how retail food markets responded to price liberalization
TRANSCRIPT
Policy Research
WORKING PAPERS
Agricultural Policies
Agriculture and Rural DevelopmentDepartment
The World BankMay 1993WPS 1140
How Retail Food MarketsResponded to Price
Liberalization in Russiaafter January 1992
Bruce Gardnerand
Karen M. Brooks
Progress was made toward market integration in the sevenmonths after price liberalization. Further development of foodmarkets will require deeper price liberalization, removal of localcontrols, continued enterprise reform, privatization,demonopolization, and entry of new firms.
Policy Research Working Papers disseminate the findings of work in progress and encourage me exchange of ideas among Bank staff andail others interested in development issues. These papers, distributed by the Research Advisory Staff, carry the names of the authors, reflectonly their views, and should be used and cited accordingly. The findings, interpretations, ana conclusions are the authors own. They shouldnot be attributed to the World Bank, its Board of Directors, its management, or any of its member countries.
Policy Research
WORKING PAPERS
Agricultural Policies
WPS 1140
This paper — a product of the Agricultural Policies Division, Agriculture and Rural DevelopmentDepartment — is part of a larger effort in the department to analyze changes in agriculture in economies.This research was supported by a grant to the University of Minnesota from the National Council on Sovietand Eastern European Research, and by the World Bank. Copies of the paper are available free from theWorld Bank, 1818 H Street NW, Washington, DC 20433. Please contact Cicely Spooner, room N8-039,extension 32116 (May 1993, 66 pages).
Under administered prices through the fall of1991, Russia's food distribution system brokedown, and it was feared that the food supplywould be inadequate in the winter of 1992 andthereafter. In January and March 1992, priceceilings were removed on most items sold instate-owned Russian stores. Price liberalizationwas intended to return food to shelves and toimprove the flow of food among regions throughresponses to price differentials. Privatization ofthe distribution system did not begin untilOctober 1992. At the time of price liberalizationthe environment was still dominated byunrestructured state enterprises.
Retail prices immediately rose sharply andfluctuated. Because food prices did not stabilizeafter the initial jump, many people questionedwhether price liberalization accomplishedanything positive. Gardner and Brooks examinedata on movements in food prices and volumesbetween December 1991 and August 1992 toexamine how retail food markets responded toliberalization. They address the followingquestions:
Is there any evidence that after liberalizationfood returned to retail outlets that wereessentially bare in December 1991? Is thereevidence that transactions took place in responseto price differentials (did markets begin toemerge despite the lack of privatization anddemonopolization)? Did city-to-city pricedifferentials evolve to reflect a price surfaceexplainable by transportation costs and othereconomic variables? If not, why not?
Gardner and Brooks conclude that progresswas made toward market integration in the sevenmonths after price liberalization. The volume offood sold in monitored shops increasedsubstantially. The geographic dispersion ofprices declined over time. But large pricedifferences between cities persisted that cannotbe explained in terms of available economicvariables.
Large economic gains could be achieved byfurther market integration.
The Policy Research Working Paper Series disseminates the findings of work under way in the Bank. An objective of the seriesis to get these findings out quickly, even if presentations are less than fully polished. The findings, interpretations, andconclusions in these papers do not necessarily represent official Bank policy.
Produced by the Policy Research Dissemination Center

How Retail Food Markets Respondedto Price Liberalization in Russia
after January 1992
byBruce Gardner
andKaren M. Brooks

Table of Contents
Page
The Data 2
Food Prices in 1992 4
Price Differences Between Cities 11
Causes of City-to-City Price Differences 16
Trends in Residual Food Price Variation 21
Regional Market Integration 23
Conclusions 29
Appendix: Average Prices and Volume in Monitored Outlets of19 Commodities in 132 Russian Cities 31

How Retail Food Markets Responded to Price Liberalization in Russia after January 1992*
Bruce Gardner (University of Maryland)
Karen M. Brooks (World Bank and University of Minnesota)
Food prices in Russian state-owned stores were freed from national regulation in two steps in
January and March 1992. Some provinces and cities retained price regulation, and in some cases even
dropped and then reintroduced it. But the main policy change occurred in January with removal of price
ceilings on most items sold in state-owned stores. Retail prices immediately rose sharply and fluctuated.
The price liberalization was intended as a first step toward creating active markets in the food
sector. The liberalization preceded privatization and institutional reform not by design, but by exigency.
Retention of administered prices throughout fall of 1991 had led to substantial breakdown in the food
distribution system and concern about adequacy of food supply in winter 1992 and thereafter. The
liberalization was intended to return food to shelves and to improve the flow of food among regions
through response to price differentials.
Privatization of the distribution system, an important concomitant to liberalization, did not begin
until the launching of the voucher scheme in October 1992.1 Some retail outlets were privatized earlier
through auctions and small-scale privatization, but these had little impact on the monopoly power of
* This research was supported by a grant from the National Council on Soviet and East European Research tothe University of Minnesota, and by the World Bank. The Center for Economic Analysis and Forecasting, Moscow,provided guidance in interpreting the data. The findings, interpretations, and conclusions expressed in this paperare entirely those of the authors and should not be attributed in any manner to the World Bank, to its affiliatedorganizations, or to members of its Board of Executive Directors or the countries they represent. The World Bankdoes not guarantee the accuracy of the data included in this publication and accepts no responsibility whatsoeverfor any consequence of their use. The presentation of material does not imply the expression of any opinionwhatsoever on the part of the World Bank, its affiliates, or its Board or member countries concerning the legalstatus of any country, territory, city, or area or of the authorities thereof or concerning the delimitation of itsboundaries or its national affiliation.
1 Beginning in October 1992, all Russian citizens over the age of 18 were issued vouchers redeemable in thefuture against shares of state-owned enterprises.

processors and distributors. Thus the price liberalization of January and March 1992 took place in an
environment dominated by unrestructured state enterprises.
Food prices moved up sharply after the January liberalization and subsequently continued to
climb, although somewhat lagging the general price level, throughout 1992. The fact that food prices
did not stabilize after the initial jump led many people to question whether liberalization accomplished
anything positive. This paper uses data on movements in food prices and volumes between December
1991 and August 1992 to examine how retail food markets responded to liberalization. Is there any
evidence that after liberalization food returned to retail outlets that were essentially bare in December
1991? Is there evidence that transactions took place in response to price differentials, i.e. did markets
begin to emerge despite lack of privatization and demonopolization? Did city to city price differentials
evolve to reflect a price surface explainable by transportation costs and other economic variables? If not,
why not? This paper attempts to answer these and related questions using data for January through
August 1992.
The Data
Goskomstat of the Russian Federation began an extensive effort to collect retail food prices in
January 1992. These data are organized by the Center for Economic Analysis and Forecasting and
evaluated to track price movements. A weekly survey covers 69 food and related commodities in 132
cities throughout Russia. Both state-owned stores and private central markets (collective farm markets)
are covered, but not individual private sellers who generally buy at the former outlets for resale on the
street in small quantities.
The survey is taken on Wednesday of each week, typically with one enumerator for each 3 or
4 state stores, and one enumerator for each private central market. Not all outlets are sampled, but the
sample size appears adequate—about 70 enumerators in Moscow, for example, covering about 100 state
Average Prices, Potato(December 1991 -- August 1992)
3

stores and 10 collective farm markets. The enumerators record posted prices in state stores and ask the
manager for volume data. In private markets the enumerators ask a sample of sellers for price quotes,
and ask the market's administrator, or in some cases individual sellers for an estimate of volume sold in
the market.
The data collecting agency uses the enumerators' reports to calculate for each commodity an
average price in each city for state stores, an average price for collective farm markets, and estimated
total volume for each type of market in the outlets surveyed. These data are then used to calculate an
overall food price index for Russia. All-Russia price indexes for each commodity and for all food are
published weekly.2
Food Prices in 1992
This paper focuses on the behavior of 19 widely sold staple commodities, which comprise a
subset of the 69 commodities sampled:
beef ("category 1")sausage ("type 1")sausage ("type 2")buttervegetable oilmilksour creamcheese (standard types)eggssugarbread (rye)bread (white)millet groatsvermicelli (spaghetti)potatoescabbageonionsapplescigarettes
2 Since the volume in sampled outlets does not by construction reflect the volume of transactions in state andprivate markets throughout Russia, the aggregate index uses adjusted weights instead of the volumes in the sample.

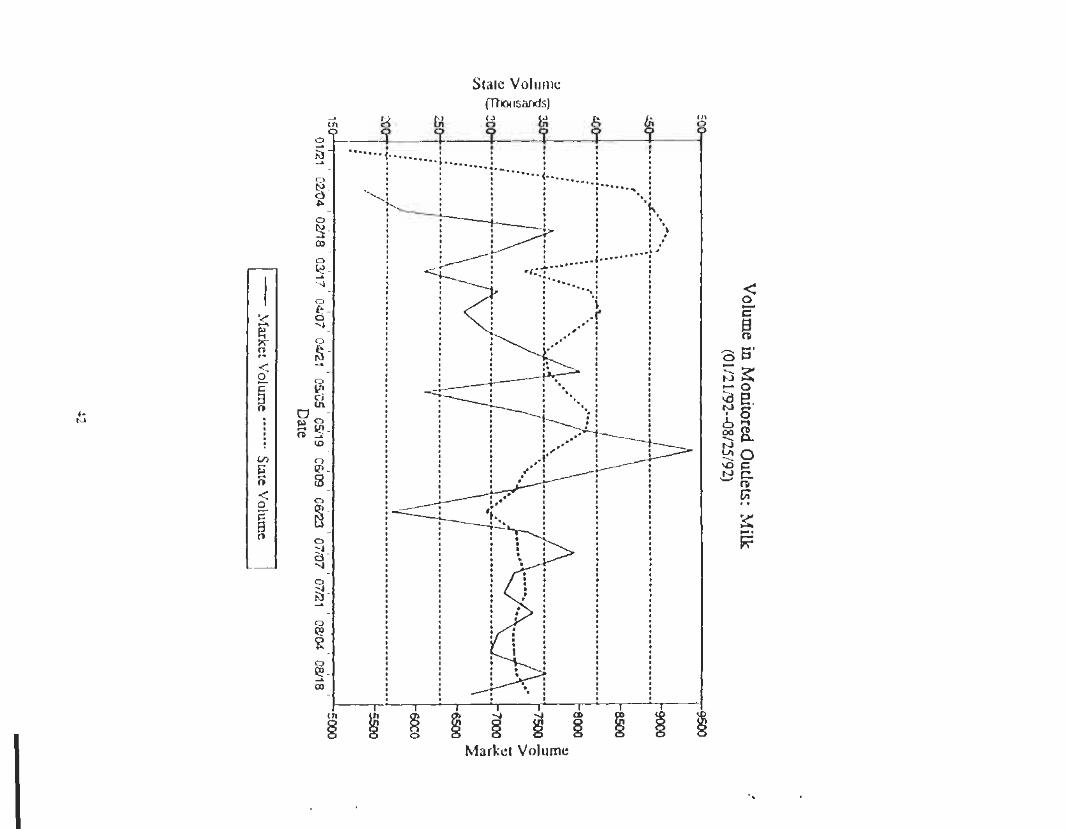
Volume in Monitored Outlets: Potatoes(01/21/92-08/25/92)
5

Figure 1 shows all-Russia prices of one of these commodities, potatoes. Potatoes, unlike most
foods, were already sold at unregulated prices in state stores in December 1991, and most of the
difference between state and free market prices reflect quality differences. The movement in potato prices
after January 2, however, suggests that prices prior to that were controlled perhaps at the local level.
Some of the price increase may be due to income escalators built into the January liberalization. Figure
1 plots the average price of potatoes from December 1991 through August 1992, in state stores and in
private (collective farm) markets. The volume-weighted mean price of potatoes in the 132 cities surveyed
was 1.48 rubles (per kilogram) in states stores in December 1991. After the liberalization of prices in
January 1992, the price in state stores immediately increased to over 5 rubles per kilo.
No data were reported for potatoes in the private markets (the same is true for almost every other
commodity) until February 1992. Reported prices in these markets have been generally higher in the
private markets than in the state stores, but these prices were already deregulated and high in December
1991 (although we have no comparable price indexes to quantify how high private market prices were
relative to state store prices in December 1991).
After the initial shock, prices rose more slowly during the first half of 1992 in both state stores
and collective farm markets. Potato prices rose "only" about 50 percent between February and July in
state stores, and then quadrupled in July-August. Private market prices rose rapidly, and by August had
converged so that state stores and private markets sold potatoes at about the same prices.
The volume of potato sales estimated for the markets sampled in the 132 cities is shown in Figure
2. The volume in state stores rose markedly after the liberalization, even though formally potato prices
had been largely freed prior to January 1992. There was no concomitant fall in volume on sampled
private markets, and so total sales of potatoes increased initially, due presumably to reduction of
inventories held within the distribution system. Overall, the state and private markets sampled had about

F i g u r e 3 . 132 c i t y P r i c e I n d e x fo r A l l Food
dec91 = 100 for both state and market

an equal volume of sales in February-August. In July and August, the state stores steadily lost sales.
August volume in state stores was about one-fourth of their February volume.
For 17 of the 19 core commodities, sales volume in the state sector increased following January
1992. The exceptions are eggs, for which the precipitous fall in volume, followed by roughly level sales
thereafter, suggests a reporting mistake. The decline in cigarette sales in stores is sustained after the
original drop, suggesting that cigarette sales may have indeed moved out of the sampled stores, perhaps
to sidewalk kiosks. For the remainder of items, the increase in volume in state stores is not mirrored by
a fall on private markets. These data support anecdotal reports that, after liberalization, food did in fact
return to shelves of state stores. Although the liberalization did little directly to promote reorganization
of the trading system, this evidence suggests that the precipitous fall in volume that caused alarm in fall
1991 was halted and reversed in January and February 1992.
For several commodities—smoked sausage, butter, milk, cheese, eggs, sugar, bread,
vermicelli—volume in the private markets remained low or negligible throughout January-August 1992.
Other products were sold heavily in the private markets. By August 1992 private market volume
exceeded state-store volume for potatoes, apples, and beef in these sampled outlets. In most cases the
private-market price substantially exceeded the price in state stores. Only for potatoes, cabbage, onions,
and apples did the market and state-store prices tend to converge over time. (See Appendix for price and
quantity charts for each of the 19 commodities.)
Figure 3 shows a volume weighted price index for all 19 commodities (using February 4, 1992
quantity weights with December 1991 = 100 as a base period). Separate indexes were constructed for
state-owned retail stores ("state price") and the collective-farm markets ("market price"). Market price
data do not begin until the last week in January. The state-store price index rose sharply between
December 1991 and January 1992, but not to the level of private market prices. Both indexes appear to
have overshot the deregulated equilibrium, so that the indexes fell in February. Subsequently, both
indexes rose steadily through 1992, with some convergence of the two toward a common level in the
summer. It is notable that the second steps of deregulation, in March 1992, had only a small apparent
impact on food prices in general, although the impact on affected commodities was greater.
Table 1 compares the state-store price rise across commodities in two stages: the change in state-
store prices between December 1991 and February 4, 1992, and the changes between February 4, 1992
and August 25, 1992. For example, the index value of 863 for beef in state stores on August 25, 1992
means the all-Russia average price of beef was 8.63 times the December 1991 price. The private market
price changes are not shown because the December 1991 base is not available.
The right-hand column of Table 1 shows indexes of prices on August 25, 1992, with February
4 = 100. The value for beef of 133 means prices were 33 percent above February. The first and third
columns show the initial shock effect of deregulation as compared to the effect of inflation over the
following seven months. (Note that multiplying the first and third columns and dividing by 100 gives
the second column. Thus, the first and third columns decompose the total price rise into two
multiplicative components). The initial shock is larger for the overall average, and for most commodities.
But some products had a smaller initial price rise than the subsequent (February through August)
increases: vegetable oil, milk, sugar, potatoes, cabbage, and onions. For vegetable oil, milk, and sugar,
the larger February through August price rise reflects removal of price ceilings retained until March
1992. For milk and sugar, a fall in volume prior to March was reversed, at least temporarily, after the
removal of ceilings.
To determine relative prices for a particular commodity, compare the commodity's price index
with the all-commodity price index. For the whole period, the lowest price increases were for millet
groats, onions, cabbage, apples, and beef. Seasonal factors may account for cabbage and onions, which
were presumably being harvested by the end of August. The commodities whose prices rose most were
sugar, bread, vermicelli, and cigarettes.

Table 1. Price indexes, states-owned stores.
Commodity
Beef
Sausage 1
Sausage 2
Butter
Vegetable oil
Milk
Sour cream
Cheese
Eggs
Sugar
Bread 1
Bread 2
Millet groats
Vermicelli
Potatoes
Cabbage
Onions
Apples
Cigarettes
All 19
December
February 4, 1992
651
908
735
774
366
315
997
1620
824
473
605
410
78
1350
269
245
210
362
500
501
1991 = 100
August 25, 1992
863
1730
1249
1703
1555
1690
1505
3175
1360
3221
3146
2034
195
2997
1264
715
502
554
2220
1563
February 4, 1992 =100
August 25, 1992
133
191
170
220
425
536
151
196
165
681
520
496
250
222
470
292
239
153
444
312
Relative price changes have been very large. Between December 1991 and August 1992 the price
of (high quality) bread relative to the price of beef more than tripled. The price of high quality bread
relative to apples rose by a factor of almost six. These changes in relative prices reflect in part easing
of mandated distortions embodied in the old administered prices. Movements in relative prices in the
period immediately following liberalization are not fully explained in the current framework.
10

Price Differences Between Cities
In an economy with well-functioning, integrated markets, prices for the same commodity would
differ between cities only by the cost of transporting the product. The size of price differences between
cities provide information about how Russia's food marketing system coped with the economic shocks
resulting from deregulation. In December 1991, prices in state stores already varied considerably from
city to city. For example, the reported price of potatoes varied from a low of 0.33 rubles in Kizel to
4.00 rubles in Yuzhno-Sakhalinsk, and the volume-weighted standard deviation of the price of potatoes
across cities was 1.05 rubles.
The coefficient of variation, the standard deviation divided by the mean, is a useful indicator of
price differences from city to city because it self-adjusts for inflation. For potatoes in December 1991,
the 132-city mean price was 1.89 rubles, so the coefficient of variation is 1.05/1.89 = .56.
A coefficient of variation declining over time indicates that price differences across cities are
becoming relatively smaller. Table 2 indicates how the coefficient of variation changed during 1992 for
each of the 19 commodities. All the coefficients of variation are less in February 1992 than before
deregulation in December 1991. While commodity prices rose dramatically, by 500 percent on average
(see Table 1), this rise was not a constant percentage across cities. It appears to have been closer to a
constant increase in the ruble price. For this initial price shock, the city-to-city standard deviation of
price may be a more meaningful measure. This measure is shown in Table 3.
11

Table 2. Coefficients of variation (xl00) of commodity prices from city to city in state stores.
Date
12/91
01/21
01/28
02/04
02/11
02718
02725
03/17
03/31
04/07
04/14
04/21
04/28
05/05
05/12
05/19
06/02
06/09
06/16
06/23
06/30
07/07
07/14
07/21
07/28
08/04
08/11
08/18
08/25
Beef
64
27
36
20
19
20
21
16
19
17
19
16
14
16
16
17
18
23
22
22
19
18
20
18
20
17
22
23
22
Sausage 1
73
17
23
21
25
19
24
21
23
23
23
23
22
22
22
24
22
23
20
19
20
18
18
18
17
19
19
18
19
Sausage 2
89
16
30
20
18
19
21
23
20
21
21
19
22
25
24
22
22
27
19
18
19
19
20
18
21
20
20
26
22
Butter
61
65
31
47
54
58
58
52
40
26
27
26
30
21
19
21
20
19
20
21
19
18
18
18
18
16
14
14
14
Vegetableoil
89
52
77
66
84
60
68
69
74
59
65
55
52
56
63
51
48
48
50
45
42
38
47
40
38
37
38
39
40
Milk
76
161
88
69
58
73
72
71
74
64
64
64
61
67
62
61
66
49
44
42
40
39
36
37
37
36
33
33
34
Sourcream
88
45
49
29
31
30
31
35
31
37
35
36
36
33
35
36
30
32
32
33
33
34
33
34
33
32
30
30
29
Cheese
133
54
53
55
54
47
48
28
35
20
20
23
25
24
21
25
20
20
17
17
17
17
17
16
17
14
16
17
18
Eggs
90
6
30
20
46
23
19
17
23
24
25
24
25
23
23
25
25
22
24
25
25
28
24
27
26
24
20
22
24
12

Table 2. Coefficients of variation (xl00) of commodity prices from city to city in state stores (cont.)
sugar
86
63
62
45
73
104
100
101
88
87
92
70
68
69
64
58
52
45
47
48
52
48
47
46
43
39
32
35
33
bread 1
43
8
18
17
28
45
47
44
47
57
55
54
57
62
59
61
61
52
54
49
55
52
49
40
40
36
38
37
35
bread 2
77
40
19
18
21
23
43
46
51
56
51
50
54
50
51
56
59
55
52
48
53
51
49
41
44
41
40
40
39
milletgroats
-
56
55
41
58
52
51
57
49
45
48
45
46
45
40
45
45
47
40
36
37
36
52
45
42
43
41
51
49
vermicelli
63
62
41
44
41
38
38
31
27
26
30
34
33
26
27
29
31
33
30
31
33
32
29
27
32
30
29
27
25
potatoes
56
46
51
38
32
41
42
32
39
36
47
43
43
44
43
41
39
38
40
39
41
42
54
47
36
34
37
43
38
cabbage
53
55
63
40
36
40
62
58
62
56
64
49
41
48
49
43
25
24
23
25
31
30
37
52
60
43
47
49
52
onions
48
37
42
38
37
39
41
45
39
42
39
29
26
27
33
27
43
38
41
34
32
32
29
30
44
39
71
71
67
apples
68
23
30
44
37
31
38
39
41
37
37
33
40
42
49
48
38
39
27
35
29
40
26
52
58
44
56
53
60
cigarettes
96
8
63
57
58
42
53
48
35
40
41
41
26
35
31
31
33
29
34
26
30
29
25
18
23
18
25
28
35
13
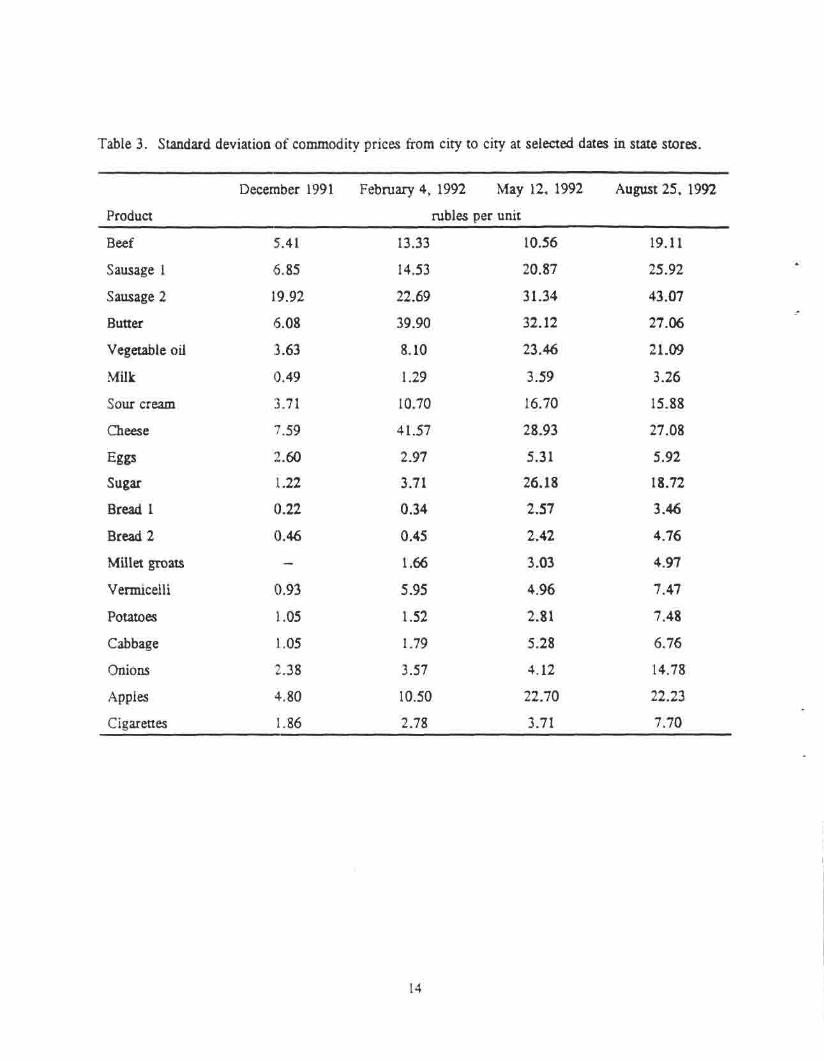
Table 3. Standard deviation of commodity prices from city to city at selected dates in state stores.
Product
Beef
Sausage 1
Sausage 2
Butter
Vegetable oil
Milk
Sour cream
Cheese
Eggs
Sugar
Bread 1
Bread 2
Millet groats
Vermicelli
Potatoes
Cabbage
Onions
Apples
Cigarettes
December 1991
5.41
6.85
19.92
6.08
3.63
0.49
3.71
7.59
2.60
1.22
0.22
0.46
—
0.93
1.05
1.05
2.38
4.80
1.86
February 4, 1992
rubles
13.33
14.53
22.69
39.90
8.10
1.29
10.70
41.57
2.97
3.71
0.34
0.45
1.66
5.95
1.52
1.79
3.57
10.50
2.78
May 12, 1992
per unit
10.56
20.87
31.34
32.12
23.46
3.59
16.70
28.93
5.31
26.18
2.57
2.42
3.03
4.96
2.81
5.28
4.12
22.70
3.71
August 25, 1992
19.11
25.92
43.07
27.06
21.09
3.26
15.88
27.08
5.92
18.72
3.46
4.76
4.97
7.47
7.48
6.76
14.78
22.23
7.70
14

Table 4. Coefficients of variation of commodity prices from city to city at selected dates in privatemarkets.
Product
Beef
Butter
Vegetable oil
Milk
Sour cream
Eggs
Potatoes
Cabbage
Onions
Apples
Cigarettes
February 4, 1992
0.53
0.20
0.62
0.62
0.35
0.21
0.37
0.35
0.33
0.24
0.25
May 12, 1992
0.34
0.18
0.41
0.41
0.32
0.26
0.44
0.32
0.31
0.26
0.13
August 25, 1992
0.30
0.11
0.45
0.45
0.30
0.26
0.48
0.65
0.50
0.75
0.24
15

For purposes of obtaining an indication of improved market integration during 1992, changes in
the coefficient of variation between February and August provide the best measure. The Table 2 data
indicate little of such integration for some commodities, while the coefficient of variation declined
substantially for cheese, butter, vermicelli, vegetable oil, milk, sour cream, sugar, and cigarettes.
Table 4 provides similar comparisons for prices in collective farm markets. Here we see more
of the expected trend toward market integration, particularly for beef, but there is still a lack of
convergence for some commodities.
Causes of City-to-City Price Differences
In order to investigate the causes of persistent price differences between cities, we can attempt
to explain statistically each city's deviation from the all-Russia average at a given time by means of
supply/demand variables. The Center for Economic Analysis and Forecasting provided data on:
Income per worker in each month of 1992 in each province
Whether each province was a net producer or consumer of each commodity
The pricing zone in prior USSR administration (proxy for transport costs)
Presence or absence of provincial price regulation after January 1992
These data were used to estimate the following linear regression equation for each commodity:
where Dit is the difference between city i's price and the all-Russia price in week t, Yit is income in the
province of city i in the month containing week t, Ei = 1 if the province produced more of the
commodity than it consumed (otherwise zero), Ii = 1 if the province consumed more of the commodity
than it produced, and Rit = 1 if the city maintained regulation in week t. Zi is a vector of 3 dummy
variables—Z1 = 1 if the province is in zone 1, Z2 = 1 if in zone 2, Z3 = 1 if in zone 3. The are
parameters to be estimated and the are random errors assumed to be independently and identically
16

distributed. The Zi, Ei and Ii are not linear combinations of the intercept term because some provinces
are classified as being neither an exporter nor an importer, and some cities are not in any of the 3 zones.
The results of fitting this equation to the February-August price data for each of the 19
commodities are shown in Table 5. Generally, only a small part of the cities' state-store price deviations
from the all-Russia price can be explained by these regressions. The R2 (adjusted for degrees of freedom)
range from .051 (cigarettes) to .320 (milk).
Of the variables intended to explain the price differences, income is most in accord with
expectations. Higher income in a city causes higher prices, i.e., increased demand, for every commodity
except potatoes and milk. The largest percentage effect is in vegetable oil where a 100 ruble (2.5
percent) income increase is associated with a 0.32 ruble (.7 percent) price increase. The next biggest
effect is in butter, where a 100 ruble income increase raises the butter price .53 rubles (.3 percent).
The other variables have only sporadic and quantitatively small effects with only a few
exceptions. The ruble effects are easy to interpret since the variables other than income are all
0-1 dummies. Thus, the estimated effect on beef prices of being in a regulated province is a 3.9 ruble
(20 percent) reduction in excess of price over average price. Being in a net exporting region reduces the
prices of vegetable oil, milk, sugar, vermicelli, potatoes, cabbage, and cigarettes significantly.
Table 6 shows regression results for collective farm markets. There are fewer commodities
because several had few observations (less than 200) with sporadic and extreme prices. The results are
quite similar to the state-store regressions, but with higher explained variation of prices. The R2 ranged
from .12 (sour cream) to .51 (vegetable oil).
Since the variables of these regressions explain relatively little, the regressions cannot go far in
explaining the rate of market integration in Russia. Even after accounting for differences in income,
reported local regulation and other important economic variables, about 80 percent of the price deviation
among cities remains unexplained. The residuals from these regressions may throw light on the process
17

Table 5. Regression coefficients ("t" ratios) explaining city price deviations from all-Russia prices: state stores
Variable
Intercept
Income
Regulation
Import
Export
Zone 1
Zone 2
Zone 3
R-Square
Obs.
Beef
-5.88(4.27)
1.8(9.28)
-3.89(3.22)
4.53(5.09)
-0.86(1.03)
0.6(0.52)
7.98(6.64)
5.48(3.42)
0.18
2636
Sausage I
-13.13(6.59)
1.5(4.57)
4.31(2.44)
14.15(10.74)
-1.16(0.93)
2.99(1.86)
4.26(2.56)
7.79(3.34)
0.15
2890
Sausage II
-37.96(13.19)
4.9(11.27)
-1.35(0.56)
26.93(14.78)
8.68(5.07)
5.5(2.26)
18.9(7.59)
17.38(5.05)
0.27
2850
Butter
89.87(28.87)
5.3
(10.86)
-28.79(9.26)
13.24(6.7)
1.23(0.64)
12.52(4.41)
19.08(6.56)
18.07(4.46)
0.13
3403
Commodities
VegetableOil
7.72(2.45)
3.2(12.14)
-3.56(2.08)
-1.38(0.53)
-19.27(6.76)
-8.3(5.2)
-2.9(1.67)
-9.44(4.32)
0.233
2533
Milk
1.17(5.36)
-0.1(3.06)
-0.97(4.58)
0.084(0.61)
-0.49(3.65)
-1.72(8.73)
1.09(5.39)
5.02(18.17)
0.32
3435
SourCream
-11.74(9.995)
1.5(8.39)
-7.24(6.3)
10.99(14.56)
4.17(5.77)
-0.25(0.231)
6.49(5.93)
5.92(3.9)
0.2
3300
Cheese
-10.41(4.11)
0.023(0.047)
-18.77(641)
21.56(12.28)
2.51(1.53)
-4.56(2.08)
7.34(3.24)
12.29(3.544)
0.178
2386
Eggs
-1.03(2.57)
0.73(11.61)
-1.42(3.75)
1.004(3.58)
0.023(0.097)
-2.48(6.75)
1.36(3.46)
2.59(5.01)
0.1987
3328
18

Table 5. Regression coefficients ("t" ratios) explaining city price deviations from all-Russia prices: state stores (cont.)
Variable
Intercept
Income
Regulation
Import
Export
Zone 1
Zone 2
Zone 3
R-Square
Obs.
Sugar
17.47(3.62)
0.96(2.95)
-7.61(3.52)
-9.05(197)
-32.72(6.93)
0.13(0.061)
8.89(4.22)
-6.84(2.42)
0.166
2490
Bread I
0.776(2.643)
0.17(3.34)
-0.12(0.445)
—
—
-2.42(8.401)
-0.84(2.888)
0.874(2.595)
0.154
1715
Bread II
0.29(114)
0.07(1.441)
0.178(0.62)
—
—
-2.3(9.16)
0.684(2.62)
0.395(0.897)
0.164
2443
Noodles
-0.745(1.25)
0.48(5.46)
-1.86(3.724)
0.756(1.653)
-0.455(1.014)
-1.28(3.071)
0.046(0.113)
1.61(2.774)
0.137
1372
Commodities
Vermicelli
0.024(0.038)
0.48(4.572)
-2.99(4.426)
-0.073(0.189)
-3.015(7.034)
-3.062(5.153)
2.87(4.764)
-1.06(1.253)
0.1482
2722
Potatoes
-4.16(9.746)
1(13.988)
-0.68(1.888)
1.46(6.375)
-0.705(2.861)
0.815(2.166)
2.26(5.908)
2.12(4.186)
0.1513
2703
Cabbage
-5.43(8.758)
1.4(14.04)
0.555(0.791)
1.475(3.943)
0.792(1.841)
0.471(0.843)
3.64(6.198)
3.02(4.008)
0.1719
2445
Onions
-4.98(7.74)
1.4(13.415)
1.64(2.796)
0.462(1.166)
-0.073(0.153)
-0.26(0.485)
2.71(4.73)
5.47(7.258)
0.1507
2828
Apples
-18.495(6.411)
4.1(13.511)
3.66(1.972)
9.33(4.226)
-3.3(1.329)
-2.67(1.397)
5.846(2.976)
7.465(2.779)
0.2456
1772
Cigarettes
-0.612(0.942)
0.37(4.723)
-1.34(2.325)
0.3(0.544)
-1.61(2.505)
0.83(1.676)
1.55(3.008)
1.776(2.662)
0.0509
1707
19

Table 6. Regression coefficients ("t" ratios) explaining city price deviations from all-Russia prices: collective farm markets
Variable
Intercept
Income
Regulation
Import
Export
Zone 1
Zone 2
Zone 3
R-Square
Obs.
Bread
-6.16(2.5650
5.1(11.277)
8.19(3.441)
17.17(10.952)
-1.54(1.029)
-19.3(10.244)
-13.29(6.727)
-13.11(2.849)
0.2487
2557
Butter
81.86(19.455)
0.528(0.554)
-20.19(3.919)
21.97(3.919)
-5.49(2.747)
-18.27(5.075)
-15.46(3.917)
-43.43(1.871)
0.145
1302
VegetableOil
17.66(3.058)
4.1(8.285)
21.5(7.895)
21.5(7.895)
-22.13(4.057)
-20.73(10.951)
-17.23(7.91)
3.88(148)
0.5055
1264
Milk
3.91(5.46)
0.77(6.115)
0.13(0.179)
0.13(0.179)
0.69(1.808)
-8.67(12.441)
-6.1(8.784)
0.2386
1825
SourCream
-2.69(0.728)
3.4(4.982)
-9.54(2.238)
-9.54(2.238)
1.31(0.61)
-17.83(5.107)
-12.73(3.651)
-46.4(2.614)
0.1201
1977
Eggs
4.1(4.665)
i.2(6.544)
-0.66(0.589)
-0.66(0.589)
-2.73(5.965)
-6.54(9.06)
-2.76(3.353)
-14.38(4.814)
0.1603
16781
Potatoes
-4.68(7.347)
1.1(10.184)
1.22(1.897)
3.1(8.297)
-1.7(4.2)
-0.92(1.645)
1.6(2.807)
4.25(4.691)
0.1678
2764
Cabbage
-6.37(7.604)
3.1(17.325)
2.77(2.632)
2.55(4.394)
-1.25(2.064)
-1.93(2.452)
2.17(2.696)
-4.56(2.353)
0.2854
1758
Onions
-8.37(8.815)
3.6(19.72)
3.78(4.097)
0.73(1.207)
1-36(1.996)
-1.46(1.78)
0.67(0.812)
-2.42(1.439)
0.1978
2266
Apples
-22.56(6.619)
7.6(16.483)
4.004(1.486)
9.82(3.958)
5.36(1.867)
-7.007(2.886)
12.83(5.154)
13.8(3.558)
0.2305
2593
20

in two ways: first, in exploring how city-to-city food price differences change over time for different
commodities; and second, whether certain cities are persistently high or low in price compared to the all-
Russia average.
Trends in residual food price variation
The relative residual differences between a city's price and the all-Russia mean price are used to
fit the following equation for each commodity:
where t is measured as days since January 1, 1992. The relative residual, is defined as
where is the estimated residual from equation (1) and P, is the mean price of the commodity at time
t. The dependent variable is put in relative terms to adjust for inflation.
One might expect that the markets would take time to adjust to the city-to-city price differences
that emerged when food prices were deregulated in January, so that the unexplained price differences
would be less, the later in 1992. This would cause < 0 in equation (2).
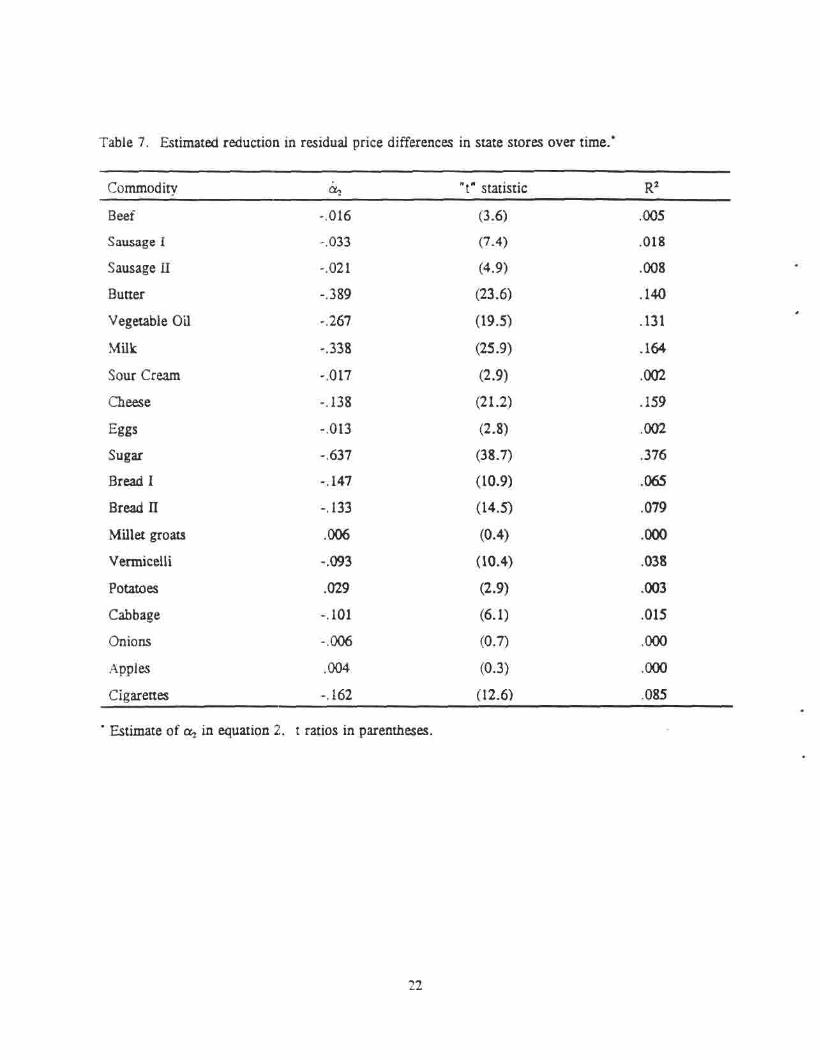
The results of the regressions are shown in Table 7. All the commodities but four (millet groats,
potatoes, onions, and apples) show a significant reduction in the residuals over time. Potatoes, onions,
and apples have increased city-to-city price differences in August, apparently as new crops became
available in some areas (see Table 2). Before August, residual city-to-city price variation was declining
for these commodities, too. So we do see quite pervasive evidence of market integration.
The coefficients indicate, however, fairly slow elimination of city-to-city differences. The
coefficient for beef implies that by the end of August (t = 240), the average city's residual price
difference from the all-Russia mean beef price was reduced by only 3.8 percent of the mean price as
compared to January price differences. This is about one-fifth of the average unexplained price
differences; that is, it would take about 21/2 years to eliminate the cities' price differences that are not
21
22
Table 7. Estimated reduction in residual price differences in state stores over time."
* Estimate of in equation 2. t ratios in parentheses.
Commodity "t" statistic R2
Beef -.016 (3.6) .005
Sausage I -.033 (7.4) .018
Sausage II -.021 (4.9) .008
Butter -.389 (23.6) .140
Vegetable Oil -.267 (19.5) .131
Milk -.338 (25.9) .164
Sour Cream -.017 (2.9) .002
Cheese -.138 (21.2) .159
Eggs -.013 (2.8) .002
Sugar -.637 (38.7) .376
Bread I -.147 (10.9) .065
Bread II -.133 (14.5) .079
Millet groats .006 (0.4) .000
Vermicelli -.093 (10.4) .038
Potatoes .029 (2.9) .003
Cabbage -.101 (6.1) .015
Onions -.006 (0.7) .000
Apples .004 (0.3) .000
Cigarettes -.162 (12.6) .085

explainable by the variables of equation (1). This is about the average rate of market integration for these
19 commodities.
A first step in understanding why market integration has not occurred as rapidly as one would
have hoped is to examine further the characteristics of cities whose prices have remained most persistently
low or high relative to all-Russia average prices.
Prices were surveyed in 28 weeks of 1992 for 19 commodities. If a city had prices whose
residual (after equation 1) excess over the all-Russia price for a commodity is in the lower 10 percent of
all the cities for more than 100 of the (28 x 19 =) 532 observations (19 weeks), then we call this city
persistently low-priced. Persistently high-priced cities are defined analogously.
Table 8 summarizes the results of applying these definitions. Special circumstances apply in both
the high- and low-priced cities. For example, low-priced cities may be company towns dominated by a
large industrial enterprise that provides cheap food, or the city may be an administrative center of an
autonomous republic that maintains food pricing policy different from federal policy. The high-priced
cities tend to be in the Far East, plus Moscow and St. Petersburg.
Regional Market Integration
Because the prices that are furthest from what one would expect are in cities in extreme locations
and special industrial situations, the all-Russia regressions and residuals may well mask more complete
economic integration within areas that are large, but not so vast as the whole of Russia.
We focus on four regions, omitting the most northern and eastern parts of the country. The
regions, and cities surveyed in each, are shown in Table 9. The regions have 14 to 18 cities sampled,
and cover areas of roughly 400 by 400 miles (Central), 400 by 600 miles (North Caucasus), 300 by 900
miles (Volga), and 400 by 750 miles (Urals); that is, they are roughly the size of 2 or 3 U.S. Midwestern
states, or in the case of the Volga region, the lower Mississippi basin from St. Louis to New Orleans.
23

Table 8. Persistently low- and high-priced cities.
24
Low-priced cities observations in lower 10% of residuals
city name city code total state stores market
Noril'sk 11044294 177 175 2
Arzamas 11224033 146 88 58
Ulyanovsk 11734018 140 124 16
Ukhta 11874251 135 103 32
Izhevsk 11944017 128 85 43
Cherkessk 11914016 125 37 88
Kazan' 11924012 124 113 11
Taishet 11254287 118 55 63
Syktyvkar 11.874015 114 93 21
Smolensk 11664016 112 84 28
Yoshkar-Ola 11884019 112 82 30
Shuia 11244113 111 58 53
Vladivostok 11054016 106 32 74
Angarsk 11254057 106 85 21
Abakan 11954010 105 35 70
Maikop 11794011 103 35 68
Tula 11704017 101 74 27
High-priced cities observations in upper 10% of residuals
Petropavlovsk - 11304016 289 145 144Kamchatskii
Yuzhno- 11544019 228 161 67Sakhalinsk
Magadan 11444013 193 147 46
St. Petersburg 1140 160 58 102
Moscow 1145 138 26 112
Novorossisk 11034203 134 49 85
Kaliningrad 11274019 130 61 69
Yakutsk 11984011 128 97 31
Vorkuta 11874104 125 90 35
Kemerovo 11324013 108 101 7
Tomsk 11694017 106 89 17
Novosibirsk 11504011 103 76 27
Khabarovsk 11084017 102 49 S3
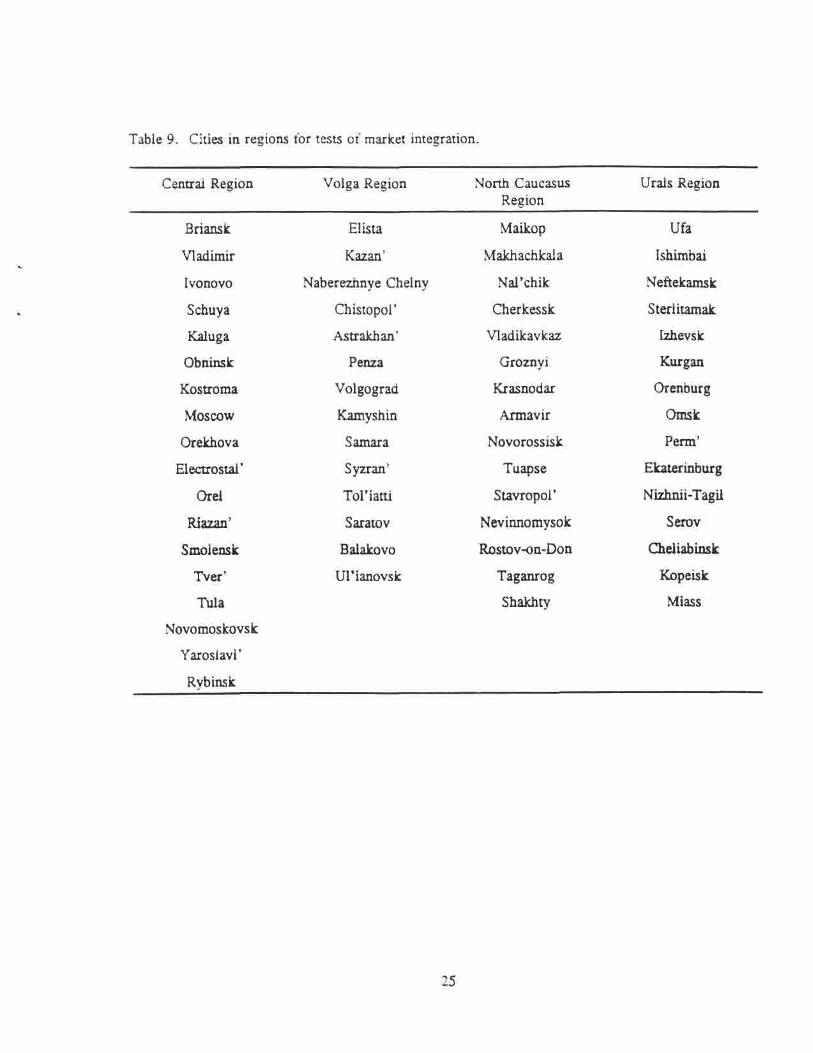
Table 9. Cities in regions for tests of market integration.
Central Region
Briansk
Vladimir
Ivonovo
Schuya
Kaluga
Obninsk
Kostroma
Moscow
Orekhova
Electrostal'
Orel
Riazan'
Smolensk
Tver'
Tula
Novomoskovsk
Yaroslavl'
Rybinsk
Volga Region
Elista
Kazan'
Naberezhnye Chelny
Chistopol'
Astrakhan'
Penza
Volgograd
Kamyshin
Samara
Syzran'
Tol'iatti
Saratov
Balakovo
Ul'ianovsk
North CaucasusRegion
Maikop
Makhachkala
Nal'chik
Cherkessk
Vladikavkaz
Groznyi
Krasnodar
Armavir
Novorossisk
Tuapse
Stavropol'
Nevinnomysok
Rostov-on-Don
Taganrog
Shakhty
Urals Region
Ufa
Ishimbai
Neftekamsk
Sterlitamak
Izhevsk
Kurgan
Orenburg
Omsk
Perm'
Ekaterinburg
Nizhnii-Tagil
Serov
Cheliabinsk
Kopeisk
Miass
25

Table 10. All Russia compared to regional prices, state stores.
Sugar
All-Russia
mean price (rubles)
std. dev. (rubles)
coef. var.
Central Region
mean price (rubles)
std. dev. (rubles)
coef. var.
Volga
mean price (rubles)
std. dev. (rubles)
coef. var.
Urals
mean price (rubles)
std. dev. (rubles)
coef. var.
February 11, 1992
rub. 12.6
rub. 13.1
1.04
8.3
5.7
.69
9.5
13.8
.81
23.2
16.6
.71
August 25, 1992
rub. 55.7
rub. 18.7
.33
66.8
8.9
.13
41.6
15.0
.29
57.5
18.3
.32
% change
342
43
-68
704
56
-81
338
9
-64
148
10
-55
26

Table 11. Regional reduction in residual price differences over time"
Commodity
beef
sausage 1
sausage 2
butter
vegetable oil
milk
sour cream
cheese
eggs
sugar
bread 1
bread 2
millet groats
vermicelli
potatoes
cabbage
onions
apples
cigarettes
All Russia
(132 cities)
-.016
-.033
-.021
-.389
-.267
-.338
-.017
-.138
-.013
-.637
-.147
-.133
.006
-.093
.029
-.101
-.006
.004
-.162
CentralRegion
(18 cities)
-.016
-.019
-.022
-.244
-.286
-.405
-.028
-.072
-.039
-.780
-.070
-.038
-.048
-.055
.041
-.120
-.073
.024
-.218
Volga Region
(14 cities)
.002
-.030
-.021
-.023
-.288
-.326
-.039
-.116
.026
-.452
.164
.223
.023
-.086
-.009
-.025
-.059
.102
-.059
NorthCaucasus
(15 cities)
-.031
-.060
-.071
-.112
-.106
-.476
-.104
-.128
-.026
-.493
.237
.068
-.068
-.090
.031
.015
-.025
-.012
—
Urals Region
(15 cities)
-.018
-.041
.006
-.099
-.503
-.352
-.061
-.098
-.023
-.639
-.368
-.300
-.144
-.032
-.027
-.140
.006
-.010
—
" The numbers shows are regression coefficients for the variable t(days) in equation 2 multiplied by 100. Alarger negative coefficient indicates more rapid market integration.
27

Table 10 compares all-Russia with regional prices for sugar on two dates, one in February and
the other in August 1992. The mean prices differ by region but the standard deviation of price within
the North Caucasus and Urals region is greater than the standard deviation over the whole 132 cities of
Russia. Much of the city-to-city price variation is within regions rather than between regional means.
One might expect that regional integration would proceed more rapidly than national integration over the
vast all-Russian market. Even at the regional level, however, barriers to emergence of markets appear
to have been great in February through August 1992. However, the coefficient of variation of price
within each region is smaller than the all-Russia C.V. Between February and August the coefficients of
variation declined very substantially for each region, but not more than the all-Russia C.V. declined.
The results of more systematic testing of regional market integration are shown in Table 11.
Regressions like those of Table 5 were estimated for each region, with the dependent variable being the
difference between a city's price and the regional mean price at each date. A typical commodity
regression now has 3 0 0 - 4 0 0 observations, e.g., 15 cities for 25 weeks, instead of 3000-3500 observations
for the all Russia regressions.
The residuals from the regional regressions were then regressed on the number of days since Jan.
1, 1992, as in equation 2. The resulting estimates of are reported in Table 11. The first column
repeats the all-Russia results from Table 7. (To save space, t ratios are omitted from Table 11; they are
generally smaller than the all-Russia t ratios, but still significant). The row labelled "sugar" in Table 11
indicates the same results as Table 10. Significant market integration occurred, but on average the
regions eliminated city-to-city price differences no more quickly than all of Russia did.
The results for the other 18 commodities tell the same story. Some regions had more market
integration than all of Russia for certain commodities, but there is no indication that ail or any regions
had an outstanding performance generally.
28

Conclusions
The retail food price data by city indicate that significant progress toward market integration
occurred in the seven months following the price liberalization of January 1992. A decline in cities' price
deviations from the all-Russia mean price occurred for 17 of the 19 commodities analyzed.
Still, large differences between cities persist for which there is no explanation in terms of
available economic variables. It is likely that this lack of apparent market integration is in part
attributable to food pricing policies in some remote cities, or cities where dominant industries subsidize
food. Beyond this, there must be significant barriers to the movement of products from low-price to
high-price cities. To what extent these barriers are local policies preventing shipments out of low-price
areas, lack of entrepreneurship among buyers or sellers within the distribution system, or other constraints
or costs is not ascertainable from the data we have. Much of the remaining distortion of prices between
and among localities can probably be attributed to the lag in initiating reforms at the enterprise level and
in the transport system. Some may be attributable to economic agents' inability to keep up with changes
in relative prices associated with the credit-induced general inflation.
It seems clear that large economic gains could be achieved by further market integration. The
best evidence of this is from the price relationships between cities in the same region. For example,
Ulianovsk on the Volga region had the largest volume of sugar sales (in monitored stores) in the Volga
region, and the lowest price, at 25 rubles per kilo as of August 25. At the same time, the two nearest
cities in our sample, Syzran' and Samara, 150 and 286 kilometers away, and both also on the Volga
River, had prices of 62.5 rubles. Transportation costs in this situation could not have been more than
a few rubles per kilo. The profit potential appears enormous, as do the potential welfare gains.**
" To obtain a crude approximation of potential welfare gains, Ulianovsk consumes 3000 kilos of sugar weeklyat 25 rub./kg., Samara and Syzran' consume 1000 kilos at 62.5 rub./kg. Suppose sugar can be moved fromUlianovsk to these cities for 5 rub./kg. (20 percent of its price), and that all three cities have an elasticity of demandfor sugar of -.5. Shipping about 300 kilos would equilibrate price at about 37 rub./kg. in Ulianovsk, and 32rub./kg. in Samara and Syzran'. The gain from the shipment would average about 24 rub./kg., for a 19 rub./kg.

Data on the geographic dispersion of food prices in Russia in the eight months following price
liberalization of January 1992 suggest the following:
a. The volume of food sold in monitored shops increased substantially in the weeks
following liberalization;
b. The geographic dispersion of prices decreased significantly over time, suggesting some
response of economic agents to the large price differences and opportunities for arbitrage;
c. More of the reduction in price dispersion took place in the period immediately following
liberalization than in the subsequent six months;
d. Although price dispersion declined over time, the decline was slower than would be
expected if well-developed markets were actually functioning;
e. Much (about: two-thirds) of the remaining price distortion cannot be explained by
traditional economic variables that we have, such as income and proxies for
transportation cost.
Further development of food markets will require retention and deepening of price liberalization
through removal of local controls and initiation of reform at the enterprise level, through privatization,
demonopolization and new entry.
net profit. This amounts to 300 x 19 = 5700 rubles net profit on an investment of 300 X 5 = 1500 rubles.
30

APPENDIX. Average Prices and Volume in MonitoredOutlets of 19 Commodities in 132 Russian Cities.
31
Average Prices, Beef(December 1991 -- August 1992)

Volume in Monitored Outlets: Beef(01/21/92-08/25/92)
32

Average Prices, Sausage I(December 1991 - August 1992)
33

Volume in Monitored Outlets: Sausage I(01/21/92-08/25/92)
34

Average Prices, Sausage II(December 1991 -- August 1992)
35

State Volume(Thousands)

Average Prices, Butter(December 1991 - August 1992)
37

State Volume(Thousands)
Market Volume

Average Prices, Vegetable Oil(December 1991 -- August 1992)
39

State Volume(Thousands)
(Thousands)
Market Volume

Average Prices, Milk(December 1991 -- August 1992)
41
State Volume(Thousands)
Market Volume

Average Prices, Sour Cream(December 1991 -- August 1992)
43
Volume in Monitored Outlets: Sour Cream(01/21/92-08/25/92)
44

Average Prices, Cheese(December 1991 -- August 1992)
45

(Thousands)
Market Volume
Slate Volume(Thousands)

Average Prices, Eggs(December 1991 -- August 1992)
47

Volume in Monitored Outlets: Eggs(01/21/92-08/25/92)
48

Average Prices, Sugar(December 1991 -- August 1992)
49

State Volume(Thousands)
(Thousands)
Market Volume

Average Prices, Bread I(December 1991 -- August 1992)
51

State Volume(Thousands)
(Thousands)
Market Volume

53
Average Prices, Bread II(December 1991 - August 1992)

State Volume(Thousands)
Market Volume

Average Prices, Millet Groats(December 1991 - August 1992)
55

State Volume(Thousands)
Market Volume
Average Prices, Vermicelli(December 1991 -- August 1992)
57

State Volume(Thousands)
Market Volume

Average Prices, Apple(December 1991 - August 1992)
59
Date

Volume in Monitored Outlets: Apples(01/21/92-08/25/92)
60
Date
Date
Average Prices, Onion(December 1991 -- August 1992)
61

Date
62
Volume in Monitored Outlets: Onions(01/21/92-08/25/92)

Average Prices, Cabbage(December 1991 - August 1992)
Date
63

64
Date
Volume in Monitored Outlets: Cabbage(01/21/92-08/25/92)

Average Prices, Cigarette(December 1991 - August 1992)
Date
65

Volume in Monitored Outlets: Cigarettes(01/21/92-08/25/92)
Date
66

Policy Research Working Paper Series
ContactTitle Author Date for paper
WPS1115 Looking at the Facts: What We Know Ross Levine March 1993 D.Evansabout Policy and Growth from Cross- Sara Zervos 38526Country Analysis
WPS1116 Implications of Agricultural Trade Antonio Salazar Brandão March 1993 D. GustafsonLiberalization for the Developing Will Martin 33714Countries
WPS1117 Portfolio Investment Flows to Sudarshan Gooptu March 1993 R. VoEmerging Markets 31047
WPS1118 Trends in Retirement Systems and Olivia S. Mitchell March 1993 ESPLessons for Reform 33680
WPS1119 The North American Free Trade Raed Safadi March 1993 J. JacobsonAgreement: Its Effect on South Asia Alexander Yeats 33710
WPS1120 Policies for Coping with Price Donald F. Larson March 1993 D. GustafsonUncertainty for Mexican Maize 33714
WPS1121 Measuring Capital Flight: A Case Harald Eggerstedt March 1993 H. AbbeyStudy of Mexico Rebecca Brideau Hall 80512
Sweder van Wijnbergen
WPS1122 Fiscal Decentralization in Transitional Richard Bird March 1993 B. PachecoEconomies: Toward a Systemic Christine Wallich 37033Analysis
WPS1123 Social Development is Economic Nancy Birdsall April 1993 S.RothschildDevelopment 37460
WPS1124 A New Database on Human Capital Vikram Nehru April 1993 M. Coleridge-Stock: Sources, Methodology, and Eric Swanson TaylorResults Ashutosh Dubey 33704
WPS1125 Industrial Development and the Adriaan Ten Kate April 1993 C.JonesEnvironment in Mexico 37699
WPS1126 The Costs and Benefits of Slovenian Milan Cvikl April 1993 S. MoussaIndependence Evan Kraft 39019
Milan Vodopivec
WPS1127 How International Economic Links Vikram Nehru April 1993 M.Coleridge-Affect East Asia Taylor
33704
WPS1128 The International Ocean Transport Hans Jürgen Peters April 1993 J.Lucas-Industry in Crisis: Assessing the WalkerReasons and Outlook 31078

Policy Research Working Paper Series
ContactTitle Author Date for paper
WPS1129 How Policy Changes Affected Cocoa Jonathan R. Coleman April 1993 G. llogonSectors in Sub-Saharan African Takamasa Akiyama 33732Countries Panos N. Varangis
WPS1130 Poverty and Policy Michael Lipton April 1993 P. CookMartin Ravallion 33902
WPS1131 Prices and Protocols in Public Jeffrey S. Hammer April 1993 J.S.YangHealthCare 81418
WPS1132 An Analysis of Repressed Inflation Andrew Feltenstein April 1993 E. Zamorain Three Transitional Economies Jiming Ha 33706
WPS1133 Macroeconomic Framework for an Ibrahim Elbadawi April 1993 A. MaranonOil-Based Economy: The Case of Nader Majd 31450Bahrain
WPS1134 Managing a Nonrenowable Resource: Ibrahim A. Elbadawi April 1993 A. MaranonSavings and Exchange-Rate Policies Nader Majd 31450in Bahrain
WPS1135 Inflation in Czechoslovakia, 1985-91 Zdenek Drabek May 1993 E. ZamoraKamil Janacek 33706Zdenek Tuma
WPS1136 The Dynamic Behavior of Quota Kala Krishna May 1993 D. GustafsonLicense Prices: Theory and Evidence Ling Hui Tan 33714from the Hong Kong Apparel Quotas
WPS1137 Railway Reform in the Central and Philip W. Blackshaw May 1993 TWUTDEastern European Economies Louis S. Thompson 31005
WPS1138 The Economic Impact of Military Daniel Landau May 1993 C.JonesExpenditures 37699
WPS1139 Should Sub-Saharan Africa Expand Jonathan R. Coleman May 1993 G. llogonCotton Exports? M. Elton Thigpen 33732
WPS1140 How Retail Food Markets Responded Bruce Gardner May 1993 C. Spoonerto Price Liberalization in Russia Karen M. Brooks 32116after January 1992