how practitioners interpret and link data to instruction...
TRANSCRIPT
How Practitioners Interpret and Link Data to Instruction:Research Findings on New York City Schools’
Implementation of the Grow Network
Daniel LightDara Wexler
Juliette Heinze
EDC/Center for Children and Technology
Paper presented at AERA 2004, San Diego, CA
Do not cite without permission
Contact information:[email protected]
[email protected]@edc.org
Funded by the Carnegie Corporation
How Practitioners Interpret and Link Data to Instruction: Research Findings on New YorkCity Schools’ Implementation of the Grow Network
AERA 2004 Do not cite without permission1
IntroductionUrban districts have faced the intense external scrutiny of a high-stakesaccountability climate for some time (Fullan, 2000), but the shift in the fundingand regulatory environment caused by the No Child Left Behind Act (NCLB) isprompting district and school administrators to think differently about thepotential that newly accessible data has to inform instruction and decision-making aimed at raising student achievement. In particular, with NCLB holdingeducators as well as students accountable, the exploration of how data can informinstructional decisions is increasingly becoming a main topic of educationalpolicy (Salpeter, 2004; Secada, 2001).
Using data to make decisions is the focus of a two-year study being conducted byEducation Development Center’s Center for Children and Technology (CCT). Theindependent study, funded by Carnegie Corporation, examines a large-scale datareporting system, developed by the Grow Network for the New York City’sDepartment of Education, that organizes students’ standardized test data intoreports customized for teachers, school leaders, and parents. For teachers, thereports provide overviews of class-wide priorities, group students in accordancewith the state performance standards, and support teachers in focusing on thestrengths and weaknesses of individual students. For the administrators, thereports provide an overview of the school, and present class and teacher-leveldata. For the parents, the report explains the goals of the test, how their childperformed, and what parents can do to help their child improve their score. EachGrow Report, which is delivered both online and in print, summarizes the datainto rankings by score and groups students according to New York Stateperformance levels.
This paper presents a conceptual framework that explores the intersection ofdecision-support technologies, educators, and the process of transforming datainto knowledge. To illuminate this framework, we will share initial findings fromour research around the question of how teachers analyze the informationprovided by the Grow Reports, as well as synthesize it into their understanding ofthe classroom to make decisions about instructional practices and their students.
Importance of this StudyPrior research has demonstrated that effective accountability occurs whenexternal and internal measures are aligned and used in coordinated fashion byschools to support improvements in student learning (Elmore & Abelmann, 1999;Fullan, 2001). The use of assessment data for decision-making assumesalignment between standards, instruction, and assessment. Therefore,administrators and teachers are increasingly pressured to use accountability datato improve instruction. However, as CRESST researchers note, “Despite both themandates and the rhetoric, schools are woefully under-prepared to engage insuch inquiry. The practice of applying large-scale data to classroom practice isvirtually nonexistent” (Herman & Gribbons, 2001).
How Practitioners Interpret and Link Data to Instruction: Research Findings on New YorkCity Schools’ Implementation of the Grow Network
AERA 2004 Do not cite without permission2
While several technical advancements enabling innovative reporting mechanismshave brought data-supported decision-making to the classroom level, questionsabout how teachers understand and use standardized test data for instructionalpurposes remain unanswered. Some preliminary work on the experiences ofdifferent design sites that are developing data-systems are seen in: the QualitySchool Portfolio (QSP) developed at CRESST (Mitchell, 1998), and IBMReinventing Education data projects in Broward County Florida (Spielvogel,Brunner, Pasnik, et al., 2001), the Texas Education Agency, and the SouthCarolina Department of Education (Spielvogel & Pasnik, 1999). Research on therole of data systems and applications in practice is also being done inMinneapolis (Heistad & Spicuzza, 2003), Boston (Sharkey & Murnane, 2003),and on the implementation of QSP in Milwaukee (Thorn, 2002; Webb, 2002).Still, the New York City school system’s partnership with the Grow Network ispossibly the largest project of its kind.1 Our research, therefore, speaks toimportant policy concerns about the role of standardized testing and data-drivendecision-making, as well as raises questions about how data are used andsupported in schools and classrooms.
Advances in technology and reporting capabilities have created newopportunities for schools to use test data for decision-making at multiple levels ofthe educational system. The current experience of the New York City Departmentof Education in conjunction with the Grow Network, an education company thathelps to “transform assessment results into instructional tools for teachers,principals, and parents” (Grow Network, 2004) is a prime example of how newlyemerging tools that use standardized testing data have the potential to bringcoherency to this process of alignment.
New York City uses the Grow Network’s web-based reporting system to provide30,000 fourth to eighth grade educators access to assessment data for 400,000students. Through the Grow Reports, teachers are able to see the previous years’test results, overall scores, and scores by each standard tested for each one oftheir current students (See Appendix A). This paper draws upon our preliminaryresearch findings, focusing on the qualitative aspects of how teachers makemeaning of Grow Reports and the ways they use them in the classroom.
Conceptual FrameworkThrough the course of this research project we have begun to piece together athree dimensional conceptual model to understand the phenomena of data-driven decision-making in classrooms. The basic framework takes into accountthe process by which raw data becomes useable information, the effect of thedata-reporting tool in shaping that process, and the role of prior knowledge of thedecision-maker. This emergent framework connects research and insights fromthree different bodies of literature. First, we draw from Management
1 The Consortium on Chicago School Research is studying the Grow Network’s implementation in Chicago(Easton & Luppescu, 2004).
How Practitioners Interpret and Link Data to Instruction: Research Findings on New YorkCity Schools’ Implementation of the Grow Network
AERA 2004 Do not cite without permission3
Information Systems literature in the fields of organizational and businessresearch and the Wisconsin Center for Education Research at the University ofWisconsin-Madison’s application of this perspective to education - an underlyingconcept of the entire decision-making process. Second, we draw on researcharound technological affordances and socio-technical relations to understand thedata tool itself. Last, we consider the factors educators bring to the process ofsynthesizing and understanding data. We will discuss each of these dimensionsin more detail below.
From Data to Knowledge: A Management Information Systems PerspectiveThe Grow Reports and the test data that the reports present are currently beingintegrated into a multi-tiered system teeming with complex decision-makingprocesses. Before we could research what access to this type of data might meanfor urban schools, we needed to map out a preliminary model of data-drivendecision-making within which to situate our research questions. To understandthe process by which teachers understand and interpret standardized test data,we used a knowledge management framework borrowed from managementtheory and organizational psychology and sociology (Ackoff, 1989; Choo, 2002;Thorn, 2002).
Most theories of information management draw distinctions among data,information, and knowledge. For example, knowledge, unlike information, isregarded in management literature as being embedded in people, and knowledgecreation occurs in the process of social interaction about information (e.g.(Sveiby, 1997). This perspective is supported by Nonaka and Takeuchi (1995):“information is a flow of messages, while knowledge is created by that very flowof information anchored in the beliefs and commitment of its holder. This […]emphasizes that knowledge is essentially related to human action.” Likewise,Drucker (1989) claims that “[…] knowledge is information that changessomething or somebody - either by becoming grounds for actions, or by makingan individual (or an institution) capable of different or more effective action.”Therefore, data, prior to becoming information, is in a raw state and is notconnected in a meaningful way to a context or situation.
Borrowing from Ackoff’s (1989) work in the field of organization andmanagement theory, in collaboration with Dr. Andreas Breiter (2003), weadapted a simplified version of Ackoff’s conceptual framework that links data,information and knowledge. Within the framework, there are three “phases” ofthe continuum that begins with raw data and ends with meaningful knowledgethat is used to make decisions. They are the following:ß Data exist in a raw state. They do not have meaning in and of itself, and
therefore, can exist in any form, usable or not. Whether or not data becomeinformation depends on the understanding of the person looking at the data.
ß Information is data that is given meaning when connected to a context. It isdata used to comprehend and organize our environment, unveiling anunderstanding of relations between data and context. Alone, however, it doesnot carry any implications for future action.

How Practitioners Interpret and Link Data to Instruction: Research Findings on New YorkCity Schools’ Implementation of the Grow Network
AERA 2004 Do not cite without permission4
ß Knowledge is the collection of information deemed useful, and eventuallyused to guide action. Knowledge is created through a sequential process. Inrelation to test information, the teacher’s ability to see connections betweenstudents’ scores on different item-skills analysis and classroom instruction,and then act on them, represents knowledge.
Figure 1: The process of transforming data into knowledge
The literature identifies six broad steps (see Figure 1) that a person goes throughto transform data into knowledge (Ackoff 1989; Drucker, 1989). Thetransformation entails collecting and organizing data, along with summarizing,analyzing, and synthesizing information prior to acting (decision-making).Through this process, raw data are made meaningful, by being related to thecontext or situation that produced it; consequently, human action underlies alldecision-making. This sequential process, therefore, forms the basis of ourunderstanding of how teachers interact with data.
How Data Technologies Shape the Transformation ProcessIn the case at hand, as in the case of most examples of data-driven decisionmaking, technology can play a central role in transforming data to knowledge.Tools can channel and shape this flow to some extent (Sarmiento, n.d.; Wayman,Stringfield, & Yakimowski, 2004). For example, data warehouse technologiesplay a first step in collecting and organizing data. The way a data warehousecollects data and structures the database influence the next steps in the process.Reporting and retrieval technologies shape the organization and summarizationof data into information. Potentially simple things like interface and visualpresentation can make the information more understandable to the end user.There are also data analysis tools and technologies that shape the process ofsummarization, analysis and synthesis of data. Basic issues of access (like
Data
Information
KnowledgeAnalyzing
Collecting
Summarizing
Organizing
Synthesizing
Decision-Making
How Practitioners Interpret and Link Data to Instruction: Research Findings on New YorkCity Schools’ Implementation of the Grow Network
AERA 2004 Do not cite without permission5
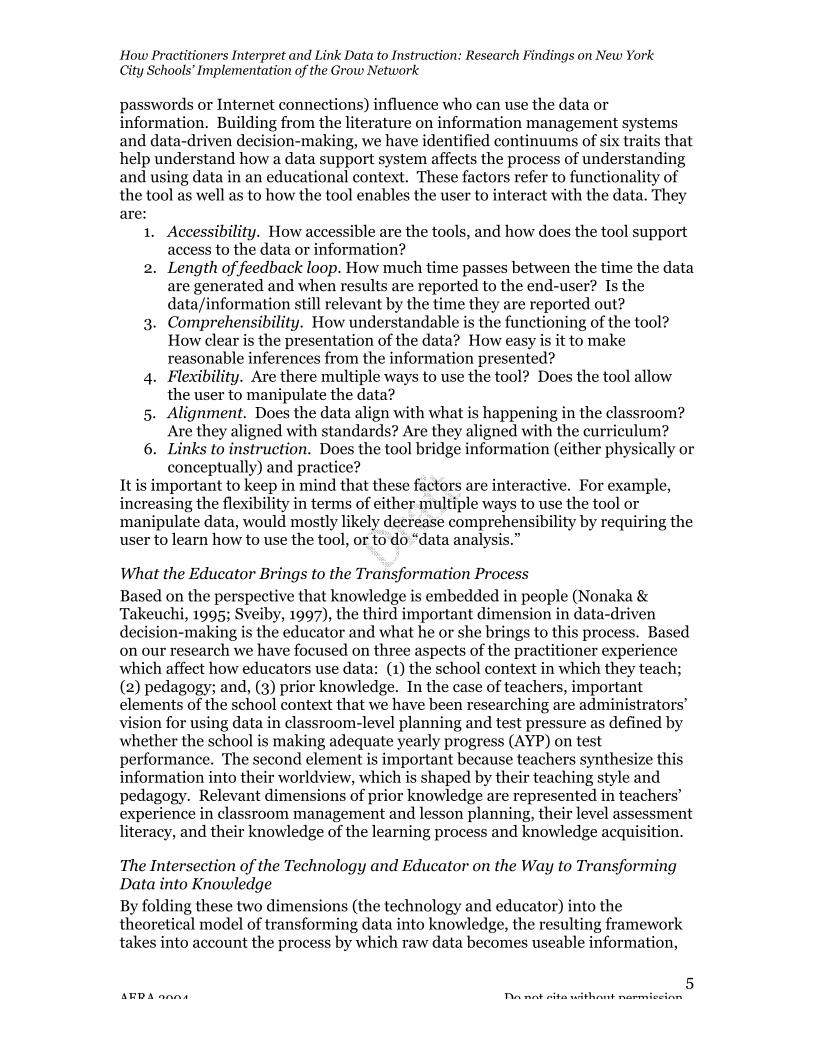
passwords or Internet connections) influence who can use the data orinformation. Building from the literature on information management systemsand data-driven decision-making, we have identified continuums of six traits thathelp understand how a data support system affects the process of understandingand using data in an educational context. These factors refer to functionality ofthe tool as well as to how the tool enables the user to interact with the data. Theyare:
1. Accessibility. How accessible are the tools, and how does the tool supportaccess to the data or information?
2. Length of feedback loop. How much time passes between the time the dataare generated and when results are reported to the end-user? Is thedata/information still relevant by the time they are reported out?
3. Comprehensibility. How understandable is the functioning of the tool?How clear is the presentation of the data? How easy is it to makereasonable inferences from the information presented?
4. Flexibility. Are there multiple ways to use the tool? Does the tool allowthe user to manipulate the data?
5. Alignment. Does the data align with what is happening in the classroom?Are they aligned with standards? Are they aligned with the curriculum?
6. Links to instruction. Does the tool bridge information (either physically orconceptually) and practice?
It is important to keep in mind that these factors are interactive. For example,increasing the flexibility in terms of either multiple ways to use the tool ormanipulate data, would mostly likely decrease comprehensibility by requiring theuser to learn how to use the tool, or to do “data analysis.”
What the Educator Brings to the Transformation ProcessBased on the perspective that knowledge is embedded in people (Nonaka &Takeuchi, 1995; Sveiby, 1997), the third important dimension in data-drivendecision-making is the educator and what he or she brings to this process. Basedon our research we have focused on three aspects of the practitioner experiencewhich affect how educators use data: (1) the school context in which they teach;(2) pedagogy; and, (3) prior knowledge. In the case of teachers, importantelements of the school context that we have been researching are administrators’vision for using data in classroom-level planning and test pressure as defined bywhether the school is making adequate yearly progress (AYP) on testperformance. The second element is important because teachers synthesize thisinformation into their worldview, which is shaped by their teaching style andpedagogy. Relevant dimensions of prior knowledge are represented in teachers’experience in classroom management and lesson planning, their level assessmentliteracy, and their knowledge of the learning process and knowledge acquisition.
The Intersection of the Technology and Educator on the Way to TransformingData into KnowledgeBy folding these two dimensions (the technology and educator) into thetheoretical model of transforming data into knowledge, the resulting frameworktakes into account the process by which raw data becomes useable information,
How Practitioners Interpret and Link Data to Instruction: Research Findings on New YorkCity Schools’ Implementation of the Grow Network
AERA 2004 Do not cite without permission6
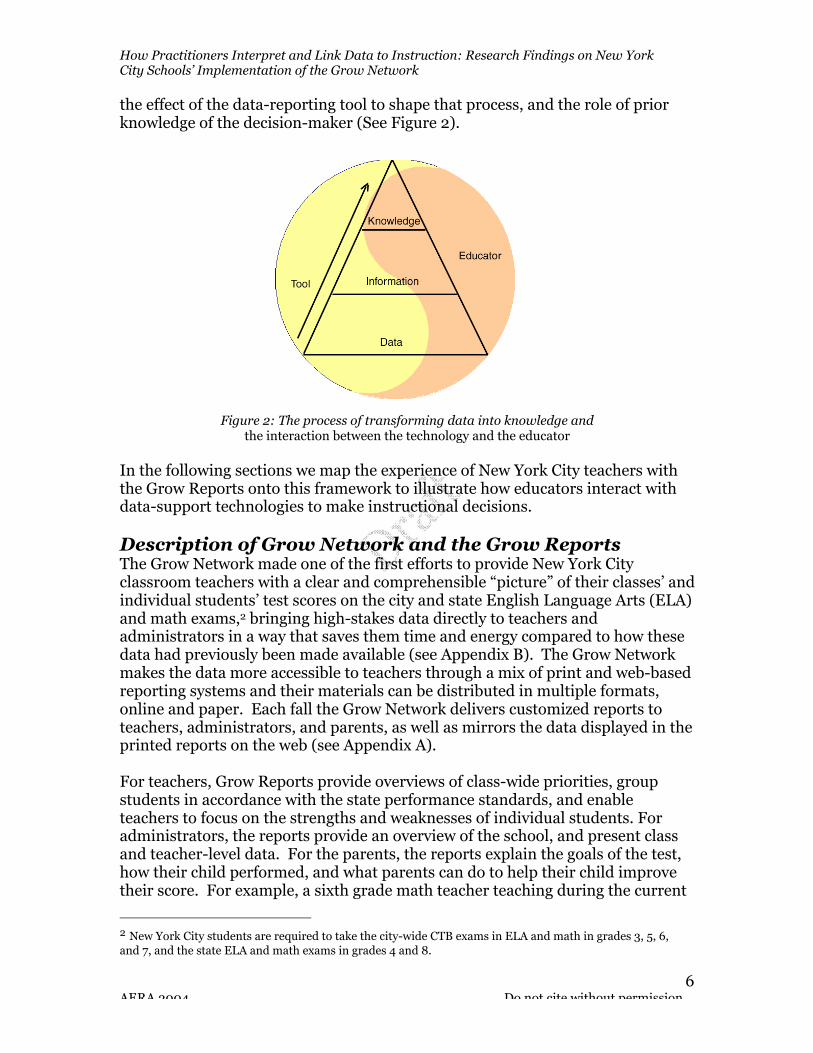
the effect of the data-reporting tool to shape that process, and the role of priorknowledge of the decision-maker (See Figure 2).
Figure 2: The process of transforming data into knowledge andthe interaction between the technology and the educator
In the following sections we map the experience of New York City teachers withthe Grow Reports onto this framework to illustrate how educators interact withdata-support technologies to make instructional decisions.
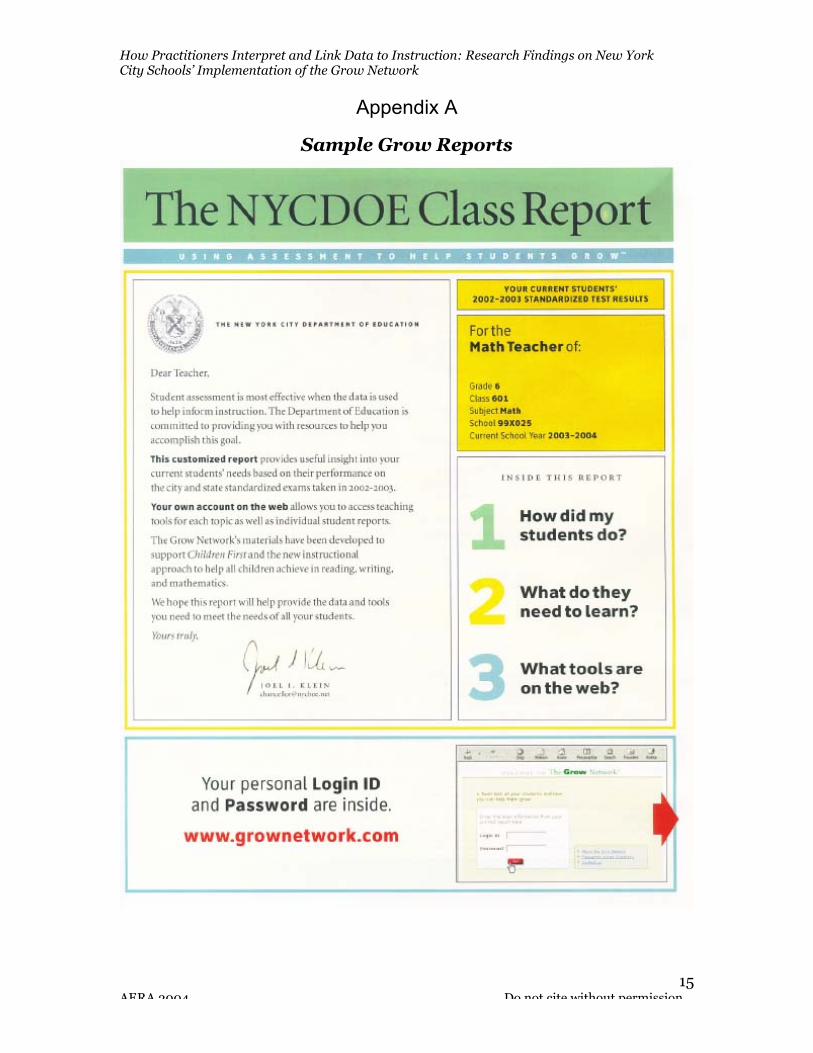
Description of Grow Network and the Grow ReportsThe Grow Network made one of the first efforts to provide New York Cityclassroom teachers with a clear and comprehensible “picture” of their classes’ andindividual students’ test scores on the city and state English Language Arts (ELA)and math exams,2 bringing high-stakes data directly to teachers andadministrators in a way that saves them time and energy compared to how thesedata had previously been made available (see Appendix B). The Grow Networkmakes the data more accessible to teachers through a mix of print and web-basedreporting systems and their materials can be distributed in multiple formats,online and paper. Each fall the Grow Network delivers customized reports toteachers, administrators, and parents, as well as mirrors the data displayed in theprinted reports on the web (see Appendix A).
For teachers, Grow Reports provide overviews of class-wide priorities, groupstudents in accordance with the state performance standards, and enableteachers to focus on the strengths and weaknesses of individual students. Foradministrators, the reports provide an overview of the school, and present classand teacher-level data. For the parents, the reports explain the goals of the test,how their child performed, and what parents can do to help their child improvetheir score. For example, a sixth grade math teacher teaching during the current
2 New York City students are required to take the city-wide CTB exams in ELA and math in grades 3, 5, 6,and 7, and the state ELA and math exams in grades 4 and 8.
How Practitioners Interpret and Link Data to Instruction: Research Findings on New YorkCity Schools’ Implementation of the Grow Network
AERA 2004 Do not cite without permission7
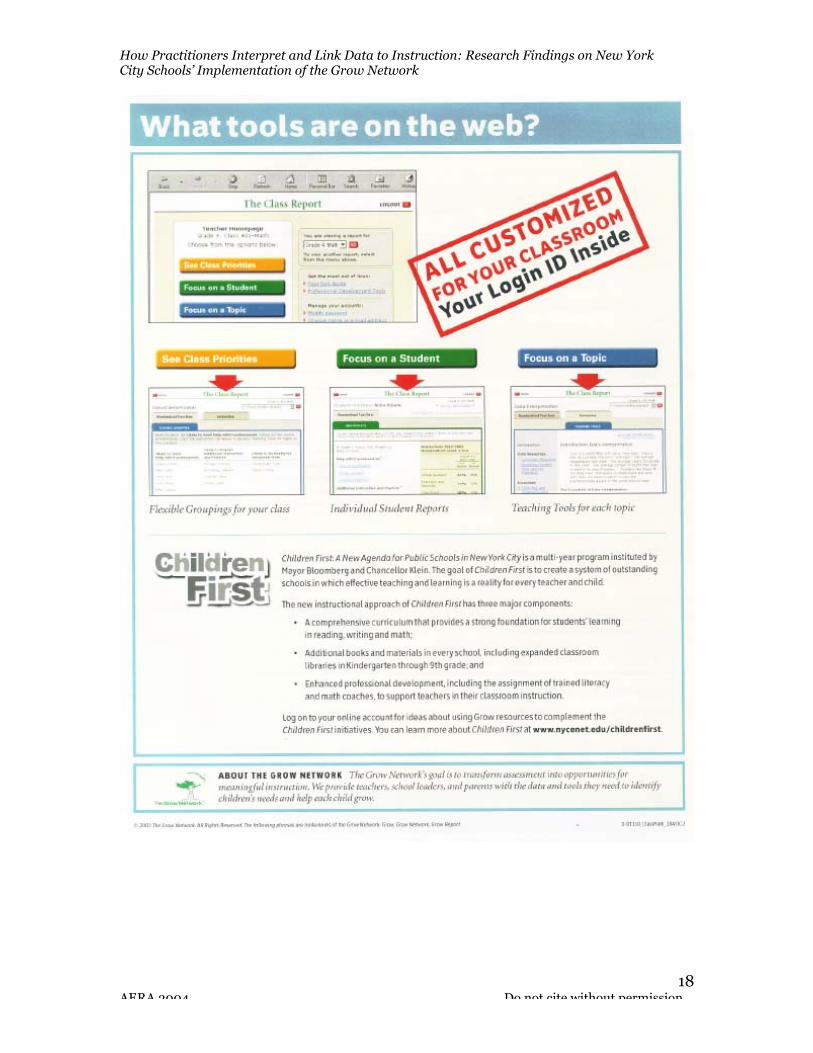
school year 2003-2004, would have access to a customized report that is groupedaccording to three questions: (1) How did my students do? (2) What do they needto learn? And, (3) what tools are on the web? This report performs a level ofsummarization and analysis of the data and identifies “class priorities.” Inresponse to “How did my student do?” the teacher would see the overall scoresfor all of her sixth grade students grouped according to the New York Statestandards across four levels, ranging from Far Below Standards (Level 1) to FarAbove Standards (Level 4), along with the students’ scale score. On “What dothey need to learn?” the teacher would see how her students did in each standardon the Grade 5 test according to New York State’s key ideas. She would also seeher students as a group compared to all New York City students. In addition, shewould have an overview of class priorities, based on last year’s test results on thesub-skills. The priorities are divided into three levels – need help withfundamentals, need additional instruction, and likely to benefit from advancedwork. These levels are calculated by Grow Network through a complex algorithmcomparing each student’s sub-skill results to the performance profile of all Level4 students on that skill, and so on, for each level. The delivery of these reportshas made data more accessible to teachers and enabled practitioners – bothteachers and administrators – to make decisions about this data directly in theirclassrooms.
In addition to the reports, the Grow Network website supports teachers’ analysisof the information and instructional decision-making with two additionalfeatures. Administrators and teachers often cited the explanations anddefinitions of the skills, standards and concepts on the test as an importantcomponent of the information provided. The online reports contain hotlinks thatdefine each skill or standard and explain challenges for students in mastering thisskill. An elementary principal commented that she “really likes Grow because ittells you what the item on the test means, and knowing what it means helps theteachers to better understand the test.” The class priorities lists as well as theexplanation of the tested concepts are also hotlinked to instructional materialsand resources for teachers and administrators that suggest activities and teachingstrategies to promote standards-based learning in the classroom. The reports alsolink to external resources approved by the New York City Department ofEducation.
Our StudyIn order to learn how educators used the Grow Reports and instructionalmaterials to make data-driven decisions within their schools and classrooms, weconstructed our research project as a combination of qualitative and quantitativemethodologies, drawing upon data gathered from observations, interviews, andsurveys. Based on the complexity of the study, we divided our research into threephases.
Phase One focused on understanding key stakeholders’ and educational leaders’objectives in bringing this project to administrators, teachers, and parents, whileexamining how districts supported the Grow Network resources. During Phase

How Practitioners Interpret and Link Data to Instruction: Research Findings on New YorkCity Schools’ Implementation of the Grow Network
AERA 2004 Do not cite without permission8
One, we conducted structured interviews with decision-makers and instructionalleaders, and piloted focus groups with teachers and staff developers. Weinterviewed a total of 47 educational leaders, including: central officestakeholders, superintendents, deputy superintendents, math coordinators, ELAcoordinators, staff developers, district liaisons, technology coordinators, directorsof research and curriculum, and individuals who work with the UnitedFederation of Teachers. We also spoke with several people representing non-government organizations working closely with the New York City schools onissues like educational reform and professional development.
Phase Two combined different qualitative research strategies, and consisted ofthree parts: (1) observations of professional development training sessions, whichfocused on how teachers spoke about using the Grow Reports; (2) interviews withteachers and administrators (including staff developers, coaches, principals, andassistant principals) about their beliefs and practices related to using GrowReports; and (3) interviews with teachers and administrators using sample GrowReports to probe about understanding and interpretation of the information.This was accomplished by conducting ethnographic research in 15 schools acrossfour school districts in New York City that represented various neighborhoods,student populations, and overall performance levels. Each district identified fourschools where we conducted 45 semi-structured and open-ended interviews withprincipals, assistant principals, staff developers, and teachers. In addition, weobserved ten grade-wide meetings and/or professional development workshops.To triangulate our data, we also designed a structured interview protocol, usingsample Grow Reports as projectives. This protocol enabled us to explore teachers’responses about the different data interfaces presented in the reports. We thenconducted 31 of these projective interviews with teachers in the two “high stakes”testing grades – fourth and eighth - in New York City, as well as with a sample ofsixth grade teachers. The sample of the upper grade teachers was equally dividedbetween those who teach math and those who teach language arts.
Phase Two of the research helped us to develop a deeper understanding of howclassroom teachers think about these resources in relation to their everydaypractice, and helped to contextualize the data gathered to inform Phase Three.This final phase of the study involved the development and administration of twoseparate surveys across the New York City public school system – one forteachers and one for administrators – and tested the hypotheses we developed inthe previous two phases of work. The surveys asked teachers and administratorsabout how they interpret data and conceptualize the use of the Grow Reports forinstructional planning. We also inquired about the types of supports needed tofully leverage the use of data to improve instruction. We disseminated over 750surveys through the mail to 17 schools across the city, as well as an online surveysent to over 1,400 teachers and administrators. We received 146 administratorresponses and 213 teacher responses from eight schools. We are currentlyanalyzing the survey data.
How Practitioners Interpret and Link Data to Instruction: Research Findings on New YorkCity Schools’ Implementation of the Grow Network
AERA 2004 Do not cite without permission9
How Teachers Understand the InformationDuring the qualitative components of the research, we spent a considerableamount of time talking with classroom teachers about their use of data inclassroom decision-making and more specifically, their use of the Grow Reports.For the first set of interviews, we sampled for teachers who were known to beusing the Grow Reports, and for the second set of interviews, we selected arandom sample of teachers within specific grades. During the interviews, theteachers’ conversation, when talking about students, seldom isolated the testresults, nor did they refer to specific scale scores. Instead, they talked about testresults in terms of their holistic knowledge of the students. It is ourunderstanding that the teachers were synthesizing the quantitative informationwith their qualitative understanding of the classroom. They commonlyunderstood the test results in relative terms of their students’ strengths andweaknesses. For example, one teacher said that she liked the Grow Reportsbecause they showed that every student has strengths. Therefore, even for herlowest performing students she could start a conversation with “here’s where youare strong….”
A consistent exception to this pattern of teachers and administrators not focusingon actual test scores is represented in discourse around “bubble kids.” “Bubblekids” refers to those students scoring within a range of five to ten points above orbelow the cut off. Because of their statistical location, the probability of movingthem is much higher; hence, some administrators report targeting the bubblekids for extra resources, such as pull-outs, after-school and special programs, inan effort “to move” them up a level. A core measure of AYP is the number ofstudents at Level 3 or moving from Level 2 to 3. Teachers, therefore, also saidthat the phenomenon of the bubble kids is some place where actual test scoresare meaningful to the classroom context.
During interviews, we learned that teachers found the reports clear andcomprehensible. Because of the importance placed on these test results, NewYork teachers already had prior knowledge of the performance levels. The factthat the Grow Reports were organized and summarized within that structuremade the reports readily meaningful to them. When we probed deeper intoteachers’ understanding of the levels themselves, we found that teachers had aqualitative understanding of the levels that was integrated into a conception ofgrade-level progression. As one fourth-grade teacher explained:
Well, it gives you a number, it tells you the number. It says righthere that Level 1 is from 475-617. That number range is tellingyou that a student within that number is far below thestandards, they are not even at grade level. Grade level isbetween 656- 700.
A number of the teachers translated the levels into “at grade-level” for Level 3,and then above and below grade level. Level 1 was understood as a catchallcategory for students more than one grade behind.

How Practitioners Interpret and Link Data to Instruction: Research Findings on New YorkCity Schools’ Implementation of the Grow Network
AERA 2004 Do not cite without permission10
Validity and Reliability ConcernsIn interviews with teachers, we also explored teachers’ knowledge of assessment,which ranged from teachers who had received training in measurement andpsychometrics to teachers with less statistical understandings. Most teacherswith whom we spoke mentioned issues of validity and reliability, althoughoftentimes using varied terms when speaking about them. In terms of thereliability of the test results, teachers primarily spoke about students’ test-takinganxiety: that some students were better test takers than others. A few educatorseven told stories about students who were so stressed out by the idea of takingthe test that they broke down in tears or actually became ill. Whenever teachershad a doubt about reliability of the data, some said that they verified studentability using their own assessment strategies. For example, one sixth gradeteacher used peer tutoring as both a teaching and an assessment strategy: “Iwatch them pair up with somebody, if they can show someone else, then youknow that they understood.”
Several teachers also expressed concern both that some students “test poorly”and would be placed in activities below their level, and, conversely, that otherstudents “test well,” scoring higher than their true understanding, and therefore,might not be eligible for the academic supports needed to really master thematerial. As one teacher of high performing fourth grade students commented:
Some students did not appear to know as much as their Growscore said they did. At first they were not as strong as Iexpected, then the previous teacher said that the whole class didnot do as well on tests. They’re very weak on the quizzesthroughout the year, but then they got higher scores on the statetest. So, you wonder what is up with that?
Teachers had a wider range of concerns when it came to issues regarding validity.In relation to content validity, the teachers with whom we spoke expressed fewconcerns about the alignment of standardized tests with the state’s standards.New York State is one of the states with the strongest alignment between the testand the standards (Princeton Review, 2002). Teachers expressed constructvalidity concerns over the reporting of the sub-skills regarding how the differentsections of the test were weighted. The reports do not indicate the number ofitems behind each sub-skill, and teachers did not know if the number of items ina section of the test truly represented a students’ ability on that skill. Teachersexpressed more concerns with face validity of the test and whether the testmeasures the “life skills” that students need to succeed. A sixth grade teacheradmitted that, “you really do start teaching to the test, you try to teach them[students] those life skills but you do begin to focus on the test.”
Teachers had substantial concerns about consequential validity. When teacherswere discussing their classroom-level decisions, concerns about validity andreliability were moderated as the test results could then be used in conjunctionwith other ways teachers have of knowing their students. Generally teachers
How Practitioners Interpret and Link Data to Instruction: Research Findings on New YorkCity Schools’ Implementation of the Grow Network
AERA 2004 Do not cite without permission11
referred to the information in the Grow Reports as a starting point, asinformation balanced with their own assessments. However, when teacherstalked about high stakes decisions made at levels of the system further distancedfrom the actual student, their concerns about the validity and reliability of thedata increased.
Teachers’ Reported Uses of Grow ReportsThe teachers’ synthesis of information from the Grow Reports into theirunderstanding of the classroom, offered us a springboard from which to exploreinstructional decision-making. In the interviews teachers reported using theGrow Network in myriad ways to meet their own varied pedagogical needs, aswell as their diverse students’ academic needs. We grouped those different usesinto three main categories: (1) planning - broad level planning such as settingclass priorities, creating a pacing calendar, or doing weekly or yearly lesson plans;(2) differentiating instruction - strategies like grouping, IEP’s, studentconferencing or individualized assignments and materials; and (3) supportingconversations – discussions with parents, students, fellow teachers andadministrators.
PlanningWhen asked how they use the Grow Reports, several teachers and schooladministrators reported using the Grow Reports and the instructional resourceswhen doing broad level planning such as setting class priorities, creating a pacingcalendar, or doing weekly or yearly lesson plans. Teachers reported that theGrow Reports help them decide on what standards to address and which skills toteach in daily lesson plans, mini-lessons, and even year-long pacing calendars.Many said that analyzing the information presented in the Grow Reports helpedto show them where their overall class’ strengths and weaknesses lie. Forexample, one teacher said that when looking at the reports, she asked herself,“Where is my class lacking?” and then, once identifying those skills, shedeveloped a mini-lesson and/or integrated those skills into larger lessons andunits for constant reinforcement. It was not uncommon for teachers to introducea higher level of analysis of the Grow information before making a decision. “Ispiral,” one teacher reflected. “If they know something I will make it a homeworkassignment to see how much they remember and if I need to review or re-teach. Iwill spiral topics throughout the whole year.”
The school context can play a key role in how teachers interpret and use the GrowReports. For example, we spoke with teachers in a low-performing school underthreat of take-over where the administration was tightly focused on testpreparation. The teachers reported planning instructional activities solely aroundthe test, even though this did not accord with their own view. A fourth gradeteacher in this school commented that “teaching is ‘not what I envisioned. Ithought [the students] would be learning to know rather than take the test.’”
Many teachers also reported using the Grow Reports to plan instruction thatwould better meet the needs of individual students, especially those who are

How Practitioners Interpret and Link Data to Instruction: Research Findings on New YorkCity Schools’ Implementation of the Grow Network
AERA 2004 Do not cite without permission12
struggling. By knowing an individual student’s strengths and weaknesses,teachers claimed that they could better plan instruction tailored to specificallyhelp that student, as well as provide him or her with materials appropriate towhere he or she is.
Differentiating InstructionMost teachers agreed that because the data represented on the Grow Reportsreveal that individual students perform at various different levels, the tool helpedthem to differentiate instruction. Teachers reported different uses of the GrowReport depending on the differentiation strategies they sought to implement.Teachers said that sometimes individualized instruction to meet student needs bymodifying lesson plans, by providing different materials so that students havemultiple entry points into the content, by varying homework and assignments,and/or by teaching in small groups or one-on-one. For example, when modifyinginstructional materials or selecting resources, teachers said that knowing wherestudents are in terms of the standards and skills could be beneficial. Some saidthey differentiate instruction by giving certain students’ modified in-class and/orhomework assignments according to their ability level. Others said they useentirely different textbooks or supplementary materials to work with differentstudents. For example, one teacher used information found in the Grow Reportto create different math homework calendars targeting specific weaknesses andstrengths of students.
Many teachers said the Grow Reports could inform their grouping strategies byshowing where students fell relative to each other. The grouping strategies tookseveral different forms, and the relevance of Grow data varied by strategy. Forinstance, teachers might use Grow Reports for homogenous or heterogeneousability grouping, but not for groups based on other criterion (i.e. behavior,interest, self selected). Furthermore, some teachers said that they regroupedstudents frequently and the Grow Report helped them make decisions whencreating groups to work on a specific skill, but were less important in helpingthem group for a project-based learning activity. One sixth-grade teacher stated,“Oh sure, we do two periods a day of reading where we focus on the skill of theweek. That’s where I group them on the data. We have test prep books that focuson the skill, and Grow ties in nicely with that.”
Another way that teachers reported differentiating instruction was by creating apeer tutoring situation in which a high performing student worked with a lowperforming student:
Like for writing, we are doing a research project. Some kids areexcelling. They have already done the outline and are ready to goon. Other kids don’t know what to do with the outline, so I pairthem – the strong and the weak to help each other.
How Practitioners Interpret and Link Data to Instruction: Research Findings on New YorkCity Schools’ Implementation of the Grow Network
AERA 2004 Do not cite without permission13
Teachers also individualized instruction by working one-on-one with students.The data in Grow Reports could help identify students in need of special supportin specific areas.
Supporting ConversationsMost of the teachers and school-building administrators with whom we spokesaid the Grow Reports were useful in supporting conversations about studentsand learning. They spoke of using the Grow Reports in conversations withteachers, parents, administrators, and students. The respondents felt that theGrow Report provided a good starting point for conversations about studentlearning. For example, many teachers stated that the Grow Reports providedsomething “concrete” to show parents when discussing where the student was inhis or her learning and where he or she needed to go. Some administrators saidthat when doing classroom visits, they ask teachers to explain how they use theGrow Report to inform their lessons.
The Grow Reports were also used to motivate students, set students’ learninggoals, and help shift responsibility to students in terms of their own learning.Many teachers reported using the information from the Grow Reports toconference with individual students about their performances. A few teachersinformed us that they gave their students their own Grow Reports and hadstudents create their own learning plans. One veteran teacher in a Harlem schoolworked with his eighth grade students to create a sort of IEP (IndividualizedEducation Plan) of skills and competencies in which they excelled and on whichthey needed to improve. This process, he said, assisted him in giving studentsmore ownership over their own learning.
Conclusions and RecommendationsThe conceptual framework for understanding data-driven decision-making hasproved effective. In this paper, we have attempted to use the framework to layout the steps of transforming data into knowledge that can inform a decision, inaddition to what the Grow Reports and what the educator brings at each step.The framework illuminates the interrelation between the data-tool and theeducator in supporting decision-making. In understanding the role of the GrowReports, the framework allows us to identify how the tool supports the creation ofknowledge by collecting and organizing and summarizing the data. The ease withwhich most teachers were able to understand the reports perhaps indicates thatthe data are now at the level of information.
The framework also highlights the critical role the educator plays in the data-knowledge process and the wealth of practitioner knowledge in that respect. Thetransformation process identifies that the last few steps in generating knowledgeare analyzing and synthesizing. In order to do this, teachers connect theinformation about test performance to their prior knowledge of teaching andtheir students, thereby shaping this connection by their pedagogy, their contextand their level of understanding of the test. The decision being made from theGrow Reports were not driven by the data as much as by teachers’ pedagogy. As

How Practitioners Interpret and Link Data to Instruction: Research Findings on New YorkCity Schools’ Implementation of the Grow Network
AERA 2004 Do not cite without permission14
teachers stated, the data helped them develop a clearer picture of their students,but they still had to integrate this data into their broader understanding. In thefinal stages of the data-knowledge process, teachers rely more on their knowledgeof teaching and learning than on their assessment literacy. This is perhaps thecrux of the relationship between the data-tool and the educator where Grow haseffectively transforms the test data so that the educator can use them whenmaking classroom decisions.
We have tried to demonstrate the way in which the teacher shapes the final stepsof transformation into knowledge. Therefore, keeping the role of practitionerknowledge in mind, our preliminary findings suggest that the information in theGrow Reports helps teachers know what their students could and could not do onone set of learning standards, but does not necessarily cause teachers to rethinktheir conceptions of teaching and learning. This supports the suggestion that, inorder, for data-driven decision-making to change teaching and learning practices,the focus of professional development should be on teaching and learning, ratherthan just on data analysis.
A second recommendation is for further research into identifying the appropriatebalance between what technology can offer and what practitioners need fordifferent levels of decision-making. Our findings support the perception that theGrow Reports play a substantial role in creating useable information for teachersand required less assessment literacy from the teachers than other data-tools.This had certain benefits in terms of ease of use and comprehensibility andrelevance to the classroom, but there are other possible combinations andformats. As data-driven decision-making becomes more prevalent in schools, weneed to better understand how data technologies can best support the teachingand learning process.
How Practitioners Interpret and Link Data to Instruction: Research Findings on New YorkCity Schools’ Implementation of the Grow Network
AERA 2004 Do not cite without permission15
Appendix A
Sample Grow Reports

How Practitioners Interpret and Link Data to Instruction: Research Findings on New YorkCity Schools’ Implementation of the Grow Network
AERA 2004 Do not cite without permission16

How Practitioners Interpret and Link Data to Instruction: Research Findings on New YorkCity Schools’ Implementation of the Grow Network
AERA 2004 Do not cite without permission17
How Practitioners Interpret and Link Data to Instruction: Research Findings on New YorkCity Schools’ Implementation of the Grow Network
AERA 2004 Do not cite without permission18

How Practitioners Interpret and Link Data to Instruction: Research Findings on New YorkCity Schools’ Implementation of the Grow Network
AERA 2004 Do not cite without permission19
Appendix B
Copy of old version of teacher report of test data

How Practitioners Interpret and Link Data to Instruction: Research Findings on New YorkCity Schools’ Implementation of the Grow Network
AERA 2004 Do not cite without permission20
References
Ackoff, R. L. (1989). From Data to Wisdom. Journal of Applied SystemsAnalysis, 16, 3-9.
Breiter, A. (2003). Information - Knowledge - Sense-making A theoreticalanalysis from management / business literature.Unpublishedmanuscript, Bremen, Germany.
Choo, C. W. (2002). Information Management for an Intelligent Organization:The Art of Environmental Scanning. 3rd Edition. Medford, NJ:Information Today.
Drucker, P. F. (1989). The New Realities: In Government and Politics/InEconomics and Business/In Society and World View. New York, NY:Harper & Row.
Easton, J. Q., & Luppescu, S. (2004). Teach and Principal Responses to theGrow Network: A Preliminary Evaluation of Use in Chicago PublicElementary Schools. Chicago: Consortium on Chicago School Research.Research Data Brief.
Elmore, R., & Abelmann, C. (1999). When accountability knocks, will anyoneanswer? Philadelphia: Center for Policy Research in Education.
Fullan, M. (2000). The Three Stories of Education Reform. Phi Delta Kappan,81(8), 581-584.
Fullan, M. (2001). The new meaning of educational change (3rd ed.). New York:Teachers College Press.
Grow Network. (2004). About The Grow Network. Retrieved April 1, 2004, fromhttp://grownetwork.com/
Heistad, D., & Spicuzza, R. (2003). Beyond zip code analyses: What goodmeasurement has to offer and how it can enhance the instructionaldelivery to all students. Paper presented at the American EducationalResearch Association, Chicago, IL.
Herman, J., & Gribbons, B. (2001). Lessons learned in using data to supportschool inquiry and continuous improvement: Final report to the StuartFoundation. Los Angeles: UCLA Center for the Study of Evaluation.
Mitchell, D., & Lee, J. (1998). Quality school portfolio: Reporting on schoolgoals and student achievement. Paper presented at the CRESSTConference, Los Angles, CA.
Nonaka, I., & Takeuchi, H. (1995). The Knowledge Creating Company. Oxford:Oxford University Press.
Princeton Review. (2002). Testing the Testers 2002: An Annual Ranking ofState Accountability Systems. Princeton, NJ: Princeton Review.
Salpeter, J. (2004). Data: Mining with a Mission. Technology and Learning,24(8), 30- 37.
Sarmiento, J. (n.d.). Technology Tools for Analysis of Achievement Data: AnIntroductory Guide for Educational Leaders. Retrieved March 7, 2004,from www.temple.edu/lss/
Secada, W. (2001, Spring). From the Director. Newsletter of the ComprehensiveCenter-Region VI, 6, 1-2.

How Practitioners Interpret and Link Data to Instruction: Research Findings on New YorkCity Schools’ Implementation of the Grow Network
AERA 2004 Do not cite without permission21
Sharkey, N., & Murnane, R. (2003). Helping K-12 Educators Learn from StudentAssessment Data. Paper presented at the AERA, Chicago.
Spielvogel, B., Brunner, C., Pasnik, S., Keane, J. T., Friedman, W., Jeffers, L., etal. (2001). IBM Reinventing Education Grant Partnership Initiative -Individual Site Reports. New York: EDC/Center for Children andTechnology.
Spielvogel, B., & Pasnik, S. (1999). From the School Room to the State House:Data Warehouse Solutions for Informed Decision-Making in Education.New York: EDC/Center for Children and Technology.
Sveiby, K. E. (1997). The New Organizational Wealth: Managing andMeasuring Knowledge-Based Assets: Berrett Koehler.
Thorn, C. (2002). Data Use in the Classroom: The Challenges of ImplementingData-based Decision-making at the School Level. Madison: University ofWisconsin, Wisconsin Center for Education Research.
Wayman, J. C., Stringfield, S., & Yakimowski, M. (2004). Software EnablingSchool Improvement throught Analysis of Student Data (No. 67).Baltimore: Baltimore City Public School System.
Webb, N. (2002). Assessment Literacy in a Standards-Based Urban EducationSetting. Paper presented at the AERA, New Orleans.