how not to attack an economist (and an economy): getting...
TRANSCRIPT
Issue Brief • April 2008
Center for Economic and Policy Research
1611 Connecticut Ave, NW Suite 400
Washington, DC 20009 tel: 202-293-5380
fax:: 202-588-1356 www.cepr.net
How Not to Attack An Economist (and An Economy): Getting the Numbers Right
BY MARK WEISBROT* Executive Summary This paper is part of a debate over the performance of the Venezuelan economy during the Chávez years, and particularly during the last five years of economic expansion. It began with an article in March/April Foreign Affairs1 which argued that “a close look at the evidence reveals just how much Chávez's 'revolution' has hurt Venezuela's economy -- and that the poor are hurting most of all.” CEPR responded with a criticism of this article,2 and the author of the Foreign Affairs article, Francisco Rodriguez, has responded with a Wesleyan University Economic Working Paper defending his assertions and attacking ours.3 This paper shows that:
Contrary to Rodriguez's assertion that Venezuela has not had very much poverty reduction for the amount of per capita income growth it experienced from 2003-2007, Venezuela ranks very high in comparison to other countries and regions on this score. (During this period, Venezuela's income per capita increased by 50 percent, and its household poverty rate was cut in half).
According to country and regional data from the World Bank for thirty-four growth spells of more than forty percent in per capita GDP, over the last two decades, Venezuela ranks near the top in terms of poverty reduction for the amount of growth experienced.
*Mark Weisbrot is Co-Director of the Center for Economic and Policy Research in Washington, DC. The author would like to thank David Rosnick and Luis Sandoval for research, and also John Schmitt, Dean Baker, Deborah James, and Dan Beeton for helpful comments.
1 Rodriguez, Francisco. “An Empty Revolution: The Unfulfilled Promises of Hugo Chávez.” Foreign Affairs. 87.2
(2008a): 49-62 2 Weisbrot, Mark. 2008. “An Empty Research Agenda: The Creation of Myths About Contemporary Venezuela.”
Washington, DC.: Center for Economic and Policy Research. [http://www.cepr.net/documents/publications/venezuela_research_2008_03.pdf]
3 Rodriguez, Francisco. 2008b. “How Not to Defend the Revolution: Mark Weisbrot and the Misinterpretation of Venezuelan Evidence.” Middletown, CT.: Wesleyan Economic Working Papers, Wesleyan University. [http://frrodriguez.web.wesleyan.edu/docs/working_papers/How_Not_to_Defend.pdf]
Center for Economic and Policy Research, April 2008 • 2
This is shown in Table 1 and Figure 1 below. The average income elasticity of poverty reduction for these growth spells is about one-third that of Venezuela. For low and middle-income countries as a group, growth from 1993-2004, per capita income grew by 46.7 percent, and the poverty rate was reduced by 20 percent. This is less than half the amount of poverty reduction per unit of per capita income growth that Venezuela achieved. This paper also attempts to clear up some of the conceptual confusion resulting from Rodriguez's erroneous comparisons, which conflated different concepts of the income elasticity of poverty reduction, in both the Foreign Affairs article and the Wesleyan Working Paper. It is because of these errors that Rodriguez draws the conclusion, contradicted by the World Bank data, that Venezuela's poverty reduction has been inadequate, relative to other countries, for the amount of economic growth achieved. Contrary to Rodriguez's assertion that inequality has increased in Venezuela during the Chávez years,
as measured by the Gini coefficient, the best available data shows a decline in inequality, with the Gini falling from 0.4865 in 1998 to 0.42 in 2007. The INE's (National Institute of Statistics) methodology, which Rodriguez attacks, appears to be the same as that used by other research institutions throughout the world, including the Luxembourg Income Study and the Inter-American Development Bank. There is no reason to believe that the INE is “omitting the poorest households from the construction of an inequality index,” as Rodriguez asserts without evidence.
Rodriguez's attempt to redefine the official poverty rate in order to salvage his original argument
about Venezuela's poverty reduction is methodologically flawed. He attempts to raise the poverty rate by taking into account shortages of some food items that have appeared over the last year and a half. But he does not take into account any increases in non-cash income of the poor that have occurred, some of which are substantial, including access to health care and education. Also, many of the shortages of food items to which he refers have recently receded.
Rodriguez's argument that the Chávez government has not delivered with regard to social spending
also falls short. Real (inflation-adjusted) social spending per capita has tripled during the Chávez years, taking into account his correction that eliminates most of PDVSA's spending that has been classified as social spending. As a percent of GDP, social spending has increased from 8.2 percent in 1998 to 15.9 percent in 2006. Even if we adopt Rodriguez's definition of social spending as only including spending on health, education, and housing, this has increased from 5.7 percent in 1998 to 10.1 percent in 2006.
Also, from 1998 –2006, the share of public spending devoted to health, education, and housing rose from 24.1 percent to 27.5 percent. This means that even by Rodriguez's definition of social spending, and accepting his argument that all that matters is the share of public spending that is social spending, there is an increase during the Chávez years. But this paper argues that it is does not make sense to look only at the share of health, education, and housing in total public spending, as Rodriguez claims. This paper also takes issue with Rodriguez's research regarding Venezuela's national literacy campaign.
Rodriguez claims he “found little evidence that the program had had any statistically distinguishable effect on Venezuelan illiteracy.” We argue that the Venezuelan Households Survey, on which this research is based, is too crude a measure of literacy to support this conclusion.
The paper also clears up a number of misrepresentations and misquotations of CEPR's work that
appear in Rodriguez's Working Paper.
Issue Brief • April 2008 • 3
Finally, it is worth noting that in the five years since the government of President Hugo Chávez Frias got control over the country's national oil industry, real (inflation-adjusted) GDP has grown by more than 87 percent, with only a small part of this growth being in oil. The poverty rate has been cut in half, and unemployment by more than half. The economy has created jobs at a rate nearly three times that of the United States during its most recent economic expansion. Health care for the poor has been vastly expanded, with the number of primary care physicians in the public sector increasing from 1,628 in 1998 to 19,571 (by early 2007). About 40 percent of the population has gotten access to subsidized food. Access to education, especially higher education, has also been greatly expanded for poor families.4
As we noted previously, it would be remarkable if this macroeconomic and spending picture were compatible with the dire picture of Venezuela that Rodriguez paints. This paper shows that it is not.
4 See, Weisbrot, Mark and Luis Sandoval. 2008. “Update: The Venezuelan Economy in the Chávez Years.”
Washington, D.C.: Center for Economic and Policy Research. [http://www.cepr.net/documents/publications/venezuela_update_2008_02.pdf]
Center for Economic and Policy Research, April 2008 • 4
Introduction In a recent paper5, I responded to an article in Foreign Affairs6 which argued that “a close look at the evidence reveals just how much Chávez's 'revolution' has hurt Venezuela's economy -- and that the poor are hurting most of all.” The author, Francisco Rodriguez, has now responded with a defense of his assertions and an attack on mine.7 Before looking at the arguments in detail, it is worth providing some background as to why this debate is important. First, with regard to Foreign Affairs, which is one of the most influential publications on foreign policy in the United States: In 2006 Foreign Affairs published three articles about Venezuela and Latin America's leftward political shift, all of which contained serious inaccuracies and also presented a very one-sided view of this important political phenomenon.8 It has never published an article or essay presenting anything substantially different from these views.9 This editorial policy combined with lax standards with regard to accuracy on this subject matter deprives Foreign Affairs readers of an informed understanding of the important political and economic changes taking place in Latin America today. Second, the political impact of economic and econometric research on Venezuela can be very significant. For example, in 2004, economists Ricardo Hausmann of Harvard's Kennedy School (a former Minister of Planning of Venezuela) and Roberto Rigobon of MIT published a paper10 purporting to show econometric evidence of electronic fraud in the 2004 presidential recall referendum. The theory of the fraud was implausible in the extreme, the statistical analysis was seriously flawed, and the election was observed and certified by the Carter Center and the Organization of American States. Nonetheless this paper had a substantial impact. Together with faked exit polls by Mark Penn's polling firm of Penn, Schoen, and Berland -- which purported to show the recall succeeding by a 60-40 margin, the mirror image of the vote count11 -- it became one of the main pieces of evidence that convinced the Venezuelan opposition that the elections were fraudulent. On this basis they went on to boycott the 2005 congressional elections, and consequently are without representation in the National Assembly. The influence of this Hausmann and Rigobon study would probably have been much greater, but CEPR refuted it12 and then the Carter Center followed with an independent panel of statisticians that also
5 Weisbrot, Mark. 2008. “An Empty Research Agenda: The Creation of Myths About Contemporary Venezuela.”
Washington, DC.: Center for Economic and Policy Research. [http://www.cepr.net/documents/publications/venezuela_research_2008_03.pdf]
6 Rodriguez, Francisco. “An Empty Revolution: The Unfulfilled Promises of Hugo Chávez.” Foreign Affairs. 87.2 (2008a): 49-62.
7 Rodriguez, Francisco. 2008b. “How Not to Defend the Revolution: Mark Weisbrot and the Misinterpretation of Venezuelan Evidence.” Middletown, CT.: Wesleyan Economic Working Papers, Wesleyan University. [http://frrodriguez.web.wesleyan.edu/docs/working_papers/How_Not_to_Defend.pdf]
8 See: Weisbrot, Mark. Letter. Foreign Affairs 85.4 (2006). [http://www.foreignaffairs.org/20060701faletter85419/mark-weisbrot/left-hook.html]
9 It has published brief responses, but no articles or essays. 10 Hausmann, Ricardo, and Roberto Rigobon. 2004. “In Search of the Black Swan: Analysis of the Statistical
Evidence of Electoral Fraud in Venezuela.” Boston, MA: Working Paper, Harvard University. Accessed online on April 15, 2008. [http://ksghome.harvard.edu/~rhausma/new/blackswan03.pdf]
11 Rosnick, David. 2004. “Polling and the Ballot: The Venezuelan Referendum.” Washington, DC. : Center for Economic and Policy Research [http://www.cepr.net/documents/publications/venezuela_2004_08.pdf]
12 Weisbrot, Mark, David Rosnick and Todd Tucker. 2004. “Black Swans, Conspiracy Theories, and the Quixotic
Issue Brief • April 2008 • 5
examined these allegations and found them to be without evidence.13 Nonetheless, the Wall Street Journal14 and other, mostly Latin American publications, used the study to claim that the elections were stolen. Conspiracy theories about Venezuelan elections continue to be widely held in Venezuela, and are still promoted by prominent people in major media sources such as Newsweek, even with regard to the recent constitutional referendum of December 2, 2007.15 Finally, there is an overall political climate, which is worsening as the U.S. State Department considers whether to list Venezuela as a “state sponsor of terrorism,” that promotes a lack of proper scrutiny of allegations regarding Venezuela. As I noted previously, before CEPR published its paper “Poverty Rates in Venezuela: Getting the Numbers Right,” the U.S. and international media, and magazines including Foreign Affairs and Foreign Policy, were widely disseminating the false assertion that poverty had actually worsened under the Chávez government.16 After CEPR's paper was published, several major newspapers17 ran retractions/corrections, and the vast majority of the media stopped repeating this particular falsehood. The current debate is useful, although it would be better if Rodriguez actually cited my writing, rather than his own approximations to my writing. As will be seen below, these are not always accurate or even true. In my response to his Foreign Affairs article, I used exact quotes to avoid such misunderstandings. It turns out that all of Rodriguez's assertions in his response are without merit, except for one – where he presents new information on PDVSA's social spending. This changes one number, but does not change the overall picture. His argument that inequality has increased during the Chávez years is contradicted by the best available data (In fact these data show a reduction in inequality). His claim that the amount of poverty reduction in Venezuela during the last 4 years—the poverty rate has been cut in half—compares unfavorably with other countries is clearly wrong; in fact, Venezuela’s poverty reduction has been much better than the vast majority of countries for the amount of growth that it has had. His argument that the Chávez government did not demonstrate any change of priorities with regard to public spending is wrong and misleading. His assertion that Venezuela’s literacy program has not had any distinguishable effect on literacy cannot be demonstrated from the data that he uses. Rodriguez uses a number of technical arguments in his response, some of which also contain errors. I will explain these errors, but will also try to show as much as possible for the non-economist reader how the substantive points are wrong.
Search for Fraud: A Look at Hausmann and Rigobon’s Analysis of Venezuela’s Referendum Vote.” Washington, DC.: Center for Economic and Policy Research. [http://www.cepr.net/documents/publications/venezuela_2004_09.pdf]
13 Carter Center. “Report on an Analysis of the Representativeness of the Second Audit Sample, and the Correlation between Petition Signers and the Yes Vote in the Aug. 15, 2004 Presidential Recall Referendum in Venezuela.” Atlanta, GA: The Carter Center. Accessed online on April 15, 2008. [http://www.cartercenter.org/documents/nondatabase/report091604.pdf]
14 “Conned in Caracas.” Wall Street Journal. September 9, 2004. Accessed online on April 15, 2008. [http://www.opinionjournal.com/editorial/feature.html?id=110005586]
15 Castañeda, Jorge. “Attempted Theft.” Newsweek Online. December 7, 2007. Accessed online on April 15, 2008. [http://www.newsweek.com/id/74230]
16 Weisbrot, Mark, Luis Sandoval and David Rosnick. 2006. “Poverty Rates in Venezuela: Getting the Numbers Right,” Washington, D.C.: Center for Economic and Policy Research. [http://www.cepr.net/documents/venezuelan_poverty_rates_2006_05.pdf]; see appendix of this paper for documentation of this repeated false allegation in major media and other sources.
17 These included the New York Times, Financial Times, Chicago Tribune and Los Angeles Times.

Center for Economic and Policy Research, April 2008 • 6
Let's look at the issues raised by Rodriguez in his rebuttal: How does Venezuelaʹs poverty reduction (2003‐2007) compare with other countries? From 2003 to 2007,18 as Rodriguez (2008a) notes, the poverty rate fell by about half, from 54 to 27.5 percent of households. This appears to be a sharp drop in just four years. But Rodriguez argues that it is really not good at all, in comparison with other countries, for the amount of growth that Venezuela has had. TABLE 1 Changes in per capita GDP and poverty rates, countries and regions
Years Percent change in per-capita GDP
Percent change in poverty rate /1
Estimated elasticity
Albania 1997-04 7 62.6 -11.5 -0.3 Armenia 1999-03 4 53.0 -18.8 -0.5 Azerbaijan 1995-01 6 46.5 -24.4 -0.7 Botswana 1986-93 7 50.2 -9.5 -0.2 Cambodia 1994-04 10 66.2 -6.6 -0.1 Chile 1992-03 11 44.2 -53.6 -2.1 China 1981-87 6 76.1 -22.1 -0.4 China 1987-93 6 57.3 -0.7 0.0 China 1993-99 6 64.4 -26.5 -0.6 China 1999-04 5 50.0 -30.3 -0.9 Costa Rica 1986-03 17 48.1 -45.8 -1.6 Dominican Republic 1992-04 12 44.1 65.7 1.4 East Asia & Pacific 1981-87 6 46.6 -19.2 -0.6 East Asia & Pacific 1987-93 6 50.3 -5.1 -0.1 East Asia & Pacific 1993-99 6 46.7 -24.1 -0.7 East Asia & Pacific 1999-04 5 41.7 -25.9 -0.9 Estonia 1995-03 8 73.3 8.7 0.2 Georgia 1996-03 7 59.1 197.5 2.3 Hungary 1993-02 9 40.9 0.0 0.0 India 1993-04 11 63.6 -5.8 -0.1 Indonesia 1987-02 15 65.2 -30.9 -0.7 Kazakhstan 1996-03 7 60.1 -14.0 -0.3 Lao PDR 1992-02 10 48.3 -1.1 0.0 Latvia 1998-03 5 43.1 -59.1 -2.5 Lithuania 1996-03 7 53.9 0.3 0.0 Low & middle income 1993-04 11 46.7 -20.0 -0.6 Malaysia 1989-97 8 64.2 -33.5 -0.8 Panama 1989-03 14 43.7 -24.1 -0.8 Poland 1993-02 9 51.0 -83.0 -4.3 South Asia 1981-93 12 41.3 -7.1 -0.2 South Asia 1993-04 11 54.7 -6.2 -0.1 Sri Lanka 1990-02 12 52.4 2.5 0.1 Thailand 1981-88 7 43.5 -1.8 -0.1 Thailand 1988-02 14 75.9 -53.5 -1.4 Average -0.5 Source: World Bank, World Development Indicators Note: 1/ Poverty headcount ratio at PPP $2 per day (percent) for all entries. 18 Data is from first half.

Issue Brief • April 2008 • 7
The World Bank’s data on poverty do not support Rodriguez’s claim. These data show that Venezuela’s record on poverty reduction compares quite favorably with other countries.19 This can be seen in Table 1. This shows country and regional data for thirty-four growth spells of more than forty percent in per capita GDP, over the last two decades.20 For example, we can look at developing countries as a group. From 1993-2004, per capita income in low and middle-income countries grew by 46.7 percent; during that time, the poverty rate21 fell by 20 percent.22 This is less than half the poverty reduction per unit of per capita income growth in Venezuela's 2003-2007 recovery. We can also compare to individual countries. As can be seen from the table, Venezuela’s poverty reduction relative to its growth in per capita income is considerably more than that of the vast majority of countries and regions in the table. The average performance is vastly below that of Venezuela – about one-third -- as we will see below when we discuss the concept of income elasticity of poverty reduction. FIGURE 1 Income-Poverty relation over substantial cumulative growth in per-capita GDP
Source: World Bank, World Development Indicators
19 World Bank. World Development Indicators online. Washington, DC: World Bank Group. 20 Venezuela's poverty rate is calculated on the basis of the national poverty line, which is several times higher than
the $2 per day PPP poverty line for the World Bank data. This would bias the comparison against Venezuela, since the income elasticity of poverty reduction is less (absolute value) as the poverty line moves closer to mean income.
21 Poverty headcount ratio at PPP $2 per day (percent). 22 World Development Indicators, author's calculations.
Center for Economic and Policy Research, April 2008 • 8
How does Rodriguez get this so wrong? This gets a bit technical. Let us look at his arguments, in the Foreign Affairs article and his most recent response (Rodriguez 2008b). From the Foreign Affairs article:
The real question is thus not whether poverty has fallen but whether the Chávez government has been particularly effective at converting this period of economic growth into poverty reduction. One way to evaluate this is by calculating the reduction in poverty for every percentage point increase in per capita income -- in economists' lingo, the income elasticity of poverty reduction. This calculation shows an average reduction of one percentage point in poverty for every percentage point in per capita GDP23 growth during this recovery, a ratio that compares unfavorably with those of many other developing countries, for which studies tend to put the figure at around two percentage points. (2008a, p.52-53).
I pointed out that this comparison did not make sense, since it would imply that Venezuela should be expected to have reduced the poverty rate to zero. To which Rodriguez now replies that the first calculation (an income elasticity of 1, as he defines it above) is an "approximation to the point elasticity (the relative change in the dependent variable for an infinitesimally small relative change in the independent variable), which will only be accurate if the poverty-income relationship is linear." 24 He then explains that the number "two", as in "two percentage points" in the above paragraph, is something quite different: an estimate based on fitting an exponential function to cross-national data on poverty reduction and income growth, which will be discussed below.25 Rodriguez attempts to argue that my criticism is "based on a misinterpretation of the concept of elasticity" but the mistake is clearly his and it is quite ridiculous to blame it on the reader. Any economist, mathematician, or person who understands the basic concept of elasticity would read his statement in the Foreign Affairs article the same way. There is no way for the reader to tell that he is comparing apples to oranges.26 Indeed, when Rodriguez (2008b) calculates the elasticity for Venezuela's poverty reduction/income growth for just the two points (2003 and 2007) according to his logarithmic specification, he gets -1.67. 27 In other words, as he shows in his response, when comparing Venezuela's elasticity of "one" with an international standard of "two" in the Foreign Affairs article28, he really meant 1.67, a number which is
23 I.e., there was approximately a 50 percent reduction in the poverty rate (from 54 percent to 27.5 percent) for an
increase in per capita income of about 50 percent from the first half of 2003 to the first half of 2007. 24 Actually, Rodriguez's original wording here is confused even for the approximation he is describing; he says
"percentage point" when he means "percent." This is a significant confusion – e.g. the poverty rate in this example drops from 54 percent to 23.5 percent. This is a 49.1 percent drop but only 26.5 percentage points.
25 “Properly estimating the point elasticity requires the assumption of a functional form that allows us to traduce the observations of discrete changes in poverty (what we observe) into point estimates corresponding to infinitesimally small changes. The simplest and most common way to do this is by assuming an isoelastic logarithmic specification, such as: it i it log pov = α + β log y (1),” (Rodriguez 2008b, p11).
26 Mathematically, ignoring the mistake in his use of the word "percentage point", he is calculating an elasticity between two points, computed on the basis of the formula ΔP/P1 divided by ΔY/Y1 and comparing it to a point elasticity that is derived from fitting a log-log regression (a constant elasticity function) to a series of data points, from different growth spells and countries, as described in the studies cited below.
27 "If one uses definition (1) for Venezuela for the period between the first semester of 2003 and the first semester of 2007, one gets an elasticity estimate of -1.67: ln(27.5/54)/ln(942,308/629,589)," (Rodriguez 2008b, p 11).
28 The numbers "one" and "two" in the Foreign Affairs description are absolute values of the elasticities, which are generally negative because poverty and per capita income generally move in opposite directions.
Issue Brief • April 2008 • 9
considerably closer to 2 than it is to 1.29 Rodriguez writes: “This estimate is still lower in absolute value than – though closer to the lower bound of – the values found in most of the cross-national literature.” In a footnote, he notes that:
Ravaillon and Chen (1997) estimate the log-elasticity of poverty reduction at between -2.59 and -3.12 on a sample of 64 developing countries. World Bank (2000) estimates -2, a value that is similar to that estimated by Bourgoignon [sic] (2003) and routinely used in World Bank simulations (Rodriguez 2008b, p.11)
But these cross-national estimates of point elasticities are not directly comparable to the large change (a 50 percent increase in per capita income) that we are looking at in Venezuela. As we have seen by looking at low and middle-income countries as a group, as well as the individual countries in Table 1 above, there is a huge difference between what we observe in each country over sizeable income changes, and these cross-national point estimates. 30 So the claim that Venezuela's poverty reduction is low, for the amount of growth that it has had, is simply false. It is based on an erroneous comparison. This can also be seen in Figure 1, which shows the annual rate of percent reduction in poverty, plotted against the annual rate of income growth, for the growth spells shown in Table 1. Venezuela has, as in table one, among the most annual poverty reduction for its annual per capita income growth for 2003-2007. Figure 1 also has isoelastic curves drawn in for the estimated income elasticities of poverty reduction for the various growth spells. Note that Venezuela's estimate, as calculated by Rodriguez, lies far below the vast majority of the data point. An isoelastic curve for –2 is even farther away. As shown in Table 1, the average income elasticity of poverty reduction is about –0.5, or about one-third of Venezuela's. By any logical comparison, therefore, there has been a sharp drop in poverty for the amount of growth that has occurred; Rodriguez's claim to the contrary is simply wrong.31
29 Another way to see how misleading his discussion in the Foreign Affairs article is: one can calculate from his
equation (1) the 2007 poverty rate that Venezuela would have needed in order to have an income elasticity of (negative) two, according to Rodriguez's logarithmic specification. The answer is 24.1 percent, which is not that far from the measured actual poverty rate of 27.5 percent. Again, the comparison of an elasticity of "one" with "two", using two different measures of elasticity, is enormously misleading.
30 There are several factors that are worth noting with regard to the difference between the cross-national estimates cited by Rodriguez and the data cited in Table 1 above. First, the cross-national studies are taking a large number of episodes of growth (or contraction) and not necessarily accounting for fixed effects. For example, the Bourguignon study takes 114 growth spells from 50 countries, with some growth spells as little as one year, all taken as separate observations. Second, the resulting point elasticity estimate (for a constant elasticity function) may not be comparable to the longer-distance change that we are looking at in Venezuela. Third, Rodriguez picks the higher estimates that were found even for these cross-national estimates. For example, he cites "a log-elasticity of poverty reduction at between -2.59 and -3.12" for Ravaillon and Chen (p.378). But the -2.59 estimate drops rapidly to -1.57 when these authors exclude Eastern Europe and Central Asia, and the full range of their estimates is even lower, dipping below 1 (absolute values). Also, the Bourguignon estimate that is most comparable to the question at hand here is -1.6.
31 It is worth noting that the importance of this whole comparison is also open to debate. If the government follows expansionary fiscal and monetary policies and that results in extraordinarily rapid growth, and this growth causes a sharp fall in the poverty rate, how much should poor people care if their gains were more a result of growth than of re-distribution?
Center for Economic and Policy Research, April 2008 • 10
Inequality and the Gini Coefficient The question here is whether inequality has increased or decreased during the Chávez years. Rodriguez claims that it has increased, as he writes in his Foreign Affairs article (Rodriguez 2008a): From the Foreign Affairs article:
[…] according to the Venezuelan Central Bank, inequality has actually increased during the Chávez administration, with the Gini coefficient (a measure of economic inequality, with zero indicating perfect equality and one indicating perfect inequality) increasing from 0.44 to 0.48 between 2000 and 2005[…].(p.53).
To which I responded:
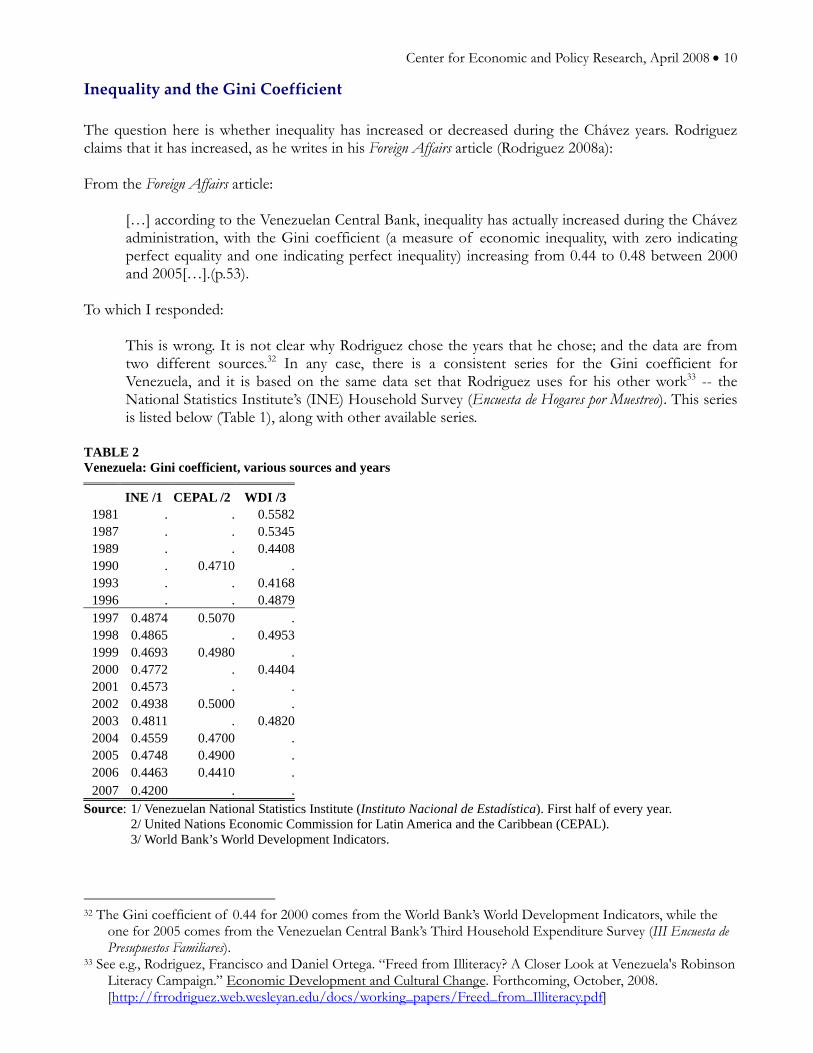
This is wrong. It is not clear why Rodriguez chose the years that he chose; and the data are from two different sources.32 In any case, there is a consistent series for the Gini coefficient for Venezuela, and it is based on the same data set that Rodriguez uses for his other work33 -- the National Statistics Institute’s (INE) Household Survey (Encuesta de Hogares por Muestreo). This series is listed below (Table 1), along with other available series.
TABLE 2 Venezuela: Gini coefficient, various sources and years
INE /1 CEPAL /2 WDI /3 1981 . . 0.55821987 . . 0.53451989 . . 0.44081990 . 0.4710 .1993 . . 0.41681996 . . 0.48791997 0.4874 0.5070 .1998 0.4865 . 0.49531999 0.4693 0.4980 .2000 0.4772 . 0.44042001 0.4573 . .2002 0.4938 0.5000 .2003 0.4811 . 0.48202004 0.4559 0.4700 .2005 0.4748 0.4900 .2006 0.4463 0.4410 .2007 0.4200 . .
Source: 1/ Venezuelan National Statistics Institute (Instituto Nacional de Estadística). First half of every year. 2/ United Nations Economic Commission for Latin America and the Caribbean (CEPAL). 3/ World Bank’s World Development Indicators.
32 The Gini coefficient of 0.44 for 2000 comes from the World Bank’s World Development Indicators, while the
one for 2005 comes from the Venezuelan Central Bank’s Third Household Expenditure Survey (III Encuesta de Presupuestos Familiares).
33 See e.g., Rodriguez, Francisco and Daniel Ortega. “Freed from Illiteracy? A Closer Look at Venezuela's Robinson Literacy Campaign.” Economic Development and Cultural Change. Forthcoming, October, 2008. [http://frrodriguez.web.wesleyan.edu/docs/working_papers/Freed_from_Illiteracy.pdf]

Issue Brief • April 2008 • 11
As can be seen, there is a sharp decline in inequality during the Chávez years, whether one measures from the beginning (1998, the year before Chávez took office) or from the time that the government got control over the oil industry (2003). As can be seen from the INE data in the first column, the Gini coefficient declined from .487 in 1998, or alternatively from .481 in 2003, to .42 in 2007 (Weisbrot, p.4)
Rodriguez (2008b) now responds:
The series cited by Weisbrot is highly problematic because it excludes from the calculation all households with reported income equals to zero, thus omitting the poorest households from the construction of an inequality index. This fact is illustrated in Figure 1, where I show the effect of excluding zero-income households from the calculation of income inequality.8 If they are excluded, the Gini index declines from .461 in the first semester of 1999 to .448 in the first semester of 2006, a decline of .012 points. When all households are counted, however, the relative comparison changes, and the index increases from .475 to .488 for the same period. Thus it appears that the decline in inequality in the series cited by Weisbrot up to 2006 is an artifact created by the exclusion of the poorest households from the sample. (p.7).
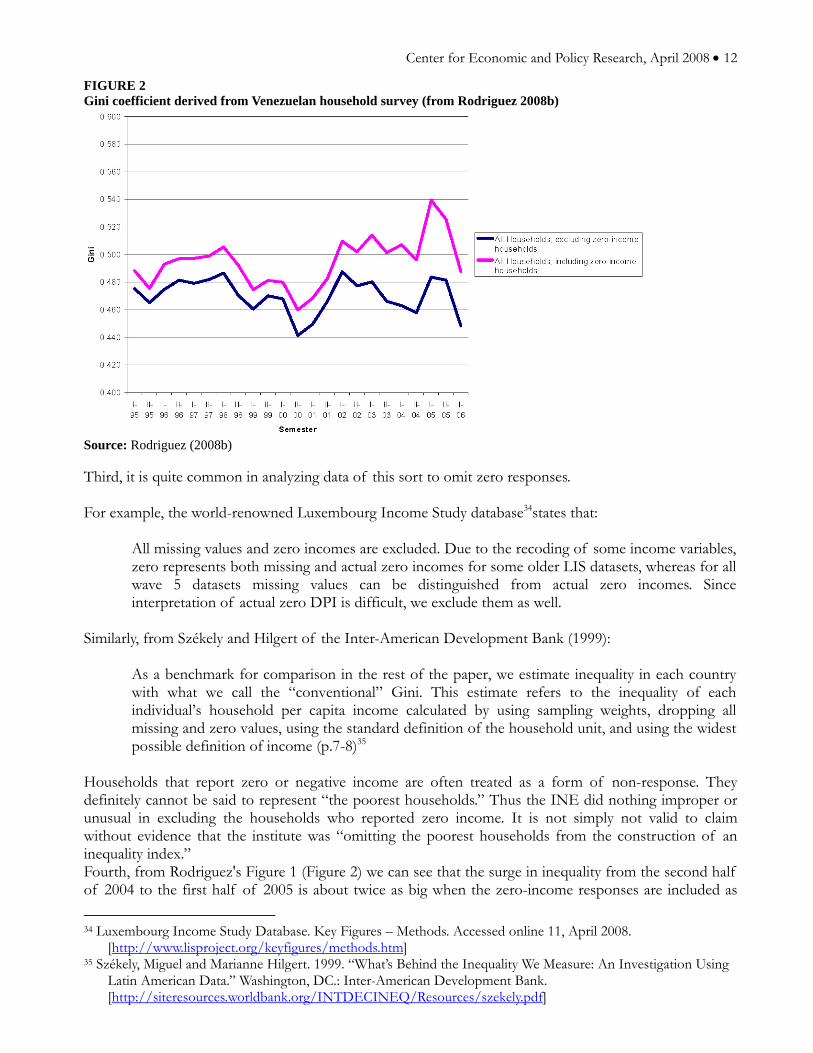
This is wrong, for several reasons. First, the numbers that Rodriguez chose in the Foreign Affairs article for 2000 and 2005 also appear to be based on excluding the "zero-income" households. This can be seen by comparing Figure 2 (from Rodriguez 2008, reproduced below) with the numbers in the Foreign Affairs article (quoted above). The Foreign Affairs numbers he cites are 0.44 and 0.48, for 2000 and 2005, respectively; these correspond to the numbers in the blue (bottom) graph below, labeled "All Households, excluding zero income households," not to the graph above it on the same chart, which includes the zero income households. So it does not make sense for Rodriguez to dismiss the INE data while basing his argument on data that also appear to exclude the households reporting zero income. It is worth emphasizing how misleading it is compare the years 2000 and 2005, as was done in the Foreign Affairs article. If we look at his graphs below (Figure 2), we can see that this is picking the very lowest point for the Gini (even choosing arbitrarily the second half of 2000, which is a big drop from the first half) and comparing to what is practically the highest point, for no apparent legitimate reason.
Center for Economic and Policy Research, April 2008 • 12
FIGURE 2 Gini coefficient derived from Venezuelan household survey (from Rodriguez 2008b)
Source: Rodriguez (2008b) Third, it is quite common in analyzing data of this sort to omit zero responses. For example, the world-renowned Luxembourg Income Study database34states that:
All missing values and zero incomes are excluded. Due to the recoding of some income variables, zero represents both missing and actual zero incomes for some older LIS datasets, whereas for all wave 5 datasets missing values can be distinguished from actual zero incomes. Since interpretation of actual zero DPI is difficult, we exclude them as well.
Similarly, from Székely and Hilgert of the Inter-American Development Bank (1999):
As a benchmark for comparison in the rest of the paper, we estimate inequality in each country with what we call the “conventional” Gini. This estimate refers to the inequality of each individual’s household per capita income calculated by using sampling weights, dropping all missing and zero values, using the standard definition of the household unit, and using the widest possible definition of income (p.7-8)35
Households that report zero or negative income are often treated as a form of non-response. They definitely cannot be said to represent “the poorest households.” Thus the INE did nothing improper or unusual in excluding the households who reported zero income. It is not simply not valid to claim without evidence that the institute was “omitting the poorest households from the construction of an inequality index.” Fourth, from Rodriguez's Figure 1 (Figure 2) we can see that the surge in inequality from the second half of 2004 to the first half of 2005 is about twice as big when the zero-income responses are included as 34 Luxembourg Income Study Database. Key Figures – Methods. Accessed online 11, April 2008.
[http://www.lisproject.org/keyfigures/methods.htm] 35 Székely, Miguel and Marianne Hilgert. 1999. “What’s Behind the Inequality We Measure: An Investigation Using
Latin American Data.” Washington, DC.: Inter-American Development Bank. [http://siteresources.worldbank.org/INTDECINEQ/Resources/szekely.pdf]

Issue Brief • April 2008 • 13
when they are excluded. This is a very strong indication that the zero income households are not "the poorest households." It strains the imagination to think that there was an explosion of extremely poor households at a time that the economy was booming and both the poverty and extreme poverty rates were plummeting.36 Fifth, Rodriguez's graph (here reproduced as Figure 2) excludes the most recent data. It thus includes the large and unexplained surge in inequality in 2004-2005 but not the big drop from 2006-2007. In sum, Rodriguez presents no logical or empirical argument that inequality has, as he alleged in the Foreign Affairs article, increased in Venezuela, nor to challenge the INE data, the most consistent data series available, which show a substantial drop in inequality during the Chávez years and during the current economic expansion.
The Poverty Rate Until this latest response (Rodriguez 2008b), Rodriguez has used the poverty numbers derived from the Household Survey, which are available from the National Institute for Statistics (INE). He now challenges these numbers, as a means of adjusting the income elasticity of poverty reduction described above. In other words, if he can show that the current poverty rate is higher than the INE's poverty rate – which Rodriguez has until now accepted -- then he can salvage his original criticism, based on confused and disparate definitions of elasticity, that Venezuela's poverty reduction is not so good for the amount of growth it has had. He claims to do this, once he adjusts the poverty rate:
Using the scarcity-adjusted poverty rates, the log-elasticity of poverty reduction decreases to -1.51 in the lower bound scenario and -1.02 in the upper bound scenario, numbers that are substantially smaller than cross-national estimates and close to the number presented in my article. (2008b, p.12)
Note that “close to the number presented in my article” refers to the income elasticity of poverty reduction discussed above, i.e. the "one percentage point in poverty for every percentage point in per capita GDP." He is now introducing a new argument that did not exist in the Foreign Affairs article, to lower the income elasticity of poverty reduction, so as to rescue the original argument that it is low by comparison to other countries. Of course any poverty rate, including that in the U.S., can be challenged on the basis of a number of criteria, and these might involve changes that have occurred over a given period of time. In this case, Rodriguez argues that the poverty rate should take into account that there have been shortages of some foods that have appeared in the last year and half. There are two problems with this approach. First, reports from Caracas indicate that the food shortages that Rodriguez mentioned have been greatly reduced. Since these shortages did not exist throughout most of the rapid expansion of the last five years, there is no reason to assume that they are permanent condition. This is especially true since the economy is running a large current account surplus and can import whatever it needs. Secondly, it does not make sense try to incorporate these shortages into the poverty rate, yet not attempt to adjust the poverty rate for non-cash benefits, including the increased access to health care or higher
36 See Table 3 in Weisbrot, Mark and Luis Sandoval. 2008. “Update: The Venezuelan Economy in the Chávez
Years.” Washington, DC: Center for Economic and Policy Research. [http://www.cepr.net/documents/publications/venezuela_update_2008_02.pdf]

Center for Economic and Policy Research, April 2008 • 14
education that many poor people have experienced. Both adjustments involve difficult measurement issues.37 The gains to poor households whose children can now attend college, and could not in the past, would have to be taken into account along with the losses of those who had to look for beans or eggs on the black market over the past year. It does not make sense to only look for a way to adjust the poverty rate upward, when there have been significant increases of non-cash income that are not included in the household survey on which the poverty rate is based.
Social Spending What is this discussion about? First, Rodriguez argues that we should be most concerned about the share of total public spending that is social spending. He also states that social spending should include only health, education, and housing. He then compares the government's average annual spending on health, education, and housing for the years 1991-1998 with 1999-2006, as a percent of total public spending: They both sum to 25.1 percent of total public spending. This is the basis for his statement in the Foreign Affairs article that: “Remarkably, given Chávez's rhetoric and reputation, official figures show no significant change in the priority given to social spending during his administration.” As it turns out, even by Rodriguez's definition and criteria, there is an increase in the share of public spending devoted to social spending (health, education, and housing) during the Chávez years. But there is a bigger problem with his argument. Why should we care only about the share of public spending that is social spending? He explains that it is an indicator of how much the Chávez government cares about poor people. In his response he argues:
To use an intuitive metaphor, if you want to know how much your rich uncle cared about you, you’d like to compare how much of his inheritance he left you with what he gave everyone else. If all of your siblings got a million dollars in his will, while you received the old man’s poodle to take care of, it would be hard to argue that you were his favorite nephew. (2008b, p.3)
I would offer another metaphor. Let's imagine that, in response to the current recession, the U.S. government were to initiate a $500 billion dollar public works program. Some of this might benefit poor people directly, by creating jobs in construction that they would get; or indirectly by stimulating economic growth; but most of it would benefit the non-poor. At the same time, imagine the government decides quadruple spending on unemployment compensation, food stamps, and temporary assistance to needy families (TANF), and provide college tuition grants at public universities for a million students from poor families. The public works program would still greatly exceed the total cost of the spending targeted towards the poor; therefore "social spending" defined as "pro-poor" spending as a share of public spending would decrease.
37 Rodriguez acknowledges these problems for the shortages (2008b, p. 12-13) and I have elsewhere explained the
measurement problems with incorporating the non-cash benefits to the poor in, Weisbrot, Mark, Luis Sandoval and David Rosnick .2006. “Poverty Rates in Venezuela: Getting the Numbers Right.” Washington, DC.: Center for Economic and Policy Research: [http://www.cepr.net/documents/venezuelan_poverty_rates_2006_05.pdf].
Issue Brief • April 2008 • 15
Should we argue that the government has short-changed the poor in this scenario? I am more concerned with what happens to poor people than with how much their government really “cares” about them, according to an arbitrary definition. Now for the numbers: Rodriguez argues that increases in social security spending should not be included under social spending, because these benefit mainly workers in the formal sector, who are mostly not poor, or at least on average are better off than informal sector workers. He also notes that only 13.1 percent of the bottom quintile received Social Security benefits in 199838, the last year for which these numbers are available. However, since the poverty rate for that year was 44-49 percent, we should also include at least the next quintile, which had 18 percent receiving benefits. In recent years, the government has expanded the program. From 1999-2006, the proportion of people receiving an old-age pension increased from 19.6 to 32 percent of the population over 60, according to data from the Venezuela Social Security Institute (IVSS).39 There have been increases in pensions (through various decrees) and the inclusion of individuals of retirement age that did not receive a pension because they did not contribute the legal minimum of 750 weeks to the IVSS.40 Another decree41 established the inclusion of poor women, 65 years old and older, into the pension system, receiving a pension equal to the minimum wage. Decree 5,31642, established that individuals of age 75 and older who never contributed to the IVSS would receive a pension equal to 60 percent of the minimum wage. This expansion of the social security system resulted in an increase in the number of individuals receiving a pension from 475,114 in 1999 to 1,208,300 in 2007.43 In the absence of better data, we cannot say exactly how much of the increase in Social Security spending in recent years has benefited the poor. But clearly some of it has, so it would not make sense to exclude it altogether. Reasonable people can disagree as to how much to include. As we will see, it does not matter very much in the overall calculations. Rodriguez's next complaint is that the PDVSA spending included as social spending is not all really "pro-poor" social spending. This complaint is valid, and useful because he presents new information; I am glad to incorporate that. As I noted in my previous article:
A complete breakdown of the PDVSA spending in the various areas (e.g., health, education,
38 He actually writes that “only 13% of individuals in the lowest quintile participate in the social security system,”
which could be interpreted as paying into it; I am here assuming he means receiving benefits because the data show that this interpretation is true.
39 Available at SISOV, under ‘Seguridad Social’: [http://www.sisov.mpd.gob.ve/indicadores/] 40 Decreto 4,269, Gaceta Oficial No. 38,377, February 10th, 2006.
For a description, e.g., [http://www.minci.gob.ve/reportajes/2/5708/gobierno_bolivariano_reconoce.html] 41 Decreto 5,370, Gaceta Oficial No. 38,694, May 30th, 2007.
See: [http://www.abn.info.ve/go_news5.php?articulo=93684&lee=18]. 42 Decreto 5,316, Gaceta Oficial No. 38,673, April 30th, 2007.
See: [http://www.abn.info.ve/go_news5.php?articulo=113062]. 43 According to data from the IVSS found in SISOV and the Labor Ministry’s 2007 Annual Report to the National
Assembly. Population estimates are from INE.

Center for Economic and Policy Research, April 2008 • 16
housing) is not available, so it is possible that some of the company's reported social spending may be on projects (for example transportation) where the categorization as social spending is debatable. But the increases in overall social spending are so huge that there is no doubt that social spending, however it is measured and whatever it is compared to, has increased massively in Venezuela during the Chávez years (Weisbrot, p.6)
Table 3 shows how much real social spending per person increases during the Chávez years, incorporating Rodriguez's breakdown of PDVSA's social spending. Assuming that Rodriguez's breakdown of PDVSA spending is correct, it would reduce my estimate of a 314 percent increase in real (inflation-adjusted) social spending per person to 218 percent. Even if we were to adopt Rodriguez's most restricted definition of social spending as spending only on health, education, and housing, that number falls to 192 per cent. This does not include any social security spending, which as noted above is not reasonable. The bottom line is that we are looking at a tripling of real social spending per capita, and probably more, even eliminating as much as Rodriguez can plausibly exclude. Rodriguez dismisses these increases because "the Venezuelan state is undeniably much richer today than it was nine years ago." 44 But this is a tripling of real social spending per capita during a period in which the GDP per capita grew by 5.7 percent– or, if we include only the boom years of this period, from 2003-2006 – GDP per capita by 35.7 percent. 45 This tripling of real social spending per person is therefore very large by almost any comparison. TABLE 3 Social spending Venezuela, 1998-2006
1998 2006 1998-2006
period (constant bolivares of 1997) (% change) Real Per Capita Social Spending (including Social Security) /1 9,739 30,999 218.3 Real Per Capita Spending on Health, Education, and Housing only (Rodriguez [2008b] definition) /1 6,768 19,809 192.7
Real per capita GDP 1,796,715 1,899,211 5.7 /2
(in % of GDP) (% change)
Social Spending (including Social Security) /1 8.2 15.9 93.1 Spending on Health, Education, and Housing only (Rodriguez [2008b] definition) /1 5.7 10.1 77.6 Sources: SISOV, BCV. Notes: 1/ Included both Central Government and direct spending by PDVSA. 2/ Real per capita GDP increased by 35.7 percent for 2003-2006—see text.
44 Even the increase in government revenue was largely a result of policy: the government greatly increased
royalties on foreign companies, and also had to get control over its (mostly nationally owned) oil resources, which was no easy task, as PDVSA was controlled by people who did not see the government has having a right to the oil revenue of a state-owned enterprise. To do this, it had to suffer a military coup and a devastating oil strike by its political opponents within PDVSA.
45 Most of the increase in social spending has been since 2003, when the economy was growing and the government had gotten control over the national oil company (PDVSA).
Issue Brief • April 2008 • 17
Another way to see this: under Rodriguez's most restricted definition, including only spending on health, education, and housing, social spending increases from 5.7 percent of GDP in 1998 to 10.2 percent of GDP in 2006.Including Social Security spending, it grows from 8.2 percent of GDP in 1998 to 15.9 percent of GDP in 2006.46 These numbers are also shown in Table 3 above. Most economists, if not all, would consider both of these sets of figures as showing very substantial increases in social spending. And they do not include 2007, which is most likely another large jump. Finally, it is worth noting that from 1998 –2006, the share of public spending devoted to health, education, and housing rose from 24.1 percent to 27.5 percent. So, even by Rodriguez's definition of social spending, and accepting his argument that all that matters is the share of public spending that is social spending, there is an increase during the Chávez years.47 But this is a minor point. The main point is that the poor have benefited from the massive increases in social spending per person during the Chávez years, and have no reason to be concerned if other spending has increased almost as fast.
Literacy The question here is how many people learned to read in the government's Mision Robinson (national literacy) program. In my article I responded to the following statement by Rodriguez in Foreign Affairs:
In contrast to the government's claim [of 1.5 million people taught to read and write], we found that there were more than one million illiterate Venezuelans by the end of 2005, barely down from the 1.1 million illiterate persons recorded in the first half of 2003, before the start of the Robinson program. Even this small reduction, moreover, is accounted for by demographic trends rather than the program itself. In a battery of statistical tests, we found little evidence that the program had had any statistically distinguishable effect on Venezuelan illiteracy. (p.55).
There are two questions here: can the Household Survey sufficiently capture changes in literacy, such that the effect of the program can be measured by looking at this data?
The second question, which is much less important, is whether Ortega and Rodriguez's statistical tests really did show “little evidence that the program had any statistically distinguishable effect on Venezuelan literacy.”
To take the minor question first: in a detailed statistical analysis of the data, we showed that there was in fact a statistically distinguishable effect of the program on Venezuelan literacy. Readers are encouraged to read both papers and decide for themselves on the basis of the regression results.48
46 This also includes PDVSA's spending that Rodriguez accepts as social spending but is not necessarily health,
education, and housing. 47 Rodriguez's calculations do not show this increase because he is taking averages over the two periods; this might
make sense in some circumstances but not when the government vastly increased its spending after it got control over oil revenues (following a devastating opposition strike) in 2003.
48 See: Ortega, Daniel, and Francisco Rodríguez. 2008. “Freed from Illiteracy? A Closer Look at Venezuela’s Robinson Campaign,” Economic Development and Cultural Change, October 2008 (forthcoming) [http://frrodriguez.web.wesleyan.edu/docs/working_papers/Freed_from_Illiteracy.pdf], and Weisbrot, Mark and David Rosnick. 2008. “’Illiteracy’ Revisited: What Ortega and Rodríguez Read in the Household Survey,” paper presented at the conference “The Popular Sectors and the State in Chávez’s Venezuela,” Yale University, March 6-7, 2008: [http://www.yale.edu/polisci/info/conferences/Venezuela/papers/IlliteracyRevisited.pdf]

Center for Economic and Policy Research, April 2008 • 18
Here Rodriguez seriously misrepresents what I wrote in response to his Foreign Affairs article. He states that “Mark Weisbrot (2008)49 has claimed that there has been a massive reduction in illiteracy” and that “It is only by systematically ignoring the results of his own empirical analysis that Weisbrot is able to keep on claiming that the Venezuelan government taught upwards of one million persons how to read and write.”
In fact, I wrote something quite different in the article that he cited:
In sum, it may well be that the government exaggerated the results of the literacy campaign, but neither the Household Survey itself, nor Ortega and Rodriguez's statistical analysis of it, provides much evidence regarding this question. (Weisbrot, p.7)
So, it does not contradict my argument to state, as Rodriguez does, that our regressions show a small but significant effect of the Robinson program. The only importance of these regressions was to show that the regressions cited by Rodriguez which found no significant effect whatsoever - and which he refers to in the Foreign Affairs article - were not robust. The more important point is that the Household Survey itself, which was not designed to be a comprehensive measure of literacy, cannot shed much light on how many people improved their reading skills under the Robinson program. In Rodriguez's response, he uses a numerical example to argue that a large-scale literacy program would necessarily have had a large impact on the measured literacy rate in the Household Survey. This, however, is not necessarily the case, as explained below. The survey simply asks whoever is present at the time of the interview about another family member: “Does this family member know how to read or write?” A respondent may answer “yes” to the question, knowing that her brother or father can write his name. At the end of a literacy program, however, the person may have considerably improved reading skills, but would still show up in the survey as the same response. So this survey is much too crude to measure the results of a program such as Misión Robinson; it was never designed to measure literacy or reading skills. To estimate the impact of such a program, one would need some before-and-after test for the participants. It would be possible to see some sign of the program's impact in the household survey, but the effect that is visible in this crude survey could be a very small fraction of the people who acquired or improved their reading skills. A semi-literate worker who could not read a newspaper article before the program but can do so afterwards has a significant improvement in skills, but may show up as a “yes” in the Households Survey in both instances. It is possible that a very large majority of Robinson graduates were functionally but not fully illiterate to start. At first blush, it may seem strange that a literacy program could wind up teaching Venezuelans reported as literate and largely miss the million who report as illiterate. Yet, functional illiteracy in Venezuela is surely more widespread than illiteracy reported in the household survey. According to a 1994 survey, more than 20 percent of adults in the United States failed to meet minimal literacy standards, as defined below. According to the survey report:
The easiest task in level 1… directs respondents to look at a medicine label to determine
49 Weisbrot, Mark. 2008. “An Empty Research Agenda: The Creation of Myths About Contemporary Venezuela.”
Washington, DC.: Center for Economic and Policy Research. [http://www.cepr.net/documents/publications/venezuela_research_2008_03.pdf]

Issue Brief • April 2008 • 19
the “maximum number of days you should take this medicine”. The label contains only one reference to number of days and this information is located under the heading “DOSAGE”. The reader must go to this part of the label and locate the phrase “not longer than 7 days.”50
The adult literacy rate in the United States is reported as 99 percent, and yet 20 percent of those same adults cannot read the simplest instructions off a medicine label. In Venezuela, a self-reported number of a million illiterate adults should imply millions more who are functionally illiterate. Even if the 2001 rate that included functional illiteracy in Venezuela was 25 to 30 percent of adults, then there would exist a pool of 3.9-4.6 million in need of training. If Robinson drew from this pool proportionately among reported and functional (non-reported) illiterates, then no more than 400,000 of a program that included 1.4 million participants would show up in the household survey. TABLE 4 Proportionate Participation by Literacy Level
Total Illiteracy Rate51
Participation rate of Reported Illiterates52
Participation rate of Functionally
Illiterate53
Number of Participants
showing in Survey
Increase in Survey Literacy Rate
25% 36% 36% 393,120 2.5% 30 30 30 327,600 2.1 35 26 26 280,800 1.8
Source: Author’s calculations This is shown in Table 4. For example, the middle line assumes a total illiteracy rate of 30 percent (1.1 million people reported in the Household Survey plus 3.5 million functionally illiterate). Assume that 30 percent of each group participates in the program. This gives us 1.4 million participants, but only 327,600 participants would show up in the Household survey as having learned to read. This could be even less if a higher proportion are drawn from the functionally illiterate population. In fact, participants in the Robinson program were not selected randomly. Participation was entirely voluntary. With illiteracy concentrated in the highest age groups, many illiterate might have had little motive to learn to read. On the other hand, younger semi-literate adults might have a much greater incentive as well as have an easier time completing the program than would a fully illiterate individual. If Robinson attracted disproportionately the functionally illiterate, far fewer would appear in the household survey as illiterate before the program and literate after. TABLE 5 Disproportionate Participation by Functionally Illiterate Total Illiteracy
Rate54 Participation rate of
Reported Illiterates55
Participation rate of Functionally
Illiterate56
Number of Participants
showing in Survey
Increase in Survey Literacy Rate
25% 21% 42% 228,664 1.5% 30 17 34 185,504 1.2 35 14 29 156,050 1.0
Source: Author’s calculations
50 Kirsch, Irwin. 2001. “ The International Adult Literacy Survey (IALS): Understanding What Was Measured.”
Princeton. NJ: Educational Testing Service. 51 This includes both the 1.1 reported illiterate and the functionally illiterate 52 These are the 1.1 million people reported as illiterate in the Household Survey 53 These are people who are reported as literate in the Household Survey but are functionally illiterate. 54 This includes both the 1.1 reported illiterate and the functionally illiterate 55 These are the 1.1 million people reported as illiterate in the Household Survey 56 These are people who are reported as literate in the Household Survey but are functionally illiterate.

Center for Economic and Policy Research, April 2008 • 20
Table 5 assumes that participation rates for functionally illiterate were twice the rate of the reported illiterates. In this case, the number of participants that would show up in the survey could be as low as 156,000, which would yield only a 1.0 percent increase in the survey literacy rate. For the sake of discussion, these calculations assume that the government did not exaggerate participation in the literacy program. Suppose instead that Robinson was still a very large program, but reached only 700,000 adults; or alternatively that only half of the 1.4 million graduates actually learned to read. In such a case, we must halve the estimated effects on measured literacy in Tables 1 and 2. In other words, the household survey might show a literacy gain of less than 1 percent of the adult population and yet still be consistent with a successful large-scale literacy program. Again, to emphasize and avoid future misquotation: we are not arguing that the government's claim that 1.4 million people learned to read is accurate. We are simply showing that the Household Survey, in the absence of further data, cannot shed much light on how many people participated in the program and what they learned. Other Issues There were a number of other exaggerations in the Foreign Affairs article that I pointed out, and it is worth noting that Rodriguez does not respond to some of the important ones. For example, I noted that:
His comparison with “populist macroeconomics” of past Latin American governments, whose policies led to “the accumulation of severe fiscal and balance-of-payments problems, galloping inflation, and plummeting real wages” clearly does not apply to contemporary Venezuela, which has no serious fiscal problems, enormous foreign exchange reserves, a large balance of payments surplus, and rising real wages. In fact, the Venezuelan economy's imbalances – again, not to underestimate the long-run importance of them – do not even constitute the kind of imminent threat to the economy that the U.S. housing bubble presented to our economy in 2003-2006, where one could say with confidence that the bubble would eventually collapse and cause a recession, and that the longer it took to burst, the worse the recession would be. 57 (Weisbrot, p.12)
I also took issue with Rodriguez's claim that Venezuela “is now threatening to erase the nation's current account surplus,” noting that the current account surplus is still very large, at more than 8 percent of GDP. (For comparison, imagine the U.S. with an annual current account surplus of more than $1.1 trillion instead of its present deficit of $739 billion.) These exaggerations are important because they indicate that the author is trying to paint a picture of the Venezuelan economy that is very much at odds with reality. In my response, I discussed the main imbalances in the Venezuelan economy, but argued that there was no need to paint an exaggerated picture. This was also the case in the following instance of selected use of statistics, below, that I criticized:
[. . .]official statistics show no signs of a substantial improvement in the well-being of ordinary Venezuelans, and in many cases there have been worrying deteriorations. The percentage of underweight babies, for example, increased from 8.4 percent to 9.1 percent between 1999 and 2006. During the same period, the percentage of households without access to running water
57 See, e.g., Baker, Dean and David Rosnick. 2005. “Will a Bursting Bubble Trouble Bernanke? The Evidence for a
Housing Bubble.” Washington, D.C.: Center for Economic and Policy Research. [http://www.cepr.net/documents/publications/housing_bubble_2005_11.pdf

Issue Brief • April 2008 • 21
rose from 7.2 percent to 9.4 percent, and the percentage of families living in dwellings with earthen floors multiplied almost threefold, from 2.5 percent to 6.8 percent. (Rodriguez 2008a, p.53)
In my article I showed that these data were counter to other trends, and appeared anomalous.58 Once again, Rodriguez misrepresents what I wrote. He writes, “Weisbrot claims that the increase in the percent of low birthweight babies is due to the decline in the percentage of children monitored for low birthweight.” In fact I wrote:
The rise in the rate of low-birth weight babies is thus an exception to these trends [reductions in measures of infant mortality]. Most of it takes place from 2002 to 2003, when the economy was devastated. Why did it not recover, like the other indicators? It is possible that this is a measurement problem; as Table 3 shows, the percent of children monitored for birth weight dropped sharply from 1999-2005, from 28.5 to 21.7 percent of births; this is not a random change in the sample, so measurement could have been affected. Given what happened to infant mortality, it is difficult to believe that the increase in low birth weight babies is really an indication of deteriorating prenatal or postnatal care. (p.8)
In one of the most bizarre accusations in Rodriquez's response (2008b), he accuses me of presenting an “incredible conspiracy theory of the 2001 Venezuelan balance of payments crisis according to which the private sector withdrew funds from the domestic system during more than a year in order to provoke a political crisis.” Below I reproduce the segment in question; as can be seen there is no such conspiracy theory. The reader can compare this analysis of events with that of Rodriguez, and see which makes more sense. The Origins of the 2002‐03 Recession, and Political and Economic Instability [from Weisbrot (2008)]
At that point, [February 2002] the economy had entered into a recession as a result of an unsustainable fiscal expansion carried out during Chávez's first three years in office . . .as we proceeded to meet with officials, the economic crisis was spilling over into the political arena, with the opposition calling for street demonstrations in response to Chávez's declining poll numbers. Soon, workers at the state oil company, PDVSA, joined the protests. (Rodriguez 2008a, p.58-60)
This is an unusual interpretation of events which probably few economists would agree with. Very simply, Rodriguez has reversed the causality of events. The opposition was determined from even before the beginning of 2002 to topple the government, and they controlled the most important asset of the country, the state-owned oil company, which provided about 50 percent of the government's revenue and 80 percent of Venezuela's foreign exchange earnings.59
58 Weisbrot, Mark. 2008. An Empty Research Agenda: The Creation of Myths About Contemporary Venezuela.”
Washington, DC: Center for Economic and Policy Research. ] p 7-9. [http://www.cepr.net/documents/publications/venezuela_research_2008_03.pdf]
59 For this reason it does not make sense to hold the Chávez government responsible for the economy during its first four years, since it did not control the state oil company or its revenues. Without control over these resources – and indeed when they are controlled by hostile forces seeking to use or even sabotage them in order to destabilize and/or overthrow the government – as happened in 2002 and 2003, it is difficult if not

Center for Economic and Policy Research, April 2008 • 22
FIGURE 3 Venezuela: Real GDP (seasonally-adjusted)
6
7
8
9
10
11
12
13
14
15
1998
Q1
1998
Q3
1999
Q1
1999
Q3
2000
Q1
2000
Q3
2001
Q1
2001
Q3
2002
Q1
2002
Q3
2003
Q1
2003
Q3
2004
Q1
2004
Q3
2005
Q1
2005
Q3
2006
Q1
2006
Q3
2007
Q1
2007
Q3
Trill
ions
of 1
997
Bol
ivar
es
1998Q4: -Chavez wins elections (Dec. 6)-Venezuelan oil price lowest in 22 years (Dec.)
1999Q1: -Chavez takes office (Feb. 2)
2002Q2: -Fedecamaras calls for another general strike (Apr. 9)-April coup d'etat temporarilyoverthrows constitutionalgovernment (Apr. 11)
2001Q4: -Fedecamaras (largest business association) calls for general strike (Dec. 9)
2002Q4: -Oil strike cripples the economy (Dec.)
2003Q1: -Oil strike ends (Feb. 3)
2003Q2: -Opposition agrees to seek Chavez's removal through electoral (recall) referendum (May)
2004Q3: -Chavez wins recall referendum (Aug.)
Source: Banco Central de Venezuela (BCV) and author’s analysis. Figure 3, above, shows this relationship between the opposition's efforts and the economy. Chávez's first year (1999), which began with the price of Venezuelan oil at its lowest point in 22 years, was marked by negative growth. But the economy began to grow in the first quarter of 2000 and continued through the third quarter of 2001. The next few months were a period of the most extreme political instability: in December of 2001 the Venezuelan Chamber of Commerce (FEDECAMARAS) organized a general business strike against the government. This political instability, combined with much capital flight, continued through April 2002, when the elected government was overthrown in a military coup. The constitutional government was restored within 48 hours, but stability did not return, as the opposition continued to seek to topple the government by extra-legal means. Growth remained negative through the summer and fall of 2002, and then the economy was hit with the opposition-led oil strike of December 2002-February 2003.
impossible for the government to achieve much of anything in the way of economic or social improvements. In fact, as the oil strike of December 2002-February 2003 showed, it was impossible to even keep the economy afloat while the opposition controlled PDVSA. As an analogy, since the United States has no comparable sector of such importance to the economy or government revenue, imagine that the U.S. Federal Reserve were controlled by a board of governors that was determined to use its control over monetary policy and interest rates to destabilize the economy and government. Such a board could wreak havoc on the economy simply by raising the Federal Funds rate to the level where it would induce a recession. In such a situation, it would not be fair to hold the executive branch or Congress responsible for the resultant economic destruction.
Issue Brief • April 2008 • 23
This plunged the economy into a severe recession during which Venezuela lost 24 percent of its GDP. The economy began to recover in the second quarter of 2003 and has grown very rapidly and continuously since then. All of this is shown in Figure 3. Conclusion As can be seen from the above discussion, the attempts by Rodriguez (2008b) to salvage the main points of his Foreign Affairs article are unsuccessful on every point. His claims that inequality increased in Venezuela during the Chávez years are contradicted by the best available data. His attack on the data is empirically and methodologically flawed. His claim that Venezuela's reduction of the poverty rate by one-half during the last four years compares unfavorably with other countries' experience is clearly wrong, as can be seen plainly from comparisons with countries and regions worldwide. His argument that the Chávez government did not show any change of priorities with regard to spending on the poor is both wrong – according to the numbers – and misleading. His attempt to show that Household Survey data can be used to measure the scale of a national literacy program is ineffective. Finally, a number of his attacks on the criticism of his arguments are based on misquoting those criticisms, as well as imputing his own errors to others.

Center for Economic and Policy Research, April 2008 • 24
References Baker, Dean and David Rosnick. 2005. “Will a Bursting Bubble Trouble Bernanke? The
Evidence for a Housing Bubble.” Washington, D.C.: Center for Economic and Policy Research. Available online at: [http://www.cepr.net/documents/publications/housing_bubble_2005_11.pdf]
Carter Center, The. “Report on an Analysis of the Representativeness of the Second Audit Sample, and the Correlation between Petition Signers and the Yes Vote in the Aug. 15, 2004 Presidential Recall Referendum in Venezuela.” Atlanta, GA: The Carter Center. Accessed online on April 15, 2008. [http://www.cartercenter.org/documents/nondatabase/report091604.pdf]
Castañeda, Jorge. “Attempted Theft.”. Newsweek Online. December 7, 2007. Accessed
online on April 15, 2008. [http://www.newsweek.com/id/74230] “Conned in Caracas.” Wall Street Journal. September 9, 2004. Accessed online on April 15,
2008. [http://www.opinionjournal.com/editorial/feature.html?id=110005586] Decreto 4,269, Gaceta Oficial No. 38,377, February 10th, 2006. Available online at:
[http://www.minci.gob.ve/reportajes/2/5708/gobierno_bolivariano_reconoce.html] Decreto 5,370, Gaceta Oficial No. 38,694, May 30th, 2007. Available online at:
[http://www.abn.info.ve/go_news5.php?articulo=93684&lee=18].
Decreto 5,316, Gaceta Oficial No. 38,673, April 30th, 2007. Available online at: [http://www.abn.info.ve/go_news5.php?articulo=113062].
Hausmann, Ricardo, and Roberto Rigobon. 2004. “In Search of the Black Swan: Analysis of
the Statistical Evidence of Electoral Fraud in Venezuela.” Boston, MA: Working Paper, Harvard University. Accessed online on April 15, 2008. [http://ksghome.harvard.edu/~rhausma/new/blackswan03.pdf]
Kirsch, Irwin. 2001. “ The International Adult Literacy Survey (IALS): Understanding What
Was Measured.” Princeton. NJ: Educational Testing Service. Luxembourg Income Study Database. Key Figures – Methods. Accessed online April 11,
2008. [http://www.lisproject.org/keyfigures/methods.htm] Rodriguez, Francisco. 2008a. “An Empty Revolution: The Unfulfilled Promises of Hugo
Chávez.” Foreign Affairs. 87.2: 49-62. Rodriguez, Francisco. 2008b. “How Not to Defend the Revolution: Mark Weisbrot and the
Misinterpretation of Venezuelan Evidence.” Middletown, CT.: Wesleyan Economic Working Papers, Wesleyan University. [http://frrodriguez.web.wesleyan.edu/docs/working_papers/How_Not_to_Defend.pdf]
Rodriguez, Francisco and Daniel Ortega. “Freed from Illiteracy? A Closer Look at
Venezuela's Robinson Literacy Campaign.” Economic Development and Cultural Change. Forthcoming, October, 2008. Available online at: [http://frrodriguez.web.wesleyan.edu/docs/working_papers/Freed_from_Illiteracy.pdf]

Issue Brief • April 2008 • 25
Rosnick, David. 2004. “Polling and the Ballot: The Venezuelan Referendum.” Washington, DC. : CEPR. Available online at: [http://www.cepr.net/documents/publications/venezuela_2004_08.pdf]
SISOV, under ‘Seguridad Social’. Available online at:
[http://www.sisov.mpd.gob.ve/indicadores/]. Székely, Miguel and Marianne Hilgert. 1999. “What’s Behind the Inequality We Measure: An
Investigation Using Latin American Data.” Washington, DC.: Inter-American Development Bank. Available online at: [http://siteresources.worldbank.org/INTDECINEQ/Resources/szekely.pdf]
Weisbrot, Mark. Letter. Foreign Affairs 85.4 (2006). Available online at:
[ http://www.foreignaffairs.org/20060701faletter85419/mark-weisbrot/left-hook.html] Weisbrot, Mark, David Rosnick and Todd Tucker. 2004. “Black Swans, Conspiracy
Theories, and the Quixotic Search for Fraud: A Look at Hausmann and Rigobon’s Analysis of Venezuela’s Referendum Vote.” Washington, DC: CEPR. Available online at: [http://www.cepr.net/documents/publications/venezuela_2004_09.pdf]
Weisbrot, Mark, Luis Sandoval and David Rosnick. 2006. “Poverty Rates in Venezuela:
Getting the Numbers Right,” Washington, D.C.: CEPR. Available online at: [http://www.cepr.net/documents/venezuelan_poverty_rates_2006_05.pdf].
Weisbrot, Mark and Luis Sandoval. 2008. “Update: The Venezuelan Economy in the Chávez
Years.” Washington, DC: CEPR. Available online at: [http://www.cepr.net/documents/publications/venezuela_update_2008_02.pdf]
Weisbrot, Mark and David Rosnick. 2008. “’Illiteracy’ Revisited: What Ortega and Rodríguez Read in the Household Survey,” paper presented at the conference “The Popular Sectors and the State in Chávez’s Venezuela,” Yale University, March 6-7, 2008: [http://www.yale.edu/polisci/info/conferences/Venezuela/papers/IlliteracyRevisited.pdf]
Weisbrot, Mark. 2008. “An Empty Research Agenda: The Creation of Myths About Contemporary Venezuela.” Washington, DC.: CEPR. Available online at: [http://www.cepr.net/documents/publications/venezuela_research_2008_03.pdf]
World Bank. World Development Indicators online. Washington, DC: World Bank Group.
Available online at: [http://go.worldbank.org/3JU2HA60D0]