how much is enough? landscape-scale conservation for the
TRANSCRIPT

B I O L O G I C A L C O N S E R V A T I O N 1 3 0 ( 2 0 0 6 ) 1 1 8 – 1 3 3
. sc iencedi rec t .com
ava i lab le at wwwjournal homepage: www.elsevier .com/ locate /b iocon
How much is enough? Landscape-scale conservation forthe Florida panther
Randy Kautza,*, Robert Kawulaa, Thomas Hoctorb, Jane Comiskeyc, Deborah Jansend,Dawn Jenningse, John Kasbohmf, Frank Mazzottig, Roy McBrideh, Larry Richardsoni,Karen Rootj
aFlorida Fish and Wildlife Conservation Commission, 620 South Meridian Street, Tallahassee, FL 32399-1600, USAbUniversity of Florida, Department of Landscape Architecture, P.O. Box 115704, Gainesville, FL 32611-5704, USAcThe Institute for Environmental Modeling, Department of Ecology and Evolutionary Biology, University of Tennessee, Knoxville, TN 37996,
USAdBig Cypress National Preserve, 33100 Tamiami Trail East, Ochopee, FL 34141, USAeUS Fish and Wildlife Service, 6620 South Point Drive South, Suite 310, Jacksonville, FL 32216, USAfUS Fish and Wildlife Service, 1502 S.E. Kings Bay Drive, Crystal River, FL 34429, USAgFort Lauderdale Research and Education Center, Department of Wildlife Ecology and Conservation, 3205 College Avenue, Davie, FL 33314,
USAhBox 178, Ochopee, FL 34141, USAiUS Fish and Wildlife Service, Florida Panther National Wildlife Refuge, 3860 Tollgate Boulevard, Suite 300, Naples, FL 34114, USAjDepartment of Biology, Bowling Green State University, Bowling Green, OH 43403-0212, USA
A R T I C L E I N F O
Article history:
Received 10 February 2005
Received in revised form
29 November 2005
Accepted 14 December 2005
Available online 3 February 2006
Keywords:
Florida panther
Puma concolor coryi
Conservation planning
Habitat
Corridors
0006-3207/$ - see front matter � 2005 Elsevidoi:10.1016/j.biocon.2005.12.007
* Corresponding author: Present address: BreTel.: +1 850 5624849; fax: +1 850 5624828.
E-mail addresses: [email protected], r
A B S T R A C T
The Florida panther (Puma concolor coryi) is an endangered, wide-ranging predator whose
habitat needs conflict with a rapidly growing human population. Our goal was to identify
specific regions of the south Florida landscape that are of high conservation value to sup-
port a self-sustaining panther population. We used compositional and Euclidean distance
analyses to determine relative importance of various land cover types as panther habitat
and to investigate the role of forest patch size in habitat selection. A model of landscape
components important to Florida panther habitat conservation was created. The model
was used in combination with radio telemetry records, home range overlaps, land use/land
cover data, and satellite imagery to delineate Primary and Secondary zones that would
comprise a landscape mosaic of cover types sufficient to support a self-sustaining popula-
tion. The Primary Zone generally supports the present population and is of highest conser-
vation value, while the Secondary Zone is of lesser value but could accommodate
expansion of the population given sufficient habitat restoration. Least-cost path models
identified important landscape linkages, and model results were used to delineate a Dis-
persal Zone to accommodate future panther dispersal outside of south Florida. We deter-
mined that the three habitat zones could support 80–94 panthers, a population likely to
persist and remain stable for 100 years, but that would be subject to continued genetic
problems. The Primary, Dispersal and Secondary zones comprise essential components
of a landscape-scale conservation plan for the protection of a viable Florida panther popu-
lation in south Florida. Assessments of potential impacts of developments should strive to
er Ltd. All rights reserved.
edlove, Dennis and Associates, Inc., 2625 Neuchatel Drive, Tallahassee, FL 32303-2249, USA.
[email protected] (R. Kautz).

B I O L O G I C A L C O N S E R V A T I O N 1 3 0 ( 2 0 0 6 ) 1 1 8 – 1 3 3 119
achieve no net loss of landscape function or carrying capacity for panthers within the Pri-
mary Zone or throughout the present range of the Florida panther.
� 2005 Elsevier Ltd. All rights reserved.
1. Introduction
The Florida panther (Puma concolor coryi) is a wide-ranging
predator whose current breeding population is restricted to
an area of approximately 10,000 km2 in southern Florida,
USA, south of Lake Okeechobee. The habitat of the Florida
panther is an extensive landscape comprised of a mix of nat-
ural, semi-natural, and agricultural land uses (Maehr and Cox,
1995; Comiskey et al., 2002). Due to past persecution and ongo-
ing habitat loss, the Florida panther is listed as an endangered
species by the State of Florida and the US Fish and Wildlife
Service (Sullivan, 2004). The Florida panther population was
previously estimated at 30–50 individuals (Maehr, 1992), but
recent counts place the population at 80–100 adults and
sub-adults (Land and Lacy, 2000; McBride, 2001, 2002, 2003).
Habitat loss remains the greatest threat to the Florida pan-
ther. Large areas of natural habitat have been converted to
agricultural and urban uses to support the rapidly growing
human population in south Florida (Kautz, 1994) and state-
wide (Kautz, 1998). Further loss of natural areas may be ex-
pected as the population of the 5-county south Florida
region supporting most of the current panther population
(i.e., Lee, Hendry, Collier, Miami-Dade, Broward) is projected
to increase 55% between 2000 and 2030 (BEBR, 2001). Agencies
involved in reviewing proposed development projects in areas
inhabited by Florida panthers are keenly aware that contin-
ued development will result in the loss of additional habitat,
and they recognize that the consequences of permitting deci-
sions may further compromise panther population viability.
However, attempts to protect panther habitats through regu-
latory programs often are confounded by the wide-ranging
nature of the species, low population density that makes it
difficult to target specific locations for protection, the large
landscapes needed to support a viable population, private
landowner concerns, and limitations inherent in laws and
rules that regulate the incidental take of endangered species.
Although land acquisition programs have brought almost
200,000 ha of panther habitat into public ownership over the
past decade, previous spatially-explicit conservation plans
(Logan et al., 1993; Cox et al., 1994) indicate that much more
habitat needs to be protected to ensure panther survival.
The range-wide recovery objective for the Florida panther
is to achieve 3 viable, self-sustaining populations within the
historic range of the animal. The first priority of the recovery
plan is to secure the population in south Florida (USFWS,
1995), which is the only existing Florida panther population.
Our goal was to identify those portions of the south Florida
landscape needed to ensure the long-term persistence of
the Florida panther in south Florida. To accomplish this, we
conducted a series of geographic information system (GIS)
analyses. First, we completed several analyses of land cover
types and forest patch sizes associated with telemetry loca-
tions and panther home ranges, and we used the results to
develop a new spatially explicit model of habitat components
important to Florida panther habitat conservation needs.
Next, using the spatial model, Florida panther telemetry and
home ranges, land use/land cover data, and satellite imagery
as guides, we identified areas of suitable habitat that have
been consistently occupied by panthers in the past 20 years
(Primary Zone), adjacent areas that would be most likely to
be occupied by an expanding panther population (Secondary
Zone), and areas that would best facilitate dispersal and pop-
ulation expansion north of the Caloosahatchee River (Dis-
persal Zone). Finally, we used the results of previous
population viability analyses to evaluate the potential for
the landscape we delineated to support a population large en-
ough to remain viable.
1.1. Study area
The entirety of our study area covered 60,256 km2 of central
and south Florida, and comprised all or portions of 25 coun-
ties (Fig. 1). This large region was selected as the study area
because it contained all telemetry location records for radio-
collared panthers through 30 March 2001 (Fig. 2), and because
habitats north of Lake Okeechobee were likely destinations
for dispersing panthers. However, most of our analyses fo-
cused on the landscape south of Lake Okeechobee and the
Caloosahatchee River, the region where reproducing panthers
were found and where 99% of telemetry records have been
collected (Fig. 2).
Rapidly growing urban areas characterized both coasts of
the study area. Dominant land uses of interior regions in-
cluded pastureland, citrus production, croplands, and scat-
tered smaller urban and residential lands. Throughout
much of the study area, natural areas consisting of slash pine
(Pinus elliottii) flatwoods, hardwood hammocks, dry prairies,
and forested and herbaceous wetlands were interspersed
among lands that have been converted to more intensive hu-
man uses. Public land south of Lake Okeechobee contained
approximately 73% of the area known to support the Florida
panther. Big Cypress National Preserve (2950 km2) in the
southwestern portion of the region south of Lake Okeechobee
consisted of a vast system of forested and herbaceous wet-
lands interspersed with smaller upland islands dominated
by slash pine and hardwood forests. The Everglades of south-
eastern Florida consisted predominantly of herbaceous fresh-
water wetlands interspersed with numerous small tree
islands.
2. Methods
2.1. Land use and land cover data
We created a statewide land cover data set by merging
land use/land cover data available from Florida’s 5 water

Fig. 1 – South Florida study area for modeling and mapping habitats important to the conservation of the Florida panther.
While the current reproducing population is found south of the Caloosahatchee River, the entire study area extends through
south central Florida to include all records of radio-collared panthers.
120 B I O L O G I C A L C O N S E R V A T I O N 1 3 0 ( 2 0 0 6 ) 1 1 8 – 1 3 3
management districts (WMD). Each WMD data set was in vec-
tor format and derived from 1995 aerial photography, and
each had been subjected to ground-truthing and accuracy
assessment prior to release to the public. The land use/land
cover data had minimum mapping units (MMU) of 2 ha for
all classes except wetlands. Wetlands were mapped with a
0.2 ha MMU in all areas except south Florida where the wet-
lands MMU was 0.8 ha. We converted the vector data sets to
30 m pixel grids, and then we merged the 5 grids into a single
statewide grid. The combined statewide data set contained
298 Level III/IV land use/land cover classes (Anderson et al.,
1976; as modified for Florida by Kuyper et al., 1981), but simi-
lar cover types were grouped to produce a data set with 44
classes. We accomplished this by grouping 101 classes repre-
senting residential, commercial, industrial, institutional, and
recreational areas into five urban lands classes; 15 types of
extractive land uses into a single mined lands class; 35 types
of cropland, feeding operations, groves, nurseries, vineyards,
specialty farms, and rural open lands into four agricultural
lands classes; nine types of pasture and rangeland into five
pasture and rangeland classes; 18 water classes into a single
open water class; 10 types of barren land into two barren land
classes; 21 types of transportation facilities into a single
transportation class; four types of communications facilities
into a single communications facilities class; 10 types of util-
ities into a single utilities class; four types of tree planta-
tions into a single plantation class; four non-native plants
classes into a single exotics class; and 61 natural community
types into 21 natural community classes.
We acknowledge that the results of our analyses might be
different if we used land cover data that were contemporane-
ous with Florida panther telemetry records. However, earlier
land cover data sets (Kautz et al., 1993; WMD 1988 land use/
land cover) used different classification schemes that were
not always consistent over time. In addition, most telemetry
records were collected from radio-collared panthers inhabit-
ing remote areas of public lands where land use changes have
been minimal, and we suspect that use of land cover data sets
closer to the dates of telemetry would yield only minor or
even insignificant differences in the results we obtained.
2.2. Analysis of habitat use
We used 2 methods to assess Florida panther habitat use
within the landscape (Fig. 1), compositional analysis (Aebi-
scher et al., 1993) and Euclidean distance analysis (Conner

Fig. 2 – Florida panther radio-telemetry locations (n = 55,542) collected between February 22, 1981, and March 30, 2001,
and the compositional analysis study area boundary. The study area used to determine characteristics of the landscape used
by panthers was defined by a minimum convex polygon containing 46,350 telemetry records for 79 panthers >2 years of age
for which >50 telemetry records were available.
B I O L O G I C A L C O N S E R V A T I O N 1 3 0 ( 2 0 0 6 ) 1 1 8 – 1 3 3 121
and Plowman, 2001). Although both methods use a similar
statistical technique (i.e., MANOVA) to test for differences in
habitat use, each method uses a different technique for deter-
mining used habitats relative to telemetry locations. We used
compositional analysis to determine the composition of land
cover types within home ranges relative to the study area. We
used Euclidean distance analysis to determine habitat use by
comparing distances from each radio-telemetry location of
individual Florida panthers to each land cover class and dis-
tances from random locations to each land cover class.
Our master set of Florida panther radio-telemetry records
consisted of data collected between February 1981 and March
2001 (n = 55,542) (Fig. 2). However, our determinations of Flor-
ida panther home ranges and our analyses of relative impor-
tance of various land cover types as panther habitat were
limited to telemetry records for 79 Florida panthers that oc-
curred south of the Caloosahatchee River (n = 46,350) to coin-
cide with the region occupied by the reproducing population.
Methodology for collection of telemetry locations was de-
scribed by Belden et al. (1988). Spatial accuracy of telemetry
data (i.e., 95th percentile) has been estimated to be within
230 m (Belden et al., 1988; Dees et al., 2001). Telemetry records
were acquired between 0600 and 1000 hours when panthers
usually were not active, and thus the majority of locations
were recorded when individuals were at or near daytime rest-
ing sites (Comiskey et al., 2002; Beier et al., 2006).
The compositional analysis study area was delimited as a
minimum convex polygon containing 46,350 telemetry re-
cords south of the Caloosahatchee River (Fig. 2). We calcu-
lated fixed kernel home ranges (Worton, 1989) with the
software program KERNELHR (Seaman et al., 1998) using
the least squares cross-validation (LSCV) method for choos-
ing the kernel smoothing parameter. Home ranges (n = 79)
were calculated for radio-collared panthers >2 years old
and for which >50 radio locations were determined. The
age limitation was applied to ensure individuals were inde-
pendent of their mothers and to reduce the effect of dispers-
ing juveniles on home ranges. The criterion for minimum
number of locations follows the recommendation of Seaman
et al. (1999) to reduce effects of small sample sizes on the
kernel estimator.
We used compositional analysis (Aebischer et al., 1993) to
identify proportions of land cover types within the fixed ker-
nel home ranges that differed from proportions of land cover
types within the study area. All land cover types were not
represented in each home range, thus land cover types were
122 B I O L O G I C A L C O N S E R V A T I O N 1 3 0 ( 2 0 0 6 ) 1 1 8 – 1 3 3
further combined into 16 habitat classes to reduce effects of
inflated Type I error rates on our results (Bingham and Bren-
nan, 2004). If proportions of land cover types differed
(p 6 0.05; PROC GLM, SAS Institute, 1999), land cover types
were ranked according to the number of positive differences
between pairs. Paired t-tests were then used to determine dif-
ferences (p 6 0.05) between ranked land cover types. Results
from these analyses were then incorporated in our GIS mod-
els below.
We used Euclidean distance analysis to identify differ-
ences in mean distances from each of the 16 land cover types
to radio-telemetry locations of individual Florida panthers
and to random locations (n = 5000) within the study area.
The methodology used to determine statistical differences
in habitat use was identical to that described for composi-
tional analysis above.
2.3. Forest patch size metrics
We also used compositional analysis to assess the effect of
forest patch size on panther habitat use within the study
area south of the Caloosahatchee River (Fig. 2). We accom-
plished this by reclassifying upland and wetland forest types
into one forest class, determining patch size, and assigning
individual forest patches to size classes according to an
equal area increment function. Similar to constraints put
on the number of different habitat classes above, the num-
ber of forest patch size classes was limited by availability
of each class within each fixed kernel home range. Conse-
quently, to reduce effects of absence of specific patch size
classes in individual home ranges and the resultant effect
of inflated Type I error rates (Bingham and Brennan, 2004),
13 forest patch size classes were used. Differences in propor-
tions of forest patches within each home range relative to
the entire study area were tested using the same methodol-
ogy described above for the compositional analysis of land
cover types.
2.4. Spatially explicit model of important habitatcomponents
Based on results from our compositional analyses of land cov-
er types and forest patch sizes, and based on reviews of Bel-
den et al. (1988) and Maehr et al. (1991), we created a
spatially explicit raster model of habitat patches potentially
suitable for use by panthers for cover. The model was based
on the following criteria: (1) all forest patches >2 ha regardless
of forest type were included in the model, and (2) all non-ur-
ban cover types within 200 m of forest patches >2 ha were in-
cluded. This model reflected panther use of all types of
upland and wetland forest patches, regardless of size, and it
also reflected the minimum mapping unit of 2 ha for upland
forests in the land cover database. The model accounts for
spatial error in the telemetry data by allowing for inclusion
of other natural or disturbed cover types in close proximity
to forest patches. This model was needed as a basis for delin-
eating boundaries around a landscape that links together the
most important components of panther habitat with inter-
vening cover types (e.g., agricultural and pasture lands) pres-
ent in the landscape.
2.5. Primary zone
Our principal goal was to identify south Florida lands essen-
tial to the long-term viability and survival of the Florida pan-
ther. Survival is defined as ‘‘the condition in which a species
continues to exist into the future while retaining the potential
for recovery. This condition is characterized by a species with
a sufficient population, represented by all necessary age clas-
ses, genetic heterogeneity, and number of sexually mature
individuals producing viable offspring, which exists in an
environment providing all requirements for completion of
the species’ entire life cycle, including reproduction, suste-
nance, and shelter’’ (USFWS and NMFS, 1998; page xix). We
called lands that met this goal the Primary Zone.
To delineate Primary Zone boundaries, we overlaid panther
telemetry data on the model of important landscape compo-
nents, overlapping minimum convex polygons of panther
home ranges that identified areas with heaviest use by pan-
thers from 1981 to 2001 as described by Comisky et al. (2002),
and WMD land use/land cover data. We then screen-digitized
a line around the outer edges of habitat patches in the land-
scape components model in a manner that (1) encompassed
most telemetry locations of currently monitored panthers in
areas of highest home range overlap and (2) incorporated a
mix of non-urban land cover types (e.g., citrus groves, crop-
lands, pastureland, freshwater marsh) in areas between
patches of forest in which the preponderance of telemetry
data occurred. The landscape delineated in this manner con-
sisted of forest patches panthers would most likely select as
daytime resting sites and den sites, and would use as cover
for stalking prey. Moreover, other natural and non-urban dis-
turbed land cover types between forest patches served as
landscape connections that accommodate panther home
range and dispersal movements (Maehr et al., 2002b), and they
contributed to the support of prey species. After the first draft
of the Primary Zone boundary had been completed, we ad-
justed the boundary slightly to account for changes to inten-
sive land uses (e.g., suburban or urban development) found
through visual interpretation of the draft boundary in relation
to recent satellite imagery (i.e., Landsat 5 Thematic Mapper sa-
tellite imagery dated December 26, 1999 [US Geological Survey,
EROS Data Center, Sioux Falls, South Dakota, USA]).
2.6. Landscape linkage model and dispersal zone
Since 1998, three radio-collared male panthers have dispersed
into south central Florida, and telemetry records indicate that
all crossed the Caloosahatchee River (Fig. 1) near the same
location (Maehr et al., 2002b). At the same time, the growing
human population of southwest Florida is expanding east
from Ft. Myers along the State Road 80 corridor immediately
south of the Caloosahatchee River, and development is ex-
pected to reach the area where the panthers crossed the river.
To maintain future opportunities for an expanding Florida
panther population to disperse out of south Florida, our sec-
ond goal was to identify lands that should be protected from
urban development to serve as a dispersal corridor. We called
lands that met this goal the Dispersal Zone.
We used ArcView GIS� version 3.3 and ArcView Spatial
Analyst� version 2 (Environmental Systems Research, Inc.,

B I O L O G I C A L C O N S E R V A T I O N 1 3 0 ( 2 0 0 6 ) 1 1 8 – 1 3 3 123
Redlands, CA, USA) to construct a set of least-cost path mod-
els to identify optimum panther dispersal corridor(s). The
least-cost path models operated on 2 cost surfaces that
ranked suitability of the landscape for use by dispersing pan-
thers under the assumption that habitat suitability influences
the routes likely to be taken by dispersing panthers. The 2
cost surfaces were 30 m pixel grids produced from the results
of our compositional and Euclidean distance analyses of hab-
itat types. We scored the 16 land cover types from 1 to 11 and
1 to 10 based on results of pair-wise comparisons of habitat
types in the compositional and Euclidean distance analyses,
respectively, with lower scores indicating higher likelihood
of use by dispersing panthers (Table 1). It is worth noting that
the urban lands class, which included residential and com-
mercial areas as well as roads and power lines, appeared in
the habitat suitability ranking because this class occurred
within some panther home ranges and within the study area
used for the compositional analysis.
We also performed sensitivity analyses to determine
whether higher cost scores for roads and water, which may
provide greater impedance to panther movements, would af-
fect the outputs of the model. We assigned water a score of 15
in each of the 2 cost surfaces to indicate that water is less
likely to be used by dispersing panthers than vegetated up-
lands or wetlands. We assigned major roads a score of 20 in
each cost surface as an indication that, even though dispers-
ing panthers can and do cross highways, the cost of dispers-
ing along a highway would accumulate rapidly relative to the
cost of crossing perpendicular to a road.
To run least-cost path models, it is necessary to designate
specific habitat sources and destinations for dispersing pan-
thers. Based on radio-telemetry locations and overlap of fixed
Table 1 – Florida panther habitat use as determined by compoand the CA study area (Fig. 2) and Euclidean distance analysis
Habitat rank Compositional analysis
Habitat type Rankdifferencesa
Cost surscor
15 Upland forest A 1
14 Hardwood swamp A 1
13 Pineland AB 2
12 Scrub B 3
11 Cypress swamp B 3
10 Shrub and brush C 4
9 Freshwater marsh CD 5
8 Dry prairie CD 5
7 Barren land DE 6
6 Unimproved pasture E 7
5 Urban EF 8
4 Pasture/grassland F 9
3 Cropland F 9
2 Open water G 10
1 Orchard/citrus grove G 10
0 Coastal wetlands H 11
Fixed kernel polygon home ranges were determined using 46,350 telemet
telemetry records were available. Land cover source data was derived from
data. Results from the CA and EDA were used to assign values to cost
Caloosahatchee River, FL, USA.
a Pairwise t-tests indicated habitat types with the same letter code were
kernel home ranges, we selected all of Florida Panther Na-
tional Wildlife Refuge (FPNWR) and patches of potential hab-
itat within Big Cypress National Preserve (BCNP) north of I-75
as source areas for dispersing panthers (Fig. 3). We then se-
lected patches of potential panther habitat within various
large parcels of public land in central Florida as destinations.
We made no attempt to model dispersal paths between occu-
pied habitats in BCNP and Everglades National Park because
these areas were protected by public ownership, and the goal
of this effort was to find one or more dispersal pathways into
central Florida. The 4 cost surfaces (i.e., 1 from each of habitat
rankings analyses; 1 from each analysis modified to test ef-
fects of roads and water) were used to find a set of one-pix-
el-wide least-cost paths from source patches to destination
patches. We reviewed the resulting set of least-cost paths
(Fig. 3) in relation to recent Landsat satellite imagery (26
December 1999; 3 April 2001), 1995 land use/land cover data,
the spatially explicit model of important landscape compo-
nents, apparent paths followed by three radio-collared males
known to have dispersed out of south Florida since 1998, and
literature recommendations for possible corridor widths (Har-
rison, 1992; Noss, 1992; Beier, 1995). We screen-digitized a 3.0–
7.8 km wide boundary of a Dispersal Zone to encompass a
mosaic of suitable land cover types in an area east of the town
of LaBelle, Hendry County, FL.
2.7. Secondary zone
Our final goal was to identify additional natural and disturbed
lands in south Florida that may be important to transient sub-
adult male panthers and have potential to support an expand-
ing panther population, especially if habitat restoration were
sitional analyses (CA) between fixed kernel home ranges(EDA) of panther telemetry records by individual animal
Euclidean distance
facee
Habitat type Rankdifferencesa
Cost surfacescore
Cypress swamp A 1
Pineland AB 2
Hardwood swamp BC 3
Upland forest CD 4
Dry prairie DE 5
Pasture/grassland EF 6
Unimproved pasture F 7
Shrub and brush F 7
Urban G 8
Cropland G 8
Coastal wetlands G 8
Orchard/citrus grove G 8
Freshwater marsh H 9
Barren land H 9
Scrub H 9
Open water I 10
ry locations for 79 panthers that were >2 years old and for which >50
a composite of 1995 water management district land use/land cover
surface grids used in determining a landscape linkage across the
not different (p > 0.05) from each other.
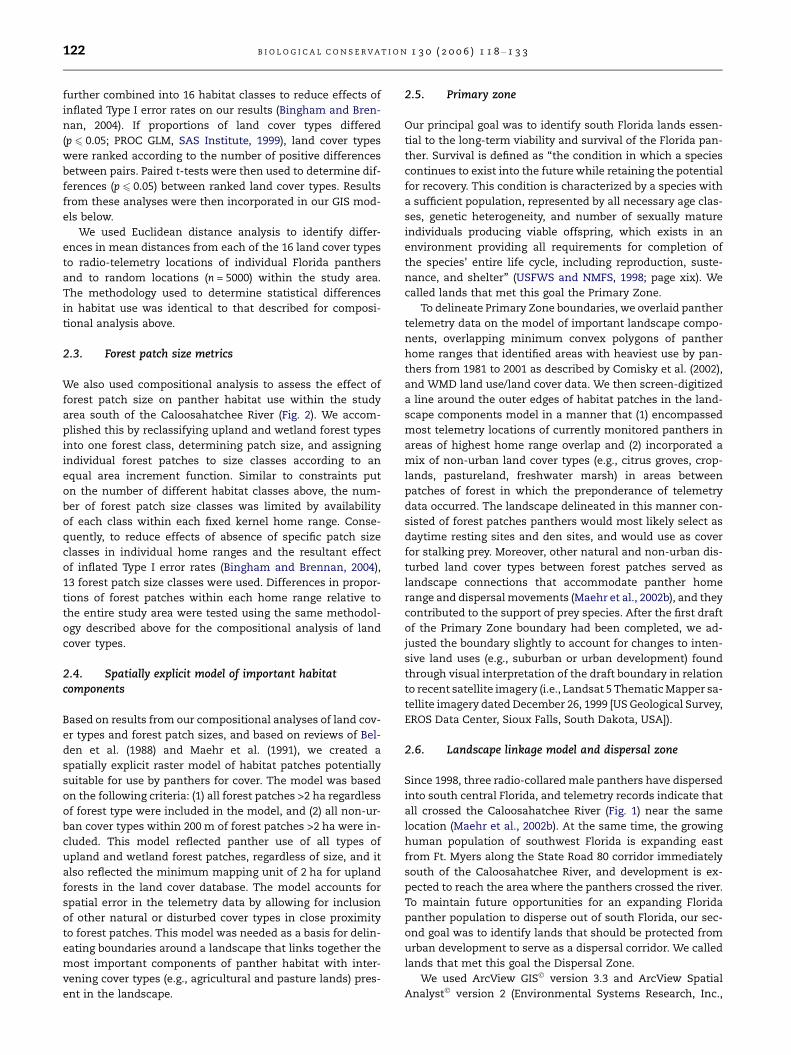
Fig. 3 – Least-cost paths most likely to be taken by Florida panthers dispersing out of south Florida. The Florida Panther
National Wildlife Refuge (FPNWR) and occupied habitat patches in the northeastern corner of Big Cypress National Preserve
were used as source areas for dispersal. Destinations for dispersing panthers were patches of apparently suitable habitat on
parcels of public land in peninsular Florida north of the Caloosahatchee River. Scores for cost surfaces derived from the
results of compositional analysis (CA) and Euclidean distance (ED) analysis.
124 B I O L O G I C A L C O N S E R V A T I O N 1 3 0 ( 2 0 0 6 ) 1 1 8 – 1 3 3
possible. We called lands that met this goal the Secondary
Zone. We sketched a preliminary boundary of a Secondary
Zone on a hard copy map, and the boundary was screen-
digitized utilizing the panther potential habitat map, recent
satellite imagery, and telemetry locations as guides. We then
conducted a GIS-based assessment of landscape context in-
side the draft Secondary Zone to provide direction to the pro-
cess of creating a final boundary. We used a ranking method
that involved subjective quantitative estimates of various
landscape variables to score lands within the draft Secondary
Zone based on presumed indicators of potential suitability to
panthers.
We evaluated the landscape context of the draft Secondary
Zone by combining a set of 30-m pixel grids created to mea-
sure three habitat-related variables (i.e., proximity to Primary
Zone, proximity to a forest plus buffer patch, forest plus buf-
fer patch size) and three land-use variables (i.e., proximity to
urban lands, intensity of land use, and road type and density).
We used WMD data as the source of land cover classes input
to each layer except roads, which derived from 1:24,000-scale
digital line graph (DLG) coverages for the region. We assigned
each pixel in the six data layers with scores of 1–10, with 10
representing the best case for panthers, and then we added
the grids together to rank the landscape within the draft Sec-
ondary Zone.
We developed scores for proximity to the Primary Zone by
first determining the maximum perpendicular distance of the
draft Secondary Zone boundary from the Primary Zone
boundary, which was found to be 17.53 km. Scores were as-
signed in increasing increments of distance from the Primary
Zone based on this maximum distance. To develop scores for
proximity to a forest plus buffer patch, Florida panther telem-
etry locations were overlaid on the model of important land-
scape components, and numbers of locations were tallied in
increments of 100 m from patches of potential habitat. Scores
were assigned as an increasing function of distance from for-
est plus buffer patches. Scores for forest plus buffer patch size
were assigned as an increasing function of size under the
assumption that larger patches would likely be more impor-
tant to panthers in the more disturbed landscape of the Sec-
ondary Zone.
We assigned scores for proximity to urban lands based on
a review of Beier (1995), who provided some information
about cougar behavior in the vicinity of urban areas, and by
B I O L O G I C A L C O N S E R V A T I O N 1 3 0 ( 2 0 0 6 ) 1 1 8 – 1 3 3 125
evaluating the distribution of telemetry locations in 100 m
increments from urban lands. We buffered urban lands by
300 m (98.5% of telemetry locations were >300 m from urban
lands), and we assigned lands within this buffer a1. We then
assigned lands between 300 and 1000 m from urban areas
scores of 2–9 in 100 m increments, and we assigned lands
>1000 m from urban areas a score of 10. To develop a ranked
data layer for land use intensity, we grouped land use/land
cover classes into natural, low, moderate, and high land use
intensity categories, and we assigned scores to pixels as fol-
lows: natural = 0, low = 1, moderate = 2, and high = 3. We then
computed the mean value of each pixel in the grid by averag-
ing all scores within a 1.0 km · 1.0 km window of each pixel.
The range of mean land use intensity values (i.e., 0.0–3.0)
was divided by 10, and scores were assigned in increments
of 0.3.
To develop scores for road type and density, we first as-
signed scores to road segments in the 1:24,000-scale DLG cov-
erage for Florida as follows: major highways = 10, major
arterial roads = 7, other paved roads = 4, and minor rural
roads = 1. Next, an empty 90 m pixel grid was created, and
the DLG road coverage that had been scored by road types
was overlaid on the grid. Then, a value for each pixel in the
grid was calculated by multiplying the total length of road
segments within a 1610 m radius of a pixel by the type score
of each road segment. Pixel values in the resulting grid ranged
0–167 and represented a measure of road type-length within
1610 m of a pixel. Regions of the grid with low values con-
tained few or no roads, whereas higher values indicated re-
gions with a high density of busy multi-lane highways.
Panther radio telemetry locations were overlaid on the road
type-length grid to produce a histogram of number of loca-
tions associated with each pixel value. A score of 10 was as-
signed to road type-length units of 0 (i.e., cells with no
roads within 1610 m), and a score of 1 was assigned to road
type-length units >23.
Lacking empirical evidence for relative contribution of
each data layer to landscape context, we tested 2 approaches
to assigning weights to the data layers. First, we assumed
each data layer had equal weight. Second, authors were
polled for their recommendations for assigning weights be-
tween 0 and 1 to each of the six variables, and mean weights
suggested by the authors were assigned to each layer. We
added the six weighted data layers using both equal weights
and mean weights suggested to by authors to create final
landscape context layers that were rescaled to 1–10. Differ-
ences between equal weights and author assigned weights
were negligible. We then intersected panther telemetry loca-
tions with the landscape context grids to generate frequency
distributions of number of telemetry points by values in the
grid. Finding that 99% of telemetry locations were associated
with pixels having scores P6, we created a final Secondary
Zone boundary by adjusting the draft boundary to eliminate
most areas with scores <6.
2.8. Florida panther population density
We generated minimum convex polygons of panther home
ranges for all Florida panthers by year (n = 49,889 telemetry
locations, 1981–2000). Each polygon was converted to a
100 m pixel grid, and resulting grids were summed to pro-
duce a grid in which the value of each pixel represented
the number of overlapping home range polygons that had
occurred at that place over the period of record. Assuming
that minimum convex polygons derived from transient
males that may have used an area only once or twice over-
estimated the region of south Florida most consistently
occupied by Florida panthers over time, we subtracted pixels
with values of 1 or 2 from the grid to generate a grid that we
defined as the region of most consistent panther occupancy
for the period of record. To estimate population density, the
total land area within the resulting region of panther occu-
pancy was divided by 62, the panther population count in
2000 (McBride, 2000), which was the year of the most recent
telemetry data used to define minimum convex polygon
home ranges.
To evaluate the extent to which the Primary, Secondary,
and Dispersal zones contribute to survival of the Florida pan-
ther, the number of panthers that each could potentially sup-
port was estimated. Density estimates of one panther per
11,000 ha (Maehr et al., 1991) and one panther per 12,919 ha
(this paper) were used to calculate a range of estimated pop-
ulation sizes as a function of the total land area of each zone.
These population estimates assume that habitat quality was
homogeneous throughout the landscape, which it was not.
Habitat quality in the Secondary Zone was estimated to be
34.53% of that in the Primary Zone based on relative propor-
tions of potentially suitable habitat patches in each zone. To
account for this difference, the estimated carrying capacity
of the Secondary Zone was adjusted downward accordingly.
Population size estimates were reviewed in relation to a sug-
gested set of population viability guidelines assembled from a
review of the Florida panther population viability analyses
(PVA) that have been conducted to date (Ballou et al., 1989;
Seal and Lacy, 1992; Ellis et al., 1999; Kautz and Cox, 2001;
Maehr et al., 2002b; Root, 2004).
3. Results
3.1. Compositional and Euclidean distance analyses
Comparison of the composition of land cover types found in
fixed kernel home ranges relative to the composition of land
cover types within the compositional analysis study area indi-
cated that habitat use was disproportionate to availability
(Wilk’s k = 0.0297, df = 15, P < 0.001). The 3 highest ranked hab-
itat types found within home ranges included upland hard-
wood forest, hardwood swamp, and pinelands, respectively
(Table 1). Habitats that were found to be disproportionately
lower in home ranges than available within the study area in-
cluded coastal wetlands, orchards/citrus groves, open water,
cropland, and pasture/grassland.
Comparison of mean distances between telemetry loca-
tions and random locations indicated that habitat use was
non-random (Wilk’s k = 0.0016, df = 16, P < 0.001). Florida pan-
ther locations during morning hours were within or closer to
forested cover types, particularly cypress swamp, pinelands,
hardwood swamp, and upland hardwood forests than would
be expected based on random locations (Table 1). Conversely,
daytime sites were farther from freshwater marsh, barren

126 B I O L O G I C A L C O N S E R V A T I O N 1 3 0 ( 2 0 0 6 ) 1 1 8 – 1 3 3
land, scrub, and open water than would be expected from
random locations.
Use of forest patches within fixed kernel home ranges also
differed significantly from random (Wilk’s k = 0.0475, df = 12,
P < 0.001). Generally, patches in the smallest forest patch size
classes occurred within home ranges in higher proportions
relative to their availability than larger forest patches (Table 2).
With the exception of the largest forest patch, which had an
intermediate rank, pairwise comparisons of patch size differ-
ences indicate that forest patch sizes 3.2–8.5 ha were found in
highest proportions relative to their availability, and forest
patches 4886.9–5647.7 ha were used less than their availability
within the compositional analysis study area.
3.2. Model of important components of the landscape
The map of landscape components important to the Florida
panther (Fig. 4), the criteria for which were based on the find-
ings from compositional and Euclidean distance analyses,
indicated that the greatest extent of forest plus buffer patches
occurs in southwest Florida, the principal area supporting the
current panther population. Large areas of habitat are in pub-
lic ownership (i.e., Big Cypress National Preserve, Fakahat-
chee Strand Preserve State Park, Florida Panther National
Wildlife Refuge, and Picayune Strand State Forest). These
landscape components tend to become progressively more
fragmented and isolated north of these parcels of public land
as well as in the southeastern portions of the Everglades.
3.3. Primary, Dispersal, and Secondary zones
The Primary, Dispersal, and Secondary zones (Fig. 5) included
a total area of 1,258,823 ha (Table 3). The Primary Zone
Table 2 – Florida panther forest patch use as determinedby compositional analyses (CA) between fixed kernelhome ranges and the CA study area (Fig. 2)
Forest patchsize class (ha)
Habitat rank Differencesin ranksa
3.2–8.5 12 A
2.0–3.1 11 A B
21.3–47.7 10 A B
117.3–253.0 9 A B
8.6–21.1 8 B
23,973.7+ 7 B C
47.8–115.0 6 B C
254.9–439.1 5 B C
3520.4–4706.6 4 C
505.1–847.8 3 C
848.1–1515.7 2 C
1538.4–3235.2 1 D
4886.9–5647.7 0 D
Fixed kernel polygon home ranges were determined using 46,350
telemetry locations for 79 panthers that were >2 years old and for
which >50 telemetry records were available. Land cover source
data was derived from a composite of water management district
land use/land cover data.
a Pairwise t-tests indicated forest patches size classes with the
same letter code were not different (p > 0.05) from each other.
covered 918,895 ha, of which 671,654 ha (73%) were in public
ownership and 247,241 ha (27%) were in private ownership
(Table 4). Forests accounted for 45% of Primary Zone cover
types; freshwater marshes for 41%; prairie and shrub lands
for 2.6%; and agricultural lands for 7.6%. Urban lands com-
prised only 0.52%. Privately owned lands within the Primary
Zone included more areas in agricultural use but less area
of freshwater marsh. Land cover types modeled as potentially
suitable habitat patches accounted for 64.3% of the Primary
Zone.
The least-cost paths output from the 2 cost surfaces based
on the original scores from the compositional and Euclidean
distance analyses resulted in multiple routes that Florida
panthers might follow when dispersing out of south Florida
across the Caloosahatchee River (Fig. 3). There were no dis-
cernable differences in the sensitivity analysis least-cost
paths that were produced from versions of the cost surfaces
that incorporated higher impedance scores for roads and
water. Paths west of LaBelle, FL, were rejected as candidate
sites for the location of the Dispersal Zone because they
passed through dense urban or intensive agricultural areas
by following one-pixel-wide paths unlikely to be used by pan-
thers on a regular basis. The path just west of Lake Okeecho-
bee was not a feasible location for the Dispersal Zone because
it passed through large expanses of open agricultural lands.
The site we selected for the Dispersal Zone incorporated the
paths that passed just east of of LaBelle, FL. The Dispersal
Zone covered 11,284 ha; ranged 3.0–7.8 km wide; had a mean
width of 5.3 km; extended about 20 km north from the Pri-
mary Zone; and included a 6 km segment of the Caloosahat-
chee River that averaged about 100 m across. Immediately
north of the Dispersal Zone was a large area mapped as hav-
ing habitat conditions potentially important for Florida pan-
thers (Logan et al., 1993; Cox et al., 1994), and the entire
area was in a single private ownership. Just within the eastern
boundary of the Dispersal Zone was an abandoned railroad
grade that may facilitate dispersal (Maehr et al., 2002b). For-
ests accounted for 29% of the Dispersal Zone; freshwater
marshes for 7.5%; prairie and shrub lands for 8.8%; agriculture
(primarily improved pasture and citrus groves) for 49%; and
barren and urban land for 5.1%. Land cover types modeled
as potentially suitable habitat patches accounted for 59.9%
of the Dispersal Zone.
The Secondary Zone covered 328,654 ha, of which
124,898 ha (38%) were in public ownership and 196,151 ha
(60%) were in private ownership. Only 11% of the Secondary
Zone was forest, the highest ranking cover types in the com-
positional analysis. A large percentage (43%) consisted of
freshwater marsh, the dominant plant community of the
Florida Everglades, most of which is in public ownership. Prai-
rie and shrub lands and agricultural lands accounted for 42%
of the Secondary Zone, and a small percentage (2.3%) con-
sisted of low-density residential areas and open urban lands.
Land cover types modeled as potentially suitable habitat
patches accounted for 22.2% of the Secondary Zone.
3.4. Florida panther population density
The region of most consistent panther occupancy from 1981
through early 2000 covered 800,951 ha. Based on the

Fig. 4 – A model of landscape components (i.e., forest patches >2 ha surrounded by 200 m non-urban buffers) significant to
Florida panther conservation throughout the southern portion of the Florida peninsula.
B I O L O G I C A L C O N S E R V A T I O N 1 3 0 ( 2 0 0 6 ) 1 1 8 – 1 3 3 127
estimated panther population of 62 individuals (McBride, 2000),
population density was one panther per 12,919 ha in 2000.
4. Discussion
4.1. Habitat analyses
Previous investigators have reported that Florida panthers are
strongly associated with forested habitats, especially in the
morning hours of 0600–1000 when telemetry data are typi-
cally collected (Belden et al., 1988; Maehr et al., 1991; Land,
1994; Maehr and Cox, 1995; Kerkhoff et al., 2000). Composi-
tional analyses of Florida panther habitat in this study con-
firmed previous findings that forest patches comprise an
important component of Florida panther habitat in south
Florida. Our compositional analysis also confirms previous
findings that other natural (e.g., freshwater marsh) and dis-
turbed (e.g., agricultural and pasture lands) cover types are
also present in the large landscapes that support panthers,
but these cover types rank lower in importance as panther
habitats (Belden et al., 1988; Maehr et al., 1991; Comiskey
et al., 2002). Similarly, Euclidean distance analysis, which
ranks the mean distances of telemetry records to the nearest
instance of each land cover type, also confirms that forest
cover types are either selected by Florida panthers as daytime
sites, or they are very close to the sites selected. On the other
hand, daytime sites typically are farthest away from freshwa-
ter marsh, barren land, scrub, and open water.
The differences in the results in Table 1 are because com-
positional analysis and Euclidean distance analysis measure
two different but related aspects of Florida panther use of
the landscape. Compositional analysis measures the relative
importance of various land cover types within home ranges.
Euclidean distance, on the other hand, ranks land cover types
according to whether or not they are selected or are near to
sites selected by panthers as daytime rest sites. Thus, not
only are panther home ranges composed to a large extent of
forest cover types, but forest cover types also are typically se-
lected as daytime sites, or they are at least near to the sites
selected. However, freshwater marsh is an example of a land
cover type that is fairly abundant within panther home
ranges, but sites selected during the daytime tend to be more
distant from freshwater marsh.
Contrary to information reported by Maehr and Cox (1995)
and Maehr and Deason (2002) that Florida panthers tend to
avoid forest patches <500 ha in size, our analyses showed
that the smallest classes of forest patches were the highest
ranked forest patch sizes within panther home ranges. This

Fig. 5 – Locations of Primary, Dispersal, and Secondary zones identified as important lands for conservation of Florida
panther habitat. Whereas the model in Fig. 4 indicates habitat patches providing important cover for panthers, the zones
integrate the patches into a connected landscape mosaic of land cover types needed to support the population.
Table 3 – Area of 1995 water management district land use/land cover types within Florida panther Primary, Dispersal, andSecondary zones
Land cover type Primary zone (ha) Dispersal zone (ha) Secondary zone (ha) Total (ha)
Wetland forest 350,306 1872 18,639 370,817
Upland forest 65,173 1440 16,984 83,597
Freshwater marsh 374,356 844 140,654 515,854
Prairie and shrub lands 23,553 992 20,163 44,707
Agriculture 70,155 5527 119,271 194,953
Barren, urban, exotics 15,236 576 10,864 26,675
Coastal wetlands 17,470 – 18 17,488
Aquatic 2646 34 2062 4742
Total area 918,895 11,284 328,654 1,258,834
128 B I O L O G I C A L C O N S E R V A T I O N 1 3 0 ( 2 0 0 6 ) 1 1 8 – 1 3 3
finding demonstrates that, not only are forests cover types
important to panthers, but forest patches of all sizes appear
to be important components of the landscapes inhabited by
Florida panthers, not just the larger forest patches. There are
several reasons why small forest patches could be important
to Florida panther conservation. First, this finding may sim-
ply be indicative of the presence of numerous small tree is-
lands in a matrix of freshwater herbaceous wetlands
characteristic of the Florida Everglades as well as small for-
est patches interspersed within agricultural landscapes
occupied by some panthers. Second, small forest patches
may be important for sub-adult Florida panthers that have
not yet established their own breeding territories, but need
a place to hunt and disperse in the interim. Additionally, a
more heterogeneous landscape characterized by an inter-
spersion of forest and non-forest patches may be more
favorable to the production of prey species, including
white-tailed deer (Odocoileus viriginianus) and wild hogs (Sus
scrofa), or perhaps prey ambush success is greater under
such conditions.

Table 4 – Estimated number of panthers that could be supported by the Primary, Secondary, and Dispersal zones in southFlorida by ownership
Zone Ownership Area (ha) Potential number ofpanthers (1/11,000 ha)a
Potential number ofpanthers (1/12,919 ha)b
Primary Public land (April 2001) 671,654 61 52
Private land 200,356 18 15
Tribal land 46,886 4 4
Total area 918,895 84 71
Secondary Public land (April 2001) 124,898 11 10
Private land 196,151 18 15
Tribal land 7605 1 1
Total area 328,654 30 25
Effective area (34.5%) 113,480 10 9
Dispersal Public land (April 2001) 0 0 0
Private land 11,284 1 0
Tribal land 0 0 0
Total area 11,284 1 0
a Density estimate from Maehr et al. (1991).
b Density estimate derived in this study.
Table 5 – Population guidelines for the Florida pantherbased on the results of previous population viabilityanalyses (Ballou et al., 1989; Seal and Lacy, 1992; Elliset al., 1999; Kautz and Cox, 2001; Maehr et al., 2002b;Root, 2004)
Populationsize
Viability
<50 Extinction highly probable in less than 100 years
– demographic instability
– Ne�50
– high levels of inbreeding
60–70 Barely viable
– low probability of extinction in 100 years
– expect 25% population decline in 100 years
– Ne < 50
– declining heterozygosity
– no habitat loss or catastrophes can be tolerated
80–100 Stable population likely for 100 years
– low probability of extinction in 100 years
– expect population to remain stable
over 100 years
– Ne > 50
– slowly declining heterozygosity
– no habitat loss or catastrophes can be tolerated
>240 High probability of persistence
– low probability of extinction in 100 years
– expect population to remain stable
over 100 years
– Ne > 50
– able to retain 90% of heterozygosity
– some habitat loss or mild catastrophes
can be tolerated
B I O L O G I C A L C O N S E R V A T I O N 1 3 0 ( 2 0 0 6 ) 1 1 8 – 1 3 3 129
4.2. Primary zone
The Primary Zone is the most important of the three zones
identified in this project because preservation of these lands
will contribute most to the long-term persistence of the Flor-
ida panther in the wild. The Primary Zone, which consisted of
86% natural cover types, could support an estimated 71–84
panthers based on estimates of population density (Table 4).
The Florida panther population was estimated at 30–50 indi-
viduals throughout the 1980s and early 1990s (Maehr, 1992).
However, the population has been growing since the mid-
1990s when 8 Texas females (P. c. stanleyana) were introduced
into south Florida, and major sources of roadkill mortality
were eliminated with the installation of underpasses along
Interstate 75 and State Road 29. If the population continues
to grow, it seems likely that additional sub-adult males may
eventually disperse outside of currently occupied lands. How-
ever, the chances of female dispersal, especially across the
Caloosahatchee River, without human intervention remain
in doubt. The most likely areas of dispersal are into the Sec-
ondary Zone and through the Dispersal Zone to privately
owned lands to the north.
A population of 71–84 panthers has a high probability of
persistence for 100 years (Table 5) assuming no further loss
of habitat. Available PVA models indicate that a population
of this size may either remain stable or decline gradually, per-
haps by as much as 25%, over the next 100 years; and genetic
problems associated with inbreeding depression and loss of
heterozygosity are likely to continue without management
intervention. Translocation of 2 females into the population
every 10 years would minimize the effects of inbreeding
depression and loss of heterozygosity in a population of this
size (Ellis et al., 1999; Maehr et al., 2002a), but genetic stability
would still fall short of the level provided by a population of
300 individuals (Maehr et al., 2002a). Thus, it appears that
the Primary Zone, a large landscape consisting of a matrix
of natural and disturbed cover types, provides just enough
space to support a population that is barely viable demo-
graphically as long as the habitat base remains stable. A pop-
ulation of 71–84 panthers would just meet the criteria for
survival (USFWS and NMFS, 1998) with the exception of ge-
netic heterogeneity. The Primary Zone takes on additional
significance in that it supports the only known breeding

130 B I O L O G I C A L C O N S E R V A T I O N 1 3 0 ( 2 0 0 6 ) 1 1 8 – 1 3 3
panther population, a population that should be viewed as
the essential foundation for one of three self-sustaining pop-
ulations needed for the recovery of the species (USFWS, 1995).
4.3. Dispersal zone
Our second priority for conservation of panther habitats was
the Dispersal Zone, an area intended to function as a land-
scape linkage maintaining connectivity to potentially suitable
habitat north of the Caloosahatchee River. Due to the rapid
rate of urban development in the region, the opportunity for
panthers to disperse out of south Florida eventually will be
precluded if a landscape connection cannot be maintained.
Moreover, should a breeding population become established
north of the Caloosahatchee River, effectively forming a
metapopulation (Wiens, 1996), a landscape connection would
facilitate exchange of dispersing individuals between the two
sub-populations, thereby increasing genetic and demographic
viability of the entire south Florida population (Ellis et al.,
1999). Logan et al. (1993) and Cox et al. (1994) identified about
150,000 ha immediately north of the Caloosahatchee River as
being potentially important for the long-term conservation of
Florida panther habitats. However, there is no certainty that
potential habitats north of the Caloosahatchee River actually
can support a sub-population of panthers.
The Dispersal Zone includes 113 km2, an area considerably
smaller than the average home ranges of adult male and fe-
male panthers (i.e., 416.5 km2 and 156.1 km2, respectively
[Land et al., 2004]). Therefore, it seems highly unlikely that
the Dispersal Zone could support permanent occupancy by
adult Florida panthers. However, Beier (1995) reported that
dispersing sub-adult males occupied transient home ranges
2–30% the size of adult home ranges for short periods of time.
Assuming transient home ranges of sub-adult male Florida
panthers were 30% the size of the average adult male, tran-
sient home ranges would be 125 km2, a number only slightly
larger than the size of the Dispersal Zone. Thus, the Dispersal
Zone may be large enough accommodate infrequent tempo-
rary use by dispersing males even though it is not large en-
ough to support permanent occupancy.
Regardless of its small area, the Dispersal Zone may be ex-
pected to function as a landscape linkage (Harris and Scheck,
1991; Hoctor, 2003). Mean maximum dispersal distance was
68.4 km for males and 20.3 km for females (Maehr et al.,
2002b), suggesting that both males and females could easily
traverse the 20 km length of the Dispersal Zone. Although
sub-adult females tend to set up home ranges immediately
adjacent to their mother’s home range (Maehr et al., 2002a),
Logan and Sweanor (2001) reported that a sizable minority of
female pumas in New Mexico did not settle near their mother,
suggesting that use of the Dispersal Zone will not be limited to
males. The potential appears to exist for female Florida pan-
thers to eventually disperse over the Caloosahatchee River in
an attempt to establish new territories to the north.
As to the widths needed to accommodate dispersal, Beier
(1995) reported that mountain lions dispersed through corri-
dors of suitable habitat that were 0.5–1.0 km wide over a dis-
tance of 6.0 km. In a California setting of wild lands
surrounded by urban areas, Beier (1995) recommended that
corridors with a length <0.8 km should be >100 m wide; corri-
dors extending 1–7 km should be >400 m wide; and corridor
width should increase as length increases. Noss (1992) sug-
gested that, as a rule-of-thumb, a regional corridor connect-
ing larger hubs of habitat should be at least 1.6 km wide
with no bottlenecks <400 m wide. With widths ranging 3.0–
7.8 km, the Dispersal Zone appears to be wide enough to facil-
itate panther dispersal out of south Florida.
The Dispersal Zone appears to be strategically located.
Three radio-collared sub-adult males have been documented
to have crossed the Caloosahatchee River in the approximate
vicinity of the Dispersal Zone (Maehr et al., 2002b). In addition,
the southern boundary is contiguous with Okaloacoochee
Slough State Forest, a parcel of public land that supported a
denning female in 2001 (Comiskey et al., 2002) and again in
2005 (Land, D., personal communication). Thus, a portion of
the breeding population was proximal to the southern termi-
nus of the Dispersal Zone in recent years, suggesting that it
is likely that dispersing panthers can find this landscape link-
age in the future. Perhaps it is only a matter of time before
pressure from an increasing population forces a young female
to disperse to the north across the Caloosahatchee River.
Immediately north of the Dispersal Zone is a very large
parcel of privately owned ranch land containing large areas
of habitat potentially suitable for Florida panthers. Our anal-
ysis of potential habitats and past evaluations (Logan et al.,
1993; Cox et al., 1994; Kautz and Cox, 2001) indicate that these
lands possess qualities that may be suitable for panthers. Just
within the eastern boundary of the Dispersal Zone is an aban-
doned railroad grade, a landscape feature likely to accommo-
date panther dispersal (Maehr et al., 2002b) The Dispersal
Zone includes a 6.0 km segment of the Caloosahatchee River
that averages 100 m across, thus making this area accessible
for panthers to cross. In addition, development intensity in
this segment of the river is relatively low.
4.4. Secondary zone
Our third priority for Florida panther habitat conservation was
the Secondary Zone, a set of lands immediately adjacent to the
Primary Zone but containing lower quality habitat and few re-
cords of panther use. Due to its position in the landscape, the
Secondary Zone is the area most likely to be encountered by
panthers ranging out of the Primary Zone. Areas within the
Secondary Zone also may provide temporary habitat or refuge
for sub-adult male panthers prior to their recruitment into the
population as breeders on established territories. Even though
radio-collared panthers previously have been tracked in por-
tions of the Secondary Zone, no panthers are known to inhabit
the area on a regular basis. Many areas within the Secondary
Zone do not now contain suitable panther habitat (e.g., inten-
sive agricultural lands, low density residential areas), but
many areas could feasibly support panthers on a permanent
basis if habitat restoration were to occur.
Based on area alone, the Secondary Zone has the capacity
to support 25–30 Florida panthers (Table 4). However, under
current conditions, habitat quality within the Secondary Zone
probably is not sufficient to support that many panthers. Cover
types modeled as being important landscape components for
panthers (Fig. 4) comprised only 22.2% of the Secondary Zone
compared to 64.3% in the Primary Zone. If the proportion of

B I O L O G I C A L C O N S E R V A T I O N 1 3 0 ( 2 0 0 6 ) 1 1 8 – 1 3 3 131
potentially suitable habitat patches in each zone is an indica-
tor of quality, the effective area of the Secondary Zone is
about 34.5% of that in the Primary Zone. Applying this ratio
to adjust for differences in habitat quality, the Secondary
Zone probably can support no more than 9–10 panthers in
its current condition (Table 4). However, this estimate is
clearly speculative because there is no evidence that panthers
consistently occupy the Secondary Zone at the present time.
5. Conservation implications
The Primary, Dispersal, and Secondary zones comprise essen-
tial components of a landscape-scale conservation plan for the
protection of a viable Florida panther population in south Flor-
ida. Taken together, the three zones in their current condition
apparently have the capacity to support approximately 80–94
Florida panthers. A population of this approximate size has a
high probability of persistence for 100 years and has a good
chance of remaining stable or perhaps declining only slightly
over the planning period. However, this conclusion assumes
that (1) further loss of habitat in all 3 zones, but especially in
the Primary Zone, is minimized, (2) the existing population will
expand into areas of the Secondary Zone where habitat condi-
tions are presently suboptimal and panthers are only occasion-
ally known to occur, and (3) unforeseen catastrophes do not
affect the population. These conditions may not be met as
new developments occur within all zones. Moreover, the pan-
ther population is currently experiencing an outbreak of feline
leukemia, the ultimate consequences of which remain to be
seen. Despite the high chance of persistence, a population of
80–94 panthers is nevertheless likely to experience genetic
problems associated with inbreeding depression and decreas-
ing heterozygosity, and future management intervention will
likely be needed to resolve these problems.
The Primary Zone, which supports the existing panther
population and comprises predominantly natural cover types,
is the most important of the lands mapped in this project to
panther habitat conservation. The maintenance of existing
home ranges and habitat function within the Primary Zone
is essential to maintaining a viable Florida panther popula-
tion. Assessments of potential impacts of proposed develop-
ments within the Primary Zone should strive to achieve no
net loss of landscape function or carrying capacity for pan-
thers within the Primary Zone. Loss of function or carrying
capacity within the Primary Zone may be affected by: (1)
reduction or degradation of the habitat base, (2) reduction in
the areal extent of the Primary Zone, (3) increasing landscape
fragmentation, and (4) land use intensification (e.g., moving
along a gradient from natural conditions to pasture, to crop-
land, to urban). Critical aspects of a functioning landscape
for panthers include use by panthers for home ranges, breed-
ing access, resting and denning sites, stalking cover, dispersal
routes, transient ranges of non-resident males, support for
prey, and natural areas that buffer against indirect impacts
associated with adjacent urban and industrial uses. Habitat
quality, functionality, and availability for panthers must be
maintained to ensure that no net loss of function or carrying
capacity occurs. When adverse land uses within the Primary
Zone are unavoidable, affected lands should be compensated
by the restoration or enhancement of habitat that maintains
or increases the potential carrying capacity for panthers else-
where within the Primary Zone. In addition, maintaining the
total areal extent of the Primary Zone may require expanding
the boundaries of the zone in appropriate locations (e.g., into
the Secondary Zone adjacent to protected habitat within the
Primary Zone) to compensate for loss of area. In such cases,
lower quality areas should be restored to land cover types
and landscape configurations that promote healthy prey den-
sities, connectivity, and habitat context to compliment con-
servation efforts within the Primary Zone.
If the Florida panther population continues to expand, dis-
persal outside of the Primary Zone is likely. The Dispersal Zone
is the second most important area mapped because it will play
a key role in maintaining a landscape connection between
south Florida and potential habitats to the north should a sec-
ond breeding sub-population become established. The most
important conservation action that could be taken for the Dis-
persal Zone is to secure it as a public conservation area using
fee-simple acquisition or the purchase of conservation ease-
ments. Most of the Dispersal Zone is privately owned; however,
11% has been placed under publicly funded conservation ease-
ments, and most of the remainder is proposed for public acqui-
sition under the State’s Florida Forever land protection
program. In addition, habitats within the Dispersal Zone need
to be restored to conditions more suitable for panthers to in-
crease the chances that this corridor will be used for dispersal.
Although pumas and panthers have been observed to disperse
through areas that are not developed to intensive urban uses
(Beier, 1995; Maehr et al., 2002b), habitat restoration within
the Dispersal Zone would improve chances for dispersal. An-
other management action that can be taken is for public land
managers to maintain high quality habitat conditions within
Okaloacoochee Slough State Forest immediately south of the
Dispersal Zone. Continued successful reproduction and growth
of the panther population in this portion of the range may be
the pressure needed to push a female panther through the Dis-
persal Zone to habitats north of the Caloosahatchee River.
The Secondary Zone is the lowest priority for panther con-
servation. Even though the Secondary Zone is immediately
adjacent to occupied areas of the Primary Zone, much of
the Secondary Zone is in intensive agricultural use, and some
areas are interspersed with low-density residential subdivi-
sions and golf course communities. Restoration of natural
cover types would have to occur in many areas of the Second-
ary Zone before the area could contribute meaningfully to the
recovery of the Florida panther. Therefore, although habitat
restoration and protection opportunities should be pursued
within the Secondary Zone whenever possible, these efforts
should not detract from the goal of protecting and enhancing
habitats within the Primary Zone.
Presently, state and federal government programs are ac-
tively engaged in obtaining new areas for protection of Florida
panther habitat. The State’s Florida Forever land acquisition
program and the South Florida Water Management District’s
Save Our Rivers program have purchased almost 200,000 ha
of panther habitat over the last decade, and another
118,000 ha are on proposed acquisition lists. The US Fish
and Wildlife Service (USFWS) reviews proposed development
projects in South Florida for potential impacts to Florida pan-
ther habitat under Sections 7 and 10 of the US Endangered

132 B I O L O G I C A L C O N S E R V A T I O N 1 3 0 ( 2 0 0 6 ) 1 1 8 – 1 3 3
Species Act (ESA). As a result of USFWS project reviews con-
ducted under the ESA between 1 September 2003, and 5 May
2005, over 4850 ha have been conserved in the Primary and
Dispersal zones (Slack, J., USFWS, personal communication).
The results of this study could aid in increasing the efficiency
and effectiveness of these programs by providing information
needed to determine which lands should be subject to regula-
tory programs and to target specific areas for protection,
either through fee-simple acquisition or purchase of less-
than-fee conservation easements.
Integration of all conservation efforts will be required to
support a self-sustaining population of the Florida panther
in South Florida. An ambitious, comprehensive strategy for
working with private landowners to protect, enhance, and re-
store panther habitat within the Primary, Dispersal, and Sec-
ondary Zones is essential. Public agencies responsible for
land use planning, transportation planning, and land man-
agement on public lands must also make decisions that
maintain or enhance the ability of South Florida to support
a viable population of the Florida panther. Trends in human
population growth, habitat loss and fragmentation, agricul-
tural conversions, and transportation planning all indicate
that these recommended conservation actions need to begin
immediately. The future of the Florida panther will likely be
determined in the next 2 decades, and without concerted
conservation efforts that future is uncertain.
Acknowledgement
This work is a product of the Florida panther sub-team of the
Multi-species Ecosystem Recovery Implementation Team
(MERIT), a committee appointed by the US Fish and Wildlife
Service (USFWS), Ecological Services Field Office, Vero Beach,
FL, USA. The primary purpose of MERIT is to guide implemen-
tation of recovery actions for endangered and threatened spe-
cies in south Florida. Sam Hamilton and Jay Slack (USFWS)
were instrumental in overseeing the process. USFWS employ-
ees Kalani Cairns, Grant Webber, Gloria Bell, Kim Dryden, and
Andy Eller participated in some team meetings, as well as did
Darrell Land, David Maehr, and Rebecca Meegan. Private citi-
zens who regularly participated in team meetings include
Tom Jones, Tim Durham, Bruce Johnson, Kris Thoemke, and
Sydney Maddock. We are grateful to Paul Beier, Tom Logan,
and three anonymous peer reviewers whose comments and
suggestions led to improvements in the final draft. The GIS
analyses for this project were performed in the facilities of
the Florida Fish and Wildlife Conservation Commission’s Of-
fice of Environmental Services and Fish and Wildlife Research
Institute in Tallahassee, FL, USA. The senior author is grateful
to Mike Dennis of Breedlove, Dennis & Associates, Inc., for
making time available to complete this work.
R E F E R E N C E S
Aebischer, N.J., Robertson, P.A., Kenward, R.E., 1993.Compositional analysis of habitat use from animalradio-tracking data. Ecology 74 (5), 1313–1325.
Anderson, J.R., Hardy, E.E., Roach, J.T., Witmer, R.E., 1976. A landuse and land cover classification system for use with remotesensor data. Geological Survey Professional Paper 964. USGeological Survey, Washington, DC, USA.
Ballou, J.D., Foose, T.J., Lacy, R.C., Seal, U.S., 1989. Florida Panther(Felis concolor coryi). Population Viability Analysis andRecommendations. Species Survival Commission, CaptiveBreeding Specialist Group, IUCN, Gland, Switzerland.
Beier, P., 1995. Dispersal of juvenile cougars in fragmentedhabitat. Journal of Wildlife Management 59 (2), 228–237.
Beier, P., Conroy, M.J., Vaughn, M.R., Quigley. H., 2006. Evaluatingscientific inferences about the Florida panther. Journal ofWildlife Management 71 (1), in press.
Belden, R.C., Frankenberger, W.B., McBride, R.T., Schwikert, S.T.,1988. Panther habitat use in southern Florida. Journal ofWildlife Management 52 (4), 660–663.
Bingham, R.L., Brennan, L.A., 2004. Type I error rates and resourceselection. Journal of Wildlife Management 68, 206–212.
Bureau of Economic and Business Research (BEBR). 2001.Projections of Florida population by county, 2000–2030. FloridaPopulation Studies, vol. 34, No. 1, Bulletin 128. University ofFlorida, Gainesville, FL, USA.
Comiskey, E.J., Bass, Jr., O.L., L.J. Gross, McBride, R.T., Salinas. R.,2002. Panthers and forests in South Florida: an ecologicalperspective. Conservation Ecology 6(1):18. [online] URL: http://www.consecol.org/vol6/iss1/art18.
Conner, L.M., Plowman, B.W., 2001. Using Euclidean distances toassess nonrandom habitat use. In: Millspaugh, J.J., Marzluff,J.M. (Eds.), Radio Tracking and Animal Populations. AcademicPress, San Diego, CA, USA, pp. 275–290.
Cox, J., Kautz, R., MacLaughlin, M., Gilbert, T., 1994. Closing theGaps in Florida’s Wildlife Habitat Conservation System. FloridaGame and Fresh Water Fish Commission, Tallahassee, FL, USA.
Dees, C.S., Clark, J.D., Van Manen, F.T., 2001. Florida pantherhabitat use in response to prescribed fire. Journal of WildlifeManagement 65 (1), 141–147.
Ellis, S., Lacy, R.C., Kennedy-Stoskopf, S., Wildt, D.E., Shillcox, J.,Byers, O., Seal, U.S., editors. 1999. Florida panther populationand habitat viability assessment and genetics workshopreport. IUCN/SSC Conservation Breeding Specialist Group,Apple Valley, Minnesota, USA.
Harris, L.D., Scheck, J., 1991. From implications to applications: thedispersal corridor approach to the conservation of biologicaldiversity. In: Saunders, D.A., Hobbs, R.J. (Eds.), NatureConservation 2: the Role of Corridors. Surrey Beatty and Sons,Chipping Norton, New South Wales, Australia, pp. 189–220.
Harrison, R.L., 1992. Toward a theory of inter-refuge corridordesign. Conservation Biology 6 (2), 293–295.
Hoctor, T.S. 2003. Regional landscape analysis and reserve designto conserve Florida’s biodiversity. Ph.D. dissertation, Univesityof Florida, Gainesville, FL, USA.
Kautz, R. 1994. Historical trends within the range of the Floridapanther. In: Jordan, D.B., (Ed.), Proceedings of the FloridaPanther Conference US Fish and Wildlife Service, Atlanta, GA,USA, pp. 285–296.
Kautz, R.S., 1998. Land use and land cover trends in Florida1936–1995. Florida Scientist 61 (3–4), 171–187.
Kautz, R.S., Cox, J.A., 2001. Strategic habitats for biodiversityconservation in Florida. Conservation Biology 15 (1), 55–77.
Kautz, R.S., Gilbert, D.T., Mauldin, G.M., 1993. Vegetative coverin Florida based on 1985–1989. Landsat Thematic Mapperimagery. Florida Scientist 56, 135–154.
Kerkhoff, A.J., Milne, B.T., Maehr. D.S., 2000. Toward apanther-centered view of the forests of south Florida.Conservation Ecology 4(1):1. [online] URL: http://www.consecol.org/vol4/iss1/art1.
Kuyper, W.H., Becker, J.E., Shopmyer, A., 1981. Land Use, Coverand Forms Classification System: A Technical manual. Florida

B I O L O G I C A L C O N S E R V A T I O N 1 3 0 ( 2 0 0 6 ) 1 1 8 – 1 3 3 133
Department of Transportation, State Topographic Office,Remote Sensing Center, Tallahassee, FL, USA.
Land, E.D., 1994. Panther use of the southern Florida landscape.In: Jordan, D.B. (Ed.), Proceedings of the Florida PantherConference. US Fish and Wildlife Service, Atlanta, GA, USA,pp. 278–284.
Land, E.D., Lacy, R.C., 2000. Introgression level achieved throughFlorida panther genetic restoration. Endangered SpeciesUPDATE 17 (5), 99–103.
Land, D., Cunningham, M., Lotz, M., Shindle, D., 2004. Floridapanther genetic restoration and management Annual report2003–2004. Florida Fish and Wildlife ConservationCommission, Tallahassee, FL, USA.
Logan, K.A., Sweanor, L.L., 2001. Desert Puma. Island Press,Washington, DC.
Logan, T., Eller Jr., A.C., Morrell, R., Ruffner, D., Sewell, J., 1993.Florida Panther Habitat Preservation Plan: south FloridaPopulation. Florida Panther Interagency Committee, US Fishand Wildlife Service, Gainesville, FL, USA.
Maehr, D.S., 1992. Florida panther (Felis concolor coryi). In: Rare andEndangered Biota of Florida. In: Humphrey, S.R. (Ed.),Mammals, vol. I. University Press of Florida, Gainesville, FL,USA, pp. 176–189.
Maehr, D.S., Cox, J.A., 1995. Landscape features and panthers inFlorida. Conservation Biology 9 (5), 1008–1019.
Maehr, D.S., Deason, J.P., 2002. Wide-ranging carnivores anddevelopment permits: constructing a multi-scale model toevaluate impacts on the Florida panther. Clean Technologyand Environmental Policy 3, 398–406.
Maehr, D.S., Land, E.D., Roof, J.C., 1991. Social ecology of Floridapanthers. National Geographic Research and Exploration 7 (4),414–431.
Maehr, D.S., Lacy, R.C., Land, E.D., Bass Jr., O.L., Hoctor, T.S., 2002a.Evolution of population viability assessments for the Floridapanther: a multi-perspective approach. In: Beissinger, S.R.,McCullough, D.R. (Eds.), Population Viability Analysis.University of Chicago Press, Chicago, IL, USA, pp. 284–311.
Maehr, D.S., Land, E.D., Shindle, D.B., Bass, O.L., Hoctor, T.S.,2002b. Florida panther dispersal and conservation. BiologicalConservation 106, 187–197.
McBride, R.T. 2000. Current panther distribution and habitat use:A review of field notes, fall 1999–winter 2000. Report to FloridaPanther Subteam of MERIT, United States Fish and WildlifeService, South Florida Ecosystem Office, Vero Beach, FL, USA.[online] URL: http://www.panther.state.fl.us/news/pdf/report.pdf.
McBride, R.T. 2001. Current panther distribution, populationtrends, and habitat use: Report of field work, fall 2000–winter2001. Report to Florida Panther Subteam of MERIT,United States Fish and Wildlife Service, South FloridaEcosystem Office, Vero Beach, FL, USA. [online] URL:http://www.panther.state.fl.us/news/pdf/rtm2001.pdf.
McBride, R.T. 2002. Current panther distribution and conservationimplications: Highlights of field work, fall 2001–winter 2002.Report to Florida Panther Subteam of MERIT, United StatesFish and Wildlife Service, South Florida Ecosystem Office, VeroBeach, FL. [online] URL: http://www.panther.state.fl.us/news/pdf/rtm2002.pdf.
McBride, R.T. 2003. Documented panther population and itscurrent distribution. In: Shindle, D., Cunningham, M.,Land, D., McBride, R., Lotz, M., Ferree, B. (Eds.), FloridaPanther Genetic Restoration Annual Report 2002–2003.Florida Fish and Wildlife Conservation Commission,Tallahassee, FL, USA. [online] URL: http://www.panther.state.fl. us/news/pdf/FWC2002-2003PantherGeneticRestorationAnnualReport.pdf.
Noss, R.F. 1992. The wildlands project land conservation strategy.Wild Earth (special issue): pp. 10–25.
Root, K.V., 2004. Using models to guide recovery efforts for theFlorida panther. In: Akcakaya, H.R., Burgman, M., Kindvall, O.,Wood, C.C., Sjogren-Gulve, P., Hatfield, J., McCarthy, M. (Eds.),Species Conservation and Management: Case Studies. OxfordUniversity Press, New York, NY, USA, pp. 491–504.
SAS Institute. 1999. SAS/STAT users’s guide. SAS Institute, Cary,NC, USA.
Seal, U.S., Lacy, R., 1992. Genetic Management Strategies andPopulation Viability of the Florida Panther (Felis concolor coryi).Report of a Workshop to the US Fish and Wildlife Service.Captive Breeding Specialist Group, IUCN, Apple Valley, MN,USA.
Seaman, D.E., Griffith, B., Powell, R.A., 1998. KERNELHR: a programfor estimating animal home ranges. Wildlife Society Bulletin26, 95–100.
Seaman, D.E., Millspaugh, J.J., Kernohan, B.J., Brundige, G.C.,Raedeke, K.J., Gitzen, R.A., 1999. Effects of sample size onkernel home range estimates. Journal of Wildlife Management63 (2), 739–747.
Sullivan, J.D., Jr. 2004. Florida’s endangered species,threatened species and species of special concern. FloridaFish and Wildlife Conservation Commission, Tallahassee,FL, USA.
US Fish and Wildlife Service (USFWS). 1995. Second revisionFlorida panther recovery plan, Atlanta, GA, USA.
US Fish and Wildlife Service (USFWS) and National MarineFisheries Service (NMFS). 1998. Endangered Species Actconsultation handbook: procedures for conducting section 7consultations and conferences, Washington, DC, USA.
Wiens, J.A., 1996. Wildlife in patchy environmentsmetapopulations, mosaics, and management. In: McCullough,D.R. (Ed.), Metapopulations and Wildlife Conservation. IslandPress, Washington, DC, USA, pp. 53–84.
Worton, B.J., 1989. Kernel methods for estimating theutilization distribution in home-range studies. Ecology 70,164–168.