how much international variation in child height can...
TRANSCRIPT

Pub
lic D
iscl
osur
e A
utho
rized
Pub
lic D
iscl
osur
e A
utho
rized
WPS6351P
ublic
Dis
clos
ure
Aut
horiz
ed
Pub
lic D
iscl
osur
e A
utho
rized
Policy Research Working Paper 6351
How Much International Variation in Child Height Can Sanitation Explain
Dean Spears
The World Bank Sustainable Development Network Water and Sanitation Program February 2013
Produced by the Research Support Team
Abstract
The Policy Research Working Paper Series disseminates the findings of work in progress to encourage the exchange of ideas about development issues An objective of the series is to get the findings out quickly even if the presentations are less than fully polished The papers carry the names of the authors and should be cited accordingly The findings interpretations and conclusions expressed in this paper are entirely those of the authors They do not necessarily represent the views of the International Bank for Reconstruction and DevelopmentWorld Bank and its affiliated organizations or those of the Executive Directors of the World Bank or the governments they represent
Policy Research Working Paper 6351
Physical height is an important economic variable reflecting health and human capital Puzzlingly however differences in average height across developing countries are not well explained by differences in wealth In particular children in India are shorter on average than children in Africa who are poorer on average a paradox called ldquothe Asian enigmardquo which has received much attention from economists This paper provides the first documentation of a quantitatively important gradient between child height and sanitation that can statistically explain a large fraction of international height differences This association between sanitation and
human capital is robustly stable even after accounting for other heterogeneity such as in GDP The author applies three complementary empirical strategies to identify the association between sanitation and child height country-level regressions across 140 country-years in 65 developing countries within-country analysis of differences over time within Indian districts and econometric decomposition of the India-Africa height differences in child-level data Open defecation which is exceptionally widespread in India can account for much or all of the excess stunting in India
This paper is a product of the Water and Sanitation Program Sustainable Development Network It is part of a larger effort by the World Bank to provide open access to its research and make a contribution to development policy discussions around the world Policy Research Working Papers are also posted on the Web at httpeconworldbankorg The author may be contacted at dspearsprincetonedu
How much international variation in child height can sanitation explain
Dean Spearslowast
First circulated 10 December 2012 This version 17 January 2013
Abstract
Physical height is an important economic variable reflecting health and human capital Puzzlingly however differences in average height across developing countries are not well explained by differences in wealth In particular children in India are shorter on average than children in Africa who are poorer on average a paradox called ldquothe Asian enigmardquo which has received much attention from economists This paper provides the first documentation of a quantitatively important gradient between child height and sanitation that can statistically explain a large fraction of internashytional height differences This association between sanitation and human capital is robustly stable even after accounting for other heterogeneity such as in GDP I apply three complementary empirical strategies to identify the association between sanitation and child height country-level regressions across 140 country-years in 65 developing countries within-country analysis of differences over time within Indian districts and econometric decomposition of the India-Africa height difference in child-level data Open defecation which is exceptionally widespread in India can account for much or all of the excess stunting in India
lowastPrinceton University Wallace Hall Princeton NJ 08540 dspearsprincetonedu I am grateful for helpful suggestions from Luis Andres Robert Chambers Juan Costain Jean Dreze Marianne Fay Ariel Fiszbein John Newman Doug Miller from seminar participants at LBSNAA Princeton and the World Bank and WSP and especially from Anne Case Diane Coffey Angus Deaton Michael Geruso and Jeff Hammer Errors and interpretations are my own Portions of this paper have previously circulated as ldquoSanitation and open defecation explain international variation in childrens height Evidence from 140 nashytionally representative household surveysrdquo and ldquoWhat does the NFHS-3 (DHS) tell us about rural sanitation externalitiesrdquo both of which this working paper supersedes
1
1 Introduction
Physical height is a topic of expanding interest to economists (Steckel 2009) in large part
because it is an important correlate of human capital and health and is a predictor of ecoshy
nomic productivity (Currie 2009) Despite this attention an important puzzle persists
international differences in height across present day developing countries are not well exshy
plained by differences in economic well-being (Deaton 2007) In particular people in India
are shorter on average than people in Africa despite the fact that Indians are also richer
on average a fact that has been labeled the ldquoAsian enigmardquo (Ramalingaswami et al 1996)
One candidate explanation which has received relatively little attention in economistsrsquo
recent investigations of the puzzle of Indian stunting (eg Deaton 2007 Tarozzi 2008
Jayachandran and Pande 2012 Panagariya 2012) is sanitation Medical research documents
that chronic childhood environmental exposure to fecal germs can be an important cause of
stunting (Humphrey 2009) Sanitation coverage is exceptionally poor in India where over
half of households defecate openly without using a toilet or latrine a much larger fraction
than in other countries with similar income
According to joint UNICEF and WHO (2012) estimates for 2010 15 percent of people in
the world and 19 percent of people in developing countries openly defecate without using
any toilet or latrine The primary contribution of this paper is to document that much of the
variation in child height among developing countries can be explained by differences in rates
of open defecation Sanitation robustly explains variation in stunting even after accounting
for GDP and other dimensions of heterogeneous economic development Other recent papers
concentrating on internal validity have demonstrated the existence of a causal effect of
sanitation on child height (Spears 2012a Hammer and Spears 2012) in contrast this
paper assesses the statistical global importance of sanitation quantitatively using descriptive
regressions and econometric decomposition techniques In particular differences in open
defecation are sufficient to statistically explain much or all of the difference in average height
2
between Indian and African children These results suggest that open defecation is a policy
priority of first-order importance
This paper makes several contribution to the literature First to my knowledge it
offers the first documentation of a quantitatively important cross-country gradient between
sanitation and child human capital Although the association between income and health has
been widely studied within and across developing countries the importance of sanitation has
received much less attention Moreover I show that sanitation predicts child height even
conditional on income Controlling for GDP the difference between Nigeriarsquos 26 percent
open defecation rate and Indiarsquos 55 percent is associated with an increase in child height
approximately equivalent to quadrupling GDP per capita
Second this paper documents an interaction between sanitation and population density
consistent with a mechanism in which open defecation harms human capital through exposure
to environmental germs The number of people defecating openly per square kilometer
linearly explains 65 percent of international variation in child height This finding clarifies
the policy case for sanitation as a public good Third it contributes to a resolution of the
puzzle of the ldquoAsian enigmardquo of Indian stunting which has received much recent attention
from economists Finally the conclusions offer a reminder that height often refereed to as
an indicator of ldquomalnutritionrdquo broadly reflects early-life net nutrition including losses due
to disease
Three sections of the paper contribute complementary analyses of the relationship beshy
tween height and open defecation each focusing on a different dimension of heterogeneity
Section 2 studies country-year average sanitation and child heights here each observation
is a collapsed DHS survey Open defecation is particularly harmful to childrenrsquos health
where population density is high creating a special risk of stunting in India Section 3
compares children within one country introducing district fixed effects to repeated cross-
section data constructed out of two rounds of Indiarsquos National Family and Health Survey
in order to study differences within districts over time Section 4 considers whether the
3
India-Africa height gap can be explained by heterogeneity in village-level open defecation
rates using individual-level data on child heights and decomposition analysis in the spirit
of Oaxaca-Blinder Reweighting Indian data to match the sanitation of an African sample
counterfactually increases the height of Indian children by more than the India-Africa gap
All three approaches find a similar and quantitatively important association between height
and sanitation Finally a concluding section 5 considers whether estimates of of the assoshy
ciation between height and sanitation in this paper and from the literature are sufficient to
account for the India-Africa gap
11 Open defecation causes stunting
A growing literature in economics documents that physical height has its origins in early
life health (eg Case and Paxson 2008) especially in poor countries where environmental
threats to health are more important than they are in rich countries relative to genetics
(Martorell et al 1977 Spears 2012b) Two existing literatures indicate that early-life exposhy
sure to fecal germs in the environment reduces childrenrsquos subsequent height First medical
and epidemiological literatures have documented the mechanisms linking open defecation to
poor health and early life human capital accumulation1 Humphrey (2009) documents that
chronic but subclinical ldquoenvironmental enteropathyrdquo ndash a disorder caused by repeated fecal
contamination which increases the small intestinersquos permeability to pathogens while reducing
nutrient absorption ndash could cause malnutrition stunting and cognitive deficits even without
necessarily manifesting as diarrhea (see also Petri et al 2008 Mondal et al 2011) Relatshy
edly Checkley et al (2008) use detailed longitudinal data to study an association between
childhood diarrhea and subsequent height
Second recent econometric studies find an effect of a government sanitation program in
1Perhaps the recent paper most complementary to this one is Fink et alrsquos (2011) regression of an indicator for child stunting on variables including sanitation in 172 pooled DHS surveys However one key difference is that they focus on within-country height-sanitation correlations all regressions include DHS survey fixed effects for country-years
4
rural India From 1999 until its replacement with a new program in 2012 the Indian central
government operated a ldquoflagshiprdquo rural sanitation program called the Total Sanitation Camshy
paign (TSC) Averaging over implementation heterogeneity throughout rural India Spears
(2012a) finds that the TSC reduced infant mortality and increased childrenrsquos height on avershy
age In a follow-up study Spears and Lamba (2012) find that early life exposure to improved
rural sanitation due to the TSC additionally caused an increase in cognitive achievement at
age six Similarly Hammer and Spears (2012) report a randomized field experiment in Mashy
harashtra in which children living in villages randomly assigned to a treatment group that
received sanitation motivation and subsidized latrine construction grew taller than children
in control villages Section 51 considers the estimates of these causally well-identified studies
in the context of this paperrsquos results
12 Open defecation is common in India
Of the 11 billion people who defecate openly nearly 60 percent live in India which means
they make up more than half of the population of India These large numbers are roughly
corroborated by the Indian governmentrsquos 2011 census which found that 531 percent of all
Indian households ndash and 693 percent of rural households ndash ldquousuallyrdquo do not use any kind of
toilet or latrine In the 2005-6 National Family Health Survey Indiarsquos version of the DHS
553 percent of all Indian households reported defecating openly a number which rose to 74
percent among rural households
These statistics are striking for several reasons First open defecation is much more
common in India than it is in many countries in Africa where on average poorer people
live UNICEF and the WHO estimate that in 2010 25 percent of people in sub-Saharan
Africa openly defecated In the largest three sub-Saharan countries ndash Nigeria Ethiopia and
the Democratic Republic of the Congo ndash in their most recent DHS surveys 311 383 and
121 percent of households report defecating openly
Second despite accelerated GDP growth in India open defecation has not rapidly deshy
5
clined in India over the past two decades not even during the rapid growth period since the
early 1990s In the DHS where 553 percent of Indian households defecated openly in 2005shy
06 637 did in the earlier 1998 survey round and 697 did in 1992 This is particularly true
for poor people the joint UNICEF and WHO report concludes that ldquothe poorest 40 percent
of the population in Southern Asia have barely benefited from improvements in sanitationrdquo
In 2010 86 percent of the poorest quintile of South Asians defecated openly
Therefore it is already well-known that open defecation is bad for childrenrsquos health
that early-life disease leads to lasting stunting and that open defecation is exceptionally
widespread in India The contribution of this paper is to quantitatively assess the importance
of the link among these facts The results indicate that sanitation is a statistically important
predictor of differences in the height of children in developing countries and can explain
differences of interest to economists and of significance to human development
2 Evidence from country means 140 DHS surveys
Across countries observed in different years how much of the variation in child height
is explained by variation in open defecation This section uses 140 DHS surveys each
collapsed into a single observation to show that sanitation alone explains more than half of
the variation across country-years
The analysis proceeds in several steps First section 22 documents that across country
means height is associated with open defecation with little change after controlling for GDP
Next section 221 uses country fixed effects and replication on sub-samples of world regions
to show that no geographic or genetic differences are responsible for the result Then section
222 verifies that other dimensions of infrastructure or well-being do not similarly predict
child height Section 223 observes that children would be more exposed to fecal pathogens
where population is more dense and finds that open defecation interacts with population
density Section 224 documents that the association between height and open defecation is
6
steeper among older children consistent with an unfolding effect of accumulating exposure
Finally section 23 considers the average height difference between children in South Asian
and Sub-Saharan African countries and shows that much of this gap is accounted for by
sanitation
21 Data
All data used in this paper are publicly available free of charge on the internet Demographic
and Health Surveys (DHS) are large nationally representative surveys conducted in poor
and middle-income countries DHS surveys are collected and organized to be internationally
comparable In some countries several rounds of DHS data have been collected in others
only one or two I use every DHS survey which recorded household sanitation and measured
child height2 This creates a maximum sample of 140 country-years and 65 countries ranging
in frequency from 26 countries that appear in the survey once to 10 that appear in four
separate DHS surveys The earliest survey in the dataset was collected in Pakistan in 1990
the most recent are from 2010
I match data from other sources to the collapsed DHS surveys GDP per capita and
population are taken from the Penn World Tables ldquoPolityrdquo and ldquoDemocracyrdquo scores of
democratization are taken from the Polity IV database A measure of calorie availability
produced by the World Food Program is used in some specifications All other variables are
from DHS surveys
Using these data the basic regression I estimate is
heightcy = βopen defecationcy + αc + γy + Xcyθ + εcy (1)
where observations are collapsed DHS surveys c indexes countries and y indexes years Open
defecation is a fraction from 0 to 1 of the population reporting open defecation without using
2I use published summary statistics available online at wwwmeasuredhscom DHS surveys do not include rich countries such as the US One important omission is China where there has not been a DHS survey
7
a toilet or latrine3 Height is the average height of children under 5 or children under 3 used
in separate regressions As robustness checks results are replicated with country fixed effects
αc year fixed effects γy and time-varying controls Xcy including the log of GDP per capita
all of which are added separately in stages Standard errors are clustered by 65 countries
22 Regression results
Figure 1 depicts the main result of this section a negative association between open defecashy
tion and child height is visible across country years both for children under 3 and children
under 5 Regression lines are plotted with and without weighting by country population
The three largest circles are Indiarsquos National Family and Health Surveys (only one large cirshy
cle appears in panel (b) because only the 2005 survey measured height of children up to age
5) Average height in India is indeed low However the fact that the Indian observations
are on the regression line ndash and not special outliers ndash is an initial suggestion that sanitation
might help resolve the ldquoAsian enigmardquo of Indian height
Table 1 reports estimates of regression 1 and will be referenced throughout this section
of the paper The main estimate of a linear decrease in height of 124 standard deviations
associated with changing the fraction openly defecating from 0 to 1 is qualitatively similar
to Spearsrsquos (2012a) estimates of 115 to 159 where effects of sanitation are identified using
heterogeneity in the implementation of an Indian government program In column 1 sanshy
itation alone linearly explains 54 percent of the country-year variation of childrenrsquos height
in DHS surveys Because sanitation and height are both improving over time column 2
adds year fixed effects the point estimates slightly increase and standard errors decrease
suggesting that the result is not an artifact of time trends
Does the significance of open defecation merely reflect general economic development
Column 3 adds a control for GDP per capita the coefficient on sanitation remains similar
3For example in Indiarsquos NFHS-3 the survey asks ldquoWhat kind of toilet facility do members of your household usually userdquo with the relevant answer ldquoNo facilityuses open space or fieldrdquo This importantly distinguishes latrine use from latrine ownership
8
which is consistent with Deatonrsquos (2007) observation that income does not explain cross-
country height differences4 This is reflected in panel (a) of figure 2 which plots the residuals
after regressing height of children under 3 years old on the log of GDP against the residuals
after regressing open defecation on the log of GDP The association remains and the R2
is similar sanitation linearly explains 542 percent of variation in child height and the
sanitation residual explains 539 percent of the variation in the height residual
Panel (b) of figure 2 adds average height and exposure to open defecation in wealth subsets
of Indiarsquos 2005 DHS to the basic plot of country mean height and sanitation Included in
published DHS data is a classification of households into wealth quintiles based on asset
ownership Average height of children within these groups is plotted against the rate of
open defecation among all households in the primary sampling unit where they live that is
the local open defecation to which they are exposed Additionally I follow Tarozzi (2008)
in identifying an elite top 25 percent of the Indian population children who live in urban
homes with flush toilets that they do not share with other households whose mothers are
literate and have been to secondary school and whose families have electricity a radio
a refrigerator and a motorcycle or car Even these relatively rich children are shorter
than healthy norms this is expected because 7 percent of the households living near even
these rich children defecate openly Indeed the graph shows that their stunted height is
approximately what would be predicted given the open defecation in their environment
More broadly the association between height and sanitation among these wealth groups is
close to the the international trend computed from country means Exposure to nearby open
defecation linearly explains 995 percent of the variation in child height across the five asset
4GDP per capita statistically significantly interacts with open defecation to predict height =heightcy minus142 minus 118 open defecationcy +014 ln (GDP ) minus 059 open defecationcy times ln (GDP ) where open defeshycy cy cation and GDP are demeaned the coefficients on open defecation and the interaction are statistically sigshynificant at the 001 level and GDP is statistically significant at the 005 level Thus the slope on ln(GDP) would be 036 with no open defecation but only 0038 at Indiarsquos 2005 level of open defecation consistent with the low apparent effect of recent Indian economic growth on stunting Although it is difficult to interpret this result causally one possibility is that private health inputs such as food do less to promote child height in a very threatening disease environment I thank Angus Deaton for this suggestion
9
quintiles
221 A geographic or genetic artifact
Perhaps people who live in certain countries or regions tend to be tall or short and this is
coincidentally correlated with open defecation Is the result driven by certain countries or
regions or fixed differences such as genetics
Figure 3 presents initial evidence against this possibility The sample is restricted to
countries with more than one DHS observation and country means across collapsed DHS
surveys are subtracted from the height and sanitation survey averages The figure plots the
difference in a country-yearrsquos height from that countryrsquos mean across DHS surveys against
the difference in sanitation The slope is similar to the undifferenced plot Moreover panel
(b) continues to demonstrate an association despite not including any data from India
Returning to table 1 column 4 adds country fixed effects A control is also added for the
average height of mothers of measured children this is in anticipation of a possibility observed
by Deaton and Dreze (2009) and considered in more depth in section 43 that Indian stunting
is not caused by current nutritional deprivation or sanitary conditions but is instead an effect
of historical conditions that stunted the growth of women who are now mothers restricting
childrenrsquos uterine growth DHS surveys are categorized into six global regions5 column 5 adds six region-specific linear time trends r δryeary to rule out that the effect is driven by
spurious changes in specific parts of the world Neither of these additions importantly change
the estimate of the coefficient although adding so many controls increases the standard
errors
Table 2 further confirms that no one region is responsible for the results The association
between height and sanitation is replicated in regressions that omit each of the six world
regions in turn The coefficient near 1 notably remains when South Asian observations are
5The regions are sub-Saharan Africa South Asia the Middle East amp North Africa Central Asia East amp Southeast Asia and Latin America
10
omitted again suggesting that the result is not merely reflecting India
222 A statistical coincidence Omitted and placebo variables
Across rich and poor places good conditions are often found together and problems are often
found in places with other problems Would any measure of infrastructure governance or
welfare be as correlated with height as is sanitation
Column 6 of table 1 adds time-varying controls These include female literacy which is
an important predictor of child welfare and accessibility of water supply all also from the
DHS6 Development outcomes are often attributed to good ldquoinstitutionsrdquo the set of controls
includes the polity and autocracy scores from the Polity IV database With these controls
added the association between height and sanitation is essentially unchanged7
Table 3 isolates each of these alternative independent variables in turn None of these
ldquoplacebordquo predictors matter for child height conditional on sanitation and and GDP8 In
particular conditional on sanitation and GDP child height is not associated with other
types of infrastructure (electrification water) governance (a democratic polity autocracy)
female literacy or nutritional measures such as food availability the breastfeeding rate9 or
the fraction of infants who are fed ldquoother liquidsrdquo beyond breastmilk in the last 24 hours
6Despite the frequency of undifferentiated references to ldquowater and sanitationrdquo improving water supply and reducing open defecation have very different effects on child health and other outcomes and should not be conflated (Black and Fawcett 2008)
7If controls for the fraction of infants ever breastfed the fraction of infants breastfed within the first day and the fraction of infants fed ldquoother liquidsrdquo in the past 24 hours are further added as measures of the quality of infant nutrition the coefficient on open defecation in panel A with all controls becomes larger in absolute value -159 with a standard error of 082 This is not statistically significantly larger than the other estimates
8Some of them do predict child height in a less thoroughly controlled specification For example in the first column if GDP is removed the coefficient on female literacy almost doubles and becomes statistically significant at the 01 level
9Breastfeeding is an especially important variable because India has high levels of open defecation short children and poor breastfeeding In a regression with open defecation country fixed effects log of GDP the fraction of children ever breastfed and the fraction of children breastfed on the first day neither breast-feeding variable is statistically significant (t of 023 and 06 respectively) but open defecation has a similar coefficient of -0849 statistically significant at the two-sided 01 level (n = 139) If open defecators per square kilometer is used in place of the open defecation fraction again it is statistically significant (t = minus6) and the breastfeeding variables are not
11
223 Mechanism Interaction with population density
If open defecation is indeed stunting childrenrsquos growth by causing chronic enteric infection
then height outcomes should be consistent with this mechanism In particular children who
are more likely to be exposed to other peoplersquos fecal pathogens due to higher population
density should suffer from larger effects of open defecation For example Ali et al (2002)
show that higher population density is associated with greater cholera risk in a rural area of
Bangladesh and Spears (2012a) finds a greater effect of Indiarsquos Total Sanitation Campaign
in districts with higher population density
To test this conjecture I construct a crude measure of ldquoopen defecators per square
kilometerrdquo the product of population density per square kilometer times the fraction of
people reporting open defecation Figure 4 reveals that this measure of exposure to fecal
pathogens (in logs due to wide variation in population density) visibly predicts average
child height The regression in panel (a) of the figure explains 65 percent of variation in
child height Notably India occupies the bottom-right corner of the graph with high rates
of open defecation and very high population density
Does population density add predictive power beyond open defecation alone The final
column of table 1 adds an interaction between open defecation and population density The
interaction term is statistically significant and the interaction and population density are
jointly significant with an F263 statistic of 45 (p = 00149) in column (a) and F257 statistic
of 45 (p = 00155) in column (b)
A further implication of this mechanism is that open defecation will have a steeper
association with child height in urban places than in rural places (Bateman and Smith 1991
Bateman et al 1993) Table 4 investigates this using two additional collapsed datasets one
containing only the urban observations in each DHS survey and one containing only the
rural observations Although GDP per capita is not available for urban and rural parts
of countries urban and rural womenrsquos height controls can similarly be computed from the
12
DHS In all cases the urban coefficient on open defecation is greater than the whole-country
coefficient and the rural coefficient is smaller Hausman tests (reported under the open
defecation coefficients in columns 5 through 7) verify that urban coefficients are larger than
rural coefficients from the corresponding specifications
224 Mechanism A gradient that steepens with age
Height-for-age z scores are computed by age-in-months so that in principle the heights of
children of different ages can be pooled and compared If international reference charts were
genetically or otherwise inappropriate for some countries we might expect a consistent gap
across children of different ages analogous to a country fixed effect However stunting in
India and elsewhere develops over time childrenrsquos mean z-scores fall relative to the norm
until about 24 months of age where they flatten out This is consistent with early-life
health deprivation causing a steepening ldquogradientrdquo between health and economic status
more steeply negatively sloped as children age (Case et al 2002) If the association between
height and sanitation were indeed the unfolding result of accumulating exposure to fecal
pathogens then it is plausible that the association would become steeper over the first two
years of life at a rate that flattens out
Figure 5 plots the coefficients from estimating the basic equation 1 separately for collapsed
means of children in four age groups 0-5 months 6-11 months 12-23 months and 24-35
months Thus as in the rest of this section of the paper each coefficient is computed in
a regression with 140 country means but now these height means only include children in
subsets of the age range The independent variable ndash country-wide open defecation ndash is the
same in each regression
Two conclusions are visible in the figure First the gradient indeed steepens in age at a
rate that flattens Second the mean height of Indian children in the 2005 NFHS-3 is plotted
for reference The curve has a similar shape to the age pattern of the coefficients This
suggests that a fixed exposure to open defecation could be scaled into a similar shape as the
13
Indian height deficit by an increasing association between sanitation and height
23 The gap between South Asia and sub-Saharan Africa
Although people in South Asia are on average richer than people in sub-Saharan Africa
children in South Asia are shorter on average and open defecation is much more common
there How much of the South Asia-Africa gap can sanitation statistically explain at the
level of country averages
Table 5 estimates regressions in the form of equation 1 with the sample restricted to
countries in South Asia and sub-Saharan Africa and with an indicator variable added for
data from South Asia Of the 140 DHS surveys in figure 1 11 are from South Asia and 78
are from sub-Saharan Africa In these data children in South Asia are on average about
one-third of a height-for-age standard deviation shorter10
How do further controls change the estimate of this South Asia indicator Merely linshy
early controlling for open defecation reduces the gap by 30 percent from 0360 to 0253
Controlling instead for the number of people openly defecating per square kilometer (the
product of population density and the open defecation rate column 4) reduces the coefficient
by 83 percent to 0061 Column 5 verifies that this result is not merely a misleading effect
of population density controlling for which increases the gap
Pairs of columns 6-7 and 8-9 demonstrate the statistical robustness of the explanatory
power of the density of open defecation After controlling for the log of GDP per capita
adding a further control for open defecators per square kilometer explains 73 percent of the
(larger) remaining gap The density of open defecation reduces by 92 percent the height
10 Jayachandran and Pande (2012) using individual-level DHS data from Africa and South Asia suggest that first-born South Asian children are taller than first-born African children The country-level data studied here however show no similar reversal If country means are computed using only first-born children I find that South Asian children are 022 standard deviations shorter (se = 005) a reduction but not an elimination of the 036 gap in table 5 In this sample of country means of first-borns the gap falls to 015 with a control for open defecation and to 008 with a control for open defecation per square kilometer In the full sample of country-level means of first-borns analogously to column 1 of table 1 moving from an open defecation rate of 0 to 1 is linearly associated with a decline in height for age of 111 standard deviations
14
gap after controlling for both log of GDP and year fixed effects Sanitation initially appears
to explain much of the Africa-South Asia gap in child height Section 44 considers the
decomposition of this difference in more detail using child-level height data
3 Evidence from differences within Indian districts
How much of the change over time in Indian childrenrsquos height is accounted for by the increase
over time in sanitation coverage One challenge to answering this question well is that
unfortunately improvements in sanitation in India have been slow As an illustration in its
2005-6 DHS 553 percent of Indian households reported open defecation and the mean child
was 19 standard deviations below the reference mean this combination is almost identical
to neighboring Pakistanrsquos in its 1990-1 DHS 15 years earlier when 531 percent of households
did not use a toilet or latrine and the mean height for age was 2 standard deviations below
the mean This section studies change over time within India by constructing a panel of
districts out of Indiarsquos 1992-3 and 1998-9 DHS surveys
31 Data and empirical strategy
The National Family and Health Surveys (NFHS) are Indiarsquos implementation of DHS surveys
This section analyzes a district-level panel constructed out of the NFHS-1 and NFHS-211
Districts are political subdivisions of states Some districts merged or split between survey
rounds so households in the survey are matched to a constructed ldquodistrictrdquo that may be
a coarser partition than actual district boundaries In particular a primary sampling unit
(PSU) is assigned to a constructed district such that all splits and merges are assigned to the
coarser partition creating the finest partition such that each PSU is in the same constructed
district as all PSUs which would have shared a district with it in either period Thus if there
were two districts A and B in the first round which split before the second round into A
11The third and most recent NFHS does not include district identifiers
15
B and C (a new district containing part of A and of B) then all of A B A B and C
would be a single constructed district although splits this complicated are rare12
The empirical strategy of this section is to compare the heights of rural children under
3 years old in the NFHS rounds 1 and 2 using district fixed effects13 In particular I
regress child height on the fraction of households reporting open defecation at two levels of
aggregation districts and villages (or more precisely rural primary sampling units) Because
open defecation has negative externalities on other households it is necessary to test for
effects of community-wide sanitation coverage rather than simply comparing households
that do and do not have latrines section 41 considers the econometric implications of these
negative externalities in more detail
Therefore the regression specification is
heightidvt = β1open defecationd dvt +αd +γt +Xidvtθ +Aidvtϑ +εidvt (2)dt +β2open defecationv
where i indexes individual children d are districts v are villages (rural PSUs) and t are
survey rounds 1 and 2 The dependent variable heightidvt is the height of child i in standard
deviations scaled according to the WHO 2006 reference chart As recommended by the
WHO outliers are excluded with z-scores less than -6 or greater than 6 The independent
variables open defecationd and open defecationv are computed fractions 0 to 1 of households dt dvt
reporting open defecation in the childrsquos district and village respectively Fixed effects αd and
γt are included for districts and survey rounds The vector Aidvt is a set of 72 indicators for
age-in-month by sex one for each month of age for boys and for girls14 Controls Xidvt are at
the household or child level electrification water supply household size indictors for being
12The NFHS was not constructed to reach all districts so households are only included in the sample if they are members of districts that appear in both survey rounds to permit district fixed effects
13Although district fixed effects are used the NFHS did not survey the same villages in the two survey rounds thus there remains an important cross-sectional component to the heterogeneity studied
14Panagariya (2012) has recently argued that height-for-age z score reference charts are inappropriate for Indian children because age-in-months-by-sex is the level of disaggregation used to create height-for-age scores these controls fully and flexibly account for any deviation between the mean height of Indian children and the reference charts
16
Hindu or Muslim a full set of birth order indicators interacted with the relationship of the
childrsquos mother to the head of the household twinship indicators and month-of-birth indicashy
tors15 Results are presented with and without controls and fixed effects to verify robustness
The mean PSU studied here contains 10 children under 3 used in these regressions
32 Regression results
Table 6 presents results from estimations of equation 2 with simple OLS in Panel A and
district fixed effects in Panel B Districts which saw greater differences in sanitation also
present greater differences in child height
District-level open defecation rates do not statistically significantly predict child height
once village-level open defecation is included which plausibly suggests that villages are much
nearer than districts (which are much larger than villages) to capturing the geographic extent
of sanitation externalities Village-level open defecation predicts child height with or without
district fixed effects and with or without individual controls16 The coefficient on village open
defecation is smallest in absolute value with fixed effects and controls17 although it is not
statistically significantly different from the other estimates this could reflect the well-known
attenuating bias of fixed effects if much of the important variation in sanitation that is
causing variation in height has been captured by other controls leaving noise remaining18
15If the survey rounds were conducted in different places in different times of year different children would be under 36 months old Month of birth is correlated with early-life human capital inputs (cf Doblhammer and Vaupel 2001 about developed countries)
16If instead of omitting observations with height-for-age z-score beyond plusmn6 a cut-off of plusmn10 is used then results are very similar For example the coefficient in column 1 of panel A becomes -0768 (0222) the smallest coefficient in absolute value column 3 in Panel B becomes -0292 (0138) If the log of height in centimeters is used as the dependent variable instead of the z score moving from 0 percent to 100 percent open defecation is associated with an approximately 2 percent decrease in height (t asymp 4 analogously to column 2 of panel B)
17Would any village-level (instead of household-level) asset or indicator of well-being have the same effect as sanitation Adding village electrification and water averages to the most controlled regression column 3 of panel B changes the point estimate on open defecation only slightly from -035 to -033 (se = 012) these two village level variables have t-statistics of 115 and -059 respectively with a joint F -statistic of 073
18For readers concerned about this possibility regressing height on village-level open defecation with no district or time fixed effects produces an estimate of -0700 (t asymp 45) and of -00501 (t asymp 48) with all the non-fixed-effect controls
17
Consistency of fixed effects estimates which subtract level differences across groups
depends on a properly linear specification Column 4 demonstrates that a quadratic term
for village-level open defecation is not statistically significant and indeed changes signs
with and without district fixed effects Potential non-linear relationships between village
sanitation coverage and child height will be considered in more detail in 412
4 Evidence from pooled Indian and African surveys
Do differences in village-level sanitation coverage explain the difference in height between
rural children in India and in sub-Saharan Africa If so is this just a spurious reflection of
other correlated variables This section addresses these questions using pooled child-level
data from the rural parts of nine DHS surveys Indiarsquos 2005-6 NFHS-3 and eight surveys from
Africa in the 2000s19 In particular the DHS surveys nearest 2005 (and balanced before and
after) were selected from the five largest African countries available20 the included countries
account for 46 percent of the 2012 population of sub-Sahara Africa
The argument of this section proceeds in several stages building to a statistical decomshy
position of the India-Africa height difference in the sense of Oaxaca-Blinder First section
41 verifies an association between village-level sanitation and height within the two regions
In particular this section assesses the linearity of the relationship (assumed by some decomshy
position techniques) and notes that a village-level effect implies the presence of negative
externalities Then section 42 considers a paradox implied by Deatonrsquos (2007) finding that
height is not strongly associated with GDP the within-region association between open defeshy
cation and well-being has a different slope from the across-region association Next section
19Here I again follow the WHO recommendation of dropping observations with height-for-age z-scores more than 6 standard deviations from the mean
20This excludes South Africa where height has not been measured in a DHS survey Beyond this data availability constraint this exclusion may be appropriate due to South Africarsquos unique history and demogshyraphy its exceptionally high sanitation coverage (116 percent open defecation in 1998) would make it a positive outlier even in the African sample The eight African DHS surveys used are DRC 2007 Ethiopia 2000 and 2005 Kenya 2005 and 2008 Nigeria 2003 and 2008 and Tanzania 2004 DHS sampling weights are used throughout
18
43 considers an alternative account of stunting in India could it be a mere effect of short
mothers causing restricted fetal growth reflecting historical conditions and not a healthy
environment that might exist today Finally section 44 proceeds with the decomposition
applying linear and non-parametric approaches to explain the India-Africa gap
41 Effects of village sanitation A negative externality
As a first step towards explaining the height difference between Indian and African children
this section verifies that village-level open defecation predicts childrenrsquos height within each
region As in section 3 I use household-level DHS data to find the fraction of households in a
PSU reporting open defecation which I treat as an estimate of village-level open defecation
Thus separately for each region r Africa and India I estimate
heightivcr = β1open defecationv + β3open defecation2 + β3open defecationi vcr vcr ivcr+
(3) αc + Xivcrθ + Aivcrϑ + εivcr
where i indexes individual children under 5 v are villages (rural PSUs) c are country-years
(DHS surveys) in Africa and states in India and r are regions (India or Africa) The deshy
pendent variable heightivcr is the height of child i in standard deviations scaled according
to the WHO 2006 reference chart The independent variable open defecationv is the comshyvcr
puted fraction 0 to 1 of households reporting open defecation in the childrsquos village (again
implemented as rural primary sampling unit) with a quadratic term included in some specshy
ifications Household-level open defecation open defecationi ivcr is an indicator 0 or 1 for the
childrsquos household Including both household and village-level open defecation tests whether
one householdrsquos open defecation involves negative externalities for other households21 In
other words is it only a householdrsquos own sanitation that matters or do other householdsrsquo
sanitation matter even controlling for onersquos own
21Gunther and Finkrsquos (2010) working paper version of Fink et al (2011) conducts a similar analysis regressing diarrhea and child mortality on household and cluster-mean water and sanitation variables
19
Fixed effects αc are included for some specifications As before the vector Aivcr is a set
of 72 indicators for age-in-month by sex one for each month of age for boys and for girls
Finally Xivcr is a vector of child or household level controls indicators for household dirt
floor access to piped water electrification and ownership of a TV bicycle motorcycle and
clean cooking fuel and the childrsquos motherrsquos literacy knowledge of oral rehydration age at
first birth count of children ever born and relationship to the head of the household These
controls help ensure that any correlation between height and open defecation is unlikely to
reflect mere wealth differences
411 Regression results
Figure 6 plots separately for the African and Indian samples the local polynomial regresshy
sions of child height on village open defecation separating households that do and do not
defecate openly The figures make clear the distinct private and social benefits of sanitation
The private benefit is the vertical distance between the two lines thus in an average Indian
village children in households that do not openly defecate are about half of a standard devishy
ation taller than children in households that do The social benefit ndash a negative externality
on other households ndash is visible in the downward slope of the regression lines children living
in villages with less open defecation overall are taller on average Of course some fraction
of these correlations also reflects omitted variable bias The dashed vertical lines show that
open defecation is much more common in the Indian than in the African data Moreover
children in households that do not practice open defecation are shorter in Africa than in
India at all levels of village open defecation
Table 7 verifies the statistical significance of these results and estimates regression equashy
tion 3 In both samples there is a clear association between child height and village-level
sanitation Especially in the Indian sample the estimate changes little when controls are
added The coefficient on household-level sanitation is less robust in the Indian sample
it becomes much smaller when household and child controls are added and in the African
20
sample it loses statistical significance
412 Linear effects on height
So far this paper has largely studied linear regression A non-linear relationship between
sanitation and height could be important for two reasons first fixed effects regression could
be inconsistent and second a linear Blinder-Oaxaca decomposition could be inappropriate
Returning to figure 6 the relationship between sanitation and height appears approximately
linear in the Indian data but may not be among openly-defecating households in the African
data
Non-linearity can be tested by adding a quadratic term Already in table 6 a quadratic
term was not statistically significant in the first two Indian DHS surveys Panel A finds
again that in the Indian NFHS-3 there is no evidence for a quadratic term In contrast
Panel B does find a quadratic term in the African sample In light of the evidence for the
importance of open defecation per square kilometer presented in section 223 one possible
explanation for this negative quadratic term is that population density is relatively low in
these African countries so open defecation is not as important for health until there is more
of it unfortunately geographic data such as population density is not generally available at
the DHS PSU level
Many sanitation policy-makers claim that there is a discontinuous increase in health when
open defecation is fully eliminated This belief was importantly popularized by Sanan and
Moulik (2007) who assert that ldquopublic health outcomes can be achieved only when the entire
community adopts improved sanitation behavior the area is is 100 percent open defecation
free and excreta safely and hygienically confinedrdquo (4)22 Whether the relationship between
sanitation and health is linear or another shape it is clear from figure 6 that there is no
22This conclusion was based on a study by an organization called Knowledge Links in three villages of Himachal Pradesh which found a ldquoprevalence of diarrheardquo of 26 percent in a village where 95 percent of households used toilets and of 7 percent in a village where 100 percent used toilets Also see Shuval et al (1981)
21
discontinuity at zero open defecation Moreover the statistically significant quadratic terms
in Panel B of table 6 are negative which suggests that if anything effects of village-level
sanitation on height are smaller near perfect coverage in that sample
42 A paradox International differences in well-being
Deaton (2007) finds that international differences in height are not well explained by differshy
ences in GDP or infant mortality How could this be given that poor sanitation increases
infant mortality (Spears 2012a) and richer people are more likely to have toilets or latrines
Figure 7 suggests that this puzzle is an example of Simpsonrsquos Paradox within separate
subsets of a larger sample the relationship between two variables can be very different from
the relationship between the two variables in the larger pooled sample23 In particular
the relationship in the pooled data also depends upon the relationship among group means
Consider a large dataset partitioned into subsets indexed s isin S Let β be the OLS coefficient
ˆof y on x in the whole pooled dataset and βs the OLS coefficient found when the data
ˆare restricted to subset s Further let βb be the ldquobetweenrdquo regression coefficient found
by regressing subsample means ys on xs weighted by the number of observations in each
subsample Then ˆ ˆ ˆβ = λsβs + λbβb (4)
sisinS
where the weights λs are the fractions of the total sum of squares in each subsample s and
λb is the fraction of the sum of squares from the subsample means Therefore if the between
coefficient is very different from the within coefficients the pooled coefficient computed from
the entire dataset could also be quite different from the within-subsample slopes
Figure 7 plots within-region between and pooled slopes to clarify this paradoxical case
Within both the Indian and African subsamples more village-level open defecation is indeed
associated with more infant mortality and less wealth However India has more open defecashy
23The difficulties involved in inferring relationships about individuals from group average data are also sometimes referred to as the problem of ldquoecological inferencerdquo
22
tion lower infant mortality and more wealth represented by the plotted circles Therefore
the pooled regressions are essentially flat potentially misleadingly showing no association
between open defecation and infant mortality or a count if household assets included in the
DHS ndash consistently with Deatonrsquos original result
43 Do short mothers cause short children
One candidate explanation for widespread stunting among Indian children that Deaton and
Dreze (2009) highlight is that Indian mothers are small What if there were a direct effect ndash
independent of genetics and of the rest of the environment ndash of a too-small mother causing
restricted intrauterine growth leading to lasting stunting If so then in principle Indian
children could be short on average despite healthy modern environments and adequate
nutrition merely because their mothers were stunted by depravations of the past
Both the possible existence of this mechanism and any plausible magnitude are debated
in the medical and epidemiological literature Discussion dates to Ounsted et alrsquos (1986)
classic paper which matched data on the birth weight of 1092 children born in Oxford UK
with self-reported birth weights of family members to show that very low or very high birth
weight babies are likely to have parents that are low or high birth weight respectively with
a greater correlation with mothers than fathers From this they hypothesize that mothersrsquo
own in utero deprivations can restrict fetal growth of the children they have as adults
Although some later scholarship has criticized the conclusion that the constraint dates back
to a motherrsquos fetal development24 it is much more widely accepted that a motherrsquos size and
net nutrition before and during pregnancy influence her childrsquos birth weight and subsequent
growth (Martorell and Zongrone 2012 Chiolero 2010) For example Ceesay et al (1997)
24In 2008 the paper was republished for commentary in the International Journal of Epidemiology disshycussion noted that clean causal identification is rare in this debate Leon (2008) summarizes that ldquo[Ounsted et alrsquos (1986)] ideas about the prepotency of maternal constraint are of less value and the hypothesis that in humans the degree of constraint a mother exerts on her offspringrsquos fetal growth is set by her own in utero experience is not supported by [their] own data or that published subsequentlyrdquo (258) Magnus (2008) and Cnattingius (2008) essentially agree although also see Hanson and Godfrey (2008) and Horta et al (2009)
23
find that daily dietary supplementation for pregnant women in rural Gambia increased birth
weight and Kanade et al (2008) document in observational data that Indian mothers who
ate more fat and micronutrients during pregnancy had larger babies
Is it possible that historical conditions that restricted Indian mothersrsquo size but have now
improved are importantly restricting the fetal growth of their children This question is
difficult to answer in part because there are at least five reasons mothersrsquo and childrenrsquos height
would be correlated (1) motherrsquos genetics (2) assortative mating and fatherrsquos genetics (3)
correlation of the childrsquos early-life environment with the motherrsquos early life environment
(4) endogenous effects of mothersrsquo early life environments on their adult ability to care for
their children (including in utero and through marriage markets) and finally (5) intrauterine
growth restriction directly caused by the historically determined aspects of a motherrsquos size
Although all five would be reflected in a simple regression of child size on motherrsquos size
only the last mechanism would allow mothersrsquo stunting to itself cause present-day childrenrsquos
stunting
Arguing that ldquovariability in stature among young children is often ascribed to to health
and nutrition differences in malnourished populations and to genetic differences in well-
nourished populationsrdquo Martorell et al (1977) hypothesized that parent-child height corshy
relation would be greater in the US than in Guatemala This is consistent with a model
in which height h is the sum of two uncorrelated factors genetics g and environment e so
h = g + e Then assuming that child genetics are a weighted sum ω of motherrsquos and fatherrsquos
genetics so gc = ωgm + (1 minus ω)gf and that environmental shocks are uncorrelated across
generations then the mother-child correlation of height is
ωσg 2
σ2 + σ2
g e
where σ2 is variance In rich countries where there is little relevant variance in environmental
conditions height correlations will be high
24
Now consider a direct effect of magnitude ρ gt 0 of motherrsquos height on childrsquos height
so hc = gc + ρhm + ec To avoid unilluminating complications of infinite regress ignore this
mechanism in mothersrsquo generation so hm = gm + em 25 Now mother-child height correlation
is ωσg
2
ρ + σ2 + σ2 g e
which will be greater than in the case without ρ because of the additional link between
generations Therefore if conditions are such that ρ is quantitatively important in a poor
country ndash perhaps due to rapid change across generations in environmental conditions ndash but
not in a richer country the intergenerational height correlation could be greater in the poorer
country
Figure 8 plots mother-child height correlations from the Indian and African DHS samples
used in this sample and for the US from the National Longitudinal Study of Youth 1979
NLSY data used span several calendar years each childrsquos height is used in the year he or
she is five years old The correlation computed from the NLSY 041 is comparable to other
correlations computed from developed country data (Livson et al 1962) It is also consistent
with the formula above if ω = 05 and σe 2 is small
Two conclusions emerge from the figure First the correlation computed for Indian
children ndash although greater than that in the African data ndash is much below the correlation for
US children suggesting that any ρ a direct causal effect of motherrsquos height on childrenrsquos
height may not be large Second the correlation between mothersrsquo and childrenrsquos height
is lower within both India and Africa in villages with more open defecation which is
consistent with an important role for σe 2 and with Martorell et alrsquos (1977) conjecture that
environmental variation will be more important relative to genetics in poorer places
25Perhaps environmental conditions were so consistently bad in past generations that intrauterine restricshytion on fetal growth due to large intergenerational differences in environmental conditions were not a binding constraint
25
44 Decomposing the gap
Decomposition methods estimate the fraction of a difference between two groups that is
statistically explained by differences in other variables (Fortin et al 2011) Decomposition
techniques are commonly applied to wage inequality in labor economics and to demographic
rates Like any econometric analysis of observational data whether decomposition results
have a causal interpretation depends on the context and the sources of variation in indepenshy
dent variables This section estimates the fraction of the India-Africa height gap statistically
ldquoexplainedrdquo by differences in village-level sanitation a main result of the paper
441 Methods of decomposition
Three methods of decomposition are used The first is a straightforward application of
regression as in table 5 I regress
heightivs = αIndias + βopen defecationv (5)vs + Xivsθ + εis
where heightivs is the height-for-age z score of child i in village v in sample s either India or
Africa The coefficient of interest is α on an indicator variable that the child lives in India
The econometric question is by how much adding a control for village level open defecation
shifts α in the positive direction This is essentially identical to the pooled Blinder-Oaxaca
decomposition with an indicator for group membership recommended by Jann (2008) The
statistical significance of the change in α is evaluated with a Hausman χ2 test Various sets
of control variables Xivs are added in turn which will in general change both α and β
The second method is a weighted two-way Blinder (1973)-Oaxaca (1973) decomposition
using a Stata implementation by Jann (2008) In particular having seen in section 42 that
open defecation has different correlations within and across the Indian and African samples
26
I implement Reimersrsquos (1983) recommendation to first estimate
heightivs = βsopen defecationvs + Xivsθs + εis (6)
separately for each sample s and then compute the difference in height ldquoexplainedrdquo by open
defecation as
05βIndia + 05βAfrica open defecationvAfrica minus open defecationvIndia (7)
creating a counterfactual ldquoeffectrdquo of sanitation by weighting equally the within-sample slopes
The third method is a non-linear decomposition which computes a new mean for the
Indian sample after reweighting to match the African samplersquos distribution of a set of obshy
servable independent variables26 In particular the approach is to construct a counterfactual
mean height of Indian children First partition both samples into groups g isin G(X) which
share values or ranges of values of a set of covariates X (which could include measures of
open defecation) Next for each group compute f(g |s) the empirical density of sample
s isin India Africa in group g using sampling weights Finally compute the counterfactual
mean f(g |Africa)
hIndia = wihi (8)f(g |India)
gisinG(X) iising
where wi is the sampling weight of observation i and hi is the height-for-age z-score of child i
in the Indian sample The unexplained gap is then hIndia minushAfrica The basic set of reweighting
variables used is village and household open defecation split into 20 groups corresponding
to 10 levels of village open defecation for households that do and do not openly defecate
26Geruso (2012) recently applied this approach to compute the fraction of the US black-white life exshypectancy gap that can be explained by a group of socioeconomic variables
27
442 Decomposition results
Table 8 presents the decomposition results Panel A reports the change in the OLS coefficient
on a dummy variable for India when a linear control for village-level open defecation is
included as in table 5 Panel B reports the change in the unexplained difference when
open defecation is added to a weighted Blinder-Oaxaca decomposition Panel C presents
counterfactual differences from non-parametrically weighting the Indian sample to match
the distribution of village and household open defecation in the African sample
Columns 1 and 2 present the basic result the simple sample mean with no controls
with and without adjustment for sanitation Village-level open defecation linearly explains
99 percent of the India-Africa gap27 In the Blinder-Oaxaca and non-parametric decomposishy
tions sanitation explains more than 100 percent of the gap this ldquoovershootingrdquo is plausible
because in addition to having worse sanitation Indian households are richer on average
than African households
The next four pairs of columns similarly find that open defecation explains much of the
India-Africa gap after controls are added Specifically columns 3 and 4 control for demoshy
graphic variables before decomposing the remaining gap sex-specific birth order indicators
and an indicator for single or multiple birth28 Columns 5 and 6 first control for a vector of
socioeconomic controls the same controls used earlier in equation 3 Columns 7 and 8 conshy
trol for a village-level estimate of infant mortality computed from mothersrsquo reported birth
27Household-level open defecation used instead of village-level explains 68 percent of the gap a reminder of the importance of disease externalities
28Jayachandran and Pande (2012) note that birth order is a predictor of child height in India (see footnote 10) For example in the sample of rural children under 5 used here I find that first children are 0063 (p = 0044) standard deviations taller than second children However this gap falls to 0034 (p = 0275) if controls for village and household open defecation are included (jointly significant with F2 asymp 95) suggesting that children born into larger households may be more likely to be exposed to environmental fecal pathogens although various forms of intra-household discrimination surely exist as well (cf Jeffery et al 1989)
Jayachandran and Pande (2012) also find in their pooled DHS sample that Indian first-borns are taller than African first-borns In the individual-level sample studied here Indian first-borns are 0019 standard deviations shorter (a much smaller gap than in the full sample but still negative) controlling for open defecation they are 0133 standard deviations taller a 015 increase similar to those when sanitation is controlled for in table 8 If for example IMR is controlled for Indian first-borns are 0132 standard deviations shorter than African first-borns which increases by 016 to Indians being 0025 taller
28
history Finally columns 9 and 10 control for mothersrsquo height Because Indian mothers like
Indian children are short Indian children are taller than African children conditional on
their mothersrsquo height However section 43 has discussed evidence that this correlation is
unlikely to be quantitatively importantly causal and the counterfactual increase in Indian
height from matching African sanitation continues to exceed the original simple gap to be
explained even after adjustment for mothersrsquo height
The level of the India-Africa height gap depends on the particular set of controls added
before sanitation is accounted for However the counterfactual change in height upon acshy
counting for open defecation is strikingly similar across specifications In particular the
flexible non-parametric decomposition in Panel C might best accommodate any shape of the
height-sanitation association In all cases non-parametrically matching the African distrishy
bution of open defecation increases the counterfactual Indian mean height by more than the
0142 standard deviation simple difference in means
5 Discussion How much does sanitation explain
Several dimensions of variation in open defecation quantitatively similarly predict variation
in child height heterogeneity in aggregated country means changes within Indian districts
and variation across village-level averages Moreover Spears (2012a) and Hammer and
Spears (2012) document causally well-identified estimates of effects of sanitation on height
Finally in the sense of econometric decomposition exceptionally widespread open defecation
can explain much of exceptional Indian stunting So how much taller would Indian children
be if they enjoyed better sanitation and less exposure to fecal pathogens
51 A linear thought experiment
To answer the question above would require knowing the true average causal effect of open
defecation on Indian children However one can envision possible answers by comparing a
29
range of estimates of the association between height and open defecation each reflecting its
own particular context and combination of internal and external validity
Children in rural India are on average 0142 standard deviations shorter than children
in the rural African sample in section 4 open defecation is 316 percentage points more
common in India Therefore imagining a linear causal effect of sanitation β the fraction of
the rural India-Africa height gap that open defecation rates would explain would be whatever
fraction β is of a 045 (= 0142 divide 0316) standard deviation increase in height resulting from
moving from 100 percent to 0 percent open defecation Children in India where 55 percent
of households openly defecated in the DHS are about 2 standard deviations shorter than
the reference mean Whatever fraction β is of 36 would be the fraction of the India-US
gap explained
Table 9 collects estimates of the linear association between height and open defecation
from this paper and others As in section 442 ldquoexplainingrdquo over 100 percent of the gap is
plausible because wealth differences predict that Indian children should be taller than African
children Unsurprisingly the instrumental variable treatment-on-the-treated estimate in
Hammer and Spearsrsquos (2012) small experimental sample has a large confidence interval
Both this estimate and Spearsrsquos (2012a) may overstate the direct effect of latrines per se
because the programs studied also promoted use of existing latrines
Like many regression estimates of the effects of inputs on human capital some of these
may be biased upwards Collectively however they suggest that the best linear approximashy
tion to the true average causal effect of village-level sanitation coverage on Indian childrenrsquos
height is likely to be a large fraction of 045 (ignoring the additional explanatory power of
population density) If so then sanitation could explain much or all of the difference in
heights between Indian and African children
30
52 Conclusion Stunting ldquomalnutritionrdquo and externalities
Section 41 presented evidence that one householdrsquos open defecation imposes negative extershy
nalities on its neighbors Village-level externalities are important for at least two reasons
First negative externalities are a classic rationale in public economics for government inshy
tervention if households do not consider the effect of their own open defecation on other
people they will be too reluctant to switch to using a latrine Second statistical approaches
that only study private resources will be unable to fully explain heterogeneity in height
For example Tarozzi (2008) finds that even Indian children in the richest households in the
NFHS (that is with the most assets) are still shorter than international reference norms
Panagariya (2012) interprets this result to suggest that international norms are incorrect for
Indian children because even children with ldquoelite or privilegedrdquo household health inputs are
stunted29 Yet this interpretation ignores externalities many of the asset-rich households
in the NFHS are exposed to a disease environment created by the open defecation of other
households Bhandari et al (2002) study the height of Indian children living in Green Park
a single affluent neighborhood in South Delhi these children grow to international reference
heights
Although a childrsquos low height-for-age is often called ldquomalnutritionrdquo Waterlow (2011)
has advocated instead using ldquothe term lsquostuntedrsquo which is purely descriptive and does not
prejudge the question of whether or not the growth deficit is really the result of malnutrishy
tionrdquo often narrowly interpreted as food especially in policy debates Early-life disease ndash
and especially chronic disease due to fecal pathogens in the environment ndash appears to be
another important determinant of height If so determining whether open defecation is an
importantly binding constraint on Indian childrenrsquos height may be a step towards a policy
response able to resolve this Asian enigma
29Tarozzi does recognize that his approach does not capture important effects of ldquothe epidemiological environment with its impact on infectionsrdquo (463)
31
References
Ali Mohammad Michael Emch JP Donnay Mohammad Yunus and RB
Sack 2002 ldquoThe spatial epidemiology of cholera in an endemic area of Bangladeshrdquo
Social Science and Medicine 55 1015ndash1024
Bateman O Massee and Shelley Smith 1991 ldquoA comparison of the health effects of
water supply and sanitaiton in urban and rural Guatemalardquo WASH Field Report 352
USAID
Bateman O Massee Shelley Smith and Philip Roark 1993 ldquoA comparison of
the health effects of water supply and sanitaiton in urban and rural areas of five African
countriesrdquo WASH Field Report 398 USAID
Bhandari Nita Rajiv Bahl Sunita Taneja Mercedes de Onis and Maharaj K
Bhan 2002 ldquoGrowth performance of affluent Indian children is similar to that in develshy
oped countriesrdquo Bulletin of the World Health Organization 80(3) 189ndash195
Black Maggie and Ben Fawcett 2008 The Last Taboo Opening the Door on the Global
Sanitation Crisis London Earthscan
Blinder Alan S 1973 ldquoWage Discrimination Reduced Form and Structural Estimatesrdquo
Journal of Human Resources 8 436455
Case Anne and Christina Paxson 2008 ldquoStature and Status Height Ability and
Labor Market Outcomesrdquo Journal of Political Economy 116(3) 499ndash532
Case Anne Darren Lubotsky and Christina Paxson 2002 ldquoEconomic Status and
Health in Childhood The Origins of the Gradientrdquo American Economic Review 92(5)
1308ndash1334
Ceesay Sana M Andrew M Prentice Timothy J Cole Frances Foord
Lawrence T Weaver Elizabeth M E Poskitt and Roger G Whitehead 1997
ldquoEffects on birth weight and perinatal mortality of maternal dietary supplements in rural
Gambia 5 year randomized controlled trialrdquo British Medical Journal 315 786ndash790
32
Checkley William Gillian Buckley Robert H Gilman Ana MO Assis Richard L
Guerrant Saul S Morris Kare Moslashlbak Palle Valentiner-Branth Claudio F
Lanata Robert E Black and The Childhood Malnutrition and Infection Netshy
work 2008 ldquoMulti-country analysis of the effects of diarrhoea on childhood stuntingrdquo
International Journal of Epidemiology 37 816ndash830
Chiolero Arnaud 2010 ldquoAdult maternal body size mattersrdquo International Journal of
Epidemiology 39(6) 1681
Cnattingius Sven 2008 ldquoCommentary On lsquoTransmission through the female line of a
mechanism constraining human fetal growthrsquo ndash does it existrdquo International Journal of
Epidemiology 37 252ndash254
Currie Janet 2009 ldquoHealthy Wealthy and Wise Socioeconomic Status Poor Health
in Childhood and Human Capital Developmentrdquo Journal of Economic Literature 47(1)
87ndash122
Deaton Angus 2007 ldquoHeight health and developmentrdquo Proceedings of the National
Academy of the Sciences 104(33) 13232ndash13237
Deaton Angus and Jean Dreze 2009 ldquoFood and Nutrition in India Facts and Intershy
pretationsrdquo Economic and Political Weekly 44(7) 42ndash65
Doblhammer Gabriele and James W Vaupel 2001 ldquoLifespan depends on month of
birthrdquo PNAS 98(5) 2934ndash2939
Fink Gunther Isabel Gunther and Kenneth Hill 2011 ldquoThe effect of water and
sanitation on child health evidence from the demographic and health surveys 19862007rdquo
International Journal of Epidemiology 40(5) 1196ndash1204
Fortin Nicole Thomas Lemieux and Sergio Firpo 2011 ldquoDecomposition Methods
in Economicsrdquo Handbook of Labor Economics 4a 1ndash102
Geruso Michael 2012 ldquoBlack-White Disparities in Life Expectancy How Much Can the
Standard SES Variables Explainrdquo Demography 49(2) 553ndash574
Gunther Isabel and Gunther Fink 2010 ldquoWater Sanitation and Childrens Health
33
Evidence from 172 DHS Surveysrdquo Policy Research Working Paper 5275 World Bank
Hammer Jeffrey and Dean Spears 2012 ldquoEffects of a village sanitation intervention
on childrenrsquos human capital Evidence from a randomized experiment by the Maharashtra
governmentrdquo working paper Princeton University
Hanson Mark A and Keith M Godfrey 2008 ldquoCommentary Maternal constraint
is a pre-eminent regulator of fetal growthrdquo International Journal of Epidemiology 37
254ndash255
Horta Bernardo L Denise P Gigante Clive Osmond Fernando C Barros and
Cesar G Victora 2009 ldquoIntergenerational effect of weight gain in childhood on offspring
birthweightrdquo International Journal of Epidemiology 38 724ndash732
Humphrey Jean H 2009 ldquoChild undernutrition tropical enteropathy toilets and hand-
washingrdquo The Lancet 374 1032 ndash 35
Jann Ben 2008 ldquoA Stata implementation of the Blinder-Oaxaca decompositionrdquo Stata
Journal 8(4) 453ndash479
Jayachandran Seema and Rohini Pande 2012 ldquoThe Puzzle of High Child Malnutrition
in South Asiardquo presentation slides International Growth Centre
Jeffery Patricia Roger Jeffery and Andrew Lyon 1989 Labour pains and labour
power Women and childbearing in India Zed
Joint Monitoring Programme for Water Supply and Sanitation 2012 Progress on
Drinking Water and Sanitation 2012 Update WHO and UNICEF
Kanade AN S Rao RS Kelkar and S Gupte 2008 ldquoMaternal nutrition and birth
size among urban affluent and rural women in Indiardquo Journal of the American College of
Nutrition 27(1) 137ndash145
Leon David A 2008 ldquoCommentary The development of the Ounstedsrsquo theory of maternal
constraint ndash a critical perspectiverdquo International Journal of Epidemiology 37(255-259)
Livson Norman David McNeill and Karla Thomas 1962 ldquoPooled Estimates of
Parent-Child Correlations in Stature from Birth to Maturityrdquo Science 138(3542) 818ndash
34
820
Magnus Per 2008 ldquoCommentary A need for unconstrained thinking of foetal growthrdquo
International Journal of Epidemiology 37(254-255)
Martorell Reynaldo and Amanda Zongrone 2012 ldquoIntergenerational Influences on
Child Growth and Undernutritionrdquo Paediatric and Perinatal Epidemiology 26(Suppl 1)
302ndash314
Martorell Reynaldo Charles Yarbrough Aaron Lechtig Hernan Delgado and
Robert E Klein 1977 ldquoGenetic-environmental interactions in physical growthrdquo Acta
Paeligdiatr Scand 66 579ndash584
Mondal Dinesh Juliana Minak Masud Alam Yue Liu Jing Dai Poonum Koshy
rpe Lei Liu Rashidul Haque and William A Petri Jr 2011 ldquoContribution of
Enteric Infection Altered Intestinal Barrier Function and Maternal Malnutrition to Infant
Malnutrition in Bangladeshrdquo Clinical Infectious Diseases
Oaxaca Ronald 1973 ldquoMale-Female Wage Differentials in Urban Labor Marketsrdquo Intershy
national Economic Review 14 693709
Ounsted M S Scott and C Ounsted 1986 ldquoTransmission through the female line of
a mechanism constraining human fetal growthrdquo Annals of Human Biology 13(2) 143ndash151
Panagariya Arvind 2012 ldquoThe Myth of Child Malnutrition in Indiardquo conference paper 8
Columbia University Program on Indian Economic Policies
Petri William A Jr Mark Miller Henry J Binder Myron M Levine Rebecca
Dillingham and Richard L Guerrant 2008 ldquoEnteric infections diarrhea and their
impact on function and developmentrdquo Journal of Clinical Investigation 118(4) 1266ndash
1290
Ramalingaswami Vulimiri Urban Jonsson and Jon Rohde 1996 ldquoCommentary
The Asian Enigmardquo The Progress of Nations
Reimers Cordelia W 1983 ldquoLabor Market Discrimination Against Hispanic and Black
Menrdquo Review of Economics and Statistics 65(4) 570ndash579
35
Sanan Deepak and Soma Ghosh Moulik 2007 ldquoCommunity-Led Total Sanitation in
Rural Areas An Approach that Worksrdquo Field Note World Bank Water and Sanitation
Program
Shuval Hillel I Robert L Tilden Barbara H Perry and Robert N Grosse
1981 ldquoEffect of investments in water supply and sanitation on health status a threshold-
saturation theoryrdquo Bulletin of the WHO 59(2) 243ndash248
Spears Dean 2012a ldquoEffects of Rural Sanitation on Infant Mortality and Human Capital
Evidence from a Local Governance Incentive in Indiardquo working paper Princeton
2012b ldquoHeight and Cognitive Achievement among Indian Childrenrdquo Economics
and Human Biology 10 210ndash219
Spears Dean and Sneha Lamba 2012 ldquoEffects of Early-Life Exposure to Rural Sanishy
tation on Childhood Cognitive Skills Evidence from Indias Total Sanitation Campaignrdquo
working paper Princeton
Steckel Richard 2009 ldquoHeights and human welfare Recent developments and new dishy
rectionsrdquo Explorations in Economic History 46 1ndash23
Tarozzi Alessandro 2008 ldquoGrowth reference charts and the nutritional status of Indian
childrenrdquo Economics amp Human Biology 6(3) 455468
Waterlow JC 2011 ldquoReflections on Stuntingrdquo in Charles Pasternak ed Access Not
Excess Smith-Gordon Chap 1 1ndash8
36
(a) children born in the last 3 years
-25
-2-1
5-1
-5
0
aver
age
heig
ht-f
or-a
ge z
-sco
re
0 20 40 60 80percent of households without toilet or latrine
(b) children born in the last 5 years
-25
-2-1
5-1
-5
0
aver
age
heig
ht-f
or-a
ge z
-sco
re
0 20 40 60 80percent of households without toilet or latrine
Figure 1 Open defecation predicts child height across DHS survey round country-years Solid OLS regression lines weight by country population dashed lines are unweighted
37
(a) residuals after ln(GDP)
-5
05
1
heig
ht-f
or-a
ge r
esid
uals
afte
r ln
(GD
P)
-6 -4 -2 0 2 4open defecation residuals after ln(GDP)
OLS residuals after GDP OLS simple regression
(b) country means and subsets of India (2005) by wealth
-25
-2-1
5-1
-5
0
aver
age
heig
ht-f
or-a
ge z
-sco
re
0 2 4 6 8exposure to open defecation (country mean or local area average)
Indian asset quintiles Indian top 25
Figure 2 Wealth does not account for the association between child height and sanitation OLS regression lines weight by country population data from children under 3 years old The ldquosimple
regressionrdquo line in panel (a) plots the slope of the uncontrolled regression of height on sanitation Mean
height of children in Indian wealth groups in panel (b) is plotted against the average rate of open 38 defecation in the primary sampling units where they live
(a) children born in the last 3 years
-4
-2
02
4
heig
ht-f
or-a
ge d
iffer
ence
from
cou
ntry
mea
n
-20 -10 0 10 20percent of households without toilet or latrine difference from country mean
(b) children born in the last 5 years
-4
-2
02
4
heig
ht-f
or-a
ge d
iffer
ence
from
cou
ntry
mea
n
-20 -10 0 10 20percent of households without toilet or latrine difference from country mean
Figure 3 Deviation from country mean sanitation explains deviation from mean height Solid OLS regression lines weight by country population dashed lines are unweighted
39
(a) children born in the last 3 years
-3-2
-10
1
aver
age
heig
ht-f
or-a
ge z
-sco
re
-6 -4 -2 0 2 4
log of people who defecate openly per square kilometer
(b) children born in the last 5 years
-25
-2-1
5-1
-5
0
aver
age
heig
ht-f
or-a
ge z
-sco
re
-6 -4 -2 0 2 4log of people who defecate openly per square kilometer
Figure 4 Open defecation interacts with population density to predict child height Solid OLS regression lines weight by country population dashed lines are unweighted
40
-25
-2-1
5-1
-5
0he
ight
-for
-age
z s
core
0 10 20 30 40age in months
95 CI Indian children95 CI 95 CIsanitation coefficient sanitation coefficient GDP control
Figure 5 Open defecation is more steeply associated with child height at older ages Confidence intervals are estimates of the coefficient from a regression of average country-level child
height-for-age on open defecation restricting the sample to four age categories The curve plots the
average height-for-age z-score of Indian children by age for reference
41
(a) India (NFHS-3)
-22
-2-1
8-1
6-1
4
heig
ht-f
or-a
ge z
-sco
re
0 2 4 6 8 1village-level open defecation
95 CI household openly defecates
does not openly defecate
(b) five African countries (8 pooled DHS surveys)
-22
-2-1
8-1
6-1
4he
ight
-for
-age
z-s
core
0 2 4 6 8 1village-level open defecation
95 CI household openly defecatesdoes not openly defecate
Figure 6 Negative externalities Village-level open defecation predicts child height Vertical dotted lines mark the overall mean open defecation fraction in these two rural samples
42
(a) infant mortality
5010
015
020
0in
fant
mor
talit
y ra
te (
per
100
0)
0 2 4 6 8 1village-level open defecation
regional means pooled India amp Africa
India five African countries
(b) asset ownership
01
23
asse
t cou
nt
0 2 4 6 8 1village-level open defecation
regional means pooled India amp Africa
India five African countries
Figure 7 Simpsonrsquos paradox open defecation and well-being across and within regions
43
12
34
mot
her-
child
hei
ght c
orre
atio
n
0 2 4 6 8 1
village-level open defecation
95 CI US (NLSY-79)
India local polynomial India OLS
Africa local polynomial Africa OLS
Figure 8 Open defecation is associated with reduced mother-child height correlation
44
Table 1 Open defecation predicts child height across DHS surveys (1) (2) (3) (4) (5) (6) (7)
Panel A Average height-for-age z-score of children born in last 3 years open defecation -1239 -1326 -1002 -0962 -1028dagger -1111 -0663
(0226) (0158) (0156) (0434) (0583) (0505) (0181) open defecation -1499 times density (0631)
ln(GDP) 0202 0512 0472 0757dagger 0280 (00733) (0146) (0174) (0423) (00525)
womenrsquos height 00130 -00564 -00369 00425 (00476) (00904) (0106) (00143)
population density 00418 (0190)
year FEs country FEs region time trends controls n (DHS surveys) 140 140 140 130 130 102 130 R2 0542 0679 0744 0988 0990 0991 0862
Panel B Average height-for-age z-score of children born in last 5 years open defecation -1211 -1443 -0910 -1335 -1175 -1354dagger -0689
(0290) (0203) (0208) (0474) (0806) (0704) (0154) open defecation -1446 times density (0549)
ln(GDP) 0276 0270 0208 0178 0341 (00859) (0208) (0308) (0226) (00454)
womenrsquos height 00674 -00180 00352 00544 (00774) (0145) (0107) (00147)
population density -00181 (0137)
year FEs country FEs region time trends controls n (DHS surveys) 117 117 117 108 108 104 108 R2 0369 0555 0689 0990 0991 0991 0893
Standard errors clustered by country in parentheses (65 countries in panel A 59 in panel B)
p-values dagger p lt 01 p lt 005 p lt 001 p lt 0001 Open defecation is a fraction 0 to 1 Population
density is demeaned to preserve the interpretation of open defecation Controls are calorie deficit female
literacy water within 15 minutes knowledge of oral rehydration polity score and autocracy score see the
text for more complete variable definitions
45
46
Tab
le 2 Open
defecation
predicts
child
heigh
t omitting each
world
region
in
turn
(1)
(2)
(3)
(4)
(5)
(6)
omitted
region
SS Africa
S Asia
MEamp
NA
f
C Asia
SE Asia
L Amer
Pan
el A
year
fixed
effects no controls
open
defecation
-1711
-0988
-1081
-1316
-1352
-1186
(0240)
(0140)
(0216)
(0165)
(0161)
(0186)
n (DHS
surveys)
62
129
121
135
135
118
R 2
0808
0517
0620
0680
0683
0721
Pan
el B
year
fixed
effects control
for
ln(G
DP)
open
defecation
-0733
-0387
-0866
-1001
-1028
-1065
(0195)
(0151)
(0178)
(0162)
(0157)
(0169)
n (DHS
surveys)
62
129
121
135
135
118
R 2
0925
0703
0693
0741
0747
0736
Pan
el C
year
fixed
effects control
for
average
heigh
t of
wom
enop
en defecation
-0679
dagger -0994
-0864
-1064
-1096
-0911
(0364)
(0135)
(0202)
(0157)
(0150)
(0186)
n (DHS
surveys)
57
121
112
125
125
110
R 2
0880
0522
0639
0698
0701
0768
Dep
endent variable
is mean
heigh
t-for-ag
e of
children
under
3 Standard
errors clustered
by
cou
ntry
in
parentheses p-values dagger plt
01 p
lt 005
p
lt 001
plt
0001
Open
defecation
is a fraction
0 to 1
Table 3 Alternative ldquoplacebordquo independent variables do not predict height conditional on sanitation
variable (1)
female literacy (2)
nearby water (3)
calorie deficit (4)
electrification
ldquoplacebordquo variable
open defecation
ln(GDP) year FEs n (DHS surveys) R2
000348 (000327) -0880 (0205)
138 0752
000382 (000268) -1077 (0158)
124 0792
00000230 (0000964) -1002 (0157)
140 0744
-000271 (000226) -0918 (0141)
135 0726
variable (5)
autocracy (6)
polity score (7)
breastfeeding (8)
fed other liquids
ldquoplacebordquo variable
open defecation
ln(GDP) year FEs n (DHS surveys) R2
00248 (00175) -0867 (0207)
136 0753
-00119 (000787) -0843 (0212)
138 0753
-0054 (0036)
-1123 (0187)
139 0689
0003 (0002)
-1101 (0186)
132 0702
Dependent variable is mean height-for-age of children under 3 Standard errors clustered by country in
parentheses p-values dagger p lt 01 p lt 005 p lt 001 p lt 0001 Open defecation is a fraction
47
Tab
le 4 Open
defecation
is more steeply
associated
with
child
heigh
t in
urban
than
in
rural areas
(1)
(2)
(3)
(4)
(5)
(6)
(7)
subsample
total
urban
urban
urban
rural
rural
rural
Pan
el A
Heigh
t-for-age z-score of
children
under
3
48
open
defecation
-1239
-2577
-1577
(0226)
(0688)
(0504)
rural =
urban
wom
enrsquos
heigh
t 00512
(00130)
rural =
urban
year
FEs
n (DHS
surveys)
140
140
130
R 2
0542
0403
0518
Pan
el B
Heigh
t-for-age z-score of
children
under
5
-1603
(0447)
00506
(000924)
130
0638
-0853
(0173)
χ 2 =
950
p =
0002
140
0467
-0572
(0157)
χ 2 =
607
p =
0014
00407
(00144)
χ
2 =
220
p =
0138
130
0506
-0689
(0143)
χ 2 =
669
p =
0009
00409
(00107)
χ
2 =
179
p =
0181
130
0624
open
defecation
-1211
-2219
-1620
-1875
-0755
-0527
-0743
(0290)
(0825)
(0586)
(0487)
(0233)
(0198)
(0161)
rural =
urban
χ
2 =
516
χ
2 =
701
χ
2 =
1074
p =
0023
p =
0008
p =
0000
wom
enrsquos
heigh
t 00620
00606
00489
00523
(00141)
(00138)
(00172)
(00152)
rural =
urban
χ
2 =
490
χ
2 =
202
p =
0027
p =
0155
year
FEs
n
(DHS
surveys)
117
117
108
108
117
108
108
R 2
0369
0201
0540
0643
0270
0423
0548
Standard
errors
clustered
by
cou
ntry
in
parentheses
(65
cou
ntries in
pan
el A
59
in
pan
el B
) p-values dagger plt
01 plt
005
plt
001
plt
0001
Open
defecation
is a fraction
0 to 1
χ 2 tests in
columns 5
6 an
d 7
test for equality
with
the coeffi
cients
in
columns 2
3 and
4
respectively
49
Tab
le 5 Open
defecation
linearly
explains much
of the Sou
th A
sia-Africa heigh
t gap
(1)
(2)
(3)
(4)
(5)
(6)
(7)
(8)
(9)
sample
full
restricted
restricted
restricted
restricted
restricted
restricted
restricted
restricted
Sou
th A
sia
-0349
-0360
-0253
-0061
-0424
-0488
-0129
-0364
0029
(00469)
(00521)
(00734)
(0162)
(0050)
(0109)
(0181)
(0084)
(0184)
percent explained
30
83
73
92
op
en defecation
-0456
(0173)
open
defecators
-1758
-2184
-1998
dagger
per
square km
(0865)
(0961)
(1094)
pop
ulation
density
0185
(0062)
ln(G
DP)
0205
0227dagger
0077
0068
(0122)
(0123)
(0084)
(0082)
year
FEs
n
(DHS
surveys)
100
89
89
89
89
89
89
89
89
R 2
0390
0391
0497
0433
0416
0495
0727
0786
0800
Dep
endent variable
is mean
heigh
t-for-ag
e of
children
under
3 Standard
errors clustered
by
cou
ntry
in
parentheses p-values dagger plt
01 p
lt 005
p
lt 001
plt
0001
Open
defecation
is a fraction
0 to 1
Sou
th A
sia is
a dummy
indicator The ldquorestrictedrdquo sample
is the set of
observations with
inform
ation
on
both
heigh
t an
d open
defecation The ldquofullrdquo sample
includes
all
observations from
Sou
th A
sia or
sub-Saharan
Africa
Table 6 Change over time in a panel of Indian districts NFHS-1 1992-3 to NFHS-2 1998-9 (1) (2) (3) (4)
Panel A Repeated cross section (OLS) district open defecation -0779 -0279
(0155) (0193) village open defecation -0537 -0523 -0774
(0128) (0104) (0170) village open defecation2 0134
(0367) survey round fixed effect age-in-months times sex control variables
Panel B District fixed effects district open defecation -0525dagger 0106
(0307) (0321) village open defecation -0553 -0353 -0710
(0125) (0117) (0179) village open defecation2 -0548
(0337) survey round fixed effect age-in-months times sex control variables
n (children under 3) 23588 23588 23588 23588 Dependent variable is height-for-age z-score of children under 3 Standard errors clustered by district
(across survey rounds) in parentheses p-values dagger p lt 01 p lt 005 p lt 001 p lt 0001 Open
defecation is a fraction 0 to 1 Controls are at the household or child level electrification water supply
household size indictors for being Hindu or Muslim a full set of birth order indicators interacted with the
relationship of the childrsquos mother to the head of the household twinship indicators and month-of-birth
indicators ldquoLinear predicted height changerdquo multiplies the statistically significant coefficient on open
defecation by 0063 the change in rural open defecation between the NFHS-1 and NFHS-2 to make a
linear prediction based only on sanitation of the change in height which was about 0022 Only rural
subsamples are used
50
Table 7 Village open defecation predicts child height India and African DHS data (1) (2) (3) (4) (5)
Panel A India (2005 NFHS-3 rural sub-sample) village open defecation -0305 -0289 -0257 -0217 -0216
(00644) (00636) (00579) (00886) (00879) village open defecation2 -0208 00746 -0111 -0174
(0210) (0191) (0224) (0220) household open defecation -0413 -0413 -00999 -0419 -0181
(00356) (00356) (00380) (00353) (00376) controls state fixed effects n (children under 5) 26832 26832 26832 26832 26832
Panel B five African countries (8 DHS surveys rural sub-samples) village open defecation -0294 -0361 -0179 -00551 000776
(00575) (00598) (00599) (00712) (00696) village open defecation2 -0726 -0572 -0569 -0523
(0193) (0187) (0196) (0191) household open defecation -00783dagger -00767dagger 00161 -00804 -0000619
(00404) (00403) (00400) (00404) (00402) controls DHS survey (country-year) FEs n (children under 5) 44216 44216 44216 44216 44216 Dependent variable is height-for-age z-score of children under 5 Standard errors clustered by village
(survey PSU) p-values dagger p lt 01 p lt 005 p lt 001 p lt 0001 Village open defecation is a
fraction 0 to 1 household open defecation is an indicator 0 or 1 Controls are at the household or child
level 120 age-in-month by sex indicators indicators for household dirt floor access to piped water
electricity TV bicycle motorcycle and clean cooking fuel and motherrsquos literacy knowledge of oral
rehydration age at first birth count of children ever born and relationship to the head of the household
51
52
Tab
le 8 Decom
position
of rural India-A
frica heigh
t difference Fraction
due to
open
defecation
(1)
(2)
(3)
(4)
(5)
(6)
(7)
(8)
(9)
(10)
covariates
non
e birth
dem
ography
socio-econ
omic
IM
R (village-level)
motherrsquos
heigh
tsanitation
n (children)
71048
71048
71048
71048
71048
71048
71048
71048
70596
70596
Pan
el A
Pooled
OLS
regression with
an
indicator
for
the Indian
sub-sam
ple
India
indicator
-0142
-0001
-0191
-0049
-0301
-0233
-0243
-0099
0134
0262
(0026)
(0026)
(0026)
(0027)
(0028)
(0030)
(0026)
(0028)
(0027)
(0027)
village
open
-0480
-0432
-0177
-0418
-0420
defecation
(0035)
(0035)
(0036)
(0035)
(0034)
R 2
00015
00090
00073
00142
00308
00318
00059
00124
00271
00337
explained
0994
0754
0225
0593
not
applicable
indicator
equal
χ 2 1
= 136
χ
2 1 =
130
χ
2 1 =
24
χ 2 1
= 120
χ
2 1 =
136
Pan
el B
Oax
aca-Blinder
decom
position
adding linear village-level
san
itation unexplained
difference
difference
-0142
0024
-0203
-0045
-0316
-0237
-0258
-0082
0149
0297
(0026)
(0026)
(0025)
(0027)
(0028)
(0030)
(0027)
(0029)
(0027)
(0027)
explained
1169
0781
0250
0682
not
applicable
Pan
el C
Non
-param
etric reweigh
ting decom
position counterfactual
difference
in
means
difference
-0142
0061
-0242
-0022
-0367
-0186
-0154
-0005
0215
0396
chan
ge
0203
0220
0181
0149
0181
explained
143
0908
0493
0967
not
applicable
Tab
le 9 W
hat
fraction
of international
heigh
t differences can
open
defecation
explain
fraction
of Indian
heigh
t gap
ldquoexplainedrdquo
estimation
strategy
source
slop
e 0
1
2
3
4
5
Africa (8
DHS)
US
53
Indiarsquos
TSC high
Indiarsquos
TSC low
experim
ent
OLS
experim
ent
TOT
IV
DHS
means
FEs
DHS
means
con
trols
DHS
means
SAampSSA
India district FEs
India
and
Africa
S (2012)dagger
S (2012)dagger
HampS
(2012)dagger
HampS
(2012)dagger
Tab
le 1
Tab
le 1
Tab
le 5
Tab
le 6
Tab
le 8
1592
1153
0786
2928
0962
1111
0721
0533
0420
3542
2565
1748
6514
2140
2471
1604
1185
0934
0440
0319
0217
0810
0266
0307
0199
0148
0116
dagger These are probab
ly overestim
ates
of the eff
ects
of sanitation
coverag
e becau
se the program
s they
study
also motivate use
of existing latrines
The ldquoT
able
5rdquo estimate is
not in
fact
from
tab
le 5 but is
fou
nd
by
estim
ating the regression
in
column
3 w
ithou
t the Sou
th A
sia indicator
variab
le Error
bars in
the fourth
column
plot 95
percent confidence
intervals for the estimate of
linear differen
ce in
heigh
t-for-ag
e standard
deviation
s associated
with
a 0
to 1 difference
in
the fraction
openly
defecating
The fourth
column
divides
the point estimate by
045
- WPS 6351 cover
- wps6351
-
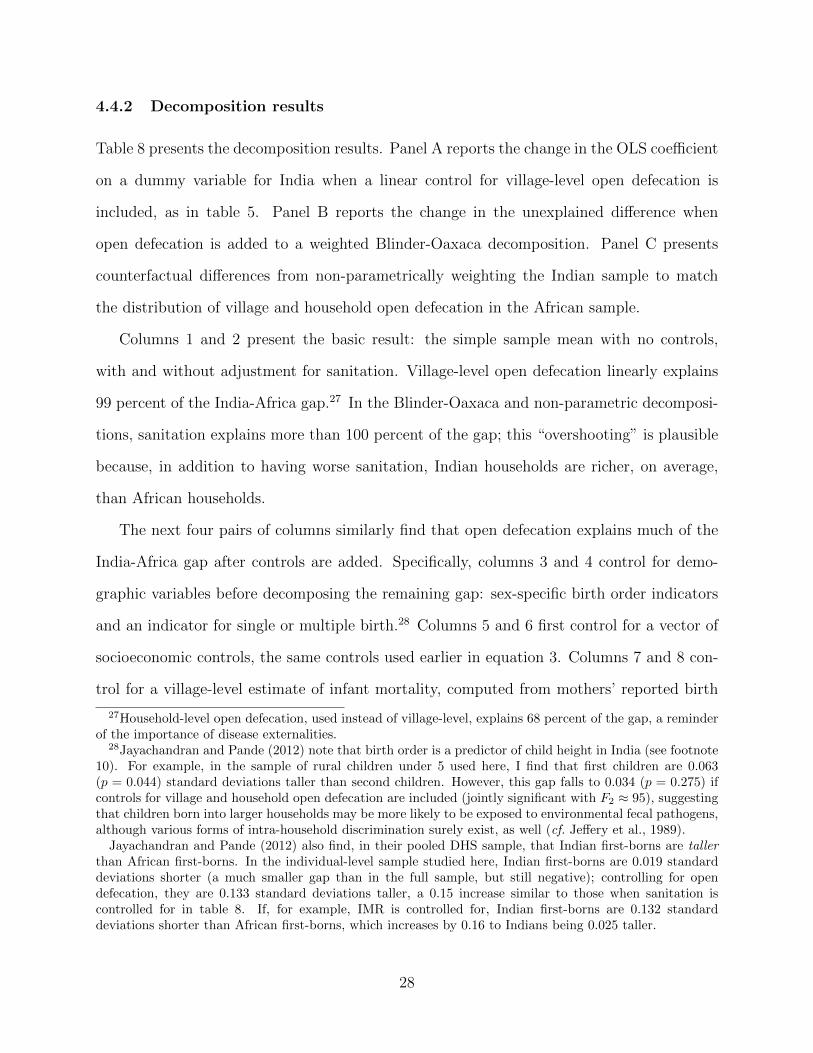
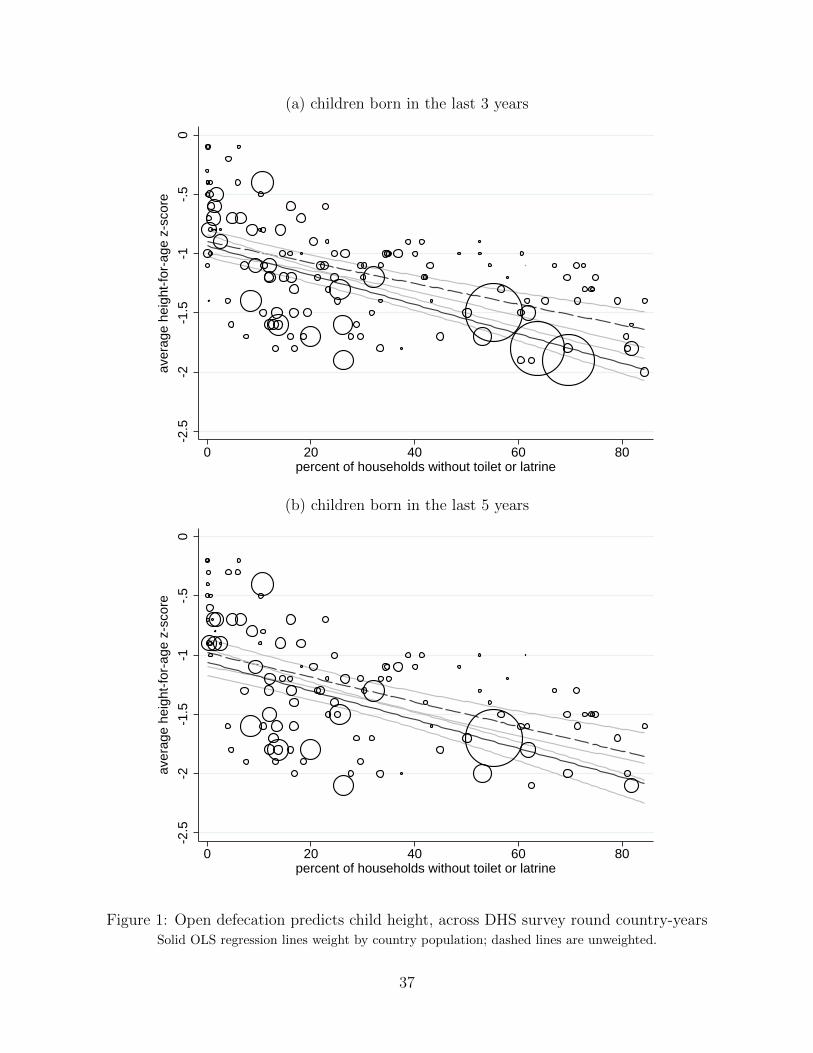
(a) children born in the last 3 years
-25
-2-1
5-1
-5
0
aver
age
heig
ht-f
or-a
ge z
-sco
re
0 20 40 60 80percent of households without toilet or latrine
(b) children born in the last 5 years
-25
-2-1
5-1
-5
0
aver
age
heig
ht-f
or-a
ge z
-sco
re
0 20 40 60 80percent of households without toilet or latrine
Figure 1 Open defecation predicts child height across DHS survey round country-years Solid OLS regression lines weight by country population dashed lines are unweighted
37
(a) residuals after ln(GDP)
-5
05
1
heig
ht-f
or-a
ge r
esid
uals
afte
r ln
(GD
P)
-6 -4 -2 0 2 4open defecation residuals after ln(GDP)
OLS residuals after GDP OLS simple regression
(b) country means and subsets of India (2005) by wealth
-25
-2-1
5-1
-5
0
aver
age
heig
ht-f
or-a
ge z
-sco
re
0 2 4 6 8exposure to open defecation (country mean or local area average)
Indian asset quintiles Indian top 25
Figure 2 Wealth does not account for the association between child height and sanitation OLS regression lines weight by country population data from children under 3 years old The ldquosimple
regressionrdquo line in panel (a) plots the slope of the uncontrolled regression of height on sanitation Mean
height of children in Indian wealth groups in panel (b) is plotted against the average rate of open 38 defecation in the primary sampling units where they live
(a) children born in the last 3 years
-4
-2
02
4
heig
ht-f
or-a
ge d
iffer
ence
from
cou
ntry
mea
n
-20 -10 0 10 20percent of households without toilet or latrine difference from country mean
(b) children born in the last 5 years
-4
-2
02
4
heig
ht-f
or-a
ge d
iffer
ence
from
cou
ntry
mea
n
-20 -10 0 10 20percent of households without toilet or latrine difference from country mean
Figure 3 Deviation from country mean sanitation explains deviation from mean height Solid OLS regression lines weight by country population dashed lines are unweighted
39
(a) children born in the last 3 years
-3-2
-10
1
aver
age
heig
ht-f
or-a
ge z
-sco
re
-6 -4 -2 0 2 4
log of people who defecate openly per square kilometer
(b) children born in the last 5 years
-25
-2-1
5-1
-5
0
aver
age
heig
ht-f
or-a
ge z
-sco
re
-6 -4 -2 0 2 4log of people who defecate openly per square kilometer
Figure 4 Open defecation interacts with population density to predict child height Solid OLS regression lines weight by country population dashed lines are unweighted
40
-25
-2-1
5-1
-5
0he
ight
-for
-age
z s
core
0 10 20 30 40age in months
95 CI Indian children95 CI 95 CIsanitation coefficient sanitation coefficient GDP control
Figure 5 Open defecation is more steeply associated with child height at older ages Confidence intervals are estimates of the coefficient from a regression of average country-level child
height-for-age on open defecation restricting the sample to four age categories The curve plots the
average height-for-age z-score of Indian children by age for reference
41
(a) India (NFHS-3)
-22
-2-1
8-1
6-1
4
heig
ht-f
or-a
ge z
-sco
re
0 2 4 6 8 1village-level open defecation
95 CI household openly defecates
does not openly defecate
(b) five African countries (8 pooled DHS surveys)
-22
-2-1
8-1
6-1
4he
ight
-for
-age
z-s
core
0 2 4 6 8 1village-level open defecation
95 CI household openly defecatesdoes not openly defecate
Figure 6 Negative externalities Village-level open defecation predicts child height Vertical dotted lines mark the overall mean open defecation fraction in these two rural samples
42
(a) infant mortality
5010
015
020
0in
fant
mor
talit
y ra
te (
per
100
0)
0 2 4 6 8 1village-level open defecation
regional means pooled India amp Africa
India five African countries
(b) asset ownership
01
23
asse
t cou
nt
0 2 4 6 8 1village-level open defecation
regional means pooled India amp Africa
India five African countries
Figure 7 Simpsonrsquos paradox open defecation and well-being across and within regions
43
12
34
mot
her-
child
hei
ght c
orre
atio
n
0 2 4 6 8 1
village-level open defecation
95 CI US (NLSY-79)
India local polynomial India OLS
Africa local polynomial Africa OLS
Figure 8 Open defecation is associated with reduced mother-child height correlation
44
Table 1 Open defecation predicts child height across DHS surveys (1) (2) (3) (4) (5) (6) (7)
Panel A Average height-for-age z-score of children born in last 3 years open defecation -1239 -1326 -1002 -0962 -1028dagger -1111 -0663
(0226) (0158) (0156) (0434) (0583) (0505) (0181) open defecation -1499 times density (0631)
ln(GDP) 0202 0512 0472 0757dagger 0280 (00733) (0146) (0174) (0423) (00525)
womenrsquos height 00130 -00564 -00369 00425 (00476) (00904) (0106) (00143)
population density 00418 (0190)
year FEs country FEs region time trends controls n (DHS surveys) 140 140 140 130 130 102 130 R2 0542 0679 0744 0988 0990 0991 0862
Panel B Average height-for-age z-score of children born in last 5 years open defecation -1211 -1443 -0910 -1335 -1175 -1354dagger -0689
(0290) (0203) (0208) (0474) (0806) (0704) (0154) open defecation -1446 times density (0549)
ln(GDP) 0276 0270 0208 0178 0341 (00859) (0208) (0308) (0226) (00454)
womenrsquos height 00674 -00180 00352 00544 (00774) (0145) (0107) (00147)
population density -00181 (0137)
year FEs country FEs region time trends controls n (DHS surveys) 117 117 117 108 108 104 108 R2 0369 0555 0689 0990 0991 0991 0893
Standard errors clustered by country in parentheses (65 countries in panel A 59 in panel B)
p-values dagger p lt 01 p lt 005 p lt 001 p lt 0001 Open defecation is a fraction 0 to 1 Population
density is demeaned to preserve the interpretation of open defecation Controls are calorie deficit female
literacy water within 15 minutes knowledge of oral rehydration polity score and autocracy score see the
text for more complete variable definitions
45
46
Tab
le 2 Open
defecation
predicts
child
heigh
t omitting each
world
region
in
turn
(1)
(2)
(3)
(4)
(5)
(6)
omitted
region
SS Africa
S Asia
MEamp
NA
f
C Asia
SE Asia
L Amer
Pan
el A
year
fixed
effects no controls
open
defecation
-1711
-0988
-1081
-1316
-1352
-1186
(0240)
(0140)
(0216)
(0165)
(0161)
(0186)
n (DHS
surveys)
62
129
121
135
135
118
R 2
0808
0517
0620
0680
0683
0721
Pan
el B
year
fixed
effects control
for
ln(G
DP)
open
defecation
-0733
-0387
-0866
-1001
-1028
-1065
(0195)
(0151)
(0178)
(0162)
(0157)
(0169)
n (DHS
surveys)
62
129
121
135
135
118
R 2
0925
0703
0693
0741
0747
0736
Pan
el C
year
fixed
effects control
for
average
heigh
t of
wom
enop
en defecation
-0679
dagger -0994
-0864
-1064
-1096
-0911
(0364)
(0135)
(0202)
(0157)
(0150)
(0186)
n (DHS
surveys)
57
121
112
125
125
110
R 2
0880
0522
0639
0698
0701
0768
Dep
endent variable
is mean
heigh
t-for-ag
e of
children
under
3 Standard
errors clustered
by
cou
ntry
in
parentheses p-values dagger plt
01 p
lt 005
p
lt 001
plt
0001
Open
defecation
is a fraction
0 to 1
Table 3 Alternative ldquoplacebordquo independent variables do not predict height conditional on sanitation
variable (1)
female literacy (2)
nearby water (3)
calorie deficit (4)
electrification
ldquoplacebordquo variable
open defecation
ln(GDP) year FEs n (DHS surveys) R2
000348 (000327) -0880 (0205)
138 0752
000382 (000268) -1077 (0158)
124 0792
00000230 (0000964) -1002 (0157)
140 0744
-000271 (000226) -0918 (0141)
135 0726
variable (5)
autocracy (6)
polity score (7)
breastfeeding (8)
fed other liquids
ldquoplacebordquo variable
open defecation
ln(GDP) year FEs n (DHS surveys) R2
00248 (00175) -0867 (0207)
136 0753
-00119 (000787) -0843 (0212)
138 0753
-0054 (0036)
-1123 (0187)
139 0689
0003 (0002)
-1101 (0186)
132 0702
Dependent variable is mean height-for-age of children under 3 Standard errors clustered by country in
parentheses p-values dagger p lt 01 p lt 005 p lt 001 p lt 0001 Open defecation is a fraction
47
Tab
le 4 Open
defecation
is more steeply
associated
with
child
heigh
t in
urban
than
in
rural areas
(1)
(2)
(3)
(4)
(5)
(6)
(7)
subsample
total
urban
urban
urban
rural
rural
rural
Pan
el A
Heigh
t-for-age z-score of
children
under
3
48
open
defecation
-1239
-2577
-1577
(0226)
(0688)
(0504)
rural =
urban
wom
enrsquos
heigh
t 00512
(00130)
rural =
urban
year
FEs
n (DHS
surveys)
140
140
130
R 2
0542
0403
0518
Pan
el B
Heigh
t-for-age z-score of
children
under
5
-1603
(0447)
00506
(000924)
130
0638
-0853
(0173)
χ 2 =
950
p =
0002
140
0467
-0572
(0157)
χ 2 =
607
p =
0014
00407
(00144)
χ
2 =
220
p =
0138
130
0506
-0689
(0143)
χ 2 =
669
p =
0009
00409
(00107)
χ
2 =
179
p =
0181
130
0624
open
defecation
-1211
-2219
-1620
-1875
-0755
-0527
-0743
(0290)
(0825)
(0586)
(0487)
(0233)
(0198)
(0161)
rural =
urban
χ
2 =
516
χ
2 =
701
χ
2 =
1074
p =
0023
p =
0008
p =
0000
wom
enrsquos
heigh
t 00620
00606
00489
00523
(00141)
(00138)
(00172)
(00152)
rural =
urban
χ
2 =
490
χ
2 =
202
p =
0027
p =
0155
year
FEs
n
(DHS
surveys)
117
117
108
108
117
108
108
R 2
0369
0201
0540
0643
0270
0423
0548
Standard
errors
clustered
by
cou
ntry
in
parentheses
(65
cou
ntries in
pan
el A
59
in
pan
el B
) p-values dagger plt
01 plt
005
plt
001
plt
0001
Open
defecation
is a fraction
0 to 1
χ 2 tests in
columns 5
6 an
d 7
test for equality
with
the coeffi
cients
in
columns 2
3 and
4
respectively
49
Tab
le 5 Open
defecation
linearly
explains much
of the Sou
th A
sia-Africa heigh
t gap
(1)
(2)
(3)
(4)
(5)
(6)
(7)
(8)
(9)
sample
full
restricted
restricted
restricted
restricted
restricted
restricted
restricted
restricted
Sou
th A
sia
-0349
-0360
-0253
-0061
-0424
-0488
-0129
-0364
0029
(00469)
(00521)
(00734)
(0162)
(0050)
(0109)
(0181)
(0084)
(0184)
percent explained
30
83
73
92
op
en defecation
-0456
(0173)
open
defecators
-1758
-2184
-1998
dagger
per
square km
(0865)
(0961)
(1094)
pop
ulation
density
0185
(0062)
ln(G
DP)
0205
0227dagger
0077
0068
(0122)
(0123)
(0084)
(0082)
year
FEs
n
(DHS
surveys)
100
89
89
89
89
89
89
89
89
R 2
0390
0391
0497
0433
0416
0495
0727
0786
0800
Dep
endent variable
is mean
heigh
t-for-ag
e of
children
under
3 Standard
errors clustered
by
cou
ntry
in
parentheses p-values dagger plt
01 p
lt 005
p
lt 001
plt
0001
Open
defecation
is a fraction
0 to 1
Sou
th A
sia is
a dummy
indicator The ldquorestrictedrdquo sample
is the set of
observations with
inform
ation
on
both
heigh
t an
d open
defecation The ldquofullrdquo sample
includes
all
observations from
Sou
th A
sia or
sub-Saharan
Africa
Table 6 Change over time in a panel of Indian districts NFHS-1 1992-3 to NFHS-2 1998-9 (1) (2) (3) (4)
Panel A Repeated cross section (OLS) district open defecation -0779 -0279
(0155) (0193) village open defecation -0537 -0523 -0774
(0128) (0104) (0170) village open defecation2 0134
(0367) survey round fixed effect age-in-months times sex control variables
Panel B District fixed effects district open defecation -0525dagger 0106
(0307) (0321) village open defecation -0553 -0353 -0710
(0125) (0117) (0179) village open defecation2 -0548
(0337) survey round fixed effect age-in-months times sex control variables
n (children under 3) 23588 23588 23588 23588 Dependent variable is height-for-age z-score of children under 3 Standard errors clustered by district
(across survey rounds) in parentheses p-values dagger p lt 01 p lt 005 p lt 001 p lt 0001 Open
defecation is a fraction 0 to 1 Controls are at the household or child level electrification water supply
household size indictors for being Hindu or Muslim a full set of birth order indicators interacted with the
relationship of the childrsquos mother to the head of the household twinship indicators and month-of-birth
indicators ldquoLinear predicted height changerdquo multiplies the statistically significant coefficient on open
defecation by 0063 the change in rural open defecation between the NFHS-1 and NFHS-2 to make a
linear prediction based only on sanitation of the change in height which was about 0022 Only rural
subsamples are used
50
Table 7 Village open defecation predicts child height India and African DHS data (1) (2) (3) (4) (5)
Panel A India (2005 NFHS-3 rural sub-sample) village open defecation -0305 -0289 -0257 -0217 -0216
(00644) (00636) (00579) (00886) (00879) village open defecation2 -0208 00746 -0111 -0174
(0210) (0191) (0224) (0220) household open defecation -0413 -0413 -00999 -0419 -0181
(00356) (00356) (00380) (00353) (00376) controls state fixed effects n (children under 5) 26832 26832 26832 26832 26832
Panel B five African countries (8 DHS surveys rural sub-samples) village open defecation -0294 -0361 -0179 -00551 000776
(00575) (00598) (00599) (00712) (00696) village open defecation2 -0726 -0572 -0569 -0523
(0193) (0187) (0196) (0191) household open defecation -00783dagger -00767dagger 00161 -00804 -0000619
(00404) (00403) (00400) (00404) (00402) controls DHS survey (country-year) FEs n (children under 5) 44216 44216 44216 44216 44216 Dependent variable is height-for-age z-score of children under 5 Standard errors clustered by village
(survey PSU) p-values dagger p lt 01 p lt 005 p lt 001 p lt 0001 Village open defecation is a
fraction 0 to 1 household open defecation is an indicator 0 or 1 Controls are at the household or child
level 120 age-in-month by sex indicators indicators for household dirt floor access to piped water
electricity TV bicycle motorcycle and clean cooking fuel and motherrsquos literacy knowledge of oral
rehydration age at first birth count of children ever born and relationship to the head of the household
51
52
Tab
le 8 Decom
position
of rural India-A
frica heigh
t difference Fraction
due to
open
defecation
(1)
(2)
(3)
(4)
(5)
(6)
(7)
(8)
(9)
(10)
covariates
non
e birth
dem
ography
socio-econ
omic
IM
R (village-level)
motherrsquos
heigh
tsanitation
n (children)
71048
71048
71048
71048
71048
71048
71048
71048
70596
70596
Pan
el A
Pooled
OLS
regression with
an
indicator
for
the Indian
sub-sam
ple
India
indicator
-0142
-0001
-0191
-0049
-0301
-0233
-0243
-0099
0134
0262
(0026)
(0026)
(0026)
(0027)
(0028)
(0030)
(0026)
(0028)
(0027)
(0027)
village
open
-0480
-0432
-0177
-0418
-0420
defecation
(0035)
(0035)
(0036)
(0035)
(0034)
R 2
00015
00090
00073
00142
00308
00318
00059
00124
00271
00337
explained
0994
0754
0225
0593
not
applicable
indicator
equal
χ 2 1
= 136
χ
2 1 =
130
χ
2 1 =
24
χ 2 1
= 120
χ
2 1 =
136
Pan
el B
Oax
aca-Blinder
decom
position
adding linear village-level
san
itation unexplained
difference
difference
-0142
0024
-0203
-0045
-0316
-0237
-0258
-0082
0149
0297
(0026)
(0026)
(0025)
(0027)
(0028)
(0030)
(0027)
(0029)
(0027)
(0027)
explained
1169
0781
0250
0682
not
applicable
Pan
el C
Non
-param
etric reweigh
ting decom
position counterfactual
difference
in
means
difference
-0142
0061
-0242
-0022
-0367
-0186
-0154
-0005
0215
0396
chan
ge
0203
0220
0181
0149
0181
explained
143
0908
0493
0967
not
applicable
Tab
le 9 W
hat
fraction
of international
heigh
t differences can
open
defecation
explain
fraction
of Indian
heigh
t gap
ldquoexplainedrdquo
estimation
strategy
source
slop
e 0
1
2
3
4
5
Africa (8
DHS)
US
53
Indiarsquos
TSC high
Indiarsquos
TSC low
experim
ent
OLS
experim
ent
TOT
IV
DHS
means
FEs
DHS
means
con
trols
DHS
means
SAampSSA
India district FEs
India
and
Africa
S (2012)dagger
S (2012)dagger
HampS
(2012)dagger
HampS
(2012)dagger
Tab
le 1
Tab
le 1
Tab
le 5
Tab
le 6
Tab
le 8
1592
1153
0786
2928
0962
1111
0721
0533
0420
3542
2565
1748
6514
2140
2471
1604
1185
0934
0440
0319
0217
0810
0266
0307
0199
0148
0116
dagger These are probab
ly overestim
ates
of the eff
ects
of sanitation
coverag
e becau
se the program
s they
study
also motivate use
of existing latrines
The ldquoT
able
5rdquo estimate is
not in
fact
from
tab
le 5 but is
fou
nd
by
estim
ating the regression
in
column
3 w
ithou
t the Sou
th A
sia indicator
variab
le Error
bars in
the fourth
column
plot 95
percent confidence
intervals for the estimate of
linear differen
ce in
heigh
t-for-ag
e standard
deviation
s associated
with
a 0
to 1 difference
in
the fraction
openly
defecating
The fourth
column
divides
the point estimate by
045
- WPS 6351 cover
- wps6351
-

(a) children born in the last 3 years
-4
-2
02
4
heig
ht-f
or-a
ge d
iffer
ence
from
cou
ntry
mea
n
-20 -10 0 10 20percent of households without toilet or latrine difference from country mean
(b) children born in the last 5 years
-4
-2
02
4
heig
ht-f
or-a
ge d
iffer
ence
from
cou
ntry
mea
n
-20 -10 0 10 20percent of households without toilet or latrine difference from country mean
Figure 3 Deviation from country mean sanitation explains deviation from mean height Solid OLS regression lines weight by country population dashed lines are unweighted
39
(a) children born in the last 3 years
-3-2
-10
1
aver
age
heig
ht-f
or-a
ge z
-sco
re
-6 -4 -2 0 2 4
log of people who defecate openly per square kilometer
(b) children born in the last 5 years
-25
-2-1
5-1
-5
0
aver
age
heig
ht-f
or-a
ge z
-sco
re
-6 -4 -2 0 2 4log of people who defecate openly per square kilometer
Figure 4 Open defecation interacts with population density to predict child height Solid OLS regression lines weight by country population dashed lines are unweighted
40
-25
-2-1
5-1
-5
0he
ight
-for
-age
z s
core
0 10 20 30 40age in months
95 CI Indian children95 CI 95 CIsanitation coefficient sanitation coefficient GDP control
Figure 5 Open defecation is more steeply associated with child height at older ages Confidence intervals are estimates of the coefficient from a regression of average country-level child
height-for-age on open defecation restricting the sample to four age categories The curve plots the
average height-for-age z-score of Indian children by age for reference
41
(a) India (NFHS-3)
-22
-2-1
8-1
6-1
4
heig
ht-f
or-a
ge z
-sco
re
0 2 4 6 8 1village-level open defecation
95 CI household openly defecates
does not openly defecate
(b) five African countries (8 pooled DHS surveys)
-22
-2-1
8-1
6-1
4he
ight
-for
-age
z-s
core
0 2 4 6 8 1village-level open defecation
95 CI household openly defecatesdoes not openly defecate
Figure 6 Negative externalities Village-level open defecation predicts child height Vertical dotted lines mark the overall mean open defecation fraction in these two rural samples
42
(a) infant mortality
5010
015
020
0in
fant
mor
talit
y ra
te (
per
100
0)
0 2 4 6 8 1village-level open defecation
regional means pooled India amp Africa
India five African countries
(b) asset ownership
01
23
asse
t cou
nt
0 2 4 6 8 1village-level open defecation
regional means pooled India amp Africa
India five African countries
Figure 7 Simpsonrsquos paradox open defecation and well-being across and within regions
43
12
34
mot
her-
child
hei
ght c
orre
atio
n
0 2 4 6 8 1
village-level open defecation
95 CI US (NLSY-79)
India local polynomial India OLS
Africa local polynomial Africa OLS
Figure 8 Open defecation is associated with reduced mother-child height correlation
44
Table 1 Open defecation predicts child height across DHS surveys (1) (2) (3) (4) (5) (6) (7)
Panel A Average height-for-age z-score of children born in last 3 years open defecation -1239 -1326 -1002 -0962 -1028dagger -1111 -0663
(0226) (0158) (0156) (0434) (0583) (0505) (0181) open defecation -1499 times density (0631)
ln(GDP) 0202 0512 0472 0757dagger 0280 (00733) (0146) (0174) (0423) (00525)
womenrsquos height 00130 -00564 -00369 00425 (00476) (00904) (0106) (00143)
population density 00418 (0190)
year FEs country FEs region time trends controls n (DHS surveys) 140 140 140 130 130 102 130 R2 0542 0679 0744 0988 0990 0991 0862
Panel B Average height-for-age z-score of children born in last 5 years open defecation -1211 -1443 -0910 -1335 -1175 -1354dagger -0689
(0290) (0203) (0208) (0474) (0806) (0704) (0154) open defecation -1446 times density (0549)
ln(GDP) 0276 0270 0208 0178 0341 (00859) (0208) (0308) (0226) (00454)
womenrsquos height 00674 -00180 00352 00544 (00774) (0145) (0107) (00147)
population density -00181 (0137)
year FEs country FEs region time trends controls n (DHS surveys) 117 117 117 108 108 104 108 R2 0369 0555 0689 0990 0991 0991 0893
Standard errors clustered by country in parentheses (65 countries in panel A 59 in panel B)
p-values dagger p lt 01 p lt 005 p lt 001 p lt 0001 Open defecation is a fraction 0 to 1 Population
density is demeaned to preserve the interpretation of open defecation Controls are calorie deficit female
literacy water within 15 minutes knowledge of oral rehydration polity score and autocracy score see the
text for more complete variable definitions
45
46
Tab
le 2 Open
defecation
predicts
child
heigh
t omitting each
world
region
in
turn
(1)
(2)
(3)
(4)
(5)
(6)
omitted
region
SS Africa
S Asia
MEamp
NA
f
C Asia
SE Asia
L Amer
Pan
el A
year
fixed
effects no controls
open
defecation
-1711
-0988
-1081
-1316
-1352
-1186
(0240)
(0140)
(0216)
(0165)
(0161)
(0186)
n (DHS
surveys)
62
129
121
135
135
118
R 2
0808
0517
0620
0680
0683
0721
Pan
el B
year
fixed
effects control
for
ln(G
DP)
open
defecation
-0733
-0387
-0866
-1001
-1028
-1065
(0195)
(0151)
(0178)
(0162)
(0157)
(0169)
n (DHS
surveys)
62
129
121
135
135
118
R 2
0925
0703
0693
0741
0747
0736
Pan
el C
year
fixed
effects control
for
average
heigh
t of
wom
enop
en defecation
-0679
dagger -0994
-0864
-1064
-1096
-0911
(0364)
(0135)
(0202)
(0157)
(0150)
(0186)
n (DHS
surveys)
57
121
112
125
125
110
R 2
0880
0522
0639
0698
0701
0768
Dep
endent variable
is mean
heigh
t-for-ag
e of
children
under
3 Standard
errors clustered
by
cou
ntry
in
parentheses p-values dagger plt
01 p
lt 005
p
lt 001
plt
0001
Open
defecation
is a fraction
0 to 1
Table 3 Alternative ldquoplacebordquo independent variables do not predict height conditional on sanitation
variable (1)
female literacy (2)
nearby water (3)
calorie deficit (4)
electrification
ldquoplacebordquo variable
open defecation
ln(GDP) year FEs n (DHS surveys) R2
000348 (000327) -0880 (0205)
138 0752
000382 (000268) -1077 (0158)
124 0792
00000230 (0000964) -1002 (0157)
140 0744
-000271 (000226) -0918 (0141)
135 0726
variable (5)
autocracy (6)
polity score (7)
breastfeeding (8)
fed other liquids
ldquoplacebordquo variable
open defecation
ln(GDP) year FEs n (DHS surveys) R2
00248 (00175) -0867 (0207)
136 0753
-00119 (000787) -0843 (0212)
138 0753
-0054 (0036)
-1123 (0187)
139 0689
0003 (0002)
-1101 (0186)
132 0702
Dependent variable is mean height-for-age of children under 3 Standard errors clustered by country in
parentheses p-values dagger p lt 01 p lt 005 p lt 001 p lt 0001 Open defecation is a fraction
47
Tab
le 4 Open
defecation
is more steeply
associated
with
child
heigh
t in
urban
than
in
rural areas
(1)
(2)
(3)
(4)
(5)
(6)
(7)
subsample
total
urban
urban
urban
rural
rural
rural
Pan
el A
Heigh
t-for-age z-score of
children
under
3
48
open
defecation
-1239
-2577
-1577
(0226)
(0688)
(0504)
rural =
urban
wom
enrsquos
heigh
t 00512
(00130)
rural =
urban
year
FEs
n (DHS
surveys)
140
140
130
R 2
0542
0403
0518
Pan
el B
Heigh
t-for-age z-score of
children
under
5
-1603
(0447)
00506
(000924)
130
0638
-0853
(0173)
χ 2 =
950
p =
0002
140
0467
-0572
(0157)
χ 2 =
607
p =
0014
00407
(00144)
χ
2 =
220
p =
0138
130
0506
-0689
(0143)
χ 2 =
669
p =
0009
00409
(00107)
χ
2 =
179
p =
0181
130
0624
open
defecation
-1211
-2219
-1620
-1875
-0755
-0527
-0743
(0290)
(0825)
(0586)
(0487)
(0233)
(0198)
(0161)
rural =
urban
χ
2 =
516
χ
2 =
701
χ
2 =
1074
p =
0023
p =
0008
p =
0000
wom
enrsquos
heigh
t 00620
00606
00489
00523
(00141)
(00138)
(00172)
(00152)
rural =
urban
χ
2 =
490
χ
2 =
202
p =
0027
p =
0155
year
FEs
n
(DHS
surveys)
117
117
108
108
117
108
108
R 2
0369
0201
0540
0643
0270
0423
0548
Standard
errors
clustered
by
cou
ntry
in
parentheses
(65
cou
ntries in
pan
el A
59
in
pan
el B
) p-values dagger plt
01 plt
005
plt
001
plt
0001
Open
defecation
is a fraction
0 to 1
χ 2 tests in
columns 5
6 an
d 7
test for equality
with
the coeffi
cients
in
columns 2
3 and
4
respectively
49
Tab
le 5 Open
defecation
linearly
explains much
of the Sou
th A
sia-Africa heigh
t gap
(1)
(2)
(3)
(4)
(5)
(6)
(7)
(8)
(9)
sample
full
restricted
restricted
restricted
restricted
restricted
restricted
restricted
restricted
Sou
th A
sia
-0349
-0360
-0253
-0061
-0424
-0488
-0129
-0364
0029
(00469)
(00521)
(00734)
(0162)
(0050)
(0109)
(0181)
(0084)
(0184)
percent explained
30
83
73
92
op
en defecation
-0456
(0173)
open
defecators
-1758
-2184
-1998
dagger
per
square km
(0865)
(0961)
(1094)
pop
ulation
density
0185
(0062)
ln(G
DP)
0205
0227dagger
0077
0068
(0122)
(0123)
(0084)
(0082)
year
FEs
n
(DHS
surveys)
100
89
89
89
89
89
89
89
89
R 2
0390
0391
0497
0433
0416
0495
0727
0786
0800
Dep
endent variable
is mean
heigh
t-for-ag
e of
children
under
3 Standard
errors clustered
by
cou
ntry
in
parentheses p-values dagger plt
01 p
lt 005
p
lt 001
plt
0001
Open
defecation
is a fraction
0 to 1
Sou
th A
sia is
a dummy
indicator The ldquorestrictedrdquo sample
is the set of
observations with
inform
ation
on
both
heigh
t an
d open
defecation The ldquofullrdquo sample
includes
all
observations from
Sou
th A
sia or
sub-Saharan
Africa
Table 6 Change over time in a panel of Indian districts NFHS-1 1992-3 to NFHS-2 1998-9 (1) (2) (3) (4)
Panel A Repeated cross section (OLS) district open defecation -0779 -0279
(0155) (0193) village open defecation -0537 -0523 -0774
(0128) (0104) (0170) village open defecation2 0134
(0367) survey round fixed effect age-in-months times sex control variables
Panel B District fixed effects district open defecation -0525dagger 0106
(0307) (0321) village open defecation -0553 -0353 -0710
(0125) (0117) (0179) village open defecation2 -0548
(0337) survey round fixed effect age-in-months times sex control variables
n (children under 3) 23588 23588 23588 23588 Dependent variable is height-for-age z-score of children under 3 Standard errors clustered by district
(across survey rounds) in parentheses p-values dagger p lt 01 p lt 005 p lt 001 p lt 0001 Open
defecation is a fraction 0 to 1 Controls are at the household or child level electrification water supply
household size indictors for being Hindu or Muslim a full set of birth order indicators interacted with the
relationship of the childrsquos mother to the head of the household twinship indicators and month-of-birth
indicators ldquoLinear predicted height changerdquo multiplies the statistically significant coefficient on open
defecation by 0063 the change in rural open defecation between the NFHS-1 and NFHS-2 to make a
linear prediction based only on sanitation of the change in height which was about 0022 Only rural
subsamples are used
50
Table 7 Village open defecation predicts child height India and African DHS data (1) (2) (3) (4) (5)
Panel A India (2005 NFHS-3 rural sub-sample) village open defecation -0305 -0289 -0257 -0217 -0216
(00644) (00636) (00579) (00886) (00879) village open defecation2 -0208 00746 -0111 -0174
(0210) (0191) (0224) (0220) household open defecation -0413 -0413 -00999 -0419 -0181
(00356) (00356) (00380) (00353) (00376) controls state fixed effects n (children under 5) 26832 26832 26832 26832 26832
Panel B five African countries (8 DHS surveys rural sub-samples) village open defecation -0294 -0361 -0179 -00551 000776
(00575) (00598) (00599) (00712) (00696) village open defecation2 -0726 -0572 -0569 -0523
(0193) (0187) (0196) (0191) household open defecation -00783dagger -00767dagger 00161 -00804 -0000619
(00404) (00403) (00400) (00404) (00402) controls DHS survey (country-year) FEs n (children under 5) 44216 44216 44216 44216 44216 Dependent variable is height-for-age z-score of children under 5 Standard errors clustered by village
(survey PSU) p-values dagger p lt 01 p lt 005 p lt 001 p lt 0001 Village open defecation is a
fraction 0 to 1 household open defecation is an indicator 0 or 1 Controls are at the household or child
level 120 age-in-month by sex indicators indicators for household dirt floor access to piped water
electricity TV bicycle motorcycle and clean cooking fuel and motherrsquos literacy knowledge of oral
rehydration age at first birth count of children ever born and relationship to the head of the household
51
52
Tab
le 8 Decom
position
of rural India-A
frica heigh
t difference Fraction
due to
open
defecation
(1)
(2)
(3)
(4)
(5)
(6)
(7)
(8)
(9)
(10)
covariates
non
e birth
dem
ography
socio-econ
omic
IM
R (village-level)
motherrsquos
heigh
tsanitation
n (children)
71048
71048
71048
71048
71048
71048
71048
71048
70596
70596
Pan
el A
Pooled
OLS
regression with
an
indicator
for
the Indian
sub-sam
ple
India
indicator
-0142
-0001
-0191
-0049
-0301
-0233
-0243
-0099
0134
0262
(0026)
(0026)
(0026)
(0027)
(0028)
(0030)
(0026)
(0028)
(0027)
(0027)
village
open
-0480
-0432
-0177
-0418
-0420
defecation
(0035)
(0035)
(0036)
(0035)
(0034)
R 2
00015
00090
00073
00142
00308
00318
00059
00124
00271
00337
explained
0994
0754
0225
0593
not
applicable
indicator
equal
χ 2 1
= 136
χ
2 1 =
130
χ
2 1 =
24
χ 2 1
= 120
χ
2 1 =
136
Pan
el B
Oax
aca-Blinder
decom
position
adding linear village-level
san
itation unexplained
difference
difference
-0142
0024
-0203
-0045
-0316
-0237
-0258
-0082
0149
0297
(0026)
(0026)
(0025)
(0027)
(0028)
(0030)
(0027)
(0029)
(0027)
(0027)
explained
1169
0781
0250
0682
not
applicable
Pan
el C
Non
-param
etric reweigh
ting decom
position counterfactual
difference
in
means
difference
-0142
0061
-0242
-0022
-0367
-0186
-0154
-0005
0215
0396
chan
ge
0203
0220
0181
0149
0181
explained
143
0908
0493
0967
not
applicable
Tab
le 9 W
hat
fraction
of international
heigh
t differences can
open
defecation
explain
fraction
of Indian
heigh
t gap
ldquoexplainedrdquo
estimation
strategy
source
slop
e 0
1
2
3
4
5
Africa (8
DHS)
US
53
Indiarsquos
TSC high
Indiarsquos
TSC low
experim
ent
OLS
experim
ent
TOT
IV
DHS
means
FEs
DHS
means
con
trols
DHS
means
SAampSSA
India district FEs
India
and
Africa
S (2012)dagger
S (2012)dagger
HampS
(2012)dagger
HampS
(2012)dagger
Tab
le 1
Tab
le 1
Tab
le 5
Tab
le 6
Tab
le 8
1592
1153
0786
2928
0962
1111
0721
0533
0420
3542
2565
1748
6514
2140
2471
1604
1185
0934
0440
0319
0217
0810
0266
0307
0199
0148
0116
dagger These are probab
ly overestim
ates
of the eff
ects
of sanitation
coverag
e becau
se the program
s they
study
also motivate use
of existing latrines
The ldquoT
able
5rdquo estimate is
not in
fact
from
tab
le 5 but is
fou
nd
by
estim
ating the regression
in
column
3 w
ithou
t the Sou
th A
sia indicator
variab
le Error
bars in
the fourth
column
plot 95
percent confidence
intervals for the estimate of
linear differen
ce in
heigh
t-for-ag
e standard
deviation
s associated
with
a 0
to 1 difference
in
the fraction
openly
defecating
The fourth
column
divides
the point estimate by
045
- WPS 6351 cover
- wps6351
-

(a) children born in the last 3 years
-3-2
-10
1
aver
age
heig
ht-f
or-a
ge z
-sco
re
-6 -4 -2 0 2 4
log of people who defecate openly per square kilometer
(b) children born in the last 5 years
-25
-2-1
5-1
-5
0
aver
age
heig
ht-f
or-a
ge z
-sco
re
-6 -4 -2 0 2 4log of people who defecate openly per square kilometer
Figure 4 Open defecation interacts with population density to predict child height Solid OLS regression lines weight by country population dashed lines are unweighted
40
-25
-2-1
5-1
-5
0he
ight
-for
-age
z s
core
0 10 20 30 40age in months
95 CI Indian children95 CI 95 CIsanitation coefficient sanitation coefficient GDP control
Figure 5 Open defecation is more steeply associated with child height at older ages Confidence intervals are estimates of the coefficient from a regression of average country-level child
height-for-age on open defecation restricting the sample to four age categories The curve plots the
average height-for-age z-score of Indian children by age for reference
41
(a) India (NFHS-3)
-22
-2-1
8-1
6-1
4
heig
ht-f
or-a
ge z
-sco
re
0 2 4 6 8 1village-level open defecation
95 CI household openly defecates
does not openly defecate
(b) five African countries (8 pooled DHS surveys)
-22
-2-1
8-1
6-1
4he
ight
-for
-age
z-s
core
0 2 4 6 8 1village-level open defecation
95 CI household openly defecatesdoes not openly defecate
Figure 6 Negative externalities Village-level open defecation predicts child height Vertical dotted lines mark the overall mean open defecation fraction in these two rural samples
42
(a) infant mortality
5010
015
020
0in
fant
mor
talit
y ra
te (
per
100
0)
0 2 4 6 8 1village-level open defecation
regional means pooled India amp Africa
India five African countries
(b) asset ownership
01
23
asse
t cou
nt
0 2 4 6 8 1village-level open defecation
regional means pooled India amp Africa
India five African countries
Figure 7 Simpsonrsquos paradox open defecation and well-being across and within regions
43
12
34
mot
her-
child
hei
ght c
orre
atio
n
0 2 4 6 8 1
village-level open defecation
95 CI US (NLSY-79)
India local polynomial India OLS
Africa local polynomial Africa OLS
Figure 8 Open defecation is associated with reduced mother-child height correlation
44
Table 1 Open defecation predicts child height across DHS surveys (1) (2) (3) (4) (5) (6) (7)
Panel A Average height-for-age z-score of children born in last 3 years open defecation -1239 -1326 -1002 -0962 -1028dagger -1111 -0663
(0226) (0158) (0156) (0434) (0583) (0505) (0181) open defecation -1499 times density (0631)
ln(GDP) 0202 0512 0472 0757dagger 0280 (00733) (0146) (0174) (0423) (00525)
womenrsquos height 00130 -00564 -00369 00425 (00476) (00904) (0106) (00143)
population density 00418 (0190)
year FEs country FEs region time trends controls n (DHS surveys) 140 140 140 130 130 102 130 R2 0542 0679 0744 0988 0990 0991 0862
Panel B Average height-for-age z-score of children born in last 5 years open defecation -1211 -1443 -0910 -1335 -1175 -1354dagger -0689
(0290) (0203) (0208) (0474) (0806) (0704) (0154) open defecation -1446 times density (0549)
ln(GDP) 0276 0270 0208 0178 0341 (00859) (0208) (0308) (0226) (00454)
womenrsquos height 00674 -00180 00352 00544 (00774) (0145) (0107) (00147)
population density -00181 (0137)
year FEs country FEs region time trends controls n (DHS surveys) 117 117 117 108 108 104 108 R2 0369 0555 0689 0990 0991 0991 0893
Standard errors clustered by country in parentheses (65 countries in panel A 59 in panel B)
p-values dagger p lt 01 p lt 005 p lt 001 p lt 0001 Open defecation is a fraction 0 to 1 Population
density is demeaned to preserve the interpretation of open defecation Controls are calorie deficit female
literacy water within 15 minutes knowledge of oral rehydration polity score and autocracy score see the
text for more complete variable definitions
45
46
Tab
le 2 Open
defecation
predicts
child
heigh
t omitting each
world
region
in
turn
(1)
(2)
(3)
(4)
(5)
(6)
omitted
region
SS Africa
S Asia
MEamp
NA
f
C Asia
SE Asia
L Amer
Pan
el A
year
fixed
effects no controls
open
defecation
-1711
-0988
-1081
-1316
-1352
-1186
(0240)
(0140)
(0216)
(0165)
(0161)
(0186)
n (DHS
surveys)
62
129
121
135
135
118
R 2
0808
0517
0620
0680
0683
0721
Pan
el B
year
fixed
effects control
for
ln(G
DP)
open
defecation
-0733
-0387
-0866
-1001
-1028
-1065
(0195)
(0151)
(0178)
(0162)
(0157)
(0169)
n (DHS
surveys)
62
129
121
135
135
118
R 2
0925
0703
0693
0741
0747
0736
Pan
el C
year
fixed
effects control
for
average
heigh
t of
wom
enop
en defecation
-0679
dagger -0994
-0864
-1064
-1096
-0911
(0364)
(0135)
(0202)
(0157)
(0150)
(0186)
n (DHS
surveys)
57
121
112
125
125
110
R 2
0880
0522
0639
0698
0701
0768
Dep
endent variable
is mean
heigh
t-for-ag
e of
children
under
3 Standard
errors clustered
by
cou
ntry
in
parentheses p-values dagger plt
01 p
lt 005
p
lt 001
plt
0001
Open
defecation
is a fraction
0 to 1
Table 3 Alternative ldquoplacebordquo independent variables do not predict height conditional on sanitation
variable (1)
female literacy (2)
nearby water (3)
calorie deficit (4)
electrification
ldquoplacebordquo variable
open defecation
ln(GDP) year FEs n (DHS surveys) R2
000348 (000327) -0880 (0205)
138 0752
000382 (000268) -1077 (0158)
124 0792
00000230 (0000964) -1002 (0157)
140 0744
-000271 (000226) -0918 (0141)
135 0726
variable (5)
autocracy (6)
polity score (7)
breastfeeding (8)
fed other liquids
ldquoplacebordquo variable
open defecation
ln(GDP) year FEs n (DHS surveys) R2
00248 (00175) -0867 (0207)
136 0753
-00119 (000787) -0843 (0212)
138 0753
-0054 (0036)
-1123 (0187)
139 0689
0003 (0002)
-1101 (0186)
132 0702
Dependent variable is mean height-for-age of children under 3 Standard errors clustered by country in
parentheses p-values dagger p lt 01 p lt 005 p lt 001 p lt 0001 Open defecation is a fraction
47
Tab
le 4 Open
defecation
is more steeply
associated
with
child
heigh
t in
urban
than
in
rural areas
(1)
(2)
(3)
(4)
(5)
(6)
(7)
subsample
total
urban
urban
urban
rural
rural
rural
Pan
el A
Heigh
t-for-age z-score of
children
under
3
48
open
defecation
-1239
-2577
-1577
(0226)
(0688)
(0504)
rural =
urban
wom
enrsquos
heigh
t 00512
(00130)
rural =
urban
year
FEs
n (DHS
surveys)
140
140
130
R 2
0542
0403
0518
Pan
el B
Heigh
t-for-age z-score of
children
under
5
-1603
(0447)
00506
(000924)
130
0638
-0853
(0173)
χ 2 =
950
p =
0002
140
0467
-0572
(0157)
χ 2 =
607
p =
0014
00407
(00144)
χ
2 =
220
p =
0138
130
0506
-0689
(0143)
χ 2 =
669
p =
0009
00409
(00107)
χ
2 =
179
p =
0181
130
0624
open
defecation
-1211
-2219
-1620
-1875
-0755
-0527
-0743
(0290)
(0825)
(0586)
(0487)
(0233)
(0198)
(0161)
rural =
urban
χ
2 =
516
χ
2 =
701
χ
2 =
1074
p =
0023
p =
0008
p =
0000
wom
enrsquos
heigh
t 00620
00606
00489
00523
(00141)
(00138)
(00172)
(00152)
rural =
urban
χ
2 =
490
χ
2 =
202
p =
0027
p =
0155
year
FEs
n
(DHS
surveys)
117
117
108
108
117
108
108
R 2
0369
0201
0540
0643
0270
0423
0548
Standard
errors
clustered
by
cou
ntry
in
parentheses
(65
cou
ntries in
pan
el A
59
in
pan
el B
) p-values dagger plt
01 plt
005
plt
001
plt
0001
Open
defecation
is a fraction
0 to 1
χ 2 tests in
columns 5
6 an
d 7
test for equality
with
the coeffi
cients
in
columns 2
3 and
4
respectively
49
Tab
le 5 Open
defecation
linearly
explains much
of the Sou
th A
sia-Africa heigh
t gap
(1)
(2)
(3)
(4)
(5)
(6)
(7)
(8)
(9)
sample
full
restricted
restricted
restricted
restricted
restricted
restricted
restricted
restricted
Sou
th A
sia
-0349
-0360
-0253
-0061
-0424
-0488
-0129
-0364
0029
(00469)
(00521)
(00734)
(0162)
(0050)
(0109)
(0181)
(0084)
(0184)
percent explained
30
83
73
92
op
en defecation
-0456
(0173)
open
defecators
-1758
-2184
-1998
dagger
per
square km
(0865)
(0961)
(1094)
pop
ulation
density
0185
(0062)
ln(G
DP)
0205
0227dagger
0077
0068
(0122)
(0123)
(0084)
(0082)
year
FEs
n
(DHS
surveys)
100
89
89
89
89
89
89
89
89
R 2
0390
0391
0497
0433
0416
0495
0727
0786
0800
Dep
endent variable
is mean
heigh
t-for-ag
e of
children
under
3 Standard
errors clustered
by
cou
ntry
in
parentheses p-values dagger plt
01 p
lt 005
p
lt 001
plt
0001
Open
defecation
is a fraction
0 to 1
Sou
th A
sia is
a dummy
indicator The ldquorestrictedrdquo sample
is the set of
observations with
inform
ation
on
both
heigh
t an
d open
defecation The ldquofullrdquo sample
includes
all
observations from
Sou
th A
sia or
sub-Saharan
Africa
Table 6 Change over time in a panel of Indian districts NFHS-1 1992-3 to NFHS-2 1998-9 (1) (2) (3) (4)
Panel A Repeated cross section (OLS) district open defecation -0779 -0279
(0155) (0193) village open defecation -0537 -0523 -0774
(0128) (0104) (0170) village open defecation2 0134
(0367) survey round fixed effect age-in-months times sex control variables
Panel B District fixed effects district open defecation -0525dagger 0106
(0307) (0321) village open defecation -0553 -0353 -0710
(0125) (0117) (0179) village open defecation2 -0548
(0337) survey round fixed effect age-in-months times sex control variables
n (children under 3) 23588 23588 23588 23588 Dependent variable is height-for-age z-score of children under 3 Standard errors clustered by district
(across survey rounds) in parentheses p-values dagger p lt 01 p lt 005 p lt 001 p lt 0001 Open
defecation is a fraction 0 to 1 Controls are at the household or child level electrification water supply
household size indictors for being Hindu or Muslim a full set of birth order indicators interacted with the
relationship of the childrsquos mother to the head of the household twinship indicators and month-of-birth
indicators ldquoLinear predicted height changerdquo multiplies the statistically significant coefficient on open
defecation by 0063 the change in rural open defecation between the NFHS-1 and NFHS-2 to make a
linear prediction based only on sanitation of the change in height which was about 0022 Only rural
subsamples are used
50
Table 7 Village open defecation predicts child height India and African DHS data (1) (2) (3) (4) (5)
Panel A India (2005 NFHS-3 rural sub-sample) village open defecation -0305 -0289 -0257 -0217 -0216
(00644) (00636) (00579) (00886) (00879) village open defecation2 -0208 00746 -0111 -0174
(0210) (0191) (0224) (0220) household open defecation -0413 -0413 -00999 -0419 -0181
(00356) (00356) (00380) (00353) (00376) controls state fixed effects n (children under 5) 26832 26832 26832 26832 26832
Panel B five African countries (8 DHS surveys rural sub-samples) village open defecation -0294 -0361 -0179 -00551 000776
(00575) (00598) (00599) (00712) (00696) village open defecation2 -0726 -0572 -0569 -0523
(0193) (0187) (0196) (0191) household open defecation -00783dagger -00767dagger 00161 -00804 -0000619
(00404) (00403) (00400) (00404) (00402) controls DHS survey (country-year) FEs n (children under 5) 44216 44216 44216 44216 44216 Dependent variable is height-for-age z-score of children under 5 Standard errors clustered by village
(survey PSU) p-values dagger p lt 01 p lt 005 p lt 001 p lt 0001 Village open defecation is a
fraction 0 to 1 household open defecation is an indicator 0 or 1 Controls are at the household or child
level 120 age-in-month by sex indicators indicators for household dirt floor access to piped water
electricity TV bicycle motorcycle and clean cooking fuel and motherrsquos literacy knowledge of oral
rehydration age at first birth count of children ever born and relationship to the head of the household
51
52
Tab
le 8 Decom
position
of rural India-A
frica heigh
t difference Fraction
due to
open
defecation
(1)
(2)
(3)
(4)
(5)
(6)
(7)
(8)
(9)
(10)
covariates
non
e birth
dem
ography
socio-econ
omic
IM
R (village-level)
motherrsquos
heigh
tsanitation
n (children)
71048
71048
71048
71048
71048
71048
71048
71048
70596
70596
Pan
el A
Pooled
OLS
regression with
an
indicator
for
the Indian
sub-sam
ple
India
indicator
-0142
-0001
-0191
-0049
-0301
-0233
-0243
-0099
0134
0262
(0026)
(0026)
(0026)
(0027)
(0028)
(0030)
(0026)
(0028)
(0027)
(0027)
village
open
-0480
-0432
-0177
-0418
-0420
defecation
(0035)
(0035)
(0036)
(0035)
(0034)
R 2
00015
00090
00073
00142
00308
00318
00059
00124
00271
00337
explained
0994
0754
0225
0593
not
applicable
indicator
equal
χ 2 1
= 136
χ
2 1 =
130
χ
2 1 =
24
χ 2 1
= 120
χ
2 1 =
136
Pan
el B
Oax
aca-Blinder
decom
position
adding linear village-level
san
itation unexplained
difference
difference
-0142
0024
-0203
-0045
-0316
-0237
-0258
-0082
0149
0297
(0026)
(0026)
(0025)
(0027)
(0028)
(0030)
(0027)
(0029)
(0027)
(0027)
explained
1169
0781
0250
0682
not
applicable
Pan
el C
Non
-param
etric reweigh
ting decom
position counterfactual
difference
in
means
difference
-0142
0061
-0242
-0022
-0367
-0186
-0154
-0005
0215
0396
chan
ge
0203
0220
0181
0149
0181
explained
143
0908
0493
0967
not
applicable
Tab
le 9 W
hat
fraction
of international
heigh
t differences can
open
defecation
explain
fraction
of Indian
heigh
t gap
ldquoexplainedrdquo
estimation
strategy
source
slop
e 0
1
2
3
4
5
Africa (8
DHS)
US
53
Indiarsquos
TSC high
Indiarsquos
TSC low
experim
ent
OLS
experim
ent
TOT
IV
DHS
means
FEs
DHS
means
con
trols
DHS
means
SAampSSA
India district FEs
India
and
Africa
S (2012)dagger
S (2012)dagger
HampS
(2012)dagger
HampS
(2012)dagger
Tab
le 1
Tab
le 1
Tab
le 5
Tab
le 6
Tab
le 8
1592
1153
0786
2928
0962
1111
0721
0533
0420
3542
2565
1748
6514
2140
2471
1604
1185
0934
0440
0319
0217
0810
0266
0307
0199
0148
0116
dagger These are probab
ly overestim
ates
of the eff
ects
of sanitation
coverag
e becau
se the program
s they
study
also motivate use
of existing latrines
The ldquoT
able
5rdquo estimate is
not in
fact
from
tab
le 5 but is
fou
nd
by
estim
ating the regression
in
column
3 w
ithou
t the Sou
th A
sia indicator
variab
le Error
bars in
the fourth
column
plot 95
percent confidence
intervals for the estimate of
linear differen
ce in
heigh
t-for-ag
e standard
deviation
s associated
with
a 0
to 1 difference
in
the fraction
openly
defecating
The fourth
column
divides
the point estimate by
045
- WPS 6351 cover
- wps6351
-
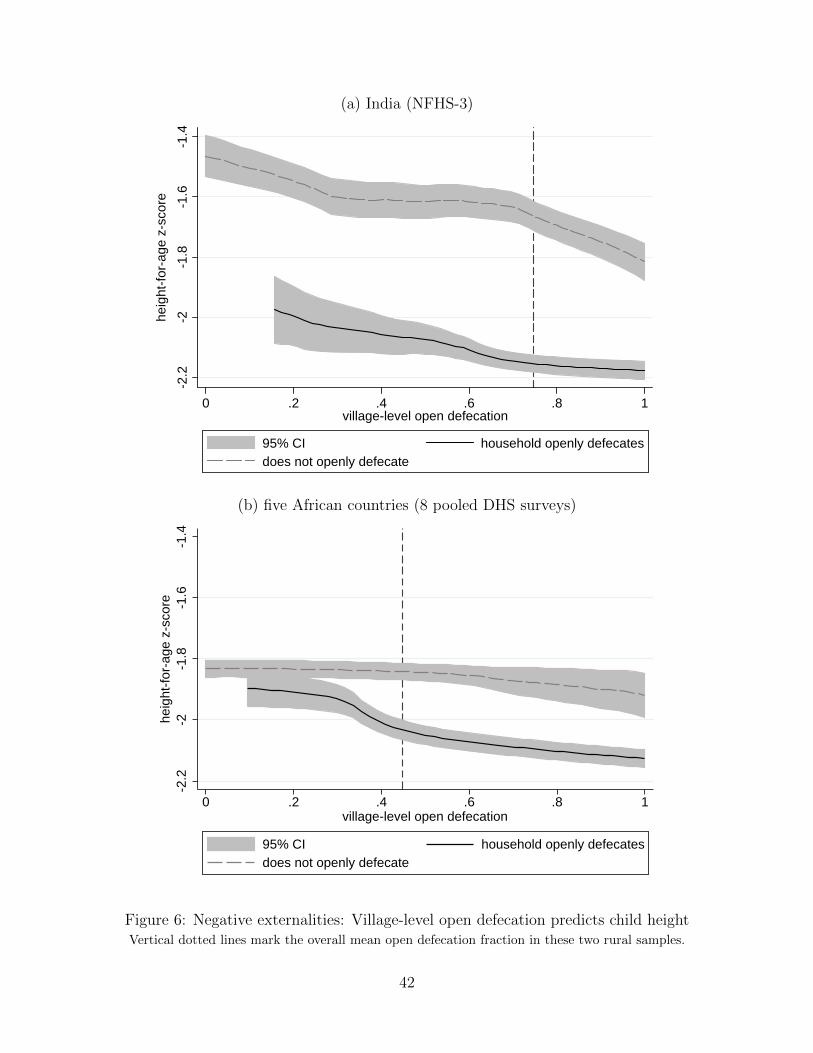
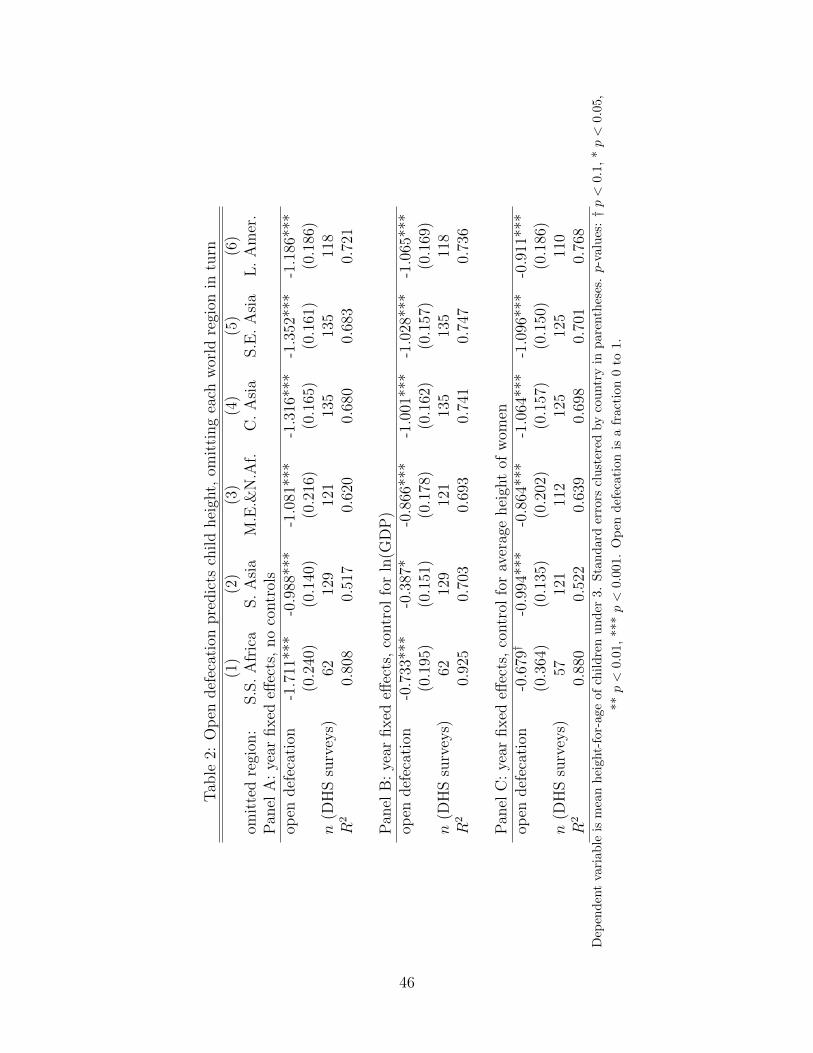
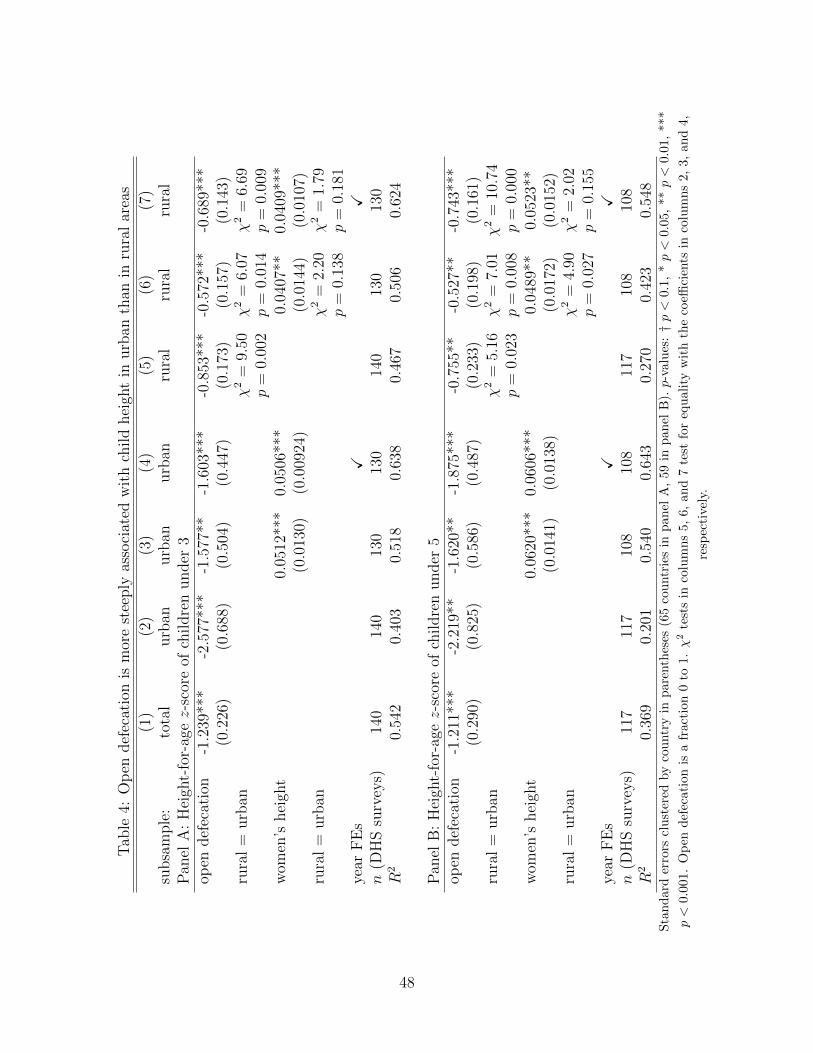
Tab
le 4 Open
defecation
is more steeply
associated
with
child
heigh
t in
urban
than
in
rural areas
(1)
(2)
(3)
(4)
(5)
(6)
(7)
subsample
total
urban
urban
urban
rural
rural
rural
Pan
el A
Heigh
t-for-age z-score of
children
under
3
48
open
defecation
-1239
-2577
-1577
(0226)
(0688)
(0504)
rural =
urban
wom
enrsquos
heigh
t 00512
(00130)
rural =
urban
year
FEs
n (DHS
surveys)
140
140
130
R 2
0542
0403
0518
Pan
el B
Heigh
t-for-age z-score of
children
under
5
-1603
(0447)
00506
(000924)
130
0638
-0853
(0173)
χ 2 =
950
p =
0002
140
0467
-0572
(0157)
χ 2 =
607
p =
0014
00407
(00144)
χ
2 =
220
p =
0138
130
0506
-0689
(0143)
χ 2 =
669
p =
0009
00409
(00107)
χ
2 =
179
p =
0181
130
0624
open
defecation
-1211
-2219
-1620
-1875
-0755
-0527
-0743
(0290)
(0825)
(0586)
(0487)
(0233)
(0198)
(0161)
rural =
urban
χ
2 =
516
χ
2 =
701
χ
2 =
1074
p =
0023
p =
0008
p =
0000
wom
enrsquos
heigh
t 00620
00606
00489
00523
(00141)
(00138)
(00172)
(00152)
rural =
urban
χ
2 =
490
χ
2 =
202
p =
0027
p =
0155
year
FEs
n
(DHS
surveys)
117
117
108
108
117
108
108
R 2
0369
0201
0540
0643
0270
0423
0548
Standard
errors
clustered
by
cou
ntry
in
parentheses
(65
cou
ntries in
pan
el A
59
in
pan
el B
) p-values dagger plt
01 plt
005
plt
001
plt
0001
Open
defecation
is a fraction
0 to 1
χ 2 tests in
columns 5
6 an
d 7
test for equality
with
the coeffi
cients
in
columns 2
3 and
4
respectively
49
Tab
le 5 Open
defecation
linearly
explains much
of the Sou
th A
sia-Africa heigh
t gap
(1)
(2)
(3)
(4)
(5)
(6)
(7)
(8)
(9)
sample
full
restricted
restricted
restricted
restricted
restricted
restricted
restricted
restricted
Sou
th A
sia
-0349
-0360
-0253
-0061
-0424
-0488
-0129
-0364
0029
(00469)
(00521)
(00734)
(0162)
(0050)
(0109)
(0181)
(0084)
(0184)
percent explained
30
83
73
92
op
en defecation
-0456
(0173)
open
defecators
-1758
-2184
-1998
dagger
per
square km
(0865)
(0961)
(1094)
pop
ulation
density
0185
(0062)
ln(G
DP)
0205
0227dagger
0077
0068
(0122)
(0123)
(0084)
(0082)
year
FEs
n
(DHS
surveys)
100
89
89
89
89
89
89
89
89
R 2
0390
0391
0497
0433
0416
0495
0727
0786
0800
Dep
endent variable
is mean
heigh
t-for-ag
e of
children
under
3 Standard
errors clustered
by
cou
ntry
in
parentheses p-values dagger plt
01 p
lt 005
p
lt 001
plt
0001
Open
defecation
is a fraction
0 to 1
Sou
th A
sia is
a dummy
indicator The ldquorestrictedrdquo sample
is the set of
observations with
inform
ation
on
both
heigh
t an
d open
defecation The ldquofullrdquo sample
includes
all
observations from
Sou
th A
sia or
sub-Saharan
Africa
Table 6 Change over time in a panel of Indian districts NFHS-1 1992-3 to NFHS-2 1998-9 (1) (2) (3) (4)
Panel A Repeated cross section (OLS) district open defecation -0779 -0279
(0155) (0193) village open defecation -0537 -0523 -0774
(0128) (0104) (0170) village open defecation2 0134
(0367) survey round fixed effect age-in-months times sex control variables
Panel B District fixed effects district open defecation -0525dagger 0106
(0307) (0321) village open defecation -0553 -0353 -0710
(0125) (0117) (0179) village open defecation2 -0548
(0337) survey round fixed effect age-in-months times sex control variables
n (children under 3) 23588 23588 23588 23588 Dependent variable is height-for-age z-score of children under 3 Standard errors clustered by district
(across survey rounds) in parentheses p-values dagger p lt 01 p lt 005 p lt 001 p lt 0001 Open
defecation is a fraction 0 to 1 Controls are at the household or child level electrification water supply
household size indictors for being Hindu or Muslim a full set of birth order indicators interacted with the
relationship of the childrsquos mother to the head of the household twinship indicators and month-of-birth
indicators ldquoLinear predicted height changerdquo multiplies the statistically significant coefficient on open
defecation by 0063 the change in rural open defecation between the NFHS-1 and NFHS-2 to make a
linear prediction based only on sanitation of the change in height which was about 0022 Only rural
subsamples are used
50
Table 7 Village open defecation predicts child height India and African DHS data (1) (2) (3) (4) (5)
Panel A India (2005 NFHS-3 rural sub-sample) village open defecation -0305 -0289 -0257 -0217 -0216
(00644) (00636) (00579) (00886) (00879) village open defecation2 -0208 00746 -0111 -0174
(0210) (0191) (0224) (0220) household open defecation -0413 -0413 -00999 -0419 -0181
(00356) (00356) (00380) (00353) (00376) controls state fixed effects n (children under 5) 26832 26832 26832 26832 26832
Panel B five African countries (8 DHS surveys rural sub-samples) village open defecation -0294 -0361 -0179 -00551 000776
(00575) (00598) (00599) (00712) (00696) village open defecation2 -0726 -0572 -0569 -0523
(0193) (0187) (0196) (0191) household open defecation -00783dagger -00767dagger 00161 -00804 -0000619
(00404) (00403) (00400) (00404) (00402) controls DHS survey (country-year) FEs n (children under 5) 44216 44216 44216 44216 44216 Dependent variable is height-for-age z-score of children under 5 Standard errors clustered by village
(survey PSU) p-values dagger p lt 01 p lt 005 p lt 001 p lt 0001 Village open defecation is a
fraction 0 to 1 household open defecation is an indicator 0 or 1 Controls are at the household or child
level 120 age-in-month by sex indicators indicators for household dirt floor access to piped water
electricity TV bicycle motorcycle and clean cooking fuel and motherrsquos literacy knowledge of oral
rehydration age at first birth count of children ever born and relationship to the head of the household
51
52
Tab
le 8 Decom
position
of rural India-A
frica heigh
t difference Fraction
due to
open
defecation
(1)
(2)
(3)
(4)
(5)
(6)
(7)
(8)
(9)
(10)
covariates
non
e birth
dem
ography
socio-econ
omic
IM
R (village-level)
motherrsquos
heigh
tsanitation
n (children)
71048
71048
71048
71048
71048
71048
71048
71048
70596
70596
Pan
el A
Pooled
OLS
regression with
an
indicator
for
the Indian
sub-sam
ple
India
indicator
-0142
-0001
-0191
-0049
-0301
-0233
-0243
-0099
0134
0262
(0026)
(0026)
(0026)
(0027)
(0028)
(0030)
(0026)
(0028)
(0027)
(0027)
village
open
-0480
-0432
-0177
-0418
-0420
defecation
(0035)
(0035)
(0036)
(0035)
(0034)
R 2
00015
00090
00073
00142
00308
00318
00059
00124
00271
00337
explained
0994
0754
0225
0593
not
applicable
indicator
equal
χ 2 1
= 136
χ
2 1 =
130
χ
2 1 =
24
χ 2 1
= 120
χ
2 1 =
136
Pan
el B
Oax
aca-Blinder
decom
position
adding linear village-level
san
itation unexplained
difference
difference
-0142
0024
-0203
-0045
-0316
-0237
-0258
-0082
0149
0297
(0026)
(0026)
(0025)
(0027)
(0028)
(0030)
(0027)
(0029)
(0027)
(0027)
explained
1169
0781
0250
0682
not
applicable
Pan
el C
Non
-param
etric reweigh
ting decom
position counterfactual
difference
in
means
difference
-0142
0061
-0242
-0022
-0367
-0186
-0154
-0005
0215
0396
chan
ge
0203
0220
0181
0149
0181
explained
143
0908
0493
0967
not
applicable
Tab
le 9 W
hat
fraction
of international
heigh
t differences can
open
defecation
explain
fraction
of Indian
heigh
t gap
ldquoexplainedrdquo
estimation
strategy
source
slop
e 0
1
2
3
4
5
Africa (8
DHS)
US
53
Indiarsquos
TSC high
Indiarsquos
TSC low
experim
ent
OLS
experim
ent
TOT
IV
DHS
means
FEs
DHS
means
con
trols
DHS
means
SAampSSA
India district FEs
India
and
Africa
S (2012)dagger
S (2012)dagger
HampS
(2012)dagger
HampS
(2012)dagger
Tab
le 1
Tab
le 1
Tab
le 5
Tab
le 6
Tab
le 8
1592
1153
0786
2928
0962
1111
0721
0533
0420
3542
2565
1748
6514
2140
2471
1604
1185
0934
0440
0319
0217
0810
0266
0307
0199
0148
0116
dagger These are probab
ly overestim
ates
of the eff
ects
of sanitation
coverag
e becau
se the program
s they
study
also motivate use
of existing latrines
The ldquoT
able
5rdquo estimate is
not in
fact
from
tab
le 5 but is
fou
nd
by
estim
ating the regression
in
column
3 w
ithou
t the Sou
th A
sia indicator
variab
le Error
bars in
the fourth
column
plot 95
percent confidence
intervals for the estimate of
linear differen
ce in
heigh
t-for-ag
e standard
deviation
s associated
with
a 0
to 1 difference
in
the fraction
openly
defecating
The fourth
column
divides
the point estimate by
045
- WPS 6351 cover
- wps6351
-

Tab
le 9 W
hat
fraction
of international
heigh
t differences can
open
defecation
explain
fraction
of Indian
heigh
t gap
ldquoexplainedrdquo
estimation
strategy
source
slop
e 0
1
2
3
4
5
Africa (8
DHS)
US
53
Indiarsquos
TSC high
Indiarsquos
TSC low
experim
ent
OLS
experim
ent
TOT
IV
DHS
means
FEs
DHS
means
con
trols
DHS
means
SAampSSA
India district FEs
India
and
Africa
S (2012)dagger
S (2012)dagger
HampS
(2012)dagger
HampS
(2012)dagger
Tab
le 1
Tab
le 1
Tab
le 5
Tab
le 6
Tab
le 8
1592
1153
0786
2928
0962
1111
0721
0533
0420
3542
2565
1748
6514
2140
2471
1604
1185
0934
0440
0319
0217
0810
0266
0307
0199
0148
0116
dagger These are probab
ly overestim
ates
of the eff
ects
of sanitation
coverag
e becau
se the program
s they
study
also motivate use
of existing latrines
The ldquoT
able
5rdquo estimate is
not in
fact
from
tab
le 5 but is
fou
nd
by
estim
ating the regression
in
column
3 w
ithou
t the Sou
th A
sia indicator
variab
le Error
bars in
the fourth
column
plot 95
percent confidence
intervals for the estimate of
linear differen
ce in
heigh
t-for-ag
e standard
deviation
s associated
with
a 0
to 1 difference
in
the fraction
openly
defecating
The fourth
column
divides
the point estimate by
045
- WPS 6351 cover
- wps6351
-