how much can societal turning points affect forecasts
TRANSCRIPT

RESEARCH ARTICLE Open Access
How much can societal turning pointsaffect forecasts’ accuracy in Europe? Caseof post-communistic transformation inSlovakia and the Czech RepublicBranislav Bleha
Abstract
It seems that the least accurate (population) forecasts are those published in the period of great historical turningpoints both economic and political. Several studies analysed the forecasts’ accuracy in Western countries, but thepost-1990 development in the post-communistic countries has not been analysed in this respect. The general goalof the study is to show how hardly predictable and poorly predicted the demographical processes have appearedto be during the major societal and economic turning points after the post-communistic transformation started. Todo this, the study first provides an exact measurement of the forecasts’ accuracy in transitioning Slovakia andCzechia. The key finding is that the forecasters either did not recognise the beginning of somewhat completely“new” or underestimated the dimensions of the turning points and turns in the recent trends. Thus, the assumption“drag” shows up much more frequently than some kind of over-reaction. Implicitly, the research re-opens aperpetual question whether methodological–mathematical improvements are more (or less) important than thedeep insight into the forecasted processes. Secondly, the study demonstrates the range and dimension of changesthat impact the demographic present and future. Here, the alternative future is built and simulated in terms ofwhat the populations would have looked like if the socialist system had not collapsed. It is a quite simple but verysmart way how to demonstrate the range of turnover since 1989.
Keywords: Czech Republic, Slovak Republic, Transformation, Accuracy, Simulation, Turning point
Introduction—background and research questionsThe absolute majority in the set of current demographi-cal and subsequent economic forecasts goes from theirreversible population ageing all over the world. Europeis a leader in this negative trend. The opposite opinionsin the demographic debate practically do not exist. Butshould we be so sure in this concern? We try to demon-strate the potential uncertainties and show examplesfrom the past that brought a lot of surprising and un-expected developments. The political changes in Europearound 1990 started a transformation, social changesand fast demographic changes. A reduction in fertilityand an increase in life expectancy significantly alteredthe demographic trajectory. These are known facts,
analysed by hundreds of studies. We know that theimpact of changes on the population dynamics wasmassive, but European populations faced such big turn-ing points regularly throughout the twentieth century.After the WW2, the UN Population division and someother institutions and national authorities started topublish population forecasts regularly. The forecastmethods and practice and partly also their accuracy andlimits have become a subject of numerous studies mostlyin the last quarter of the twentieth century, with manyfresh studies having appeared in the new millennium,too. These studies have mostly focused on both how toevaluate and what indicators are appropriate for theevaluation. The key and principal questions involve theaccuracy factors, appropriateness of a method or modelapplied, length of the forecasting period and improve-ment of knowledge on demographic processes. New
© The Author(s). 2019 Open Access This article is distributed under the terms of the Creative Commons Attribution 4.0International License (http://creativecommons.org/licenses/by/4.0/), which permits unrestricted use, distribution, andreproduction in any medium, provided you give appropriate credit to the original author(s) and the source, provide a link tothe Creative Commons license, and indicate if changes were made.
Correspondence: [email protected] of Natural Sciences, Comenius University in Bratislava, Ilkovičova 6,84215 Bratislava, Slovak Republic
European Journalof Futures Research
Bleha European Journal of Futures Research (2019) 7:6 https://doi.org/10.1186/s40309-019-0158-z

methods based on adjusted fertility rates [1] may, forinstance, lead to better understanding and forecasts offuture fertility. Such methods were not available untilthe 1990s. In one of his principal study, Keyfitz [2]points out the role of forecasts’ accuracy and subjectiveindividuality of the forecaster. At the same time, heemphasises improvements of UN forecasts throughoutthe decades following WW2. He also seeks the reasonsfor those improvements, though their relevancy orweight remains uncertain. Among them, he mentions amethodological upgrade versus weaker oscillations orunexpected shifts versus knowledge improvements. Stoto[3] comments on the accuracy of American forecasts inthe context of confidence intervals, applied methods andforecast period length and clearly distinguishes betweenprojections (simulations) and forecasts expressing sub-jective attitudes of the forecaster towards the future. Wepoint out that in our empirical case no forecast was pro-duced and we produced only simulation using post-diction and projection (see the “Data and methods” sec-tion). The abovementioned concepts are often misinter-preted even today by both forecasters and users of theforecasts. The alternative scenarios demonstrated in thesecond part of this study represent an alternative, virtualfuture, i.e. they represent a projection. Smith [4] high-lights the relevancy of confidence interval creation usingthe sets of empirical forecasts for nearly 3000 countiesin the USA. What is now a common method was onlybeing introduced then.A fruitful debate on forecasts concerning their reliabi-
lity and accuracy appeared in the 1990s. After all, thedebate resulted in the development of stochastic orprobabilistic approaches applied in population forecasts.One of the principal issues was an examination of fore-cast accuracy concerning the forecasting period length,error progress in time and mainly methods applied. Onthe one hand, Smith and Sincich [5] confirm a linear oralmost linear relationship between accuracy and forecastperiod length, but no significant relationship betweenbias and length of the horizon. The same authors [6]illustrate by US state forecasts that complex and sophis-ticated techniques bring neither more accurate nor lessbiased results compared to simple techniques such asnaive models. As shown by Sanderson [7], the use of awide 95% confidence interval does not guarantee thatthe results will be within the interval. Stochasticmethods witnessed a rapid boom in the 1990s and in thefirst decade of the new millennium, accompanied by thedevelopment of methods using accurate prediction inter-vals, such as ARIMA application [8]. Regardless of theexpansion of these methods including the ARIMAmodel and probabilistic methods, the issue of factors af-fecting inaccuracy is still on the table. Do better modelsgenerate more accurate forecasts? Although Rogers [9]
does not cast doubt upon previous examinations, he em-phasises that reality is probably more sophisticated, andthe forecast results do not reflect only models appliedbut also depend on the moment when the model isbeing applied. This is a very important part of the story.A complex overview of forecasts for industrialised coun-tries was made by Keilman [10]. Keilman and Kučera[11] bring an interesting comparison of the forecasts’accuracy in the Netherlands and Czechoslovakia. Theyclearly showed that advancement in the methodologyand the overall quality of demographic research (beinghigher in the Netherlands) did not correlate with the ac-curacy and the situation at the time of publication isvery important. As they assessed, the very first after-WW2-forecasts published in the 1950s (in case of theNetherlands) underestimated the level of fertility becausethe post-war baby-boom was even stronger than ex-pected, unlike the later ones from the period of around1967–1972, which were too optimistic because of down-ward trends in fertility. But one really ought to dis-tinguish between the post-war “baby-boom” effects andlater decrease that seems to be stronger just thanks tothe post-war effects died away. On the other side, somechanges seem to be cardinal (definitive below-replacement-levels of the TFR and some others). Itmight be extracted from the Dutch results that the fore-casters realised their excessive optimism towards fertilityonly around 1975 (and later), although fertility had beendropping at least for 6–7 years earlier. The errors in thenumber of births are much lower in later forecasts, forinstance in that from 1980, although there is still a slightoverestimation. What should be really stressed is that,actually, some forecasts published in the 1950s underes-timated fertility just after 5 years (since their publica-tion), whereas the overestimation is fact after 20 years.Thus, the length of an evaluating period matters espe-cially when turns are frequent and this is just the case ofthe decades after WW2. Similarly, profound and rapidchanges have been observed in former communist coun-tries. However, no complex research has shown how theforecasters overcame the most powerful demographicchanges of the 1990s. Thus, our first aim is to revealhow successful the forecasters were to cope with theturning moment, the new social and economic condi-tions and overall society transformation, examining aselection of subnational forecasts.The latter goal arises from the fact that many studies
tried to explain the changes in family and reproductionbehaviour in the post-communistic countries; however,the changes in the dynamics and ageing were not pre-cisely quantified so far. By now, it has not been shownhow the fall of the socialist regimes altered the previoustrajectory and to what extent it accelerated ageing anddepopulation. Thus, a simulation is aimed to quantify
Bleha European Journal of Futures Research (2019) 7:6 Page 2 of 12

the deviations between a “communistic” trajectory to beprolonged far beyond 1989 and the actual after-1989 tra-jectory. Like in the first goal concerning the accuracy, acomparison of the Slovak and Czech Republics has beenused also in the second goal. The major reason is thatseveral similarities as well as differences are appropriatefor studying these countries. It has been confirmed thatdemographic development is lagging behind in Slovakia,and transformational changes and timing changes (post-ponement and then recuperation) manifested in theCzech Republic somewhat earlier [12]. This was also thecase during the demographic transition in the nineteenthand twentieth centuries. It began later in Slovakia andwas finished faster. On the other side, both countriesshared the same political regime and, until 1989, theywere part of the same state. They differed in part from asocio-developmental perspective. Slovakia has alwaysshown a higher proportion of workers in agriculture butalso higher religiousness according to census data, agreater percentage of the Roma population often sociallysegregated [13, 14], and substantial immigration to theCzech Republic during the existence of the commonstate. Even after 1989, the Czech Republic remainssomewhat stronger economy with lower unemploymentand a higher figure of GDP per capita according to re-cent EUROSTAT data, although Slovakia, for example,adopted the Euro currency earlier, introduced pensionreforms and attracted many major investors.
Data and methodsConcerning the first goal focused on forecast accuracyexamination, two subnational forecasts [15, 16] wereanalysed. Both forecasts were generated in the period ofthe most dynamic changes in some of the demographicprocesses. The subnational forecasts were used to showsome spatial accuracy aspects, spatial forecast errorsdistribution and effects of inner migration. The latterwitnessed completely new phenomena such as amenitymigration and suburbanisation, above all. Such processeswere reported in Western Europe a few decades before,but they were quite new for countries such as formerCzechoslovakia. Were the forecasters capable to predicttheir rapid emergence and were their predictions finallyadequate?Two basic indicators of accuracy were applied, simi-
larly to some previously released studies focused onforecast accuracy evaluation. Of course, there is a varietyof more complicated and sophisticated indicators (seefor instance [17]) especially assessing subnational ormultistate forecasts. The following measures are ad-equate for our purposes. One of the elementary indica-tors is the percentage error (PE) expressing a relativedifference between real and forecast values in per cent.The mean percentage error (MPE) is a combination of
several percentage-error values such as medium repre-senting age categories (in age-structural analysis) ormedium error in a set of territorial units; in this case,local administrative units LAU 1 (districts) were consid-ered. By analogy, absolute percentage errors and conse-quently mean absolute percentage errors are calculated.As for the percentage errors, the deviations are bothpositive and negative, and mean error may also reachpositive as well as negative values. This indicates thedirection in which the forecast is wrong and whether thegeneral forecast is under- or overestimated.The latter goal includes a comparative simulation of
theoretical and real demographic scenarios until 2018and predicted subsequent demographic trends until2040. We used the currently existing national forecastspublished by official institutions in the Czech Republic[18] and Slovakia [19]. We used the medium scenarios.These scenarios represent the benchmark against whichwe compare the theoretical simulation. The simulationdemonstrates what development would have been like ifthe social and demographic changes had not occurredafter 1989. Thus, we tried to simulate what developmentwould have been if the values had been “frozen” at thelevel of 1989. The simulation has its starting point in1989, i.e. at the beginning of the political and socialchanges.For the simulation purposes, data of the year 1989
were used. It is the last year of the communist regime.The quantum and tempo of fertility and mortality thatwere actual in 1989 were used for the calibration of theprediction model. The age structure as of December 31,1989, was used; that date is the starting point for theprojection. From this point until the forecast horizon(2040), the model was calibrated every year using thesame values, the data valid for 1989. The results there-fore represent a hypothetical age structure of both coun-tries if a rapid after-1989 transformation of reproductivebehaviour did not occur.It should be noted that already in the 1980s, during
the socialist era, there was a change in reproduction be-haviour, fertility and mortality. The measures of com-munist governments, temporarily affecting an increasein fertility in the 1970s (but only briefly), lost their po-tential. It is interesting that even in the 1970s a tempor-ary increase in fertility first occurred in the CzechRepublic and with a certain delay in Slovakia. Also note-worthy is the fact that in the first 2 years after thechange of the regime in the Czech Republic (first 4 yearsin the case of the Slovak Republic), the total fertility rateremained at the initial level, and only then an enormousdecline came. It is likely that, even assuming a continu-ation of the communist establishment, there would besome further changes in reproduction. However, it is dif-ficult to estimate exactly what these changes would be.
Bleha European Journal of Futures Research (2019) 7:6 Page 3 of 12

Very likely, they would certainly be only moderate andnot so major as they actually were during the transform-ation. So, in a simplified way, we used precisely thevalues of 1989 as the last pre-transition year and weused a naive extrapolation model for the projection.Moreover, these values are close to the replacement levelof fertility. This helps demonstrate how the shift fromthe replacement level to lowest-low fertility affected andwill affect ageing and depopulation in the decades follow-ing 1990. At the same time, there are certain differencesin total fertility between the Czech Republic and Slovakia,which helped uncover the extent to which these, at a firstglance, relatively small differences influenced the differen-tiation (differences) of trajectories in these countries after1989. The common cohort–component model was usedfor prediction. The age-specific fertility rates and probabi-lities of deaths for both sexes are the major inputs,migration has not been incorporated.Figure 1 explains the basic idea of the simulation. As a
starting point for simulation, the “revolutionary” year1989 is set. From this starting point, the actual and fore-casted demographical developments are compared tothose simulated using both the post-diction and projec-tion. The period of the last three decades could besimply called as a period of transformation, and thefuture development as the post-transformation period,although they are different opinions when the societaltransformation did finish. In terms of demographicreproduction, the last decade is a “calming period” inwhich the radical turns in trends have damped out andmany indicators such as non-marital births or timing offertility touch the levels in the Western countries. Onthe other side, there has been still the phase of
recuperation, at least in some local populations, and thechildlessness is predicted to grow. Hence, the end oftransformation can only be estimated very roughly. From1989 to the present time, we simulated the three decadesof alternative history (no transformation, the communistregime remained). But this is not the end of the story.Our simulation is going also onward to the future, andin case of future predictions, the term projection is ac-curate. We used the past to project the future, whereasthe retrodiction means using the future to predict thepast, but this is truly not our case. Retrodiction andpost-diction generally are the forms of “reconstructionsof history” moving backward from the present to thepast, or from the past to the present [20, 21]. Both theretrodiction and post-diction are sometimes used freelyas the synonyms. Our simulation represents a post-diction in the period from 1989 to 2018 and a projection(projecting the future) in the period 2019–2040.Table 1 provides information on parameters entering
the model. The simulated 1989–2040 period is calibratedusing real official values of the year 1989, the last year ofthe communist era. For the population of Slovakia,therefore, fertility on the replacement level is by about0.2 children higher than that of the Czech Republic. His-torically, the values in the Czech Republic were lower.The difference is slight only; however, it plays a role inthe results. As for the timing of fertility, the curve ofage-specific fertility rates is much more asymmetrical,because of concentration of births in the younger ages.The mean age at first birth was 21–22 years only,whereas current values are by 5–6 years higher. Oneshould point out that not only the quantum (intensity)but also the tempo (timing) plays a role and was taken
Fig. 1 The conceptual framework of the simulation. Source: authors
Bleha European Journal of Futures Research (2019) 7:6 Page 4 of 12

into consideration. For instance, the share of realisedfertility in 1989 was approximately 45% in Slovakwomen aged 20–24, but the value dropped to less than20% in 2017. There is also some inter-generational shiftin reproductive behaviour based on which cohorts andin which age faced the starting of transformation [22].We only extract the assumptions and results of official
forecasts. The forecasts also used the common cohort–component method, so they are comparable. We have usedthe forecasts published by official statistical bodies in bothcountries. They estimate a fertility level roughly at the levelof 1.5 to 1.6 children in both countries in 2040. The datafrom the past confirm a certain “delayed pattern” in thecase of Slovakia. At the same time, there is a certain spacefor higher levels of fertility in Slovakia due to the represen-tation of the Roma population and higher religiosity inSlovakia. According to the results of the national popula-tion census in 2011, the share of believers in Slovakia was76%, while the Czech Republic is very likely the mostatheistic country in Europe with a 32% share merely.The values of life expectancy at birth grew before
1989, but very slowly (Table 2). In the case of males inSlovakia and the Czech Republic, it even stagnated (orgrew more or less negligibly) for a very long time, fromthe mid-1960s until the change of the political regime in1989. For women, it increased only slightly and thus thedifference between male and female values of life expect-ancy widened. For mortality, the impact of socialchanges is completely obvious. An analysis of avoidablemortality in the case of Slovakia speaks clearly. After1989, its level fell sharply in connection with changes inhealthcare, emergency rescue, environmental improve-ment, employment structure (less industry) and others.For example, in the 1993–1997 period, 53 of the 79districts of Slovakia recorded annually more than 5
avoidable deaths of males per 1000 European standardpopulation. In the 2009–2013 period, not even in one ofthe 79 districts did it exceed this value. It can thereforebe assumed that in the case of continuation of the com-munist establishment, at least male mortality wouldstagnate or increase only slightly. Both tables illustrate aclear gap between expected development and “frozen”development, although in the case of fertility an ex-pected increase of the TFR means convergence betweensimulated and forecasted values. It should be stated thatthe medium scenarios seem to be less optimistic thanthe very last trend shows, by any means, all availableforecasts published recently predict the TFR in Czechiaand Slovakia to be clearly below the replacement level,even in high fertility scenarios. There is still some poten-tial for recuperation, although the very crucial part ofrecuperation has already finished.Only the medium scenario was used in the study be-
cause this is given as the most likely future trajectoryand low together with high variants are only rough fron-tiers of future development. The high and low scenarioswould complicate the explanations much. For instance,in case of a high scenario, fertility is closer to the com-munist level of fertility and mortality is an opposite case.As for the range, for instance the difference between thehigh and low scenarios in the case of the fertility level inthe Slovak forecast is approximately 0.2 children in 2040(1.65–1.85), so it is not a wide range. In the case of mor-tality, the range is between 77 and 80 for males and be-tween 82 and 85 for females. There is an assumptionthat in the first decades the increase will be higher thanin later decades, the potential for growth will be spend-ing in the first period, mainly in higher ages in the caseof both sexes. No confidence intervals in terms ofpercentage expressions were published in the forecasts.
Table 1 Overview of values of the total fertility rate in selected years
Real data, 1950 Real data, 1989 Real data, 2015 1989–2018, simulation:post-diction period
2040, official forecast 2019–2040, simulation:projection period
Czech R. 2.80 1.87 1.46 1.87 1.53 1.87
Slovak R. 3.56 2.08 1.34 2.08 1.59 2.08
Source: [18, 19], Czech Statistical Office, Statistical Office of the Slovak Republic, own simulation
Table 2 Overview of values of life expectancy in selected years
Real data, 1950 Real data, 1989 Real data, 2015 1989–2018, simulation:post-diction period
2040, official forecast 2019–2040, simulation:projection period
Males
Czech R. 62.30 68.10 75.20 68.10 81.30 68.10
Slovak R. 58.96 66.88 72.90 66.88 79.70 66.88
Females
Czech R. 67.00 75.40 81.10 75.40 86.60 75.40
Slovak R. 62.76 75.36 79.61 75.36 84.90 75.36
Source: [18, 19], Czech Statistical Office, Statistical Office of the Slovak Republic, own simulation
Bleha European Journal of Futures Research (2019) 7:6 Page 5 of 12
The assumptions in the official forecasts are the fol-lowing. Both the Czech and Slovak forecasters see somepotential for a slight increase in fertility from the levelsof very-low fertility, driven by recuperation in the firstperiod and convergence to the levels common forWestern European countries (1.7–1.9). In general, theforecasters see no reasons for fertility being remained atsuch a low (current) level. The trend in life expectancyis positive and is assumed to stay growing in the comingdecades, although this is indeed still only gaining thesituation in Western Europe. The values in 2040 areexpected to be only slightly higher than the currentvalues in the countries such as France, Great Britain orGermany.Migration was not incorporated into the model. Its im-
pact on the dynamics was, and still is, not so significantas the impact of reproduction and population momen-tum. However, this is primarily a problem of obtainingreliable data. In particular, emigration is largely undocu-mented. A zero-migration variant, which we experimen-tally simulated as a check-point for the Slovak Republic,is only little different from the medium scenario. Thus,at least for the purposes of this study, which is a dichot-omous comparison of two completely different trajector-ies, we can abstract from migration. Migration has amore significant impact on the number of population,but it does not influence significantly the indicators ofageing. As shown in studies on replacement migration,only hundreds of thousands to millions of immigrantswould be able to reverse the increase of the mean age ofthe population in transition countries [23].
ResultsAccuracy in the context of developmental turning points.Is there an assumption drag?The key finding covers the fact that the forecasts did notreact accurately enough in the case of both countries.This statement refers to all three processes representingthe input parameters of the cohort–component model.The percentage error of population size by age in the
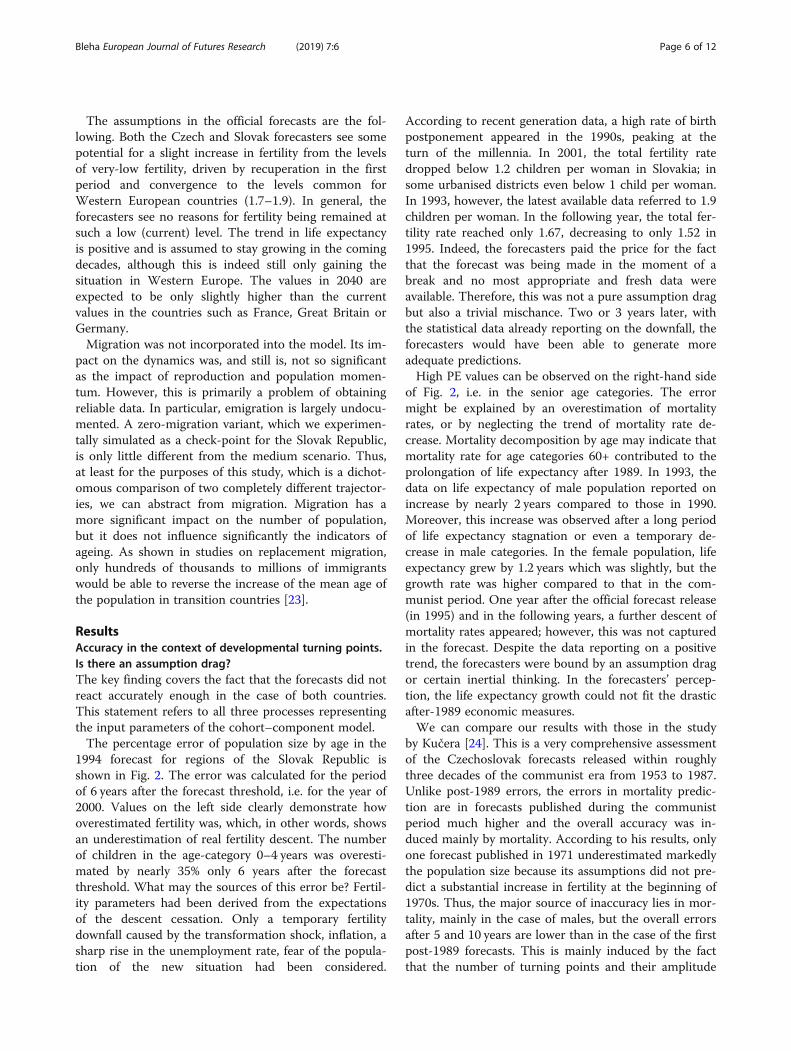
1994 forecast for regions of the Slovak Republic isshown in Fig. 2. The error was calculated for the periodof 6 years after the forecast threshold, i.e. for the year of2000. Values on the left side clearly demonstrate howoverestimated fertility was, which, in other words, showsan underestimation of real fertility descent. The numberof children in the age-category 0–4 years was overesti-mated by nearly 35% only 6 years after the forecastthreshold. What may the sources of this error be? Fertil-ity parameters had been derived from the expectationsof the descent cessation. Only a temporary fertilitydownfall caused by the transformation shock, inflation, asharp rise in the unemployment rate, fear of the popula-tion of the new situation had been considered.
According to recent generation data, a high rate of birthpostponement appeared in the 1990s, peaking at theturn of the millennia. In 2001, the total fertility ratedropped below 1.2 children per woman in Slovakia; insome urbanised districts even below 1 child per woman.In 1993, however, the latest available data referred to 1.9children per woman. In the following year, the total fer-tility rate reached only 1.67, decreasing to only 1.52 in1995. Indeed, the forecasters paid the price for the factthat the forecast was being made in the moment of abreak and no most appropriate and fresh data wereavailable. Therefore, this was not a pure assumption dragbut also a trivial mischance. Two or 3 years later, withthe statistical data already reporting on the downfall, theforecasters would have been able to generate moreadequate predictions.High PE values can be observed on the right-hand side
of Fig. 2, i.e. in the senior age categories. The errormight be explained by an overestimation of mortalityrates, or by neglecting the trend of mortality rate de-crease. Mortality decomposition by age may indicate thatmortality rate for age categories 60+ contributed to theprolongation of life expectancy after 1989. In 1993, thedata on life expectancy of male population reported onincrease by nearly 2 years compared to those in 1990.Moreover, this increase was observed after a long periodof life expectancy stagnation or even a temporary de-crease in male categories. In the female population, lifeexpectancy grew by 1.2 years which was slightly, but thegrowth rate was higher compared to that in the com-munist period. One year after the official forecast release(in 1995) and in the following years, a further descent ofmortality rates appeared; however, this was not capturedin the forecast. Despite the data reporting on a positivetrend, the forecasters were bound by an assumption dragor certain inertial thinking. In the forecasters’ percep-tion, the life expectancy growth could not fit the drasticafter-1989 economic measures.We can compare our results with those in the study
by Kučera [24]. This is a very comprehensive assessmentof the Czechoslovak forecasts released within roughlythree decades of the communist era from 1953 to 1987.Unlike post-1989 errors, the errors in mortality predic-tion are in forecasts published during the communistperiod much higher and the overall accuracy was in-duced mainly by mortality. According to his results, onlyone forecast published in 1971 underestimated markedlythe population size because its assumptions did not pre-dict a substantial increase in fertility at the beginning of1970s. Thus, the major source of inaccuracy lies in mor-tality, mainly in the case of males, but the overall errorsafter 5 and 10 years are lower than in the case of the firstpost-1989 forecasts. This is mainly induced by the factthat the number of turning points and their amplitude
Bleha European Journal of Futures Research (2019) 7:6 Page 6 of 12
was generally lower in previous periods than in post-1989 communist developments, and once occurred, theyinstantly affected the accuracy, for instance, the after-1970 growth in fertility. Kučera [25] assessed also errorsin regions (actually NUTS-3) and districts (actuallyLAU-1). He pointed out that the variability in the set ofsmaller geographical units is much higher, and this wasconfirmed also in our evaluation. To make the picturemore comprehensive, we mention also one currentanalysis from Slovakia [26]. The accuracy of the nationaldeterministic three-scenario-forecast from 2012 has beenanalysed until 2017. It should be remarked that thesecond decennium is a period of stabilisation bound torecuperation and slight increase from very-low fertilitylevels to levels close to the EU average and more. This isreflected in the results. The authors used Keyfitz’s indexof predictions’ quality (see [27] for details) and statedthat there is some underestimation of recuperation inthe case of fertility, but the results are generally satisfy-ing, especially in the case of mortality. The trends didjustice to reality adequately. Although the 2012 forecastused a very detailed methodology, multi-decompositionsand cohort approach, the main factor of relative successvery likely lies also in the period when published and inongoing years that can be marked as a “calm period”.Going back to the results of our evaluation, similar re-
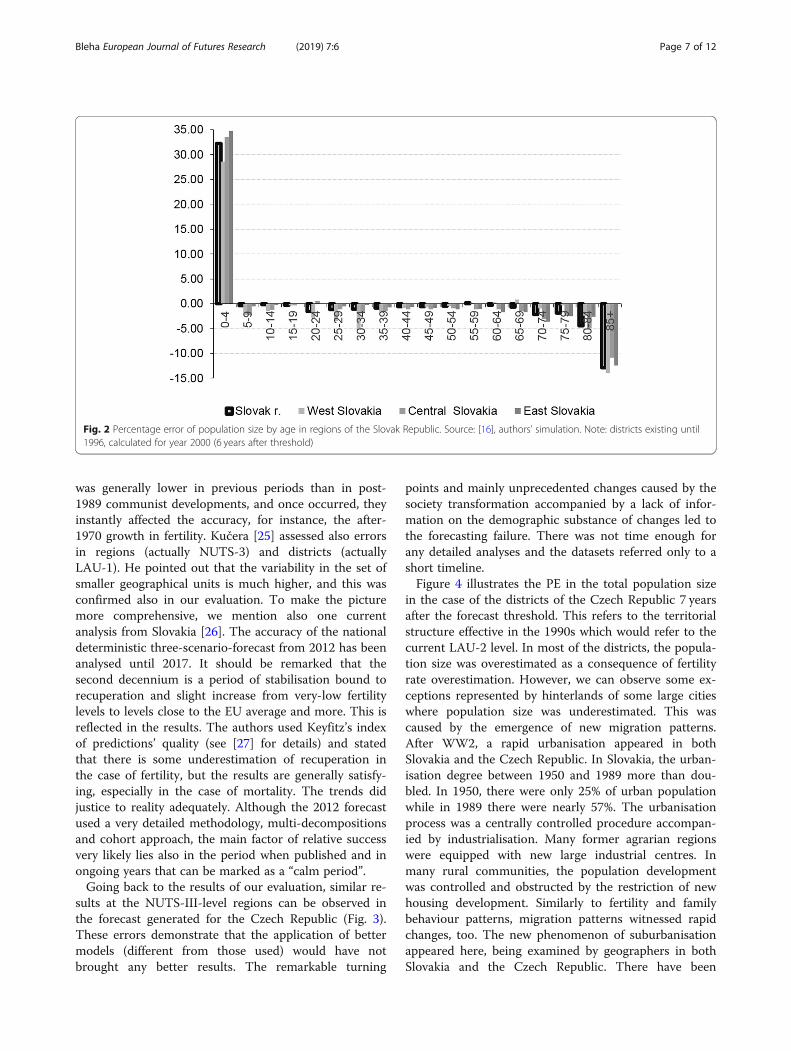
sults at the NUTS-III-level regions can be observed inthe forecast generated for the Czech Republic (Fig. 3).These errors demonstrate that the application of bettermodels (different from those used) would have notbrought any better results. The remarkable turning
points and mainly unprecedented changes caused by thesociety transformation accompanied by a lack of infor-mation on the demographic substance of changes led tothe forecasting failure. There was not time enough forany detailed analyses and the datasets referred only to ashort timeline.Figure 4 illustrates the PE in the total population size
in the case of the districts of the Czech Republic 7 yearsafter the forecast threshold. This refers to the territorialstructure effective in the 1990s which would refer to thecurrent LAU-2 level. In most of the districts, the popula-tion size was overestimated as a consequence of fertilityrate overestimation. However, we can observe some ex-ceptions represented by hinterlands of some large citieswhere population size was underestimated. This wascaused by the emergence of new migration patterns.After WW2, a rapid urbanisation appeared in bothSlovakia and the Czech Republic. In Slovakia, the urban-isation degree between 1950 and 1989 more than dou-bled. In 1950, there were only 25% of urban populationwhile in 1989 there were nearly 57%. The urbanisationprocess was a centrally controlled procedure accompan-ied by industrialisation. Many former agrarian regionswere equipped with new large industrial centres. Inmany rural communities, the population developmentwas controlled and obstructed by the restriction of newhousing development. Similarly to fertility and familybehaviour patterns, migration patterns witnessed rapidchanges, too. The new phenomenon of suburbanisationappeared here, being examined by geographers in bothSlovakia and the Czech Republic. There have been
Fig. 2 Percentage error of population size by age in regions of the Slovak Republic. Source: [16], authors’ simulation. Note: districts existing until1996, calculated for year 2000 (6 years after threshold)
Bleha European Journal of Futures Research (2019) 7:6 Page 7 of 12
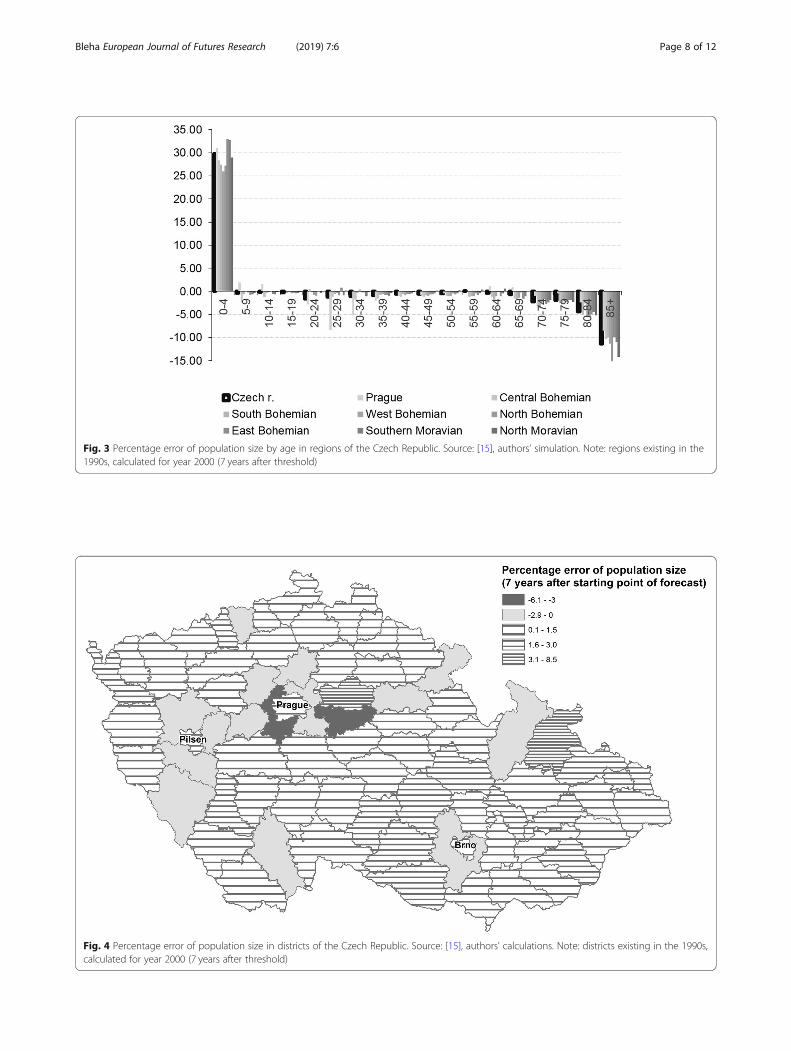
Fig. 3 Percentage error of population size by age in regions of the Czech Republic. Source: [15], authors’ simulation. Note: regions existing in the1990s, calculated for year 2000 (7 years after threshold)
Fig. 4 Percentage error of population size in districts of the Czech Republic. Source: [15], authors’ calculations. Note: districts existing in the 1990s,calculated for year 2000 (7 years after threshold)
Bleha European Journal of Futures Research (2019) 7:6 Page 8 of 12

hundreds of studies focused on the phenomenon ofsuburbanisation. However, this issue was a pure terra in-cognita in the early 1990s. Demographers were not ableto estimate when and to what scale the processes visiblein Western Europe or the USA appear in a post-communist society where they had been restricted or de-formed by then regime. Significant part of the districtscan be found in the intervals of overestimated popula-tion size due to a neglected fertility rate decline. In otherdistricts, we can observe an error stemming from omit-ting the suburbanisation process and its impacts on mi-gration patterns. This relates to the largest cities such asPrague or Brno, but also Pilsen. The districts formingthe functional urban regions of these cities manifestedan underpredicted population size as of 7 years after theinitial point of the forecast, simply because no immigra-tion had been predicted for these districts. Persistence oftrends observed before 1989 had been predicted. Thespatial pattern in Fig. 5 is therefore nearly homogeneous.As of 6 years after the forecast threshold, all districts(except for two) were afflicted by an overestimation ofthe population size. An unexpected fertility rate declinewas the main reason.
Alternative futures: post-1989 socio-economictransformation versus virtually outstaying communismThe results of the simulation and its comparison againstofficial forecasts are evaluated here. The main goal is toshow the difference between a likely developmental
trajectory from the official forecasts and a simulatedtrajectory coming from the socialistic continuum. This isa rather trivial exercise; however, it brings quite uniqueresults pointed out in Figs. 6 and 7 and Table 3. Theyare summarised as follows.a) The difference between the age structures (grey with
no lines versus B/W pyramids) is significant and con-trastive. As expected, virtual populations (grey, continu-ing socialism up to 2040) are younger with a wider base.In contrast, the cohorts are less numerous in the olderage categories. The pyramids therefore illustrate howfast fertility dominated ageing and ageing at the top hasbeen due to after-1989 changes in fertility and mortality.The indicators such as mean age and ageing index dem-onstrate the huge differences. For instance, the index ofageing in 2040 in case of simulation is more than twotimes lower compared to the values extracted from theofficial forecasts.b) Differences in 2040 are much bigger than those in
2025. This means that, over time, the differences result-ing from the change of reproduction would cumulate. Itis most visible in the age structure of Slovak population.The fall in fertility in the case of Slovakia was more sig-nificant compared to the Czech example. At the sametime, secondary waves can be identified that wouldoccur at the time of entry of women from the 1970s intoreproductive age. These are numerous generations, whenthe impact of the large number of women of reproduct-ive age (post-war baby boomers) and the pro-natalist
Fig. 5 Percentage error of population size in districts of the Slovak Republic. Source: [16], authors’ calculations. Note: districts existing until 1996,calculated for year 2000 (6 years after threshold)
Bleha European Journal of Futures Research (2019) 7:6 Page 9 of 12

measures of communist governments cumulated to-gether. According to the then president, these childrenare sometimes referred to as “Husák’s children”. Due toa decline in fertility in the 1990s, this wave did notmanifest itself, and, in the pyramid of Slovakia, there is asignificant cut around the age of 35 years in 2040. Thecontinuation of the reproductive regime typical for so-cialism characterised by fertility just above the replace-ment level would mean that, in 2040, a tertiary wavewould also manifest. It is represented by population aged15–20 years in 2040. In these ages, the differencebetween the forecast and simulation is the highest one.Moreover, around 2050, these less numerous genera-tions will reach the age of the most intensivereproduction, thus causing a further decrease in thenumber of births. Although the official forecast predictsan increase in the total fertility rate, the abovementionedage-structural effect will be more efficient.
c) The differences between the simulated and officiallyforecasted populations are manifested in another way inthe case of the Slovak Republic and the Czech Republic.Development in the twentieth century is the cause of asignificant imbalance of age structure for the CzechRepublic. Since fertility in the Czech Republic has beendeclining for a longer time, and in 1989, it was alreadylower than that in Slovakia, ageing at the base is not sosignificant. Thus, the difference between the officiallyforecasted and simulated populations is not so obviousas is in the case of Slovakia. The most significant differ-ence lies in the age around 25 years in 2020 and 40 yearsin 2040. This is due to a significant fall in fertility fromthe turn of the millennia, when total fertility reachedonly 1.18 children per woman.d) Concerning the birth rate, the difference between
the predicted and simulated populations is much moreobvious in the case of Slovakia, whereas in the case of
Fig. 6 Age structure of the Czech Republic—simulation versus official forecast. Source: [18], authors’ calculations
Fig. 7 Age structure of the Slovak Republic—simulation versus official forecast. Source: [19], authors’ calculations
Bleha European Journal of Futures Research (2019) 7:6 Page 10 of 12
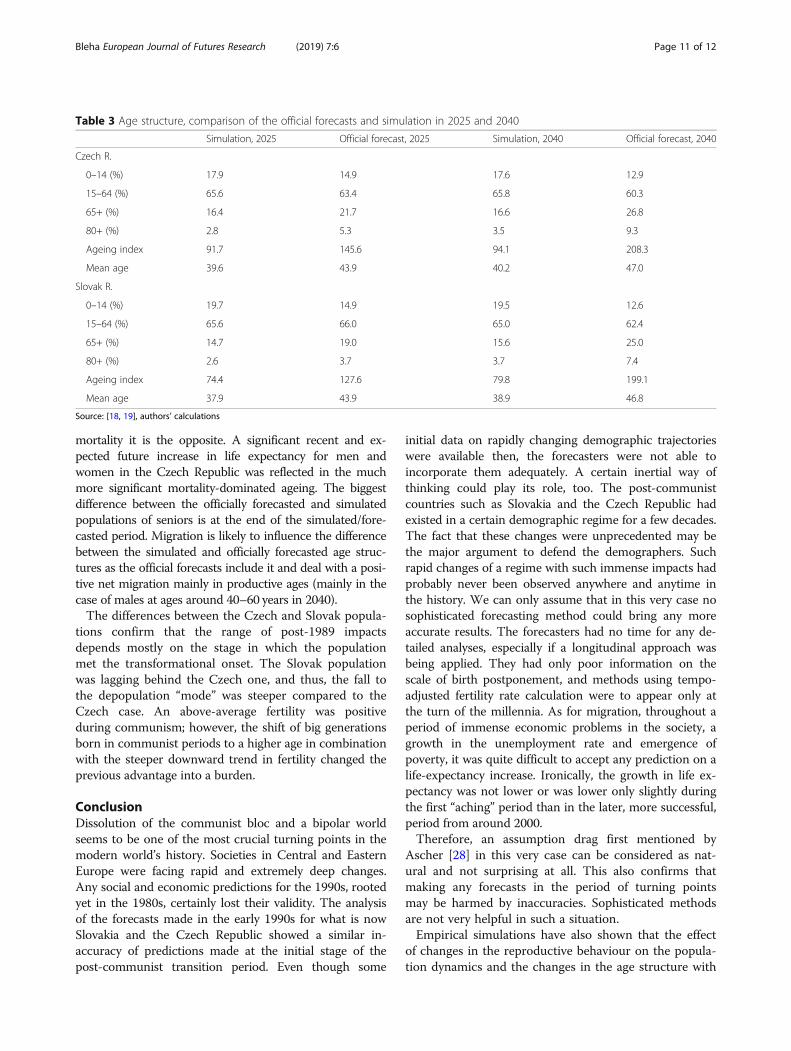
mortality it is the opposite. A significant recent and ex-pected future increase in life expectancy for men andwomen in the Czech Republic was reflected in the muchmore significant mortality-dominated ageing. The biggestdifference between the officially forecasted and simulatedpopulations of seniors is at the end of the simulated/fore-casted period. Migration is likely to influence the differencebetween the simulated and officially forecasted age struc-tures as the official forecasts include it and deal with a posi-tive net migration mainly in productive ages (mainly in thecase of males at ages around 40–60 years in 2040).The differences between the Czech and Slovak popula-
tions confirm that the range of post-1989 impactsdepends mostly on the stage in which the populationmet the transformational onset. The Slovak populationwas lagging behind the Czech one, and thus, the fall tothe depopulation “mode” was steeper compared to theCzech case. An above-average fertility was positiveduring communism; however, the shift of big generationsborn in communist periods to a higher age in combinationwith the steeper downward trend in fertility changed theprevious advantage into a burden.
ConclusionDissolution of the communist bloc and a bipolar worldseems to be one of the most crucial turning points in themodern world’s history. Societies in Central and EasternEurope were facing rapid and extremely deep changes.Any social and economic predictions for the 1990s, rootedyet in the 1980s, certainly lost their validity. The analysisof the forecasts made in the early 1990s for what is nowSlovakia and the Czech Republic showed a similar in-accuracy of predictions made at the initial stage of thepost-communist transition period. Even though some
initial data on rapidly changing demographic trajectorieswere available then, the forecasters were not able toincorporate them adequately. A certain inertial way ofthinking could play its role, too. The post-communistcountries such as Slovakia and the Czech Republic hadexisted in a certain demographic regime for a few decades.The fact that these changes were unprecedented may bethe major argument to defend the demographers. Suchrapid changes of a regime with such immense impacts hadprobably never been observed anywhere and anytime inthe history. We can only assume that in this very case nosophisticated forecasting method could bring any moreaccurate results. The forecasters had no time for any de-tailed analyses, especially if a longitudinal approach wasbeing applied. They had only poor information on thescale of birth postponement, and methods using tempo-adjusted fertility rate calculation were to appear only atthe turn of the millennia. As for migration, throughout aperiod of immense economic problems in the society, agrowth in the unemployment rate and emergence ofpoverty, it was quite difficult to accept any prediction on alife-expectancy increase. Ironically, the growth in life ex-pectancy was not lower or was lower only slightly duringthe first “aching” period than in the later, more successful,period from around 2000.Therefore, an assumption drag first mentioned by
Ascher [28] in this very case can be considered as nat-ural and not surprising at all. This also confirms thatmaking any forecasts in the period of turning pointsmay be harmed by inaccuracies. Sophisticated methodsare not very helpful in such a situation.Empirical simulations have also shown that the effect
of changes in the reproductive behaviour on the popula-tion dynamics and the changes in the age structure with
Table 3 Age structure, comparison of the official forecasts and simulation in 2025 and 2040
Simulation, 2025 Official forecast, 2025 Simulation, 2040 Official forecast, 2040
Czech R.
0–14 (%) 17.9 14.9 17.6 12.9
15–64 (%) 65.6 63.4 65.8 60.3
65+ (%) 16.4 21.7 16.6 26.8
80+ (%) 2.8 5.3 3.5 9.3
Ageing index 91.7 145.6 94.1 208.3
Mean age 39.6 43.9 40.2 47.0
Slovak R.
0–14 (%) 19.7 14.9 19.5 12.6
15–64 (%) 65.6 66.0 65.0 62.4
65+ (%) 14.7 19.0 15.6 25.0
80+ (%) 2.6 3.7 3.7 7.4
Ageing index 74.4 127.6 79.8 199.1
Mean age 37.9 43.9 38.9 46.8
Source: [18, 19], authors’ calculations
Bleha European Journal of Futures Research (2019) 7:6 Page 11 of 12
two representatives of the post-socialist bloc weremassive. Although a virtual continuation of communismwould also have brought certain changes in fertility andmortality, it is certain that they would have not been sosignificant. Simulation thus indirectly suggests that thedivergence of the West and the Eastern blocs of coun-tries would have increased instead of convergence pro-jected by the EUROSTAT projection [29]. One shouldmention that despite several converging patterns occur-ring after 1990, there are still some partial divergencesor at least interrupted or slowing convergences withindemographic components [30].The Slovak and Czech populations would have been
demographically much younger due to higher fertilityand mortality in the conditions of socialism associatedwith pro-natalist measures and unfavourable health andmedical conditions. Assuming stagnation or only a slightincrease in life expectancy and only a slight decline infertility, the almost exclusive impact on ageing wouldhave been the shift of numerous cohorts of the 1950sand 1970s. Slovak population will be the oldest in theEuropean Union in the second half of this century. Iron-ically, this can be true just thanks to the over-averageddynamics until the 1980s that was higher than in theCzech Republic. Thus, the previous advantage changeditself into the burden in just a few decades.
AcknowledgementsNot applicable
OriginalityI confirm that the article is original, has not already been published in ajournal, and is not currently under consideration by another journal.
Licence agreementI agree to the terms of the SpringerOpen Copyright and License Agreement.
Author’s contributionsThere are no co-authors for this manuscript. The author read and approvedthe final manuscript.
FundingSlovak Research and Development Agency (Grant No. APVV 17-0079)
Availability of data and materialsData on personal request
Ethics approval and consent to participateNot relevant for the study.
Consent for publicationThe author agrees to publish the manuscript and there have been noindividual data used.
Competing interestsThe author declares that he has no competing interests..
Received: 18 February 2019 Accepted: 23 September 2019
References1. Bongaarts J, Feeney G (1998) On the quantum and tempo of fertility. Popul
Dev Rev 24:271–291
2. Keyfitz N (1981) The limits of population forecasting. Popul Dev Rev 7:579–5933. Stoto AM (1983) The accuracy of population projections. J Am Stat Assoc 78:13–204. Smith SK (1987) Tests of forecasts accuracy and bias for county population
projections. J Am Stat Assoc 82:991–10125. Smith SK, Sincich T (1991) An empirical analysis of the effect of length of
forecast horizon on population forecast errors. Demography 28:261–2746. Smith SK, Sincich T (1992) Evaluating the forecast accuracy and bias of
alternative population projections for states. Int J Forecast 8:495–5087. Sanderson W (1995) Predictability, complexity, and catastrophe in a
collapsible model of population, development, and environmentalinteractions. Math Popul Stud 5:259–279
8. Tayman J, Smith SK, Lin J (2007) Precision, bias, and uncertainty for statepopulation forecasts: an exploratory analysis of time series models. PopulRes Policy Rev 26:347–369
9. Rogers A (1995) Population forecasting: do simple models outperformcomplex models? Math Popul Stud 5:187–202
10. Keilman N (1997) Ex-post errors in official population forecasts inindustrialized countries. J Off Stat 13:245–277
11. Keilman N, Kučera T (1991) The impact of forecasting methodology on theaccuracy of national population forecasts: evidence from the Netherlandsand Czechoslovakia. J Forecast 10:371–398
12. Potančoková M, Vaňo B, Pilinská V, Jurčová D (2008) Slovakia: fertilitybetween tradition and modernity. Demogr Res 25:973–1018
13. Vaňo B (2001) The demographic characteristics of the Roma population inSlovakia. Infostat, Bratislava
14. Šprocha B, Bleha B (2018) Does Socio‐Spatial Segregation Matter? ‘Islands’ ofHigh Romany Fertility in Slovakia. Tijdschrift voor Economische en SocialeGeografie 109:239-255
15. Czech Statistical Office (1993) Projekce obyvatelstva České republiky do roku2020, část II, ČR- kraje, okresy. (Population Projections of the Czech Republicuntil 2020, part II, Regions and Districts)
16. Statistical Office of the Slovak Republic (1994) Prognóza vývoja obyvateľstvaSR podľa okresov vrátane migrácie. (Population forecast of districts inSlovakia including migration assumptions)
17. Swanson DA, Tayman J, Bryan MT (2011) MAPE-R: a rescaled measure of accuracyfor cross-sectional subnational population forecasts. J Popul Res 28:225–243
18. Czech Statistical Office (2013) Population projection of the Czech Republicuntil 2100 https://www.czso.cz/csu/czso/projekce-obyvatelstva-ceske-republiky-do-roku-2100-n-fu4s64b8h4/ Accessed 12 July 2015
19. Infostat (2013) Population forecast of the Slovak Republic until 2060. http://www.infostat.sk/vdc/pdf/Prognoza2060.pdf/ Accessed 12 July 2015.
20. Hagget P (1972) Geography: a modern synthesis. Harper and Row, London21. Ellison CHJ, Mahoney JR, Crutchfield, JP (2009) Prediction, retrodiction, and
the amount of information stored in the present. Santa Fe Institute WorkingPaper 09–05-XXX https://arxiv.org/pdf/0905.3587.pdf Accessed 15.6.2019
22. Šprocha B, Tišliar P, Šídlo L (2018) A cohort perspective on the fertinitypostponement transition and low fertility in Central Europe. MoravianGeograph Rep 26:109–120
23. Burcin B, Drbohlav D, Kučera T (2005) Czech Republic in the mirror of replacementmigration concept. Acta Universitatis Carolinae – Geographica 40:47–67
24. Kučera T (1998). Regionální populační prognózy: teorie a praxe prognózovanívývoje lidských zdrojů v území. PhD Thesis, Charles University, Prague
25. Kučera T (1988) Les perspectives démographiques nationales et regionalsen Tchécoslovaquie – es méthodes et la question de confiance. ActaUniversitatis Carolinae – Geographica 23:57–71
26. Bleha B, Šprocha B, Vaňo B (2018) Prognóza obyvateľstva Slovenska do roku2060: Revízia poznatkov a predpokladov v kontexte pokračujúcejtransformácie. Infostat, Bratislava
27. Keyfitz N, Caswell H (2005) Applied mathematical demography. Springer, New York28. Ascher W (1978) Forecasting. An Appraisal for Policy-makers and Planners.
John’s Hopkins University Press, Baltimore29. EUROSTAT (2008) EUROPOP 2008 convergence scenario https://ec.europa.
eu/eurostat/statistics-explained/index.php?title=Archive:Population_projections&oldid=21953 Accessed 5 Apr 2019
30. Meslé F, Vallin J (2017) The end of east–west divergence in European lifeexpectancies? An introduction to the special issue. Eur J Popul 33:615–627
Publisher’s NoteSpringer Nature remains neutral with regard to jurisdictional claims inpublished maps and institutional affiliations.
Bleha European Journal of Futures Research (2019) 7:6 Page 12 of 12