how it meets the eye: altering locus of control …
TRANSCRIPT
HOW IT MEETS THE EYE: ALTERING LOCUS OF CONTROL THROUGH
ENVIRONMENTAL DATA VISUALIZATION
A Thesis
Submitted to the Graduate Faculty
of the
North Dakota State University
of Agriculture and Applied Science
By
Briana Rose Wilhelmi
In Partial Fulfillment of the Requirements
for the Degree of
MASTER OF SCIENCE
Major Department:
Sociology and Anthropology
August 2019
Fargo, North Dakota
North Dakota State University
Graduate School
Title
HOW IT MEETS THE EYE: ALTERING LOCUS OF CONTROL
THROUGH ENVIRONMENTAL DATA VISUALIZATION
By
Briana Rose Wilhelmi
The Supervisory Committee certifies that this disquisition complies with North Dakota
State University’s regulations and meets the accepted standards for the degree of
MASTER OF SCIENCE
SUPERVISORY COMMITTEE:
Dr. Pamela Emanuelson
Chair
Dr. Gary Goreham
Dr. Christina Hargiss
Approved:
August 1, 2019 Dr. Christopher Whitsel
Date Department Chair
iii
ABSTRACT
Locus of control (LOC), first defined as a trait determining one’s sense of control over
outcomes, continues to be refined. Originally treated as a generalized expectancy, scholars have
extended its range for queries in specific domains (e.g., health, workplace, environmental
behaviors), and, in more recent years, have suggested reformulating the concept as a state, based
on evidence indicating its susceptibility to change. This paper builds on work suggesting a
relationship between data visualization techniques and LOC by presenting the results of an
experiment aiming to manipulate environmental internal LOC by varying the number of
graphical elements in bar charts. Environmental issues, presenting cause for concern and a need
for urgent action, provide a timely area for application—and one in which a shift toward internal
locus of control carries substantial benefits, as research indicates a strong link between internal
LOC and participation in pro-environmental behaviors.
iv
ACKNOWLEDGEMENTS
I owe many thanks first to Dr. Pamela Emanuelson, my adviser, for generously sharing
her expertise and patiently enduring my questions, all the while offering meaningful guidance
and encouragement. Secondly, I would like to thank Dr. Gary Goreham, a second committee
member—whose incredible skill as a teacher might only be matched by his keen insight as a
researcher—for his availability, kindness, and helpful advice. I also owe Dr. Christina Hargiss,
my third committee member, a debt of gratitude for offering clear and perceptive comments,
which proved very beneficial to the structure and content of this paper. Sincere thanks are also
due to Dr. Nicholas Smith-Sebasto for sharing materials in the project’s early stages.
In addition to those who helped me work directly on the content of this thesis, I am
grateful to several others who have formed me in the discipline of sociology. Many thanks to Ms.
Patty Corwin for first inspiring a deep interest in me in the field, Dr. Christina Weber Knopp for
helping me expand my horizons, particularly through teaching about service learning, Dr.
Christopher Whitsel for sharing a depth of knowledge of qualitative methods and facilitating
research workshops, and professor emeritus Dr. Richard Rathge for giving me my first
opportunity to practice research outside of the classroom while an undergraduate. Additional
thanks go to those I have had the pleasure of working with as a graduate research assistant at the
Center for Social Research at NDSU: I’m deeply grateful to fellow research assistant Shweta
Srivastava, administrative assistant Kate Ulmer, research specialists Kay Schwarzwalter,
Xiangping ‘Coco’ Gao, Kendra Erickson-Dockter, Chelsey Hukriede, Mihaela ‘Ina’ Cernusca,
and Karen Olson, and center director Dr. Nancy Hodur, for their mentorship and support.
Finally, I would like to thank my family and friends, whose love, encouragement,
generosity, and kindness mean more to me than I can say. You make all of my journeys a joy.
v
TABLE OF CONTENTS
ABSTRACT ................................................................................................................................... iii
ACKNOWLEDGEMENTS ........................................................................................................... iv
LIST OF TABLES ........................................................................................................................ vii
LIST OF FIGURES ..................................................................................................................... viii
INTRODUCTION .......................................................................................................................... 1
LITERATURE REVIEW ............................................................................................................... 4
Environmentalism in the United States ....................................................................................... 4
Pro-environmental behaviors ...................................................................................................... 5
Locus of control .......................................................................................................................... 7
Locus of control and environmental behavior ............................................................................. 9
Locus of control: Fixed trait or alterable state? ......................................................................... 10
Data visualization ...................................................................................................................... 13
Images ....................................................................................................................................... 14
Communication through text and moral reframing ................................................................... 15
THEORY AND HYPOTHESIS ................................................................................................... 18
METHODS ................................................................................................................................... 21
Study design .............................................................................................................................. 21
Recruitment and survey delivery ............................................................................................... 23
Scale choice and validity/reliability .......................................................................................... 26
Analysis ..................................................................................................................................... 27
Methodological issues ............................................................................................................... 28
RESULTS ..................................................................................................................................... 30
DISCUSSION ............................................................................................................................... 33
Implications of study for policymakers, activists, and educators ............................................. 37

vi
CONCLUSION ............................................................................................................................. 39
REFERENCES ............................................................................................................................. 40
APPENDIX A. RESEARCH COMPLIANCE FORM ................................................................. 44
APPENDIX B. PRETEST ............................................................................................................ 45
APPENDIX C. POSTTEST A ...................................................................................................... 61
APPENDIX D. POSTTEST B ...................................................................................................... 84
APPENDIX E. POSTTEST C .................................................................................................... 111

vii
LIST OF TABLES
Table Page
1. Means and standard deviations ................................................................................................. 31
2. Tests of between-subjects effects.............................................................................................. 32
viii
LIST OF FIGURES
Figure Page
1. Pretest Posttest control group design ...................................................................................... 22
2. “High graphical elements”/minimized data-ink ratio .............................................................. 25
3. “Low graphical elements”/maximized data-ink ratio .............................................................. 25
1
INTRODUCTION
Research analyzing “locus of control”—its effects on motivation and behavior, as well as
its manipulation – has profound implications for activists, policymakers, and others who seek to
produce specific behaviors (Levenson and Miller 1976; Legerski, Cornwall, and O’Neil 2006;
Galvin, Randel, Collins, and Johnson 2018; Kalamas, Cleveland, and Laroche 2014). Locus of
control refers to individuals’ beliefs about the amount of control they have over events and varies
from individual to individual. Those with an internal locus of control believe outcomes result
primarily from personal effort or ability. In contrast, individuals with an external locus of
control ascribe outcomes to forces outside of their control (e.g., chance or powerful others).
Research shows that locus of control predicts a wide range of outcomes, including motivation
and behavior (Galvin et al. 2018).
Social learning theory served as the theoretical foundation for locus of control, but the
concept has not remained unchanged since its inception. Though originally understood as a
fixed trait, Ryon and Gleason (2014) describe how it functions more like an alterable state. The
reformulation is ultimately consistent with social learning theory, which claims that early
experiences influence one’s learning process and, in turn, behavior. During this learning process,
individuals begin to develop a sense that certain types of behaviors result in certain types of
reinforcements. Over time, individuals’ expectancies about causal links between behaviors and
rewards result in more stable differences between individuals (i.e., their locus of control) (Galvin
et al. 2018). Conceptualizing locus of control as an alterable state essentially extends this
learning process throughout one’s lifetime, instead of claiming its crystallization in early
development.
2
The implications of the shift towards reconceptualizing locus of control as a state are
profound, not only for the understanding of the concept as a generalized expectancy, but also for
its application to understanding behavior in the workplace, as well as the enactment of beneficial
behaviors in health and environmental domains (Legerski et al. 2006; Galvin et al. 2018; Ahn,
Bailenson, and Park 2014). If locus of control can change and it predicts behavior, it behooves
researchers interested in producing certain behaviors to investigate what might provoke or
prevent change in an individual’s locus of control. One promising area of investigation exists
within the field of data visualization. Recent developments suggest that individuals may interpret
visualizations (e.g., graphic designs) differently due to differences in loci of control
(Ziemkiewicz, Ottley, Crouser, Yauilla, Su, Ribarsky, and Chang 2013). This study tests whether
the addition of certain design elements in bar graphs might effectively shift locus of control
toward greater internality among users.
My purpose is to determine if locus of control can be modified with the specific aim of
increasing the perception that action by an individual can have an outcome on the environment.
That is, can those who think that their actions have little impact on the environment experience a
shift toward a stronger sense of the impact of their actions? My hypothesis posits that locus of
control can change depending on the complexity of the presentation of data in visualizations.
My research question is:
Can environmental locus of control be altered by manipulating the
number of graphical elements in messaging?
In the following section, the context and motivation of the study is set up in a discussion
of environmentalism in the United States. I discuss locus of control and data visualization as a
mediating factor between information and behavior in general, and more specifically within the

3
domain of pro-environmental behavior. I apply theories of data visualization and locus of
control to generate a hypothesis and tests, and conclude with a discussion of results, limitations
of the study and possible future directions for research.

4
LITERATURE REVIEW
Environmentalism in the United States
The scientific community agrees that climate change exists, and its origins are human
(Feinberg and Willer 2011; Feygina, Jost, and Goldsmith 2010, Steg and Vlek 2008; Ahn et al.
2014). The Intergovernmental Panel on Climate Change asserts that, “Warming of the climate
system is unequivocal […]” (IPCC 2007:2). NASA cites the rise of global temperature,
increased temperature in oceans, diminishing ice sheets, glacial retreat, rising sea levels,
decreasing arctic sea ice, and increased ocean acidity as evidence of climate change (NASA
N.d.). Yet, despite the availability of such evidence from reputable sources, only 41% of the
American public attribute climate change to anthropogenic causes (Ahn et al. 2014). The
variation in opinions seems, in part, to be a consequence of disposition. Some individuals believe
strongly in their capacity to control events and outcomes related to the environment, while others
believe that outside forces have greater control over environmental outcomes. These beliefs refer
to an individual’s “environmental locus of control.” Beyond claims regarding causes of climate
change, those who believe they have greater control over their lives are better poised to make
positive environmental decisions (Yuriev, Boiral, Francouer, and Paille 2018; Galvin et al. 2018;
Ahn et al. 2014). It follows that successful interventions to reduce harmful environmental
practices could be facilitated by creating a greater sense of personal control over outcomes.
Forerunners in the modern environmental movement emphasized that environmental
destruction by humans has severe consequences, and that the public has a right to know how
these consequences might affect them (Carson [1962] 2000; Stoll 2007). Unfortunately, research
suggests that the provision of knowledge alone is insufficient to produce behavior change (Barr
and Gilg 2007:362). While policy change has certainly at times proven effective, passing new
5
legislation or enacting stricter regulations can be a slow and arduous process. By the time
changes are codified, the damage may be widespread. For instance, even though DDT was
banned well over 40 years ago, a new study suggests a link between lingering levels of the
chemical in the bloodstream of mothers from previous contact and the diagnosis of children with
autism spectrum disorder (Brown, Cheslack-Postava, Rantakokko, Kiviranta, Hinkka-Yli-
Salomäki, McKeague, Surcel, and Sourander 2018:1). Since policy change may be effective, but
slow, and public awareness campaigns have been insufficient, it seems incumbent upon us to
better understand why some people participate in behaviors that benefit the environment while
others do not. Fortunately, significant amounts of research have already been completed on core
aspects of this question.
Pro-environmental behaviors
Research into pro-environmental behaviors, and attitudes towards them, is ubiquitous.
Stern (2000), for one, worked to advance a more coherent theory of environmentally significant
behavior—defining what constitutes environmentally significant behaviors, categorizing such
behaviors and their origins, and ultimately seeking ways to influence the factors that determine
behaviors (Stern 2000:407). Studies focused on pro-environmental behaviors often discuss the
use and effectiveness of interventions aimed at changing behaviors to encourage more
ecologically sound practices (see Stern 2000; Barr and Gilg 2007; Kalamas, Cleveland and
Laroche 2014). One major intervention is to provide information through educational efforts to
change attitudes (Stern 2000:419); this practice has been supported by the information deficit
model.
The information deficit model—a causal linear model suggesting behavior occurs
through awareness, information, decision, and action—assumes what is now referred to as the
6
“A-I-D-A logic of behavior,” (Barr and Gilg 2007:362). Applying A-I-D-A (awareness,
information, decision, and action), the best way to work toward resolution of environmental
issues is to make people aware of concerns and then inform them how to engage in better
practices. According to the model, once people know the proper response, they decide to act and,
ultimately, the behavior creates the desired outcome change (362). Unfortunately, research
suggests that simply sharing information, though it may lead to a change in attitude, is
insufficient to bring about actual behavioral change (362).
Addressing gaps in environmental knowledge by educating the public is an important
component of encouraging action, but awareness efforts alone have not successfully led to
behavior change. Kalamas et al. (2014), indicate that, while most consumers are concerned
about the environment and their role in its wellbeing or destruction, their level of concern has
generally not been commensurate with their behavior (2014:12). Researchers, however,
emphasize that, though the information-deficit model may not be holistic enough to withstand
the complexities inherent in environmental action, such a finding does not dismiss or diminish
the value of research that aims to quantify behaviors or attitudes related to environmental action
(Barr and Gilg 2007). Rather, it encourages both the gathering of detailed data about individual
lifestyles along with data that can offer a more widescale perspective of daily choices and
behaviors (362). Educating the public is important, but not necessarily motivating. The next
relevant area of investigation then, examines factors that motivate behavior.
The psychological variable of locus of control, which considers whether individuals
believe outcomes result primarily from their own action (i.e., internal control) or from external
forces beyond their control (i.e., external control), has been linked to environmental behaviors
7
and offers perhaps a more effective means of encouraging environmental behaviors (Huebner
and Lipsey 1981). The following discusses locus of control and its relation to behavior.
Locus of control
Julian Rotter, a psychologist widely credited with much of the early development of the
concept of locus of control, cites his own work on social learning theory as the theoretical
foundation for what he initially termed “generalized expectancies for internal versus external
control of reinforcement.” Rotter’s attempt to develop measures of internal-external control was
built on previous work by Phares (1957), who constructed a scale with a total of 26 items, half
devoted to internal attitudes and half to external attitudes in a study of skill and chance effects on
reinforcement expectancies (Rotter 1966:9).
Rotter (1966) points to the relation between reinforcement and performance, noting that
some individuals tend to think rewards result from their own actions, while others perceive
receipt of a reward as due to some external factors (1966:1). Rotter goes on to explain that, if
reinforcement or reward appears to follow from one’s action, but not completely depend on it,
individuals consider such happenings as resulting from chance, luck, fate, or otherwise
controlled by “powerful others.” Rotter termed this a “belief in external control” while
individuals who perceived events as primarily dependent on their own actions were said to have
beliefs in internal control (1). The Internal-External Control (hereafter I-E) scale developed by
Rotter is a forced-choice test including 29 items, incorporating filler items to make the test’s
purpose appear ambiguous (1966:10). Results from this original scale inspired the early
conception of locus of control.
Rotter relates “locus of control” to “alienation.” Following from the classical works of
Marx, Durkheim, and Weber, alienated individuals feel incapable of directing their futures and
8
fulfilling their potential as “a small cog in a big machine and at the mercy of forces too strong or
too vague to control” (Rotter 1966:3). Seeman (1959) expands on classical understanding of
alienation, offering five “alternative meanings of alienation”: powerlessness, meaninglessness,
normlessness, isolation, and self-estrangement (1959:783). Seeman joined the concept of
alienation, identified as “powerlessness”, to the concept of internal and external control (Rotter
1966:3). Discussing alienation as powerlessness from a social psychological perspective, not as
based on the “objective conditions in society,” but on an, “individual’s expectancy for control of
events,“ Seeman links Rotter’s (1958) “internal versus external control of reinforcements” to
alienation (1959:784, emphasis original).
Levenson and Miller (1976) argue that the relation between activism and locus of control
as measured by Rotter’s I-E scale is inconsistent (1976:199-200). Referencing Strickland (1965)
and Gore and Rotter (1963), Levenson and Miller (1976) acknowledge that some early studies
support Rotter’s theory. However, Huebner and Lipsey (1981) find no significant relation
between activism and locus of control and cite three other studies with the same finding:
Blanchard and Scarboro (1972), Gootnick (1974), and Evans and Alexander (1970) (1981:55).
Levenson and Miller (1976) suggest two reasons for the inconsistent findings in the 1970s: 1) the
“changing times” of the United States in the 1960s, and 2) an issue with the conceptualization of
the scale (200). They assert that a different conceptualization of locus of control might better
capture the concept in studies, whereby studies can more accurately gauge the relation between
activism and locus of control (200). Levenson (1974,1981) developed multidimensional scales
for locus of control, effectively dividing the measure of external control into two constructs –
chance and powerful others – while retaining a measure for internal control, for a total of three
scales (Levenson 1981; Levenson and Miller 1976: 200).
9
Locus of control and environmental behavior
Research indicates that a strong relationship exists between ecologically responsible
behavior and locus of control (Ahn et al. 2014:235). According to Huebner and Lipsey (1981),
those who participate in pro-environmental behaviors necessarily believe “in the efficacy of their
own ameliorative action (i.e., maintain an ‘internal’ locus of control)” (1981:55). Although the
relationship between locus of control and pro-environmental behaviors has been supported (Ahn
et al. 2014:235), both Levenson and Rotter’s scales have received criticism regarding their
applicability to studies on environmental action (Huebner and Lipsey 1981:55). Researchers
question the applicability of Rotter’s scale for such studies, in part from findings suggesting his
I-E measure is not related to social action (55). While also shown to be flawed, Levenson’s
scales offer an improved means of predicting “willingness to engage in ecologically responsible
activities,” likely as a result not only of the multidimensional approach, but also the particular
dimensions created (55). As Huebner and Lipsey explain, “When environmental action is the
practical issue of interest, a distinction between the role of chance and that of powerful outside
interests is quite sensible and undoubtedly more useful in the environmental context than might
be other multidimensional distinctions” (55).
The operationalization of the locus of control scales has not been the sole cause of
inconsistent findings and confusion in studies regarding environmental behaviors. Frequently
confused with locus of control, perceived behavioral control includes, “ ‘people’s expectations
regarding the degree to which they are capable of performing a given behavior, the extent to
which they have the requisite resources and believe they can overcome whatever obstacles they
may encounter’ ” (Ernst, Blood, and Beery 2017: 155). A major concept in Azjen’s theory of
planned behavior—perceived behavioral control—is composed of two major pieces:

10
controllability and self-efficacy (2017:155). Self-efficacy within this concept is understood as the
ease with which one performs a given behavior, and controllability is understood as how much
one believes events are under their influence (155). Ernst et al. (2017) highlight studies which
have essentially treated the two concepts as identical by comparing their findings as if they were
equivalents (172). Multiple studies have been criticized for operationalizing constructs related to
environmental behavior inconsistently: the example of the confusion over the constructs of
perceived behavioral control and locus of control serves as one major example (172).
Locus of control: Fixed trait or alterable state?
Perhaps one of the greatest developments regarding the construct of locus of control has
been a closer look at whether it is better understood as more of an inherent characteristic,
resistant to change over time, or something that can be modified – better termed a “state” than a
“trait” (Ryon and Gleason 2014:121). Rotter’s I-E locus of control scale placed subjects on a
continuum, generally categorizing those whose scores fell within the upper half of the
distribution as “externals” and those whose scores fell in the lower half as “internals” (Rotter
1966:19). The implication is twofold: 1) internal/external control exist on the same continuum
and 2) locus of control is a fixed trait.
The development of the construct from unidimensional to multidimensional maintains its
treatment as a stable trait (Ryon and Gleason 2014:121), but it treats internal control and external
control as distinct concepts, each measured by their own scale. While not entirely conclusive,
recent research suggests that locus of control may not be as stable a trait as initially conceived.
The potential to manipulate locus of control toward internality is worthy of study as it may lead
to the adoption of pro-environmental behaviors by those with external locus of control.
11
Much of the research on locus of control treats the variable primarily as a stable trait,
considering it to be more a cause of behavior than a consequence of social environment. Huebner
and Lipsey (1981) examined measures of locus of control and environmental activism, in part to
determine locus of control’s modifiability “under the pressure of a sociopolitical event,” in this
case, a ballot referendum regarding the California Nuclear Power Initiative of 1977. According
to the study’s findings, situation-specific locus of control Powerful Others and situation-specific
locus of control Chance scales demonstrated a shift toward externality in a group of activists
following California’s Nuclear Safeguards Initiative’s defeat, while maintaining internality on
the situation-specific Internal scale (Huebner and Lipsey 1981: 54-56). In addition, the
researchers note that while Rotter’s locus of control had generally been understood as a stable
personality trait, other studies regarding political events indicated its potential for change (47).
Sociopolitical events, however, have not been the only opportunity for considering the
construct’s modifiability.
Legerski, Cornwall, and O’Neill (2006) revisited the question of whether locus of
control might be changed in a study about steelworkers facing forced unemployment, noting the
concept was still generally seen as a stable personality characteristic at the time (Legerski et. al
2006:1521). Ultimately, the study does not report an overall change in the locus of control score
but does report other findings calling for further research and suggests that life-changing events,
like long term unemployment, can alter one’s sense of control over the events of their lives
(1534).
Although studies conducted by Huebner and Lipsey (1981) and Legerski et al. (2006)
both suggest the modifiability of locus of control, counterarguments might be offered on the
basis of neuroanatomical claims. Hashimoto et al. (2015) found significant correlations between

12
gray and white matter volumes and locus of control (Hashimoto, Takeuchi, Taki, Sekiguchi,
Nouchi, Kotozaki, Nakagawa, Miyauchi, Iizuka, Yokoyama, Shinada, Yamamoto, Hanawa,
Araki, Hashizume, Kunitoki, and Kawashima 2015:146). Although such a finding may seem
deterministic, researchers indicate that “a feeling of being in control can be constructed through
daily events and this might shape brain structures” (Hashimoto et al. 2015:146). Hashimoto et
al.’s (2015) study, from a neuroanatomical perspective, seems to support both the
characterization of locus of control as a cause of behavior as well as a consequence of one’s
social environment.
The ability to modify locus of control could have very significant implications for
environmental behaviors. Ahn et al. (2014) state that, although 97% of scientific discourse cited
human action as a cause of climate change, only 41% of the general American public made the
same attribution (2014:235). They assert that this attribution gap might partially explain the
coexistence of vast amounts of information about environmental concerns and lack of behavioral
changes, and further suggest that increasing internal control among those who fail to connect
their actions to climate change may significantly decrease the attribution gap (235). Ahn et al.
(2014) suggest that since those with internal locus of control are more likely to engage in pro-
environmental behaviors, the potential to encourage a shift toward greater internality merits
greater attention. Although evidence supports the connection between environmental behaviors
and locus of control (Bamberg and Möser 2007; Ahn et al. 2014), research attempting to
manipulate locus of control to encourage pro-environmental behaviors is severely lacking (Ahn
et al. 2014: 235).
Attempts to manipulate locus of control are informed by empirical data from research on
decision-making (Ahn et al. 2014:236). The, “time-delayed, abstract, and often-distant nature”
13
of environmental concerns does not necessarily encourage strong reactions to the threat of
climate change (236). Ahn et al. (2014) hypothesized that one’s own experience of a negative
consequence might make an issue seem more relevant, thereby increasing internal locus of
control. To test their hypothesis, Ahn et al. utilized immersive virtual environments to offer a
visceral experience of cutting down a virtual tree to make the connection between paper use and
deforestation (236).
Beyond locus of control, several factors including moral concerns, moral affect and types
of informational and structural strategies, have been analyzed in attempts to encourage pro-
environmental behaviors (Steg and Vlek 2008). The following sections discuss three major
sources of environmental messaging and present an argument linking the style of message
presentation to message clarity, and message clarity to changes in locus of control.
Data visualization
As early as the 1920s, Walter Eells (1926) and Frederick Croxton (1932) began
investigating best practices for data visualization. Data visualization refers to the graphical
representation of information or data points. Information cannot mediate behavior in the absence
of comprehension. Research in this area examines how different possible visualizations affect the
degree of comprehension. For example, Eells (1926) and Croxton (1932) identified charts or
shapes that best represent data so that individuals grasp data meaning accurately (see Eells, 1926
and Croxton 1932). More recently, Ziemkiewicz et al. (2013) examined effects of layout style,
also known as spatial arrangement, and visual encoding, understood as mapping of variables to
specific graphical characteristics (such as size or color) on user comprehension (Ziemkiewicz et
al. 2013:1).

14
Ziemkiewicz et al. (2013) found that the way elements are displayed interacts with one’s
locus of control (13). Their findings suggest that those with more internal locus of control will
perform better when given visualizations that minimize use of grouping elements (e.g., borders,
outlines, etc.) and are characterized by “simple spatial organization,” whereas those with external
locus of control may perform better with the inclusion of more grouping elements to “call
attention to a specific information structure” (13). The researchers further suggest that those with
external locus of control may prefer visualizations which organize information using a two-
dimensional layout. Finally, Ziemkiewicz et al. discovered that those with an external locus of
control might be more willing to adjust their thinking to accommodate novel visualizations,
while those with an internal locus of control might take more time to do so, highlighting an
advantage for those with an external locus of control (13). They refer to research that suggests
that the “surface learning” practice of those with external locus of control, generally considered
to be a negative point academically, might be advantageous in the process of learning a novel
visualization system (12).
Whereas prior research focuses on how current locus of control affects comprehension,
this investigation will check if comprehension, as affected by type of data visualization, can
affect locus of control. In particular, the study will examine if more easily understood graphics
produce higher scores on a scale measuring internal locus of control specifically for
environmental events.
Images
Images are frequently utilized in communication containing pro-environmental
messaging; one reason for their use is their capacity to change mental imagery from abstract to
concrete (Wang, Miller, Brown, Jiang and Castellazi 2016:1753; Boomsma, Pahl, and Andrade
15
2016:1). Research indicates that one of the major issues in communicating environmental
problems is that environmental change is perceived as too abstract (Boomsma, Pahl, and
Andrade 2016:1). Boomsma et al. (2016) cite research explaining, “external imagery is key in
determining how individuals perceive real-world issues and can transform abstract issues into
something that can be visualized – and that individuals can respond to” (2016:3; emphasis
added). Although research on the relationship between behavior and imagery is still regarded as
nascent, there exists evidence to suggest that one’s mental imagery is linked to perceptions on
climate change (Boomsma et al. 2016:3).
Construal Level Theory asserts that those with more concrete mental representations of
an event perceive the event to be closer to them, while those with more abstract mental
representations tend to see the event as more distant (3). Indeed, research has pointed to the
abstract nature of environmental problems (Ahn et al.2014:236). Finding a way to clarify the
issues by making them more concrete would, according to Construal Level Theory, make the
issues seem closer in terms of time, space, and/or chance of occurring (Boomsma et al. 2016:3),
potentially affecting not only one’s understanding of the issue, but one’s sense of control over it
as well. Another means of influencing the public’s understanding of an issue is through using
text communication that resonates with one’s values.
Communication through text and moral reframing
Feinberg and Willer (2012) argue that individuals are more likely to be receptive to
messaging that resonates with their moral values, asserting that groups of people will be affected
to different degrees by different messages; this idea is referred to as the “logic of segmentation”
and is closely related to work on message framing (57). For example, positions on five areas of
human morality – harm/care, fairness/reciprocity, in-group/loyalty, authority/respect, and
16
purity/sanctity – have been shown to correspond in unique ways to liberal and conservative
identities (57). Message framing based on moral values has shown significant promise in
explaining the relationship between political ideology and environmental behaviors. Feinberg
and Willer (2012) found that presenting pro-environmental concerns to conservatives using
moral concerns they relate to leads to increased support for pro-environmental behaviors (57).
Deeply held beliefs about the nature of the world and systems one lives in have also been
shown to affect the likelihood of pro-environmental behaviors. Just-world belief, the belief that
the world is “just, orderly, and stable,” is widespread and deep-seated (Feinberg and Willer
2011:34). Similarly, according to Feygina, Jost and Goldsmith, (2010:327), beliefs that justify
systems are influenced by a need for stability, and in turn motivate individuals to assess systems
as “fair, legitimate, beneficial, and stable.” In doing, system justification beliefs rationalize and
protect systems. Just-world beliefs and system-justification beliefs have positive qualities, but
often conflict with environmental messaging. Research indicates, for example, that dire
messaging regarding global warming may ultimately backfire when it conflicts with individuals’
just world beliefs (Feinberg and Willer 2011:37). Furthermore, system justification theory
asserts that individuals may support harmful practices if it allows them to maintain a sense of
stability and a belief in the fairness of the system (Feygina, Jost and Goldsmith 2010:326). For
example, individuals might support harmful changes in oil and gas regulatory practices endorsed
by elected officials because doing so allows them to continue to believe in the fairness of the
system of governance, whereas questioning such elected officials’ judgments undermines the
system they represent.
Environmental degradation is a pressing issue, and research indicates that those with an
internal locus of control are most likely to act to decrease or reverse it. Early environmentalists

17
championed public awareness campaigns, adopting a logic which assumed the best way to
encourage better ecological choices was through information and education. Research indicates
that this approach, though important, has been largely unsuccessful. At the same time,
environmental communication has been criticized for being too abstract or vague. However, not
all efforts to communicate the importance of pro-environmental behaviors have failed. For
instance, recent studies about moral reframing serve as an example and precedent for how
changing the way in which messages are communicated can lead to positive outcomes. Studies
primarily using images suggest that the stronger a mental image, the more an individual might
feel empowered to respond to it. At issue then is determining all the means by which physical
images can produce vivid mental images.
Locus of control is closely correlated with environmental behaviors for the following
reason: if individuals think they do not have an impact on the larger environment, they have no
reason to act even should they want to do so. In contrast, if individuals believe their actions have
impact, concern should motivate change. For that reason, the potential to shift toward greater
internality has considerable potential for impact. I am positing that by using more appropriate
messaging strategies, as studies on moral reframing and mental imagery have done in their own
way, one’s locus of control can be shifted toward internality. This study focuses on the impact
of data visualization on locus of control and leaves the impact of locus of control on
environmental behavior for future studies.
18
THEORY AND HYPOTHESIS
Locus of control theory and data visualization theory are central to the investigation.
Locus of control theory is an offshoot of Rotter’s social learning theory. According to social
learning theory, individuals develop expectancies over time that certain behaviors lead to certain
reinforcements. This development occurs by way of early experiences and circumstances such as
socioeconomic status, parenting style, and environmental factors (Galvin et al. 2018:821). Locus
of control develops through this process. Individuals develop either a sense of control over
events or a sense that external forces determine their fate. Research finds that those with an
external locus of control more frequently adopt a passive stance toward outcomes in their lives
(821).
As discussed earlier, locus of control has been conceptualized and measured in several
different ways. Rotter’s (1966) scale measures external and internal locus of control on one,
continuous scale. In contrast, Levenson (1974, 1981) developed distinct scales for internal
control, control by powerful others, and outcomes determined by chance. Situation- and domain-
specific measures have emerged as well (Huebner and Lipsey 1981; Galvin et al. 2018). This
study utilizes a domain-specific scale for internal locus of control, in line with contemporary
recommendations and studies (Galvin et al. 2018; Ahn et al. 2014; Kalamas, Cleveland, and
Laroche 2014). Huebner and Lipsey’s (1981) research compares findings from generalized scales
against those from situation-specific scales. They reported greater success with the situation-
specific locus of control scales with respect to its ability to differentiate between activists and
nonactivists as well as its ability to predict interest in participating in pro-environmental
behaviors.

19
Research links environmental behavior to environmental locus of control but has largely
ignored the possibility of manipulating locus of control to encourage pro-environmental
behaviors (Ahn et al. 2014:235). One potential way to manipulate locus of control is to
manipulate data visualizations. Data visualization studies examine how visualization relates to
personality factors and how various visualizations affect the ability of individuals to problem-
solve or to understand data (Ziemkiewicz et al. 2013:12).
Tufte’s data-ink ratio is an often-cited guideline of design and encourages minimalist
visualizations (Ziemkiewicz et al. 2013; Tufte 1983). According to Tufte, a quality graphic
presentation of data should maximize data-ink – ink that denotes data on a graph – while
minimizing the use of any other ink. However, some theory suggests that what counts as a
quality graphic representation of data can vary depending on the person viewing the graph
(Ziemkiewicz et al. 2013). The Distributed Cognitive Approach predicts that those who have
external locus of control rely more on external representations when interpreting information.
From that prediction, it is possible to infer that a minimizing of non-data ink may not be optimal
for everyone. According to Ziemkiewicz et al. (2013), individuals with external locus of control
may better interpret visualizations with the addition of more non-functional elements (12).There
is reason to hypothesize that offering information to users in a format they can more easily
comprehend will lead to a greater sense of empowerment .
The proposed study’s hypothesis rests on the following assumptions inspired by prior
research. 1) Individuals with external locus of control better comprehend data visualizations with
more elements and 2) comprehension empowers individuals to act, and that increased ability to
act can shift the individual toward an internal locus of control for that issue. It follows, then, that
the new locus of control might encourage pro-environmental behaviors. The research proposed
20
here seeks to use principles of data visualization to alter environmental locus of control. The
research question follows:
Can environmental locus of control be altered by manipulating the
number of graphical elements in messaging?
Following from research presented above, and the basic argument linking data
visualization to locus of control, the following hypothesis is provided.
H: Mean scores for internal locus of control will increase most when
data is presented using a high number of supporting, non-data
graphical elements, and least when information is not presented in
graph form.
The previous sections established the benefit of investigating the malleability of
environmental locus of control. Literature in environmental intervention strategies and locus of
control were reviewed, and a new strategy for intervention was proposed. Environmentalism in
the United States and methods of education aimed at encouraging pro-environmental behaviors
continue to evolve, learning from models that ultimately failed (e.g., the information-deficit
model), and seeking new methods (e.g., immersive virtual experiences) (Barr and Gilg 2007;
Ahn et al. 2014). Locus of control studies investigate what it means for individuals to feel either
in control, or at the mercy of, external events. In recent years, domain-specific measures for
locus of control have become more commonly used to investigate the particulars of specific
domains like the environment. Research on data visualization, which began by looking at the
use and study of basic charts and graphs, moves forward by asking questions of how personal
characteristics interact with elements of design.
21
METHODS
The following section discusses the study design and analysis, as well as methodological
and ethical issues. I discuss why an experimental pretest posttest design with control is best
suited for investigating my research question and outline the procedure in detail. Then, I explain
how the literature on locus of control and visualization informs my hypothesis and my choice of
scale for measuring the dependent variable, internal locus of control.
Study design
The goal of this study is to determine whether graphical presentation can increase internal
locus of control. Using a pre and posttest design, I manipulated the data-ink ratio in two bar
graphs, each conveying the same environment-relevant data, and measure locus of control prior
and subsequent to the manipulation. Mean scores for internal locus of control were calculated
from pre and posttest scores on the Environmental Action Internal Control Index, a domain-
specific index for environmental locus of control (Smith-Sebasto 1992; Smith-Sebasto and
Fortner 1994).
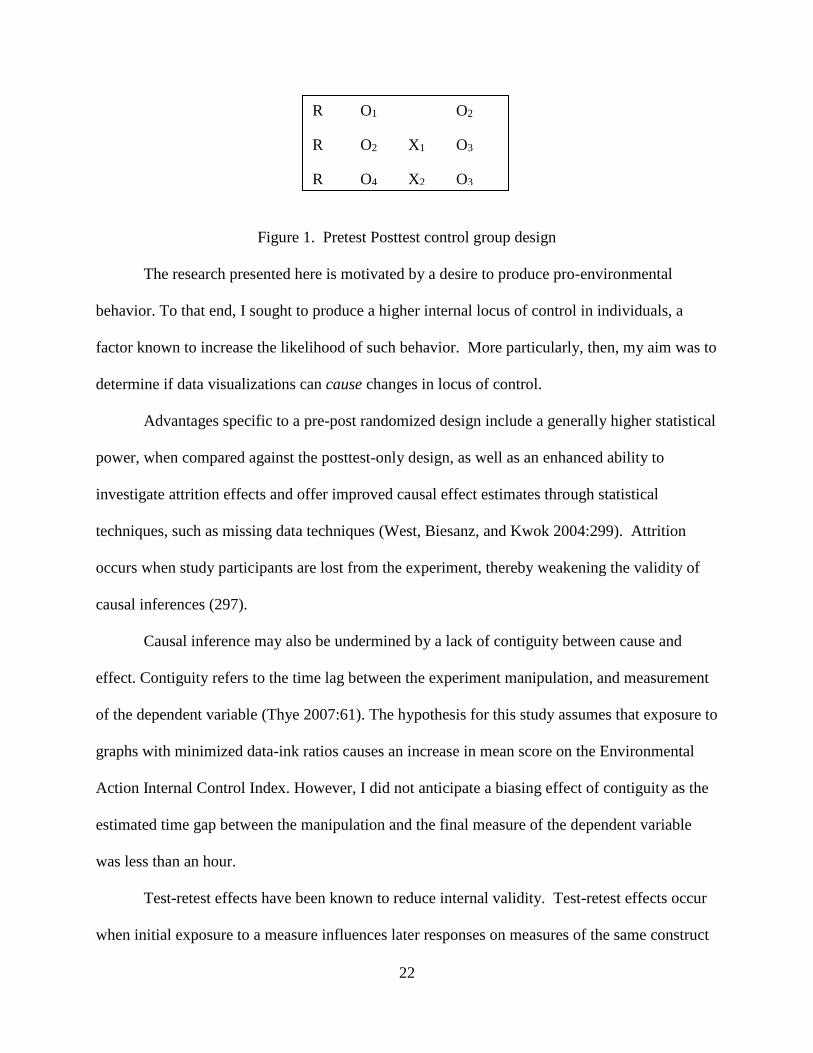
As shown in Figure 1, the study is a pretest/posttest design with control. In the two
experiment conditions, the independent variable, data-ink ratio, is varied. The third condition
does not use a graphical presentation, but rather presents data in a written format. In the figure
below, “R” refers to random assignment, “O” refers to observation, and “X” refers to the
experimental manipulation.
22
Figure 1. Pretest Posttest control group design
The research presented here is motivated by a desire to produce pro-environmental
behavior. To that end, I sought to produce a higher internal locus of control in individuals, a
factor known to increase the likelihood of such behavior. More particularly, then, my aim was to
determine if data visualizations can cause changes in locus of control.
Advantages specific to a pre-post randomized design include a generally higher statistical
power, when compared against the posttest-only design, as well as an enhanced ability to
investigate attrition effects and offer improved causal effect estimates through statistical
techniques, such as missing data techniques (West, Biesanz, and Kwok 2004:299). Attrition
occurs when study participants are lost from the experiment, thereby weakening the validity of
causal inferences (297).
Causal inference may also be undermined by a lack of contiguity between cause and
effect. Contiguity refers to the time lag between the experiment manipulation, and measurement
of the dependent variable (Thye 2007:61). The hypothesis for this study assumes that exposure to
graphs with minimized data-ink ratios causes an increase in mean score on the Environmental
Action Internal Control Index. However, I did not anticipate a biasing effect of contiguity as the
estimated time gap between the manipulation and the final measure of the dependent variable
was less than an hour.
Test-retest effects have been known to reduce internal validity. Test-retest effects occur
when initial exposure to a measure influences later responses on measures of the same construct
R O1 O2
R O2 X1 O3
R O4 X2 O3
23
(Campbell and Stanley 1963:5). Introducing a control condition minimizes the impact of test-
retest effects. Since it was not my intent to influence the scores on the post-survey by exposing
participants to the same questions in the pretest, I further incorporated a week-long break
between administrations of the index.
Recruitment and survey delivery
Research participants were recruited face-to-face from social science classes at a mid-
sized midwestern university. They were offered extra credit in return for their participation.
Convenience sampling was chosen for the researcher’s proximity to the sample population and
as a means of reducing cost.
The study was conducted online using Qualtrics. The lack of face-to-face interaction
between researcher and participant during the study was intended to decrease participant
response bias and researcher bias. The experiment had two phases: a pretest phase to establish
baseline measures of internal locus of control, and a manipulation phase, which at its conclusion,
again measured internal locus of control. During the pretest phase, participants were asked to
complete a Qualtrics survey that included a forced choice acknowledgement of informed consent
and the pretest. They were informed of the structure of the study and given notice of a
subsequent communication and the average amount of time each phase was expected to last.
During phase one, subjects were asked to complete The Environmental Action Internal Control
Index (EAICI) in a quiet, distraction-free setting, and return their responses within 48 hours.
Communication during this phase was mediated through email. Participants were informed of
the dates, times, and duration for phases one and two so response times could be more tightly
controlled.
24
Approximately one week after the 48-hour deadline for phase one, the manipulation
phase commenced. A one-week time gap was selected to diminish the effect of the pretest on
posttest responses (see Ahn et al. 2014:237). In the period between phase one and two,
respondents were randomly assigned to the “high number of graphical elements,” “low number
of graphical elements,” or the control condition. Graphical elements for the purpose of this study
refer to borders, outlines, fills, tick marks, grid lines, and text boxes. Random assignment was
used to ensure equality of the groups. Both groups were equal regarding historical, social,
genetic, personality, and physical factors (see Thye 2007:66).
For the two experimental conditions, each participant received 10 graphs and The
Environmental Action Internal Locus of Control Index. Both conditions were created using
Qualtrics, and participants were restricted such that they needed to examine the graphs prior to
completing the posttest. The control condition did not contain any graphs, but instead, described
the same information visualized in the two treatment conditions through descriptive text. After
examining the graphs, but prior to the posttest, participants were asked to write a sentence
explaining each visualization, followed by a five-point Likert scale question about the perceived
clarity of the visualization; these components were included to ensure participant engagement
with the visualizations or text.
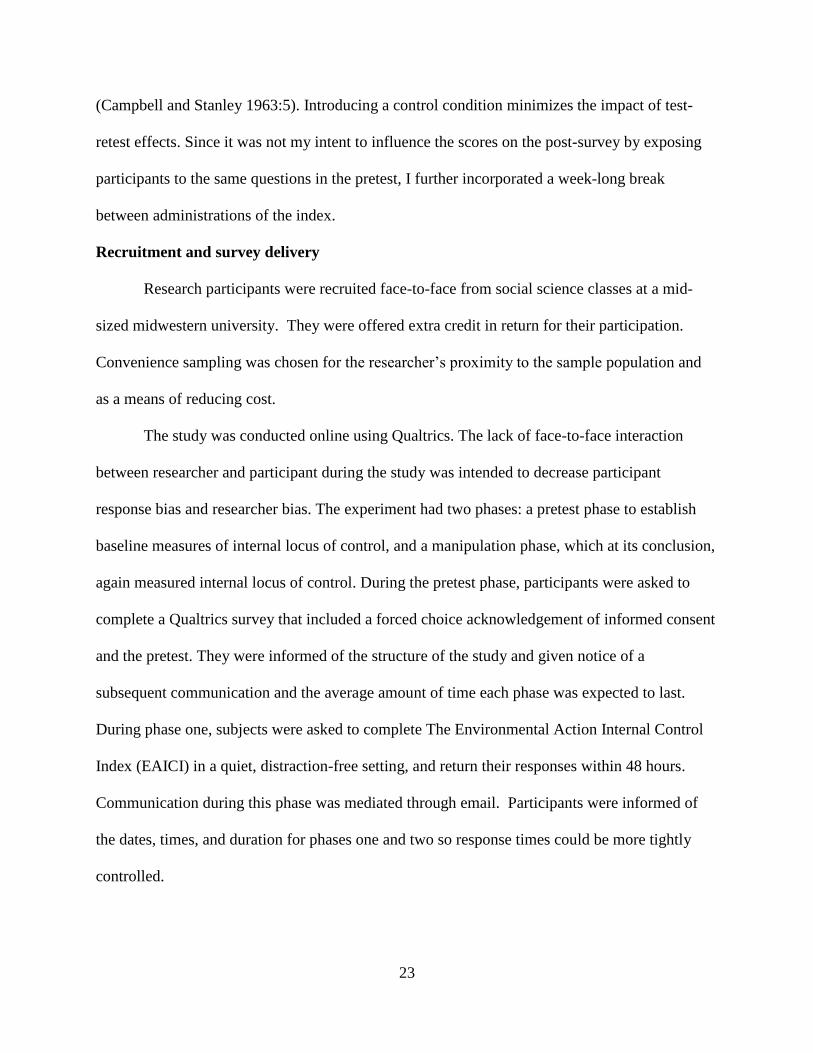
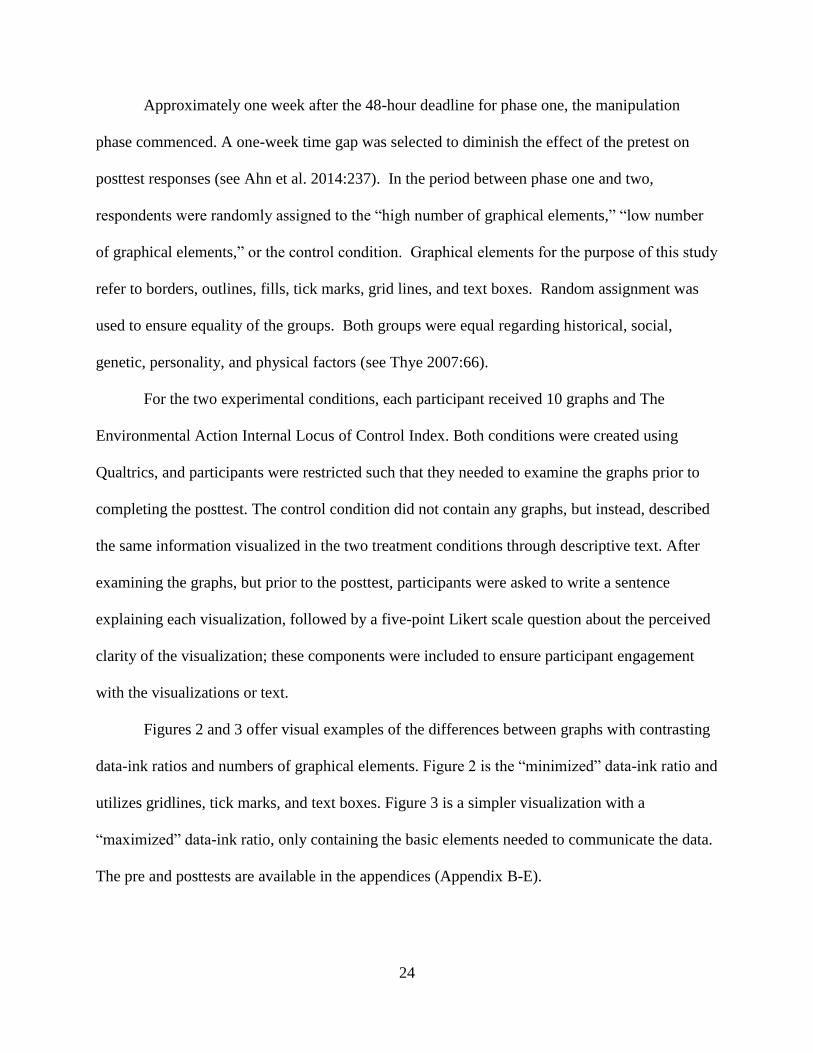
Figures 2 and 3 offer visual examples of the differences between graphs with contrasting
data-ink ratios and numbers of graphical elements. Figure 2 is the “minimized” data-ink ratio and
utilizes gridlines, tick marks, and text boxes. Figure 3 is a simpler visualization with a
“maximized” data-ink ratio, only containing the basic elements needed to communicate the data.
The pre and posttests are available in the appendices (Appendix B-E).
25
Figure 2. “High graphical elements”/minimized data-ink ratio
Figure 3. “Low graphical elements”/maximized data-ink ratio

26
Scale choice and validity/reliability
I chose to use a domain-specific scale, a practice that is in line with other contemporary
studies researching locus of control in the context of environmental behaviors, although Rotter’s
I-E and Levenson’s IPC scales are still commonly used (Galvin et al. 2018:8; Ernst et al.
2017:59; Ahn et al. 2014:243). The Environmental Action Internal Control Index is a 28-item
instrument, offering response options in a 5-point Likert format, ranging from “strongly
disagree” to “strongly agree” (Smith-Sebasto 1992). The index has strong face validity, as
participants are asked directly for their level of agreement regarding the effect of their specific
individual actions on the environment.
The validity and reliability of the index has previously been assessed through
discriminant analysis and Pearson product-moment correlation analysis conducted from field
tests which all included the EAICI, the Environmentally Responsible Behavior Inventory
(ERBI), and the Inventory of Environmental Action Knowledge and Skill (IEAKS) (Smith-
Sebasto 1994). One third of the tests also included the Internal Control Index, another third
included the Brown Locus of Control, and a final third included the Need for Control Scale
(Smith-Sebasto 1994).
Cronbach’s alpha, which tests for relatedness of items within a group, indicated strong
reliability in previous studies. The coefficient alpha was 0.94 for the full instrument, indicating
good internal consistency (Smith-Sebasto 1995). Smith-Sebasto and Fortner (1994) discovered
that the correlations between Duttweiler’s Internal Control Index (ICI), which intends to measure
internal locus of control generally (i.e., it is not specific to how it relates to the environment) and
the EAICI were stronger than those between the EAICI and Brown’s Locus of Control measure,
which does not specifically test for internal orientation, suggesting convergent validity in the
27
EAICI (Smith-Sebasto and Fortner 1994:7). Correlations between the EAICI and the Need for
Control scale indicated a weak relationship, suggesting discriminant validity for the EAICI,
showing they are probably not testing the same construct (1994:7).
Analysis
Analysis of Variance (ANOVA) on gain scores, Analysis of Covariance (ANCOVA),
ANOVA on residual scores, and repeated measures ANOVA are all commonly used statistical
methods of analysis in pre and posttest designs (Dimitrov and Rumrill, Jr. 2003). ANCOVA was
chosen for this study for its ability to remove systematic bias and reduce error variance
(Dimitrov and Rumrill, Jr. 2003). The use of ANCOVA assumes randomization, homogeneity of
regression slopes, and a linear relationship between pretest and posttest scores (2003:160). One
advantage of using ANCOVA over ANOVA on gain scores occurs when the regression slope
does not equal 1—a frequent occurrence. When this is the case, ANCOVA offers a more
powerful test (2003:161). A second advantage of ANCOVA over ANOVA on gain scores occurs
when some assumptions are not upheld. For example, both tests assume a linear relationship
between pretest and posttest. If this assumption does not hold, ANCOVA can be adjusted to
include a cubic or quadratic component (2003:161). Similarly, if regression slopes are not
homogenous, ANCOVA allows for additional procedures, such as the Johnson-Neyman
technique, which indicates regions of significance (2003:161). ANOVA on residual scores and
repeated measures ANOVA were both also a poorer fit for this study than ANCOVA. ANOVA
on residual scores has lower power when compared to ANCOVA (2006:161). Repeated
measures ANOVA’s results can be misleading when applied to pretest posttest data; since the
pretest scores are not influenced by the treatment, the treatment main effect’s F test is
conservative (163).
28
Methodological issues
Methodological issues, such as internal and external validity, have been considered in the
experimental design. Threats to internal validity in this study included effects from testing (as the
pre-test might, simply by raising awareness of the topic, influence participants’ scores in the
posttest) as well as any unreliability in the measure (see Thye 2007:73-74). As mentioned, I
incorporated a break between the pre and posttests to mitigate the threats to internal validity that
are inherent in pre-post studies. In addition, I re-established the reliability of the measure to
address concerns about internal validity threats due to the choice in instrumentation (see Thye
2007:74).
External validity is concerned with generalizability (Campbell and Stanley 1963:5).
Because an experiment may be considered externally valid if it can offer a means of explaining
and predicting behavior within the scope conditions of the theory, the design has been
constructed using a domain-specific variable (Zelditch 2007:108). The study does not seek to
predict or explain either questions of general locus of control or questions of data visualizations
that vary in ways other than the data-ink ratio or number of graphical elements.
To protect participants’ personal information that were gathered during the study,
materials were de-identified; I do not present data on an individual level. Since offering a
reward for participation in the study resulted in a power differential, the points offered were
minimal to not constitute a form of coercion (see Hegtvedt 2007:149). The issue of
objectification is of importance in laboratory experiments where the researcher manipulates the
context (147). Instead of using the more objectifying term “subject,” I used the more neutral term
“participant” (147). Finally, although the threat of physical harm was extremely low or non-
existent in this study, other potential harms, such as social or psychological harms or the harm of
29
inconvenience existed (148). Social harms are those which might negatively influence a
participant’s social standing; in the case of this study, this concern is closely linked to
confidentiality concerns, as shared information about individuals’ beliefs regarding
environmental behaviors may have social consequences.
This study was determined exempt (category #3 (B)) by the NDSU IRB (see Appendix
A). Still, it aimed to fulfill the requirements set forth by the Belmont Report for human subjects’
research, namely, respect for persons, beneficence and justice. Respect for persons refers to the
understanding that participants have autonomy and should be treated with dignity. The principle
of beneficence requires minimizing harm while maximizing benefits, a balance I obtained
through the careful design and execution of the experiment, while being attentive to signs of
psychological or social distress through any communication from participants. Justice requires
that those who bear the burdens of research should receive its benefits (146). College students
almost certainly would benefit from research findings that indicate more effective ways of
communicating data to shift environmental locus of control toward greater internality.
30
RESULTS
The investigation presented here asked if locus of control could be altered by
manipulating the number of graphical elements in messaging. Drawing on social learning theory
and theories of data visualization, I derived the following hypothesis.
H: Mean scores for internal locus of control will increase most when
data is presented using a high number of supporting, non-data
graphical elements, and least when information is not presented in
graph form.
The results of the study were statistically non-significant; a description of the findings follows.
Participants were undergraduate students from social science classes from a mid-sized
midwestern university. Additional demographic data was not collected about the sample. A total
of 105 respondents completed the pretest; 91 participants completed both the pre and the
posttest.
The reliability of the instrument used in the pre and posttest was tested using Cronbach’s
alpha. Cronbach’s alpha indicated that the index used in this study—the Environmental Action
Internal Control Index (EAICI)—has strong reliability based on analyzing scores for the pretest
of this study (α=0.95); this is similar to previous tests of reliability on the index (see Smith-
Sebasto 1995). Further analysis was conducted to determine whether there would be a
measurable difference if any item from the index were deleted. The test indicated that reliability
could not be increased through further deletion of any one item from the index. Therefore, the
following data were based on responses from the EAICI in its entirety.
The data met the assumptions for conducting an ANCOVA as there was not a statistically
significant difference between groups on the pretest scores (p=.16) and a test of between-subjects
31
effects was not significant (p= .63)—meeting the assumption for the homogeneity of regression
assumption.
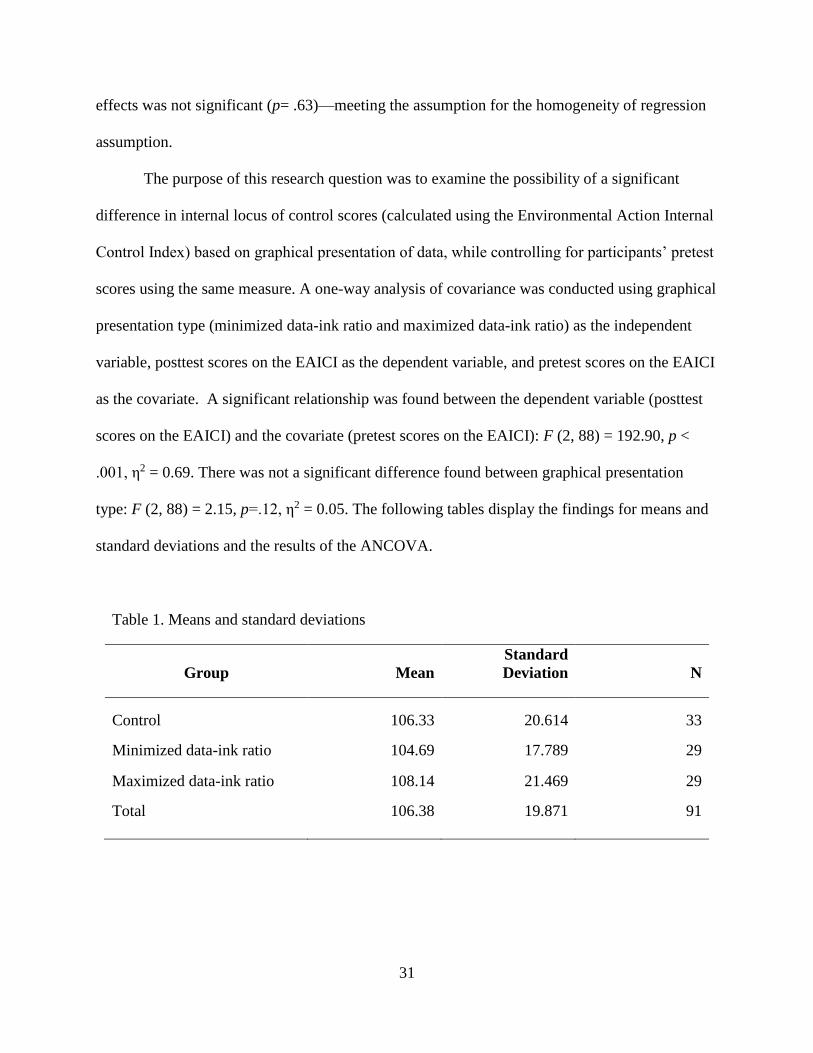
The purpose of this research question was to examine the possibility of a significant
difference in internal locus of control scores (calculated using the Environmental Action Internal
Control Index) based on graphical presentation of data, while controlling for participants’ pretest
scores using the same measure. A one-way analysis of covariance was conducted using graphical
presentation type (minimized data-ink ratio and maximized data-ink ratio) as the independent
variable, posttest scores on the EAICI as the dependent variable, and pretest scores on the EAICI
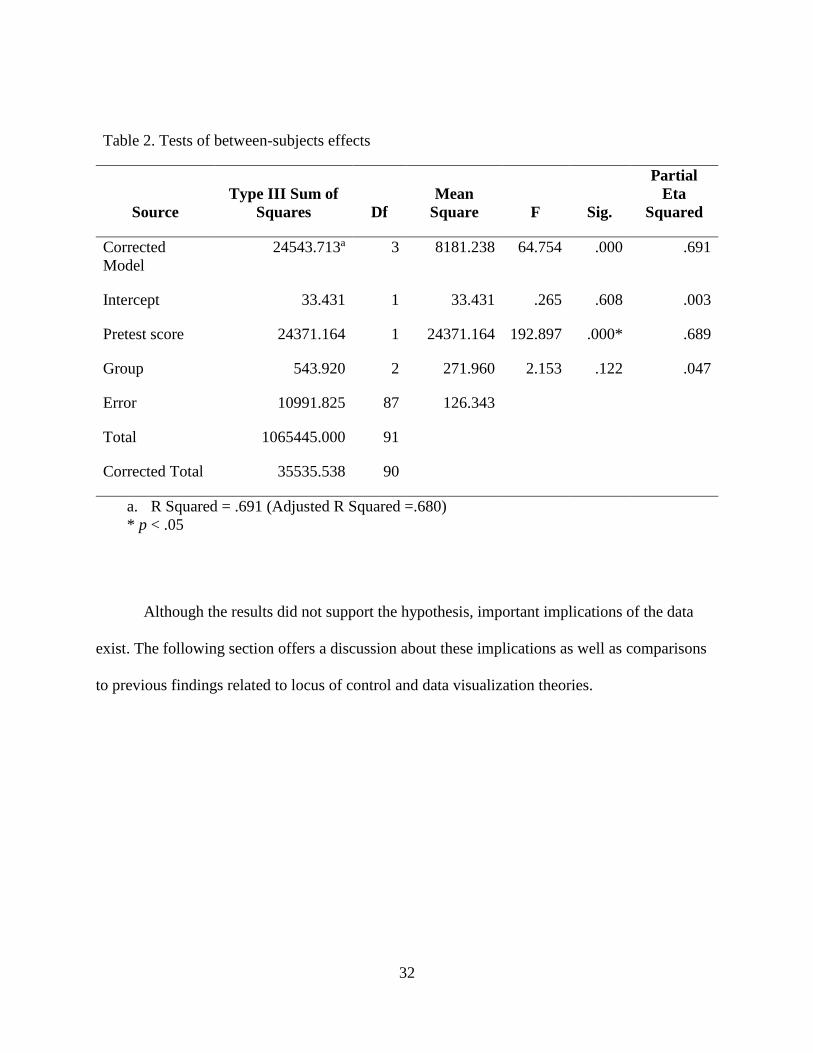
as the covariate. A significant relationship was found between the dependent variable (posttest
scores on the EAICI) and the covariate (pretest scores on the EAICI): F (2, 88) = 192.90, p <
.001, η2 = 0.69. There was not a significant difference found between graphical presentation
type: F (2, 88) = 2.15, p=.12, η2 = 0.05. The following tables display the findings for means and
standard deviations and the results of the ANCOVA.
Table 1. Means and standard deviations
Group Mean
Standard
Deviation N
Control 106.33 20.614 33
Minimized data-ink ratio 104.69 17.789 29
Maximized data-ink ratio 108.14 21.469 29
Total 106.38 19.871 91
32
Although the results did not support the hypothesis, important implications of the data
exist. The following section offers a discussion about these implications as well as comparisons
to previous findings related to locus of control and data visualization theories.
Table 2. Tests of between-subjects effects
Source
Type III Sum of
Squares Df
Mean
Square F Sig.
Partial
Eta
Squared
Corrected
Model
24543.713a 3 8181.238 64.754 .000 .691
Intercept 33.431 1 33.431 .265 .608 .003
Pretest score 24371.164 1 24371.164 192.897 .000* .689
Group 543.920 2 271.960 2.153 .122 .047
Error 10991.825 87 126.343
Total 1065445.000 91
Corrected Total 35535.538 90
a. R Squared = .691 (Adjusted R Squared =.680)
* p < .05
33
DISCUSSION
The results did not support the hypothesis that exposure to a maximized data-ink ratio
graph would increase scores of internal loci of control more than when data was not presented in
graph form. The findings, therefore, are inconsistent with newer developments in locus of control
theory suggesting its malleability and do not support the practice of manipulating visualizations
as a means of encouraging changes in loci (Galvin et al. 2018; Legerski et al. 2006; Ryon and
Gleason 2014). This section discusses support for and divergence from the two main guiding
theories, limitations of the study, —including aspects of design and sample population — and
suggestions for future research.
Recent research suggesting that locus of control may exist more like a state than a
permanent trait (Legerski et al. 2006; Ryon and Gleason 2014) informed this study’s attempt to
manipulate internal locus of control. Research specifically attempting to manipulate locus of
control to encourage pro-environmental behaviors is still nascent; other means of manipulation
offer possibilities to be explored (Ahn et al. 2014). It may be that internal locus of control is
more susceptible to change through methods other than exposure to environmental data via
graphs.
Ziemkiewicz et al.’s 2013 study addressing the relationship between visual
representations and locus of control served as inspiration for this project’s hypothesis. Their
findings suggest that, “a useful guideline for adaptation would be to increase the amount of
explicit structures for users that might have a more external locus of control”, noting that a
rejection of Tufte’s largely-accepted guidelines might ultimately be helpful to those with an
external locus of control (2013:13). Their research also indicates that those with internal LOC
may prefer their own mental models, meaning such individuals would likely do better with visual
34
representations that followed Tufte’s guidelines. While their study does support the
externalization theory of visualization, it does not make claims regarding how visualizations
might be used to alter one’s locus of control. Further, it should be noted that the index used for
this project specifically measured internal locus of control within the domain of environmental
action (on a continuum), while Ziemkiewicz et al.’s (2013) study used a different scale
measuring generalized expectancies where participants were categorized as “external LOC
users,” “internal LOC users,” and “average LOC users.” Since these studies conceptualize locus
of control differently (i.e., generalized versus domain-specific) the implications of each study are
different. It may be the case that locus of control, as measured within a particular domain, is
more or less pervious to change compared to generalized measures, or that different types of
manipulations are more or less efficacious depending on their format and application to a
particular domain.
Limitations in this study stem partially from sampling issues. Using a convenience
sample may have introduced a selection bias. Since having a higher internal locus of control, by
definition, is characterized by a greater sense of control of one’s outcomes, it may be the case
that those who elected to participate did so, in part, due to a relatively higher starting internal
locus of control than their non-participating peers, although this clearly cannot be verified.
Another potential limitation of this study may relate to the design of the study itself. Although
the manipulations were inspired by suggestions in previous research (Ziemkiewicz et al. 2013),
they might not have been extreme enough to cause measurable changes in locus of control. In
addition, the study analyzed the responses of a relatively low number of participants (n=91),
following attrition from the initial recruitment and the break between the pre and posttest. The
restriction of the study to college students is not a limitation in this study since the index was
35
originally developed for distribution to undergraduate students (Smith-Sebasto and Fortner
1994).
This project hypothesized that graphical presentation type would influence one’s ability
to comprehend data. The following discusses the relationship between presentation style and
comprehension and offers cause for considering how different approaches to imparting
knowledge might improve this study’s model for manipulating internal locus of control.
This study was based on the principle that information cannot mediate behavior in the
absence of comprehension, and that comprehension could be enhanced by visual presentation
style—specifically through graphs with minimized data-ink ratios. Although this study did not
directly test comprehension, it was designed assuming a relationship between presentation style
and comprehension. In a 2015 thesis, Kevin McGurgan conducted an experiment specifically
testing the question of whether data-ink maximization improved performance in graph
comprehension tasks. The results of McGurgan’s study suggested that data-ink maximization
does not improve performance and encouraged future studies to consider the “subjective issue of
graph aesthetics” in relation to data-ink ratio and emphasized the importance of considering the
audience of the graphical information (McGurgan 2012: iv). McGurgan’s study tested the merit
of allegiance to Tufte’s guidelines, whereas this study hypothesized the influence of their
rejection. Suggestions for future research, therefore, include a greater development of the
understanding of the relationship between knowledge and locus of control by way of application
of different epistemological approaches. The following considers how a conception of
knowledge as a social relation, as opposed to a simple accumulation of facts or receipt of
information, may be more effective in models aimed at manipulating internal locus of control
(see Bell and Ashwood 2016:320).
36
Although effective communication strategies about the state of the environment remain
crucial, it is unlikely that the simple sharing of information will result in increasing internal loci
of control—and resulting pro-environmental behaviors—without greater consideration given to
an audience’s capacity to receive and integrate the information as meaningful (and actionable)
knowledge. Literature supports this line of reasoning. Daubenmire et al. (2017) used the
FOCUSSS (Families, Organizations, and Communities Understanding Science, Sustainability,
and Service) design framework, a research project incorporating projects across both informal
and formal learning environments (e.g., chemistry classrooms, the home, and museums) as a way
of empowering urban high school students and their families to engage in sustainable living
choices. Participation in the program correlated with increased self-efficacy and the adoption of
positive changes in pro-environmental behavior (Daubenmire et al. 2017). Daubenmire et al.’s
research project was constructed using the theory of Situated Cognition and Knowledge
Building, a “social constructivist pedagogical theory” (2017:61). In another study, Ahn et al.
(2014) examined differences between print and video messages about tree-cutting and paper use
against communication via immersive visual environments (IVEs). IVEs allowed participants to
hear, see and feel stimuli related to tree-cutting as if they were experiencing them in the physical
world; results indicated greater success with the use of IVEs than print or video messages, as
participants assigned to the IVE condition reported greater internal environmental locus of
control and pro-environmental behaviors a week following the experiences (2014:235). The
commonality between these two studies exists in their focus not in the transfer of knowledge by
simple information sharing, but in the capacity for experientially gained knowledge (e.g.,
through physical stimuli and within the context of daily routines) to encourage the adoption of
pro-environmental behaviors. In brief, it seems that information actually does play a central role
37
in the adoption of pro-environmental behaviors, but it is most effective when it is linked
concretely to one’s everyday life experiences.
Implications of study for policymakers, activists, and educators
As discussed in the previous section, it appears that the simple dissemination of
information without regard to individual differences may be ineffective in shifting locus of
control. Indeed, the lack of statistically significant findings in this study lend support to the
conceptualization of locus of control as more of a permanent trait than an alterable state. It may
be the case that, at least within the environmental domain, locus of control is unlikely to be
influenced significantly. It may also be the case that locus of control did not change significantly
in this study due to the weakness of the experimental manipulation. Implications exist for
policymakers, educators, and activists.
Even if locus of control cannot be markedly shifted toward internality, policymakers
maintain a significant amount of authority and capacity to effect change. Individuals who might
not choose to participate in pro-environmental behaviors based on their own disposition or sense
of duty might change their behaviors if policy changes administered by ‘powerful others’ require
them to engage in more positive environmental behaviors. Creating policy that incurs positive
incentives or negative consequences for behaviors that affect the environment is one way in
which policy makers can address environmental concerns within their communities.
Since it is possible that locus of control did not alter considerably in this study due to the
weakness of the intervention, activists may consider means of crafting and utilizing more direct
visualizations. Visualizations based on local data or clear quantifications of personal impact, for
instance, may have a greater capacity to influence locus of control than those used within this
study, which utilized more global, abstract data. Additionally, since those with an external locus
38
of control may be more willing to adapt their thinking to novel visualizations than those with
internal loci (Ziemkiewicz et al. 2013), activists might explore the efficacy of less commonly
used visualizations than the bar graphs used in this study.
Locus of control theory claims that early experiences serve as antecedents to one’s
development of locus of control (Galvin et al. 2018); therefore environmental educators may
consider paying particular attention to the education of young people who are in the process of
developing expectancies as an alternative to focusing efforts on changing already-developed loci.
Offering early environmental education experiences linking personal efforts to outcomes may
lead young people to develop an internal locus of control in their early years. Continued
educational efforts following early education would offer students exposure to current
environmental realities and best practices, creating space for necessary dialogue—a valuable
exercise for students, even if it fails to result in shifts in loci.
39
CONCLUSION
The findings of this study did not support the hypothesis that data-ink ratio impacts
internal locus of control scores. However, there still exists a substantial body of research that has
produced valid and reliable situation-specific measures that can be used to further test for ways
of manipulating locus of control. Data visualization theory and guidelines should continue to be
studied and refined based on their capacity to accurately transmit messaging. Models that
recognize knowledge as a social relation, either implicitly or explicitly, show promise in
previous studies and should be considered as an avenue for future research studies aimed at
encouraging greater internality in locus of control within the context of environmental behaviors.

40
REFERENCES
Ahn, Sun Joo (Grace), Jeremy N. Bailenson, and Dooyeon Park. 2014. “Short- and Long-Term
Effects of Embodied Experiences in Immersive Virtual Environments on Environmental
Locus of Control and Behavior.” Computers in Human Behavior 39:235-245.
Bamberg, Sebastian and Guido Möser. 2007. “Twenty Years After Hines, Hungerford, and
Tomera: A New Meta-Analysis of Psycho-Social Determinants of Pro-Environmental
Behavior.” Journal of Environmental Psychology 27:14-25.
Barr, Stewart and Andrew W. Gilg. 2007. “A Conceptual Framework for Understanding and
Analyzing Attitudes towards Environmental Behavior.” Geografiska Annaler. Series B,
Human Geography 89(4):361-379.
Bell, Michael M. and Loka L. Ashwood. 2016. An Invitation to Environmental Sociology 5th ed.
Los Angeles: Sage.
Boomsma, Christine, Sabine Pahl, and Jackie Andrade. 2016. “Imagining Change: An
Integrative Approach toward Explaining the Motivational Role of Mental Imagery in Pro-
Environmental Behavior.” 2016. Frontiers in Psychology 7:1-14. doi:
10.3389/fpsyg.2016.01780
Brown, A.S., Cheslack-Postava, K., Rantakokko, P., Kiviranta, H., Hinkka-Yli-Salomäki, S.,
McKeague, I.W., Surcel, H., Sourander, A. “Association of Maternal Insecticide Levels
with Autism in Offspring from a National Birth Cohort.” The American Journal of
Psychiatry doi: https://doi-
org.ezproxy.lib.ndsu.nodak.edu/10.1176/appi.ajp.2018.17101129
Campbell, Donald T. and Julian C. Stanley. 1963. Experimental and Quasi-Experimental
Designs for Research. Chicago: Rand McNally College Publishing Company.
Carson, Rachel. [1962] 2000. Silent Spring. Reprint, London: The Folio Society.
Croxton, Frederick E. 1932. “Graphic Comparisons by Bars, Squares, Circles, and Cubes.”
Journal of the American Statistical Association 27(177):54-60.
Daubenmire, P.L., M.T. van Opstal, N.J. Hall, B. Wunar, and N. Kowrach. 2017. “Using The
Chemistry Classroom As The Starting Point for Engaging Urban High School Students
And Their Families In Pro-Environmental Behaviors.” International Journal of Science
Education 7 (1):60-75.
Dimitrov, Dimiter M. and Phillip D. Rumrill, Jr. 2003. “Pretest-Posttest Designs and
Measurements of Change.” Work 20(2):159-165.
Eells, Walter Crosby. 1926. “The Relative Merits of Circles and Bars for Representing
Component Parts.” Journal of the American Statistical Association 21(154):119-132.

41
Ernst, Julie, Nathaniel Blood and Thomas Beery. 2017. “Environmental Action and Student
Environmental Leaders: Exploring the Influence of Environmental Attitudes, Locus of
Control, and Sense of Personal Responsibility.” Environmental Education Research
23(2):149-175.
Feinberg, Matthew and Robb Willer. 2011. “Apocalypse Soon? Dire Messages Reduce Belief in
Global Warming by Contradicting Just-World Beliefs.” Psychological Science 22(1):34-
38.
Feinberg, Matthew and Robb Willer. 2012. “The Moral Roots of Environmental Attitudes.”
Association for Psychological Science 24(1):56-62.
Feygina, Irina, John T. Jost, and Rachel E. Goldsmith. 2010. “System Justification, the Denial of
Global Warming, and the Possibility of ‘System-Sanctioned Change’.” Personality and
Social Psychology Bulletin 36(3): 326-338.
Galvin, Benjamin M., A.E. Randel, B.J. Collins, and R.E. Johnson. 2018. “Changing the Focus
of Locus (of Control): A Targeted Review of the Locus of Control Literature and Agenda
for Future Research.” Journal of Organizational Behavior 39(7): 820-833.
Hashimoto, Teruo, H. Takeuchi, Y. Taki, A. Sekiguchi, R. Nouchi, Y. Kotozaki, S. Nakagawa,
C.M. Miyauchi, K. Iizuka, R. Yokoyama, T. Shinada, Y. Yamamoto, S. Hanawa, T.
Araki, H. Hashizume, K. Kunitoki, and R. Kawashima. 2015. “Neuroanatomical
Correlates of the Sense of Control: Gray and White Matter Volumes Associated with an
Internal Locus of Control.” NeuroImage 119:146-151.
Hegtvedt, Karen. 2007. “Ethics and Experiments,” Pp. 141-172 in Laboratory Experiments in the
Social Sciences, edited by M. Webster, Jr. and J. Sell. Amsterdam: Academic Press.
Huebner, Robert B. and Mark W. Lipsey. 1981. “The Relationship of Three Measures of Locus
of Control to Environmental Activism.” Basic and Applied Social Psychology 2(1):45-58.
Intergovernmental Panel on Climate Change. 2007. “Climate Change 2007: Synthesis Report.”
Retrieved November 23, 2018
(https://www.ipcc.ch/publications_and_data/ar4/syr/en/spms1.html).
Kalamas, Maria, Mark Cleveland, and Michel Laroche. 2014. “Pro-environmental Behaviors for
Thee but not for Me: Green Giants, Green Gods, and External Environmental Locus of
Control.” Journal of Business Research 67(2):12-22.
Legerski, Elizabeth Miklya, Marie Cornwall and Brock O’Neil. 2006. “Changing Locus of
Control: Steelworkers Adjusting to Forced Unemployment.” Social Forces 84(3):1521-
1537.
Levenson, Hanna and Jim Miller. 1976. “Multidimensional Locus of Control in Sociopolitical
Activists of Conservative and Liberal Ideologies.” Journal of Personality and Social
Psychology 33(2): 199-208.
42
Levenson, Hanna. 1974. “Activism and Powerful Others: Distinctions within the Concept of
Internal-External Control.” Journal of Personality Assessment 38:77-383.
Levenson, Hanna. 1981. “Differentiating Among Internality, Powerful Others, and Chance.” Pp.
15-63 in Research with the Locus of Control Construct, edited by H. Lefcourt. New
York: Academic Press.
Lynch, Michael J. 2017. “Green Criminology and Social Justice: A Reexamination of the
Lynemouth Plant Closing and the Political Economic Causes of Environmental Social
Injustice.” Critical Sociology 43(3): 449-464.
McGurgan, Kevin. 2015. “Data-ink Ratio and Task Complexity in Graph Comprehension.”
Master’s thesis. Department of Psychology, Rochester Institute of Technology.
NASA. N.d. “Arctic Sea Ice Minimum.” Retrieved November 13, 2018
(https://climate.nasa.gov/vital-signs/arctic-sea-ice/).
NASA. N.d. “Carbon Dioxide.” Retrieved November 13, 2018 (https://climate.nasa.gov/vital-
signs/carbon-dioxide/).
NASA. N.d. “Climate Change: How Do We Know?” Retrieved November 23, 2018
(https://climate.nasa.gov/evidence/).
NOAA National Centers for Environmental Information. 2018. “Climate at a Glance: Global
Mapping.” Retrieved November 13, 2018 (https://www.ncdc.noaa.gov/cag/).
Ottley, A., Crouser, R.J., Ziemkiewicz, C. and Chang, R. 2015. “Manipulating and Controlling
for Personality Effects on Visualization Tasks.” Information Visualization 14(3): 223-
233.
Rotter, Julian B. 1966. “Generalized Expectancies for Internal Versus External Control of
Reinforcement.” Psychological Monographs: General and Applied 80(1):1-28.
Ryon, Holly S. and Marci E.J. Gleason. 2014. “The Role of Locus of Control in Daily Life.”
Personality and Social Psychology Bulletin 40(1):121-131.
Seeman, Melvin. 1959. “On the Meaning of Alienation.” American Sociological Association
24(6):783-791.
Smith-Sebasto, Nicholas J. 1992. “Design, Development, and Validation of an Instrument to
Assess the Relationship Between Locus of Control of Reinforcement and
Environmentally Responsible Behavior in University Undergraduate Students.” PhD
dissertation, The Ohio State University.
Smith-Sebasto, Nicholas J. 1995. “Designing a Likert-Type Scale to Predict Environmentally
Responsible Behavior in Undergraduate Students: A Multistep Process.” The Journal of
Environmental Education 27(1): 14-20.
43
Smith-Sebasto, N.J. and Rosanne W. Fortner. 1994. “The Environmental Action Index.” The
Journal of Environmental Education 25(4): 23-29.
Steg, Linda and Charles Vlek. 2008. “Encouraging Pro-Environmental Behaviour: An
Integrative Review and Research Agenda.” Journal of Environmental Psychology 29(3):
309-317.
Stern, Paul C. 2000. “Toward a Coherent Theory of Environmentally Significant Behavior.”
Journal of Social Issues 56(3): 407-424.
Stoll, Steven. 2007. U.S. Environmentalism since 1945: A Brief History with Documents. Boston:
Bedford/St. Martin’s.
Thye, Shane R. 2007. “Logical and Philosophical Foundations of Experimental Research in the
Social Sciences.” Pp. 57-86 in Laboratory Experiments in the Social Science, edited by
M. Webster, Jr. and J. Sell. Amsterdam: Academic Press.
Tufte, Edward R. 1983. The Visual Display of Quantitative Information. Cheshire, CT: Graphics
Press.
Wang, Chen, D. Miller, I. Brown, Y. Jiang, and M. Castellazi. 2016. “Visualisation Techniques
to Support Public Interpretation of Future Climate Change and Land-Use Choices: A
Case Study from N-E Scotland.” International Journal of Digital Earth 9(6):586-605.
West, Stephen G., Jeremy C. Biesanz, and Oi-Man Kwok. 2004. “Within-Subject and
Longitudinal Experiments: Design and Analysis Issues.” Pp. 247-312 in The Sage
Handbook of Methods in Social Psychology edited by C. Sansone, C.C. Morf, and A.T.
Panter. Thousand Oaks: Sage Publications.
Willer, David and Walker, Henry A. 2007. Building Experiments: Testing Social Theory.
Stanford: Stanford University Press.
World Bank. N.d. “Environment.” Retrieved November 13, 2018
(https://data.worldbank.org/topic/environment).
Yuriev, Alexander, O. Boiral, V. Francoeur, P. Paille. 2018. “Overcoming the Barriers to Pro-
Environmental Behaviors in the Workplace: A Systematic Review.” Journal of Cleaner
Production 182: 379-394.
Zelditch, Jr., Morris. 2007. “The External Validity of Experiments that Test Theories.” Pp. 87-
112 in Laboratory Experiments in the Social Sciences, edited by M. Webster, Jr. and J.
Sell. Amsterdam: Academic Press.
Ziemkiewicz, Caroline, A. Ottley, R.J. Crouser, A.R. Yauila, S.L. Su, W. Ribarsky, and R.
Chang. 2013. “How Visualization Layout Relates to Locus of Control and Other
Personality Factors.” IEEE Transactions on Visualization and Computer Graphics 19(7):
1109-1121
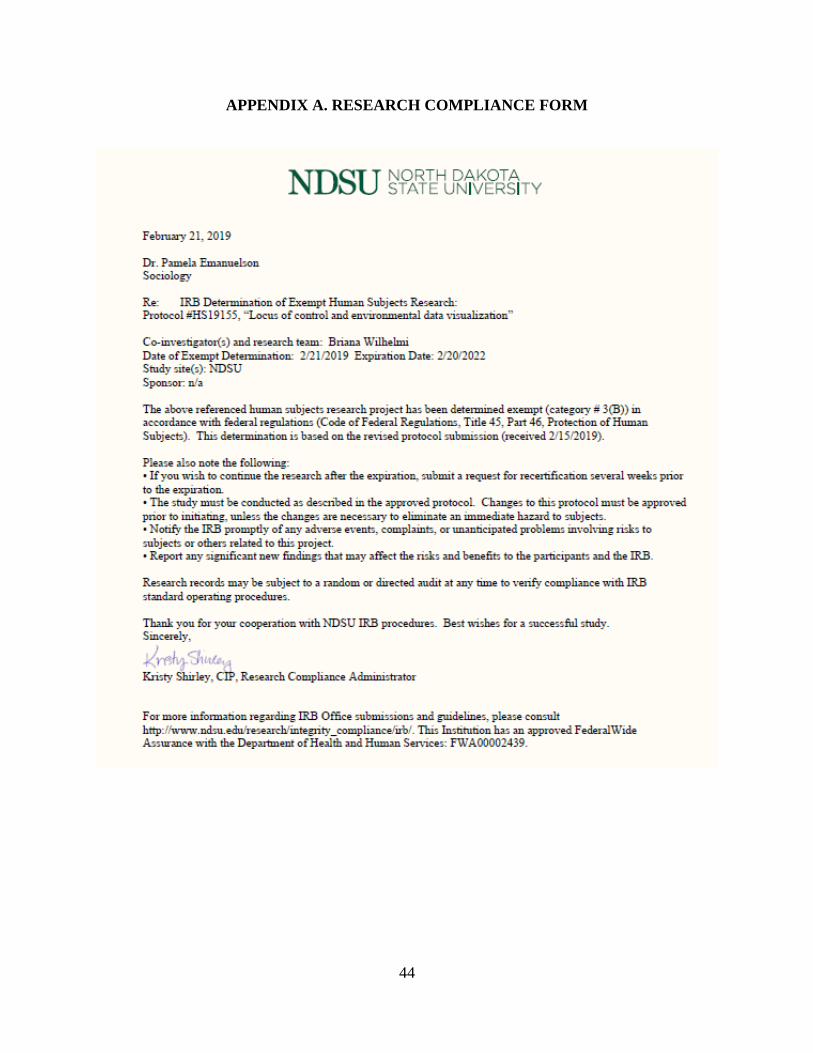
44
APPENDIX A. RESEARCH COMPLIANCE FORM

45
APPENDIX B. PRETEST
Pretest
Start of Block: Informed Consent
Q1 Informed Consent
PI: Dr. Pamela Emanuelson, 701-231-5887, [email protected]
Co-investigator: Briana Wilhelmi, [email protected]
The Department of Sociology and Anthropology invites you to participate in an experimental
study. The purpose of this study is to examine the relationship between data presentation and
one’s sense of control over their environment. After the project is completed, the results will be
analyzed, and conclusions will be shared in a thesis.
Please examine the following information before deciding whether you wish to participate. If
you have questions regarding the content of this form or have questions at any time during the
study, please direct them to the co-investigator or PI listed above.
The study will take place online through two Qualtrics surveys. The first survey, which
immediately follows if you give your consent, is estimated to take approximately 10 minutes
and the second survey should last no more than 15 minutes. You will have 48 hours to complete
this first survey. A week after this deadline, you will receive the second survey, which you will
also have 48 hours to complete. During the experiment, you will be asked to complete an index
regarding your beliefs about the impact of your actions on the environment and will be asked
about the clarity of environmentally-relevant data.
Please note that all interaction occurs online. Throughout the study you will be referred to by a
label to protect your privacy.
This research has no more than minimal risk, but also carries benefits. Through participation in
this study, you will learn about current environmental data. Furthermore, participants will be
compensated with extra credit, receiving half of the possible points through completion of the
first survey and the remainder of the possible points through completion of the second survey.
You must complete the first survey to receive the second. You may contact your instructor for
non-research alternatives to earn extra credit.
Your participation is completely voluntary, and you may opt out of the study at any time.
You have rights as a participant in research. If you have any questions about your rights, or
complaints about this research, you may talk to the researcher or contact the NDSU Human
Research Protection Program by:
Telephone: 701.231.8995 or toll-free 1.855.800.6717
Email: [email protected]
Mail: NDSU HRPP Office, NDSU Dept. 4000, PO Box 6050, Fargo, ND 58108-6050.
The role of the Human Research Protection Program is to see that your rights are protected in
46
this research; more information about your rights can be found at: www.ndsu.edu/irb .
If you have questions about the study, please contact Briana Wilhelmi
([email protected]) or the PI, Dr. Pamela Emanuelson (701-231-5887 or
Do you give your consent to participate in this study?
o Yes (1)
o No (2)
End of Block: Informed Consent
Start of Block: Course information
Q2 Please provide course information in the following questions to receive extra credit.
Q3 Course name (e.g., SOC 110)
________________________________________________________________
Q4 Instructor name
________________________________________________________________
End of Block: Course information
Start of Block: Pretest
Q5 The Environmental Control Index: Instructions
Please read the partial statement in bold letters below followed by the action described after each
47
number. Then, carefully fill the choice on the answer sheet which best indicates how strongly
you agree or disagree with the whole statement.
Please respond to every statement with only one choice.
Key:
1=Strongly Disagree; 2=Disagree; 3=Unsure; 4=Agree; 5=Strongly Agree
Q6 My individual actions would improve the quality of the environment if I were to...
learn about the recycling facilities in my area.
o 1. Strongly Disagree (1)
o 2. Disagree (2)
o 3. Unsure (3)
o 4. Agree (4)
o 5. Strongly Agree (5)
Q7 My individual actions would improve the quality of the environment if I were to...
attend a community meeting that involves concern over a local environmental issue.
o 1. Strongly Disagree (1)
o 2. Disagree (2)
o 3. Unsure (3)
o 4. Agree (4)
o 5. Strongly Agree (5)

48
Q8 My individual actions would improve the quality of the environment if I were to...
buy resource conservation devices, such as low-flow faucet aerators for my sinks and low-flow
shower heads.
o 1. Strongly Disagree (1)
o 2. Disagree (2)
o 3. Unsure (3)
o 4. Agree (4)
o 5. Strongly Agree (5)
Q9 My individual actions would improve the quality of the environment if I were to...
buy products packaged in containers that either can be reused or recycled or are made of recycled
materials.
o 1. Strongly Disagree (1)
o 2. Disagree (2)
o 3. Unsure (3)
o 4. Agree (4)
o 5. Strongly Agree (5)
49
Q10 My individual actions would improve the quality of the environment if I were to...
report someone who violates a law or laws that protect our natural resources (e.g., illegal fishing,
hunting, or trapping or illegal tree cutting) to the proper authorities.
o 1. Strongly Disagree (1)
o 2. Disagree (2)
o 3. Unsure (3)
o 4. Agree (4)
o 5. Strongly Agree (5)
Q11 My individual actions would improve the quality of the environment if I were to...
report someone who tampers with the anti-pollution devices on a car to the proper authorities.
o 1. Strongly Disagree (1)
o 2. Disagree (2)
o 3. Unsure (3)
o 4. Agree (4)
o 5. Strongly Agree (5)

50
Q12 My individual actions would improve the quality of the environment if I were to...
reduce the amount of my household trash by reusing or recycling items to the fullest extent
possible.
o 1. Strongly Disagree (1)
o 2. Disagree (2)
o 3. Unsure (3)
o 4. Agree (4)
o 5. Strongly Agree (5)
Q13 My individual actions would improve the quality of the environment if I were to...
set my home appliances, such as the refrigerator, dishwasher, water heater, etc. to 'energy saver'
levels.
o 1. Strongly Disagree (1)
o 2. Disagree (2)
o 3. Unsure (3)
o 4. Agree (4)
o 5. Strongly Agree (5)

51
Q14 My individual actions would improve the quality of the environment if I were to...
take my old tires to a recycling center.
o 1. Strongly Disagree (1)
o 2. Disagree (2)
o 3. Unsure (3)
o 4. Agree (4)
o 5. Strongly Agree (5)
Q15 My individual actions would improve the quality of the environment if I were to...
carpool instead of driving alone.
o 1. Strongly Disagree (1)
o 2. Disagree (2)
o 3. Unsure (3)
o 4. Agree (4)
o 5. Strongly Agree (5)

52
Q16 My individual actions would improve the quality of the environment if I were to...
open windows for ventilation rather than using a fan or air conditioner.
o 1. Strongly Disagree (1)
o 2. Disagree (2)
o 3. Unsure (3)
o 4. Agree (4)
o 5. Strongly Agree (5)
Q17 My individual actions would improve the quality of the environment if I were to...
convince someone to boycott a store that sells products that damage the environment.
o 1. Strongly Disagree (1)
o 2. Disagree (2)
o 3. Unsure (3)
o 4. Agree (4)
o 5. Strongly Agree (5)
53
Q18 My individual actions would improve the quality of the environment if I were to...
convince someone to sign a petition regarding an environmental issue.
o 1. Strongly Disagree (1)
o 2. Disagree (2)
o 3. Unsure (3)
o 4. Agree (4)
o 5. Strongly Agree (5)
Q19 My individual actions would improve the quality of the environment if I were to...
convince someone to learn about the recycling facilities in his/her area.
o 1. Strongly Disagree (1)
o 2. Disagree (2)
o 3. Unsure (3)
o 4. Agree (4)
o 5. Strongly Agree (5)
54
Q20 My individual actions would improve the quality of the environment if I were to...
convince someone to have a home 'energy audit' to find the heat leaks in her/his house or
apartment.
o 1. Strongly Disagree (1)
o 2. Disagree (2)
o 3. Unsure (3)
o 4. Agree (4)
o 5. Strongly Agree (5)
Q21 My individual actions would improve the quality of the environment if I were to...
convince someone to obtain a copy of the League of Conservation Voters' Environmental
Scorecard.
o 1. Strongly Disagree (1)
o 2. Disagree (2)
o 3. Unsure (3)
o 4. Agree (4)
o 5. Strongly Agree (5)

55
Q22 My individual actions would improve the quality of the environment if I were to...
convince someone to buy household cleaning and/or laundry products that don't harm the
environment.
o 1. Strongly Disagree (1)
o 2. Disagree (2)
o 3. Unsure (3)
o 4. Agree (4)
o 5. Strongly Agree (5)
Q23 My individual actions would improve the quality of the environment if I were to...
convince someone to buy fruits and vegetables loose rather than in plastic bags.
o 1. Strongly Disagree (1)
o 2. Disagree (2)
o 3. Unsure (3)
o 4. Agree (4)
o 5. Strongly Agree (5)

56
Q24 My individual actions would improve the quality of the environment if I were to...
convince someone to buy products packaged in containers that either can be reused or recycled
or are made of recycled materials.
o 1. Strongly Disagree (1)
o 2. Disagree (2)
o 3. Unsure (3)
o 4. Agree (4)
o 5. Strongly Agree (5)
Q25 My individual actions would improve the quality of the environment if I were to...
convince someone to report someone who violated a law or laws that protect our natural
resources (e.g., illegal fishing, hunting, or trapping or illegal tree cutting) to the proper
authorities.
o 1. Strongly Disagree (1)
o 2. Disagree (2)
o 3. Unsure (3)
o 4. Agree (4)
o 5. Strongly Agree (5)
57
Q26 My individual actions would improve the quality of the environment if I were to...
convince someone to reuse envelopes by putting a label over the old address.
o 1. Strongly Disagree (1)
o 2. Disagree (2)
o 3. Unsure (3)
o 4. Agree (4)
o 5. Strongly Agree (5)
Q27 My individual actions would improve the quality of the environment if I were to...
convince someone to set her/his household appliances, such as the refrigerator, dishwasher,
water heater, etc. to 'energy saver' levels.
o 1. Strongly Disagree (1)
o 2. Disagree (2)
o 3. Unsure (3)
o 4. Agree (4)
o 5. Strongly Agree (5)
58
Q28 My individual actions would improve the quality of the environment if I were to...
convince someone to keep her/his car tires properly inflated.
o 1. Strongly Disagree (1)
o 2. Disagree (2)
o 3. Unsure (3)
o 4. Agree (4)
o 5. Strongly Agree (5)
Q29 My individual actions would improve the quality of the environment if I were to...
convince someone to take old tires to a recycling center.
o 1. Strongly Disagree (1)
o 2. Disagree (2)
o 3. Unsure (3)
o 4. Agree (4)
o 5. Strongly Agree (5)
59
Q30 My individual actions would improve the quality of the environment if I were to...
convince someone to conserve water by not running the water while brushing her/his teeth or
shaving and/or installing a water saving device in the tank of her/his toilet(s).
o 1. Strongly Disagree (1)
o 2. Disagree (2)
o 3. Unsure (3)
o 4. Agree (4)
o 5. Strongly Agree (5)
Q31 My individual actions would improve the quality of the environment if I were to...
convince someone to avoid idling her/his car unnecessarily.
o 1. Strongly Disagree (1)
o 2. Disagree (2)
o 3. Unsure (3)
o 4. Agree (4)
o 5. Strongly Agree (5)
60
Q32 My individual actions would improve the quality of the environment if I were to...
convince someone to reduce the amount he/she drives her/his car by carpooling instead of
driving alone and/or driving only when necessary.
o 1. Strongly Disagree (1)
o 2. Disagree (2)
o 3. Unsure (3)
o 4. Agree (4)
o 5. Strongly Agree (5)
Q33 My individual actions would improve the quality of the environment if I were to...
convince someone to reduce the amount of her/his household trash by reusing or recycling items
to the fullest extent possible.
o 1. Strongly Disagree (1)
o 2. Disagree (2)
o 3. Unsure (3)
o 4. Agree (4)
o 5. Strongly Agree (5)
End of Block: Pretest

61
APPENDIX C. POSTTEST A
PosttestA
Start of Block: Introduction
Q1
This is the second of two surveys in which you have consented to participate. If you have any
questions or concerns about either or both of these surveys, you may contact the co-PI, Briana
Wilhelmi ([email protected]) or the PI, Dr. Pamela Emanuelson
([email protected]; 701-231-5887).
End of Block: Introduction
Start of Block: Course information
Q2 Please provide course information in the following questions to receive extra credit.
Q3 Course name (e.g., SOC 110)
________________________________________________________________
Q4 Instructor name
________________________________________________________________

62
End of Block: Course information
Start of Block: Instructions
Q5 The following section contains 10 pieces of descriptive text regarding environmentally
relevant data. Please read each piece of text, answer the question regarding the clarity of the
information on a one-to-five Likert scale, and write one sentence describing your impression of
the data where prompted to do so.
End of Block: Instructions
Start of Block: Global temperatures
Q6 Global surface temperatures have steadily risen since 1880. Since 1976, the global
temperature has always been warmer than the twentieth century average. 2016 was the warmest
year on record, 2015 the second warmest, and 2017 the third warmest. The coolest years on
record were 1908 and 1911, which were both -0.43 below the twentieth-century average.
Please rate the clarity of the above statement in the one-to-five scale below.
o 1= Very unclear (1)
o 2= Unclear (2)
o 3= Unsure (3)
o 4= Clear (4)
o 5= Very Clear (5)
Q7 Please write a one-sentence reaction to the data.
________________________________________________________________
End of Block: Global temperatures
Start of Block: Arctic sea ice

63
Q8 Arctic sea ice levels have been generally declining from 1979 to 2017. The highest level of
sea ice in that time frame is on record as 7,862,303 km. The lowest level of sea ice in that time
frame is on record as 3,404,543 km.
Please rate the clarity of the above statement in the one-to-five scale below.
o 1= Very unclear (1)
o 2= Unclear (2)
o 3= Unsure (3)
o 4= Clear (4)
o 5= Very clear (5)
Q9 Please write a one-sentence reaction to the data.
________________________________________________________________
End of Block: Arctic sea ice
Start of Block: Carbon dioxide
Q10 CO2 levels have continually risen from 2005 to 2018. The lowest amount of CO2 recorded
in that time frame was in 2005 at 378.93 parts per million. The highest amount was recorded in

64
2018 at 409.33 parts per million. Please rate the clarity of the above statement in the one-to-
five scale below.
o 1= Very unclear (1)
o 2= Unclear (2)
o 3= Unsure (3)
o 4= Clear (4)
o 5= Very clear (5)
Q11 Please write a one-sentence reaction to the data.
________________________________________________________________
End of Block: Carbon dioxide
Start of Block: Methane emissions
Q12 Methane emissions rose in the time period 1970-2012. The lowest amount of methane
emitted in that time from was 5,145,430 kt of CO2 equivalent in 1971. The highest amount of
methane emitted in that time frame was 8,014,067 kt of CO2 equivalent in 2012.
Please rate the clarity of the above statement in the one-to-five scale below.
o 1= Very unclear (1)
o 2= Unclear (2)
o 3= Unsure (3)
o 4= Clear (4)
o 5= Very clear (5)

65
Q13 Please write a one-sentence reaction to the data.
________________________________________________________________
End of Block: Methane emissions
Start of Block: Plastics
Q14 The amount of plastics generated in the Municipal Waste Stream (MWS) increased from
1960 to 2015. The lowest amount of plastics generated in the MWS in that time period was in
1960 at 390 thousand tons. The highest amount of plastics generated in that time period was in
2015 at 34,500 thousand tons.
Please rate the clarity of the above statement in the one-to-five scale below.
o 1= Very unclear (1)
o 2= Unclear (2)
o 3=Unsure (3)
o 4= Clear (4)
o 5=Very clear (5)
Q15 Please write a one-sentence reaction to the data.
________________________________________________________________
End of Block: Plastics
Start of Block: Aluminum
Q16 The amount of aluminum generated in the Municipal Waste Stream (MWS) has steadily
increased from 1960-2015. The lowest amount of aluminum generated in that time period in the
66
MWS was 340 thousand tons in 1960. The highest amount of aluminum generated in that time
period was 3,610 thousand tons in 2015.
Please rate the clarity of the above statement in the one-to-five scale below.
o 1= Very unclear (1)
o 2= Unclear (2)
o 3= Unsure (3)
o 4= Clear (4)
o 5= Very clear (5)
Q17 Please write a one-sentence reaction to the data.
________________________________________________________________
End of Block: Aluminum
Start of Block: Containers and packaging
Q18 The weight of containers and packaging generated in the Municipal Waste Stream (MWS)
steadily increased from 1960-2000, leveling out somewhat in the time period 2000-2015. The
lowest weight of containers and packaging generated in the time period 1960-2015 in the MWS
was 27,370 thousand tons in 1960. The highest weight of containers and packaging generated in
67
that time period was 77,920 thousand tons in 2015.
Please rate the clarity of the above data in the one-to-five scale below.
o 1= Very unclear (1)
o 2= Unclear (2)
o 3= Unsure (3)
o 4= Clear (4)
o 5= Very Clear (5)
Q19 Please write a one-sentence reaction to the data.
________________________________________________________________
End of Block: Containers and packaging
Start of Block: Rubber tires
Q20 The weight of rubber tires generated in the Municipal Waste Stream (MWS) steadily
increased from 1960-2015. The lowest weight of tires generated in that time period in the MWS
was 1,120 thousand tons in 1960. The highest weight of tires generated in that time period was
5,840 thousand tons in 2015.
Please rate the clarity of the above statement in the one-to-five scale below.
o 1= Very unclear (1)
o 2= Unclear (2)
o 3= Unsure (3)
o 4= Clear (4)
o 5= Very clear (5)

68
Q21 Please write a one-sentence reaction to the data,
________________________________________________________________
End of Block: Rubber tires
Start of Block: Forest area
Q22 The world forest area has steadily decreased from 1990-2015. The highest percent of world
forest area in that time period was 31.801 percent in 1990. The lowest percent of world forest
area in that time period was 30.825 percent in 2015.
Please rate the clarity of the above statement in the one-to-five scale below.
o 1= Very unclear (1)
o 2= Unclear (2)
o 3= Unsure (3)
o 4= Clear (4)
o 5= Very clear (5)
Q23 Please write a one-sentence reaction to the data.
________________________________________________________________
End of Block: Forest area
Start of Block: Freshwater resources
Q24 The renewable freshwater resources per capita has steadily decreased from 1962-2014. The
highest amount of renewable freshwater resources per capita in that time period was 13,401.910
cubic meters. The lowest amount of renewable freshwater resources per capita in that time period

69
was 5,920.508 cubic meters in 2014.
Please rate the clarity of the above statement in the one-to-five scale below.
o 1= Very unclear (1)
o 2= Unclear (2)
o 3= Unsure (3)
o 4= Clear (4)
o 5= Very clear (5)
Q25 Please write a one-sentence reaction to the data.
________________________________________________________________
End of Block: Freshwater resources
Start of Block: Post-test
Q26 The Environmental Control Index: Instructions
Please read the partial statement in bold letters below followed by the action described after each
number. Then, carefully fill the choice on the answer sheet which best indicates how strongly
you agree or disagree with the whole statement.
Please respond to every statement with only one choice.
Key:
1=Strongly Disagree; 2=Disagree; 3=Unsure; 4=Agree; 5=Strongly Agree
70
Q27 My individual actions would improve the quality of the environment if I were to...
learn about the recycling facilities in my area.
o 1. Strongly Disagree (1)
o 2. Disagree (2)
o 3. Unsure (3)
o 4. Agree (4)
o 5. Strongly Agree (5)
Q28 My individual actions would improve the quality of the environment if I were to...
attend a community meeting that involves concern over a local environmental issue.
o 1. Strongly Disagree (1)
o 2. Disagree (2)
o 3. Unsure (3)
o 4. Agree (4)
o 5. Strongly Agree (5)
71
Q29 My individual actions would improve the quality of the environment if I were to...
buy resource conservation devices, such as low-flow faucet aerators for my sinks and low-flow
shower heads.
o 1. Strongly Disagree (1)
o 2. Disagree (2)
o 3. Unsure (3)
o 4. Agree (4)
o 5. Strongly Agree (5)
Q30 My individual actions would improve the quality of the environment if I were to...
buy products packaged in containers that either can be reused or recycled or are made of recycled
materials.
o 1. Strongly Disagree (1)
o 2. Disagree (2)
o 3. Unsure (3)
o 4. Agree (4)
o 5. Strongly Agree (5)

72
Q31 My individual actions would improve the quality of the environment if I were to...
report someone who violates a law or laws that protect our natural resources (e.g., illegal fishing,
hunting, or trapping or illegal tree cutting) to the proper authorities.
o 1. Strongly Disagree (1)
o 2. Disagree (2)
o 3. Unsure (3)
o 4. Agree (4)
o 5. Strongly Agree (5)
Q32 My individual actions would improve the quality of the environment if I were to...
report someone who tampers with the anti-pollution devices on a car to the proper authorities.
o 1. Strongly Disagree (1)
o 2. Disagree (2)
o 3. Unsure (3)
o 4. Agree (4)
o 5. Strongly Agree (5)
73
Q33 My individual actions would improve the quality of the environment if I were to...
reduce the amount of my household trash by reusing or recycling items to the fullest extent
possible.
o 1. Strongly Disagree (1)
o 2. Disagree (2)
o 3. Unsure (3)
o 4. Agree (4)
o 5. Strongly Agree (5)
Q34 My individual actions would improve the quality of the environment if I were to...
set my home appliances, such as the refrigerator, dishwasher, water heater, etc. to 'energy saver'
levels.
o 1. Strongly Disagree (1)
o 2. Disagree (2)
o 3. Unsure (3)
o 4. Agree (4)
o 5. Strongly Agree (5)
74
Q35 My individual actions would improve the quality of the environment if I were to...
take my old tires to a recycling center.
o 1. Strongly Disagree (1)
o 2. Disagree (2)
o 3. Unsure (3)
o 4. Agree (4)
o 5. Strongly Agree (5)
Q36 My individual actions would improve the quality of the environment if I were to...
carpool instead of driving alone.
o 1. Strongly Disagree (1)
o 2. Disagree (2)
o 3. Unsure (3)
o 4. Agree (4)
o 5. Strongly Agree (5)
75
Q37 My individual actions would improve the quality of the environment if I were to...
open windows for ventilation rather than using a fan or air conditioner.
o 1. Strongly Disagree (1)
o 2. Disagree (2)
o 3. Unsure (3)
o 4. Agree (4)
o 5. Strongly Agree (5)
Q38 My individual actions would improve the quality of the environment if I were to...
convince someone to boycott a store that sells products that damage the environment.
o 1. Strongly Disagree (1)
o 2. Disagree (2)
o 3. Unsure (3)
o 4. Agree (4)
o 5. Strongly Agree (5)

76
Q39 My individual actions would improve the quality of the environment if I were to...
convince someone to sign a petition regarding an environmental issue.
o 1. Strongly Disagree (1)
o 2. Disagree (2)
o 3. Unsure (3)
o 4. Agree (4)
o 5. Strongly Agree (5)
Q40 My individual actions would improve the quality of the environment if I were to...
convince someone to learn about the recycling facilities in his/her area.
o 1. Strongly Disagree (1)
o 2. Disagree (2)
o 3. Unsure (3)
o 4. Agree (4)
o 5. Strongly Agree (5)
77
Q41 My individual actions would improve the quality of the environment if I were to...
convince someone to have a home 'energy audit' to find the heat leaks in her/his house or
apartment.
o 1. Strongly Disagree (1)
o 2. Disagree (2)
o 3. Unsure (3)
o 4. Agree (4)
o 5. Strongly Agree (5)
Q42 My individual actions would improve the quality of the environment if I were to...
convince someone to obtain a copy of the League of Conservation Voters' Environmental
Scorecard.
o 1. Strongly Disagree (1)
o 2. Disagree (2)
o 3. Unsure (3)
o 4. Agree (4)
o 5. Strongly Agree (5)
78
Q43 My individual actions would improve the quality of the environment if I were to...
convince someone to buy household cleaning and/or laundry products that don't harm the
environment.
o 1. Strongly Disagree (1)
o 2. Disagree (2)
o 3. Unsure (3)
o 4. Agree (4)
o 5. Strongly Agree (5)
Q44 My individual actions would improve the quality of the environment if I were to...
convince someone to buy fruits and vegetables loose rather than in plastic bags.
o 1. Strongly Disagree (1)
o 2. Disagree (2)
o 3. Unsure (3)
o 4. Agree (4)
o 5. Strongly Agree (5)
79
Q45 My individual actions would improve the quality of the environment if I were to...
convince someone to buy products packaged in containers that either can be reused or recycled
or are made of recycled materials.
o 1. Strongly Disagree (1)
o 2. Disagree (2)
o 3. Unsure (3)
o 4. Agree (4)
o 5. Strongly Agree (5)
Q46 My individual actions would improve the quality of the environment if I were to...
convince someone to report someone who violated a law or laws that protect our natural
resources (e.g., illegal fishing, hunting, or trapping or illegal tree cutting) to the proper
authorities.
o 1. Strongly Disagree (1)
o 2. Disagree (2)
o 3. Unsure (3)
o 4. Agree (4)
o 5. Strongly Agree (5)

80
Q47 My individual actions would improve the quality of the environment if I were to...
convince someone to reuse envelopes by putting a label over the old address.
o 1. Strongly Disagree (1)
o 2. Disagree (2)
o 3. Unsure (3)
o 4. Agree (4)
o 5. Strongly Agree (5)
Q48 My individual actions would improve the quality of the environment if I were to...
convince someone to set her/his household appliances, such as the refrigerator, dishwasher,
water heater, etc. to 'energy saver' levels.
o 1. Strongly Disagree (1)
o 2. Disagree (2)
o 3. Unsure (3)
o 4. Agree (4)
o 5. Strongly Agree (5)

81
Q49 My individual actions would improve the quality of the environment if I were to...
convince someone to keep her/his car tires properly inflated.
o 1. Strongly Disagree (1)
o 2. Disagree (2)
o 3. Unsure (3)
o 4. Agree (4)
o 5. Strongly Agree (5)
Q50 My individual actions would improve the quality of the environment if I were to...
convince someone to take old tires to a recycling center.
o 1. Strongly Disagree (1)
o 2. Disagree (2)
o 3. Unsure (3)
o 4. Agree (4)
o 5. Strongly Agree (5)

82
Q51 My individual actions would improve the quality of the environment if I were to...
convince someone to conserve water by not running the water while brushing her/his teeth or
shaving and/or installing a water saving device in the tank of her/his toilet(s).
o 1. Strongly Disagree (1)
o 2. Disagree (2)
o 3. Unsure (3)
o 4. Agree (4)
o 5. Strongly Agree (5)
Q52 My individual actions would improve the quality of the environment if I were to...
convince someone to avoid idling her/his car unnecessarily.
o 1. Strongly Disagree (1)
o 2. Disagree (2)
o 3. Unsure (3)
o 4. Agree (4)
o 5. Strongly Agree (5)

83
Q53 My individual actions would improve the quality of the environment if I were to...
convince someone to reduce the amount he/she drives her/his car by carpooling instead of
driving alone and/or driving only when necessary.
o 1. Strongly Disagree (1)
o 2. Disagree (2)
o 3. Unsure (3)
o 4. Agree (4)
o 5. Strongly Agree (5)
Q54 My individual actions would improve the quality of the environment if I were to...
convince someone to reduce the amount of her/his household trash by reusing or recycling items
to the fullest extent possible.
o 1. Strongly Disagree (1)
o 2. Disagree (2)
o 3. Unsure (3)
o 4. Agree (4)
o 5. Strongly Agree (5)
End of Block: Post-test
84
APPENDIX D. POSTTEST B
Posttest B
Start of Block: Introduction
Q1
This is the second of two surveys in which you have consented to participate. If you have any
questions or concerns about either or both of these surveys, you may contact the co-PI, Briana
Wilhelmi ([email protected]) or the PI, Dr. Pamela Emanuelson
([email protected]; 701-231-5887).
End of Block: Introduction
Start of Block: Course information
Q2 Please provide course information in the following questions to receive extra credit.
Q3 Course name (e.g., SOC 110)
________________________________________________________________
Q4 Instructor name
________________________________________________________________
End of Block: Course information
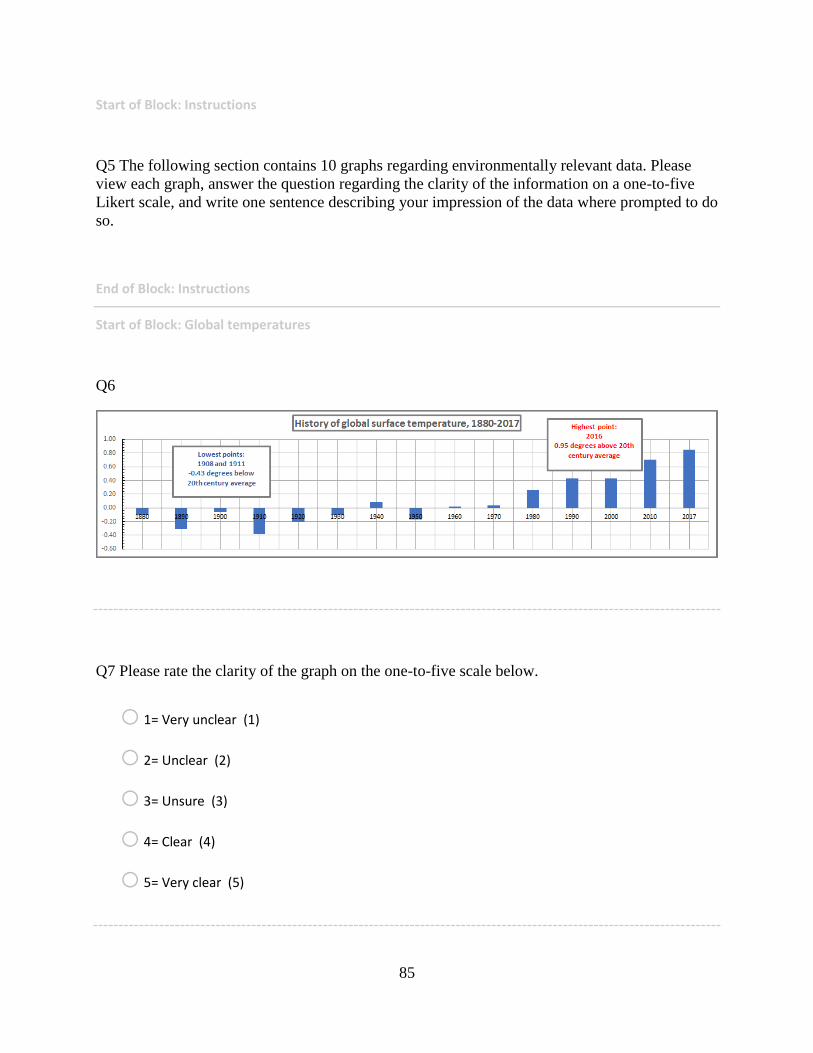
85
Start of Block: Instructions
Q5 The following section contains 10 graphs regarding environmentally relevant data. Please
view each graph, answer the question regarding the clarity of the information on a one-to-five
Likert scale, and write one sentence describing your impression of the data where prompted to do
so.
End of Block: Instructions
Start of Block: Global temperatures
Q6
Q7 Please rate the clarity of the graph on the one-to-five scale below.
o 1= Very unclear (1)
o 2= Unclear (2)
o 3= Unsure (3)
o 4= Clear (4)
o 5= Very clear (5)
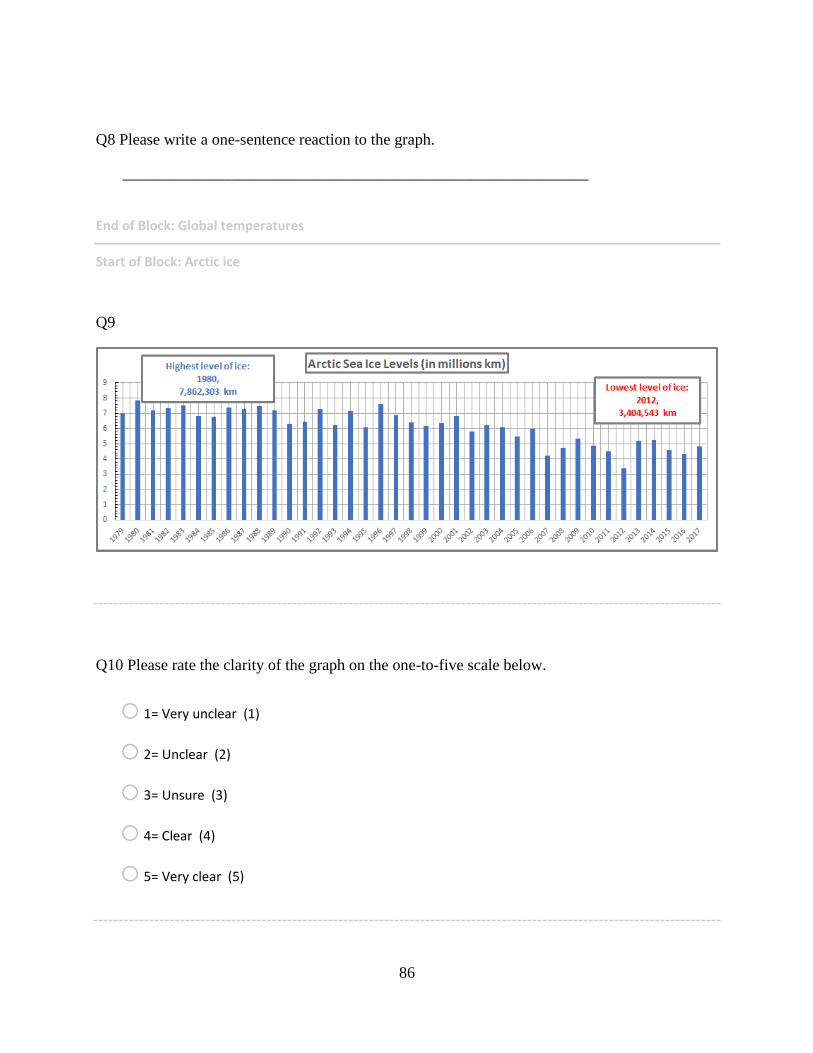
86
Q8 Please write a one-sentence reaction to the graph.
________________________________________________________________
End of Block: Global temperatures
Start of Block: Arctic ice
Q9
Q10 Please rate the clarity of the graph on the one-to-five scale below.
o 1= Very unclear (1)
o 2= Unclear (2)
o 3= Unsure (3)
o 4= Clear (4)
o 5= Very clear (5)
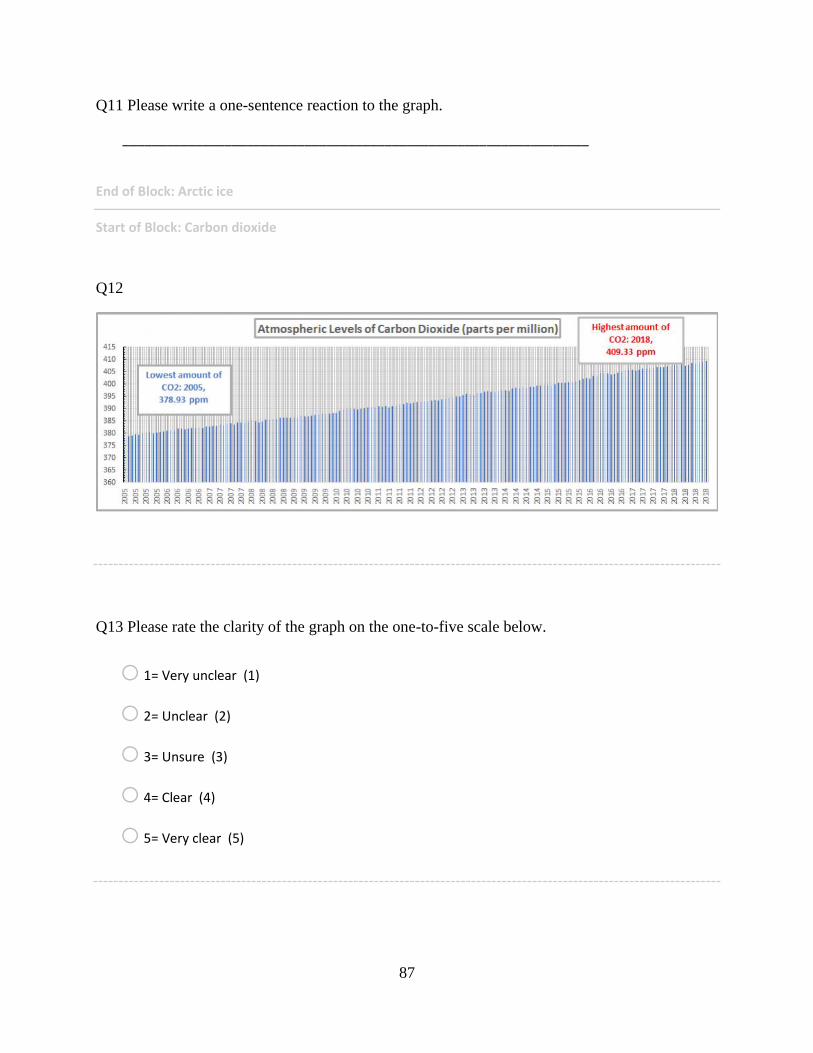
87
Q11 Please write a one-sentence reaction to the graph.
________________________________________________________________
End of Block: Arctic ice
Start of Block: Carbon dioxide
Q12
Q13 Please rate the clarity of the graph on the one-to-five scale below.
o 1= Very unclear (1)
o 2= Unclear (2)
o 3= Unsure (3)
o 4= Clear (4)
o 5= Very clear (5)
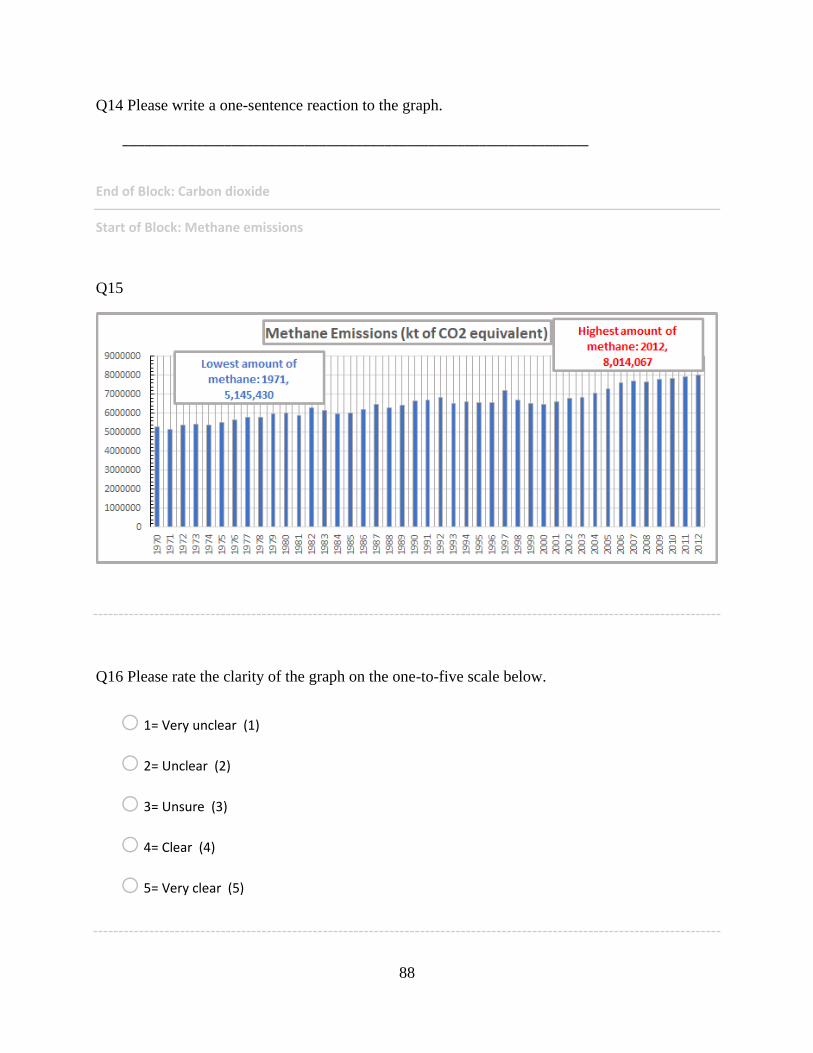
88
Q14 Please write a one-sentence reaction to the graph.
________________________________________________________________
End of Block: Carbon dioxide
Start of Block: Methane emissions
Q15
Q16 Please rate the clarity of the graph on the one-to-five scale below.
o 1= Very unclear (1)
o 2= Unclear (2)
o 3= Unsure (3)
o 4= Clear (4)
o 5= Very clear (5)
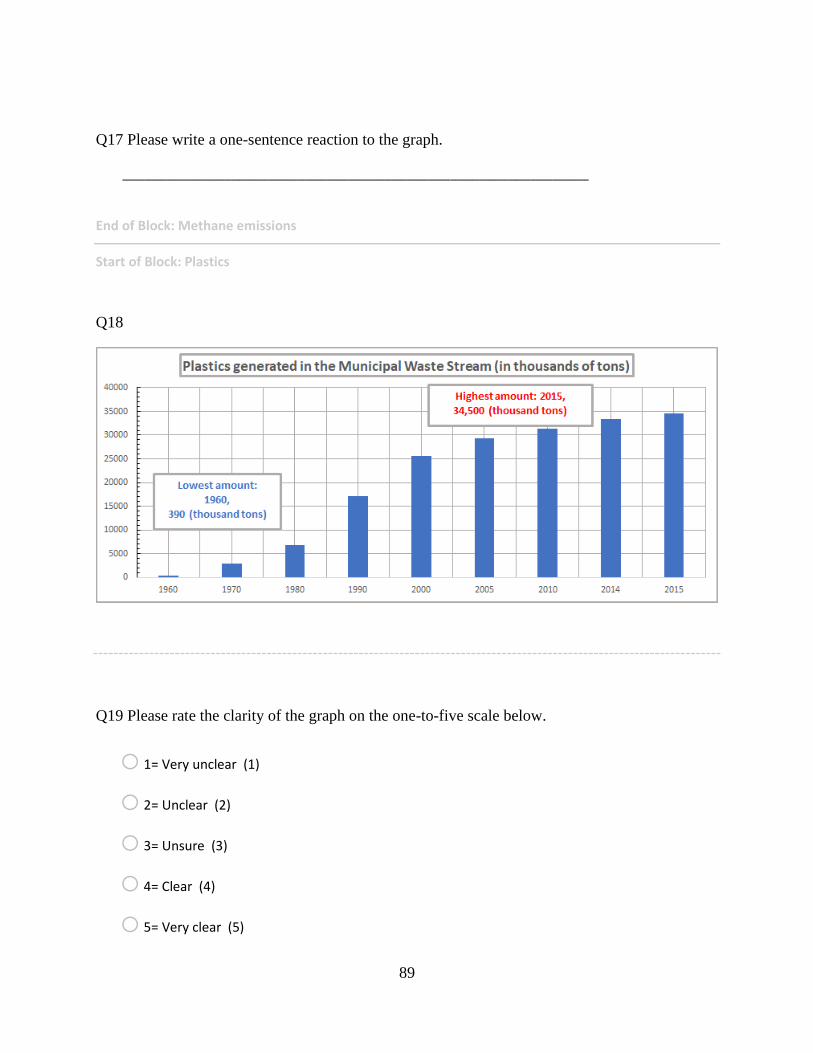
89
Q17 Please write a one-sentence reaction to the graph.
________________________________________________________________
End of Block: Methane emissions
Start of Block: Plastics
Q18
Q19 Please rate the clarity of the graph on the one-to-five scale below.
o 1= Very unclear (1)
o 2= Unclear (2)
o 3= Unsure (3)
o 4= Clear (4)
o 5= Very clear (5)
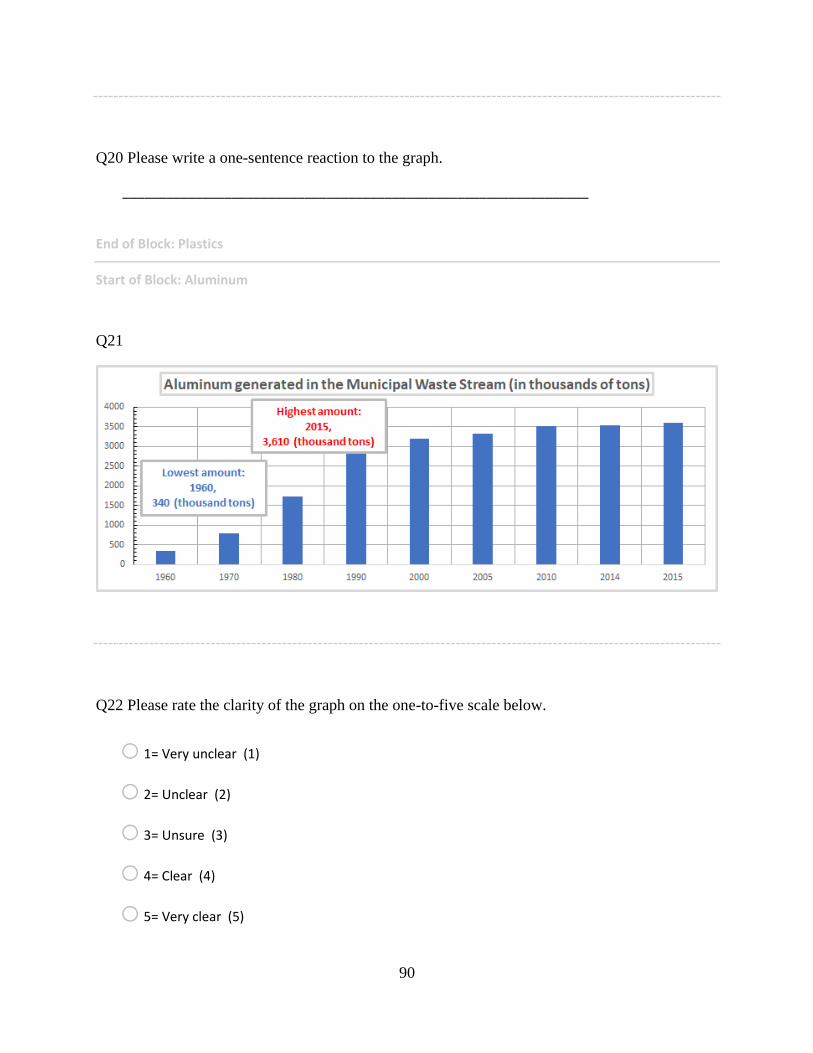
90
Q20 Please write a one-sentence reaction to the graph.
________________________________________________________________
End of Block: Plastics
Start of Block: Aluminum
Q21
Q22 Please rate the clarity of the graph on the one-to-five scale below.
o 1= Very unclear (1)
o 2= Unclear (2)
o 3= Unsure (3)
o 4= Clear (4)
o 5= Very clear (5)
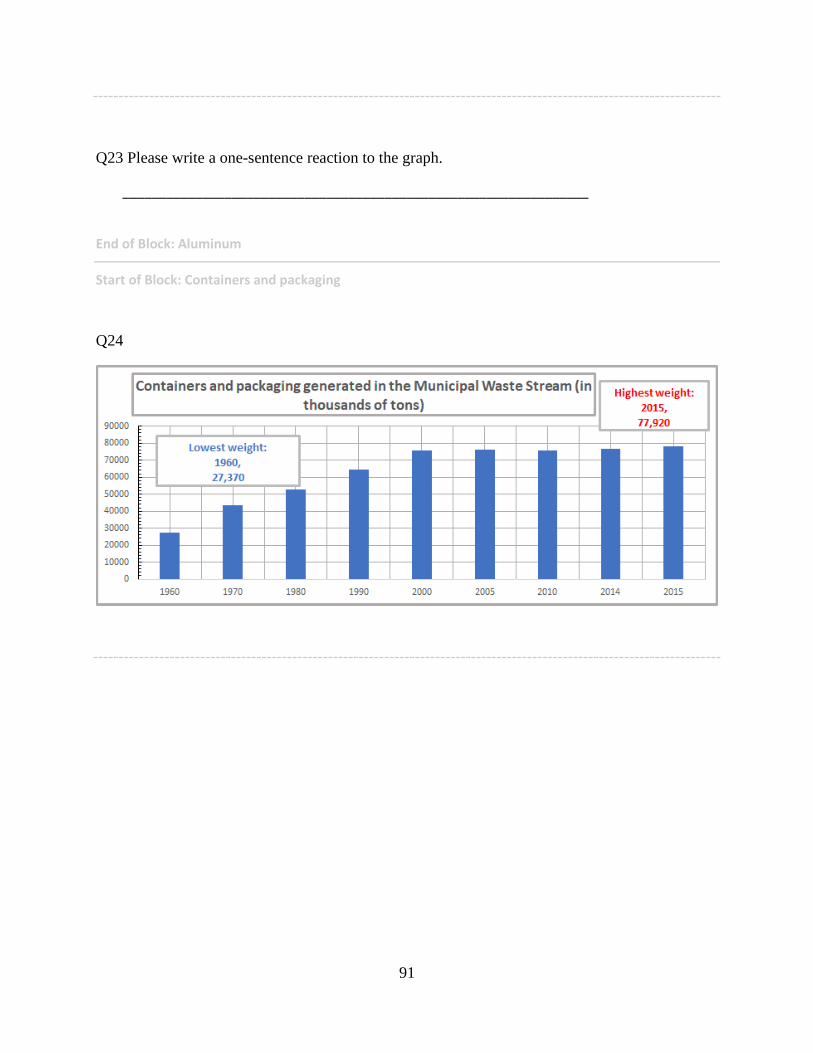
91
Q23 Please write a one-sentence reaction to the graph.
________________________________________________________________
End of Block: Aluminum
Start of Block: Containers and packaging
Q24
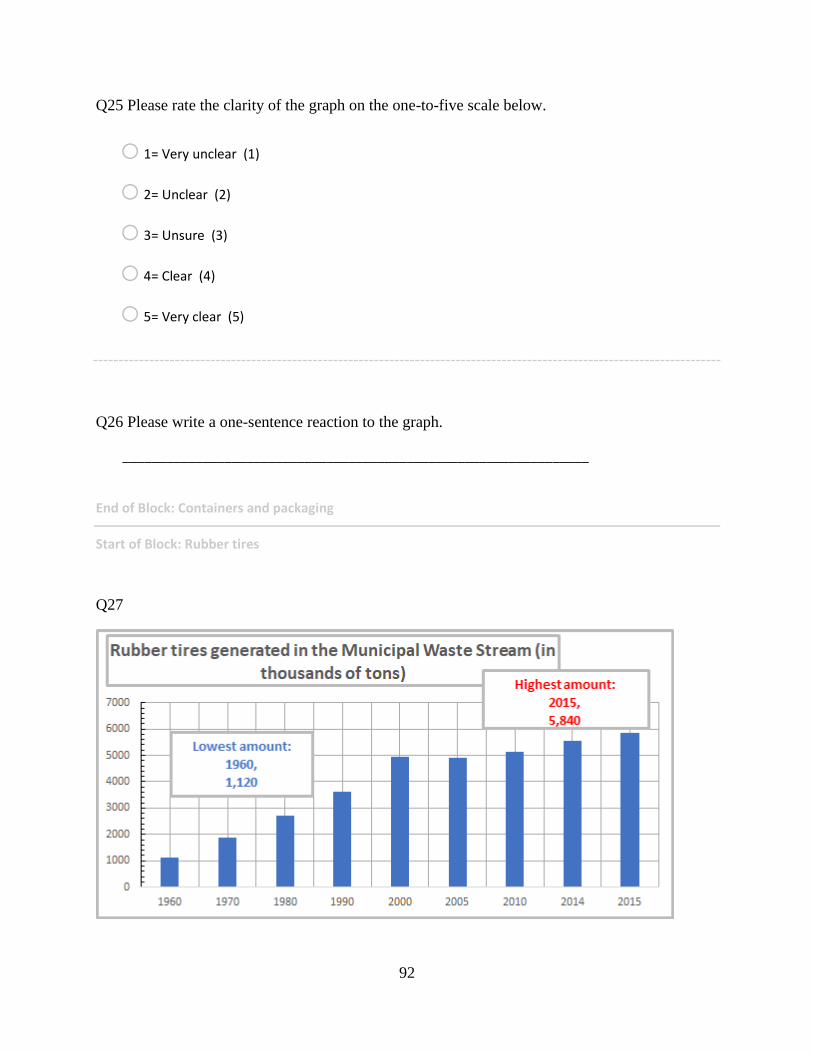
92
Q25 Please rate the clarity of the graph on the one-to-five scale below.
o 1= Very unclear (1)
o 2= Unclear (2)
o 3= Unsure (3)
o 4= Clear (4)
o 5= Very clear (5)
Q26 Please write a one-sentence reaction to the graph.
________________________________________________________________
End of Block: Containers and packaging
Start of Block: Rubber tires
Q27
93
Q28 Please rate the clarity of the graph on the one-to-five scale below.
o 1= Very unclear (1)
o 2= Unclear (2)
o 3= Unsure (3)
o 4= Clear (4)
o 5= Very clear (5)
Q29 Please write a one-sentence reaction to the graph.
________________________________________________________________
End of Block: Rubber tires
Start of Block: Forest
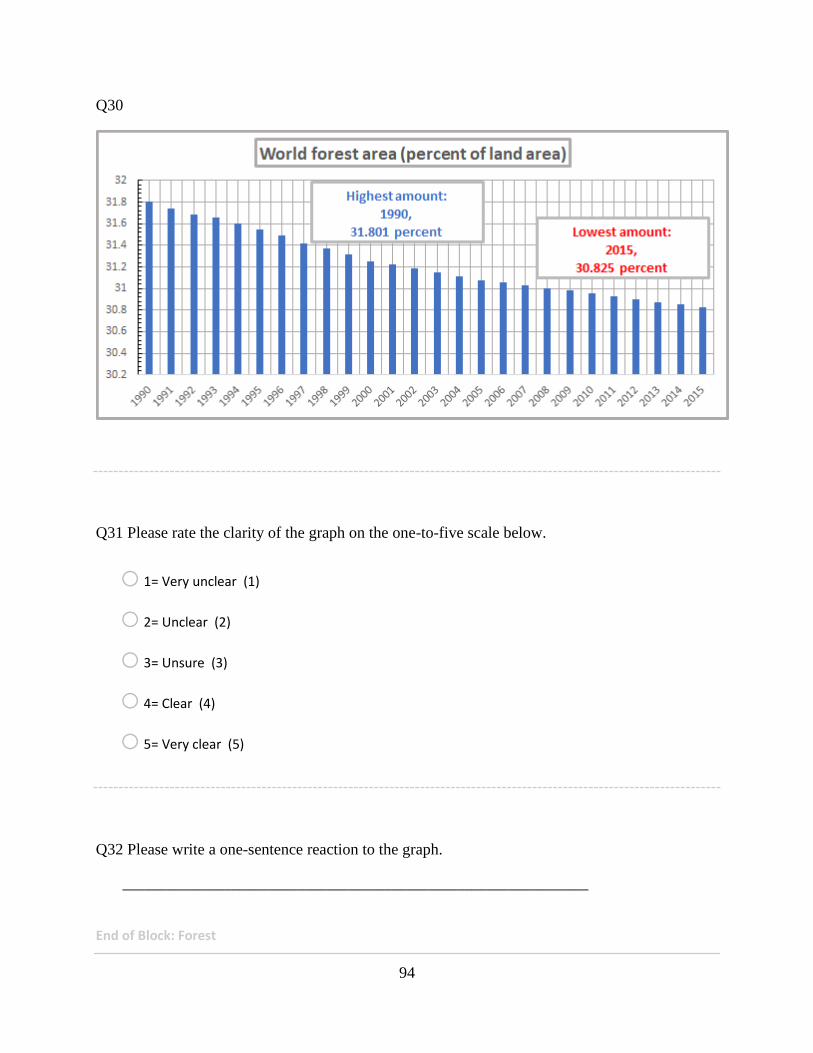
94
Q30
Q31 Please rate the clarity of the graph on the one-to-five scale below.
o 1= Very unclear (1)
o 2= Unclear (2)
o 3= Unsure (3)
o 4= Clear (4)
o 5= Very clear (5)
Q32 Please write a one-sentence reaction to the graph.
________________________________________________________________
End of Block: Forest
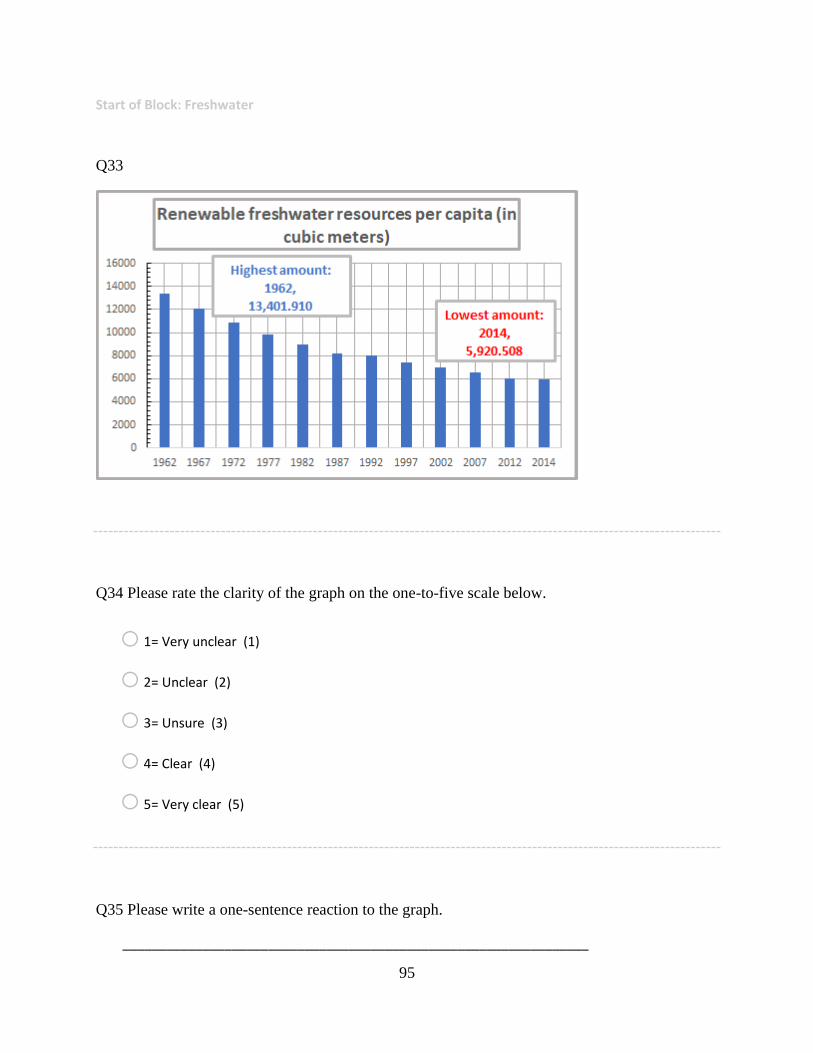
95
Start of Block: Freshwater
Q33
Q34 Please rate the clarity of the graph on the one-to-five scale below.
o 1= Very unclear (1)
o 2= Unclear (2)
o 3= Unsure (3)
o 4= Clear (4)
o 5= Very clear (5)
Q35 Please write a one-sentence reaction to the graph.
________________________________________________________________
96
End of Block: Freshwater
Start of Block: Pretest
Q36 The Environmental Control Index: Instructions
Please read the partial statement in bold letters below followed by the action described after each
number. Then, carefully fill the choice on the answer sheet which best indicates how strongly
you agree or disagree with the whole statement.
Please respond to every statement with only one choice.
Key:
1=Strongly Disagree; 2=Disagree; 3=Unsure; 4=Agree; 5=Strongly Agree
Q37 My individual actions would improve the quality of the environment if I were to...
learn about the recycling facilities in my area.
o 1. Strongly Disagree (1)
o 2. Disagree (2)
o 3. Unsure (3)
o 4. Agree (4)
o 5. Strongly Agree (5)
97
Q38 My individual actions would improve the quality of the environment if I were to...
attend a community meeting that involves concern over a local environmental issue.
o 1. Strongly Disagree (1)
o 2. Disagree (2)
o 3. Unsure (3)
o 4. Agree (4)
o 5. Strongly Agree (5)
Q39 My individual actions would improve the quality of the environment if I were to...
buy resource conservation devices, such as low-flow faucet aerators for my sinks and low-flow
shower heads.
o 1. Strongly Disagree (1)
o 2. Disagree (2)
o 3. Unsure (3)
o 4. Agree (4)
o 5. Strongly Agree (5)
98
Q40 My individual actions would improve the quality of the environment if I were to...
buy products packaged in containers that either can be reused or recycled or are made of recycled
materials.
o 1. Strongly Disagree (1)
o 2. Disagree (2)
o 3. Unsure (3)
o 4. Agree (4)
o 5. Strongly Agree (5)
Q41 My individual actions would improve the quality of the environment if I were to...
report someone who violates a law or laws that protect our natural resources (e.g., illegal fishing,
hunting, or trapping or illegal tree cutting) to the proper authorities.
o 1. Strongly Disagree (1)
o 2. Disagree (2)
o 3. Unsure (3)
o 4. Agree (4)
o 5. Strongly Agree (5)

99
Q42 My individual actions would improve the quality of the environment if I were to...
report someone who tampers with the anti-pollution devices on a car to the proper authorities.
o 1. Strongly Disagree (1)
o 2. Disagree (2)
o 3. Unsure (3)
o 4. Agree (4)
o 5. Strongly Agree (5)
Q43 My individual actions would improve the quality of the environment if I were to...
reduce the amount of my household trash by reusing or recycling items to the fullest extent
possible.
o 1. Strongly Disagree (1)
o 2. Disagree (2)
o 3. Unsure (3)
o 4. Agree (4)
o 5. Strongly Agree (5)
100
Q44 My individual actions would improve the quality of the environment if I were to...
set my home appliances, such as the refrigerator, dishwasher, water heater, etc. to 'energy saver'
levels.
o 1. Strongly Disagree (1)
o 2. Disagree (2)
o 3. Unsure (3)
o 4. Agree (4)
o 5. Strongly Agree (5)
Q45 My individual actions would improve the quality of the environment if I were to...
take my old tires to a recycling center.
o 1. Strongly Disagree (1)
o 2. Disagree (2)
o 3. Unsure (3)
o 4. Agree (4)
o 5. Strongly Agree (5)
101
Q46 My individual actions would improve the quality of the environment if I were to...
carpool instead of driving alone.
o 1. Strongly Disagree (1)
o 2. Disagree (2)
o 3. Unsure (3)
o 4. Agree (4)
o 5. Strongly Agree (5)
Q47 My individual actions would improve the quality of the environment if I were to...
open windows for ventilation rather than using a fan or air conditioner.
o 1. Strongly Disagree (1)
o 2. Disagree (2)
o 3. Unsure (3)
o 4. Agree (4)
o 5. Strongly Agree (5)
102
Q48 My individual actions would improve the quality of the environment if I were to...
convince someone to boycott a store that sells products that damage the environment.
o 1. Strongly Disagree (1)
o 2. Disagree (2)
o 3. Unsure (3)
o 4. Agree (4)
o 5. Strongly Agree (5)
Q49 My individual actions would improve the quality of the environment if I were to...
convince someone to sign a petition regarding an environmental issue.
o 1. Strongly Disagree (1)
o 2. Disagree (2)
o 3. Unsure (3)
o 4. Agree (4)
o 5. Strongly Agree (5)

103
Q50 My individual actions would improve the quality of the environment if I were to...
convince someone to learn about the recycling facilities in his/her area.
o 1. Strongly Disagree (1)
o 2. Disagree (2)
o 3. Unsure (3)
o 4. Agree (4)
o 5. Strongly Agree (5)
Q51 My individual actions would improve the quality of the environment if I were to...
convince someone to have a home 'energy audit' to find the heat leaks in her/his house or
apartment.
o 1. Strongly Disagree (1)
o 2. Disagree (2)
o 3. Unsure (3)
o 4. Agree (4)
o 5. Strongly Agree (5)
104
Q52 My individual actions would improve the quality of the environment if I were to...
convince someone to obtain a copy of the League of Conservation Voters' Environmental
Scorecard.
o 1. Strongly Disagree (1)
o 2. Disagree (2)
o 3. Unsure (3)
o 4. Agree (4)
o 5. Strongly Agree (5)
Q53 My individual actions would improve the quality of the environment if I were to...
convince someone to buy household cleaning and/or laundry products that don't harm the
environment.
o 1. Strongly Disagree (1)
o 2. Disagree (2)
o 3. Unsure (3)
o 4. Agree (4)
o 5. Strongly Agree (5)
105
Q54 My individual actions would improve the quality of the environment if I were to...
convince someone to buy fruits and vegetables loose rather than in plastic bags.
o 1. Strongly Disagree (1)
o 2. Disagree (2)
o 3. Unsure (3)
o 4. Agree (4)
o 5. Strongly Agree (5)
Q55 My individual actions would improve the quality of the environment if I were to...
convince someone to buy products packaged in containers that either can be reused or recycled
or are made of recycled materials.
o 1. Strongly Disagree (1)
o 2. Disagree (2)
o 3. Unsure (3)
o 4. Agree (4)
o 5. Strongly Agree (5)
Q56 My individual actions would improve the quality of the environment if I were to...
convince someone to report someone who violated a law or laws that protect our natural

106
resources (e.g., illegal fishing, hunting, or trapping or illegal tree cutting) to the proper
authorities.
o 1. Strongly Disagree (1)
o 2. Disagree (2)
o 3. Unsure (3)
o 4. Agree (4)
o 5. Strongly Agree (5)
Q57 My individual actions would improve the quality of the environment if I were to...
convince someone to reuse envelopes by putting a label over the old address.
o 1. Strongly Disagree (1)
o 2. Disagree (2)
o 3. Unsure (3)
o 4. Agree (4)
o 5. Strongly Agree (5)
107
Q58 My individual actions would improve the quality of the environment if I were to...
convince someone to set her/his household appliances, such as the refrigerator, dishwasher,
water heater, etc. to 'energy saver' levels.
o 1. Strongly Disagree (1)
o 2. Disagree (2)
o 3. Unsure (3)
o 4. Agree (4)
o 5. Strongly Agree (5)
Q59 My individual actions would improve the quality of the environment if I were to...
convince someone to keep her/his car tires properly inflated.
o 1. Strongly Disagree (1)
o 2. Disagree (2)
o 3. Unsure (3)
o 4. Agree (4)
o 5. Strongly Agree (5)
108
Q60 My individual actions would improve the quality of the environment if I were to...
convince someone to take old tires to a recycling center.
o 1. Strongly Disagree (1)
o 2. Disagree (2)
o 3. Unsure (3)
o 4. Agree (4)
o 5. Strongly Agree (5)
Q61 My individual actions would improve the quality of the environment if I were to...
convince someone to conserve water by not running the water while brushing her/his teeth or
shaving and/or installing a water saving device in the tank of her/his toilet(s).
o 1. Strongly Disagree (1)
o 2. Disagree (2)
o 3. Unsure (3)
o 4. Agree (4)
o 5. Strongly Agree (5)

109
Q62 My individual actions would improve the quality of the environment if I were to...
convince someone to avoid idling her/his car unnecessarily.
o 1. Strongly Disagree (1)
o 2. Disagree (2)
o 3. Unsure (3)
o 4. Agree (4)
o 5. Strongly Agree (5)
Q63 My individual actions would improve the quality of the environment if I were to...
convince someone to reduce the amount he/she drives her/his car by carpooling instead of
driving alone and/or driving only when necessary.
o 1. Strongly Disagree (1)
o 2. Disagree (2)
o 3. Unsure (3)
o 4. Agree (4)
o 5. Strongly Agree (5)
110
Q64 My individual actions would improve the quality of the environment if I were to...
convince someone to reduce the amount of her/his household trash by reusing or recycling items
to the fullest extent possible.
o 1. Strongly Disagree (1)
o 2. Disagree (2)
o 3. Unsure (3)
o 4. Agree (4)
o 5. Strongly Agree (5)
End of Block: Pretest
111
APPENDIX E. POSTTEST C
Posttest C
Start of Block: Introduction
Q1
This is the second of two surveys in which you have consented to participate. If you have any
questions or concerns about either or both of these surveys, you may contact the co-PI, Briana
Wilhelmi ([email protected]) or the PI, Dr. Pamela Emanuelson
([email protected]; 701-231-5887).
End of Block: Introduction
Start of Block: Course information
Q2 Please provide course information in the following questions to receive extra credit.
Q3 Course name (e.g., SOC 110)
________________________________________________________________
Q4 Instructor name
________________________________________________________________
End of Block: Course information
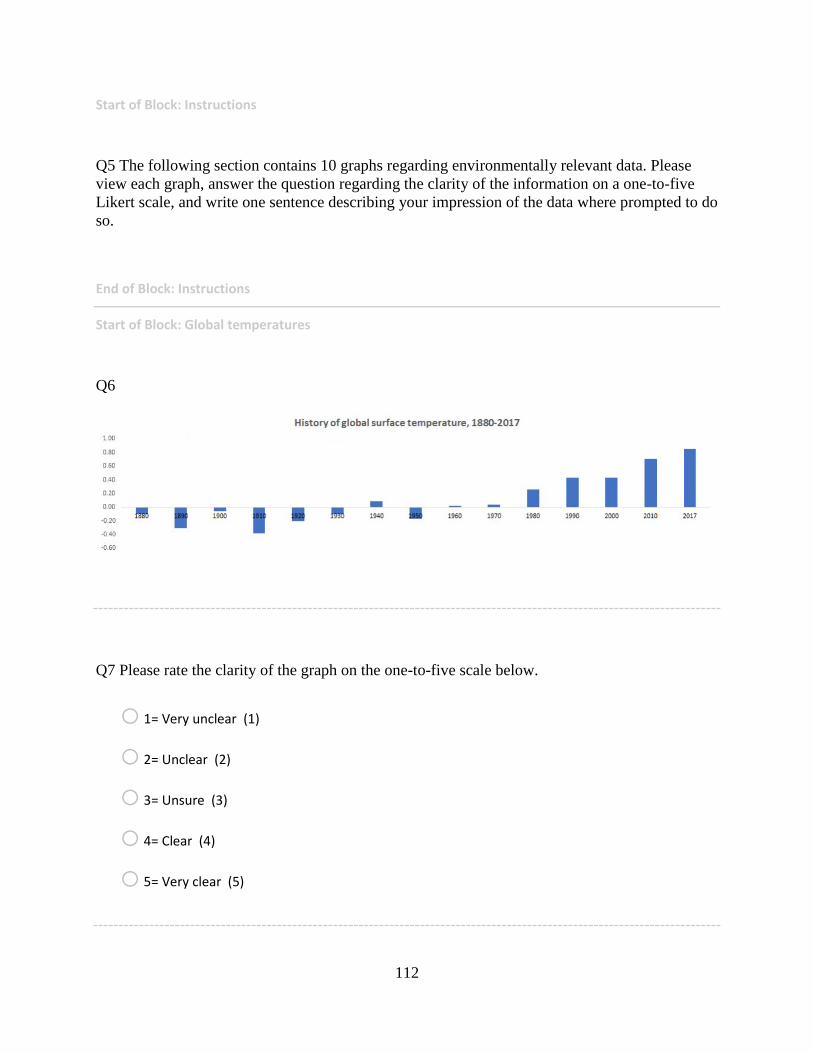
112
Start of Block: Instructions
Q5 The following section contains 10 graphs regarding environmentally relevant data. Please
view each graph, answer the question regarding the clarity of the information on a one-to-five
Likert scale, and write one sentence describing your impression of the data where prompted to do
so.
End of Block: Instructions
Start of Block: Global temperatures
Q6
Q7 Please rate the clarity of the graph on the one-to-five scale below.
o 1= Very unclear (1)
o 2= Unclear (2)
o 3= Unsure (3)
o 4= Clear (4)
o 5= Very clear (5)
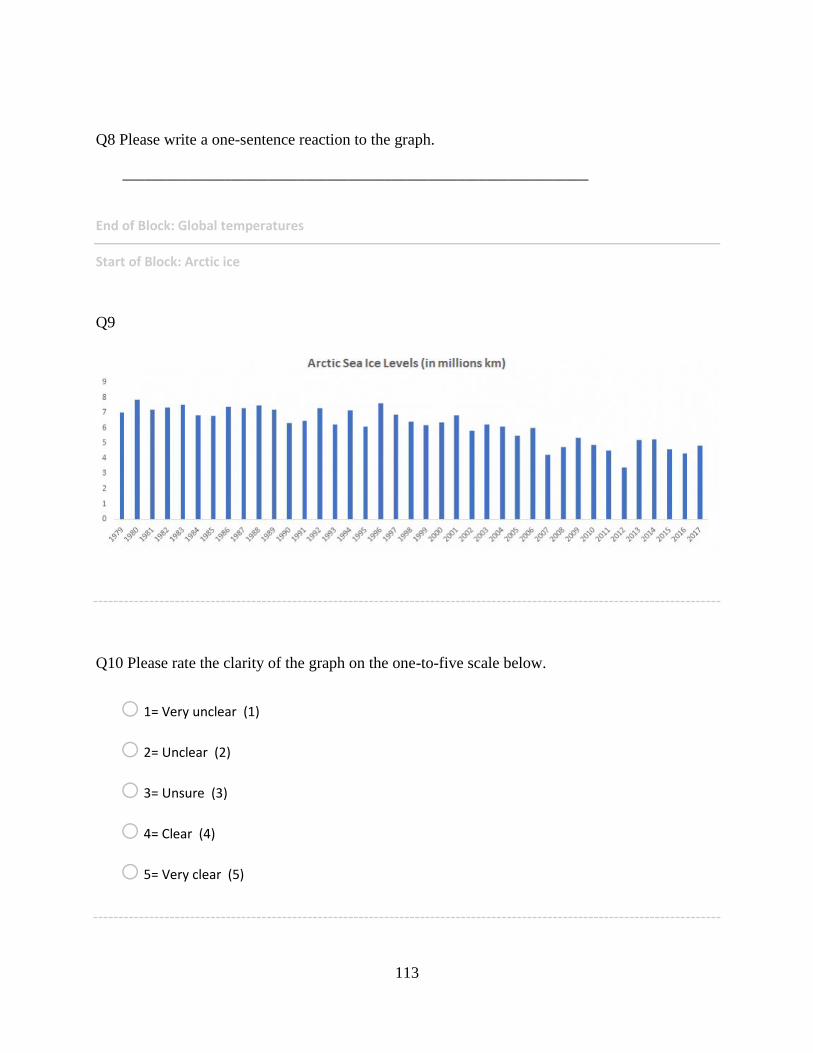
113
Q8 Please write a one-sentence reaction to the graph.
________________________________________________________________
End of Block: Global temperatures
Start of Block: Arctic ice
Q9
Q10 Please rate the clarity of the graph on the one-to-five scale below.
o 1= Very unclear (1)
o 2= Unclear (2)
o 3= Unsure (3)
o 4= Clear (4)
o 5= Very clear (5)
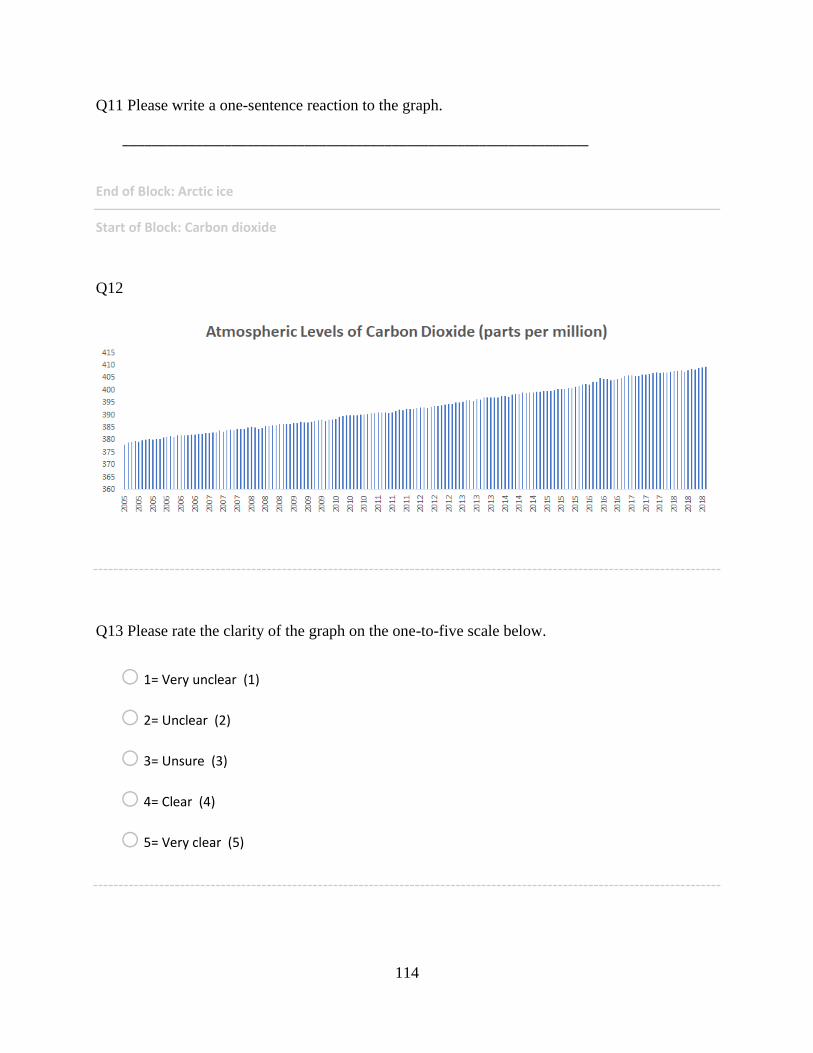
114
Q11 Please write a one-sentence reaction to the graph.
________________________________________________________________
End of Block: Arctic ice
Start of Block: Carbon dioxide
Q12
Q13 Please rate the clarity of the graph on the one-to-five scale below.
o 1= Very unclear (1)
o 2= Unclear (2)
o 3= Unsure (3)
o 4= Clear (4)
o 5= Very clear (5)
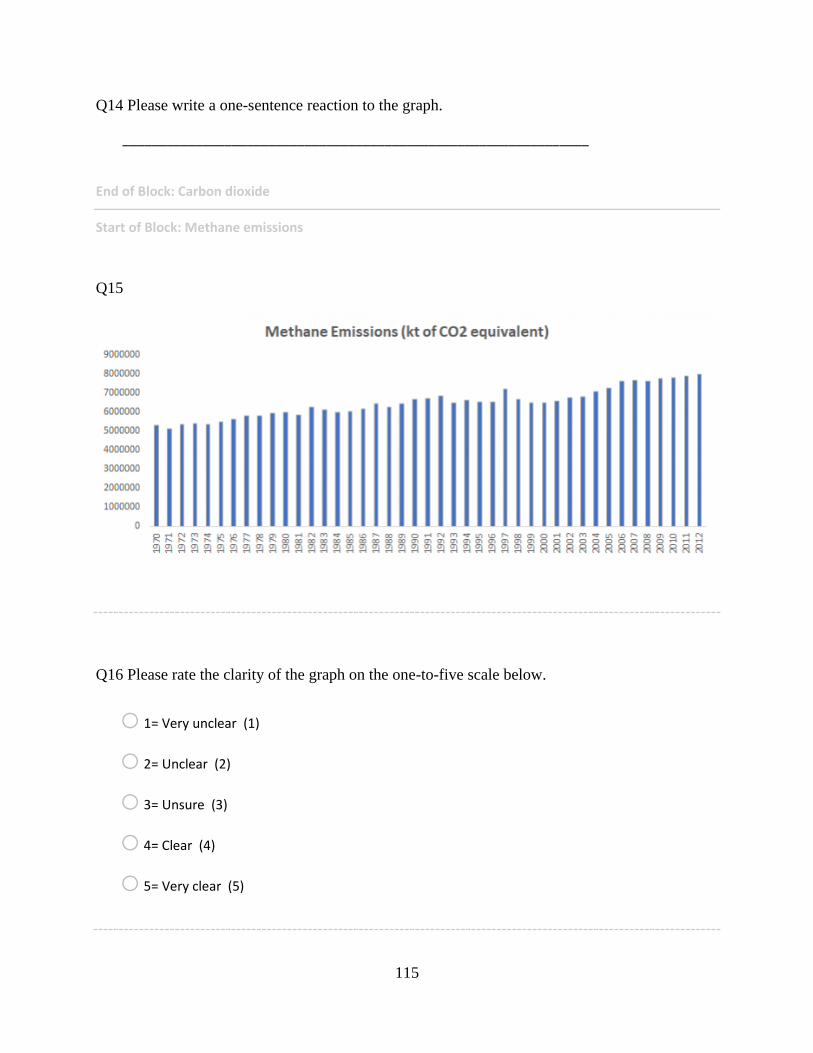
115
Q14 Please write a one-sentence reaction to the graph.
________________________________________________________________
End of Block: Carbon dioxide
Start of Block: Methane emissions
Q15
Q16 Please rate the clarity of the graph on the one-to-five scale below.
o 1= Very unclear (1)
o 2= Unclear (2)
o 3= Unsure (3)
o 4= Clear (4)
o 5= Very clear (5)
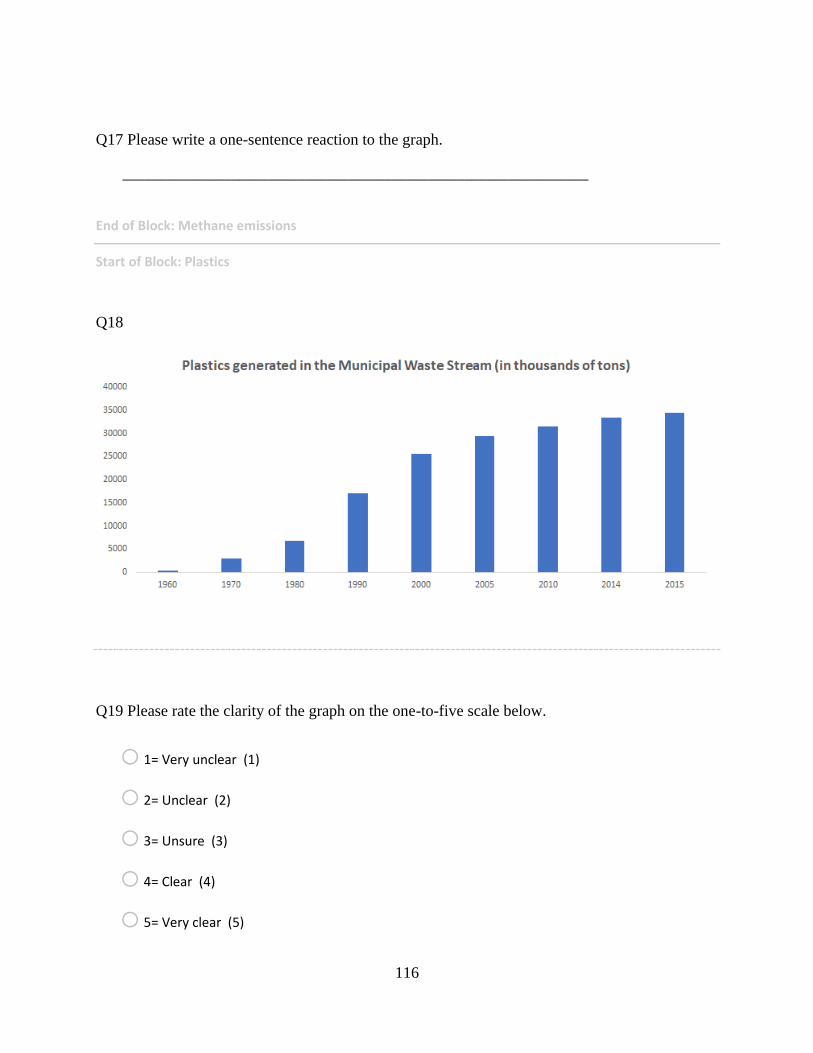
116
Q17 Please write a one-sentence reaction to the graph.
________________________________________________________________
End of Block: Methane emissions
Start of Block: Plastics
Q18
Q19 Please rate the clarity of the graph on the one-to-five scale below.
o 1= Very unclear (1)
o 2= Unclear (2)
o 3= Unsure (3)
o 4= Clear (4)
o 5= Very clear (5)
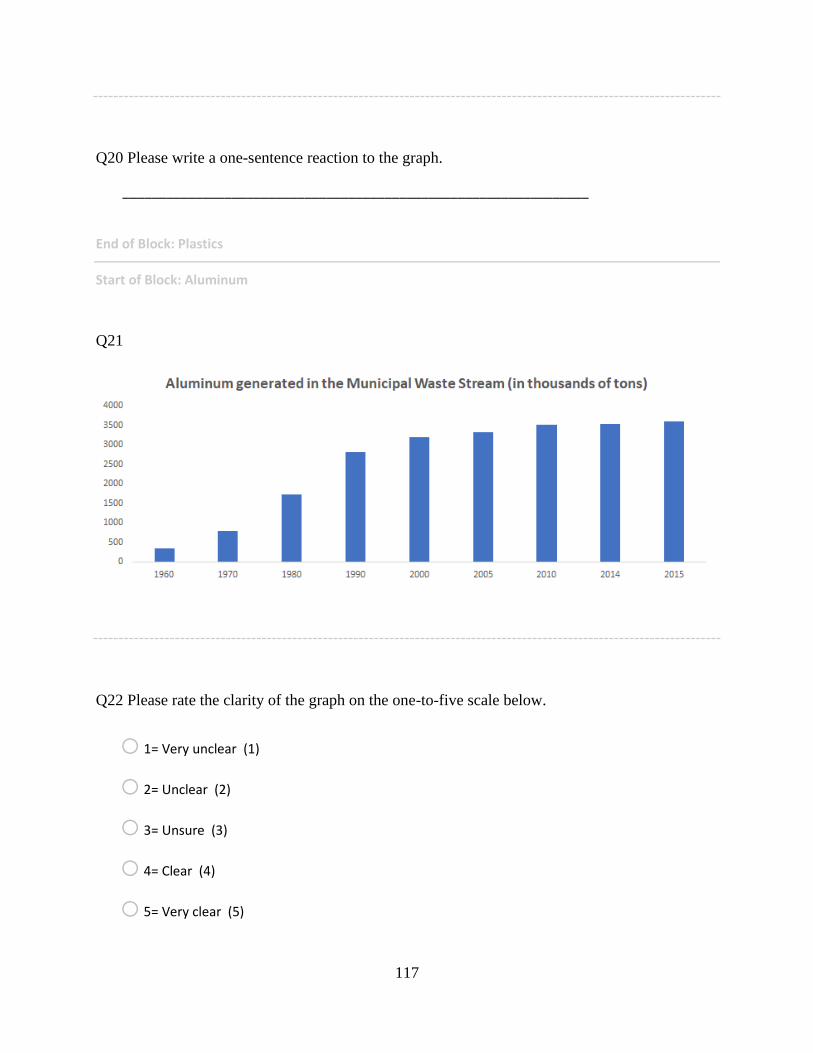
117
Q20 Please write a one-sentence reaction to the graph.
________________________________________________________________
End of Block: Plastics
Start of Block: Aluminum
Q21
Q22 Please rate the clarity of the graph on the one-to-five scale below.
o 1= Very unclear (1)
o 2= Unclear (2)
o 3= Unsure (3)
o 4= Clear (4)
o 5= Very clear (5)

118
Q23 Please write a one-sentence reaction to the graph.
________________________________________________________________
End of Block: Aluminum
Start of Block: Containers and packaging
Q24
Q25 Please rate the clarity of the graph on the one-to-five scale below.
o 1= Very unclear (1)
o 2= Unclear (2)
o 3= Unsure (3)
o 4= Clear (4)
o 5= Very clear (5)
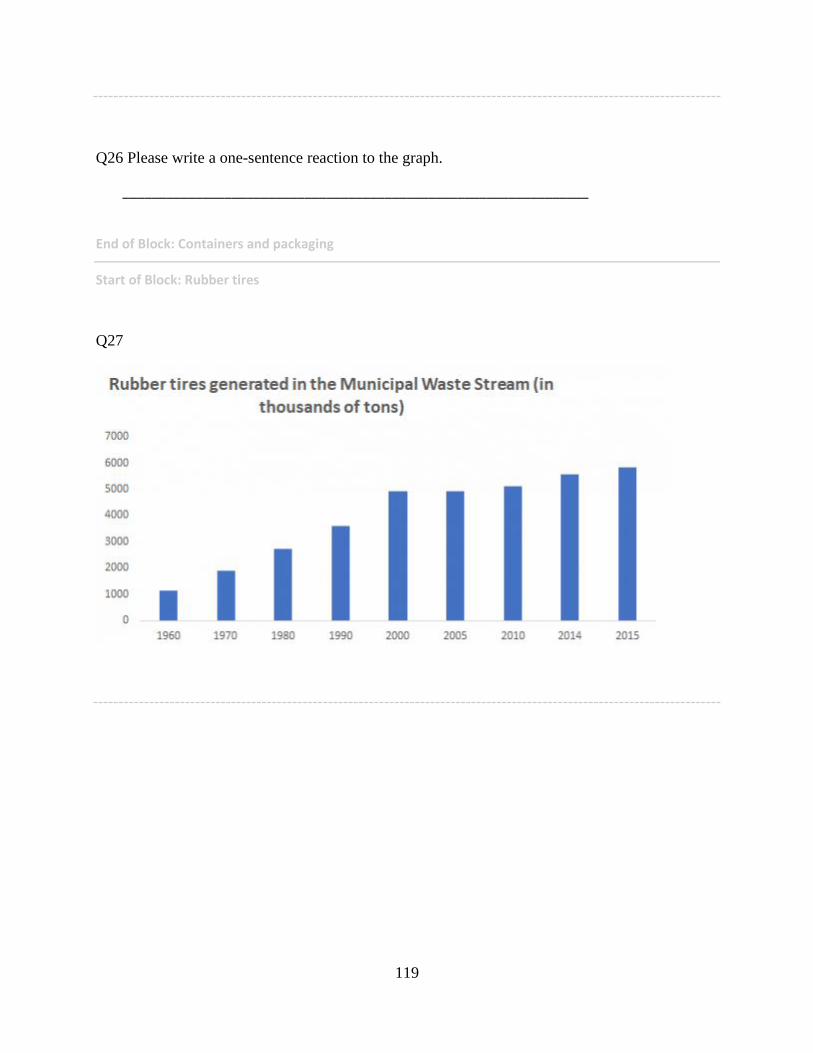
119
Q26 Please write a one-sentence reaction to the graph.
________________________________________________________________
End of Block: Containers and packaging
Start of Block: Rubber tires
Q27
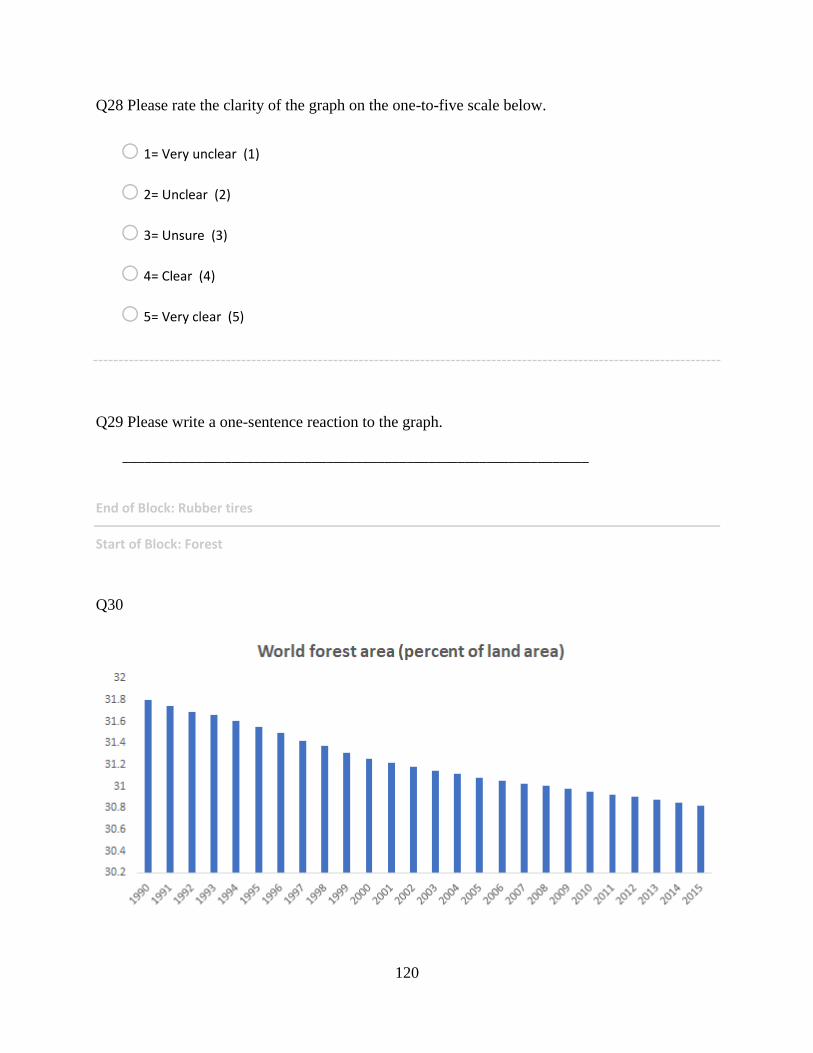
120
Q28 Please rate the clarity of the graph on the one-to-five scale below.
o 1= Very unclear (1)
o 2= Unclear (2)
o 3= Unsure (3)
o 4= Clear (4)
o 5= Very clear (5)
Q29 Please write a one-sentence reaction to the graph.
________________________________________________________________
End of Block: Rubber tires
Start of Block: Forest
Q30

121
Q31 Please rate the clarity of the graph on the one-to-five scale below.
o 1= Very unclear (1)
o 2= Unclear (2)
o 3= Unsure (3)
o 4= Clear (4)
o 5= Very clear (5)
Q32 Please write a one-sentence reaction to the graph.
________________________________________________________________
End of Block: Forest
Start of Block: Freshwater

122
Q33
Q34 Please rate the clarity of the graph on the one-to-five scale below.
o 1= Very unclear (1)
o 2= Unclear (2)
o 3= Unsure (3)
o 4= Clear (4)
o 5= Very clear (5)
Q35 Please write a one-sentence reaction to the graph.
________________________________________________________________
End of Block: Freshwater
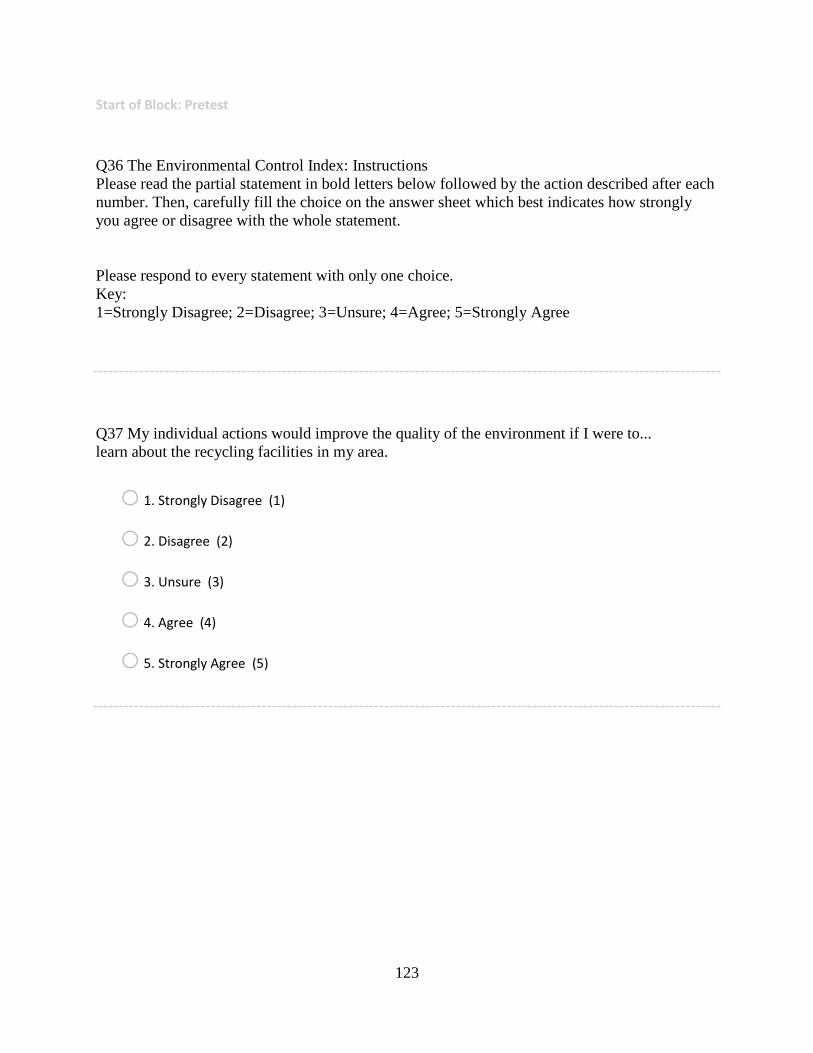
123
Start of Block: Pretest
Q36 The Environmental Control Index: Instructions
Please read the partial statement in bold letters below followed by the action described after each
number. Then, carefully fill the choice on the answer sheet which best indicates how strongly
you agree or disagree with the whole statement.
Please respond to every statement with only one choice.
Key:
1=Strongly Disagree; 2=Disagree; 3=Unsure; 4=Agree; 5=Strongly Agree
Q37 My individual actions would improve the quality of the environment if I were to...
learn about the recycling facilities in my area.
o 1. Strongly Disagree (1)
o 2. Disagree (2)
o 3. Unsure (3)
o 4. Agree (4)
o 5. Strongly Agree (5)

124
Q38 My individual actions would improve the quality of the environment if I were to...
attend a community meeting that involves concern over a local environmental issue.
o 1. Strongly Disagree (1)
o 2. Disagree (2)
o 3. Unsure (3)
o 4. Agree (4)
o 5. Strongly Agree (5)
Q39 My individual actions would improve the quality of the environment if I were to...
buy resource conservation devices, such as low-flow faucet aerators for my sinks and low-flow
shower heads.
o 1. Strongly Disagree (1)
o 2. Disagree (2)
o 3. Unsure (3)
o 4. Agree (4)
o 5. Strongly Agree (5)

125
Q40 My individual actions would improve the quality of the environment if I were to...
buy products packaged in containers that either can be reused or recycled or are made of recycled
materials.
o 1. Strongly Disagree (1)
o 2. Disagree (2)
o 3. Unsure (3)
o 4. Agree (4)
o 5. Strongly Agree (5)
Q41 My individual actions would improve the quality of the environment if I were to...
report someone who violates a law or laws that protect our natural resources (e.g., illegal fishing,
hunting, or trapping or illegal tree cutting) to the proper authorities.
o 1. Strongly Disagree (1)
o 2. Disagree (2)
o 3. Unsure (3)
o 4. Agree (4)
o 5. Strongly Agree (5)
126
Q42 My individual actions would improve the quality of the environment if I were to...
report someone who tampers with the anti-pollution devices on a car to the proper authorities.
o 1. Strongly Disagree (1)
o 2. Disagree (2)
o 3. Unsure (3)
o 4. Agree (4)
o 5. Strongly Agree (5)
Q43 My individual actions would improve the quality of the environment if I were to...
reduce the amount of my household trash by reusing or recycling items to the fullest extent
possible.
o 1. Strongly Disagree (1)
o 2. Disagree (2)
o 3. Unsure (3)
o 4. Agree (4)
o 5. Strongly Agree (5)

127
Q44 My individual actions would improve the quality of the environment if I were to...
set my home appliances, such as the refrigerator, dishwasher, water heater, etc. to 'energy saver'
levels.
o 1. Strongly Disagree (1)
o 2. Disagree (2)
o 3. Unsure (3)
o 4. Agree (4)
o 5. Strongly Agree (5)
Q45 My individual actions would improve the quality of the environment if I were to...
take my old tires to a recycling center.
o 1. Strongly Disagree (1)
o 2. Disagree (2)
o 3. Unsure (3)
o 4. Agree (4)
o 5. Strongly Agree (5)

128
Q46 My individual actions would improve the quality of the environment if I were to...
carpool instead of driving alone.
o 1. Strongly Disagree (1)
o 2. Disagree (2)
o 3. Unsure (3)
o 4. Agree (4)
o 5. Strongly Agree (5)
Q47 My individual actions would improve the quality of the environment if I were to...
open windows for ventilation rather than using a fan or air conditioner.
o 1. Strongly Disagree (1)
o 2. Disagree (2)
o 3. Unsure (3)
o 4. Agree (4)
o 5. Strongly Agree (5)

129
Q48 My individual actions would improve the quality of the environment if I were to...
convince someone to boycott a store that sells products that damage the environment.
o 1. Strongly Disagree (1)
o 2. Disagree (2)
o 3. Unsure (3)
o 4. Agree (4)
o 5. Strongly Agree (5)
Q49 My individual actions would improve the quality of the environment if I were to...
convince someone to sign a petition regarding an environmental issue.
o 1. Strongly Disagree (1)
o 2. Disagree (2)
o 3. Unsure (3)
o 4. Agree (4)
o 5. Strongly Agree (5)
130
Q50 My individual actions would improve the quality of the environment if I were to...
convince someone to learn about the recycling facilities in his/her area.
o 1. Strongly Disagree (1)
o 2. Disagree (2)
o 3. Unsure (3)
o 4. Agree (4)
o 5. Strongly Agree (5)
Q51 My individual actions would improve the quality of the environment if I were to...
convince someone to have a home 'energy audit' to find the heat leaks in her/his house or
apartment.
o 1. Strongly Disagree (1)
o 2. Disagree (2)
o 3. Unsure (3)
o 4. Agree (4)
o 5. Strongly Agree (5)
131
Q52 My individual actions would improve the quality of the environment if I were to...
convince someone to obtain a copy of the League of Conservation Voters' Environmental
Scorecard.
o 1. Strongly Disagree (1)
o 2. Disagree (2)
o 3. Unsure (3)
o 4. Agree (4)
o 5. Strongly Agree (5)
Q53 My individual actions would improve the quality of the environment if I were to...
convince someone to buy household cleaning and/or laundry products that don't harm the
environment.
o 1. Strongly Disagree (1)
o 2. Disagree (2)
o 3. Unsure (3)
o 4. Agree (4)
o 5. Strongly Agree (5)

132
Q54 My individual actions would improve the quality of the environment if I were to...
convince someone to buy fruits and vegetables loose rather than in plastic bags.
o 1. Strongly Disagree (1)
o 2. Disagree (2)
o 3. Unsure (3)
o 4. Agree (4)
o 5. Strongly Agree (5)
Q55 My individual actions would improve the quality of the environment if I were to...
convince someone to buy products packaged in containers that either can be reused or recycled
or are made of recycled materials.
o 1. Strongly Disagree (1)
o 2. Disagree (2)
o 3. Unsure (3)
o 4. Agree (4)
o 5. Strongly Agree (5)
Q56 My individual actions would improve the quality of the environment if I were to...
convince someone to report someone who violated a law or laws that protect our natural
133
resources (e.g., illegal fishing, hunting, or trapping or illegal tree cutting) to the proper
authorities.
o 1. Strongly Disagree (1)
o 2. Disagree (2)
o 3. Unsure (3)
o 4. Agree (4)
o 5. Strongly Agree (5)
Q57 My individual actions would improve the quality of the environment if I were to...
convince someone to reuse envelopes by putting a label over the old address.
o 1. Strongly Disagree (1)
o 2. Disagree (2)
o 3. Unsure (3)
o 4. Agree (4)
o 5. Strongly Agree (5)

134
Q58 My individual actions would improve the quality of the environment if I were to...
convince someone to set her/his household appliances, such as the refrigerator, dishwasher,
water heater, etc. to 'energy saver' levels.
o 1. Strongly Disagree (1)
o 2. Disagree (2)
o 3. Unsure (3)
o 4. Agree (4)
o 5. Strongly Agree (5)
Q59 My individual actions would improve the quality of the environment if I were to...
convince someone to keep her/his car tires properly inflated.
o 1. Strongly Disagree (1)
o 2. Disagree (2)
o 3. Unsure (3)
o 4. Agree (4)
o 5. Strongly Agree (5)
135
Q60 My individual actions would improve the quality of the environment if I were to...
convince someone to take old tires to a recycling center.
o 1. Strongly Disagree (1)
o 2. Disagree (2)
o 3. Unsure (3)
o 4. Agree (4)
o 5. Strongly Agree (5)
Q61 My individual actions would improve the quality of the environment if I were to...
convince someone to conserve water by not running the water while brushing her/his teeth or
shaving and/or installing a water saving device in the tank of her/his toilet(s).
o 1. Strongly Disagree (1)
o 2. Disagree (2)
o 3. Unsure (3)
o 4. Agree (4)
o 5. Strongly Agree (5)
136
Q62 My individual actions would improve the quality of the environment if I were to...
convince someone to avoid idling her/his car unnecessarily.
o 1. Strongly Disagree (1)
o 2. Disagree (2)
o 3. Unsure (3)
o 4. Agree (4)
o 5. Strongly Agree (5)
Q63 My individual actions would improve the quality of the environment if I were to...
convince someone to reduce the amount he/she drives her/his car by carpooling instead of
driving alone and/or driving only when necessary.
o 1. Strongly Disagree (1)
o 2. Disagree (2)
o 3. Unsure (3)
o 4. Agree (4)
o 5. Strongly Agree (5)

137
Q64 My individual actions would improve the quality of the environment if I were to...
convince someone to reduce the amount of her/his household trash by reusing or recycling items
to the fullest extent possible.
o 1. Strongly Disagree (1)
o 2. Disagree (2)
o 3. Unsure (3)
o 4. Agree (4)
o 5. Strongly Agree (5)
End of Block: Pretest