how is the offshore drilling competitive landscape …
TRANSCRIPT
HOW IS THE OFFSHORE DRILLING COMPETITIVE LANDSCAPE UNFOLDING?
JO FRIEDMANN, ENERGY SERVICE RESREACH, VP RIGS & VESSELS
NOVEMBER 2021

Agenda
Is shallow water oil and gas a competitive source of supply?
How is the competitive landscape in offshore drilling evolving?
Will the jackup market see a recovery?
1
2
3

Investment themes changes over time; Optionality and sustainability key in next phase
Upcycle (2007-2013) Downcycle (2014-2018) Future (2019 → )
Investment
themes
Materiality &
volume upside
Robustness &
cash-preservation
Optionality &
Sustainability
Price
regime
Communicated
focus
high oil price
low oil price
«Under pressure»
Volume
Cost
Carbon
3
Future (2019 →)Downcycle (2014-2019)Upcycle (2007-2013)
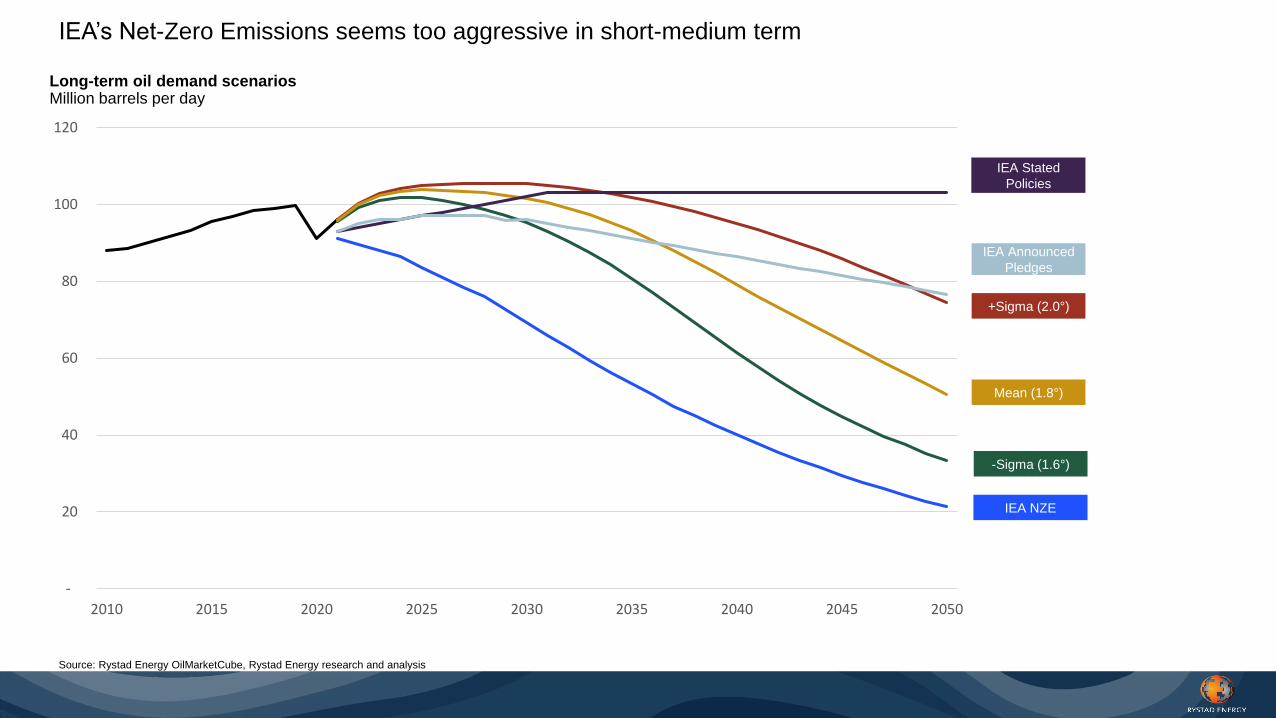
IEA’s Net-Zero Emissions seems too aggressive in short-medium term
Source: Rystad Energy OilMarketCube, Rystad Energy research and analysis
-
20
40
60
80
100
120
2010 2015 2020 2025 2030 2035 2040 2045 2050
Mean (1.8°)
IEA NZE
+Sigma (2.0°)
IEA Announced
Pledges
-Sigma (1.6°)
IEA Stated
Policies
Long-term oil demand scenariosMillion barrels per day
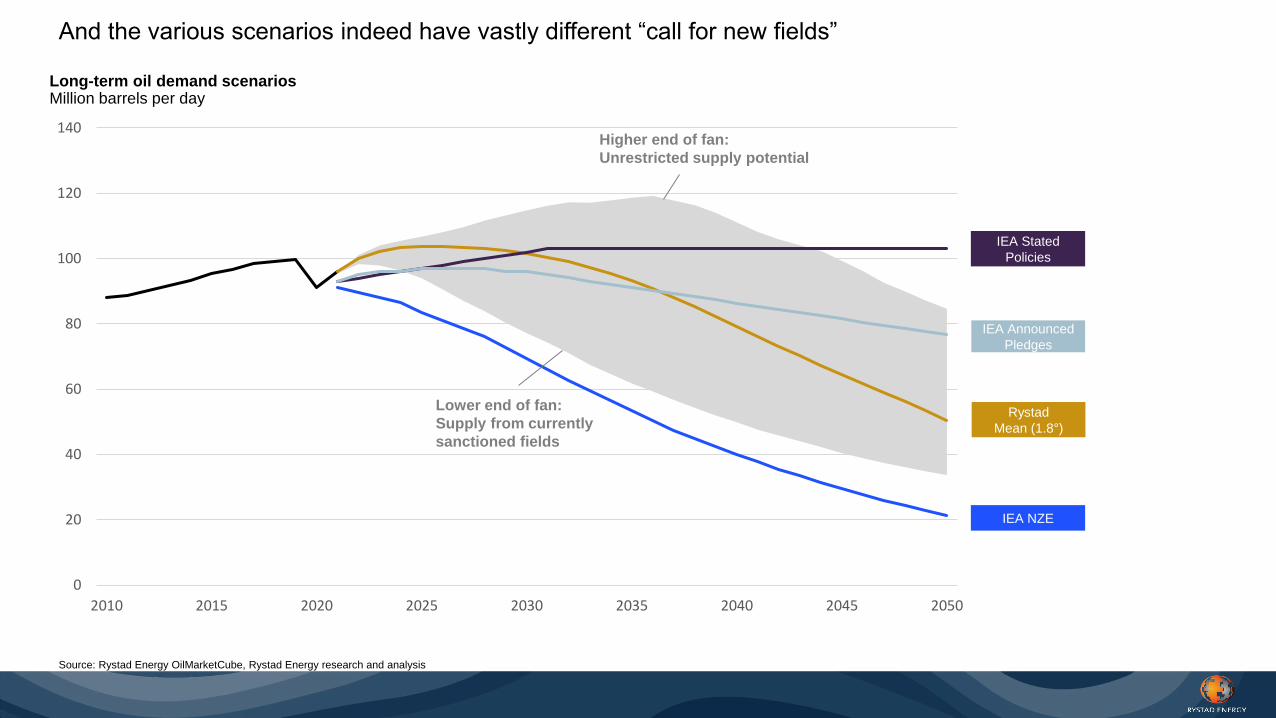
And the various scenarios indeed have vastly different “call for new fields”
Source: Rystad Energy OilMarketCube, Rystad Energy research and analysis
0
20
40
60
80
100
120
140
2010 2015 2020 2025 2030 2035 2040 2045 2050
Rystad
Mean (1.8°)
IEA NZE
IEA Announced
Pledges
IEA Stated
Policies
Long-term oil demand scenariosMillion barrels per day
Lower end of fan:
Supply from currently
sanctioned fields
Higher end of fan:
Unrestricted supply potential
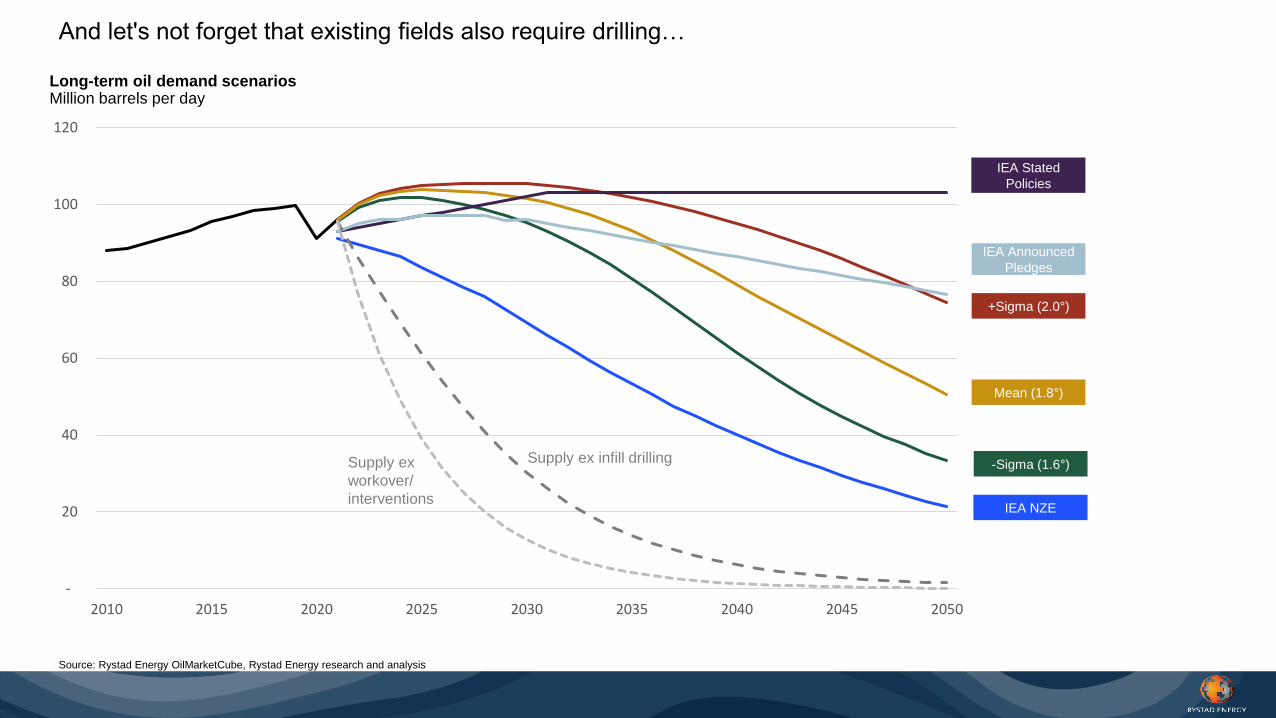
And let's not forget that existing fields also require drilling…
Source: Rystad Energy OilMarketCube, Rystad Energy research and analysis
-
20
40
60
80
100
120
2010 2015 2020 2025 2030 2035 2040 2045 2050
Mean (1.8°)
IEA NZE
+Sigma (2.0°)
IEA Announced
Pledges
-Sigma (1.6°)
IEA Stated
Policies
Long-term oil demand scenariosMillion barrels per day
Supply ex infill drillingSupply ex
workover/
interventions

7
Middle East offsetting offshore shelf production decline in NS, SEA and GoM
Source: Rystad Energy research and analysis; Rystad Energy UCube
Shallow water production by region
Million boe/d
0
2
4
6
8
10
12
14
16
0
1
2
3
4
5
6
2000 2001 2002 2003 2004 2005 2006 2007 2008 2009 2010 2011 2012 2013 2014 2015 2016 2017 2018 2019 2020
Middle East (RHS)
Other
Southeast Asia
North Sea
US GoM
India
Mexico
China
West Africa
Million boe/d
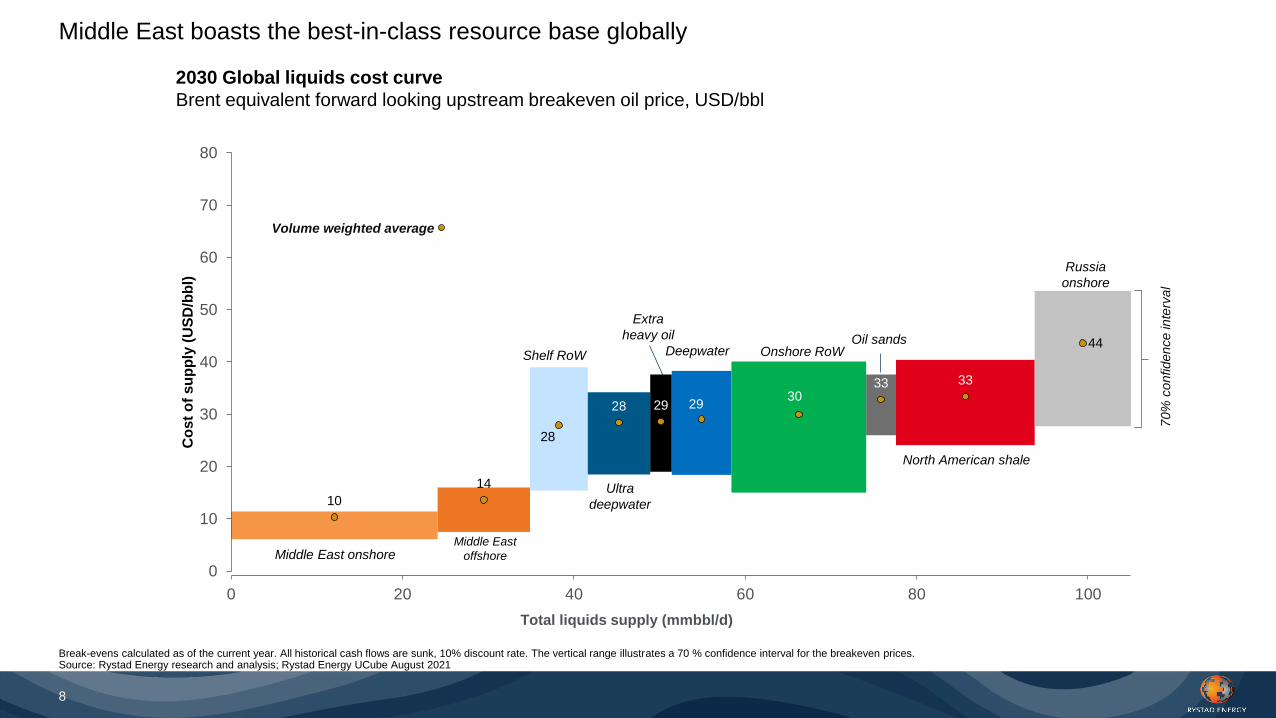
10
14
28
28 29 2930
33 33
44
0 20 40 60 80 100
0
10
20
30
40
50
60
70
80
Total liquids supply (mmbbl/d)
Co
st
of
su
pp
ly (
US
D/b
bl)
Middle East boasts the best-in-class resource base globally
Break-evens calculated as of the current year. All historical cash flows are sunk, 10% discount rate. The vertical range illustrates a 70 % confidence interval for the breakeven prices. Source: Rystad Energy research and analysis; Rystad Energy UCube August 2021
8
Middle East onshore
Deepwater
Ultra
deepwater
Shelf RoW
Extra
heavy oil
Onshore RoW
North American shale
Russia
onshore
Middle East
offshore
Oil sands
70%
confidence in
terv
al
Volume weighted average
2030 Global liquids cost curve
Brent equivalent forward looking upstream breakeven oil price, USD/bbl

Source: Rystad Energy UCube and WellCube
0
10
20
30
40
50
60
70
80
90
2005 2006 2007 2008 2009 2010 2011 2012 2013 2014 2015 2016 2017 2018 2019 2020
Offshore deepwater Offshore shelf
-50%
-40%
9
Development in average offshore well cost per well by segment
MUSD per well
Average shallow water well cost is down 40% since 2014

9.9
6.6
5.5
5.4
4.5
4.3
4.3
4.2
3.6
3.6
2.5
2.2
1.8
1.8
1.6
0 2 4 6 8 10 12
Thailand
United Kingdom
Angola
Nigeria
United States
Norway
Mexico
Malaysia
China
India
Trinidad and Tobago
Saudi Arabia
UAE
Brazil
Qatar
*Based on wells completed between 2010 and 2020 Source: Rystad Energy UCube
7.1
6.0
3.6
3.2
3.1
2.5
2.3
2.2
2.1
2.0
1.9
1.7
0.7
0.4
0.2
0 2 4 6 8
Thailand
United Kingdom
India
Indonesia
United States
China
Malaysia
Netherlands
Saudi Arabia
Malaysia/Thailand JDA
Norway
Trinidad and Tobago
Australia
Iran
Qatar
Oilfields Gas fields
10
Average well capex per boe for top 15 most active countries*
UDS/boe
Qatar, Brazil, UAE and Saudi Arabia with the most commercial oil wells drilled over the last decade

Agenda
Is shallow water oil and gas a competitive source of supply?
How is the competitive landscape in offshore drilling evolving?
Will the jackup market see a recovery?
1
2
3

12
Offshore drillers that filed for Chapter 11
Diamond Offshore Exited
Noble Drilling Exited
Valaris Exited
Pacific Drilling Exited & Acquired
Seadrill Partners (Aquadrill) Exited
Seadrill Limited On-going (4Q 2021)
Offshore Drilling Holding (part of Grupo R) On-going
Aban Offshore On-going
KS Energy (subsidiary company KS Drilling) On-going
Debt wipeout will enable further consolidation

13
Source: Rystad Energy research and analysis; Company 8Ks
Five drillers reduce debt burden by more than $14Bn in latest restructuring round
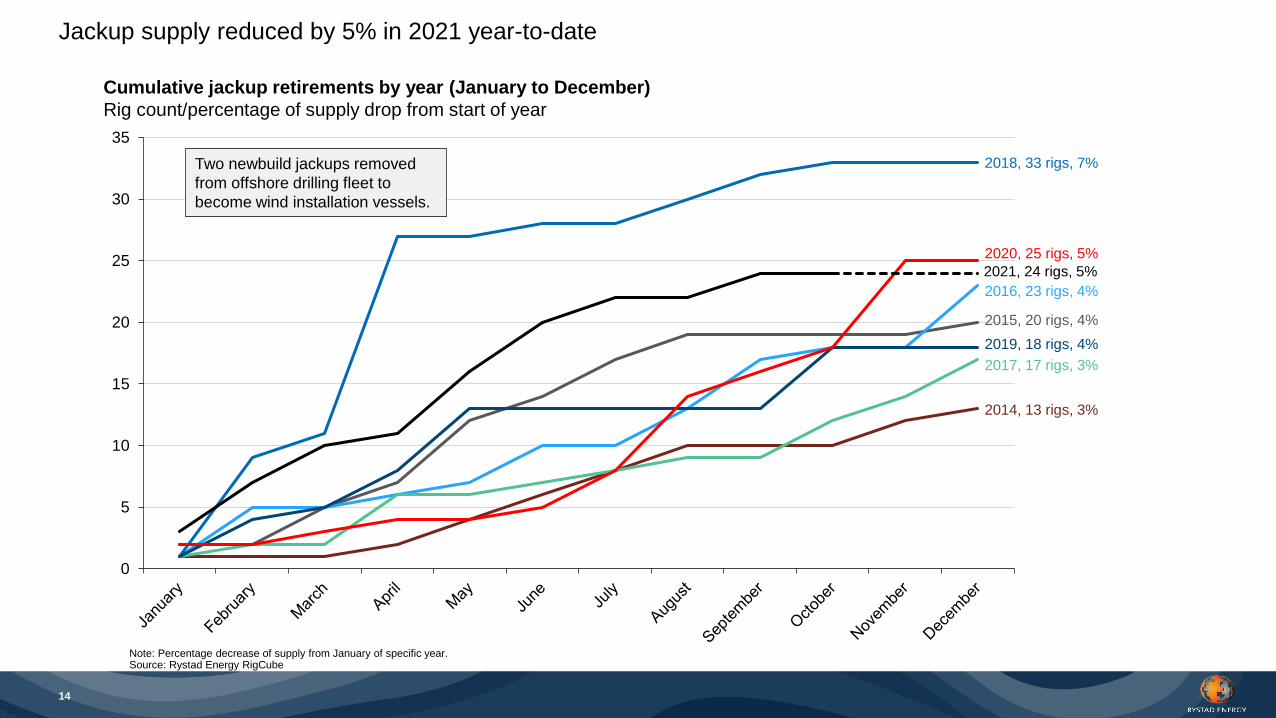
14
Note: Percentage decrease of supply from January of specific year. Source: Rystad Energy RigCube
Cumulative jackup retirements by year (January to December)
Rig count/percentage of supply drop from start of year
Jackup supply reduced by 5% in 2021 year-to-date
0
5
10
15
20
25
30
35
2018, 33 rigs, 7%
2014, 13 rigs, 3%
2020, 25 rigs, 5%
2017, 17 rigs, 3%
2016, 23 rigs, 4%
2015, 20 rigs, 4%
2019, 18 rigs, 4%
2021, 24 rigs, 5%
Two newbuild jackups removed
from offshore drilling fleet to
become wind installation vessels.

15
Stranded jackups are slowly but steadily leaving the yards and entering the market
Source: Rystad Energy research and analysis
Cumulative number of stranded jackups, 2015-2021 (YTD)
Number of rigs
Gulf Driller I stranded at CIMC
PaxOcean strands 2 jackups at PT Drydocks
Paragon strands Prospector 6, 7 & 8 at DISC
Speculative owner strands Gulf Driller VIII
TS Jade stranded at CSIC
TS Jasper stranded at KeppelFELS
Borr Drilling acquiires 9 rigs from PPL Shipyard
Borr Drilling acquires 5 rigs from KeppelFELS
Noble acquires 2 rigs from PaxOcean
Shelf Drilling buys 2 / BBCs 2 rigs from CMHI
CP Latina takes Gulf Driller 6 & 8 on BBC
COSL takes SinoOcean Auspicious on BBC
Shelf Drilling ends BBC deal for 2 rigs
COSL takes 3 x CHMI jackups on BBC
SinoOcean converts 2 jackups to wind vessels
ADNOC buys units previously under BBC to Shelf
0
10
20
30
40
50
60
70
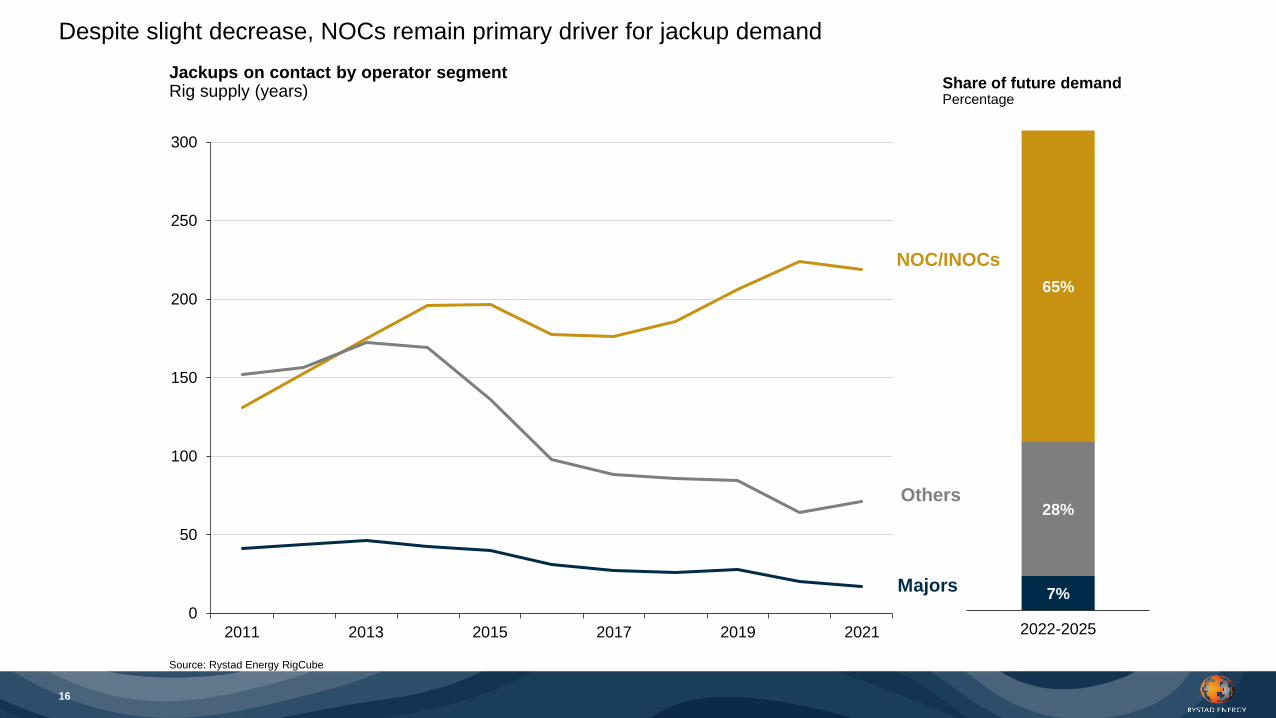
16
Despite slight decrease, NOCs remain primary driver for jackup demand
Source: Rystad Energy RigCube
0
50
100
150
200
250
300
2011 2013 2015 2017 2019 2021
7%
28%
65%
2022-2025
Share of future demandPercentage
Majors
NOC/INOCs
Others
Jackups on contact by operator segmentRig supply (years)

Source: Rystad Energy research and analysis
NOC Rig Demand National Rig Contractor / JV Regional Rig Contractor Standard International RigContractor
Premium International RigContractor
National / JVGuaranteed
contract wins
RegionalNOC relationship
and localization
Standard
International
Price competitionPremium
International
Technology
differentiation
17
NOC contracting preferences and contractor differentiation illustration

Agenda
Is shallow water oil and gas a competitive source of supply?
How is the competitive landscape in offshore drilling evolving?
Will the jackup market see a recovery?
1
2
3
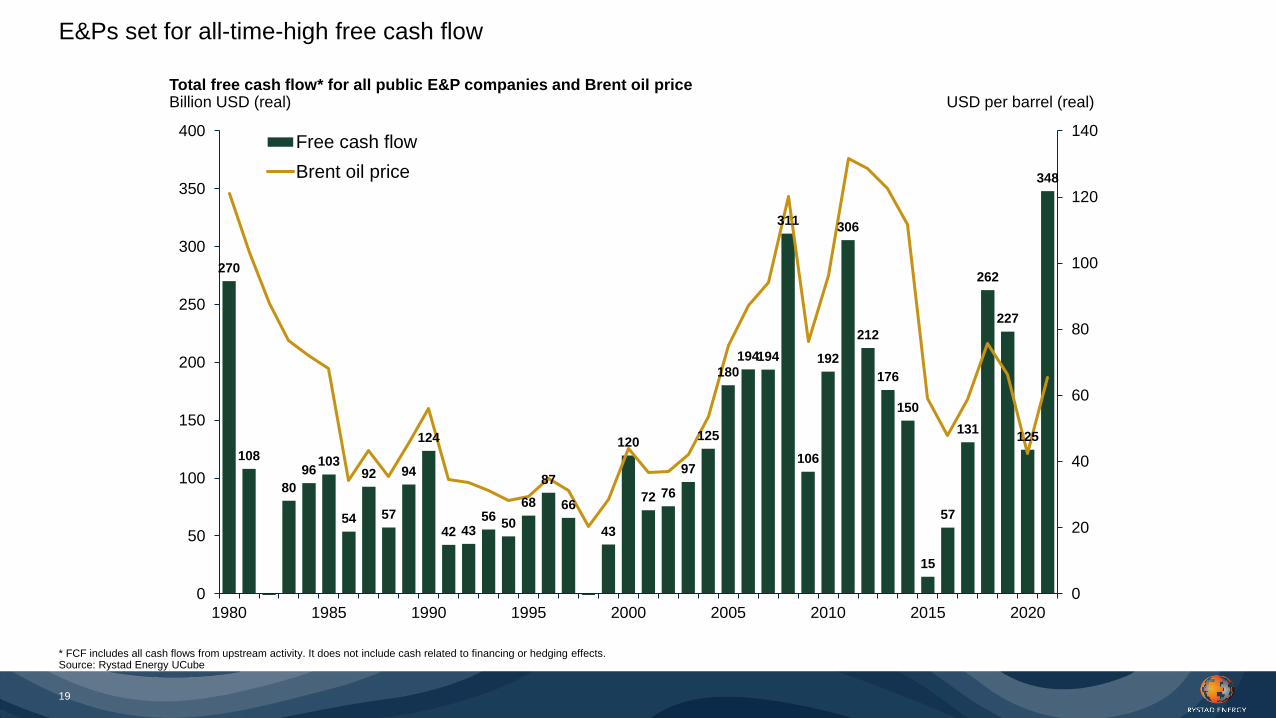
19
E&Ps set for all-time-high free cash flow
* FCF includes all cash flows from upstream activity. It does not include cash related to financing or hedging effects. Source: Rystad Energy UCube
Total free cash flow* for all public E&P companies and Brent oil priceBillion USD (real) USD per barrel (real)
270
108
80
96103
54
92
57
94
124
42 4356
50
68
87
66
43
120
72 76
97
125
180
194194
311
106
192
306
212
176
150
15
57
131
262
227
125
348
0
20
40
60
80
100
120
140
0
50
100
150
200
250
300
350
400
1980 1985 1990 1995 2000 2005 2010 2015 2020
Free cash flow
Brent oil price

Source: Rystad Energy RigCube
-20%
-10%
0%
10%
20%
30%
40% Drillships
Semisubmersibles
Jackups
Jackups, drillships and semisubmersibles on contract
Daily rig count indexed to October 27, 2020
Jackups with steady growth last 12 months after showing resilience during downturn

21
Note: Marketed utilization excludes cold-stacked units. Excluding newbuilds without contracts. Source: Rystad Energy RigCube
0%
20%
40%
60%
80%
100%
0
20
40
60
80
100
120O
ct-
18
Apr-
19
Oct-
19
Apr-
20
Oct-
20
Apr-
21
Oct-
21
Middle EastNumber of contracted rigs/utilization (%)
Southeast AsiaNumber of contracted rigs/utilization (%)
West AfricaNumber of contracted rigs/utilization (%)
North Sea (Norway)Number of contracted rigs/utilization (%)
North Sea (excl. Norway)Number of contracted rigs/utilization (%)
MexicoNumber of contracted rigs/utilization (%)
Marketed utilization (RHS)
Contracted rigs (LHS)
0%
20%
40%
60%
80%
100%
0
10
20
30
40
50
Oct-
18
Apr-
19
Oct-
19
Apr-
20
Oct-
20
Apr-
21
Oct-
21
0%
20%
40%
60%
80%
100%
0
5
10
15
Oct-
18
Apr-
19
Oct-
19
Apr-
20
Oct-
20
Apr-
21
Oct-
21
0%
20%
40%
60%
80%
100%
0
10
20
30
40
Oct-
18
Apr-
19
Oct-
19
Apr-
20
Oct-
20
Apr-
21
Oct-
21
Marketed utilization (RHS)
Contracted rigs (LHS)
0%
20%
40%
60%
80%
100%
0
10
20
30
40
Oct-
18
Apr-
19
Oct-
19
Apr-
20
Oct-
20
Apr-
21
Oct-
21
0%
20%
40%
60%
80%
100%
0
10
20
30
40
Oct-
18
Apr-
19
Oct-
19
Apr-
20
Oct-
20
Apr-
21
Oct-
21
Regional utilization and rig count trends

0
500
1000
1500
2000
2500
3000
3500
1Q 2019 2Q 2019 3Q 2019 4Q 2019 1Q 2020 2Q 2020 3Q 2020 4Q 2020 1Q 2021 2Q 2021
Transocean Valaris plc Noble Drilling Maersk Drilling
Diamond Offshore Odfjell Drilling Shelf Drilling Saipem
Borr Drilling Vantage Drilling Awilco Drilling PLC
*Transocean received a one-time cash settlement of $177 million recognized during 2Q 2020.Source: Rystad Energy ServiceSupplyCube
22
Revenues for selected listed rig owners
Quarterly revenue from offshore drilling by selected rig companiesQuarter-on-quarter percentage change in million USD

Source: Rystad Energy RigCube
Historical fixtures by asset class (new unique contracts)
Thousand USD/day
Rate improvement lagging for jackups
Premium jackup Standard jackupHarsh jackup
Source: Rystad Energy RigCube
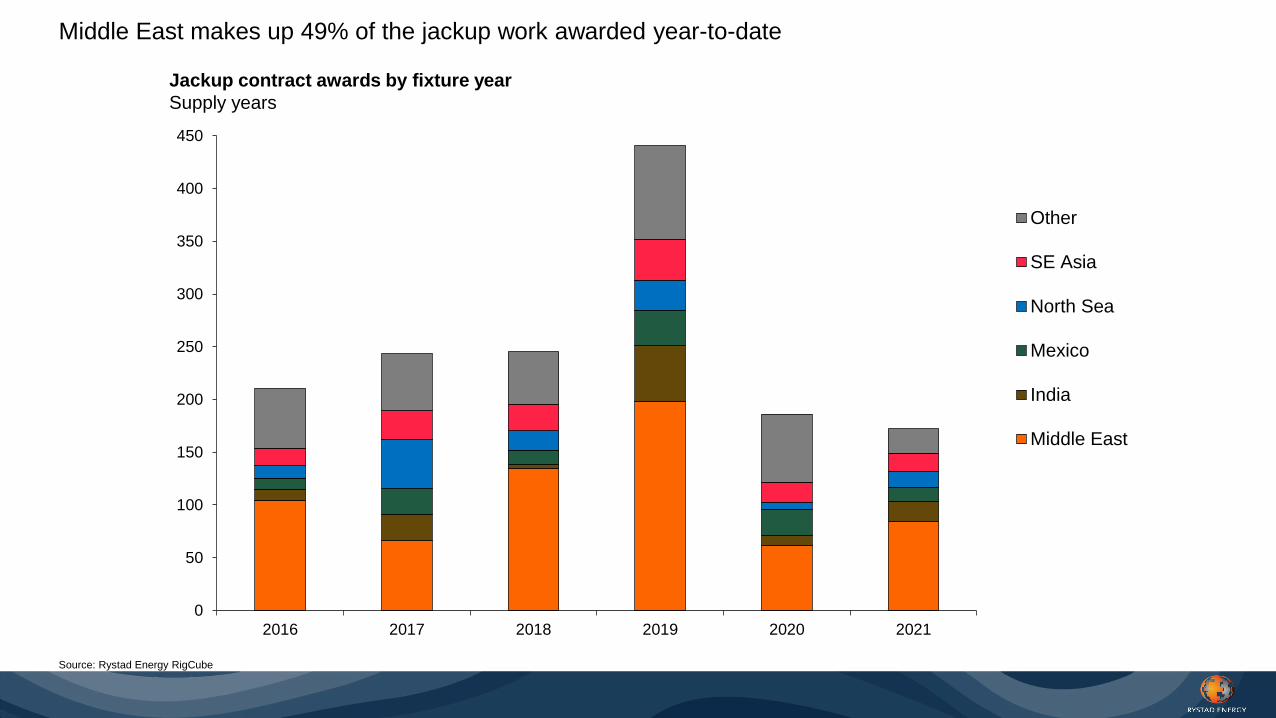
Jackup contract awards by fixture year
Supply years
Middle East makes up 49% of the jackup work awarded year-to-date
0
50
100
150
200
250
300
350
400
450
2016 2017 2018 2019 2020 2021
Other
SE Asia
North Sea
Mexico
India
Middle East
*Contract awards in 2021 YTD. Includes new unique contracts, exercised options and extensions.Source: Rystad Energy RigCube
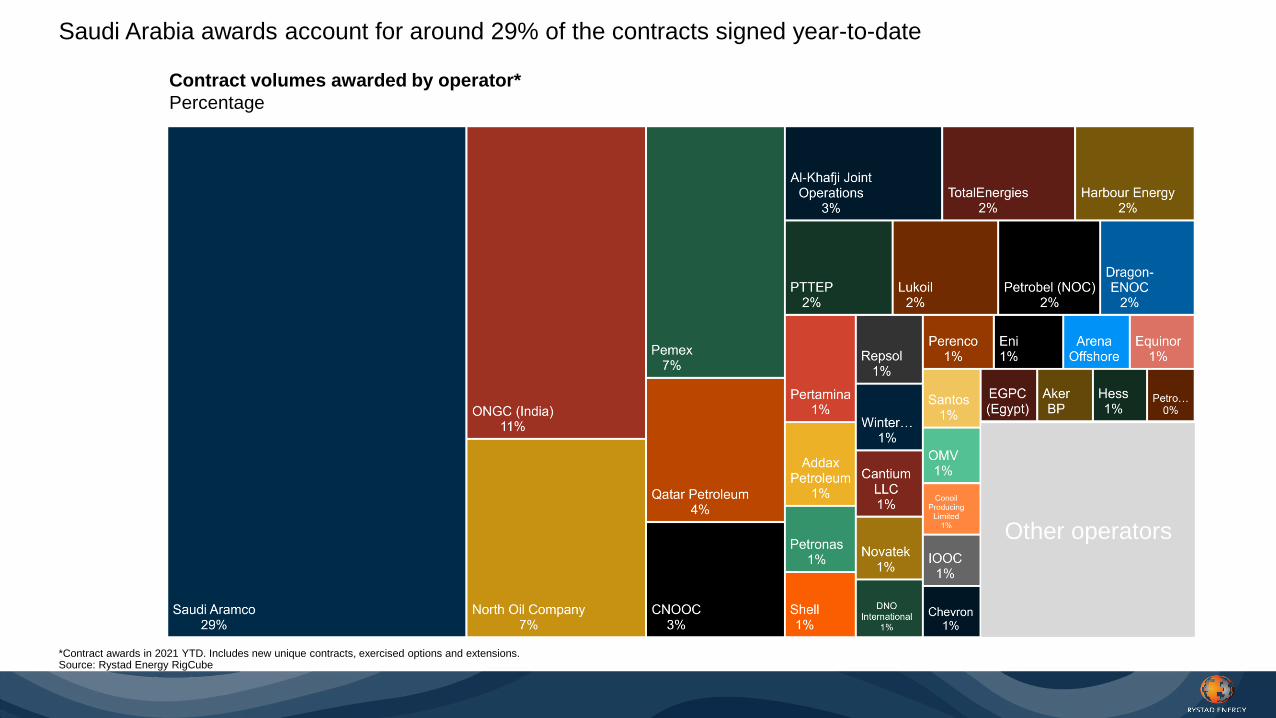
Contract volumes awarded by operator*
Percentage
Saudi Arabia awards account for around 29% of the contracts signed year-to-date
Other operators
26
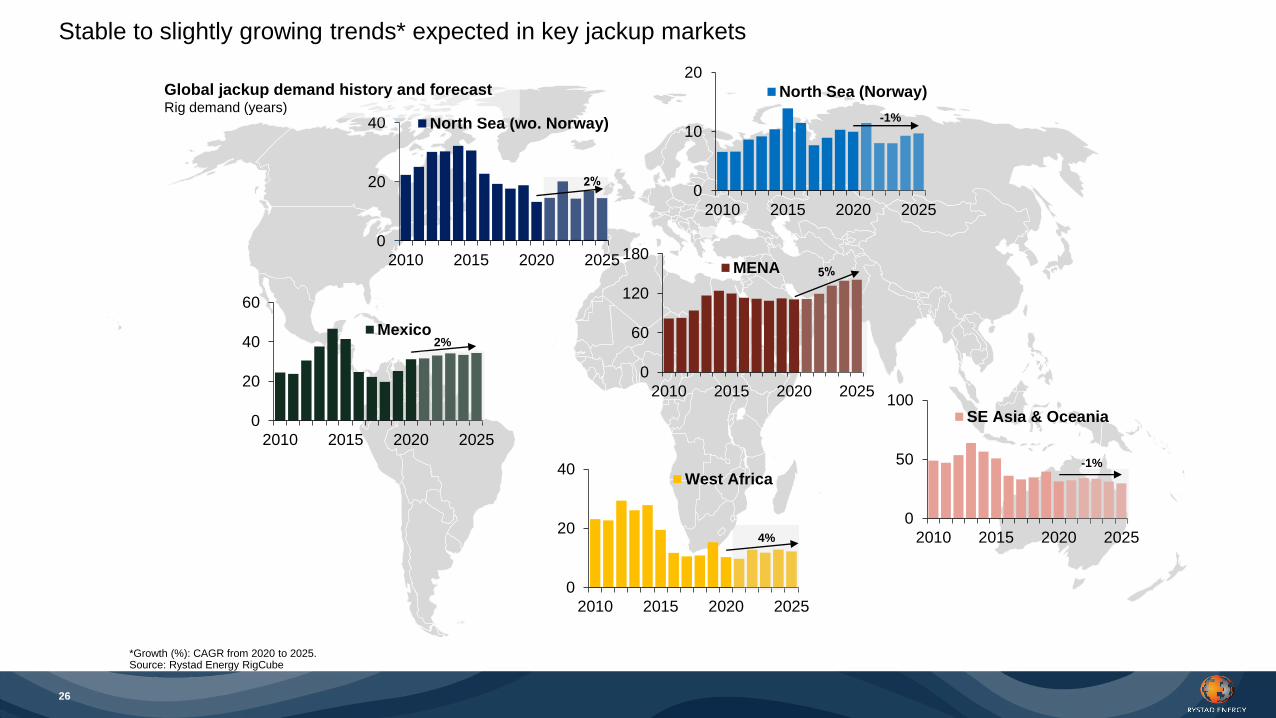
*Growth (%): CAGR from 2020 to 2025.Source: Rystad Energy RigCube
0
10
20
2010 2015 2020 2025
North Sea (Norway)
0
20
40
2010 2015 2020 2025
North Sea (wo. Norway)
0
20
40
60
2010 2015 2020 2025
Mexico2%
0
60
120
180
2010 2015 2020 2025
MENA
0
20
40
2010 2015 2020 2025
West Africa
0
50
100
2010 2015 2020 2025
SE Asia & Oceania
-1%
-1%
4%
Global jackup demand history and forecastRig demand (years)
Stable to slightly growing trends* expected in key jackup markets

Rystad Energy is an independent energy consulting services and business
intelligence data firm offering global databases, strategy advisory and
research products for energy companies and suppliers, investors,
investment banks, organizations, and governments. Rystad Energy’s
headquarters are located in Oslo, Norway.
Headquarters
Rystad Energy
Fjordalléen 16, 0250 Oslo, Norway
Americas +1 (281)-231-2600
EMEA +47 908 87 700
Asia Pacific +65 690 93 715
Email: [email protected]
© Copyright. All rights reserved.