how inadequate provision - documents & reports - all ... inadequate provision of public...
TRANSCRIPT

POLICY RESEARCH WORKING PAPER 2262
How Inadequate Provision Evidence from Uganda showsthat poor public provision of
of Public Infrastructure infrastructure services -
and Services Affects proxied by an unreliable andinadequate power supply -
Private Investment significantly reducesproductive private investment
Ritva Reinikka
Jakob Svensson
The World Bank
Development Research Group
Public Economics
and
Macroeconomics and Growth
December 1999
Pub
lic D
iscl
osur
e A
utho
rized
Pub
lic D
iscl
osur
e A
utho
rized
Pub
lic D
iscl
osur
e A
utho
rized
Pub
lic D
iscl
osur
e A
utho
rized
Pub
lic D
iscl
osur
e A
utho
rized
Pub
lic D
iscl
osur
e A
utho
rized
Pub
lic D
iscl
osur
e A
utho
rized
Pub
lic D
iscl
osur
e A
utho
rized

I POLICY RESEARCH WORKING PAPER 2262
Summary findingsLack of private investment is a serious policy problem in poor public capital, proxied by an unreliable andmany developing countries, especially in Africa. Despite inadequate power supply, significantly reducesrecent structural reform and stabilization, the investment productive private investment.response to date has been mixed, even among the Firms can substitute for inadequate provision of publicstrongest reformers. capital by investing in it themselves. This comes at a cost,
The role of poor infrastructure and deficient public however: the installation of less productive capital.services has received little attention in the economic These results have clear policy implications. Althoughliterature, where the effect of public spending and macroeconomic reforms and stabilization are necessaryinvestment on growth is shown to be at best ambiguous. conditions for sustained growth and private investment,
Reinikka and Svensson use unique microeconomic without an accompanying improvement in the publicevidence to show the effects of poor infrastructure sector's performance, the private supply response toservices on private investment in Uganda. They find that macroeconomic policy reform is likely to remain limited.
This paper - a product of Public Economics and Macroeconomics and Growth, Development Research Group - is partof a larger effort in the group to study public service delivery and economic growth. Copies of the paper are available freefrom the World Bank, 1818 H Street, NW, Washington, DC 20433. Please contact Hedy Sladovich, room MC2-609,telephone 202-473-7698, fax 202-522-1154, email address [email protected]. Policy Research Working Papersare also posted on the Web at www.worldbank.org/research/workingpapers. The authors may be contacted [email protected] or [email protected]. December 1999. (26 pages)
The Poliy Research Working Paper Series disseminates the findcngs of work in progress to encourage the exchange of ideas aboutdevelopment issuies. An objective of the series is to get the findings out quickly, even if the presentations are less than fully polished. Thepapers carry the names of the authors and sbould be cited accordingly. IThe findings, interpretations, and conclusions expressed in thispaper are entirely those of the authors. They do not necessarily represent the view of the World Bank, its Executive Directors, or thecountries they represent.
Produced by the Policv Research Dissemination Center

How Inadequate Provisionof Public Infrastructure and Services
Affects Private Investment
Ritva ReinikkaDevelopment Research Group
The World Bank1818 Street, N.W., Rm. MC 2-507
Washington, DC [email protected]
Jakob SvenssonDevelopment Research Group
The World Bank1818 Street, N.W., Rm. MC 3-361
Washington, DC [email protected]
The findings reported in this paper are based on data from a 1998 Uganda EnterpriseSurvey carried out by the Uganda Manufacturers Association Consultancy andInformation Service (UMACIS) on behalf of the Ugandan Private Sector Foundation andthe World Bank, and was managed by William Kalema and Frances Nzonsi. We thankthe Governments of Austria and Sweden for their generous financial support of thesurvey.


1. Introduction
Until fairly recently, the traditional approach to growth in the development eco-
normics literature (and in policy formation) was rather mechanical: growth was
constrained by lack of investment which, in turn, was constrained by lack of fi-
nance. Consequently, if finance were made available, it was argued, investment
would follow (Easterly, 1997). Although underdeveloped financial systems are
found to be associated with poor economic performance in cross-country regres-
sions (King and Levine, 1993), evidence from several African countries indicates
that lack of liquidity typically only constrains the capital accumulation of house-
hold and small enterprises, but on average not that of larger firms (Bigsten et al.,
1999). Hence, factors other than finance must explain the apparent reluctance of
firms to invest and expand.
In the extensive cross-country growth literature, the role of macroeconomic
policy, proxied by government budget deficits, black-market premiums, and infla-
tion (see for instance Easterly and Rebelo, 1993; Barro, 1991; Fisher, 1993), has
been identified as a key policy measure influencing both efficiency and level of
investment and growth. However, despite recent macroeconomic reforms in many
developing countries, the private investment response has been disappointing, par-
ticularly in Africa (Collier and Gunning, 1999). Uganda is a good example. Over
the past decade, Uganda has consistently liberalized its economy, and now has one
of the best macroeconomic environments in Africa. Still, the investment response
is not significantly different from other African countries with significantly worse
macroeconomic environments (Reinikka and Svensson, 1999).
2

The role of poor infrastructure and deficient public services has received little
attention in the economic literature. The existing empirical evidence, based on
cross-country data, indicates that the effect of public spending and investment
on growth is at best ambiguous (Barro and Sala-i-Martin, 1995; Easterly and
Rebelo,1993; Devarajan, Swaroop, and Zou, 1996).'
This ambiguity may simply be a problem of identification; more spending does
not necessarily imply more public capital or services (Pritchett, 1996; Ablo and
Reinikka, 1998; Svensson, 1999a). In fact, when output measures of public capital,
such as telephones per worker, rather than spending have been used to proxy
infrastructure constraints, a positive relationship between infrastructure quality
and growth emerges (Easterly and Levine, 1997). However, as with other outcome
measures in cross-country regressions, the direction of causality is unclear, thus
making it difficult to assess the relationship.
We avoid the identification problem by using unique microeconomic evidence
to show the effects of poor infrastructure services on private investment in Uganda.
We find that poor public capital, proxied by unreliable and inadequate public
power supply, significantly reduces productive investment by firms. The microe-
conomic data also shows us how firms cope with deficient public capital: when
public provision of services and infrastructure is poor they can invest in comple-
mentary capital themselves. However, there is a cost: less productive capital will
be installed.
lEasterly and Rebelo (1993) find that overall public investment has a very low impact ongrowth, but that certain types of investment expenditures are correlated with growth. Devara-jan, Swaroop, and Zou (1996) find that the standard candidates for productive expenditureshad either a negative or insignificant relationship with growth.
3

These results have clear policy implications. Although macroeconomic reforms
and stabilization are necessary conditions for sustained growth and private invest-
ment, without an accompanying improvement in the public sector's performance,
the private supply response to macroeconomic policy reform is likely to remain
limited.
The rest of the paper is organized as follows. Section 2 explores the stylized
facts of deficient public capital from the viewpoint of firms. Section 3 sets out a
simple two-period model highlighting the relationship between firms' productive
investment and availability of complementary capital. The model captures salient
features of low-income economies by assuming absence of a credit market, deficient
supply of publicly provided complementary capital, and uncertainty about its
future improvement. Section 4 tests the model empirically using recent firm survey
data from Uganda. Section 5 concludes.
2. Deficient public capital: A case study of a developing
country
This section stylizes some facts about deficient public capital in a typical low-
income developing country. The data come from a recent (1998) firm survey in
Uganda that collects information on infrastructure services and private invest-
ment. The survey covered a total of 243 firms for the period 1995-97 (Reinikka
and Svensson, 1999).
We define complementary capital as capital that provides support services
necessary for the operation of productive private capital (e.g. transport infras-
tructure, such as roads, ports, and railways; or utilities, such as electricity, water,
4

and telephone). In low-income countries complementary capital is typically pub-
licly provided. In certain cases the firm can substitute for deficient public services
by investing privately in complementary capital (e.g. electric power generators or
waste disposal). However, some types of complementary capital, such as transport
infrastructure, cannot easily be substituted.
Is poor public service perceived to be an important constraint for firms? Figure
1 ranks firm managers' perceptions on a wide range of constraints to investment.
Managers rated poor utility services (and the cost of utility services) as the most
binding constraint. Unreliable and inadequate electricity was ranked as most
binding by most firms, followed by telephone services, roads, and waste disposal.
Although most firms (94 percent) were connected to the public grid, power supply
was ranked as a major obstacle for every sector and size category of firms, whether
foreign or domestic. Responses suggest that the supply of electricity had in fact
worsened in the recent years.
The quantitative information reveals a similar picture. On average, the firms
surveyed did not receive electricity from the public grid, a monopoly supplier,
for 89 operating days (adding up all the part or full days) a year (74 days at
the median). As a result, many firms invested in a back-up power generator.
As many as 77 percent of large firms, 44 percent of medium-sized firms, and 16
percent of small-sized firms owned generators. The cost of generators represented
16 percent of the value of total investment, on average, and 25 percent of the
value of investment in equipment and machinery in 1997. Moreover, the data
suggest that it costs about three times more to run and own a generator than to
buy power from the public grid (when it is available). Errors in billing occurred
3 months per year, on average.
5

Despite the generally poor quality of public electricity service, there were large
variations across firms in terms of days without power (figure 2). These variations
were partly the result of unreliable power supply in general, and partly the result
of service on specific power lines. For instance, interviews with firm managers
suggested that firms connected to "priority" lines (i.e., power lines that connect
important army facilities) were more likely to receive reliable power supply.
Access to public telephone service varied by location and firm size. On average,
it took 13 weeks to obtain a telephone connection. Over one-half of the firms
invested in mobile phones (a privately run service) because public service was so
inefficient. Firms tried an average 2.5 times to complete a local call, 4.6 times
to complete a long-distance call within Uganda, 4 times to complete a call to a
neighboring country, and 2.8 times to complete an international call.
One-third of the firms reported having access to public waste disposal services,
but few could actually rely on them. Eight percent of firms used a private provider
and 77 percent disposed of their own waste. Similar problems plagued other public
capital services, including water supply (firms reported 33 days of inadequate
supply in a year), postal services (only 31 percent of business correspondence was
delivered by the public post office), ports and airports, road and rail services.
Altogether, the summary statistics suggest that the magnitude of the poor
infrastructure and deficient public services is considerable, and therefore might
have significant effects on firms' investment and business decisions. In section 4
we formally test if this is the case, and in the next section we present a simple
model to guide the empirical work.
6

3. Model
Consider the following two-period model. A manager maximizes the expected
discounted cash flow according to the following quasi-linear preference function
w(di, d2) = u(di) + E3d2 (3.1)
where dt, t = 1, 2, is cash flow in period t, /3 is a discount factor, E is an ex-
pectation operator, and u(.) is a strictly increasing concave function. The firm
(manager) starts period 1 with retained earnings e, and must decide how to al-
locate these earnings between dividends in present period (d1) and investment i
and thereby expected dividends in period 2 (d2 ).
The return to private productive capital, i, depends on the availability of
complementary capital. There is uncertainty about the availability and quality of
publicly provided complementary capital. However, firms can remove the uncer-
tainty by substituting public capital for private substitutes, but there is a fixed
cost of doing so. In period 1, the manager decides whether or not to buy com-
plementary capital; that is, private substitutes, denoted by ,', where i, = {O, i}.
In period 1, the manager also determines the amount of investment, denoted by
i. Capital becomes productive in period 2, according to the production function
f (i).Without adequate complementary public capital, the return to private invest-
ment is uncertain. The net return is given by qf (i). To simplify, we assume that
q can take two values, q and q, with q > r > q. The probability of event ff [ is
p4 [{P]. Let qe denote expected q; that is, qe = pqq + pqq.
With private complementary capital installed, the firm can ensure at least the
net return rf (i), where f > r > q. If public provision turns out to be available
7

and of good quality, the net return qf (i) is higher.2 Thus, the net return for a
firm with installed complementary capital is max [q, r] f (i). q is observed at the
beginning of period 2.
We assume an incomplete credit market, implying that firms can only invest
from retained earnings, e. The budget constraint in period 1 is then simply
d, + i + ic < e . (3.2)
The firm's problem can be solved by working backwards. In period 1, the firm
determines the amount of investment, i. The first-order conditions for the two
'types' of firms are
-u'(di) + I3ref(i) = 0 if K = K (3.3)
and
-u'(di) +3,qef'(i) =O if K = 0 (3.4)
where re _ pqq + pqr. Equations (3.3) and (3.4), together with the budget con-
straint (3.2), implicitly define the investment functions
ii = IP(e, ,',re, K) (3.5)
io = Io°(e, o3, qe) (3.6)
where il is the investment function for a firm that installed complementary capital
(K = R), io is the investment function for a firm that did not (K = 0). Using the
investment functions (3.5) and (3.6), and budget constraint (3.2), to substitute
2 This seems like a reasonable assumption since complementary capital typically involves largefixed costs and therefore can be supplied cheaper through large-scale production. As an example,the firm survey revealed that it costs about three times more to run and own a generator forpower than to buy power from the public grid.
8

into (3.1), yields the indirect expected utility functions, we (e, re, R |K = K) and
w (e, qe i = 0).
Will the firm invest in complementary capital itself? Installing private substi-
tutes is an optimal response if the expected utility of buying private substitutes
and investing according to (3.5) is higher than the expected utility of relying solely
on public capital and investing according to (3.6). That is, a firm invests K = K
if,
we (e,r', K Jr, = K) - We (e, q' IK = 0) > O . (3.7)
Let qe be the cutoff value of qe such that
we (e, r, K |K = K) - we (e, q Jr = 0) = 0 (3.8)
holds. If the firm expects poor quality of complementary public capital; that is
qe < qe, the firm will buy private complementary capital. If the firm expects
publicly provided complementary capital of high quality; that is qe > qe, it will
rely solely on public capital.
The investment functions (3.5) and (3.6), and the complementary capital de-
cision (3.8) have some interesting characteristics. First, for a firm that installed
private substitutes (, = K), investment is independent of qe* Thus, as illustrated
in figure 3, a fall in the expected quality of publicly provided complementary
capital (due to a lower q) has no effect on desired investment rate for firms with
K = K, but would result in lower private investment for a firm with rK = 0.3
3This asymmetry is due to the fact that firms with K = ic will always exploit their ownprivately provided stock of complementary capital when public capital provision is poor, yieldinga certain return r on investment. Thus, a lower q has no effect. Note though that, for example,a reduction in the probability of efficient public capital provision (pq), would lower privateinvestment for both "types" of firms, since both re and qe would fall. However, a lower pq wouldreduce the expected return to private investment for a type 1 firm (with X = ) more than the
9

Second, a fall in the expected quality of public capital would also affect
the decision to buy private substitutes. Note that ddk [we (. In = 0)] > 0, and
dd [we I n = EC)] 0, implying that dq/dqe > 0. Hence, a fall in the expected
quality of public capital would reduce the cutoff value 4 for which it becomes
optimal to install private substitutes. Thus, the incentives to 'insure' against bad
states increase.
Third, private substitutes crowd-out productive capital; that is, dl'/dR < 0.
As illustrated figure 3, higher costs of complementary private substitutes, shift the
I'-curve down, as resources that could be utilized for productive public capital is
now used to finance private substitutes. If rc is sufficiently large, 1I > I1 for highqe
Finally, a mean-preserving spread in q would also result in more firms buying
private substitutes. That is, even though firms are risk neutral with respect to
second period cash flows, an increase in the variance of the return q, holding the
expected return qe constant, increases the incentives to buy private substitutes.
Intuitively, the option value that follows an installation of complementary capital;
that is, the possibility of getting return r when publicly provided capital is of poor
quality (q) increases when the variance in q increases.4 This result resembles one
of the key findings in recent investment under uncertainty theory (see Dixit and
Pindyck 1994, for a comprehensive review; and Pattillo, 1997; Svensson, 1999b,
for empirical support). The so-called option approach views investment policy
as balancing the value of waiting for new information with the cost of foregone
fall in expected return to private investment for a type 2 firm (with Is = 0). As a result, morefirms would find it optimal to buy private substitutes.
4 A mean-preserving spread implies a higher q and a lower q. Note that a firm with n = k is"insured" against the bad outcome (q), but will take advantage of the good outcome (q).
10

returns. When a firm makes an irreversible investment it gives up its option to
wait. In this paper we have implicitly assumed away the option-to-wait incentive,
since the firm is presumed to always invest in period 1. However, we end up with
a similar result since firms have the opportunity to install its own complementary
capital, thereby receiving an option value on potential future returns.
The effect of a mean-preserving spread can be illustrated graphically. Figure
4 plots the relationship between investment rates and expected quality of the
publicly provided complementary capital for two types of firms:
Type 1. a firm facing an uncertain q with high variance;
Type 2. a firm facing an uncertain q with low variance.
If the firms expect qe to be larger than q' but smaller than q", only the firm
facing high variance will choose to buy insurance by investing in private substitute,
at the cost of less productive capital installed. Thus, if the expected quality of
public capital is sufficiently good, a firm facing low variance might choose not buy
private substitutes and to invest more in productive capacity.
4. Testing the model
4.1. Empirical specification
In this section, we test the implication of the model on a sample of 171 Ugandan
establishments. The two key equations in the model are the investment functions
(3.5) and (3.6). FRom (3.5) and (3.6) it follows that for firms with installed
complementary capital, investment should be independent of qe (or q), while for
firms that lack complementary capital, investment should be a negative function
of qe. Moreover, complementary capital crowds out private investment. Provided
11

that the quality of public capital is sufficiently good, a firm that installs private
substitutes might even invest less than a firm that does not (as illustrated in figure
4).
To estimate equations (3.5) and (3.6) we make linear approximations of Io(.)
and I,(.), and replace the unobserved qe with a proxy of realized q, plus a forecast
error, 6. Nesting equations (3.5) and (3.6) then yields a testable model
a ao + a7ri + a.p,3 + aeei + adpt + adpiq + a!qi + i (4.1)
where pi is a dummy variable taking the value 1 if firm i has invested in comple-
mentary public capital and 0 otherwise.
4.2. Data
The data used to estimate equation (4.1) comes from the Ugandan Industrial
Enterprise Survey (Reinikka and Svensson, 1999). The survey was initiated by the
World Bank primarily to collect data on the constraints facing private enterprises
in Uganda, and it was implemented during January-June 1998. A total of 243
firms were interviewed in 5 locations, in 14 different subindustries (three-digit
ISIC). We were unable to collect detailed cost and sales or investment data for all
firms. Thus we ended up with a smaller sample of 171 firms.
The dependent variable, the investment rate, is measured as investment in
machinery and equipment in 1997 excluding potential investment in generators,
as a share of the previous period's capital stock, inv. As a proxy for pi, com-
plementary public capital, we use installed electric power generators (generator).
This is a binary variable taking the value 1 if the firm reported that it owned a
generator at the end of the sample period, and 0 otherwise. A logical proxy for q
12

is then the reported number of days in 1997 that the firm did not receive power
from the public grid (lostdays).
Retained earnings, el is proxied by profits, measured as sales less operating
costs and interest payments (profit), The unobserved parameters r' and Bi3 are
proxied by total employment (size) and age (age). The presumption is that larger
and more established firms are more likely to have access to lower cost capital
(external finance). The empirical model is hence
inv' = a x + cadgeneratoe + aqlostdays' + adqgenerator t * lostdays' + s' (4.2)
where xi = [age', sizei, profit']. To minimize heteroscedasticity problem with
respect to size, investment and profits are scaled by the inverse of the end of the
previous period capital stock.
4.3. Results
Before proceeding to the results it is useful to take an initial look at some of the
data. Table 1 reports summary statistics for the 171 firm sample. 40 percent of
the firms owned a generator by the end of the sample period. The size of the
generator varied greatly, with a mean of roughly 270 KVA [median 140 KVAI and
a standard deviation of 550 KVA, and is highly correlated with the size of the
firm. The simple correlation between employment size and owning a generator is
0.37.
As depicted in table 2, firms with installed generators typically are larger, and
reported more days in 1997 without power from the public grid. Both results are
in accordance with the model. A fall in the expected quality of public capital
increases the incentives to buy private substitutes, and due to indivisibilities in
13

t., larger firms will find it easier to match available private substitutes to their
needs. The two types of firms are similar with respect to age and profit rate (at
the median).
Table 3 reports a series of regression, corresponding to equation (4.2). As evi-
dent, all three variables of primary interest, lostdays, generator and the interactive
term; enter highly significant.5 In accordance with the model, the investment level
of firms with installed generators is quantitatively independent of q, whereas for
firms with no generator, investmnent is negatively related to number of lost days.6
Interestingly, firms that had installed complementary capital and experienced few
lost days, invested less than firms that did not have a generator. This supports
the notion that private complementary capital indeed crowds out private invest-
ment; that is, firms that install complementary capital invest less than firms that
do not, provided that the quality of public capital is sufficiently good.7 Regression
2 is illustrated in figure 5. The estimated magnitude of deficient public capital on
investment is large. For a firm that relies solely on public capital, a one-standard-
deviation deterioration in power supply (evaluated at the mean), would result in
an 11-percentage point drop in the investment rate.
To test the robustness of the results, we add additional controls to the base
specification in regressions 2-5. Regression 2 adds change in sales (Asales). Ac-
5 One extreme outlier is dropped. Including this observation increases the standard errors ongenerator and the interactive term (generator-lostdays). However, the three variables of maininterest; lostdays, generator, and generator-lostdays are still jointly significant (F-statistic onthe joint hypothesis of zero coefficients is 3.37).
6We cannot reject the null-hypothesis that aq - adq = 0. The F-statistic is 0.21 with p-value0.65.
7 Note that there is not only a fixed cost of investing in private complementary capital, butthat there are also additional maintenance and operating costs. As noted in footnote 2, the datareveals it costs three times more to own and operate a generator for power than to by powerfrom the public grid.
14

cording to a traditional accelerator model, investment is positively related to
demand changes (see for instance Tybout, 1983). However, once we control for
profit, A sales has no significant impact. In regression 3, the base specification
is augmented with a measure of capacity utilization (capacity), and in regres-
sion 4, with the percentage of foreign ownership (foreign). As evident, neither
variable enters significantly. In all three regressions, lostdays, generator, and the
interactive term, remain highly significant.
Regression 5 adds a proxy of the firm managers' perception of the overall
quality of public capital (infrastructure services). The variable quality enters
significantly positive (at the 10 percent level) without affecting the variables of
primary interest.
As a further check on robustness of the findings we report the results of some
additional sensitivity analysis in table 4. The estimated residuals tend to be
larger for the larger firms in the sample (as measured by log of employment).
As a possible correction for this heteroscedasticity, we re-estimated the model by
weighting observations with employment. The results are shown in regressions 1
and 2 of table 4. Apart from the perception score quality, which no longer enters
significantly, the results remain similar to those reported in table 3.
In table 5 we re-estimate the model (4.2) with all variables in logs. This has
the well-known advantage that the coefficients can be interpreted as elasticities.
However, since both profit and investment can take negative values, we have to
add constants to these terms. This in turn implies that the elasticity of investment
with respect to these variables are not constant. Column 2 displays the estimated
elasticities evaluated at the mean. For a firm lacking private substitutes of com-
plementary capital, a one-percent increase in the number of days without power,
15

results in a 0.45 percent reduction in investment. As in previous regressions, we
cannot reject the hypothesis that gq - adq = 0. Thus, an increase in number of
days lost has no statistically significant effect on investment for firms with their
own generators.
5. Conclusion
The role of poor infrastructure and deficient public services in determining level
of private capital accumulation has received relatively little attention in the eco-
nomic literature, and the existing empirical evidence suggest that the effect of
public spending and investment on growth is at best ambiguous. This ambiguity
may simply be a problem of identification; more spending does not necessarily
imply more productive public capital or services. By using firm-level data on
outcomes, we overcome this identification problem. We show that poor public
capital significantly reduces productive investment by firms. The microeconomic
data also shows how firms cope with deficient public capital: when public services
are poor they can invests privately in complementary capital. However, there is
a cost: less productive capital will be installed.
The results have clear policy implications. If a substantial share of firms'
cost items is attributable to the poorly functioning public sector, which is beyond
firms' control, private supply responses to macroeconomic policy reform are likely
to remain limited without an accompanying improvement in the public sector's
performance. Thus, although stabilization and structural adjustment are neces-
sary conditions for sustainable improvement in the private sector, they may not
be sufficient to achieve sustained growth and capital accumulation.
16

References
[1] Ablo, E., and R. Reinikka, 1998, "Do budgets really matter? Evidence from publicspending on education and health in Uganda", Policy Research Working Paper1926, The World Bank.
[2] Barro, R., 1991, "Economic growth in a cross section of countries", QuarterlyJournal of Economics 106(2): 407-443.
[3] Barro, R.J., and X. Sala-i-Martin, 1995, Economic Growth, McGraw-Hill, Inc.
[4] Bigsten A., P. Collier, S. Dercon, B. Gauthier, J.W. Gunning, A. Isaksson, A.Oduro, R. Oostendorp, C. Pattillo, M. Soderbom, M. Sylvain, F. Teal, and A.Zeufack, 1999, "Investment in Africas Manufacturing Sector: A Four CountryPanel Data Analysis", Oxford Bulletin of Economics and Statistics (forthcoming).
[5] Collier P., and J. W. Gunning, 1999, "Explaining African Economic Performance",Journal of Economic Literature XXXVII (March): 64-111.
[6] Devarajan, S., V. Swaroop, and H. Zou, 1996, "The composition of public expen-diture and economic growth", Journal of Monetary Economics 37: 313-44.
[7] Dixit, A., and R.S. Pindyck, 1994, Investment under Uncertainty, Princeton, NewJersey, Princeton University Press.
[8] Easterly, W., 1997, "The Ghost of Financing Gap: How the Harrod-Domar GrowthModel Still Haunts Development Economics", Policy Research Working Paper1800, The World Bank.
[9] Easterly, W., and R. Levine, 1997, "Africa's Growth Tragedy: Policies and EthnicDivisions", Quarterly Journal of Economics 107: 1203-1250.
[10] Easterly, W., and S. Rebelo, 1993, "Fiscal policy and economic growth: an empir-ical investigation", Journal of Alonetary Economics 32(3): 417-58.
[11] Fisher, S., 1993, "The role of macroeconomic factors in growth", Journal of Mon-etary Economics 32(2): 485-512.
[12] King, R.G., and R. Levine, 1993, "Finance, entrepreneurship, and growth: Theoryand evidence", Journal of Monetary Economics 32: 513-542.
[13] Levine, R., and D. Renelt, 1992, "A sensitivity analysis of cross-country growthregressions", American Economic Review 82(4): 942-63.
17

[14] Pattillo, C., 1997, "Investment, uncertainty and irreversibility in Ghana", Pro-cessed, Oxford University.
[15] Pritchett, L., 1996, "Mind Your P's and Q's: The cost of public investment isnot the value of public capital", Policy Research Working Paper 1660, The WorldBank.
(16] Reinikka, R., and J. Svensson, 1999, "Confronting Competition: Investment Re-sponse and Constraints in Uganda". Policy Research Working Paper, forthcoming,The World Bank.
[17] Svensson, J., 1999a, "Democracy, government spending and growth", Processed,The World Bank.
[18] Svensson, J., 1999b, "Is the bad news principle for real?", Economics Letters(forthcoming).
[19] Tybout, J.R., 1983, "Credit Rationing and Investment Behavior in a DevelopingCountry", Review of Economics and Statistics 65: 598-607.
18
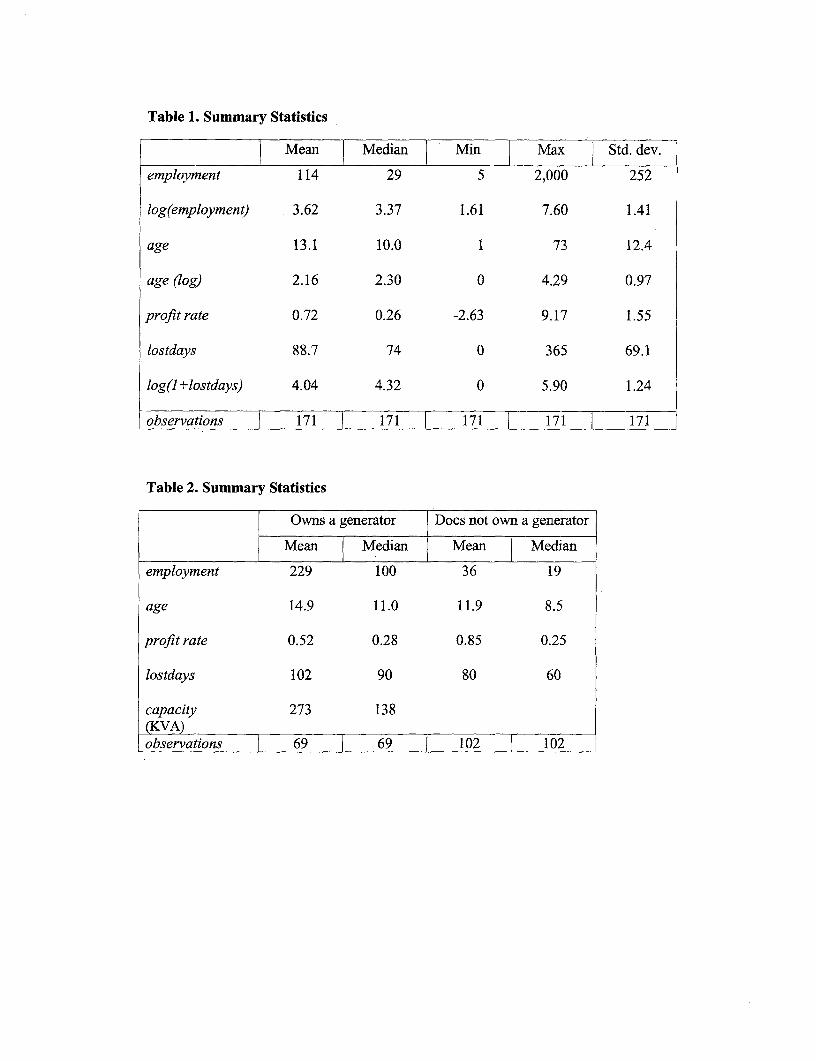
Table 1. Summary Statistics
Mean Median Min Max Std. dev.
employment 114 29 5 2,000 252
log(employment) 3.62 3.37 1.61 7.60 1.41
age 13.1 10.0 1 73 12.4
age (log) 2.16 2.30 0 4.29 0.97
profit rate 0.72 0.26 -2.63 9.17 1.55
lostdays 88.7 74 0 365 69.1
log(l +lostdays) 4.04 4.32 0 5.90 1.24
observations 171 171 171 171 171
Table 2. Summary Statistics
Owns a generator Does not own a generator
Mean Median Mean Median
employment 229 100 36 19
age 14.9 11.0 11.9 8.5
profit rate 0.52 0.28 0.85 0.25
lostdays 102 90 80 60
capacity 273 138
observations 69 69 102 102

Table 3. Investment Regressions(i) u(ii)(iv)
Equation (1) (2) (3) (4) (5)Dependent variable inv inv inv inv inv
constant .407*** .386*** .398*** .411 .283**(.110) (.112) (.120) (.111) (.129)
profit .054* .047 .052*** .054* .052***(.014) (.015) (.014) (.014) (.014)
employment (log) 6.8E-4 -.001 -5.5E-4 .005 .004(.018) (.018) (.018) (.018) (.018)
age (log) -.041* -.037' -.040* -.044** -.042**(.021) (.021) (.022) (.022) (.021)
lostdays (log) -.073 -.068 -.076 -.074 -.069(.020) (.020) (.020) (.020) (.020)
lostdays(log) *generator .087* .081** .089** .084** .098**(.037) (.037) (.037) (.037) (.037)
generator -.329** -.301* -.336** -.311* -.379**(.159) (.161) (.161) (.160) (.161)
Asales .021(.017)
capacity 4.3E-4(.001)
foreign -5.3E-4(5.7E-4)
quality .049*(.026)
F-statistic(v) 4.51 3.88 4.65 4.59 4.22(.005) (.010) (.004) (.004) (.007)
AdjustedR R.15 .15 .14 .15 .16Observations 170 170 168 170 169
Note: (i) dependent variable is investment in machinery in equipment to previous period's capital stock;(ii) OLS regressions; (iii) standard errors in parenthesis; (iv) *** (**) [*J denotes significance at the 1,5, and 10 percent level; (v) F-test the joint hypothesis that the coefficients on lostdays,lostdays*generator, generator are zero, with p-values in parentheses.

Table 4. Investment Regressions(i)>(ii)0(iii)O(iv)
Equation (1) (2)Dependent variable inv inv
constant .353 .346*(.108) (.121)
profit .037*** .037(.012) (.013)
employment (log) .004 .004(.015) (.015)
age (log) -.050 -.050(.018) (.018)
lostdays (log) -.052** -.051 **(.021) (.021)
lostdays(log) *generator .074* .074**(.030) (.031)
generator -.301*' -.304**(.130) (.132)
quality .003(.023)
F-statistic(V) 2.44 2.47(.066) (.064)
Adjusted R .13 .13Observations 170 169
Nate: (i) dependent variable is investment in machinery inequipment to previous period's capital stock; (ii) WLSregressions with employment as weight; (iii) standard errors inparenthesis; (iv) *** (**) [*] denotes significance at the 1, 5,and 10 percent level; (v) F-test the joint hypothesis that thecoefficients on lostdays, lostdays*generator, generator are zero,with p-values in parentheses.

Table 5. Investment Regressions(i),(1i)((iii),(iV)I(v)
Equation (1) (2)Dependent variable log(l +inv) % change
constant .067(.082)
log(3+profit) .134*** 0.34(.035)
log(employment) .005 0.06(.010)
age (log) -.030* 0.40(.013)
lostdays (log) -.034* 0.45(.012)
lostdays(log) *generator .049** 0.64(.022)
generator -.185(.094)
F-statistic(v') 2.90(.036)
Adjusted R2 .121Observations 170 170
Note: (i) dependent variable is the logarithm of I + investment inmachinery in equipment to previous period's capital stock; (ii) OLSregression with employment as weight; (iii) standard errors inparenthesis; (iv) *** (**) [*] denotes significance at the 1, 5, and 10percent level; (v) percentage change is calculated as(dinvlinv)/(dxlx)=[(1+inv)linv]*[x/(a+x)I where x is the mean of theexplanatory variable and a is relevant constant; (vi) F-test the jointhypothesis that the coefficients on lostdays, lostdays*generator,generator are zero, with p-values in parentheses.

Figure 1: Major Constraints to hivestment
1 1.5 2 2.5 3 3.5 4
Poor utility services and ____________________ ____________
high prces
High taxes and poor taxadministration
High interest rates andlack of finance
Corruption
Cost of raw materials
1 = no problem, 4 major problem
Note: The managers were asked to rank 24 potential bottlenecks. Some of these were close in bothranking and interpretation (poor utility service and high utility prices; high taxes and poor taxadministration; high interest rates and lack of access to finance), and were therefore combined.Source: Reinikka and Svensson, 1999.
Figure 2: Distribution of Firms According to Number of Days Without Power
# firms
70 2
60 - 1i:
50H
40
20j
10
0 ~~~~~~~~~~~~~~~~~~~~#days without power
0-30 31-60 61-90 90-120 121-150 150-180 >180
Source: Authors' calculations

Figure 3. Effect of Poor Infrastructure Quality on Investment Rate
Investment rate
0.48
0.43 -
0.38 - c 3
0.33 \
0.28
0.23-
0.18
0.13
0.08-
o 0 0 s i mat i n 0 a 0 Q 0 C C> 0 e
Source: Model simulation
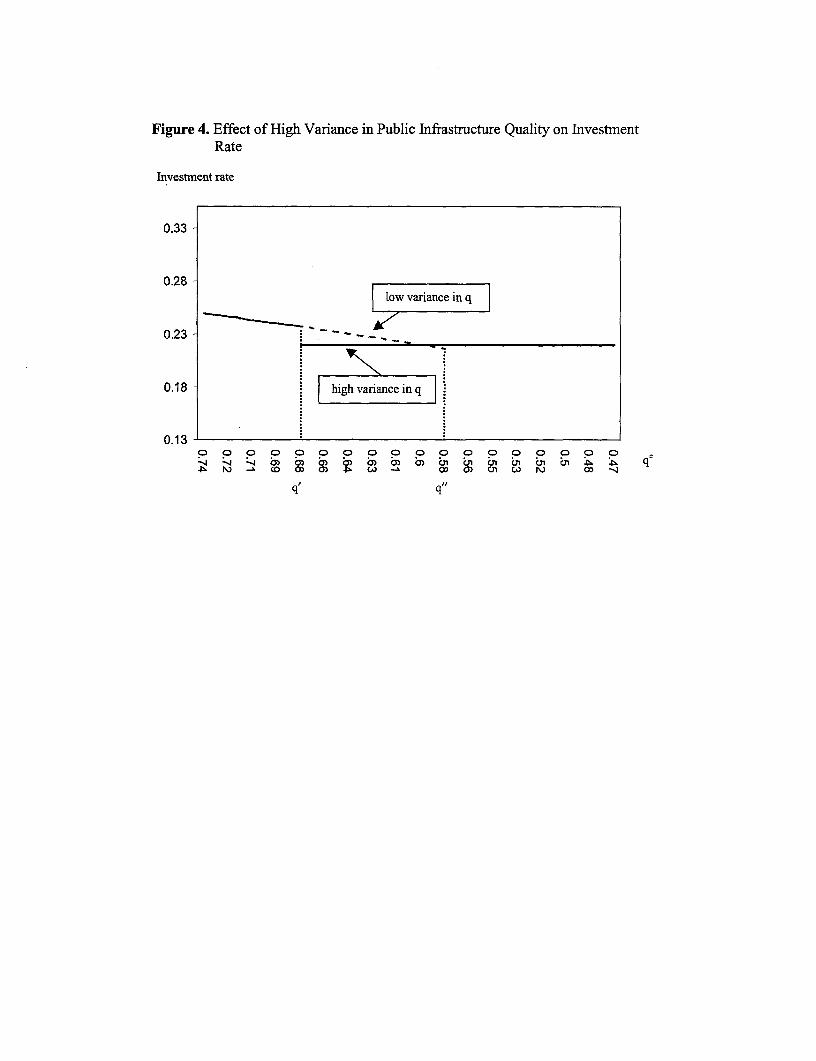
Figure 4. Effect of High Variance in Public Infrastructure Quality on InvestmentRate
Investment rate
0.33
0.28|low varance in q
0.23 -
0.18 high variance in q
0.13
1N) - (0 CO ao 1) . ) -\ co 0) 0n co f3 0q -I
qt qt

Figure 5. Investment Rates of Ugandan Firms as a Function of Poor Electricity Service
Investment rate
0.25 -
0.20 \ | no generator |
0.10
0.05
0.00
6 15 24 33 42 51 60 69 78 87 96 105114123132 #lostdays
Source: Estimated investment rates based on regression 1, table 3; with all control variables evaluated atthe mean.


Policy Research Working Paper Seoies
tContactTitle Author Date for paper
WPS2240 The Effects of Land Registration on Frank F. K. Byamugisha November 1999 5. Ge3sFinancial Development and Economic 37846Growth: A Theoretical and ConceptualFramework
WPS2241 How Land Registration Affects Frank F. K. Byamugisha November 1999 E. GeoosFinanciai Development and Economic 37846Growth in Thailand
WPS2242 Confronting Competition: Investment Ritva Reinikka Noverrier 1999 H. Sladovic:Response and Constraints in Uganda Jakob Svensson 37698
WPS2243 Designing Pro-Poor Water and Kristin Komives November 1999 M. SaleriSewer Concessions: Early Lessons 37157from Boiivia
WPS2244 True World Income Distribution, 1988 Branko Milanovic Novemoer 1999 P. Saderand 1993: First Calculations, Based 33902on Household Surveys Alone
WPS2245 Opportunities for Improving Susmita Dasgupta November 1999 Y. D'SouzeEnvironmental Compliance in Mexico 31449
WPS2246 Infrastructure's Contribution to David Canning Novermber 1999 H. Sladov;cnAggregate Output 37698
WPS2247 Does Deposit Insurance Increase As11 Demirguc-Kunt November 1999 K. LabrieBanking System Stability? Enrica Detragiache 31001
An Empirical Investigation
WPS2248 Privatization and Reguiation of Antonio Estache November 1999 G. Chenet-Smith
Transport Infrastructure in the 363701990s: Successes ... and Bugs toFix for the Next Millennium
WPS2249 Argentina's Transport Privatization Antonio Estache November 1999 G. Chenet-Srnrithand Re-Regulation: Ups and Downs Jose C. Carbajo 3'-'370of a Daring Decade-Long Experience Gines de Rus
WPS2250 Universal Service Obligations in Omar Chisari November 1999 G. Chene -; Utility Concession Contracts and Antonio Estache 386370the Needs of the Poor in Argentina'sPrivatizations
WPS2251 Will the Euro Create a Bonanza Daniel Cohen November 1999 He. Varge,for Africa? Nicoiai Kristensen 327871
Dorte Verner

Policy Research Working Paper Series
ContactTitle Author Date for paper
WPS2252 Productivity Growth, Capital Ejaz Ghani December 1999 N. MensahAccumulation, and the Banking Vivek Suri 80546Sector: Some Lessons from Malaysia
WPS2253 Revenue Recycling and the Welfare Ian W. H. Parry December 1999 R. YazigiEffects of Road Pricing Antonio Miguel R. Bento 37176
WPS2254 Does "Grease Money" Speed Up Daniel Kaufmann December 1999 H. Sladovichthe Wheels of Commerce? Shang-Jin Wei 37698
WPS2255 Risk and Efficiency in East Asian Luc Laeven December 1999 R. VoBanks 33722
WPS2256 Geographical Disadvantage: Anthony J. Venables December 1999 L. TabadaA Heckscher-Ohlin-von Thunen Nuno Limao 36896Model of International Specialization
WPS2257 Infrastructure, Geographical Nuno Limao December 1999 L. TabadaDisadvantage, and Transport Costs Anthony J. Venables 36896
WPS2258 Market Access Bargaining in the J. Michael Finger December 1999 L. TabadaUruguay Round: Rigid or Relaxed Ulrich Reincke 36896Reciprocity? Adriana Castro
WPS2259 Predicting Currency Fluctuations Daniel Kaufmann December 1999 E. Khineand Crises: Do Resident Firms Gil Mehrez 37471Have an Informational Advantage? Sergio Schmukler
WPS2260 Regional Integration Agreements: Anthony J. Venables December 1999 L. TabadaA Force for Convergence or 36896Divergence?
WPS2261 Is Knowledge Sharecl within Kaushik Basu December 1999 M. MasonHouseholds? Ambar Narayan 30809
Martin Ravallion