how health systems can improve value in cancer care
TRANSCRIPT

Cancer is becoming the most expensive disease for many health
systems. A pathway-based approach can help reduce variability
in care delivery, improve outcomes, and control costs.
How health systems can improve value in cancer care
Health International is published by McKinsey’s Healthcare Systems and Services Practice. Copyright © 2012. McKinsey & Company.

39
to specific therapies. Instead, they often reflect differences in how treatment is delivered at individual cancer centers.5
These findings suggest that health systems have an important opportunity to improve cancer outcomes—in many cases, without a sharp increase in costs. By using care pathways to map local variations in care delivery and out-comes, and to compare spending against those outcomes, health systems can find ways to im-prove adherence to best practices and redirect spending to improve value. The approach must be holistic, however. Although some health sys-tems have been using pathway-based practices in oncology for some time now, their efforts have focused primarily on clinical settings. Few have developed system-wide, pathway-based approaches that can be utilized across a wider range of settings.
This article describes how health systems can use a pathway-based approach extending from prevention to end-of-life care to improve value in cancer care. Although our recommendations are designed for health systems in developed countries, they may also be useful for middle-income countries that need to address rapidly rising cancer rates.
Why cancer rates are rising
In almost all countries, the incidence of cancer is increasing significantly.6 At present, one of every three people in developed countries will have some form of cancer in their lifetime.3 Overall cancer incidence in the developing world remains lower than it is in the developed world but is rising more rapidly. Experts esti-mate that by 2030, cancer incidence will rise by 65 percent in developed countries, 80 percent in middle-income countries, and 100 percent in the world’s poorest countries.6
Over the past several decades, dis cover ies in molecular biology have significantly improved cancer care. Biomarkers based on mutation status or over-expression of specific genes are now commonly used to guide treatment, and drugs targeting these biomarkers have helped extend the lives of many patients.1,2 Neverthe-less, cancer incidence continues to rise in both developed and developing countries, and cancer has become the leading cause of death in many parts of the world. About eight million people around the world currently die of cancer each year—one person every four seconds.3 And at any given time, several times that many patients are ill with cancer and require care.
Considerable debate has therefore arisen over the affordability of cancer care, especially in light of the efforts many countries are making to control or reduce healthcare spending. In fact, cancer is becoming the most expensive disease on many payors’ books.3 In the European Union alone, payors spend about €49 billion annually on health services for cancer patients.4 (If indirect costs, such as lost productivity, are included, cancer’s annual economic toll in the European Union is about €124 billion.4)
Despite the high spending, many health sys-tems fall short of providing consistent, high-quality cancer care. There are wide variations (both between and within countries) in the care delivered and outcomes achieved. Similarly, there are wide variations in the amounts spent on cancer care, but higher spending does not always correlate with better outcomes. Even within a single country, survival rates for some cancers can vary more than twofold. In many cases, the differences in survival rates cannot be entirely explained by differences in patient characteristics (for example, age, co-morbidi-ties, stage at detection) or by differential access
39
Lisa Åberg;
Björn Albrecht,
PhD; and Thomas
Rudolph, MD
1 Kris MG et al (eds). Accelerat-ing Progress Against Cancer. American Society for Clinical Oncology. 2011.
2 Coleman MP et al. Cancer survival in Australia, Canada, Denmark, Norway, Sweden, and the UK, 1995-2007 (the International Cancer Bench-marking Partnership): an analysis of population-based cancer registry data. Lancet. 2011;377(9760):127-138.
3 Jemal A et al. Global cancer statistics. CA Cancer J Clin. 2011;61:69-90.
4 Luengo-Frenandez R. Presen-tation at the European Society of Medical Oncology annual meeting. 2010.
5 Cancer Reform Strategy— Second Annual Report. UK Department of Health. 2009.
6 Bray F et al. Global cancer transitions according to the Human Development Index (2008-2030): a population-based study. Lancet Oncology. 2012;13(8):790-801.

40 Health International 2012 Number 12
tobacco products, coupled with increased exposure to air pollution, is causing the number of new patients with lung and many other cancers to skyrocket.3
The cost of improved survival
Less than a decade ago, no drugs were available to treat metastatic kidney cancer; today, mul-tiple treatment options exist, including targeted agents and immunotherapeutics. Similar advances in the treatment of many other forms of cancer have also occurred, made possible by a range of discoveries about cancer pathology.
The advances in diagnosis and treatment have improved survival rates for many forms of cancer (Exhibit 1). However, the survival improvements have often come at a high price. The yearly cost
The primary factors driving the overall in-crease in incidence are population growth and lengthening life expectancy. However, other factors are also involved. Greater public awareness of cancer has increased the number of patients who undergo screening. Methods to screen for and diagnose many cancers, particularly early-stage malignancies, have become more sophisticated. These changes have led to a notable rise in diagnosis rates.
In addition, some experts have suggested that the global trend toward unhealthy diets, lack of physical activity, and other related risk factors may be causing an increase in the incidence of some cancers—especially kidney, breast (in women), and colon cancer (in men).7 In developing countries, the growing use of
7 World Cancer Report 2008. World Health Organization. 2008.
Exhibit 1 Survival rates have increased for many cancer types
1995–99 2000–02 2005–07
Ovarian cancer
1995–99 2000–02 2005–07
Breast cancer (women)
1995–99 2000–02 2005–07
Lung cancer
1995–99 2000–02 2005–07
70
60
50
40
30
40
30
20
10
0
100
90
80
70
60
60
50
40
30
20
Colorectal cancer
*The relative survival rate takes into account the probability of survival if the patients in question did not have cancer. Thus, it provides a truer picture of cancer’s impact on patients than the observed survival rate does.Source: Coleman et al. Lancet. 2011
5-year relative survival*, %
Health International #12 December 2012 — Oncology
Exhibit 2 of 8
Australianregistries
Canadianregistries
Denmark
Norway
Swedish regions
UK registries
41How health systems can improve value in cancer care
Given projected increases of this magnitude, it becomes clear why cancer care is becoming the largest single cost for many health systems. It is hardly surprising that these systems are questioning—because of cost-effectiveness concerns or budget-impact considerations—whether they can afford some of the new treatments. However, the attention paid to these treatments’ cost may be deflecting attention from two other questions health systems should be asking: How well are they delivering cancer care? And is the money they are spending on cancer care always producing the optimal results?
How well is cancer care being delivered?
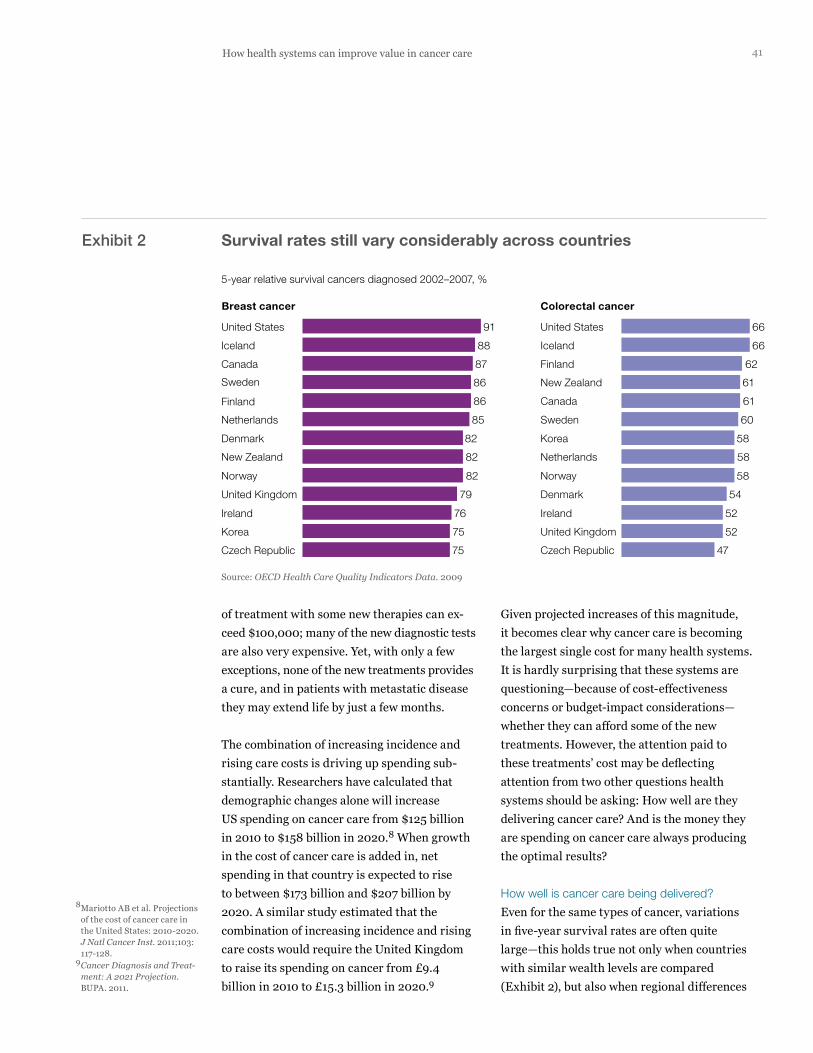
Even for the same types of cancer, variations in five-year survival rates are often quite large—this holds true not only when countries with similar wealth levels are compared (Exhibit 2), but also when regional differences
of treatment with some new therapies can ex-ceed $100,000; many of the new diagnostic tests are also very expensive. Yet, with only a few exceptions, none of the new treatments provides a cure, and in patients with metastatic disease they may extend life by just a few months.
The combination of increasing incidence and rising care costs is driving up spending sub-stantially. Researchers have calculated that demographic changes alone will increase US spending on cancer care from $125 billion in 2010 to $158 billion in 2020.8 When growth in the cost of cancer care is added in, net spending in that country is expected to rise to between $173 billion and $207 billion by 2020. A similar study estimated that the combination of increasing incidence and rising care costs would require the United Kingdom to raise its spending on cancer from £9.4 billion in 2010 to £15.3 billion in 2020.9
8 Mariotto AB et al. Projections of the cost of cancer care in the United States: 2010-2020. J Natl Cancer Inst. 2011;103: 117-128.
9 Cancer Diagnosis and Treat-ment: A 2021 Projection. BUPA. 2011.
Exhibit 2 Survival rates still vary considerably across countries
5-year relative survival cancers diagnosed 2002–2007, %
75
75
76
79
82
82
82
85
86
86
87
88
91
47
52
52
54
58
58
58
60
61
61
62
66
66
Czech Republic
Ireland
United Kingdom
Norway
Netherlands
Korea
Sweden
Canada
New Zealand
Finland
Iceland
United States
Denmark
Canada
Iceland
United States
Finland
Netherlands
Sweden
Denmark
New Zealand
Norway
United Kingdom
Ireland
Korea
Czech Republic
Breast cancer Colorectal cancer
Source: OECD Health Care Quality Indicators Data. 2009
Health International #12 December 2012 — Oncology
Exhibit 2 of 8

42 Health International 2012 Number 12
are given).2 A large body of evidence has shown that many cancer patients do not receive best-practice care. Failure to observe best practices remains a problem even for malignancies that receive considerable public attention, such as breast cancer. One European study showed, for example, that the percentage of women who received best-practice treatment for early-stage breast cancer ranged from 9 percent to 78 per-cent, depending on the country (Exhibit 4).12
This type of variation in care delivery is not just an international phenomenon; it occurs within countries as well. In Sweden, for exam-ple, the treatment offered to men with prostate cancer differs widely from hospital to hospital (Exhibit 5).13
within countries are mapped (Exhibit 3).5,10,11 In England, for example, there is a greater than twofold difference among regions in one-year lung cancer survival rates.5
A number of factors help explain the variations in survival rates. Differences in patient character-istics (for example, socioeconomic status, risk factor exposures) clearly play a role, as do the difficult choices health systems and individual payors make about which services and therapies they can afford to pay for. In many cases, how-ever, the variations also appear to result from differences in care quality (for example, how early the diagnosis is made, what diagnostic methods are used, how staging is performed, how soon treatment is started, and what sorts of treatments
Exhibit 3 Even within countries, survival rates often vary significantly
44474850
5253535455565656565757585959
6162
67
+52% 0 2 4 6 8 10 12 14 16 18 20 22 24 26 28 30 32 34 36
2.3x
5-year relative survival after colon cancerin Sweden, by county council
1-year relative survival after lung cancerin England, by primary care trust
Source: Cancer Register and the Cause of Death Register, Swedish National Board of Health and Welfare;Cancer Reform Strategy: Second Annual Report (England).
Health International #12 December 2012 — Oncology
Exhibit 3 of 8
10 OECD Health Care Quality Indicators Data. 2009.
11 Cancer Register and the Cause of Death Register, National Board of Health and Welfare, Sweden.
12 Allemani C et al. Variation in ‘standard care’ for breast cancer across Europe: a EUROCARE-3 high-resolution study. Eur J Cancer. 2010;46:1528-1536.
13 HSN-f Valdatabas (Stockholm inpatient record system).

43How health systems can improve value in cancer care
Exhibit 4 Many countries do not consistently offer the highest standard of care
Health International #12 December 2012 — Oncology
Exhibit 4 of 8
Early-stage cases receiving breast-conserving surgery plus radiotherapy (BCS + RT), %
Estonia
Poland
Denmark
Slovakia
US
Iceland
Sweden
Spain
Italy
Slovenia
Finland
Netherlands
France
Source: Allemani et al. Eur J Cancer. 2010
22
34
39
39
42
45
54
55
63
64
73
84
919
16
27
36
37
45
46
55
58
61
61
66
78
BCS + RT Other surgery
Exhibit 5 Cancer treatment often varies between hospitals, even in the same city
Hospital D
Hospital C
Hospital B
Hospital A
Source: HSN-f Valdatabas (Stockholm inpatient record system)
Chemotherapy Radiotherapy Brachytherapy Major pelvic surgery
Other surgical treatments
Prostatectomy Transurethral resection
Treatments given to prostate cancer patients in Stockholm who see urologist during their first specialist visit, %
4
5
7
9
23
7
4
4
243 3 21 13 13
3 24 59 1 2
1 0 78 2 6
4 7 73 0
Health International #12 December 2012 — Oncology
Exhibit 5 of 8

44 Health International 2012 Number 12
often have very different overall survival rates (Exhibit 6).15 Even the United States does not obtain uniformly strong outcomes through its investments in cancer care. Although the coun-try does achieve above-average survival rates for breast and colorectal cancer, it scores below the OECD average for survival after cervical and lung cancer.16,17
Of course, overall cancer spending could mask important differences among countries in terms of where they have chosen to focus their invest-ments. A country that has spent heavily to improve prostate cancer survival, for example, could have markedly reduced its mortality rate from that disease but not have seen changes in the mortality rates for other forms of cancer.
However, a close look at spending levels for just one malignancy (colorectal cancer) supports
Considerable improvement in one- and five-year survival rates could be achieved if health systems could reduce inappropriate variations in care delivery and ensure that as many cancer patients as possible receive best-practice care. A recent study calculated, for example, that more than 10,000 deaths could be prevented each year if cancer survival rates in the United Kingdom could be improved to match the best rates achieved elsewhere in Europe.14
Is cancer spending producing optimal results?
Variations in care and outcomes would be more understandable if they reflected differences in funding availability. We and others have found, however, that the correlation between what countries and regions spend on cancer care and the outcomes they achieve is far from perfect. In Europe, for example, countries with very similar per-capita spending on cancer care
Exhibit 6 In Europe, cancer spending and outcomes vary considerably
80
Cancer care costs, USD PPP per capita
44
46
48
50
52
54
56
58
60
62
64
90 100 110 120 130 140 150 160 170 180 190 200 210 220
Sweden
Switzerland
NorwayAustria
Belgium
GermanyItaly
Denmark2
UK
SpainNetherlands
Finland
Survival rate
All diagnoses, both sexes1
15-year average; adjusted survival rates for patients diagnosed with cancer 2000-2002.2Excluding skin cancer.Sources: OECD Health Data. 2007; Verdecchia A et al. Lancet Oncol. 2007; Kraeft I Danmark: en Opslagsbok. 2006
Health International #12 December 2012 — Oncology
Exhibit 6 of 8
14 Abdel-Rahmen M et al. What if cancer survival in Britain were the same as in Europe: how many deaths are avoidable? Br J Cancer. 2009;101:S115-S124.
15 Sullivan R et al. Delivering affordable cancer care in high-income countries. Lancet Oncol. 2011;12:933-980.
16 Squires DA. Explaining high health care spending in the United States: an international comparison of supply, utili-zation, prices, and quality. Issue Brief (Commonw Fund). 2012;10:1-14.
17 Organisation for Economic Cooperation and Development. OECD Health Data 2011.

45How health systems can improve value in cancer care
By using a care pathway approach, a health system (or even individual public or private payor) can begin to translate its cancer strategy into a more concrete plan of action. Health sys-tems around the world are using care pathways to improve outcomes for patients with diabetes, coronary heart disease, and a range of other conditions.19 Similar care pathways are being increasingly used to improve the delivery of cancer care.20 As noted earlier, however, most of the oncology pathways implemented to date have focused on the clinical arena and have not included prevention or end-of-life services provided in different care settings.
A more holistic pathway approach enables health systems to identify and eliminate the factors causing variations in care delivery (thereby increasing adherence with interna-tional best practices) and to redirect funding to the interventions that have the greatest impact on outcomes. We believe these steps
the conclusion that there is often little asso-ciation between spending and outcomes. Data from eight countries show that countries with comparable spending levels can have very dif-ferent survival rates, and that countries with similar survival rates can have very different spending levels (Exhibit 7).18 It seems reason-able to conclude, therefore, that many countries are not deriving the value they should from their investments in cancer care.
What health systems can do
Most health systems recognize the need to improve cancer outcomes and have established cancer strategies to help them do that. (For a quick look at some of these strategies, see the sidebar on p. 46.) The strategies share many important features; for example, they are patient-centric and put considerable focus on prevention and rehabilitation. They vary markedly, however, in terms of their ambitions and specificity.
15 25 30 35 45 50 175170 180105 40 55 60 65
Australia
FinlandFrance
Germany
Netherlands
Spain*
Sweden
England
20
55
60
6261
59
585756
54
00
Colorectal cancer (CRC) mortality rates in 8 OECD countries
5-year CRC survival
Spending per CRC incidence, euros (thousands)
*Data for Spain includes only public, not private, spending.Source: Kanavos P, Schurer W. Eur J Health Econ. 2010
Health International #12 December 2012 — Oncology
Exhibit 7 of 8
Exhibit 7 Correlation between spending and outcomes in colorectal cancer is also weak
18 Kanavos P, Schurer W. The dynamics of colorectal cancer management in 17 countries. Eur J Health Econ. 2010;10 (Suppl 1):S115-S129.
19 Cavlan O et al. Using care path-ways to improve health systems. Health Int. 2011;11:6-17.
20 Feinberg BA et al. Implemen-tation of cancer clinical care pathways: a successful model of collaboration between payers and providers. J Oncol Pract. 2012;8(Suppl 3):e38s-e43s.

46 Health International 2012 Number 12
An overview of select regional and national cancer strategies
Country
England Improving Outcomes: A Strategy for Cancer (2011)
Ireland A Strategy for Cancer Control in Ireland (2006)
Scotland Better Cancer Care: An Action Plan (2008)
France Cancer Plan 2009-2013 (2009)
Qatar National Cancer Strategy: The Path to Excellence (2011)
Victoria, Australia Victoria’s Cancer Action Plan 2008-2011 (2008)
Quantified top-level goals
Achieve cancer survival rates at European average to save 5,000 lives
“…have a system of cancer control to reduce cancer incidence, morbidity, and mortality rates relative to other EU15 countries by 2015”
None highlighted
Six “flagship” measures, including:
• Increase participation in organized screening programs by 15 percent
• Ensure that 80 percent of patients benefit from at least one individualized care plan
• Ensure that 50 percent of patients benefit from at least one post-cancer plan
None quantified; to enable future performance tracking, recommends that baselines be established for survival, incidence, prevalence, mortality, percentage of patients treated abroad, and number of patients coming from abroad
Increase survival rates by 10 percent by 2015 to save 2,000 lives
Topical goals (select examples)
• Reduce the incidence of cancers that are preventable by lifestyle changes
• Improve access to screening for all groups
• Achieve earlier diagnosis of cancer to increase the scope for successful treatment
• Develop and maintain international alliances in support of cancer control
• Ensure that appropriate services are in place to minimize the psychosocial impact of cancer
• Ensure that patients, families, and caregivers understand fully all aspects of patients’ care and their treatment options
• Support a comprehensive program of cancer prevention research
• Consider actions that might be taken within primary care to improve uptake of the Scottish Bowel Screening Program
• Establish live links between all local electronic systems and agreed local referral guidelines
• Promote interventional research that tests the effects of changes to the environment and to individual behaviors
• Produce annual estimates of incidence and mortality on the basis of a validated methodology; produce updates of prevalence and survival every two years
• Ensure referring doctors have access to tools for training, information, and inclusion in screening programs
• Introduce a fully resourced cancer registry to record all cancer cases treated in Qatar and abroad
• Make HPV vaccine available to those families who wish it from 2013
• Ensure that patients with suspected cancer are given referrals to specialist clinics via a standardized process within 14 days (2012), 7 days (2013), and 48 hours (2015)
• Reduce major cancer risk factors in the population and maximize effective screening
• Ensure rapid translation of research into effective treatments and clinical care
• Invest in innovative treatments and technologies and sustainable integrated care systems
• Support and empower patients and their caregivers throughout their cancer journey

47How health systems can improve value in cancer care
cancer pathway should start not with screening for adenomas, but with lifestyle changes that might reduce the risk of that cancer. It should finish with palliative care at the end of life.
Primary clinical research and national/interna-tional guidelines should be used to identify the interventions to be delivered at each pathway stage, the outcomes the interventions are expected to produce, the magnitude of the outcome effect each intervention is likely to have, and the intervention’s comparative cost effectiveness. (Admittedly, the current evidence base is not always strong enough to permit comparisons of cost effectiveness.) Whenever possible, the outcomes mapped to the pathway should reflect the system’s—and patients’— ultimate goal: lower mortality and morbidity. Therefore, tumor shrinkage is a less important outcome than an increase in time to progression, progression-free survival, or overall survival. By
are feasible for most health systems to take and will enable them to unlock value.
Establish best-practice care pathways
The first step is to establish best-practice care pathways. The work required is considerable, because a separate pathway must be developed for each type of cancer (and, in many cases, for resectable versus nonresectable tumors), and each pathway must define, on a system-wide level, the best practices for prevention, clinical care delivery, and end-of-life care (Exhibit 8). A health system might therefore decide to focus on only a single cancer initially (one that is especially common in that region, for example, or one for which the system’s five-year survival rates are markedly below international averages).
The pathways should begin with prevention and continue through all stages of diagnosis and treatment. Thus, for example, the colorectal
*Detailed protocols outline all of the steps required in pathway substages A through K.
Pathway stage
Stage I Stage II Stage III Stage IV
Rectal cancer
Stage IV Stage III Stage II Stage I
Colon cancer
I
E Diagnosis and staging
A Primary prevention
BScreening and removal of adenomas (typical) C Screening and removal of adenomas
in high-risk patients
D Surveillance and risk reduction post-polypectomy
Substages*
Treatment
Primaryprevention
Diagnosisand staging
Surveillance
Health International #12 December 2012 — Oncology
Exhibit 8 of 8
H Rectal medical(e.g., pre-op chemoradiotherapy)
I Metastatic medical(e.g., chemotherapyand biologics)
J Colon medical (e.g., chemotherapy)
K Surveillance
F Surgical (rectal) G Surgical (colon)
Exhibit 8 The end-to-end pathway for colorectal cancer: an overview

48 Health International 2012 Number 12
In many cases, the comparisons can be made only at a high level. International data for cer-tain outcomes, such as five-year survival for common cancers, can be obtained fairly easily. More granular information (for example, how many patients undergo a specific screening test, at what frequency and at what site of care) is not always available. A health system with strong analytic capabilities can, however, draw useful inferences from the available outcomes data. For example, significant differences in one-year survival for a given cancer suggest that some health systems may be better at early diagnosis than others—perhaps because they screen more frequently, use more sensitive diagnostic meth-ods, or provide a higher level of reimbursement for screening. The differences in one-year sur-vival can be further compared against the dif-ferences in five-year survival to check for other potential problems. If, for example, a health sys-tem has a higher-than-average one-year survival rate but a lower-than-average five-year survival rate, it should investigate whether it is under-performing in the frequency of patient follow-up (driven, perhaps, by physician behavior or reim-bursement levels) or in the longer-term therapy protocols it uses (for example, which drugs it administers, at what doses, and in what cycles).
Similarly, data for spending on cancer care may only be available at a high level. However, the data may reveal that a health system’s investments are disproportionately high in comparison to the outcomes it is achieving, which gives the system the opportunity to investigate whether it can redirect its spending within the care pathway to obtain better results.
The types of analyses just described do not prove that a problem with care delivery exists or that money is being misspent. However, the hypotheses that can be generated from the
aggregating all this information, the health sys-tem can develop a shorter list of interventions to prioritize for deeper investigation.
In addition, the health system should calculate, as best it can, how much it is spending for each intervention. This analysis will enable the sys-tem to determine whether its funds are being allocated to the interventions that will deliver the most significant impact on outcomes.
Finally, the pathway should include the manage-ment practices the health system has in place to provide the interventions (for example, use of multidisciplinary teams and disease registries, support personnel availability, data accessibil-ity and use). Although this type of information may not always be easily available, it is impor-tant to include in the pathway, because differ-ences in management practices may help explain differences in outcomes or spending.
Compare outcomes and spending internationally
Most countries use international benchmark-ing—especially of five-year survival rates—to evaluate their cancer care delivery.2 The United Kingdom, for example, created the National Cancer Action Team to improve care delivery after it discovered that many of its outcomes were below those of other developed countries.
Thus, once a health system has completed a care pathway diagnostic for a given malignancy, it should determine how its care pathway and delivery models differ from those used in other similar health systems. In addition, it should investigate how well other systems perform along the pathway, including outcomes achieved and costs. Through our work with the International Cancer Benchmarking Partnership, we know that these types of comparisons can help health systems find ways to improve care delivery.

49How health systems can improve value in cancer care
with precancerous conditions or early-stage cancers being referred to the right types of clinicians? Are the right treatments being administered at each stage along the pathway? Are multidisciplinary care teams being used to guide care? Are the right types of follow-up sur-veillance being performed at the right intervals?
These questions should be evaluated region by region, as well as on a system-wide basis. A health system with an average rate of screening for colorectal cancer could find that some of its regions have markedly below-average screening success, whereas others have significantly above-average success.
However, the most important variables that must be analyzed on a region-by-region, as well
analyses give health systems a place to start as they further analyze their own data.
Health systems do have an opportunity to obtain more granular data about outcomes and spending if they band together to investi-gate cancer care delivery. For an example of how this can be done, see the sidebar above.
Compare outcomes and spending internally
In addition to benchmarking its performance externally, the health system should dig deeper into its data to understand how well it is per-forming on each step of the pathway and to identify the places where care delivery varies most from best practices. Among the process questions it needs to consider are: Is screening being performed appropriately? Are patients
Five health systems that want to improve the value of
the cancer care they deliver have decided to join forces
through McKinsey’s Leading Systems Network (LSN). These
systems, from Western Europe and the Asia/Pacific region,
believe that by working together, they can gain a deeper
understanding of where they are performing well (in com-
parison with best-practice guidelines), where they need to
improve, and what options they have for controlling costs.
In a dedicated 24-month “Pathway Improvement Program,”
these systems are focusing on colorectal cancer, one of
the most common cancer causes of death in developed
countries. Their goal is to jointly identify cost, quality, and
managerial opportunities for improvement in care delivery.
To support their analytic work, the systems have agreed
on a clinical evidence base derived from a robust review
of the clinical literature and vetted by international experts,
as well as a best-practice system-level pathway. They are
now in the process of extracting data from their IT systems
so that they can map to the pathway their outcomes and
spending, as well as their clinical practices and organiza-
tional management of colorectal cancer care. Once the
analytic phase is complete, the systems will support one
another in designing and implementing individually tailored
projects to improve performance.
To support the Improvement Program, LSN is helping the
systems calculate both their total spending on colorectal
cancer and their expenditures on each step in the pathway.
For example, the systems will be able to determine how
much of their funding for initial screening goes to colono-
scopy rather than fecal occult blood testing, and what
percentage of their expenditures for chemotherapeutics
and biologics is being spent on nonrecommended uses.
Results from the Improvement Program will not be avail-
able for several months. The systems are confident,
though, that their joint effort will enable them to improve
care delivery and better control what they are spending
on colorectal cancer care. They also believe that the
lessons they learn through this effort can be extended
to other areas of care delivery.
Digging deep into
cancer pathways:
a case example

50 Health International 2012 Number 12
For example, a number of different factors can contribute to low colorectal cancer screening rates, including poor cultural adoption of screening, lower-than-average frequency of screening, narrower-than-average distribution of screening kits (which can occur, for example, if screening starts at age 65 rather than age 55), lower-than-average return rates for the kits, and the absence of a strong campaign to build awareness and overcome the stigma associated with screening. A health system could find that different regions are encountering different problems and thus require different solutions before screening rates can be raised.
As it undertakes this part of the investigation, it is important that the health system consider long-term as well as short-term results. For example, as diagnostic tests increase in sophis-tication, screening is coming to play an increas-ingly important role in determining outcomes in many forms of cancer. However, the high cost of the new tests must be paid for now, whereas the improved outcomes may not be seen for several years. In some cases (for ex-ample, bladder cancer), evidence is emerging that new diagnostic methods may reduce re currence rates and lower long-term treatment costs.21 Although this remains to be proved, it reminds health systems that in making coverage decisions, they must weigh acute budget impact against longer-term outcomes and cost effectiveness.
Develop strategies to address
the most significant problems
Once the factors that are most likely to be impairing outcomes have been identified, the health system can take steps to address them. There is no one-size-fits-all answer in this regard; the actions taken will depend on the tumor type the health system is focusing
as a system-wide, basis are not process metrics but outcome metrics. As we have shown, out-comes often vary significantly within the same country. Among the variables the health system should monitor carefully are incidence rates, the stages at which the initial diagnosis was made, 30-day postsurgical mortality, one-year and five-year survival, and death rates.
Identify the factors most likely
to be impairing outcomes
By aggregating the information it has gleaned in the previous three steps, the health system can determine where it has the biggest variations in care delivery and which factors are likely to be having the strongest negative effect on patient out-comes and/or cost of care. This part of the in ves-tigation requires particularly careful analysis to ensure that root causes are accurately identified.
21 Sievert KD et al. Economic aspects of bladder cancer: what are the benefits and costs? World J Urol. 2009;27:295-300.

51How health systems can improve value in cancer care
In centers of excellence, an adequate number of procedures are performed annually, and multi-disciplinary teams ensure that all patients re-ceive appropriate cross-functional care. Many studies have demonstrated that these teams improve outcomes.23
Another option health systems can consider is closer collaboration between cancer centers and community hospitals, perhaps through virtual consultations. Some of the larger US cancer centers are exploring the use of virtual approaches to improve communication between their experts and clinicians at com-munity centers and thus maximize timely knowledge transfer.
. . .Given the toll cancer already takes on public health and healthcare financing, all health systems should take steps to improve the value they deliver in cancer care. Doing so is far from easy, but neither is it impossible. By prioritizing the interventions they want to focus on, deter-mining where best practices are not being fol-lowed (and why), and then taking steps to ad-dress the root causes of the problems identified, health systems can ensure that as many patients as possible receive high-quality care and there-by save lives. By reducing variations in cancer care delivery, many health systems will also find that they can better control costs. •
Lisa Åberg, a principal in McKinsey’s Stockholm
office, has worked on improving service operations
in hospitals. Björn Albrecht, PhD, a principal in
its London office, leads McKinsey’s oncology efforts
globally; he works with health systems, payors, provid-
ers, and pharmaceutical companies on a wide range
of projects related to cancer. Thomas Rudolph,
MD, a principal in its Stuttgart office, concentrates
on strategic issues for pharmaceutical companies.
on, the specific problems it has found, and the nature of its care delivery system.
If the primary problem is screening, for exam-ple, the health system could undertake a public education campaign to raise awareness of the symptoms of that cancer and the importance of early diagnosis. If it opts to do this, the health system must ensure that it has an adequate screening infrastructure to enable all appro-priate patients get tested. The screening infra-structure must include well-trained personnel, and the health system must make certain that its general practitioners (GPs) are up-to-date on which patients should be referred for screening when and what tests they should be sent for.
Our recent work on colorectal cancer shows that this is not as easy to accomplish as it might seem and that many systems struggle with the screening part of the pathway. Some systems, for example, have low return rates for fecal occult blood tests, and thus colorectal cancer is often not detected until its later, symptomatic stages. The systems’ colonoscopy centers must then operate above capacity to conduct confirmatory tests; the result is long wait times, faster and sometimes faulty screen-ing, mis-staging of tumors, and even subopti-mal treatment decisions.
If the primary problem appears to be bottle-necks in referral to specialists, GP education may be helpful. In this case, however, the health system should also take steps to ensure that GPs are able to refer patients to an appro-priate secondary care setting. Numerous stud-ies have suggested that centralization of cancer surgery leads to significant improvement of survival rates. (In Sweden, for example, cen-tralization has led to a 56 percent increase in the 10-year colorectal cancer survival rate.22)
22 Data obtained from Social-styrelsen and Cancerfonden in Sweden.
23 Levine RA et al. Multidisci-plinary management of colo-rectal cancer enhances access to multimodal therapy and compliance with National Comprehensive Cancer Network guidelines. Int J Colorectal Dis. 2012;27:1531-1538.