how does inflation affect different households?
TRANSCRIPT

MotivationMotivation
• Inflation has been more topical over the past year than it has been in many years
– First very high rates of inflation
– Then the lowest rates of inflation seen for over half a centuryy
• The aim of today’s lecture is to understand:
– difference between the various rates of inflation that are used
h l d i fl i d h i d ’– what exactly reported inflation measures and what it doesn’t measure
• Focus on the distribution of inflation
– The distribution of inflation matters for many purposes: not just the y p p javerage
– I show inflation has varied lately by household characteristics, e.g. tenure, income and age etc.

PlanPlan
• What is inflation?
Different inflation measures and their uses– Different inflation measures and their uses
– How is inflation calculated?
– Why has inflation fallen so much recently?
• Key results:
– Variation in inflation rates across different groupsVariation in inflation rates across different groups
– The changing distribution of inflation
– Longer-term averages
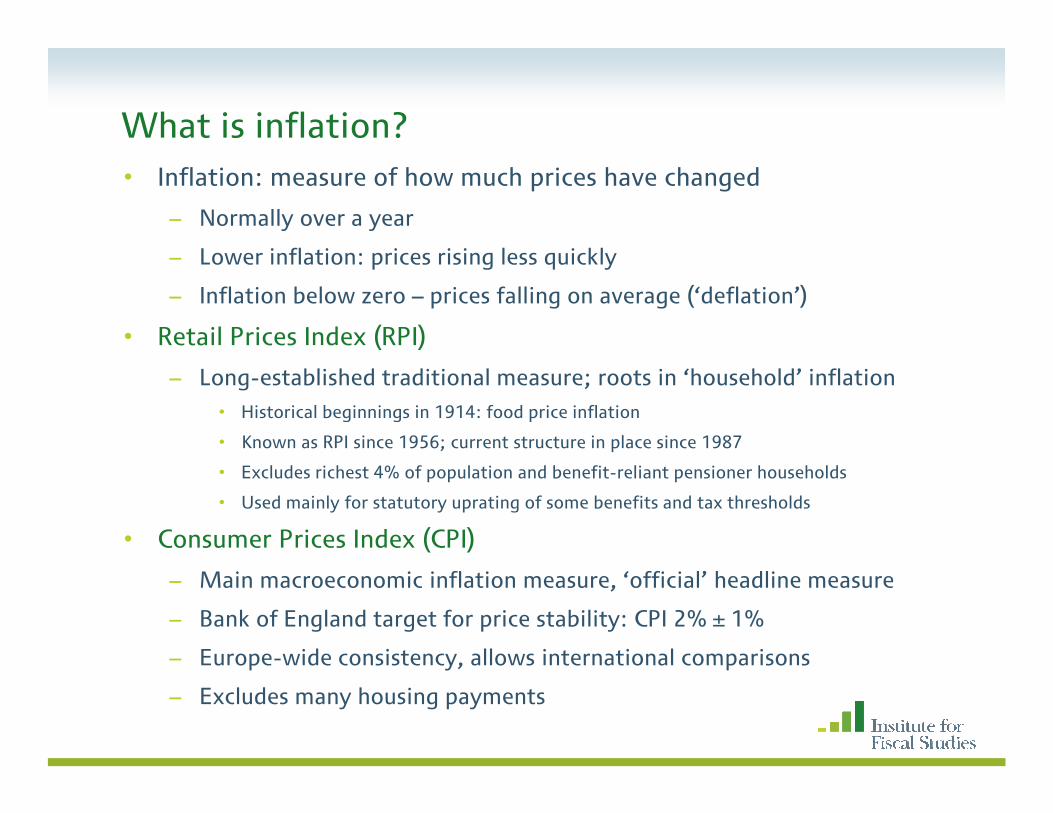
What is inflation?• Inflation: measure of how much prices have changed
– Normally over a year
Lo er inflation prices rising less q ickl– Lower inflation: prices rising less quickly
– Inflation below zero – prices falling on average (‘deflation’)
• Retail Prices Index (RPI)
– Long-established traditional measure; roots in ‘household’ inflation• Historical beginnings in 1914: food price inflation
• Known as RPI since 1956; current structure in place since 1987
• Excludes richest 4% of population and benefit-reliant pensioner households
• Used mainly for statutory uprating of some benefits and tax thresholds
• Consumer Prices Index (CPI)
– Main macroeconomic inflation measure, ‘official’ headline measure
– Bank of England target for price stability: CPI 2% ± 1%
– Europe-wide consistency, allows international comparisonsEurope wide consistency, allows international comparisons
– Excludes many housing payments

60 years of RPI inflation rates60 years of RPI inflation rates
30
20
25
(%)
15
tion
rat
e (
5
10
RP
I Inf
la
-5
01949 1954 1959 1964 1969 1974 1979 1984 1989 1994 1999 2004 2009
-5
Source: ONS

The last 10 years in focusThe last 10 years in focus
6RPI
CPI
4
5
%)
CPI
2
3
tion
rat
e (%
0
1
1999 2000 2001 2002 2003 2004 2005 2006 2007 2008 2009
Infl
a
-2
-1999 000 00 00 003 00 005 006 00 008 009
Source: ONS

Calculating inflationCalculating inflation
• Different measures all essentially calculated in same way
– Define a ‘basket’ of goods and servicesDefine a basket of goods and services • choose items to go into the basket that represent different categories of spending
• 78 different categories in current RPI (e.g. bread, UK holidays, motor fuel, beer)
• each category given a weight depending on how significant a share of spending it is on average
• basket changes each year as spending patterns change
– 2008: in – fruit smoothies, USB memory sticks; out – CD singles, microwaves
Collect sample of prices for these items– Collect sample of prices for these items• in total around 120,000 prices collected each month
• prices from randomly sampled retailers (high street, local, specialist, online)
– Compare prices today to prices a year ago– Compare prices today to prices a year ago• defines an inflation rate for each item
• combined into a rate for each of the 78 categories
• from this, calculate overall RPI as a weighted average using the basket weightsg g g g

RPI Annual Inflation Rates: August 2009
-11.2Housing
All-items RPI: -1.3%
2 22
-0.1-0.2
-4.7
Meals outPublic transport
Leisure goodsPrivate transport
Clothing
3 32.8
2.62.22.2
Household fuelHousehold servs
Personal spendingFood
Meals out
5.54.4
3.93.43.3
Leisure servicesHousehold goods
TobaccoAlcohol
Household fuel
-15 -10 -5 0 5 10
Inflation Rate (%)
Source: ONS

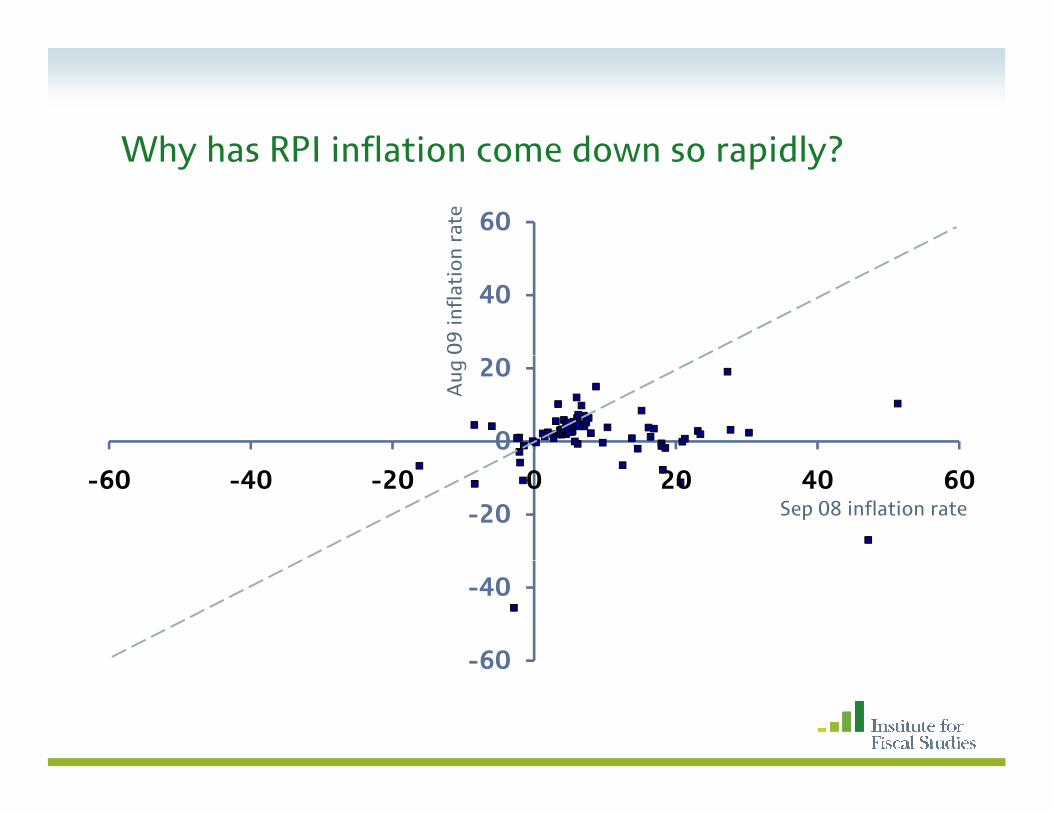
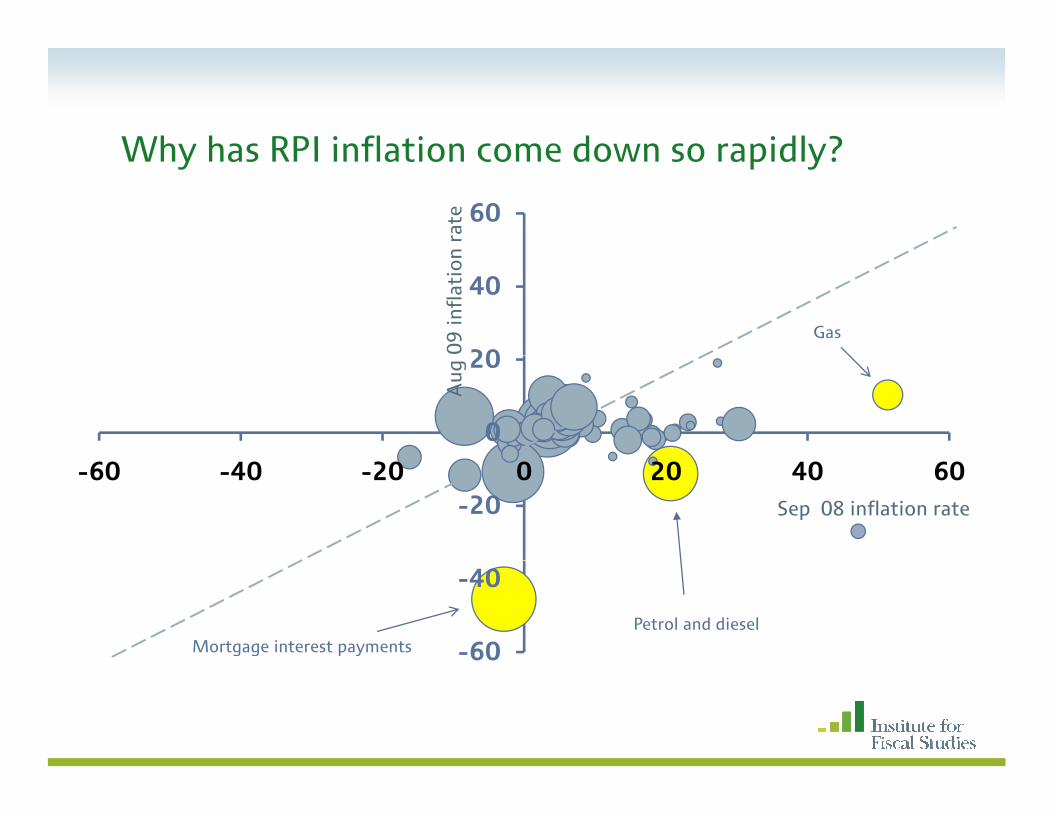
Why has RPI inflation come down so rapidly?Why has RPI inflation come down so rapidly?
60
rate
40
9 in
flat
ion
r0
20
Aug
09
-20-60 -40 -20 0 20 40 60
August 09 average (-1.3%) Sep 08 inflation rate
-60
-40September 08 average (5.0%)
-60
Why has RPI inflation come down so rapidly?Why has RPI inflation come down so rapidly?
60
n ra
te
40
09 in
flat
ion
0
20
Aug
-20-60 -40 -20 0 20 40 60
Sep 08 inflation rate
-60
-40
-60

Why has RPI inflation come down so rapidly?Why has RPI inflation come down so rapidly?
60
n ra
te
20
40
09 in
flat
ion
0
20
Aug
-20-60 -40 -20 0 20 40 60
Sep 08 inflation rate
-60
-40
Why has RPI inflation come down so rapidly?Why has RPI inflation come down so rapidly?
60
n ra
te
20
40
Gas
09 in
flat
ion
0
20
Aug
-20-60 -40 -20 0 20 40 60
Sep 08 inflation rate
-60
-40
Mortgage interest paymentsPetrol and diesel

Why has RPI inflation come down so rapidly?Why has RPI inflation come down so rapidly?
60
n ra
te
20
40
Motor Vehicles 09 in
flat
ion
0
20
Aug
-20-60 -40 -20 0 20 40 60
Sep 08 inflation rate
-60
-40
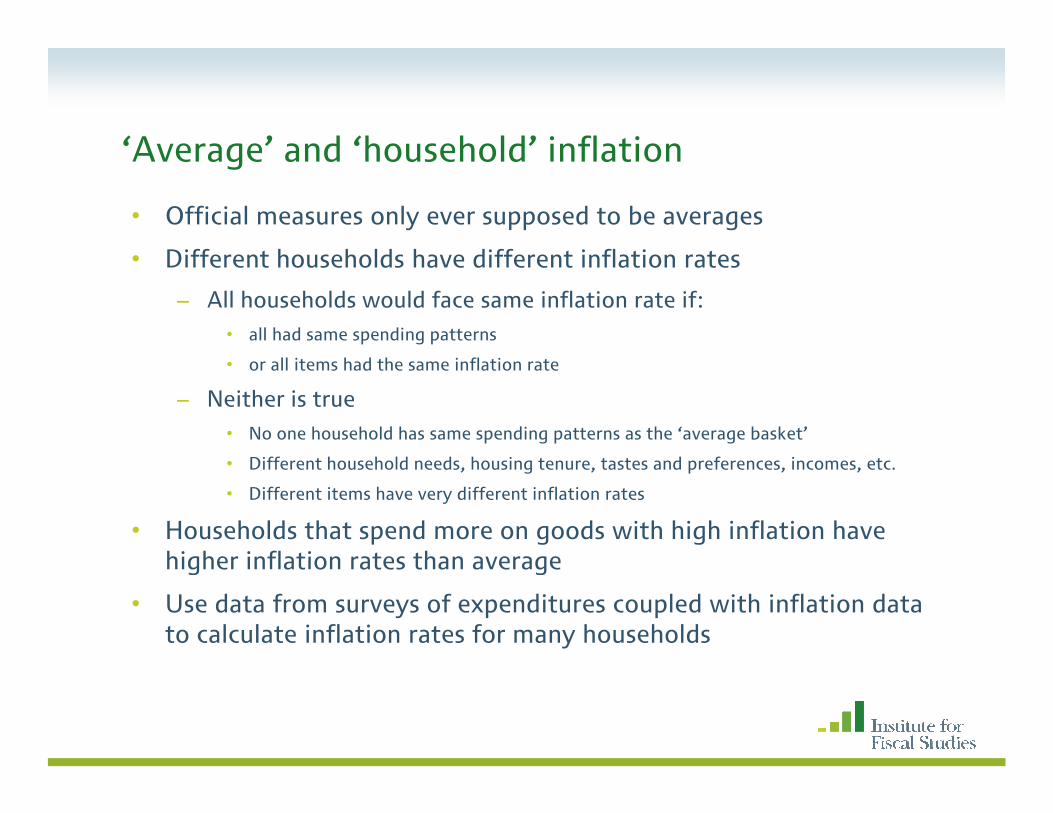
‘Average’ and ‘household’ inflationAverage and household inflation
• Official measures only ever supposed to be averages
Diff t h h ld h diff t i fl ti t• Different households have different inflation rates
– All households would face same inflation rate if:• all had same spending patterns
• or all items had the same inflation rate
– Neither is true• No one household has same spending patterns as the ‘average basket’
Diff t h h ld d h i t t t d f i t• Different household needs, housing tenure, tastes and preferences, incomes, etc.
• Different items have very different inflation rates
• Households that spend more on goods with high inflation have higher inflation rates than averagehigher inflation rates than average
• Use data from surveys of expenditures coupled with inflation data to calculate inflation rates for many households
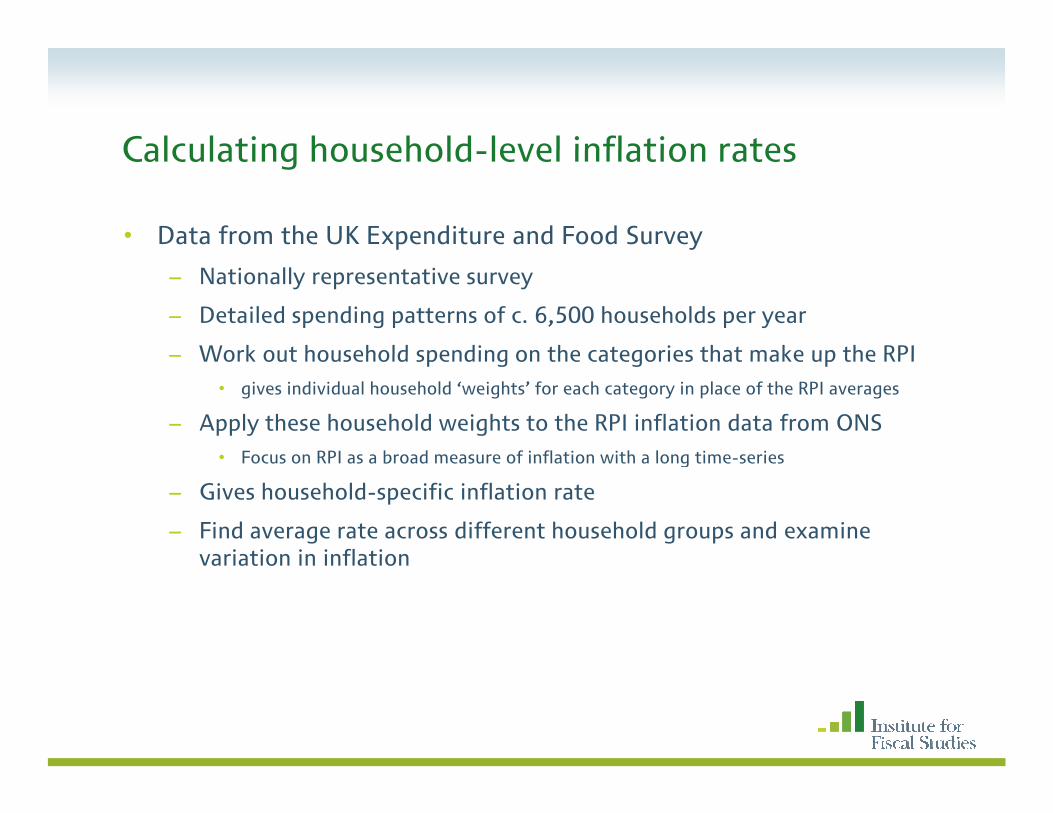
Calculating household level inflation ratesCalculating household-level inflation rates
• Data from the UK Expenditure and Food Survey
– Nationally representative survey
– Detailed spending patterns of c. 6,500 households per year
– Work out household spending on the categories that make up the RPI– Work out household spending on the categories that make up the RPI• gives individual household ‘weights’ for each category in place of the RPI averages
– Apply these household weights to the RPI inflation data from ONS• Focus on RPI as a broad measure of inflation with a long time series• Focus on RPI as a broad measure of inflation with a long time-series
– Gives household-specific inflation rate
– Find average rate across different household groups and examine variation in inflationvariation in inflation
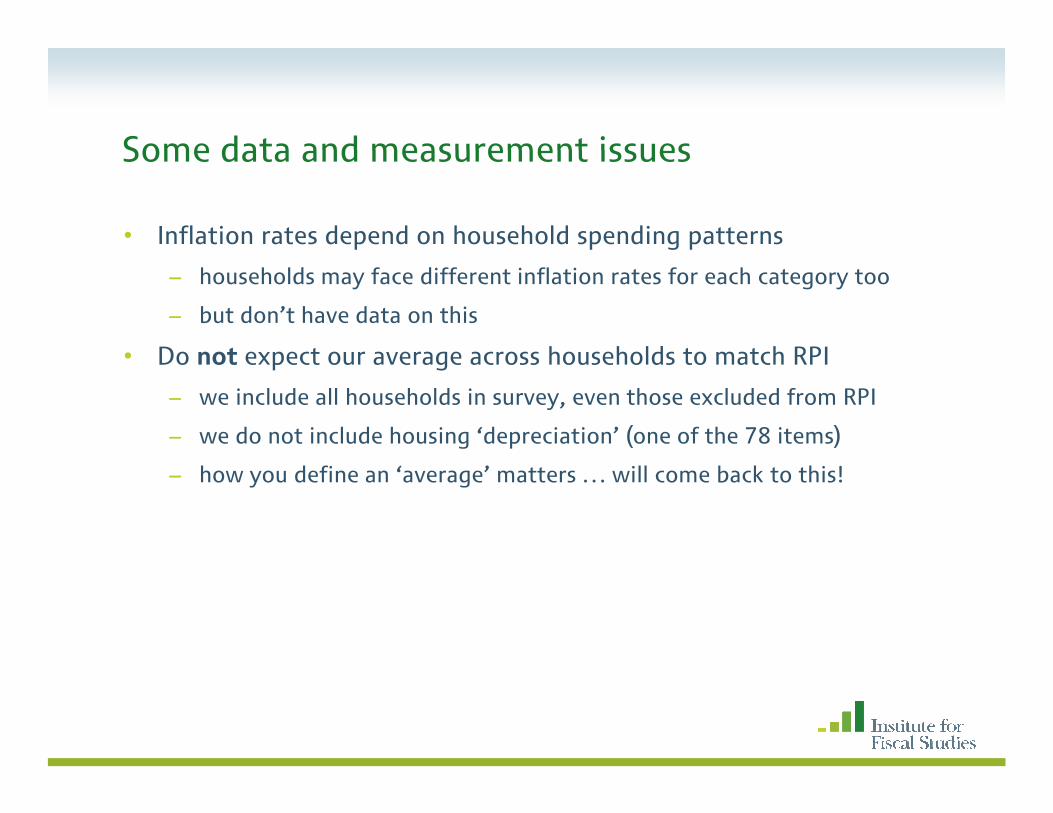
Some data and measurement issuesSome data and measurement issues
• Inflation rates depend on household spending patterns
– households may face different inflation rates for each category too
– but don’t have data on this
• Do not expect our average across households to match RPI• Do not expect our average across households to match RPI
– we include all households in survey, even those excluded from RPI
– we do not include housing ‘depreciation’ (one of the 78 items)
– how you define an ‘average’ matters … will come back to this!

Mortgage interest paymentsMortgage interest payments
• Inflation rate for mortgage interest payments down to -45%
– Drives variation in average inflation across groups in many cases• large part of spending for mortgagees
• also impacts other results (income, age) correlated with tenure
• RPI samples bank and building society Standard Variable Rates
– May overstate average fall in inflation for households with mortgages• households on fixed rates will not have enjoyed large reductions in payments yethouseholds on fixed rates will not have enjoyed large reductions in payments yet
• but will move onto SVRs lower than they otherwise would have been
• so ‘timing’ of inflation rates may be wrong if not the level
• important example of our assumption that all households face same inflation rates
• RPI effectively assumes all households on variable rates; our approach consistent

Comparing household and ONS average inflationFigures tend to be similar over long termFigures tend to be similar over long-term
12
10
te (
%)
RPI
Household average
6
8
infl
atio
n ra
t
3.5%
2
4
Ave
rage
i
0
99
0
99
1
99
2
99
3
99
4
99
5
99
6
99
7
99
8
99
9
20
00
20
01
20
02
20
03
20
04
20
05
20
06
20
07
20
08
3.3%
1 1 1 1 1 1 1 1 1 1 2 2 2 2 2 2 2 2 2

Comparing household and ONS average inflationR t diff t b d i b diff i h &Recent differences appear to be driven by differences across rich & por
8 RPI
5
6
7
ate
(%)
RPI
Household (democratic)
Household (plutocratic)
1
2
3
4
e in
flat
ion
ra
-2
-1
0
1
Jan
06
Mar
06
May
06
Jul 0
6
Sep
06
ov
06
Jan
07
Mar
07
May
07
Jul 0
7
Sep
07
ov
07
Jan
08
Mar
08
May
08
Jul 0
8
Sep
08
ov
08
Jan
09
Mar
09
May
09
Jul 0
9Ave
rage
-3
J M M
J S N J M M
J S N J M M
J S N J M M
J

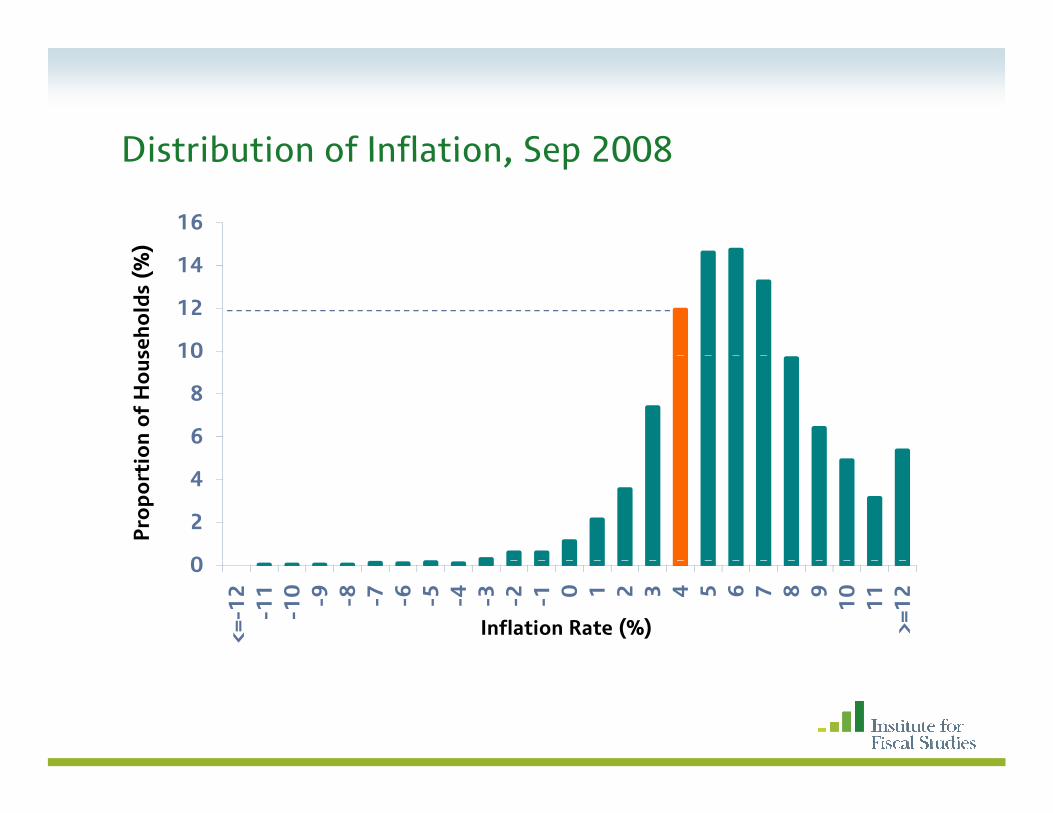
Distribution of Inflation Sep 2008Distribution of Inflation, Sep 2008
16
%)
10
12
14
seh
old
s (%
6
8
10
on
of
Ho
us
0
2
4
Pro
po
rti
0
<=-1
2-1
1-1
0 -9 -8 -7 -6 -5 -4 -3 -2 -1 0 1 2 3 4 5 6 7 8 91
01
1>=
12
Inflation Rate (%)
Distribution of Inflation Sep 2008Distribution of Inflation, Sep 2008
16
%)
10
12
14
seh
old
s (%
6
8
10
on
of
Ho
us
0
2
4
Pro
po
rti
0
<=-1
2-1
1-1
0 -9 -8 -7 -6 -5 -4 -3 -2 -1 0 1 2 3 4 5 6 7 8 91
01
1>=
12
Inflation Rate (%)

Distribution of Inflation Sep 2008Distribution of Inflation, Sep 2008
16
%)
10
12
14
seh
old
s (%
6
8
10
on
of
Ho
us
0
2
4
Pro
po
rti
0
<=-1
2-1
1-1
0 -9 -8 -7 -6 -5 -4 -3 -2 -1 0 1 2 3 4 5 6 7 8 91
01
1>=
12
Inflation Rate (%)

Distribution of Inflation Sep 2008 Jan 2009Distribution of Inflation, Sep 2008- Jan 2009
35
%)
September 08
20
25
30
seh
old
s (% Febuary 09
10
15
20
on
of
Ho
us
5
0
5
12
11
10 -9 -8 -7 -6 -5 -4 -3 -2 -1 0 1 2 3 4 5 6 7 8 9
10
11
12
Pro
po
rti
-5
<=-1 -1 -1
- - - - - - - - - 1 1>=
1
Inflation Rate (%)
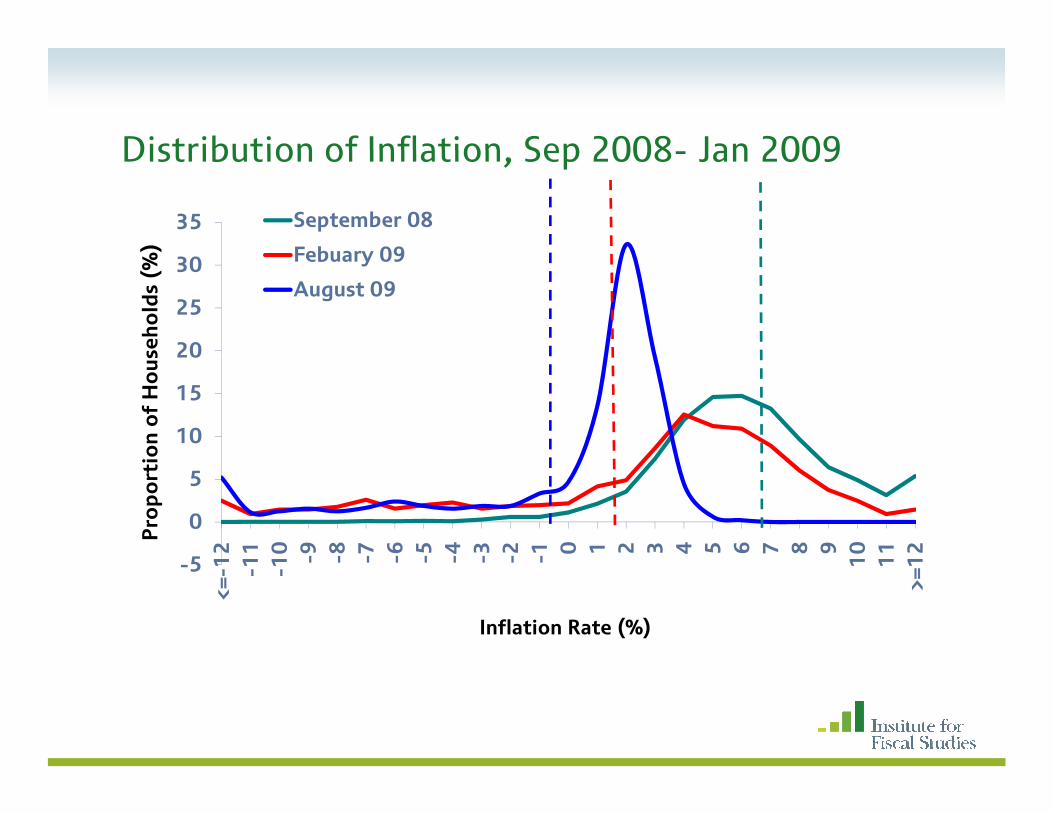
Distribution of Inflation Sep 2008 Jan 2009Distribution of Inflation, Sep 2008- Jan 2009
35
%)
September 08
Febuary 09
20
25
30
seh
old
s (%
Febuary 09
August 09
10
15
20
on
of
Ho
us
5
0
5
12
11
10 -9 -8 -7 -6 -5 -4 -3 -2 -1 0 1 2 3 4 5 6 7 8 9
10
11
12
Pro
po
rti
-5
<=-1 -1 -1
- - - - - - - - - 1 1>=
1
Inflation Rate (%)

Those with mortgages have seen a steep fall in inflation in recent monthsinflation in recent months….
8
10
4
6
8
ate
(%)
0
2
4
nfl
atio
n R
a
-4
-2
0
Jan
06
Mar
06
May
06
Jul 0
6
Sep
06
No
v 0
6
Jan
07
Mar
07
May
07
Jul 0
7
Sep
07
No
v 0
7
Jan
08
Mar
08
May
08
Jul 0
8
Sep
08
No
v 0
8
Jan
09
Mar
09
May
09
Jul 0
9
Ave
rag
e In
-8
-6
4A
Owner - Still Mortgaged

…while those in other types of housing have seen more moderate fallsmore moderate falls….
8
10
4
6
8
ate
(%)
0
2
4
nfl
atio
n R
a
-4
-2
0
Jan
06
Mar
06
May
06
Jul 0
6
Sep
06
No
v 0
6
Jan
07
Mar
07
May
07
Jul 0
7
Sep
07
No
v 0
7
Jan
08
Mar
08
May
08
Jul 0
8
Sep
08
No
v 0
8
Jan
09
Mar
09
May
09
Jul 0
9
Ave
rag
e In
-8
-6
4A Owner - Still Mortgaged
Rented - LA
Rented - Private
O d O t i htOwned Outright

Poorer Households are currently experiencing substantially higher inflation than richer onessubstantially higher inflation than richer ones….
10 Quintile 1 (Poorest)23
6
8
ate
(%)
34Quintile 5 (Richest)
2
4
nfl
atio
n R
a
0
2
06
06
06
06
06
06
07
07
07
07
07
07
08
08
08
08
08
08
09
09
09
09Ave
rag
e In
-4
-2 Jan
0
Mar
0
May
0
Jul 0
Sep
0
No
v 0
Jan
0
Mar
0
May
0
Jul 0
Sep
0
No
v 0
Jan
0
Mar
0
May
0
Jul 0
Sep
0
No
v 0
Jan
0
Mar
0
May
0
Jul 0
A
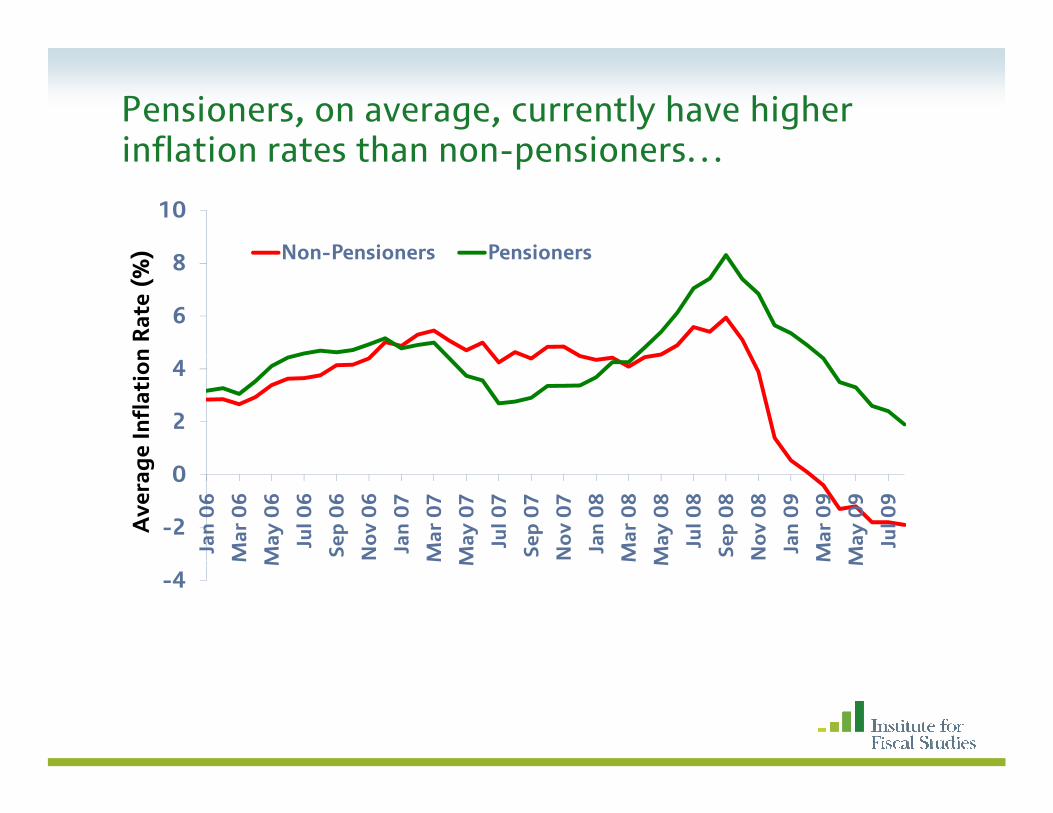
Pensioners, on average, currently have higher inflation rates than non pensionersinflation rates than non-pensioners…
10
) Non-Pensioners Pensioners
6
8
n R
ate
(%) Non-Pensioners Pensioners
2
4
e In
flat
ion
-2
0
Jan
06
Mar
06
May
06
Jul 0
6
Sep
06
No
v 0
6
Jan
07
Mar
07
May
07
Jul 0
7
Sep
07
No
v 0
7
Jan
08
Mar
08
May
08
Jul 0
8
Sep
08
No
v 0
8
Jan
09
Mar
09
May
09
Jul 0
9
Ave
rag
-4
M M M M M M M M

…and those over 80 currently have particularly high average rateshigh average rates…
12
20s 40s 60s 80+
8
10
ate
(%)
20s 40s 60s 80+
4
6
nfl
atio
n R
a
0
2
6 6 6 6 6 6 7 7 7 7 7 7 8 8 8 8 8 8 9 9 9 9Ave
rag
e In
-4
-2
Jan
06
Mar
06
May
06
Jul 0
6
Sep
06
No
v 0
6
Jan
07
Mar
07
May
07
Jul 0
7
Sep
07
No
v 0
7
Jan
08
Mar
08
May
08
Jul 0
8
Sep
08
No
v 0
8
Jan
09
Mar
09
May
09
Jul 0
9A

The old poor currently have particularly high rates of inflation while the young rich have particular low ratesinflation, while the young rich have particular low rates…
10
12 Poorest 20%, under 35
Poorest 20%, over 65
6
8
10
ate
(%)
Richest 20%, over 65
Richest 20%, under 35
2
4
nfl
atio
n R
a
4
-2
0
Jan
06
Mar
06
May
06
Jul 0
6
Sep
06
No
v 0
6
Jan
07
Mar
07
May
07
Jul 0
7
Sep
07
No
v 0
7
Jan
08
Mar
08
May
08
Jul 0
8
Sep
08
No
v 0
8
Jan
09
Mar
09
May
09
Jul 0
9
Ave
rag
e In
-8
-6
-4 M M N M M N M M N M MA

Indexation of Benefits and Tax ThresholdsIndexation of Benefits and Tax Thresholds
• The September inflation numbers are used for uprating tax h h ld d b fthresholds and certain benefits
– The basic state pension is uprated by the greater of RPI inflation and 2.5%
– Many other benefits are usually either uprated in line with the RPI or the Rossi Index (RPI excluding housing costs)
– Budget 2009 stated that if RPI is negative in September, there will be h d ti i th b fit i t th h ldno cash reductions in these benefits or in tax thresholds
– Could involve a real increase for some

OutlookOutlook
• RPI inflation could rebound over the next few months
– Average of most recent independent forecasts for Q4 2010 is 2.6%
• Mortgage Interest Rates cannot go much lower
Current collapse in RPI is inflation largely driven by lower mortgage– Current collapse in RPI is inflation largely driven by lower mortgage interest
– These prices are unlikely to fall much further
Eff t f E h R t• Effect of Exchange Rates
– Fall in the value of Sterling puts upward pressure on inflation, and vice versa

Crucially, many of these differences cancel out over the longer termover the longer term…
8
9 Rented - LA
Rented - Private
6
7
8
Rat
e (%
) Owner-Still Mortgaged
Owned Outright
4
5
e In
flat
ion
1
2
3
Ave
rag
e
0
1
99
1
99
2
99
3
99
4
99
5
99
6
99
7
99
8
99
9
00
0
00
1
00
2
00
3
00
4
00
5
00
6
00
7
00
8
1 1 1 1 1 1 1 1 1 2 2 2 2 2 2 2 2 2

Average inflation rates since 1991,by housing tenureby housing tenure
3.17 3.12 3.17 3.20 3.19
3.0
3.5
%)
2.0
2.5
3.0
ion
Rat
e (%
1.0
1.5
age
Infl
ati
0.0
0.5Ave
ra
All
Ren
t-LA
Ren
t-P
riv
Mo
tgag
ee
Ow
ner
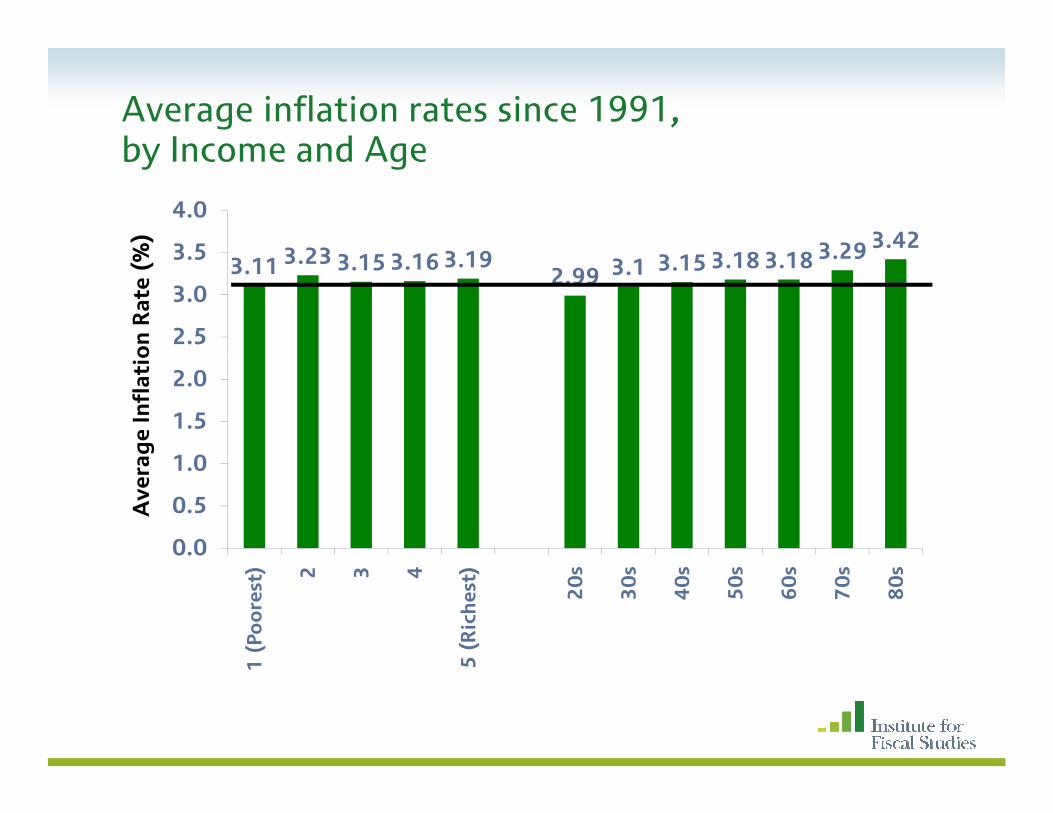
Average inflation rates since 1991,by Income and Ageby Income and Age
3 23 3 19 3 18 3 18 3 29 3.423 5
4.0
%)
3.11 3.23 3.15 3.16 3.192.99 3.1 3.15 3.18 3.18 3.29
2.5
3.0
3.5
on
Rat
e (%
1 0
1.5
2.0
age
Infl
atio
0.0
0.5
1.0
Ave
ra
1 (
Poo
rest
) 2 3 4
5 (
Ric
hes
t)
20
s
30
s
40
s
50
s
60
s
70
s
80
s
1 5

SummarySummary• Published inflation rates are simply averages.
• Behind these averages, there is variation in households rates as
Higher Inflation, on Average
R i h
Lower Inflation, on Average
Th i h
different households have different spending patterns
• Renters, owners-outright
• Older households
• Poorer households
• Those with mortgages
• Younger households
• Richer households
• Single Adult Households • Couples
• Currently most of this is driven by mortgage interest payments. Many who have the lowest inflation now had the highest inflationMany who have the lowest inflation now had the highest inflation in 2007
• Differences in the average rate of inflation over a longer time period tend to less dramatic than those at any one point in timeperiod tend to less dramatic than those at any one point in time