how does globalization affect the implicit tax rates on labour income
TRANSCRIPT
How does globalization affect the implicit tax rates on labour income, capital
income and consumption in the EU?
Ozlem Onaran,
Valerie Boesch,
and
Markus Leibrecht*
JEL Code: H23, H24, H25, F19, F21
How does globalization affect the implicit tax rates on labour income, capital
income and consumption in the EU?
Abstract
This paper analyzes the effects of globalization on implicit tax rates (ITRs) on labour
income, capital income, and consumption in the EU15 and Central and Eastern European
New Member States (CEE NMS). We find supportive evidence for an increase in the ITR on
labour income in the EU15, but no effect on the ITR on capital income. There is evidence of
convergence in terms of the ITR on consumption, as countries with higher than average ITR
on consumption respond to globalization by decreasing their tax rates. There are important
differences among the welfare regimes within the EU15. Social-democratic countries have
decreased the tax burden on capital, but increased that on labour due to globalization.
Globalization exerts a pressure to increase taxes on labour income in the conservative and
liberal regimes as well. Taxes on consumption decrease in response to globalization in the
conservative and social democratic regimes. In the CEE NMS, there is no effect of
globalization on the ITR on labour and capital income, but we find a negative impact on the
ITR on consumption in the CEE NMS with higher than average ITR on consumption.
Key words: globalization, implicit tax rate on labour income, capital income, and
consumption, welfare regimes
* The authors are grateful to Ilker Atac, Oliver Prausmüller, Claudia Hochgatterer, and two
anonymous referees for very helpful comments. Support from the FWF Project Nr. F2008 is
acknowledged. The usual disclaimer applies.
Ozlem Onaran: Corresponding author, Senior Lecturer, Middlesex University, Department of
Economics and Statistics, The Burroughs, London NW4 4BT, UK Phone: +44 20 8411 5956,
e-mail: [email protected]
Valerie Boesch: Research Assistant, Vienna University of Economics and Business, Research
Institute International Taxation, Augasse 2-6, A-1090 Vienna, Austria, Phone (+43-1) 31336-
5932, e-mail: [email protected].
Markus Leibrecht: Senior economist, Vienna University of Economics and Business,
Department of Economics and Research Institute International Taxation, Augasse 2-6, A-1090
Vienna, Austria, Phone (+43-1) 31336-5833, e-mail: [email protected].
1
I. INTRODUCTION
This paper analyzes the effects of globalization on the taxation of labour income,
capital income, and consumption in the EU Member States. The theory of capital tax
competition argues that, as capital becomes increasingly more mobile, firms are able to avoid
high taxes by choosing countries with a low capital tax burden, which may result in
inefficiently low taxes on capital income and inefficiently low public good provision (Oates,
1972; Zodrow and Mieszkowski, 1986; Tanzi, 1995; Bucovetsky, 1991; Wilson, 1999;
Brueckner, 2000; Krogstrup, 2004). However, fewer possibilities to tax mobile capital also
implies that more immobile tax bases, notably labour income and consumption, should bear
the tax burden necessary to finance a given level of public expenditures.
Indeed, an already extensive empirical literature is available which explores the impact
of globalization on the level of the capital income tax burden as well as the tax burden on
more immobile tax bases. In this literature, five different measures of tax burden are used: (i)
statutory tax rates on corporate income (STR), (ii) corporate income tax revenues as a
percentage of GDP or total tax revenues, (iii) implicit tax rates (ITR)1 on capital income,
corporate income, labour income and on consumption expenditures of the Mendoza et al.
(1994) type, and (iv and v) effective marginal and average tax rates on corporate income
(EMTR and EATR) of the Devereux and Griffith (1998) type.
Studies that test the effect of globalization on the level of STR or EATR (see Swank
and Steinmo, 2002; Slemrod, 2004; Clausing, 2007 on STR, and Krogstrup, 2005; Dreher,
2006a; Garretsen and Peeters, 2007; Loretz, 2008 on EATR) generally find a negative effect.
Yet, the empirical results on the effects on the ITR on capital income are inconclusive: Dreher
et al. (2008), Swank and Steinmo (2002), and Swank (2006) find no effect; Dreher (2006a)
estimates a positive effect, whereas Winner (2005) finds a negative effect. Using the ITR on
corporate income, Adam and Kammas (2007), Bretschger (2008) and Bretschger and Hettich

2
(2002) also find a negative effect of globalization. Moreover, Quinn (1997) finds a positive
effect on corporate tax revenues as a percentage of GDP and total revenues.
Concerning ITR on labour income, Adam and Kammas (2007), Winner (2005) and
Dreher et al. (2008) find a positive effect of globalization. However, Dreher (2006a) finds no
effect, while Swank and Steinmo (2002) find a negative effect. Furthermore, Bretschger and
Hettich (2002) explore the globalization impact on the ratio of the ITR on labour income to
that on corporate income. They find a positive relationship which signals that the tax burden
is shifted to labour income. Winner (2005) and Adam and Kammas (2007) likewise find a
shift from capital to labour income taxation. Regarding the globalization effects on the ITR on
consumption the picture is more conclusive as most available studies find no effect (e.g.
Swank and Steinmo 2002, Dreher 2006a, Dreher et al. 2008).
Concerning tax law based tax measures (EATR, EMTR, STR) the empirical evidence
available so far points towards a negative relationship with globalization.. Yet, notable
features of the existing literature are that these studies (i) are predominantly based on a sample
of advanced OECD countries and (ii) do not separate the globalization effects by welfare
regimes or country groups.
This paper adds to the literature by exploring differences in globalization effects across
welfare regimes within the EU15 based on an "augmented" Esping-Andersen typology. We
also distinguish between countries that have tax rates higher than average compared to those
with a lower tax rate.2 A second novelty of the paper lies in including the Central and Eastern
European New EU Members States (CEE NMS) in the country sample and, thus, by focusing
on differences in globalization effects between Western (EU15) and CEE NMS.
With respect to the separation by welfare regimes, Campbell (2005) suggests that
national political and economic institutions mediate how states react to the pressures of
globalization. Thus, the institutional environment limits the degree to which national tax
regimes converge in response to globalization. Specifically, the institutional configuration of

3
national politics shapes actors’ political tax policy strategies. This is in line with the argument
that welfare regimes display path-dependency, and only change gradually within specified
paths (Scharpf and Schmidt, 2000; Esping-Andersen, 1996; Swank, 2001). Different welfare
states create different expectations and dependency relations among the citizens, which cannot
be changed quickly given electoral considerations (Kautto and Kvist, 2002). This also affects
tax policy. For instance, Campbell (2005) argues that the type of labour and business
organizations affects the sorts of tax policies these organizations are willing to support. If
labour is politically influential, unions support relatively high taxes because they expect this
to finance expenditures like social protection. Indeed, Campbell (2005) finds that social-
democratic countries set the highest tax rates on both labour and capital income, as they
utilize the tax revenue to finance welfare spending and the tax burden is lowest in the liberal
welfare state.
Although most of the CEE countries reformed their tax systems along western lines
during the transition period (Campbell, 2005), analyzing the CEE NMS in isolation is
meaningful for several reasons: first, CEE NMS governments have been especially active in
using cuts in effective corporate income tax rates (e.g. Bellak and Leibrecht, 2009),
introducing flat rate personal income taxes (e.g. Keen et al., 2008) and creating special
economic zones (e.g. World Bank, 2008) to attract foreign capital (esp. Foreign Direct
Investment (FDI)). Second, the tax reforms have probably led to a profit-shifting response of
multinational enterprises, which have tried to make use of the lower statutory corporate tax
rates in the transition countries (Devereux, 2007). Third, the transition crisis has posed quite
extensive fiscal needs in terms of increased unemployment and early pension schemes, which
may have shaped taxation decisions (Havlik and Landesmann, 2005). Fourth, the tax structure
is quite different in the CEE NMS, e.g. the share of indirect taxes in tax revenues is on average
much higher than in the EU15 (e.g. EU Commission, 2009: 58). Fifth, the extent of the
informal economy, which is much higher than in the EU15, may have increased the preference
4
of the governments for lower tax rates on income to create incentives for formalization as well
as a higher share of taxes on consumption (Duman, 2009).
Based on a panel data set we find supportive evidence for an increase in the ITR on
labour income in the EU15. We do not find a significant effect of globalization on the ITR on
capital income. There is some evidence of convergence in terms of the ITR on consumption,
as countries with higher than average ITR on consumption respond to globalization by
decreasing their tax rates. However there are important differences among the welfare regimes
within the EU15. Social democratic countries have decreased the tax burden on capital, but
increased that on labour due to globalization. Globalization exerts a pressure to increase taxes
on labour income in the conservative and liberal regimes as well. Taxes on consumption
decrease in response to globalization in the conservative and social democratic regimes. In the
CEE NMS, there is no effect of globalization on the ITR on labour and capital income but we
find a negative impact on the ITR on consumption. Furthermore this again points at
convergence as the CEE NMS with higher than average ITR on consumption decrease their
tax rates in response to economic globalization.
The paper is structured as follows: Section two reviews the literature on welfare regime
typologies. Section three describes how we measure tax burdens and the globalization process.
It also includes some empirical, stylized facts. Section four introduces the control variables
used in the empirical analysis. Section five presents the estimation methodology and section
six discusses the results. Section seven concludes.
II. GROUPING OF COUNTRIES INTO WELFARE REGIMES
The welfare state literature indicates considerable heterogeneity among the Western
European countries related to the institutional setting of a country. In the literature about the
effects of globalization on the government budget, Leibrecht et al (2010) is the only article to

5
the best of our knowledge, which directly addresses the relevance of welfare regimes; however
this paper only discusses the effects on social spending.
Esping-Andersen (1990) developed a widely used typology of three welfare regimes,
grouping countries based on their stratification, decommodification, and the mix between
private and public social security institutions. The first group consists of social-democratic
regimes which are universalistic and egalitarian with high degrees of decommodification, little
stratification and social security payments provided universally by the state (Sweden, Finland,
Denmark, Norway). The second comprises conservative regimes strongly associated with
employment protection, with the family at the heart of the protection, a medium
decommodification, and social security provided partly by the state and partly by the market
(Germany, France, Austria, Belgium, Italy, Japan, Switzerland and the Netherlands). Finally,
the third group encompasses liberal regimes with low decommodification, high stratification,
restricted role of the state, a low level of social security, and a significant private insurance
contribution (UK, USA, Ireland, Canada, and Australia). This classification is later extended
by adding a separate welfare regime group for the southern European countries (Italy, Spain,
Greece, Portugal) by Ferrera (1996) and Bonoli (1997). As opposed to previous research which
treats countries like Spain, Portugal and Greece as latecomers on the same path of continental
conservative welfare states, Ferrera (1996) argues that southern countries are inter alia
characterized by a highly fragmented and polarized welfare regime with generous pensions
paired with substantial gaps in the social safety net, a departure from the corporatist tradition in
the field of health care, a highly collusive mix between public and private institutions in the
welfare sphere and the persistence of clientelism in the distribution of cash subsidies.
Due to its wide use in the literature, we use Esping-Andersen’s classification. Although
these welfare regimes are developed based on social expenditure structures, they reflect
institutional and political structures that might determine the influence of social actors on tax
policy. Furthermore, expenditure structures create a path dependency that also locks in tax

6
regimes (Scharpf and Schmidt, 2000; Esping-Andersen, 1996; Swank, 2001). As discussed in
Section 3 on the stylized facts of the tax rates on capital and labour income and consumption,
the tax structures of welfare regimes can be quite different.
While some studies see welfare states in the CEE NMS within the liberal regime based
on a mix of social insurance and social assistance, and a partial privatization of social policy
with just a few corporatist attributes (e.g. Ferge, 2001, Standing, 1996), others argue that the
CEE NMS constitute a separate post-socialist regime type (Aidukaite, 2004, Lelkes, 2000).
Noelke and Vliegenthart (2009) argue that the CEE NMS form a dependent market economy
model that differs from coordinated or liberal market economies due to its dependency on
foreign capital. Fenger (2007) distinguishes a "post-communist European type" and a "former
USSR type", where the former mixes characteristics of both the conservative and the social-
democratic types. Bohle and Greskovits (2007) distinguish between a neoliberal type in the
Baltic States, an embedded neoliberal type in the Visegrad states, and a neo-corporatist type in
Slovenia. Alternatively, Orenstein and Hass (2005) distinguish between European and
Eurasian post-communist welfare states where the European category includes all CEE NMS
as well as other former Yugoslav republics. According to Orenstein and Haas (2005), good
prospects of joining the EU pushed for the development of welfare states in the CEE NMS,
and they therefore find less of a difference between the Baltic countries and the other countries
within the CEE NMS.
These studies suggest that the countries in the CEE NMS constitute a welfare regime in
transition different from those found in the EU15. Therefore, we estimate the effects of
globalization on taxes separately for the EU15 and the CEE NMS. However, further tests of
diversity among the CEE NMS are not possible due to limited degrees of freedom.
7
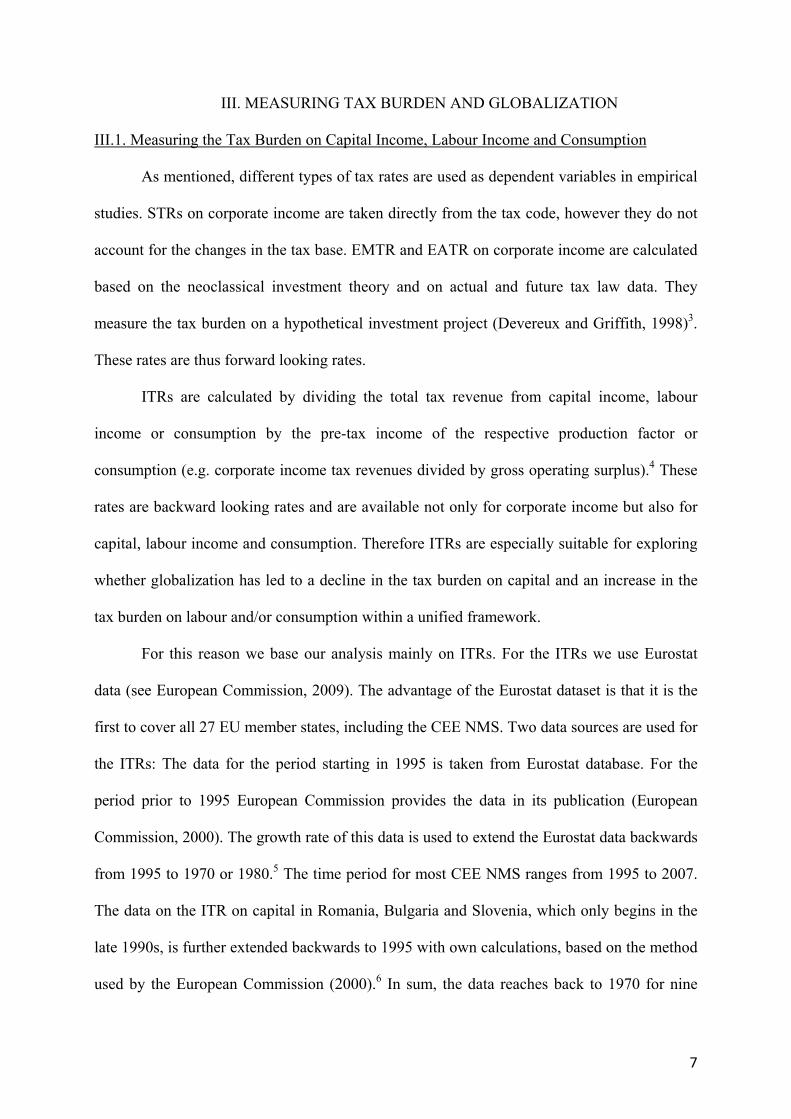
III. MEASURING TAX BURDEN AND GLOBALIZATION
III.1. Measuring the Tax Burden on Capital Income, Labour Income and Consumption
As mentioned, different types of tax rates are used as dependent variables in empirical
studies. STRs on corporate income are taken directly from the tax code, however they do not
account for the changes in the tax base. EMTR and EATR on corporate income are calculated
based on the neoclassical investment theory and on actual and future tax law data. They
measure the tax burden on a hypothetical investment project (Devereux and Griffith, 1998)3.
These rates are thus forward looking rates.
ITRs are calculated by dividing the total tax revenue from capital income, labour
income or consumption by the pre-tax income of the respective production factor or
consumption (e.g. corporate income tax revenues divided by gross operating surplus).4 These
rates are backward looking rates and are available not only for corporate income but also for
capital, labour income and consumption. Therefore ITRs are especially suitable for exploring
whether globalization has led to a decline in the tax burden on capital and an increase in the
tax burden on labour and/or consumption within a unified framework.
For this reason we base our analysis mainly on ITRs. For the ITRs we use Eurostat
data (see European Commission, 2009). The advantage of the Eurostat dataset is that it is the
first to cover all 27 EU member states, including the CEE NMS. Two data sources are used for
the ITRs: The data for the period starting in 1995 is taken from Eurostat database. For the
period prior to 1995 European Commission provides the data in its publication (European
Commission, 2000). The growth rate of this data is used to extend the Eurostat data backwards
from 1995 to 1970 or 1980.5 The time period for most CEE NMS ranges from 1995 to 2007.
The data on the ITR on capital in Romania, Bulgaria and Slovenia, which only begins in the
late 1990s, is further extended backwards to 1995 with own calculations, based on the method
used by the European Commission (2000).6 In sum, the data reaches back to 1970 for nine

8
EU15 countries, to 1980 for six EU15 countries, and to 1995 for most CEE NMS (see Table
A.1).
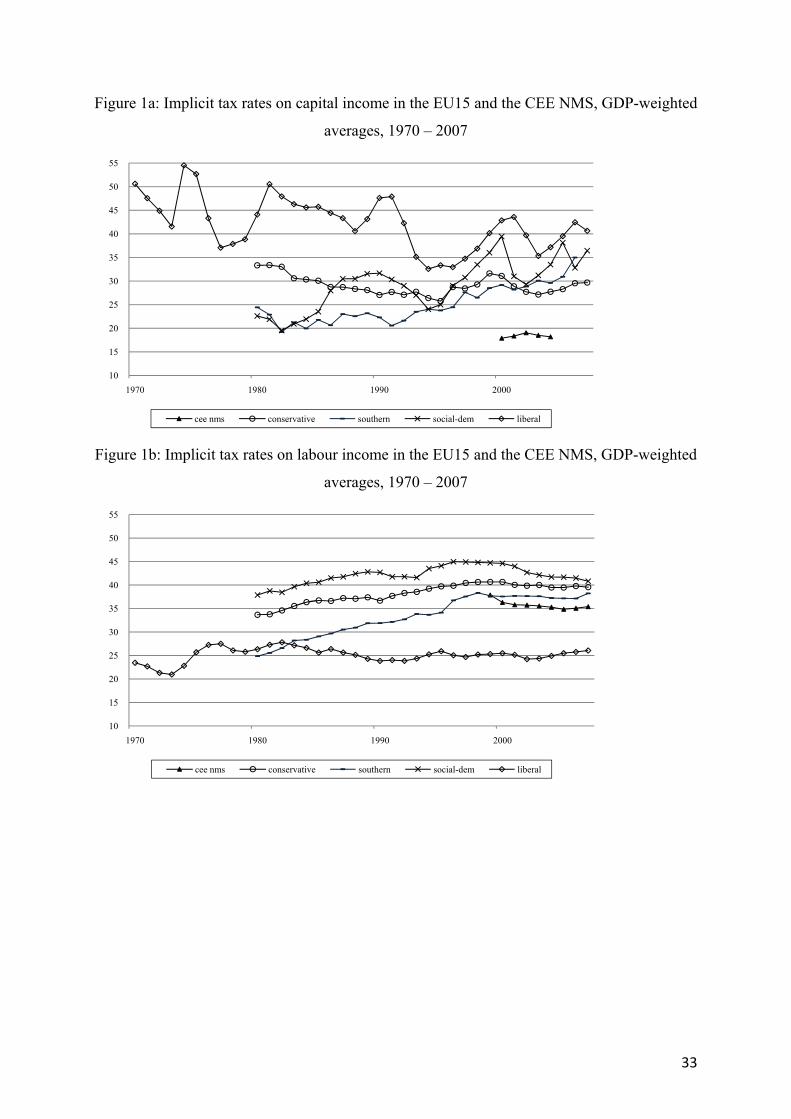
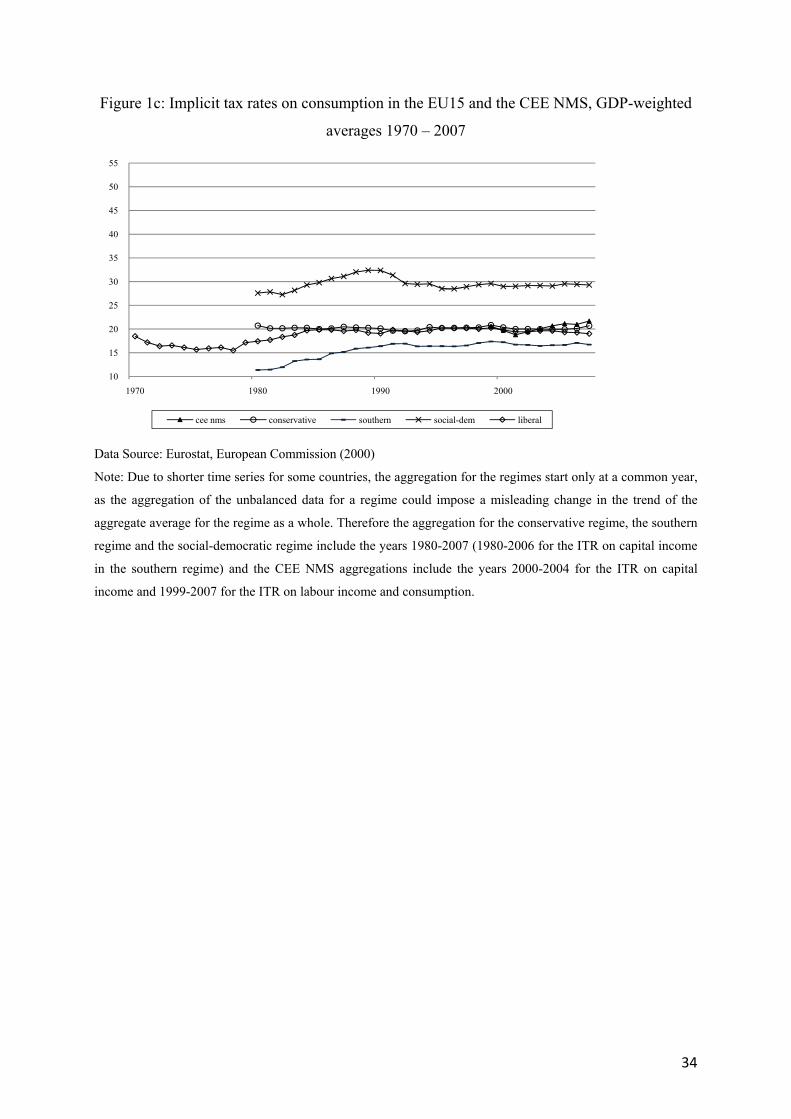
Figures 1a-c show the development of the ITR on capital income, consumption and
labour income in the EU15 grouped by welfare state regimes and the CEE NMS (GDP-
weighted average).
[Figures 1a-c about here]
The ITR on capital income stayed rather stable at 30.4%% (weighted sample mean)
due to a broadening of the tax base, particularly in the case of corporate income (rising
profits, legal changes regarding deductions, allowances etc.; see Devereux et al., 2002);
European Commission, 2008). Regarding the different welfare regimes, since the 1970s the
ITR on capital income has fallen in the liberal welfare regime from 50.6 to 40.6% (weighted
regime mean) and risen in the social-democratic regime from 22.6% to 36.5% with stronger
upturns and downturns. In the southern regime the ITR on capital income has developed
similar to that of the social-democratic regime rising from 24.4% to 35.0%. In the
conservative regime it decreased from 33.3% to 29.7%, apart from a slight increase since the
mid-1990s. . Within the conservative regime France is a particular exception with a
continuously increasing ITR on capital. In the CEE NMS the mean of the ITR on capital
income is much lower than in the EU15 (19.7% compared to 30.6%). The highest rate is for
the Czech Republic with 25.9% and it is as low as 10% in the Baltic countries. The average in
the CEE NMS decreased until 2000 and then slightly increased.
However, there are also important differences in the trends among the CEE NMS.
While in Slovenia the ITR on capital has risen from a very low level, it has decreased in
Latvia and Estonia, and it plummeted from a higher level in Slovakia while remaining quite
stable in most other CEE NMS.
The ITRs on labour are on average higher than those on capital, with a weighted mean
of 33.4%. The development has been more homogenous among the different welfare regimes

9
in the EU15 with an overall increasing trend in most countries compared to the early 1970s.
Countries in the social-democratic welfare regime have the highest ITR on labour income
which has risen until the turn of the millennium and has decreased since then. Overall the rate
increased from 37.9% to 40.8%. The lowest ITR on labour income is levied by the liberal
regime with a mean of only 25.1%. It rose until the late 1980s, since which it has decreased
slightly. The ITR on labour income in countries of the conservative regime lies between those
of the social-democratic and the liberal regime, and has constantly risen from 33.7% to 39.5%
almost converging with that of the social-democratic regime eventually. The ITR on labour
income in the southern regime has also constantly risen from 24.9% to 38.2%, although it is
still slightly lower than that of the conservative and social-democratic welfare regimes. The
ITR on labour income in the CEE NMS is higher than in the EU15, although the difference is
relatively small (36.5% to 33.4%), with Hungary, the Czech Republic and Slovenia showing
the highest rates. On average, the ITR on labour in the CEE NMS remained quite stable or
declined slightly. Combining this with the lower ITR on capital, it can be argued that the CEE
NMS rely more heavily on labour taxes.
With respect to the ITR on consumption, the social-democratic countries once again
show the highest ITR by far. It rose in the late 1980s, decreased in the early 1990s and since
then has stayed more or less constant. Over the whole period it increased from 27.6% to
29.3%. In the liberal regime the ITR on consumption increased during the late 1970s and
early 1980s, and then stayed rather constant in a range of 19.0-20.0%, as in the conservative
regime. Again in southern countries the ITR on consumption is lower than in the EU15 with a
mean of 15.4%. However, it has been constantly rising, with a particularly strong increase in
the late 1980s and early 1990s. The level of the ITR on consumption in the CEE NMS
corresponds to the level in the conservative and liberal regime.
Overall, the descriptive analysis of the ITRs underlines the relevance of estimating
different effects of globalization among welfare regimes and country groups (West vs. East).

10
III.2 Measuring the Globalization Process
Globalization is a multi-facetted phenomenon comprising economic, social,
institutional and political aspects (Dreher, 2006b; Dreher et al., 2008). In the empirical
literature globalization is frequently measured by a country’s openness to trade or FDI (see
Gemmel et al., 2008 for a review). However, using either trade or FDI to measure
globalization, thus excluding other flows of income and capital or changes in de jure measures
or social and political dimensions of globalization might result in biased estimates (Dreher et
al., 2008). The estimations by Leibrecht et al (2010) about the effects of globalization on social
spending might be significantly misinterpreted, if narrow measures are used. Following
Leibrecht et al (2010), we therefore base our analysis on the KOF globalization indices,
developed by Dreher (2006b) and Dreher et al. (2008), which incorporate these different
dimensions. These are weighted indices of various globalization variables, where the weights
are determined via principle component analysis. Each variable entering the KOF measure is
transformed to an index on a scale from 1 to 100, where 100 is the maximum value of the
variable in the period 1970 to 2006. The data is transformed according to the percentiles of
the original distribution. For the current analysis the KOF indices have the additional
advantage of also being available for the CEE NMS.
We use two different KOF indices, one capturing economic globalization and one also
considering social, political and institutional aspects of the globalization phenomenon: (a)
KOFecon which incorporates actual FDI, income and trade flows, as well as legal restrictions
on FDI and trade. The “flow-part” of the index brings together FDI stock and flows, exports
and imports, portfolio investments (stock of assets and liabilities) and income payments to
foreign nationals, all normalized by GDP. The “restrictions-part” of the index includes de jure
measures of formal openness such as hidden import barriers, mean tariff rates, taxes on
international trade as a percentage of current revenue and capital account restriction; (b)
KOFglobal which combines economic globalization with social and political globalization,

11
incorporating the number of embassies and high commissions in the country, the number of
international organizations of which the country is a member, the number of international
treaties signed, personal contacts, information flows and cultural proximity (Dreher,
2006b).The EU countries have gone through two types of global integration: at the global level
and the European level. While KOF globalization indices capture the effects of overall global
integration, they do not distinguish the effects of the intra-EU integration. It is not possible to
construct a new index for the intra-EU integration within the scope of this paper; however in
order to reflect the relevance of this EU dimension, and test for convergence effects, we also
introduce a dummy variable in the empirical estimation for countries with tax rates higher than
EU average.
IV. CONTROL VARIABLES
In addition to the globalization variables, further explanatory variables capturing
mainly domestic determinants of tax rates are included in the estimations as control variables.
The choice of control variables is based on the related previous empirical literature (e.g.
Dreher, 2006a; Adam and Kammas, 2007; Bretschger and Hettich, 2002; Swank and Steinmo,
2002; Winner, 2005).
Total expenditures of general government as a ratio to GDP (variable expenditures)
should ceteris paribus be positively related to ITRs since they induce higher financial needs.
The general government consolidated gross debt as percent of GDP (debt) can have
either a positive or negative effect on ITRs. On the one hand public debt can serve as
substitute for taxes: when taxes are lowered, expenditures have to be financed by debt. On the
other hand there exists a borrowing effect: the higher the public debt, the more taxes have to
be levied to pay for the debt. Thus, the expected sign of this variable is ambiguous a priori.
The population older than 65 years as a share of total population (oldage) is expected
to be positively correlated with implicit tax rates: A higher share of dependent population
results in higher fiscal needs.
12
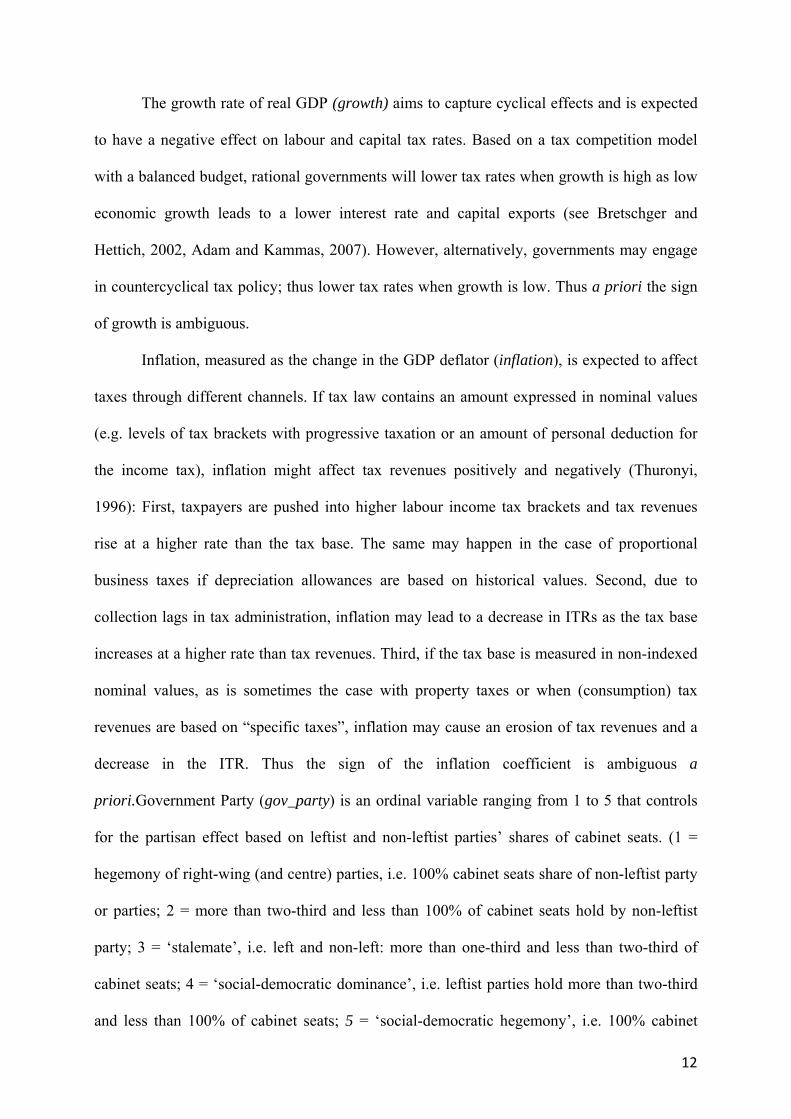
The growth rate of real GDP (growth) aims to capture cyclical effects and is expected
to have a negative effect on labour and capital tax rates. Based on a tax competition model
with a balanced budget, rational governments will lower tax rates when growth is high as low
economic growth leads to a lower interest rate and capital exports (see Bretschger and
Hettich, 2002, Adam and Kammas, 2007). However, alternatively, governments may engage
in countercyclical tax policy; thus lower tax rates when growth is low. Thus a priori the sign
of growth is ambiguous.
Inflation, measured as the change in the GDP deflator (inflation), is expected to affect
taxes through different channels. If tax law contains an amount expressed in nominal values
(e.g. levels of tax brackets with progressive taxation or an amount of personal deduction for
the income tax), inflation might affect tax revenues positively and negatively (Thuronyi,
1996): First, taxpayers are pushed into higher labour income tax brackets and tax revenues
rise at a higher rate than the tax base. The same may happen in the case of proportional
business taxes if depreciation allowances are based on historical values. Second, due to
collection lags in tax administration, inflation may lead to a decrease in ITRs as the tax base
increases at a higher rate than tax revenues. Third, if the tax base is measured in non-indexed
nominal values, as is sometimes the case with property taxes or when (consumption) tax
revenues are based on “specific taxes”, inflation may cause an erosion of tax revenues and a
decrease in the ITR. Thus the sign of the inflation coefficient is ambiguous a
priori.Government Party (gov_party) is an ordinal variable ranging from 1 to 5 that controls
for the partisan effect based on leftist and non-leftist parties’ shares of cabinet seats. (1 =
hegemony of right-wing (and centre) parties, i.e. 100% cabinet seats share of non-leftist party
or parties; 2 = more than two-third and less than 100% of cabinet seats hold by non-leftist
party; 3 = ‘stalemate’, i.e. left and non-left: more than one-third and less than two-third of
cabinet seats; 4 = ‘social-democratic dominance’, i.e. leftist parties hold more than two-third
and less than 100% of cabinet seats; 5 = ‘social-democratic hegemony’, i.e. 100% cabinet
13
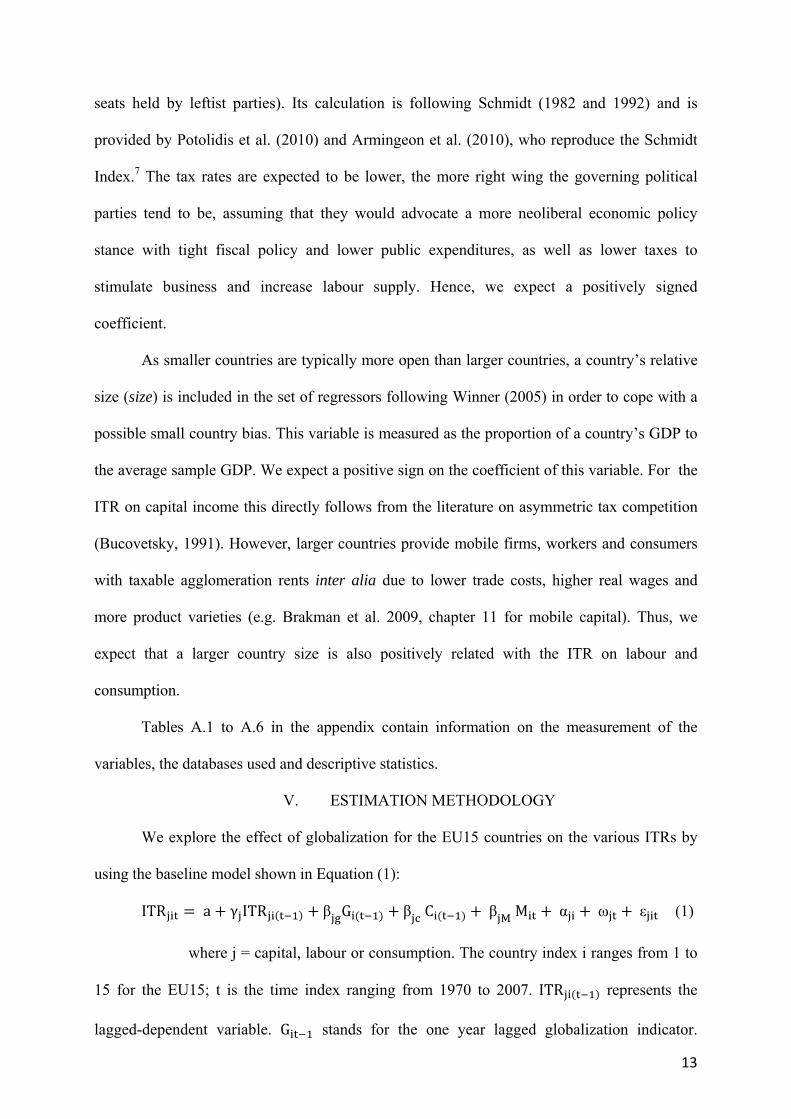
seats held by leftist parties). Its calculation is following Schmidt (1982 and 1992) and is
provided by Potolidis et al. (2010) and Armingeon et al. (2010), who reproduce the Schmidt
Index.7 The tax rates are expected to be lower, the more right wing the governing political
parties tend to be, assuming that they would advocate a more neoliberal economic policy
stance with tight fiscal policy and lower public expenditures, as well as lower taxes to
stimulate business and increase labour supply. Hence, we expect a positively signed
coefficient.
As smaller countries are typically more open than larger countries, a country’s relative
size (size) is included in the set of regressors following Winner (2005) in order to cope with a
possible small country bias. This variable is measured as the proportion of a country’s GDP to
the average sample GDP. We expect a positive sign on the coefficient of this variable. For the
ITR on capital income this directly follows from the literature on asymmetric tax competition
(Bucovetsky, 1991). However, larger countries provide mobile firms, workers and consumers
with taxable agglomeration rents inter alia due to lower trade costs, higher real wages and
more product varieties (e.g. Brakman et al. 2009, chapter 11 for mobile capital). Thus, we
expect that a larger country size is also positively related with the ITR on labour and
consumption.
Tables A.1 to A.6 in the appendix contain information on the measurement of the
variables, the databases used and descriptive statistics.
V. ESTIMATION METHODOLOGY
We explore the effect of globalization for the EU15 countries on the various ITRs by
using the baseline model shown in Equation (1):
ITR a γ ITR β G β C β M M α ω ε (1)
where j = capital, labour or consumption. The country index i ranges from 1 to
15 for the EU15; t is the time index ranging from 1970 to 2007. ITR represents the
lagged-dependent variable. G stands for the one year lagged globalization indicator.

14
C and M are the matrices capturing the one year lagged and the contemporaneous control
variables as further detailed below. α captures country fixed effects, ωjt captures time fixed
effects and ε is the remainder error term.
The second step is to investigate if there are differences of the effect of globalization
between countries with a high and low ITR, respectively.
ITR a γ ITR β G δ H G β C β M M
τ H T φ H α ω ε (2)
In equation (2) a dummy variable H is interacted with the lagged globalization
indicator, which is 1 if the ITR of the respective country is higher than the mean ITR of the
EU15 countries in time t. For most countries H is either 1 or 0 for all years; but there are
also intermediate country cases where the dummy changes value for some years. In order to
avoid an ad hoc classification of these intermediate countries as either high or low tax
countries for all years, we opted for using a time variant dummy. Thus for most cases, H
captures a structural effect for high vs. low tax countries. In the intermediate cases where a
country changes position, for e.g. a country, which had traditionally lower than average ITR,
might find have a higher than average ITR in one year when several other countries decrease
taxes, and they may try to respond to this next year. Since H is time variant, we also added
the intercept dummy itself despite the presence of country fixed effects (see e.g. Brambor et
al. 2006). Furthermore a trend H T is introduced, which is specific to the countries with
higher than average ITR.
As described in section 2, we further test for the heterogeneity of the globalization
effects in different Western European welfare state regimes, i.e. the social-democratic,
conservative, liberal and southern regime. Therefore, the following equation is estimated:
15
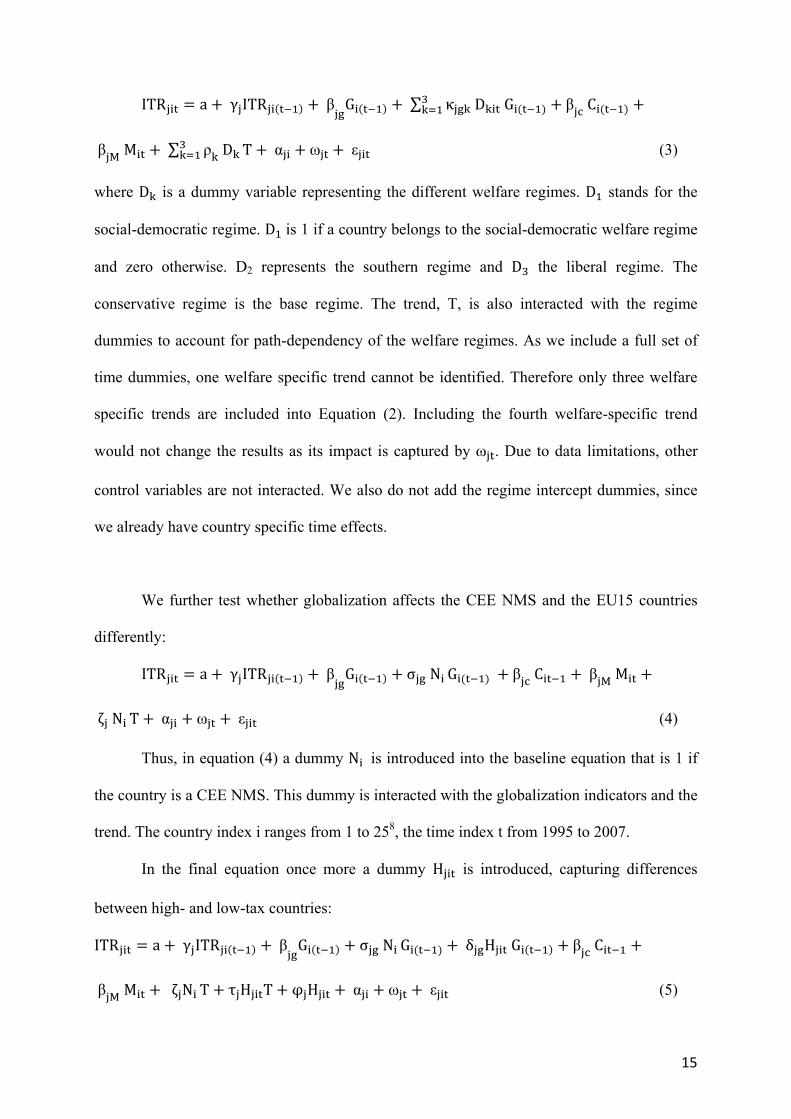
ITR a γ ITR β G ∑ κ D G β C
β M M ∑ ρ D T α ω ε (3)
where D is a dummy variable representing the different welfare regimes. D stands for the
social-democratic regime. D is 1 if a country belongs to the social-democratic welfare regime
and zero otherwise. D2 represents the southern regime and D the liberal regime. The
conservative regime is the base regime. The trend, T, is also interacted with the regime
dummies to account for path-dependency of the welfare regimes. As we include a full set of
time dummies, one welfare specific trend cannot be identified. Therefore only three welfare
specific trends are included into Equation (2). Including the fourth welfare-specific trend
would not change the results as its impact is captured by ω . Due to data limitations, other
control variables are not interacted. We also do not add the regime intercept dummies, since
we already have country specific time effects.
We further test whether globalization affects the CEE NMS and the EU15 countries
differently:
ITR a γ ITR β G σ N G β C β M M
ζ N T α ω ε (4)
Thus, in equation (4) a dummy N is introduced into the baseline equation that is 1 if
the country is a CEE NMS. This dummy is interacted with the globalization indicators and the
trend. The country index i ranges from 1 to 258, the time index t from 1995 to 2007.
In the final equation once more a dummy H is introduced, capturing differences
between high- and low-tax countries:
ITR a γ ITR β G σ N G δ H G β C
β M M ζ N T τ H T φ H α ω ε (5)

16
Thereby the effects of globalization in the EU15 countries with lower than average
ITRs can be identified by the coefficient β , in the EU15 countries with higher than average
ITRs by the coefficient β + δ , in the CEE NMS with lower than average ITRs by the
coefficient β σ , and in the CEE NMS with higher than average ITRs by β σ δ .
The globalization indices as well as all the control variables except the fraction of
elderly people and the government cabinet gravity, enter into Equations (1)-(5) with a one
year lag. This is done for two reasons: First, to cope with time lags in the political and fiscal
decision process and, second, to mitigate potential problems due to endogeneity. A better way
to cope with endogeneity issues would be to apply a GMM-approach. However, due to the low
number of cross-sections (countries), meaningful GMM based estimation of the Arellano and
Bond (1991) type is precluded (also see Potrafke, 2009).9 A second best approach is to use
lagged values of the right hand side variables (see Wooldridge, 2002: 301). Moreover, as we
include fixed country-effects in addition to the lagged dependent variable results are biased for
short T applications (see Nickell 1981). This poses only minor problems in case of the EU15
country sample. In this case the time span ranges from 1970 to 2007. As shown in Judson and
Owen (1999) the Least Square Dummy variable estimator with lagged dependent variable
(LSDV) performs comparably well in applications based on unbalanced panels.10 In case of the
aggregate pool including the CEE NMS the time span covered is lower (1995-2007). The
results for this pool of countries must therefore be seen as indicative rather than conclusive.
In each estimation the variance-covariance-matrix of the remainder error term, εjit, is
calculated using the approach developed by Newey and West (1987). Therefore, standard
errors are fully robust with respect to serial correlation as well as general heteroscedasticity
(see Baum et al., 2007).11

17
VI. ESTIMATION RESULTS
VI.1 Globalization and Implicit Tax Rates in the EU15
The first six columns of Table 1 show the results for the basic specification in
Equation (1) for the EU15 using two alternative KOF globalization indices among the
explanatory variables. The lagged dependent variables are significant in all cases. However,
globalization seems to matter only for the ITR on labour income. Specifically, KOFecon
carries a significant positive coefficient which implies that ceteris paribus economic
globalization exerts an upward pressure on the implicit tax rate on labour income.
Specifically, an increase in economic globalization by 1 percentage point increases the ITR on
labour income by 0.75 percentage points.12
Concerning control variables Table 1 shows that most variables fall short of statistical
significance. This is due to the inclusion of the lagged dependent variable which absorbs most
of the explanatory power of regressor variables. In line with the theoretical predictions (see
Bucovetsky, 1991; Brakman et al. 2009) and empirical findings (also see Adam and Kammas,
2007; Bretschger and Hettich, 2002; Garretsen and Peeters, 2007; Winner, 2005) we can
establish that a country’s relative size has a positive effect on the ITR on capital income:
Larger countries have a higher tax burden on capital.
[Table 1 about here]
The fraction of elderly people, total government expenditures as well as the debt level
have a positive effect on the ITR on labour income. Thus, higher fiscal demands due to
increasing total expenditures and the shift of expenditures towards old age contributions as
well as debt payments are financed via taxes on labour income.
In columns (7) to (12) a dummy, which is 1 if the implicit tax rate of a country is
higher than the mean ITR of the EU15, is interacted with the KOF indices. This intends to

18
show whether countries with above average ITRs react differently to globalization pressures
than low ITR countries do. F-tests for the joint significance of the KOF index and the
interaction dummy are reported at the end of the Table. Note, that we do not include the
dummy variable as a separate regressor since we have country fixed effects included.
Compared to columns (1) to (6) results for the ITR on labour and capital income remain
stable. Column (9), however, indicates that countries with an ITR on consumption higher than
average decrease their tax rate in response to globalization (though the statistically significant
effect is due to total globalization and not economic globalization), while there is no
significant effect on ITR on consumption in the countries with a below average ITR. Thus
there is a convergence in terms of the ITR on consumption rather than an overall decline.
Taken together the results contained in Table 1 imply that globalization does not exert
any downward (or upward) pressure on the ITR of capital which is in line with many related
studies (see below) but somewhat against the public perception. Yet, we find robust evidence
that globalization increases the taxation of labour income, especially in countries with an
above average ITR. Thus, a relative shift towards taxation of labour income due to
globalization pressures is likely.
How do our results compare to related literature? Our results pertaining to the absence
of a significant effect of globalization on ITR on capital income are in line with Dreher et al.
(2008), Swank and Steinmo (2002), and Swank (2006). However, Dreher (2006a) finds a
positive effect while Winner (2005) finds a negative effect of globalization on the ITR on
capital income. Adam and Kammas (2007), Bretschger (2008) and Bretschger and Hettich
(2002) likewise find a negative effect of globalization, but they use the ITR on corporate
income as the dependent variable. Their measures of globalization are also limited to the trade
volume, the Quinn indices on capital or goods market integration, or the IMF index of
restrictions on capital mobility. The difference in the sample (a subsample of the OECD
countries vs. EU15) can also explain part of the difference. As we show below, there are
19
differences in how different welfare regimes filter the effects of globalization on the ITRs.
Thus, the results are sensitive to the country sample. Swank (1998) and Swank (2006) provide
a further reason why globalization might have no effect on ITR on capital income. He argues
that there has been a general policy shift from ‘market conforming’ to ‘market regulating’
policy caused by a spread of neoliberal policy and theory. Government’s aim changed from
redistribution to promoting growth by encouraging investment. So the change in tax policy
may not only be caused by globalization, but also by a general change in policy. This policy
shift is also in line with the cutting of the tax rates and broadening of the tax base, which
means that the policy goals shifted from redistribution towards efficiency as the deadweight-
loss of taxation depends in a non-linear way on the statutory tax rate and on the possibilities to
substitute taxable income with non-taxed items.
Regarding the ITR on labour, the positive effect of globalization in the EU15 is in line
with Dreher et al. (2008), Adam and Kammas (2007) and Winner (2005). Bretschger and
Hettich (2002) also find a shift of the tax burden to labour income, although they do not
estimate the effect on the ITR on labour income separately, but rather in the form of the ratio
of taxes on capital to labour. However, Dreher (2006a) finds no effect and Swank and
Steinmo (2002) find a negative effect on the ITR on labour income.
Our finding of no globalization effect on the ITR on consumption is well established
in the literature (see e.g. Swank and Steinmo, 2002; Dreher, 2006a; Dreher et al., 2008). Our
findings indicate that there is only a downward convergence effect in the countries with
higher than average ITR on consumption; however other studies do not test such a
specification.
Given the upward pressure of globalization on the ITR on labour income, an
interesting follow up question is how the composition of tax revenues changes in response to
globalization. Although the share of a tax base in total tax revenues does not measure the
average effective tax burden born by a particular category, the trends of its share shows
20
whether revenues from a particular tax base are especially influenced by the globalization
process. To address this question, we estimate the effect of globalization on the share of taxes
on labour and capital income and consumption in total tax revenues using the same control
variables. The results are reported in Table 2. Interestingly there is no significant effect of
globalization on the share of a particular tax base in total tax revenues. In particular no
positive effect on the share of taxes on labour can be established despite the robust positive
effect of globalization on the ITR on labour income. This signals that labour income, the
denominator of the ITR on labour, increases less than total tax revenues over time. The
growth in total tax revenues usually maps the growth in GDP. Thus, our result of no impact of
globalization on the share of labour income taxes in total income taxes despite a positive
globalization impact on the ITR on labour income is in line with the declining share of wages
in GDP in all the EU15 countries since the 1980s.
[Table 2 about here]
VI.2 Globalization, Taxes and Welfare Regimes in the EU15 Table 3 reports the results in case the EU15 are split into 4 welfare regimes based on the
(extended) Esping-Andersen classification. Again, the lagged dependent variable is highly
significant in each case. Yet, there is an interesting difference between the welfare regimes.
According to our estimations there is a significant negative effect of globalization on the ITR
on capital income in the social-democratic welfare regime. The pressure in the social-
democratic countries on the ITR on capital indicates a convergence towards the lower
European average. Thus, our results indicate convergence rather than a race to the bottom in
effective capital income taxation.
Both globalization indices have a positive effect on the ITR on labour income in the
conservative regime (the base group). Results also imply that economic globalization exerts
an upward pressure on labour income taxes in the social-democratic and the liberal welfare
regimes: An increase of economic globalization by one percentage point leads to an increase

21
of the ITR on labour income by 0.95 percentage points in the conservative, 2.06 in the social-
democratic and 0.70 in the liberal regime.13 Although the individual coefficients, which
represent contrast to the base group are not statistically significant, the F-tests on joint
significance of the coefficients (base group plus contrasted regime) imply statistical
significance. Thus in all regimes except the southern regime globalization exerts a pressure to
increase taxes on labour income. This is interesting, as southern countries showed the
strongest increase in labour taxes. Apparently, this rise is unrelated to globalization pressures.
The economic effect of globalization on the ITR on labour income is strongest in the social
democratic countries. This might be explained by the prevailing social consensus in these
countries about having high taxes on labour income.
Regarding ITR on consumption results displayed in columns (5) and (6) are in favour
of a negative economic globalization impact in the conservative welfare regime. Moreover, a
negative pressure is also possible in the social-democratic regime. Yet, in this case the
statistical evidence is rather weak as the p-value of the F-test on joint significance of the
coefficients is only borderline significant (p-value of 0.091). These results are consistent with
our findings above about convergence in the ITR on consumption via a decline in the
countries with higher than average ITR.
[Table 3 about here]
Taken together these results shed more light on the relationship between globalization
and implicit tax rates. In particular, globalization has an impact on all three types of effective
tax rates, capital, labour and consumption, which contrasts to the results displayed in Table 1
(where only ITR on labour income is related to globalization). Globalization determines tax
policy especially in the social-democratic and the conservative welfare regime. Social
democratic countries have decreased the tax burden on capital, but increased that on labour
due to (economic) globalization. This might be considered in line with the broad agreement of
the labour unions in the social-democratic countries to preserve the competitiveness of their
22
firms while preserving a certain level of social welfare regime. In the conservative welfare
regime especially labour and consumption taxation are hit by globalization pressures.
However, even in the liberal regime globalization exerts a positive impact on the ITR on
labour income. Thus, the positive relationship between globalization and the ITR on labour
income as established in Table 1 represents a common development across three out of the
four West European welfare regimes.
Finally we performed several robustness checks for the EU-15. First we excluded
inflation. Second we used unemployment instead of growth as proxy for cyclical effects, with
and without inflation. The results regarding globalization are robust and can be received upon
request.
VI.3 Globalization and Taxes in the EU15 and CEE NMS
Next we compare the effects of globalization on taxation in the EU15 and the CEE NMS.
Since the data for the CEE NMS start in 1995, we estimate the effects in the EU15 also from
1995 onwards. Therefore the results for the EU15 in this section are not strictly comparable to
the ones in Section VI.1.14 At the first step, we test the differences in the reaction of the old
and new member states to globalization. Again we do not estimate a full interaction model
with dummies for the control variables to gain degrees of freedom. Table 4 shows the results
for the pool of the EU15 and the CEE NMS for the period 1995-2007 with the interaction
dummy for the CEE NMS as shown in Equation (4). The EU15 is the base group, and the
effect of KOF indices in the CEE NMS is given by the summation of the base coefficient and
the interaction dummy. In Columns (7)-(12) a second interaction dummy is introduced that is
zero if the ITR of a country is lower than the EU-25 mean ITR, and one otherwise (see
Equation (5)). Thus, four different country groups can be distinguished: first, the EU15
countries with low ITRs as the base group; second, the EU15 countries with high ITRs; third,
the CEE NMS with low ITRs; and fourth the CEE NMS with high ITRs. The summation of
the coefficients of KOF index and the interaction dummy for the CEE NMS shows the effect
23
of globalization in the CEE NMS with ITR lower than average, whereas the summation of the
coefficients of KOF index, the interaction dummy for the CEE NMS, and the interaction
dummy for the countries with ITR higher than EU25 average shows the effect of globalization
in the CEE NMS with ITR higher than average. The F-tests for joint significance are reported
at the end of the Table.
[Table 4 about here]
Again, the lagged dependent variable is statistically significant in each case. Economic
globalization has now a negative effect on the ITR on capital income in the EU15 in the
period after 1995, in contrast to the estimations in Table 1 for the whole sample. The effect is
valid for the EU15 countries with both a lower and higher than average ITR on capital as can
be seen in columns (7) and (8).
The ITR on labour income in both groups in the EU15 (high and low ITR countries) is
positively affected by KOFecon, but there is no significant effect in the CEE NMS.
Globalization (both indicators) exerts a negative impact on the ITR on consumption in
the CEE NMS; but when the countries with higher than average ITR are distinguished
interesting results emerge, particularly in the case of economic globalization: The CEE NMS
with a higher than average ITR on consumption decrease their tax rates, whereas there is no
significant response in the CEE NMS with lower than average ITR. Again there is some
evidence of convergence. The effect of overall globalization is negative and statistically
similar in both groups of CEE NMS though. This may be related to the reforms during the
process of EU accession in all the CEE NMS. Specifically, CEE NMS had to realize the
acquis communautaire of the EU which is rather far-reaching in the field of indirect taxation.
In the EU15, although there is no significant effect on the ITR on consumption in the
aggregate, the results in Column (12) show that the EU15 countries with lower than average
ITR on consumption increase their tax rate in response to globalization, while the other EU15
countries keep their tax rates stable. These results are consistent with the results for the EU15
24
with the full sample; now convergence is taking place via an increase in the tax rates in
countries with lower than average ITR on consumption rather than a decline in those with
taxes higher than average.
The reason for the lack of a significant effect in the CEE NMS concerning the ITR on
labour or capital income could be that the increase in the formalization of these economies
along with international integration might offset any negative effects of globalization on taxes
(Duman, 2009). However, we are not able to test this argument due to lack of time series data
on the informal economy. Of course, another problem can be the limited data availability
leading to high standard errors.
Regarding the control variables, GDP growth and inflation have a positive effect on
the ITR on capital income. The inflation rate has a negative impact on labour taxation, while
size, government expenditure and public debt have positive effects. The ITR on consumption
is negatively affected by the relative size of a country, as well as oldage and government
party. Government expenditures have a positive impact on consumption taxes.
Taken together, in the CEE NMS there is no effect of globalization on the ITR on
labour and capital income but we find a negative impact on the ITR on consumption,
particularly in the CEE NMS with higher than average ITR in the case of economic
globalization. In the EU15 the upward pressure of globalization on the ITR on labour are once
again robust findings. There is some evidence of a negative effect on the ITR on capital in the
EU15 in the post-1995 period. However we would be cautious about this latter result as it
stands at odds with the more reliable findings based on the full EU15 sample. In the EU15, in
the post-1995 period the EU15 countries with lower than average ITR on consumption
increase their tax rate in response to globalization, while the other EU15 countries keep their
tax rates stable.
Finally we again estimate the effects of globalization on the composition of the tax
revenues. The results are in Table 5. In the EU15 consistent with the results for the full
25
sample, there is no significant effect on the share of taxes on labour income; but according to
the results for the post-1995 period, the share of taxes on capital income is decreasing in
response to economic globalization, and the share of taxes on consumption are increasing. So
there is a shift towards indirect taxes with a more regressive nature, which fall more heavily
on the immobile factor of production and a decline in the tax share of the mobile factor.
Interestingly, the opposite is true for the CEE NMS: the share of taxes on capital increases
and that on consumption decreases. These findings are consistent with the estimation results
for the ITRs. The significant positive effect on the share of taxes on capital income in the
CEE NMS may be related to the increase in FDI and profit income in these countries after the
transition.
[Table 5 about here]
VII. SUMMARY AND CONCLUSIONS
This paper analyzes the effects of globalization on the ITR on labour income, capital
income, and consumption with an emphasis on the differences among welfare regimes in the
EU15 and also between the EU15 and CEE NMS.
Overall, our results confirm that globalization leads to a higher tax burden on labour
income in the EU15: there is a positive effect of globalization on the ITR on labour income in
the EU15, but no effect on the ITR on capital income There is evidence of convergence in
terms of the ITR on consumption as the countries with higher than average ITR decrease their
ITR on consumption..
However, there are differences in the response to globalization across the welfare
regimes within the EU15. Globalization has a significant negative effect on the ITR on capital
income in the social-democratic regime, but no significant effect in the other welfare regimes.
Regarding the ITR on consumption, there is a significant negative effect of globalization in
the social-democratic and conservative regimes. In the case of the ITR on labour income we

26
find evidence that globalization causes an increase in all the welfare regimes except the
southern regime.
There are also important differences between the EU15 and the CEE NMS; in the
latter we find no effect of globalization on the ITR on labour and capital income but a
negative impact on the ITR on consumption. Interestingly there is again evidence of
convergence, particularly in response to economic globalization as the CEE NMS with higher
than average ITR on consumption decrease their tax rates in response to globalization. .

27
References Adam, A. and P. Kammas. “Tax policy in a Globalized World: Is It Politics After All?”
Public Choice. 133, 2007, 321-341.
Aidukaite, J. The Emergence of the Post-Socialist Welfare State The Case of the Baltic States:
Estonia, Latvia and Lithuania, Södertörn Doctoral Dissertations, 2004.
Arellano, M. and S. Bond. "Some Tests of Specification for Panel Data: Monte Carlo
Evidence and an Application to Employment Equations", Review of Economic Studies.
58, 1991, 277-297.
Armingeon, K., R. Careja, S. Engler, M. Gerber, P. Leimgruber, P. Potolidis. Comparative
Political Data Set III 1990-2008, Institute of Political Science, University of Berne
2010.
Baum, C.F, M. Schaffer, S. Stillman. Enhanced routines for instrumental variables/GMM
estimation and testing. Boston College Working Papers in Economics 667, Boston
College Department of Economics, 2007.
Bellak, C. and M. Leibrecht. “Do low corporate income tax rates attract FDI? - Evidence from
Central- and East European Countries”, Applied Economics. 41(21), 2009, 2691-2703.
Bjørnskov, C. and N. Potrafke.. Politics and Privatization in Central and Eastern Europe: A
Panel Data Analysis, Social Science Research Network, 2010. Available at SSRN:
http://ssrn.com/abstract=1319730, 2010.
Bohle, D. and B. Greskovits. “Neoliberalism Embedded Neoliberalism and Neocorporatism:
Towards Transnational Capitalism in Central-Eastern Europe”, West European
Politics. 30, 2007, 443-366.
Bonoli, G. (1997). “Classifying welfare states: a two-dimension approach”, Journal of Social
Policy. 26:351-172.
Brakman, S., H. Garretsen and C. von Marreijk. “The New Introduction to Geographical
Economics”. Cambridge: Cambridge University Press, 2009.
Brambor, T., W. Clark and M. Golder. "Understanding Interaction Models: Improving
Empirical Analyses", Political Analysis. 14, 2006, 63-82.
Bretschger, L. Taxes, mobile capital, and economic dynamics in a globalising world, CER-
ETH Working Paper. 05/43, 2008.
Bretschger, L. and F. Hettich. “Globalisation, capital mobility and tax competition: theory and
evidence for OECD Countries”, European Journal of Political Economy. 18, 2002,
695-716.
Brueckner, J.K. “A Tiebout/Tax-Competition Model”, Journal of Public Economics. 77,
2000, 285-30.
28
Bruno, G. Approximating the Bias of the LSDV Estimator for Dynamic Unbalanced Panel
Data Models, KITeS Working Papers 159, KITeS, Centre for Knowledge,
Internationalization and Technology Studies, Universita' Bocconi, Milano, Italy,
revised Jul 2004.
Bucovetsky, S. “Asymmetric Tax Competition”, Journal of Urban Economics. 30, 1991, 167-
181.
Campbell, J.L. “Fiscal Sociology in an Age of Globalization: Comparing Tax Regimes in
Advanced Capitalist Countries”, in: Victor Nee and Richard Swedberg (eds.), The
Economic Sociology of Capitalism. Princeton: Princeton University Press, 2005, 391-
418.
Clausing, K. Corporate Tax Revenues in OECD Countries”, International Tax and Public
Finance. 14, 2007, 115–33.
Devereux, M.P. and R. Griffith. The taxation of discrete investment choices. IFS Working
paper series, no. W98/16, 1998.
Devereux, M.P., R. Griffith, and A. Klemm. “Corporate Income Tax Reforms and
International Tax Competition”, Economic Policy. 17, 2002, 451-495.
Devereux, M.P. Developments in the Taxation of Corporate Profit in the OECD Since 1965:
Rates, Bases and Revenues. Working Papers 0704, Oxford University Centre for
Business Taxation, 2007.
Devereux, M.P., C. Elschner, D. Endres, J.H. Heckemeyer, M. Overesch, U. Schreiber and C.
Spengel. Project for the EU Commission TAXUD/2005/DE/3 10: final report, Centre
for European Economic Research (ZEW) and University of Mannheim, Mannheim,
2008.
Dreher, A. “The Influence of Globalization on Taxes and Social Policy: An Empirical
Analysis for OECD Countries”, European Journal of Political Economy. 22, 2006a,
179-201.
Dreher, A. “Does Globalization Affect Growth? Evidence from a new Index of Globalization”,
Applied Economics. 38, 2006b, 1091-1110.
Dreher, A., N. Gaston and P. Martens. Measuring Globalization – Gauging its Consequences,
New York: Springer, 2008.
Duman, A. Flux or Fixed: Tax Reforms, Informal Economy and Foreign Investment in New
EU Member States, Vienna University of Economics and Business, Department of
Economics and Research Institute International Taxation Discussion Paper No 36,
2009.
29
Esping-Andersen, G. The Three Worlds of Welfare Capitalism, Princeton: Princeton University
Press, 1990.
Esping-Andersen, G. “After the golden age? Welfare state dilemmas in a global economy”, in:
Esping-Andersen, Gosta (ed.), Welfare States in Transition, London: SAGE
Publications, 1996, 1-31.
European Commission. Structures of the taxation systems in the European Union,
Luxembourg: Eurostat Statistical Books, 2000.
European Commission. Taxation Trends in the European Union, Luxembourg: Eurostat
Statistical Books, 2008.
European Commission. Taxation Trends in the European Union, Luxembourg: Eurostat
Statistical Books, 2009.
Fenger, M.. “Welfare regimes in Central and Eastern Europe: Incorporating post-communist
countries in a welfare regime typology”, Contemporary Issues and Ideas in Social
Sciences, 3, 2007.
Ferge, Z. „Welfare and 'ill-fare' systems in Central-Eastern Europe,“ in R. Sykes, B. Palier, P.
M. Prior (eds.) Globalization and European welfare states – challenges and change.
Houndmills-Basingstoke: Palgrave, 2001, 127-153
Ferrara, M. “The Southern Model of Welfare in Social Europe”, Journal of European Social
Policy. 6, 1996, 179-189.
Ganghof, S. Adjusting National Tax Policy to Economic Internationalization, Strategies and
Outcomes, in: Fritz W. Scharpf and Vivien A. Schmidt (eds.): From Vulnerability to
Competitiveness. Welfare and Work in the Global Economy, Volume II, Oxford:
Oxford University Press, 2000, 597-64.
Garretsen, H. and J. Peeters. Capital Mobility, Agglomeration and Corporate Tax Rates: Is the
Race to the Bottom for Real, CESifo Economic Studies 2007, June 4
Garretsen, H. and J. Peeters, “FDI and the relevance of spatial linkages: do third-country
effects matter for Dutch FDI?”, Review of World Economics. 145, 2009, 3219-338.
Gemmel, N., R. Kneller and I. Sanz . “Foreign investment, international trade and the size and
structure of public expenditures”, European Journal of Political Economy. 24, 2008,
151-171.
Glyn, A. Capitalism Unleashed, Finance, Globalization and Welfare. Oxford: Oxford
University Press, 2007
Havlik, P. and M. Landesmann. Structural change, productivity and employment in the new
EU member states, in: Economic restructuring and labour markets in the accession

30
countries, The Vienna Institute for International Economic Studies Research Project
commissioned by EU DG Employment, Social Affairs and Equal Opportunities, 2005.
Judson, R. and A. Owen. "Estimating dynamic panel data models: a guide for
macroeconomists", Economics Letters. 1999, 65, 9-15.
Kautto, M. and J. Kvist. “Parallel Trends, Persistent Diversity: Nordic Welfare States in the
European and Global Context”, Global Social Policy. 2, 2002, 189–208.
Keen, M., Y. Kim, and R. Varsano. “The ‘flat tax(es)’: principles and experience”,
International Tax and Public Finance. 15, 2008, 712–751.
Krogstrup, S. Are Corporate Taxes Racing to the Bottom in the European Union, Mimeo,
Graduate Institute of International Studies, Geneva, 2005.
Krogstrup, S. A Synthesis of Recent Developments in the Theory of Capital Tax Competition,
EPRU Working Paper Series 04-02, 2004.
Leibrecht, M., M. Klien and Ö. Onaran. “Globalization, welfare regimes and social protection
expenditures in Western and Eastern European countries.” Public Choice,
Forthcoming.
Lelkes, O. “A Great Leap Towards Liberalism? The Hungarian Welfare State”, International
Journal of Social Welfare. 9, 92-102, 2000.
Loretz, S. The Condition of Corporate Taxation in the OECD in a Wider Context, Oxford
Review of Economic Policy. 24, 2008, 639–60.
Mendoza, E. G., A. Razin and L.L. Tesar. “Effective Tax Rates in Macroeconomics Cross-
Country Estimates of Tax Rates on Factor Incomes and Consumption”, Journal of
Monetary Economics. 34, 1994, 297-323.
Newey, W.K. and K.D. West. “A simple, positive semi-definite, heteroscedasticity and
autocorrelation consistent covariance matrix”, Econometrica. 55, 1987, 703–708.
Nichols, A. and M. Schaffer . Cluster Errors in Stata. Paper presented at the 2007 UK Stata
Users Group meeting. Download at:
http://www.stata.com/meeting/13uk/nichols_crse.pdf
Nickell, S. J. "Biases in Dynamic Models with Fixed Effects", Econometrica. 1981, 49, 1417-
26.
Noelke, A. and A. Vliegenthart. “Enlarging the Varieties of Capitalism: The Emergence of
Dependent Market Economies in East Central Europe”, World Politics. 61, 2009, 600-
702.
Oates, W.E. Fiscal federalis, New York: Harcourt Brace Jovanovich, 1972.
31
Orenstein, M.A. and M.R. Haas. Globalization and the Future of the Welfare State, Pittsburgh:
University of Pittsburgh Press, 2005, 130-152.
Potolidis P., M. Gerber and P. Leimgruber. Comparative Political Data Set 1960-2008,
Institute of Political Science, University of Berne, 2010.
Potrafke, N. Social Expenditures as a Political Cue Ball? OECD Countries under
Examination, DIW discussion papers, Berlin, 2007.
Potrafke, N. “Did globalization restrict partisan politics? An empirical evaluation of social
expenditures in a panel of OECD countries”, Public Choice. 140, 2009, 105-124.
Potrafke N. "Does government ideology influence deregulation of product markets? Empirical
evidence from OECD countries", Public Choice. 143, 2010, 135-155
Prasad, N. Policies for redistribution: The use of taxes and social transfers, ILO discussion
papers, Geneva, 2008.
Quinn, D. “The Correlates of Change in International Financial Regulation”, The American
Political Science Review. 91, 1997, 531-551.
Roodman, D. “How to do xtabond2: An introduction to difference and system GMM in
Stata", Stata Journal, StataCorp LP. 9(1), 2009, 86-136.
Schaffer, M.E. xtivreg2: Stata module to perform extended IV/2SLS, GMM and AC/HAC,
LIML and k-class regression for panel data models. Download at:
http://ideas.repec.org/c/boc/bocode/s456501.html, 2010.
Scharpf, F.W and V.A. Schmidt. „Introduction”, in: Fritz W. Scharpf and Vivian A. Schmidt
(eds.), Welfare and Work in the Open Economy, Vol. I: From Vulnerability to
Competitiveness, Oxford: Oxford University Press, 2000, 1-20.
Schmidt, M.G. Wohlfahrtsstaatliche Politik unter bürgerlichen und sozialdemokratischen
Regierungen. Ein internationaler Vergleich. Frankfurt a. M.: Campus, 1982.
Schmidt, M. G. Regierungen - parteipolitische Zusammensetzung, in: M. G. Schmidt (ed.),
Die westlichen Laender. Munich : C.H. Beck, 1992, 393–400.
Slemrod, J. “Are corporate Tax Rates, or Countries, Converging?” Journal of Public
Economics. 88, 2004, 1169-1186.
Standing, G. “Social protection in Central and Eastern Europe: a Tale of Slipping Anchors and
Torn Safety Nets”, in: Gosta Esping-Andersen (ed.). Welfare States in Transition,
London: Sage, 1996.
Swank, D. “Funding the Welfare State: Globalization and the Taxation of Business in
Advanced Economies”, Political Studies. 46, 1998, 671-692.

32
Swank, D. “Mobile capital, democratic institutions, and the public economy in advanced
industrial societies”, Journal of Comparative Policy Analysis. 3, 2001, 133-162.
Swank, D. “Tax Policy in an Era of Internationalization, Expanding the Spread of
Neoliberalism”, International Organization. 60, 2006, 847-882.
Swank, D. and S. Steinmo. “The New Political Economy of Taxation in Advanced Capitalist
Democracies”, American Journal of Political Science. 46, 2002, 642–55.
Tanzi, V. Taxation in an Integrating World, Washington D.C.: The Brookings Institution,
1995.
Thuronyi, V. “Adjusting Taxes for Inflation”, in: Victor Thuronyi: Tax Law Design and
Drafting, Volume, Washington D.C.: IMF, Chapter 13, 1996.
Wilson, J.D. “Theories of Tax Competition”, National Tax Journal. 52, 1999, 269-303.
Winner, H. “Has Tax Competition Emerged in OECD Countries? Evidence from Panel Data”,
International Tax and Public Finance. 12, 2005, 667-687.
Wooldridge, J. Econometric Analysis of Cross Section and Panel Data, Cambridge: MIT
Press, 2002.
World Bank. Special economic Zones: performance, lessons learned, and implications for
Zone development, April 2008, Washington, 2008.
Zodrow, G.R., and P. Mieszkowski. “Pigou, Tiebout, Property Taxation, and the
Underprovision of Local Public Goods”, Journal of Urban Economics. 19, 1986, 356-
370.
33
Figure 1a: Implicit tax rates on capital income in the EU15 and the CEE NMS, GDP-weighted
averages, 1970 – 2007
Figure 1b: Implicit tax rates on labour income in the EU15 and the CEE NMS, GDP-weighted
averages, 1970 – 2007
10
15
20
25
30
35
40
45
50
55
1970 1980 1990 2000
cee nms conservative southern social-dem liberal
10
15
20
25
30
35
40
45
50
55
1970 1980 1990 2000
cee nms conservative southern social-dem liberal
34
Figure 1c: Implicit tax rates on consumption in the EU15 and the CEE NMS, GDP-weighted
averages 1970 – 2007
Data Source: Eurostat, European Commission (2000)
Note: Due to shorter time series for some countries, the aggregation for the regimes start only at a common year,
as the aggregation of the unbalanced data for a regime could impose a misleading change in the trend of the
aggregate average for the regime as a whole. Therefore the aggregation for the conservative regime, the southern
regime and the social-democratic regime include the years 1980-2007 (1980-2006 for the ITR on capital income
in the southern regime) and the CEE NMS aggregations include the years 2000-2004 for the ITR on capital
income and 1999-2007 for the ITR on labour income and consumption.
10
15
20
25
30
35
40
45
50
55
1970 1980 1990 2000
cee nms conservative southern social-dem liberal
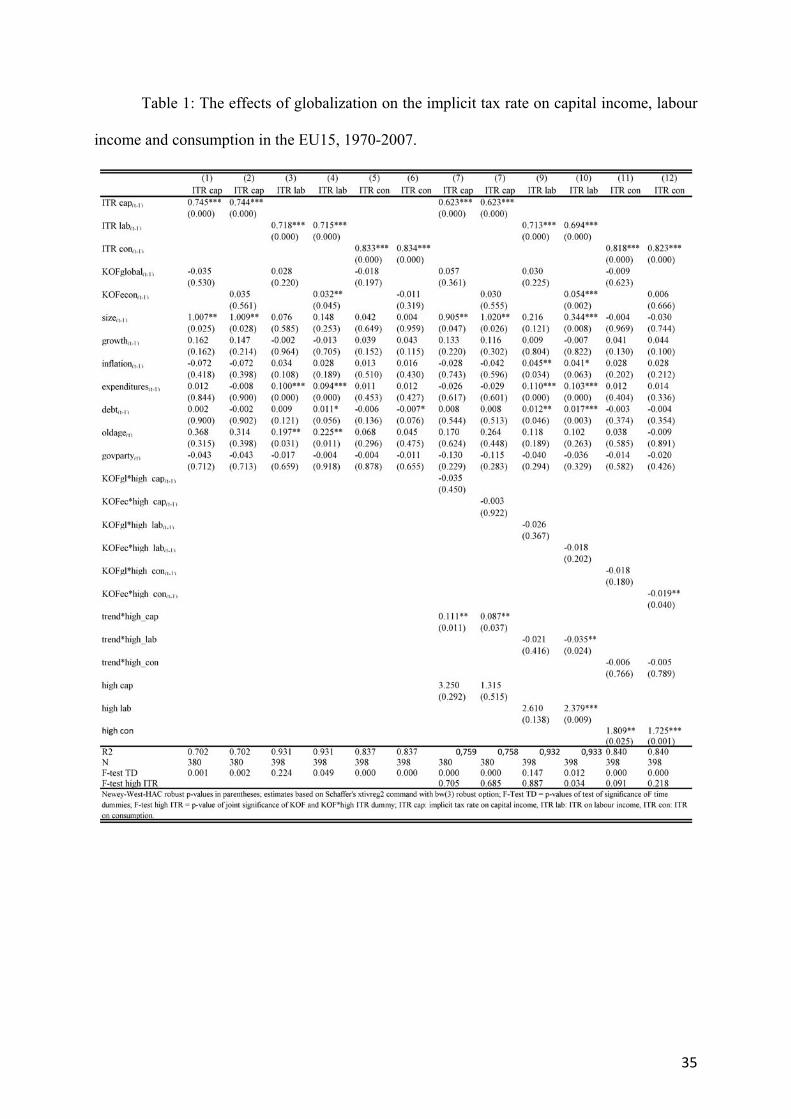
35
Table 1: The effects of globalization on the implicit tax rate on capital income, labour
income and consumption in the EU15, 1970-2007.

36
Table2: The effects of globalization on the share of taxes in total tax revenues in the
EU15, 1970-2007.

37
Table 3: The effects of globalization on the implicit tax rate on capital income, labour
income and consumption in different welfare regimes, 1970-2007

38
Table 4: The effects of globalization on the implicit tax rate on capital income, labour
income and consumption in the CEE NMS and EU15, 1995-2007.

39
Table 5: The effects of globalization on the share of taxes in total tax revenues in the
CEE NMS and EU15, 1995-2007.

40
Appendix
Table A. 1: Data Availability Implicit tax rates 1970-2007: BE, GE, DE, FR, IE, IT, LU (no ITR on capital available), NE, UK1980- 2007: AT,ES, FI, GR, PT, SE 1995-2007: CZ, EE, HU (ITR on capital since 2000), LT, LV, PL, SK, SI Later than 1995: BG 1999 - 2007, RO: ITR on capital 1998-2004, ITR on labour and consumption 1999-2007 All data from Eurostat; ITR on capital for BG, HU, RO, SI partly own calculations
Table A. 2: Data Sources and Description
Table A. 3: Data Summary – EU15, 1970-2007

41
Table A. 4: Data Summary – CEE NMS and EU15,1995-2007
Table A. 5: Correlation Matrix – EU15, 1970-2007
42
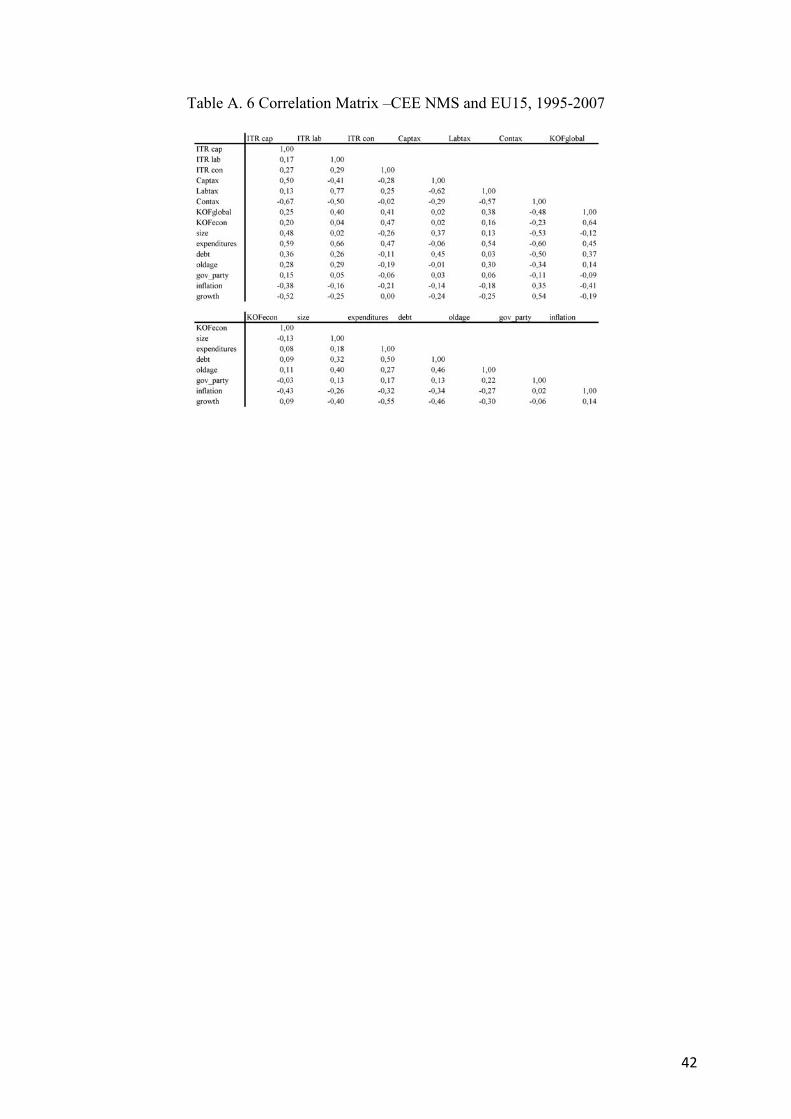
Table A. 6 Correlation Matrix –CEE NMS and EU15, 1995-2007
43
Endnotes
1 ITRs are also referred as average effective tax rates (AETR).
2 This is based on Garretsen and Peeters (2009), who use a dummy that is one if the statutory tax rates of the country are higher than the distance-weighted average of the statutory tax rate of the other countries.
3 The EMTR is based on the costs of capital of an investment project at the break-even point. The EATR measures the tax burden on a project earning a positive economic rent.
4 A widely used method to calculate ITRs using National Accounts data has been developed by Mendoza et al. (1994).
5 For data availability see Table A.1.
6 For the ITR on capital income tax revenue on capital income is divided by operating surplus (data source: Eurostat)
7 Potrafke (2007, 2009) also develops an index for government’s ideology; however the data available in these papers end in 2003 and only cover OECD countries. Bjørnskov and Potrafke (2010) calculate a similar index that also covers the CEE NMS; however their data is not available publicly to the best of our knowledge. Therefore we use the Schmidt Index. The index of Potrafke (2007, 2009) for the Western countries for the period until 2003 is broadly similar to the Schmidt index (the correlation coefficient between the two indices is very high (0.82) for the common sample); it seems to vary less in time and group more countries as left wing parties. Potrafke (2010) cites another ideology index developed by Bjørnskov (2008, cited in Potrafke 2010); and writes that the correlation coefficient between this index and that in Potrafke is 0.70. 8 We did not include Cyprus and Malta to this pool, since we wanted to keep the group of EU15 comparable to the former estimations, and it would not be correct to group Cyprus and Malta together with the transition economies in CEE.
9 The cross-sectional dimensions are 15 (EU15) and 25 (EU15 and CEE NMS aggregate pool), respectively.
10 In addition to the LSDV estimator we applied the GMM-estimator of Arellano and Bond (1991) using Roodman’s xtabond2 command in Stata (also see Roodman 2009). However, we did not end up with a specification that meets minimum requirements for reliable estimates: The Hansen-J test signals extreme overfitting (p-value of 1) and the test on second-order autocorrelation leads to a low p-value. We also applied the bias-corrected LSDV estimator developed by Bruno (2004), which is available as xtlsdvc command in Stata. However, to derive the bias-correction term this estimator also relies on Arellano and Bond type estimates, which, in our case, cannot be meaningfully retrieved. Note that the Bruno type estimator also does not solve the endogeneity issue with respect to right-hand side regressor other than the lagged dependent variable. For these reasons we stick to the LSDV estimator.
11 Newey-West-HAC robust standard errors are chosen as the alternative cluster-robust standard errors need a rather large number of clusters (here countries) for reliable inference. Typically a minimum cluster dimension of about 50 is required (see Nichols and Schaffer 2007). Estimations are carried out with Schaffer’s xtivreg2 Stata command (see Schaffer (2010)).
12 The total economic effect of globalisation on the implicit tax rates is calculated as the coefficient of the KOF index multiplied by the average change of the KOF index. The average change of KOFecon in the EU15 in the common period 1980-2007 is 23,375. 13 The total economic effect of globalisation on the implicit tax rates is calculated as the sum of the coefficient of the KOF index and the coefficient of the interaction of the KOF index and regime dummy multiplied by the average change of the KOF index in the respective regime. The average change in the common period 1980-2007 in the conservative regime of KOFglobal is 18,243 and of KOFecon 19,872; the average change in the

44
social-democratic regime of KOFglobal is 18,525 and of KOFecon 27,895; the average change of KOFecon in the liberal regime is 10,780.
14 As explicated above, the results presented in this section should be seen as indicative rather than conclusive due to the limited time range the estimates are based on.