how does disproportionality in discipline manifest in
TRANSCRIPT

University of Arkansas, Fayetteville University of Arkansas, Fayetteville
ScholarWorks@UARK ScholarWorks@UARK
Graduate Theses and Dissertations
5-2020
How does Disproportionality in Discipline Manifest in Rural How does Disproportionality in Discipline Manifest in Rural
Schools in Southeast Arkansas? Schools in Southeast Arkansas?
Julie Workman University of Arkansas, Fayetteville
Follow this and additional works at: https://scholarworks.uark.edu/etd
Part of the Disability and Equity in Education Commons, Educational Assessment, Evaluation, and
Research Commons, Educational Leadership Commons, Educational Psychology Commons, Educational
Sociology Commons, Education Policy Commons, Race and Ethnicity Commons, and the Social and
Philosophical Foundations of Education Commons
Citation Citation Workman, J. (2020). How does Disproportionality in Discipline Manifest in Rural Schools in Southeast Arkansas?. Graduate Theses and Dissertations Retrieved from https://scholarworks.uark.edu/etd/3573
This Dissertation is brought to you for free and open access by ScholarWorks@UARK. It has been accepted for inclusion in Graduate Theses and Dissertations by an authorized administrator of ScholarWorks@UARK. For more information, please contact [email protected].

How does Disproportionality in Discipline Manifest in Rural Schools in Southeast Arkansas?
A dissertation submitted in partial fulfillment
of the requirements for the degree of
Doctor of Education in Educational Leadership
by
Julie Workman
Texas A&M University
Bachelor of Science in Interdisciplinary Studies, 1993
Tarleton State University
Master of Education in Curriculum and Instruction, 2006
Arkansas State University
Educational Specialist in Educational Leadership, 2017
May 2020
University of Arkansas
This dissertation is approved for recommendation to the Graduate Council.
_____________________________________
Kevin Brady, Ph.D.
Dissertation Director
_____________________________________ _____________________________________
Ed Bengston, Ph.D. Kara Lasater, Ed.D.
Committee Member Committee Member

Abstract
African American students are disciplined in schools at disproportionately higher rates than
White students. This trend was first reported in 1975 in a report by the Children’s Defense Fund
and since that time, has been highly studied. However, most research has been conducted in
urban or suburban schools, with less known about disproportionate discipline in rural schools.
This study utilized an explanatory sequential mixed methods approach to explore
disproportionate discipline between African American and White students in five rural schools
located in Southeast Arkansas. The research questions were as follows: (1) How is discipline
disproportionality perceived in specific rural schools from the principal’s perspective? and (2)
What factors are most influential in explaining discipline disproportionality in specific rural
schools from the principal’s perspective? Quantitative data consisting of discipline infractions
and actions for the 2017-2018 school year were first collected and analyzed to establish if
disproportionate discipline was occurring and if so, to what degree. Interviews were then
conducted with the principal of each school to further understand their perspectives. Results
indicated that African American students were being disciplined at higher rates than White
students in all five schools, with one school having significantly lower rates of disproportionality
than the others. In answering the research questions, results suggest that these principals have
varied perceptions of disproportionate discipline in their schools. The most significant factor
causing disproportionate discipline in these schools based on their perspective was a cultural
mismatch between teachers and students, followed by student trauma and mental health issues.
Based on analysis of data, specific recommendations are made for principal actions and principal
preparation programs to better prepare leaders in identifying disproportionate discipline in their
schools and effective methods to address it.

Acknowledgements
I am so grateful to all of those who supported my work throughout this journey, including the
faculty in the Education Leadership department at the University of Arkansas, my dialogic
engagement partners, my coworkers, my family, and my participants. Thank you Dr. Kevin
Brady, for serving as my committee chair and for helping me find a way to explore this issue and
organize my thoughts. Thank you Dr. Ed Bengston and Dr. Kara Lasater for serving on my
committee and pushing me to think beyond the surface level at each point in my study. I want to
say a special thank you to my dialogic engagement partners who helped me think through my
data analysis. Dr. Tom MacKenzie (Dad), thank you for checking my math and helping me make
sense of the quantitative data analysis. You’ve been doing that for me since I first took Algebra
many years ago! Dr. Donna Wake, thank you for being my coding partner and for being such a
source of encouragement. Your guidance was invaluable in this process. Dr. Dawn Childress, my
fellow doctoral cohort member, thank you being a thought partner throughout my study and
helping me think through my data. Thank you to my coworkers, Marilyn Johnson, Karen Norton,
Rachel Schell, and Candace Smith, who listened to me talk endlessly about my study, cheered
me on, and offered feedback. I love working with you each day to support educators in
Arkansas! To my parents, Tom and Nancy MacKenzie, thank you for always supporting my
endeavors and believing I could do this, even when I didn’t. To my children, Hunter, Ryan, and
Libby Grace, thank you for giving me support to complete this study. You have encouraged me
when I felt I couldn’t go on, listened to me talk through my data, and given me the time to write
without complaining. My final thank you goes to my participants, who choose to go to work each
day on the front lines in public schools and fight the good fight. You opened up willingly to me
and shared your views, so that together we could find a way to have a deeper impact on students.

Dedication
I dedicate this dissertation to my children, Hunter, Ryan, and Libby Grace Workman, who have
been my inspiration throughout my career in education. You each have such unique gifts and I
am blessed to be your mother. Because of you, I have always worked hard to make things better
for those around me and tried to provide an example of how you can reach your goals with hard
work. I love all three of you and am so grateful that we shared this journey together.

Table of Contents
CHAPTER ONE – INTRODUCTION
Introduction ................................................................................................................................. 1
Problem Statement ...................................................................................................................... 1
Focus on Systemic Issues................................................................................................. 2
Is Directly Observable ..................................................................................................... 2
Is Actionable .................................................................................................................... 3
Connects to Broader Strategy of Improvement ............................................................... 4
Is High Leverage .............................................................................................................. 6
Research Questions ..................................................................................................................... 7
Overview of Methodology .......................................................................................................... 8
Positionality ................................................................................................................................ 9
Researcher's Role .............................................................................................................. 9
Assumptions .................................................................................................................... 10
Definition of Key Terms ........................................................................................................... 12
Organization of the Dissertation ............................................................................................... 12
CHAPTER TWO-REVIEW OF THE LITERATURE ................................................................. 14
Introduction ............................................................................................................................... 14
Review of the Literature ........................................................................................................... 15
Disproportionality and School Discipline ........................................................................ 15
Policies and School Discipline......................................................................................... 17
Federal Policies ....................................................................................................... 17
State Policies ........................................................................................................... 19

Zero Tolerance Policies .......................................................................................... 20
School Characteristics and School Discipline .................................................................. 23
Implicit Racial Bias........................................................................................................... 26
Critical Race Theory ........................................................................................................ 28
Conceptual Framework ............................................................................................................ 29
Chapter Summary ..................................................................................................................... 35
CHAPTER THREE – INQUIRY METHODS ............................................................................. 37
Introduction ............................................................................................................................... 37
Rationale ................................................................................................................................... 39
Problem Setting / Context ......................................................................................................... 41
Research Sample and Data Sources .......................................................................................... 44
Data Collection Methods .......................................................................................................... 45
Quantitative Data Collection ................................................................................... 45
Qualitative Data Collection..................................................................................... 45
Data Analysis Methods ............................................................................................................. 46
Quantitative Data Analysis ..................................................................................... 46
Qualitative Data Analysis ....................................................................................... 48
Trustworthiness ......................................................................................................................... 51
Limitations and Delimitations ................................................................................................... 54
Chapter Summary ..................................................................................................................... 55
CHAPTER FOUR – RESEARCH ANALYSIS AND RESULTS ............................................... 57
Introduction ............................................................................................................................... 57
Results for All Schools ............................................................................................................. 58

Quantitative Data Results ....................................................................................... 58
Qualitative Data Results ......................................................................................... 61
Theme 1 ......................................................................................................... 62
Sub-theme 1.1 ..................................................................................... 64
Sub-theme 1.2 ..................................................................................... 68
Sub-theme 1.3 ..................................................................................... 73
Theme 2 ......................................................................................................... 74
Sub-theme 2.1 ..................................................................................... 75
Sub-theme 2.2 ..................................................................................... 78
Sub-theme 2.3 ..................................................................................... 81
Summary Across Schools ....................................................................................... 82
Results for Individual Schools .................................................................................................. 84
Elementary A .......................................................................................................... 84
Quantitative Results ....................................................................................... 84
Infractions ........................................................................................... 87
Actions ................................................................................................ 89
Qualitative Results ........................................................................................ 90
Elementary B .......................................................................................................... 95
Quantitative Results ....................................................................................... 95
Infractions ........................................................................................... 97
Actions ................................................................................................ 99
Qualitative Results ...................................................................................... 101
Middle B ............................................................................................................... 106

Quantitative Results ..................................................................................... 106
Infractions ......................................................................................... 109
Actions .............................................................................................. 111
Qualitative Results ...................................................................................... 112
Elementary C ........................................................................................................ 115
Quantitative Results ..................................................................................... 115
Infractions ......................................................................................... 118
Actions .............................................................................................. 120
Qualitative Results ...................................................................................... 121
Middle C ............................................................................................................... 126
Quantitative Results ..................................................................................... 126
Infractions ......................................................................................... 129
Actions .............................................................................................. 131
Qualitative Results ...................................................................................... 132
Chapter Summary ................................................................................................................... 135
CHAPTER FIVE – DISCUSSION, RECOMMENDATIONS, AND CONCLUSION ............. 136
Introduction ............................................................................................................................. 136
Research Questions ................................................................................................................. 137
Research Question 1 ............................................................................................. 137
Awareness of Disproportionality .................................................................. 137
Perceptions of Degree of Disproportionality ................................................ 138
Reactions to Disproportionality .................................................................... 139
Research Question 2 .............................................................................................. 141

Cultural Mismatch ........................................................................................ 141
Student Trauma and Mental Health Issues ................................................... 145
Conceptual Framework Revisited ........................................................................................... 147
Critical Race Theory ...................................................................................................... 148
Implicit Bias ................................................................................................................... 151
Administrator and Teacher Training .............................................................................. 153
Discipline Policies and Practices ................................................................................... 157
Limitations and Delimitations ................................................................................................. 160
Implications for Professional Practice .................................................................................... 162
Primary Actions for Professional Practice ..................................................................... 162
Graduate Education Leadership Preparation Programs ................................................. 163
Data Systems and Training in Schools .......................................................................... 164
Implications for Future Research ............................................................................................ 165
Conclusion .............................................................................................................................. 166
REFERENCES ........................................................................................................................... 168
APPENDICES ............................................................................................................................ 176
Appendix A: Interview Protocols ........................................................................................... 176
Appendix B: Codebook........................................................................................................... 182
Appendix C: Informed Consent .............................................................................................. 185
Appendix D: IRB Approval Letter ......................................................................................... 187
Appendix E: Implicit Association Test ................................................................................... 188

List of Tables
Table 1 Number and Types of Sources Reviewed ...................................................................... 15
Table 2 District Characteristics ................................................................................................... 42
Table 3 School Characteristics .................................................................................................... 42
Table 4 Discipline Actions per 100 Students for 2017-2018 ...................................................... 43
Table 5 Administrator Characteristics ........................................................................................ 44
Table 6 Relative Difference in Composition of Infractions and Enrollment Composition for
Students in All Schools by Race .................................................................................. 59
Table 7 Relative Difference in Composition and Top Codes Across All Schools .................... 83
Table 8 Elementary A Enrollment and Discipline Infractions by Racial Group ....................... 85
Table 9 Composition Difference in Student Infractions and Actions in Elementary A ............ 86
Table 10 Composition Differences by Type of Infraction in Elementary A ............................... 88
Table 11 Composition Differences by Type of Action in Elementary A .................................... 89
Table 12 Elementary B Enrollment and Discipline Infractions by Racial Group ....................... 95
Table 13 Composition Difference in Student Infractions and Actions in Elementary B ............. 97
Table 14 Composition Differences by Type of Infraction in Elementary B................................ 99
Table 15 Composition Differences by Type of Action in Elementary B .................................. 100
Table 16 Middle B Enrollment and Discipline Infractions by Racial Group ............................ 107
Table 17 Composition Difference in Student Infractions and Actions in Middle B ................. 108
Table 18 Composition Differences by Type of Infraction in Middle B .................................... 110
Table 19 Composition Differences by Type of Action in Middle B ......................................... 111
Table 20 Elementary C Enrollment and Discipline Infractions by Racial Group ..................... 116
Table 21 Composition Difference in Student Infractions and Actions in Elementary C ........... 117
Table 22 Composition Differences by Type of Infraction in Elementary C.............................. 119

Table 23 Composition Differences by Type of Action in Elementary C .................................. 120
Table 24 Middle C Enrollment and Discipline Infractions by Racial Group ............................ 127
Table 25 Composition Difference in Student Infractions and Actions in Middle C ................. 128
Table 26 Composition Differences by Type of Infraction in Middle C .................................... 130
Table 27 Composition Differences by Type of Action in Middle C ......................................... 131

List of Figures
Figure 1 Conceptual Framework ................................................................................................ 33
Figure 2 Codes Generated from First- and Second-Cycle Coding Leading to Theme
Development ............................................................................................................. 50
Figure 3 Major Themes and Sub-themes Derived from Qualitative Data Analysis ................... 62
Figure 4 First Major Theme, Sub-themes, and Codes ................................................................ 64
Figure 5 Quantity of Codes for Principal-Culturally Aware, Taking Action, and Passive by
Leader ....................................................................................................................... 67
Figure 6 Highly Related Codes within Principal-Taking Action................................................ 69
Figure 7 Quantity of Codes within Principal-Taking Action by Leader .................................... 72
Figure 8 Second Major Theme, Sub-themes, and Codes ............................................................ 75
Figure 9 Composition of Population, Infractions, and Actions by Race in Elementary A ......... 86
Figure 10 Top Codes for Principal of Elementary A .................................................................. 91
Figure 11 Composition of Population, Infractions, and Actions by Race in Elementary B ....... 96
Figure 12 Top Codes for Principal of Elementary B ................................................................ 102
Figure 13 Composition of Population, Infractions, and Actions by Race in Middle B ............ 108
Figure 14 Top Codes for Principal of Middle B ....................................................................... 113
Figure 15 Composition of Population, Infractions, and Actions by Race in Elementary C ..... 117
Figure 16 Top Codes for Principal of Elementary C ................................................................ 122
Figure 17 Composition of Population, Infractions, and Actions by Race in Middle C ............ 128
Figure 18 Top Codes for Principal of Middle C ....................................................................... 132
Figure 19 Conceptual Framework ............................................................................................ 148

1
CHAPTER ONE - INTRODUCTION
Introduction
The purpose of this study was to examine the problem of practice found in the
disproportionate rate of student discipline actions for African American students compared to
White students in rural schools in Southeast Arkansas. Most of the research that has been
conducted up to this point has focused on pinpointing causes of disproportionate rates of
discipline using large urban or suburban schools (Noltemeyer & Mcloughlin, 2010). However,
considerably less research has been done in rural school communities to determine the
influencing factors of rates of disproportionality between White and African American students.
This dissertation examined racial disproportionality in discipline in several rural school districts
in Southeast Arkansas from the perspective of the principal to determine influences on racial
disproportionality in discipline in these schools. The goal of this research was to develop
awareness of the impact of these factors on African American students and inform school leaders
working in these rural schools toward improved equity in the school disciplinary process for all
students.
Problem Statement
The trend of African American students receiving discipline in schools at higher rates
than White students is one that has occurred for over four decades (Children’s Defense Fund,
1975; Losen, 2011; Skiba et al., 2002). Nationally, African American students receive
exclusionary discipline, including suspension and expulsion, at a rate of three times as great as
White students, which has increased since 1970 (Wald & Losen, 2003). On average, 50% of
African American students report that they have experienced suspension or expulsion at least one
time in their school career, while only 20% of White students report the same (Wallace et al.,

2
2008). Suspensions from school result in lost instructional time, putting students at a higher risk
for retention, dropping out, and contact with the juvenile court system (American Psychological
Association [APA], 2008). The purpose of this study was to examine the problem of practice
found in the disproportionate rate of student discipline infractions and actions for African
American students compared to White students in rural schools in Southeast Arkansas.
Focus on Systemic Issues
An overrepresentation of students of color in disciplinary practices is a systemic issue
that is complex in nature. The policies of each school, district, and state guide consequences for
disciplinary infractions, but teachers and administrators differ in how they apply those
consequences to students within a school or between schools. Individual district and school
culture also guides decisions about appropriate consequences, which may be impacted by racial
bias at several different points. The culture of the community, perceptions of students and their
families, and community history can also impact discipline decisions. This interaction between
the norms of the staff with the policies in place in the district creates a multi-layered issue with
many facets to explore.
Another layer of complexity is the impact that discipline consequences have on student
achievement. When a student is suspended from school, they miss instruction. A lack of
instruction often leads to lower achievement for students. In this way, African American students
who are already disadvantaged can be further disadvantaged by school discipline systems
because of the impact on their educational achievement (APA, 2008).
Is Directly Observable
Student discipline outcomes are observable through the school’s discipline data. In the
state of Arkansas, the Office of Educational Policy (OEP) compiles and reports school discipline

3
based on self-reported data from each school in compliance with Act 1329 of 2013. In a report
released in September 2018, they found that African American students in Arkansas receive an
average of 117.6 discipline infractions per 100 students, whereas white and other race students
receive 37 - 40 per 100 students (Anderson, 2018). This indicates that on average, more than one
discipline referral per African American student is occurring in the state. African American
students in Arkansas also receive higher rates of exclusionary discipline including Out-of-School
Suspension (OSS) and In-School-Suspension (ISS) at a rate of 25% of referrals, while White
students receive them at a rate of 13.5% (Anderson, 2018). This study also found using data from
student and infraction-level data from 2007 – 2017 that students who were engaged in
exclusionary discipline in the ninth grade had a lower rate of high school graduation and
enrollment in a post-secondary educational program. These statistics indicate that the
disproportionate rate of discipline for African American students is prevalent in the state of
Arkansas.
Is Actionable
The principal in a school is in a unique role to enact change in their own building and
impact student outcomes based on the decisions they make. This problem of practice is
actionable because insight gleaned from this study can inform the daily school discipline
practices of the administrators involved. By being aware of the impact of their discipline policies
and practices on African American students, administrators have the opportunity to make
changes. Based on the factors influencing disproportionality sifted from the data, work can begin
on crafting school systems that create equitable opportunities for all students. Analysis of recent
Arkansas discipline data by the OEP found that the differences in disproportionality by race for
students happens between schools in Arkansas and not within schools (Anderson, 2018). This

4
indicates that as a whole, principals may consistently implement their policies with both African
American and White students in their school, but that there are differences in rates of
disproportionality for entire schools. This also suggests that there are schools in Arkansas that
are not experiencing disproportionate discipline between African American and White students.
Identification of these schools and an in-depth look at their discipline policies and practices
could provide insight to help all schools take action to provide more equitable experiences for
students.
Connects to a Broader Strategy of Improvement
This problem connects to both individual school improvement as well as improvement of
the entire system of schools in Arkansas. The High Reliability Schools (HRS) framework by
Marzano was endorsed in 2019 by the Arkansas Department of Education as a model for school
improvement. The concept of a HRS mirrors that of High Reliability Organizations (HRO) in the
business world, which are organizations that “proactively prevent failure” (Marzano et al., 2014,
p. 1). Air traffic control towers, nuclear plants, and aircraft carriers are examples of organizations
that adhere to the HRO mindset, because failure on their part can have disastrous consequences
for many. Marzano adapted the framework to schools as a way to help them focus their work on
creating systems of constant monitoring based on the most important research-based factors for
schools to ensure that all students graduate fully prepared for college and career. The framework
consists of five progressive levels to be mastered to become a HRS. Each level contains leading
indicators which are the best practices related to that level and surveys are used to monitor
progress toward attainment of each indicator (Marzano, et al., 2014). Level 1, considered the
foundational level, is ensuring a Safe, Supportive, and Collaborative environment for all
students. Within this level, schools consider the level of safety perceived by students, parents,

5
staff, and administrators, as well as having systems in place to gather input from all stakeholders
and use that input to make decisions in the school. These areas can all be affected by
disproportionate discipline between African American and White students. This connection to
the HRS framework makes the work of this study relevant to school leaders in Arkansas because
it aligns with work they are already engaged in as they improve their schools.
In order for students to learn, they must be able to concentrate and focus in an orderly
environment. Teachers must feel that they are safe and have the ability to teach their classes
without excessive disruption, while at the same time feeling supported by their administrators.
Students who spend extended amounts of time away from the class due to discipline issues miss
out on important instruction and fall behind the other students. A positive school culture and
discipline practices that honor every student can lead to higher student achievement for students
in all ethnic groups. The school improvement goals are directly related to student achievement
for all students in every school.
With the passage of the Every Student Succeeds Act (ESSA) in December of 2015 at the
federal level, a renewed focus has been placed on equity in schools across the nation. Arkansas
crafted their ESSA plan by working closely with stakeholders and the plan was approved by the
federal government in January 2018. The Arkansas ESSA plan calls for equitable opportunities
for all students in Arkansas, including having effective educators in every classroom, effective
administrators in every building, and leading the nation in student-focused learning. School
accountability measures take into account a number of achievement indicators, including how
many students are reading on grade level, growth and achievement in math, science, and literacy,
and student engagement as measured by the number of students chronically absent. The new

6
ESSA plans take a “big picture” approach to student achievement with the inclusion of multiple
measures of growth and achievement to determine the effectiveness of each school and district.
In December 2016, the Arkansas State Board of Education convened a Student Discipline
Task Force to review existing policies and practices and examine their effect on positive
outcomes for students. Their findings, released in September 2018, call for major changes in how
students are disciplined in Arkansas to reverse disparity among races and negative student
outcomes. Their recommendations included tasking the educational cooperatives with providing
training and support in positive school discipline practices such as restorative justice and banning
the use of discipline practices that exclude students from school and prevent them from
completing their education. They also recommended that discipline rates be included as an
indicator on school report cards that are released to the public and to use a school climate
measure in accountability measures under ESSA. It is clear that the state of Arkansas is focused
on improving equitable outcomes for all students.
Is High Leverage
Racial disproportionality in student discipline is an equity issue that is high leverage for
many reasons. Across the country schools have begun to focus on their discipline practices. In
response to alarming rates of disproportionality in school discipline and use of exclusionary
discipline practices, Arkansas legislators passed Act 1059 of 2017. This law prohibits the use of
OSS and expulsion for students in grades K-5, except in cases where “the student poses a
physical threat to themselves or others or causes a serious disruption that cannot be addressed by
other means” (State of Arkansas, Act 1059, 2017). Although this law has only been in effect for
a few years, there are already calls from state organizations to expand the ban on exclusionary
discipline up through grade eight. Banning the use of exclusionary discipline is one way that the

7
state is trying to address disproportionality. However, banning the use of exclusionary discipline
alone does not guarantee equity in schools for all students.
When groups of students are being disciplined at disproportionate rates, we must seek to
understand the root cause. This is not just an issue of school discipline, but rather one of social
justice. The laws of our country require that all students receive a free and appropriate public
education. The research shows that the trend of disciplining African American students at higher
rates than White students is prevalent across our country in schools and that these students are
being disadvantaged educationally (Children’s Defense Fund, 1975; Losen, 2011; Skiba et al.,
2002). By gaining more information about why this inequity is happening in rural schools, we
can then use that knowledge to create systems with equitable opportunities for all students. The
long-term effects of student discipline can be damaging for future economic outcomes, as well as
have an impact on a student’s social emotional development. Students who are subjected to
exclusionary discipline in schools end up in prison at higher rates than those who do not, a
phenomenon known as the school-to-prison pipeline (APA, 2008). If students can avoid contact
with the court system while they are in school, they have a better chance of completing their
education and attaining post-graduation success.
Research Questions
The disproportionality of discipline between African American students and White
students has been well-documented in the literature. However, most of the studies done were
conducted in large urban districts or suburban districts where the population of African
American students comprised the majority. This study explored what this issue looks like in rural
school settings.

8
The research questions for this study were:
1. How is discipline disproportionality perceived in specific rural schools from the
principal’s perspective?
2. What factors are most influential in explaining discipline disproportionality in
specific rural schools from the principal’s perspective?
Overview of Methodology
This study followed an explanatory sequential mixed methods design to gain a deeper
understanding of this complex problem. According to Creswell (2014), explanatory sequential
mixed methods is a design in which, “The researcher first conducts quantitative research,
analyzes the results, and then builds on the results to explain them in more detail with qualitative
research” (p. 15). The quantitative data in this study consists of student discipline data from five
rural schools in Southeast Arkansas for the 2017-2018 school year. Using raw discipline data,
composition index scores and relative differences in composition for discipline infractions and
actions were calculated to provide an overall picture of disproportionate discipline between
African American and White students for each school. Analysis of the quantitative data was then
conducted for the purpose of informing the qualitative data collection. Within qualitative
research, there are numerous methodological approaches that may be taken based on the research
questions (Ravitch & Carl, 2016, p. 18). In the qualitative portion of this study, an instrumental
collective case study approach was used to gain insight from principals in the five sample
schools about their experiences related to student discipline to understand more deeply the
phenomenon of disproportionate referral rates for African American students. According to
Creswell (2018), a collective case study approach is one where a single issue or concern is
investigated in multiple cases to provide various perspectives of the issue, while an instrumental

9
case study focuses on a single issue or concern that is studied in depth (Stake, 1995). In this
study, five rural schools in Southeast Arkansas served as the cases through which to explore the
phenomenon of disproportionate discipline. The collection of both quantitative and qualitative
data in this study provided a deeper understanding of this complex issue by starting with the
discipline data and then including the voices of the leaders of each school to share their
perspective.
Positionality
In qualitative research, the researcher serves as an instrument of research. Because they
are involved in the setting with participants as they collect the research, positionality must be
addressed throughout the study. This section describes the positionality of the researcher,
including my own experiences related to this topic, how I feel about the issues of race and
disproportionality, and why this issue matters to me. My positionality influenced the
methodology, how I related to my participants, and how I analyzed the data.
Researcher’s Role
The role I assumed as the researcher was one of both an insider and an outsider. In my
current role, I serve as the Instructional Leadership Specialist at an educational cooperative
located in Central Arkansas providing professional development and support for administrators
and teachers in the region. However, this role is new for me as of one year ago. Prior to that time,
I served as the principal of an intermediate school located in Southeast Arkansas and had lived
and worked in the community for twelve years. It was during my time as principal that I began to
ask myself why African American students were overrepresented in student discipline in my
school and what could be done to correct it. Because of my relationships with colleagues in the
area, I was able to secure participants with whom I had worked with as a principal who were

10
leading schools similar to my own in the region. Although technically an outsider when
conducting the research, I was also able to understand their challenges, having so recently been
an insider in the region.
Navigating the insider and outsider relationship provided both advantages and challenges
throughout the study. As an insider, I understood fully the challenges these principals were
facing, the context of the culture of the region, and the limited resources at their disposal. I was
also able to leverage my insider role to discuss the sensitive issues related to race and
disproportionality. Because the participants knew me as a principal, I believe they trusted me
enough to share their true insights into the situation. The challenge associated with the insider
role was making sure that I did not make assumptions about their experiences based on my own
or insert my own interpretation to explain their raw data. My role as an outside who no longer
lived in the region also contributed to open dialogue. Participants shared their insights freely,
without fear of influencing a relationship with a fellow principal in a neighboring school. Being
an outsider also allowed me to examine the data through a more detached lens, knowing that I
was not facing the same issues they were each day. It was also helpful because I was able to ask
difficult questions about student discipline without the principals feeling like we were comparing
schools. I believe this unique role as both an insider and an outsider contributed to the quality of
information shared by participants and ultimately, allowed me to develop a deeper level
understanding of the phenomenon and more accurately answer the research questions.
Assumptions
It is well established in the literature that African American students are disciplined at
higher rates than any other race of students both across the nation and in Arkansas (Children’s
Defense Fund, 1975; Losen, 2011; Skiba et al., 2002). An assumption of mine is that the

11
participants in this study are not fully aware of the impact of implicit bias in student discipline. I
make this assumption based on my own experience as a principal who didn’t really understand
the role of implicit bias in my daily work. Another assumption I make is that the discipline
systems in place in these schools are based on the expectations of white, middle class Americans
and their traditional ideas of discipline. Knowing the culture of the region, common beliefs of
parents, and my own experiences working in schools in this region, I assume that the majority
opinion prevails. A final assumption I make is that the educators involved in this study choose to
be in the role of administrator because they want to make a difference in the lives of their
students and are truly interested in doing what’s best for each child. I have yet to meet a public
educator who is willing to deal with the frustrations, demands, and low level of pay who wasn’t
doing it because they genuinely wanted to make a positive difference in the lives of children.
My bias as a researcher is related to my role as a teacher and administrator in public
schools for the past twenty-two years. I am a white, educated, middle-class female who is part of
the racial majority group in our country and bring my own implicit biases related to students,
educators, and school discipline. Based on my experience, I am more likely to positively regard
administrators with discipline philosophies similar to my own and worked throughout the study
to put aside my own bias to listen to the perspectives of all participants. As an educator aware of
the impact of racial bias on student discipline, I have found that I often want to protect African
American students in discipline situations. I also had to stay aware of my feeling towards
educators who persist in using outdated practices related to school discipline that are harmful to
students resulting in higher rates of exclusionary discipline for students. In my years as an
administrator I faced many situations where students were being pushed out of classrooms by
teachers who didn’t know how to relate to them. Writing reflexive memos and using dialogic
12
engagement with thought partners throughout the study helped me to keep my own bias in check
and allowed for documentation of my own thoughts and feelings during the study.
Definition of Key Terms
Cultural awareness - Cultural awareness is defined as the ability of the principal to discuss the
hidden aspects of culture or those not easily observed, including the values, beliefs, attitudes,
norms, communication styles, and role expectations of the students (Nelson & Guerra, 2014).
Disproportionality in discipline – The over- or underrepresentation of students in discipline
actions when compared to the percentage of the student population they comprise. For example,
if African American students comprise 35% of the student population but 75% of the discipline
infractions come from African American students, then the difference shows the degree by which
they are overrepresented. In this study, composition index scores were calculated to determine
disproportionality.
Exclusionary discipline -- Any discipline consequence assigned to a student that removes them
from their regular classroom, including ISS, OSS, and Expulsion.
Equity -- All students have access to the necessary supports to succeed at school, free from bias.
Organization of the Dissertation
The first chapter of this dissertation is the introduction and an overview of the study
conducted. The second chapter contains the literature review and conceptual framework, which
situates the problem of practice of disproportionate discipline within current literature. The third
chapter details the methodology utilized in the study and information related to the context of
each school. Chapter Four contains quantitative and qualitative findings of the research,
beginning with patterns noticed across all five schools, followed by a presentation of the findings

13
by each school individually. Chapter Five discusses the findings based on the research questions
and conceptual framework and concludes with implications for practice and future research.

14
CHAPTER TWO - LITERATURE REVIEW
Introduction
The purpose of this study was to examine the problem of practice found in the
disproportionate rate of student discipline actions for African American students compared to
White students in rural schools in Southeast Arkansas. I searched for literature that would
establish the scope of the issue of disproportionality and possible causes for the rate across
various types of school settings. I utilized several databases including the University of Arkansas
databases, EBSCO, and Google Scholar to locate peer-reviewed articles and books related to
student discipline. Search terms used included “racial disproportionality and school discipline,”,
“race and student discipline,” “school-to-prison pipeline,” “exclusionary discipline and race,”
“suspension and disproportionality,” “rural schools and race,” “Critical Race Theory and
discipline,” and “discipline policies and disproportionality.”
I also read several books to provide context and background on the issue including Why
Rural Schools Matter by Mara Casey Tieken (2014). This book, written by a Harvard researcher
based on her dissertation research, was a case study of two different school districts in Arkansas,
Earle and Delight, and the challenges each faced as a rural district. I also read Critical Race
Theory: An introduction (Third Edition) by Richard Delgado and Jean Stefancic (2017), Implicit
Bias in Schools: A Practitioner’s Guide by Gina Gullo, Kelly Capatosto, and Cheryl Staats
(2018) and Is Everyone Really Equal? An Introduction to Key Concepts in Social Justice
Education by Ozlem Sensoy and Robin DiAngelo (2017). These texts helped me to understand
the factors related to being rural, Critical Race Theory, implicit bias, and the foundations of
racism in the United States. Table 1 details the sources that informed this study.

15
Table 1
Number and Types of Sources Reviewed
Type of Source Number Reviewed
Peer Reviewed Articles 50
Scholarly Books 12
Government Reports 15
Scholarly Websites 10
Review of Literature
The review of literature, while not exhaustive, focused on the phenomenon of
disproportionate discipline as it has been documented over the past forty years. The following
sections represent the topic areas that were explored to further understand disproportionality in
student discipline in rural schools: disproportionality and school discipline, policies and school
discipline, school characteristics and school discipline, racial bias, and Critical Race Theory.
Disproportionality and School Discipline
Discipline in public schools typically consists of a teacher making a discipline referral for
students when they break the norms of the school, resulting in punitive consequences ranging
from student detention, parent conferences, corporal punishment, ISS, OSS, to expulsion.
Consequences are generally applied by administrators according to the school discipline plan,
which is guided by federal, state, and local policies. Often, this discipline disproportionately
affects certain groups of students, including African American students. A landmark report by
the Children’s Defense Fund on school suspensions, published in 1975, first reported that
African American students were being suspended from schools at a rate of three to one when
compared to White students (Children’s Defense Fund, 1975). This rate of disproportionate
discipline has consistently persisted and its causes and effects analyzed by researchers (Gregory
16
& Weinstein, 2008; Skiba et al., 2002; Skiba et al., 2011). According to the Office for Civil
Rights’ most recent data collection (2015), the rate of suspension for African American students
when compared to White students is still holding steady at a rate of three to one. Administrators
are not solely to blame for the disparate impact. In a study conducted by Skiba et al. (2011) using
a data set of over 350 schools from across the nation, significant disparities in school discipline
were found at all stages in the discipline process including the initial referral by the teacher and
the administrative decision on consequence for African American students. They also found that
at the elementary level African American students were twice as likely as White students to
receive a discipline referral and four times as likely at the middle school level (Skiba et al.,
2011).
Recent studies have focused on disproportionate outcomes for more specific groups of
students within the demographic, such as African American females. Blake et al. (2017) found
that the shade of skin or colorism of female African American adolescents was a significant
factor in the risk of school suspension. Females with darker skin and more Afro-centric features
were likely to be suspended twice as often as students who were white, while lighter skinned
African American females did not show the same risk level. According to the Office of Civil
Rights (OCR, 2014), African American females are suspended more than females of any other
ethnicity. In 2013 African American females made up 50.7% of all girls with multiple out-of-
school suspensions, while African American boys made up only 39.9% of all boys with multiple
out-of-school suspensions. Research has also focused on disproportionate suspensions for
students in preschool. African American students comprise 18% of preschool enrollment, but
represent 42% of all students suspended once, and 48% of the students who have had more than
one out-of-school suspension (OCR, 2014). The pattern of disciplining African American

17
students beginning with our youngest students, is well established in the literature. As required
by law, each school’s policies and practices must be aligned with both federal and state mandates
governing school discipline.
Policies and School Discipline
Federal Policies
There are several federal policies that directly impact discipline policy in public schools
across the nation, beginning with the Civil Rights Act of 1964. Within this landmark legislation
are two sections that affect student discipline in schools. Title IV prohibits discrimination in
public elementary and secondary schools based or race, color, or national origin, while Title VI
prohibits discrimination by race, color, or national origin in any entity that receives federal
funds. Both of these sections in the statute require public schools to enact a system of equity and
fairness for all students with regard to student discipline policies and practices. More recently, a
“Dear Colleague” letter dated January 8, 2014 by the OCR provided significant guidance on how
schools were to examine their actions related to student discipline. The brief outlined two themes
that the OCR looks for when investigating claims of discrimination, which include “different
treatment” and “disparate impact.” Different treatment concerns a school intentionally punishing
students of different races in a different manner, while disparate impact focuses on policies
administered consistently to all students, but result in one race being punished at disparate rates
when compared to the others. These sections of the Civil Rights Act of 1964 have provided a
framework for public schools to use when creating their systems of discipline and are enforced
by the OCR and the Department of Justice. Schools are required to submit all discipline
infraction data into the OCR database each year, and the numbers are compiled and analyzed for

18
disparate impact. This accountability measure applies to all public schools that accept federal
funds and provides a comprehensive data set for analysis.
In December 2018, the Federal School Safety Commission released a report
recommending President Trump revoke the Dear Colleague guidance from the Obama
administration intended to prevent the discipline of students groups at disproportionate rates
claiming that the guidance puts students in danger. The report stated, “Where well-meaning but
flawed policies endanger student safety, they must be changed.” (Federal Safety Commission,
2018, p. 67). Days after the report was presented to the President, the guidance was revoked in
the name of preventing school violence without worry of meeting quotas or tracking disparate
impact on groups of students.
The U.S. Commission on Civil Rights (CCR) released a report in July 2019 called
Beyond Suspensions that provided further insight into the federal government’s current position
on disproportionate discipline. Based on the revocation of the 2014 guidance by President
Trump, the CCR found that the approach of the Trump Administration has reduced their ability
to investigate claims of disparate impact in schools, the identification of patterns of systemic
racism, and caused them to close 65 investigations without guidance (U.S. Commission on Civil
Rights, 2019). They also found that in response to the guidance in 2014, many schools changed
their discipline policies, which resulted in greater perceptions of safety, higher student
achievement, and higher graduation rates resulting in higher safety ratings (U.S. Commission on
Civil Rights, 2019). This guidance and revocation has caused confusion for school leaders as to
what the true federal guidelines are with regard to school discipline.
The Every Student Succeeds Act (ESSA), which was passed by Congress in December
2015, includes reference to a school’s discipline policies and both directly and indirectly impacts

19
school discipline. This law requires states to create their own education plan for how they will
support local schools in improving the conditions for teaching and learning, including reducing
incidents of bullying and harassment, reducing the use of discipline practices such as suspensions
and expulsions, and eliminating the use of aversive behavioral interventions like restraints and
seclusions. Title 1 of ESSA requires accountability and disaggregation of discipline data, so that
states can target schools with disproportionate rates and provide support. Title II of ESSA
provides funding in the form of professional development for staff members on ways to
incorporate social and emotional learning (SEL) for students and ways to provide for students
who have experienced trauma. Title IV of ESSA creates funding for schools that are leading the
way by implementing dramatic changes in school culture, climate, and safety by creating a
Youth Promise program. The greater focus on SEL for students and rewarding of schools with
successful discipline systems that do not result in disparate treatment is promising. With the
recent approvals of state plans under ESSA, this law may greatly impact changes in school
discipline policies across the nation.
State Policies
There are numerous state laws that affect school discipline in Arkansas ranging from
requirements to create a tiered system of support for students with behavior issues to provisions
for teachers to remove a student from the classroom. Those policies that most directly impact this
problem of practice include those related to suspension and expulsion of students. Act 1059,
which amended Title VI of the Arkansas Code concerning discipline of students in schools, was
passed in 2017, and prohibits assigning OSS as a consequence for students in grades K-5, unless
they pose a threat of harm to themselves or others, or have created a disruption that cannot be
addressed through other means. This law was aimed at reducing the numbers of students in

20
elementary school being excluded from school. In 2013, the Arkansas legislature passed Act
1329, which was designed to examine the disparities in school discipline between student
groups. This law states that schools may not use OSS as a consequence of truancy, and also
created a specific accounting system to keep track of all school discipline in the state. Even
though this law has been in effect for more than five years, there are still schools in Arkansas
who suspend students for truancy (Anderson, 2018). The goal of this law was to examine trends
and data specific to Arkansas to create real change in the future for students. Act 1015 of 2017 is
a recent law in Arkansas requiring school districts to report the number of student incidents per
100 students for each demographic group required for state reporting. With the addition of this
reporting measure and a new online data portal easily accessed by anyone called MySchoolInfo,
the state is providing the means of making the problem of disproportionate discipline rates
visible to the public. Act 529 of 2019 was passed during the last legislative session and recently
went into effect. This law prohibits the use of corporal punishment for students with a disability
and is causing some districts to ban the practice altogether. Each school is required to create their
own discipline policies, using input from a representative group of stakeholders, based on the
guidelines provided by the state. They are also required to provide a copy of their discipline
polices to the state each year after they have been revised and approved by the local school board
(U.S. Department of Education, 2019).
Zero-Tolerance Policies
Following the passage of the Gun Free Schools Act of 1994, states were required to
create their own laws mandating a year-long expulsion of any student who brought a firearm to
school, regardless of the circumstances. The law began a chain reaction of states creating
systems of harsh mandated consequences for offenses that have come to be known as zero-

21
tolerance policies. According to Mallet (2016), zero tolerance policies are often used on first-
time offenders, meant to deter others, and require severe consequences. However, these policies
have done little to reduce violence in schools or prevent future offenses by sending a message
(APA, 2008). According to Losen and Gillespie (2012), “The truth is that harsh and punitive
policies do more harm than good” (pg. 11). According to Mallet (2016), the use of zero-tolerance
policies in schools has led to an exponential increase in the number of students referred to
juvenile court systems, with disproportionate numbers of African American students represented
at every level of the system. Often exclusionary discipline consequences are applied to students
as a result of zero-tolerance policies.
Exclusionary discipline practices include any consequence that excludes a student from
participating in their regular school schedule. The use of suspension, both in and out of school,
disrupts a student’s learning by taking them out of the classroom and away from their peers.
Although suspensions are intended to teach students of the severity of their offense, they instead
remove them from the classroom and place them on a path where they are missing instruction,
classwork, and socialization with their peers (Skiba et al., 2011). Another outcome of
exclusionary discipline is that the exclusion does nothing to help the student repair the harm they
have created or re-socialize them with their peers. Students are often removed from the situation
and returned a few days later, without any intervention or support provided. Prior to 1975,
students had little protection when being given suspension or expulsion as a consequence for
discipline at school. However, in 1975 the Supreme Court in Goss v. Lopez ruled that the
exclusion from school violated a student’s civil rights and could not be used without due process
safeguards. Although the safeguards provided an appeal process for students, the Court did
nothing to limit exclusionary discipline or its use in schools. School suspensions and expulsions

22
are associated with negative outcomes, including lower academic achievement (Anderson,
2018), higher rates of school dropouts, and increased contact with the juvenile justice
system (Wald & Losen, 2003).
Exclusionary discipline practices have an even greater impact on African American
students because they are administered at higher rates than they are for White students, often for
nonviolent offenses. In a study of a nationwide database, Skiba et al. (2011) found that in
elementary school African American students were four times as likely to be suspended or
expelled for a minor infraction as White students, while at the middle school level, they were
more likely to be suspended or expelled for disruption, moderate infractions, or truancy than
White students. Numerous studies by other researchers have consistently verified
disproportionately higher rates of suspension and expulsion for African American students
across the United States (Gregory et al., 2010).
Students who receive exclusionary discipline such as OSS and expulsion are also more
likely to end up in the juvenile justice system. This phenomenon, called the School-to-Prison
Pipeline, describes a system beginning with the youngest students in school that subject them to
policies and practices that make it more likely for them to end up in the court system than receive
a quality education (Mallet, 2016). The criminalization of schools through “get tough” policies,
the presence of law enforcement in the form of school resource officers, and mandated
consequences requiring schools to involve the juvenile justice system for discipline offenses
have all led to increases in the number of students incarcerated (Mallet, 2016).

23
School Characteristics and School Discipline
School characteristics have been shown to have an impact on disproportionate rates of
discipline for African American students. One characteristic is the type of community where the
school is located. Much of the research on school discipline and disproportionality has been
conducted in urban school settings, with little being conducted in rural school settings. Losen and
Skiba (2010) found that the highest rates of suspension overall were in poor urban districts. In a
study utilizing data from 326 districts in Ohio for 2007-2008 school year, Noltemeyer et al.
(2010) found that urban districts with high poverty had the highest rates of exclusionary
discipline, while rural/agricultural districts with small enrollment and low poverty had the lowest
rates of suspension and expulsion. Because poverty was controlled for in the study, the authors
suggested that another factor beyond poverty was likely responsible for disproportionate rates of
exclusionary discipline in Ohio schools. In contrast, rates of disparity between African American
and White students in receiving suspension have been found to be as high and in some cases
higher in suburban districts with more resources (Wallace et al., 2008). Another study found that
urban school districts disciplined their students more than rural districts, regardless of the wealth,
district size, or racial composition (Tajalli & Garba, 2014). The overall consensus of the
literature is that urban districts typically have the highest rates of disproportionate exclusionary
discipline among students when compared to rural school settings, but it is unclear if the reason
is because more research exists on urban districts or because there truly is more disproportionate
discipline happening in these schools.
Although little research has been conducted in rural schools on disproportionality rates in
discipline, there have been some studies that provide insight into what discipline looks like in
rural settings. The Harvard Law School Mississippi Delta Project prepared a policy brief for the

24
Quitman County School District in Mississippi to help them make positive changes to their
discipline system (Harvard Law, 2014). They compiled data on the school and found that, in
general, Mississippi has some of the harshest discipline policies in the nation. The Quitman
County School District is a rural district of 8,000 people, who are mostly farmers. There are
1,273 students in the district, 97% of whom are African American. According to their principal,
the district does not deal with student violence as often as an urban school might, but they do
discipline students at high rates through the use of corporal punishment and frequent
suspensions. Disorderly conduct is their most prevalent student infraction at the high school,
which has 340 students. During an 8-month period during the 2013-2014 school year, they
disciplined students 944 times for disorderly conduct. Other offenses that they deal with often
include disrespect, defiance, and skipping class. During the 2010-2011 school year in the district
of 1,273 students, they reported 1,594 incidents of corporal punishment. Although the offenses in
the district are not of a violent or serious nature, students experience punitive discipline at high
rates in this district. The trend of high numbers of student discipline in this rural school provides
some insight as to how student discipline manifests in this rural setting.
Racial composition of the student body has also been found to have an impact on
disproportionate rates of discipline. Researchers have consistently found that in districts where
African American students are the majority, schools tend to use more punitive and harsher
consequences, have more zero-tolerance policies, use less interventions, and have higher rates of
exclusionary discipline (Welch & Payne, 2010). In a study by Skiba et al. (2014), it was found
that one of the strongest predictors of OSS for any student, regardless of gender, school
achievement, the economic level of the school, or the severity of the student’s behavior was
attending a school with a higher percentage of African American students. In contrast, Tajalli

25
and Garba (2014) conducted a study of placement in disciplinary alternative education programs
in Texas using data that represented 62% of all schools in Texas. Using multilevel regressions,
they found that as the “whiteness” of a school district increased, so did the discipline rates for
African American students. Their only explanation for this finding was that racial bias was a key
factor in discipline decisions.
Based on the overwhelming persistence of the rate of disproportionate discipline of
African American students, numerous factors have been explored including poverty, behavior
differences among students, and culture. However, studies have failed to find concrete evidence
that any of these factors can be pinpointed as a cause. In studies where Socio-Economic status
(SES), a common measure of the poverty rate within a school, was controlled for, it was found
that race still made a significant difference in discipline rates (Skiba et al., 2002; Wallace et al.,
2008). The behavior of African American students has also not been found to be the cause. A
study conducted by Bradshaw et al. (2010) used teacher rating of individual students and their
discipline data to further explore this concept. They found that African American students still
have a higher likelihood of receiving a discipline referral even after controlling for the child’s
level of behavior problems. Essentially if they had a White and an African American student
with identical teacher ratings of their behavior and all other measures in the study, the African
American student had a 24 - 80% higher chance of receiving a discipline referral compared to the
White student, depending on the type of infraction (Bradshaw et al., 2010). Skiba et al. (2002)
found that White students were disciplined for more easily observable behaviors, such as
smoking or vandalism, while African American students were disciplined for behaviors that are
more subjective, such as disruption or defiance. The overwhelming conclusion of many studies is

26
that racial bias plays a significant role in the disproportionate rate of discipline for African
American students.
Implicit Racial Bias
Racial bias has been studied extensively in conjunction with the disproportionality of
discipline for African American students. Racial bias can be divided into two distinct types:
explicit and implicit (Girvan, 2015). Explicit bias consists of the conscious attitudes or beliefs
that we hold about a person or group such as prejudice and overt racism. Implicit bias, on the
other hand, refers to the unconscious perceptions, attitudes, and stereotypes that we have based
on our learned experiences that impact our decisions. Studies have found that implicit bias is
more likely to impact discipline decisions than explicit bias, especially when the decision being
made is not clear-cut (Pearson, et al., 2009). In addition, researchers have found that our implicit
biases often reflect the stereotypes of the society we live in as opposed to our actual beliefs and
feelings (Gullo et al., 2019). In a study of school discipline referral patterns, McKintosh et al.
(2014) found that discipline referral decisions can be impacted by implicit bias, especially with
behaviors that are more subjective such as disrespect, defiance, and disruption. They found that
when discipline decisions are being made, making discipline procedures for defiance and
disrespect as objective as possible, operationalizing staff expectations, and providing training in
how to respond instructionally to student behavior (McKintosh et al., 2014) can have a positive
impact on referral rates. Based on their findings, they developed the Vulnerable Decision Point
(VDP) model to help schools identify their vulnerable decision points where implicit bias may
have an effect, including offenses that are subjective in nature, those that are labeled as more
severe, and location. Other studies have confirmed that bias plays a role in the referral process.
Skiba et al. (2002) conducted a study and found that African American students were more likely

27
to be referred to the office for offenses that were more subjective in nature, such as disrespect,
threats, excessive noise, and loitering. White students, on the other hand, were more likely to be
referred for more objective offenses, such as smoking, leaving without permission, vandalism,
and obscene language. Their study suggests that implicit bias is present at the classroom level
when teachers are forced to make a judgment call on a subjective offense. In a follow-up study
by McKintosh et al. (2016), the VDP model was tested. This model focuses on the key points
where racial bias can impact decision-making in the discipline process including at the referral
level (classroom teacher) and at the consequence level (administrator). This study confirmed
earlier studies and found that overall, African American students were more likely to receive
office referrals for subjective offenses than White students.
Tajalli and Garba (2014) conducted a study of students referred to Discipline Alternative
Education Programs in Texas and found that as the percentage of White students increased in a
district, so did the discretionary punishment (administrator choice) for minority students. They
also found that the mandatory punishment of minority students increased as the White population
increased. They surmise that if the disproportionate rates of discipline for minorities are not
being impacted by bias, then they should have found similar rates of mandatory punishments for
White and minority students. They concluded that racial bias impacting discipline decisions was
the likely cause of disproportionality. Fenning and Jenkins (2018) suggest that administrators can
be successful in reducing disproportionality by offering professional development in the areas of
implicit bias, empathy training, and using classroom consultation/teacher supports as methods to
address the root causes of disparity in discipline.

28
Critical Race Theory
School discipline situations are an expression of dominance and power with the school
attempting to exercise control over the student to preserve order. One lens to examine the
relationships between race, power, and racism is called Critical Race Theory (CRT). This
collection of theories, first applied to the legal system, are now being extended into other fields,
including health care, social sciences, and education. According to Delgado and Stefanic (2006),
the basic tenets of CRT are:
1. Racism is pervasive and has been institutionalized in the United States,
2. Because this racism advances the interests of Whites, many are not interested in
abandoning it,
3. Race is a social construction, and
4. Minority groups are racialized differently throughout history, usually in response
to the labor market.
The themes of CRT can be applied to school discipline in a number of ways. According
to Simson (2014), one way that it can be applied is through the social construct of race which
comes from the social sciences. He explains that when encountering an unknown individual, a
complex chain of decisions happen subconsciously that are influenced by what the person has
experienced which allows them to assign the person to a racial category. These decisions include
how they view the other person and their race, how they regard that racial group as a whole, and
the relative worth that they place on that group (implicit bias). We form our concept of race
based on their dress, their behavior, their accent, and many other factors that must be sorted out
to make these assignments. Once we have classified someone through this process, we then take
their current behavior and use it to either confirm or disconfirm what we believe about this race.

29
In the United States, most people tend to associate Whites with superiority and African
Americans with inferiority. We then make a decision about how we feel about a particular
person. The resulting decision is shaped by implicit bias. The fact that these processes take place
automatically and without our knowledge makes it difficult to directly measure implicit bias.
When this social construction of race takes place in the context of student behavior in
school, opportunities for bias occur. The teacher first processes student behavior with their own
implicit bias and makes the decision to refer (or not) a student to the office. The administrator
then approaches the student through their own socially constructed idea of race, and makes a
decision about what type of discipline to administer. If the behavior in question is ambiguous in
any way and the decision to be made relies on the administrator’s discretion, the difference
between saying the student “had a bad day” or is a “threat to others” can create patterns of
decisions that marginalize certain groups of students. Simson’s view is that this assigning
students to categories based on implicit bias is the root cause of disproportionate rates of
discipline for African American students in schools.
Conceptual Framework
In serving as a school administrator for several years, I have often wondered why African
American students were overrepresented in disciplinary actions both in the schools where I have
worked and in other schools around the state. I have observed the problem first-hand as an
assistant principal and principal in a rural school where the demographics consisted of a student
body that was 65% White and 35% African American. After closely monitoring student data
over several years, I found that African American students were receiving discipline at rates two
and three times higher than the White students were receiving disciplinary actions, which is

30
highly consistent with the research base (Children’s Defense Fund, 1975; Gregory & Weinstein,
2008; Skiba et al., 2002; Skiba et al., 2011).
Due to recent changes in the law requiring school discipline data for all schools in
Arkansas to be posted in an online portal, a closer examination of discipline rates shows that this
problem is not unique to the school where I worked. In examining the data for schools across the
state, it is clear that discipline is being applied to African American students at disproportionate
rates in rural districts across the state. Because the literature often focuses on the discipline
practices of large urban districts, little is known about the experience of African American
students in rural schools with regard to school discipline other than the numbers.
In Arkansas, a study by the OEP found that students who received exclusionary discipline
in high school, and particularly in ninth grade, had a lower likelihood of not completing high
school or enrolling in college (Anderson, 2018). They also found that the use of ISS for African
American students increased in a period over five years between 2006 and 2012 in Arkansas
while the rate for White students decreased (Anderson, 2018). During the same time period,
Arkansas was 15th in the nation for the use of OSS for all students and 13th in the gap between
African American and White students for OSS (Losen & Gillespie, 2012). In the latest report
from the OEP in Arkansas on student discipline dated September 2018, African American
students receive OSS, expulsion, or a referral to an alternate program for 25% of their discipline
referrals, as compared to only 15% of all other races. (Anderson, 2018). This statistic is
compounded by the fact that in Arkansas, African American students receive 117 office referrals
per 100 students while White students receive 37 - 40 per 100 students (Anderson, 2018). They
also found that some schools in Arkansas were more likely to administer longer exclusionary
periods for students, including schools with greater proportions of African American students,

31
and middle and high schools. It is clear that disproportionate rates of discipline for African
American students are prevalent across the state of Arkansas, and not just in the school where I
served as the principal.
There are three aspects of the school discipline system that I believe are impacting rates
of disproportionate discipline for African American students in Arkansas including the discipline
policies and practices that are currently in place at the school-level, the amount and quality of
training the administrators and teachers have had in each school, and the impact of implicit bias
at both the system level and the individual interaction level with teachers and administrators. The
discipline system of each school is based on federal and state guidelines, but is highly influenced
by local policy as well. Local discipline policies are often created by administrator and school-
level teams to meet the needs of the school. Some schools may have established discipline
systems that have been used for many years, while others may rely on teacher and administrator
judgment to administer. However, just because a system exists in policy does not mean that it is
the daily practice of the teachers or administrators. Both the polices and the practices should be
taken into account when determining what school discipline for African American students looks
like in rural districts.
The amount and quality of training that administrators and teachers have had also has an
impact on the disproportionate rate of discipline for students in rural schools. A link exists
between the type of training a teacher or administrator has had and the way they discipline
students. According to Diem and Carpenter (2012), the majority of principal preparation
programs fail to adequately prepare leaders for conversations about equity and social justice. The
number of applicants for each teaching position is another indicator of the amount of training
educators in rural districts have. In a study conducted by the OEP in Arkansas, rural districts

32
reported that they had on average four applicants per job opening, while the districts located in
cities reported eight applicants on average per job (Forman et al., 2018). Districts located in
urban areas have more applicants to choose from, which increases the likelihood that they can
hire more experienced teachers.
According to DeMatthews (2016), administrators must be well-trained in equity practices
to understand their impact on student discipline rates and be willing to adopt a social justice
framework for their practice. A social justice framework attends to how resources, recognition,
and opportunities to better one’s life are allocated (DeMatthews, 2016). This training is often
provided to those working in large, urban districts, and specific administrator preparation
programs at some colleges and universities. Specialized programs for those working with schools
that have high poverty also exist. However, most administrators take a basic educational leader
preparation program and do not gain the benefits of more specialized skills such as ensuring that
the systems they put in place are equitable. According to DeMatthews (2016), school leaders
have a unique position in being able to influence equitable outcomes for students in their schools
and should receive the necessary training for social justice leadership.
Teacher training is also an important aspect of student discipline. Teachers who have
good classroom management skills use a variety of approaches to create safe learning
environments for their students, while those who struggle may rely on office referrals and
outside support to manage their students. This can lead to higher rates of referrals for students
with more challenging behaviors. Teacher and administrator training is a key factor when
examining disproportionality in rural schools.
The presence of implicit bias is also a likely factor in the disproportionate rate of
discipline for African American students in rural schools in Arkansas. The research shows that

33
our implicit bias is based on years of learned experiences beginning with our earliest memories,
and are so automatic and embedded that we are often unaware of what these biases are. When
administrators and teachers work together to create discipline systems, their bias may become
institutionalized into the system. When you examine a school discipline system through the lens
of Critical Race Theory, it is possible to see where implicit bias can become institutionalized.
For example, if a group of White, female, middle-class educators work together to create a
system for discipline referrals, the system is likely to reflect their idea of what a classroom
disruption is, how severe it must be before the student receives a referral, and what is appropriate
in the classroom. Implicit bias can also come into play in the implementation of discipline
systems, especially when the behavior requires a judgment call. Figure 1 is a visual
representation of the interaction of these three main areas concerning student discipline and
disproportionality for African American students.
Figure 1. Conceptual Framework

34
Figure 1 represents three leading factors that result in disproportionate rates of discipline
for African American students in rural schools based on the literature reviewed, current theory,
and my own experiences as a school administrator in the region. Each of the three factors is
represented by a circle, and the three circles are overlapped to show the interconnectedness of
each factor. All three of the factors are within a box that is labeled with Critical Race Theory in
all four corners to show how these factors are steeped in the tenets of CRT.
Circle A in Figure 1 represents the discipline policies and practices that exist in the
school. These policies and practices are informed by different bodies, including the federal and
state mandates, which is represented by the portion only in Circle A. Local discipline policies
and practices are also impacted by the amount and quality of training the administrators and the
teachers have had, both in their design of discipline systems and their daily practices. This is
represented in the portion of the diagram labeled D, which is where Circles A and B overlap. For
administrators, training in designing systems that promote equity for all would have a positive
impact on discipline policies and procedures, while a lack of that training may have a negative
impact. For teachers, culturally responsive pedagogy and practices, especially related to
classroom management would have a positive impact, while training or use of an authoritarian
management system or the lack of any training at all would have a negative impact. The
discipline policies and practices of the school can also be impacted by implicit bias. This is
marked by the portion labeled E, which represents the overlap of implicit bias on both the
discipline policies and the practices in the school.
The second circle, labeled Circle B, represents the training that the administrators and
teachers have had in a school concerning discipline. The amount and quality of educator training
can impact the types of discipline policies and the everyday practices in a school, as represented

35
by section D, and there can also be an overlapping of training and implicit bias, represented by
section F. If educators receive training that makes them aware of the effects of implicit bias on
students, this could have a positive impact on the rates of school discipline, while the lack of
awareness or training in the impact of implicit bias could have a negative impact. The third
circle, labeled Circle C, represents the presence of implicit bias in schools. This bias can impact
the discipline policies and practices in a school (section E), and can also impact administrator
and teacher training (section F). This is where the lens of Critical Race Theory can be helpful in
examining a school’s discipline system.
The middle portion of the diagram, section G, is where all three of the factors overlap
with one another. Where discipline policies and practices, implicit bias and a lack of effective
administrator and teacher training collide, disproportionate rates of discipline for African
American students may occur. When seeking to understand what disproportionality of student
discipline between African American and White students looks like in rural schools in Arkansas,
this visual can help to illustrate the complex and multifaceted nature of the issue.
Chapter Summary
This literature review was written to explain the research that exists on rates of
disproportionate discipline for African American students by exploring the following
topics: Disproportionality and school discipline, legal mandates, policies and school discipline,
school characteristics and school discipline, racial bias, and Critical Race Theory. This section
also included the conceptual framework used to further define the problem of disproportionate
discipline as it relates to students in Arkansas in rural schools. The conceptual framework
detailed the interconnectedness of the key findings from the literature with regard to discipline

36
policies and practices, teacher and administrator training, and implicit bias through the use of a
Critical Race Theory lens.
Following this chapter is Chapter Three - Inquiry Methods, which provides a detailed
description of the research design and methodology utilized to explore the answers to the
research questions. Chapter Three also provides a rationale for the study, explains the context of
the selected rural schools in Arkansas, and explains the data collection methods and analysis
used.

37
CHAPTER THREE – INQUIRY METHODS
Introduction
The purpose of this study was to examine the problem of practice found in the
disproportionate rate of student discipline actions for African American students compared to
white students in rural schools in Southeast Arkansas. This study followed an explanatory
sequential mixed methods design to gain a deeper understanding of the complex problem.
According to Creswell (2014), explanatory sequential mixed methods is a design in which, “The
researcher first conducts quantitative research, analyzes the results, and then builds on the results
to explain them in more detail with qualitative research” (p. 15). Data collection in this study
occurred in two phases, quantitative and qualitative.
The first phase of data collection focused on the quantitative data consisting of raw
discipline numbers from each school for the 2017-2018 school year. The data was compiled by
race, types of disciplinary incidents, and type of discipline action taken, and then composition
index scores were calculated for each school to determine if disproportionate rates existed
between the two student groups. The data was then analyzed and the results used to inform data
collection in the qualitative phase of the study. Within qualitative research, numerous
methodological approaches can be taken based on the research questions (Ravitch & Carl, 2016).
In this study, an instrumental collective case study approach was used to gain insight
from administrators in five rural schools in Southeast Arkansas about their experiences related to
student discipline to understand more deeply the phenomenon of disproportionate referral rates
for African American students. According to Creswell (2018), a collective case study approach is
one where a single issue or concern is investigated in multiple cases to provide various
perspectives of the issue. The cases in this study are each of the five schools being studied. An

38
instrumental case study focuses on a single issue or concern that is studied in depth (Stake,
1995). The decision to utilize both a collective and instrumental case study approach was made
to gain a deeper understanding of disproportionate discipline in several rural schools within the
same region of the state and to determine if the causes of disproportionate discipline were similar
to those found in the literature.
The collection of both quantitative and qualitative data in this study provided greater
understanding of this complex issue. This is an issue with many layers, including the power
administrators have on the discipline actions students receive, the impact of bias in the discipline
system they administer, and the possible impact of being a rural school. The research questions
for this study included:
1. How is discipline disproportionality perceived in specific rural schools from the
principal’s perspective?
2. From a principal’s perspective, what factors are most influential in explaining
discipline disproportionality in specific rural schools?
The exploration of these two research questions provided insight into factors that are influencing
discipline rates in rural schools within Southeast Arkansas based on the principals in the schools.
This chapter begins with the introduction, a rationale for the research approach to answer
the research questions, and a description of the setting and context of each school where the
research was conducted. It continues with a description of the research sample and participants,
the data collection methods, and the data analysis methods. It concludes with a description of
why the methods used were trustworthy and rigorous, the limitations and delimitations of the
study, and a summary.

39
Rationale
The choice to utilize an explanatory sequential mixed methods study was made to gain a
more accurate picture of the phenomenon of disproportionate discipline in rural schools.
Collection of the quantitative data was necessary to see where each school was in terms of their
reported discipline numbers. This data was also needed to compare to the student population to
determine if disproportionate discipline was present, and if so, to what degree. The inclusion of
the qualitative phase of the research was critical in beginning to understand why the discipline
was disproportionate in these schools. Because so much of the research has been conducted in
large, urban schools with a majority of minority students, it was important to include the voices
of these principals about what was going on in their schools. Both urban and rural schools can
have the same rates of disproportionate discipline between African American and White
students, but without their voices, the issue cannot be fully understood. This can help to
determine if the reasons why disproportionate discipline exists in rural schools are similar or
different from those in urban schools.
The collection and analysis of the quantitative data first helped me to become aware of
each school’s unique pattern of discipline data. Calculating composition index scores revealed
the degree to which each school had disproportionate discipline rates between African American
and White students for the target year. This knowledge helped me to understand which of the
schools were experiencing the highest rates of disproportionate discipline and also those that had
lower rates. It also allowed me to tailor the questions asked during both interviews with each
principal to the specific patterns noticed both in their school and across all schools included in
the study. This knowledge guided me to probe deeper for responses during interviews in specific
areas because I was aware of their data and which areas were disproportionate. Because of the

40
sensitive nature of the topic being discussed, I decided to hold two separate interviews with each
principal to allow ample time to build understanding of the study and create a feeling of safety
and security with responses. The choice to use a collective instrumental case study approach for
the qualitative portion of the study was made to provide a deeper picture of the phenomenon
across schools. By exploring disproportionate discipline in five rural schools within one region
of the state, I was able to explore the impact of the principal’s beliefs on their discipline data and
hear a variety of perspectives. Not only did this choice allow me to develop a picture of the
discipline system in each school, it also provided the opportunity for comparison between
schools.
Critical Race Theory (CRT) was used as the theoretical framework for this study because
of its alignment with the issue of disproportionality in school discipline. Each aspect of the study
was designed with regard to the tenets of CRT to discern the effect that implicit bias may have in
disproportionate numbers of African American students being disciplined when compared to
their White peers in rural schools. The research questions were based on the principal’s
perspective because they are the primary actor in a school discipline situation that determines
what type of consequence a student receives. The open-ended interview questions were designed
to elicit information from each principal without implying judgement of the discipline
procedures in place. The research sample also aligned with CRT because the principals
interviewed mirror the demographics of the leadership in most schools in the region. All of the
principals interviewed were White, which is the norm for this area. Following data collection and
analysis in each phase, a clearer picture of how the rural schools in the study approached
discipline of their White and African American students emerged, allowing for conclusions to be
drawn related to CRT.

41
Problem Setting/Context
This study was carried out in five rural schools in Southeast Arkansas, with each school
serving as an individual case. The region of Southeast Arkansas, also known as the lower Delta,
is comprised of ten counties in the southeast region of the state, and is bordered by Louisiana to
the south and Mississippi to the east. According to the 2017 Arkansas Labor Market and
Economic Report, between 2012 and 2016 the population in this region decreased by 8,742
people. The top industry in the region is food preparation and serving-related positions. The
largest occupation is cashier, and their average wage is $18,000 a year. All five schools are
located in this region within three separate school districts.
The academic performance of the schools in this area is significantly lower than
academic performance in the other areas of the state. Most of the schools in the Southeast region
of the state earned letter grades of C or D, with some earning F’s. Only one school out of 44 in
the region earned an A in 2017. The letter grade for each school is calculated based on a formula
that takes into account student performance in literacy and math, their growth from the previous
year in those area, and other indicators, including student attendance and graduation rate. The
first year for schools in Arkansas to be compared using letter grades calculated from a variety of
data points, as opposed to a single test, was 2017. Most of the schools in this region have a
poverty rate of at least 50%, as measured by the number of students receiving free and reduced
lunch.
This region was chosen as the focus area because it is where the researcher had most
recently been a principal and observed disproportionality in discipline first-hand. The schools
and districts chosen appeared to have high rates of disproportionate discipline in 2017 for
African American students when compared to their White students based on publically available

42
data and are all located in rural communities. Table 2 shows the characteristics of the three
school districts and the communities where they are located.
Table 2
District Characteristics
School District A School District B School District C
Community Population
White
African American
Hispanic
Other
Median Income
District Enrollment
9,142
57.3%
38.6%
3.3%
.8%
$37,586
1,568
9,626
59.3%
36.3%
2.3%
2.1%
$29,965
1,930
9,626
59.3%
36.3%
2.3%
2.1%
$29,965
1,027
Note. School Districts B and C are located in the same community.
Five schools from the three districts were included in the study. Elementary A is part of
School District A, Elementary B and Middle B are part of School District B, and Elementary C
and Middle C are part of School District C. All five schools are all located within a 100-mile
radius of one another and have similarities and differences. Characteristics of each school are
listed in Table 3.
Table 3
School Characteristics
Elem. A Elem. B Middle B Elem. C Middle C
Grades served
Total students
White
African American
Free/Reduced Lunch
Average Years of Experience
Letter Grade
K – 4
638
36.8%
48.9%
75%
10.0
C
K – 2
440
55.5%
40.2%
61%
16.15
C
6 – 8
424
60.2%
34.4%
55%
11.45
B
K – 4
402
58.6%
28.4%
79%
13.52
D
5 – 8
301
69%
23.6%
74%
9.79
C

43
School Discipline data for the 2017-2018 school year is publically available online
through the MySchoolInfo portal provided by the Arkansas Department of Education (ADE) and
is reported as discipline actions per 100 students, as part of the requirement of Act 1015 of 2017.
Reporting the discipline actions per 100 students provides some indication about rates of
discipline disproportionality, although it is not disaggregated to the level of the individual
student and is subject to being skewed if there is a small number of students in the particular
demographic group. This type of reporting also does not account for students with recurring
infractions. Table 4 contains the discipline actions per 100 students for each school for 2017-
2018 for each school in the study.
Table 4
Discipline Actions per 100 Students for 2017-2018
Elem. A Elem. B Middle B Elem. C Middle C
W AA W AA W AA W AA W AA
ISS
CP
OSS
EXP
9
4
0
1
23
8
0
0
0
3
1
0
2
4
0
0
7
4
3
0
24
6
13
0
18
10
0
0
41
24
2
0
31
8
3
0
38
7
7
0
Note. Numbers reflect the number of actions per 100 students. W = White students, AA =
African American students, ISS = In-School-Suspension, CP = Corporal Punishment, OSS =
Out-of-School Suspension, and EXP = Expulsion.
Based on the actions per 100 students, it was apparent that disparities existed between White and
African American students in each school. However, this data does not take into account the
portion of the student population each race comprises, nor does it indicate the number of
infractions reported for each demographic group.

44
Research Sample and Data Sources
The sample for this study consisted of the building principal from each of the five
schools in the study. One assistant principal from one of the elementary schools was also
included because she had a direct role in discipline and has been in the position in that school for
the past sixteen years. The principals were chosen through convenience sampling. The researcher
had known and worked with each participant for the past several years and had established
collegial relationships, making sensitive discussions about race and disproportionality possible.
Each of the principals had been the principal at their campus for a minimum of four years prior
to the study and had taken a direct role in student discipline. To protect the participants, all data
collected was labeled using a pseudonym. Because all of the participants were well-known in
their communities and served in administrative positions, special precautions were taken to
protect their responses. Data was stored using pseudonyms in a password-protected file on a
password-protected device. Table 5 details characteristics of each school administrator.
Table 5
Administrator characteristics
Elem. A
Principal
Elem. B
Principal
Elem. B
Asst.
Principal
Middle B
Principal
Elem. C
Principal
Middle C
Principal
Years Exp.
Years in
Role
Gender
Race
19
7
F
W
33
8
F
W
24
16
F
W
22
6
M
W
32
12
F
W
29
4
F
W
Note: F = Female, M = Male, W = White.

45
All principals in the study were veteran educators and had been an administrator in their
school for a minimum of four years. They were all White, as is the norm for schools in the
region, and the majority were female. All of the principals had lived in the community where
their school was located for many years, with the exception of Middle B’s principal, who lived in
a neighboring community. All of the principals willingly agreed to participate in the study and
were interested in finding out ways to reduce disproportionate discipline in their school.
Data Collection Methods
Quantitative Data Collection
Because the research design of the study was explanatory sequential mixed methods,
quantitative data was first collected and analyzed, and was then used to inform qualitative data
collection. Following IRB approval, student discipline data was requested from the Arkansas
Department of Education (ADE) through a formal Data Request. Discipline data from each
school in the study was requested to include the following data disaggregated by demographic
group: Report DS0060: Infraction, which contains data categorized by the code that best
describes the violation or infraction and Report DS0070: Action Taken, which contains the
punitive action taken by the school authority or court authority to reprimand the student after an
offense is committed. Data were provided in the form of Excel spreadsheets containing total
counts by grade level for each category of either infraction or action for every school. Once the
data was received, analysis was conducted to inform the qualitative data collection phase.
Qualitative Data Collection
Qualitative data collected consisted of two separate interviews of approximately 60
minutes with each building leader held about six weeks apart. The first interview took place at
each participant’s school at a time convenient to them. All first-round interviews took place

46
during a school day in May 2019. Questions for the first round of interviews focused on getting
participants to explain their beliefs related to discipline in their school, their ideas on how being
rural impacts their school, and general information on their current discipline system.
Approximately six weeks lapsed between the first and second round of interviews, to allow the
participants time to finish the school year and the researcher to transcribe the data from the first
interview. The second round of interviews took place through videoconferencing at a time
convenient to each participant in late June 2019. The decision to use Zoom as the platform for
the second interview was made to allow for convenience for the participants since school was no
longer in session. It also allowed the researcher to switch from the on-camera mode to share the
screen for participants to see the spreadsheets prepared with each school’s discipline data
disaggregated. The second interview focused on asking more specific questions related to
discipline coding in each school, their reactions to seeing their disproportionality rates for the
target school year, and their thoughts on why disproportionality existed in their school. Both
interviews were recorded using the recording and transcribing app Rev. Following each
interview, data was transcribed using the services of Rev.com and then analyzed.
Data Analysis Methods
Quantitative Data Analysis
After student discipline infractions and actions were obtained from ADE through a data
request, calculations were conducted to determine if disproportionate discipline was present in
each school. Before calculations could be performed, a decision had to be made about how to
handle the Restricted Values (RV) in the raw data. Because of data security, ADE cannot report
any numbers for student groups where the value is less than ten. These were represented as a RV
in the data set. Therefore, when analyzing data by grade level and demographic group in each

47
school, a value of one was substituted for any action or infraction where all actions and/or
infractions in the category were listed as RV, including the total. For actions and infractions
where a total number was reported, but one or more of the categories contained RV, simple
calculations of adding up the numbers and subtracting from the total was used, and then the
remaining number was divided among any cells with RV in that category. This method allowed
the total numbers to be kept as accurate as possible, while providing some value for categories
that had less than ten infractions or actions to represent activity. Having close approximations
provided valuable insight into which infraction and action codes were being utilized by each
school and which categories contained the highest numbers.
Following the substitutions in each category for RV, the data was broken down by each
school into two main categories: infractions and actions. Each school’s data was already
disaggregated by grade level and ethnicity. For the purposes of this study, students who were
categorized as African American and White were listed separately, and students categorized as
any other race, including Two or More Races, Hispanic, Asian, and Pacific Islander were
grouped together into a category called Other. The number of students in the Other category for
all five schools was considerably smaller than their African American and White student
populations and ranged from 5-15%.
After compiling the data for infractions and actions by race and grade level, total student
population numbers were calculated. From the total number, a percentage of the population for
each race was calculated by dividing the number of students in the population by the total
number of students and then multiplying by 100. The same calculation was also used to
determine the total number of student infractions and actions for all students and then by race for
the categories African American, White, and Other. Only data from the following categories for

48
infractions was included in this study, because they represent the categories where all schools
had values reported in their data: Insubordination, Disorderly Conduct, Fighting, Bullying, and
Other. Only data from the following categories for actions was included, because all schools had
values reported in these categories: ISS, OSS, Corporal Punishment, and Other. The total
number of expulsions was less than five for all schools, so it was not included. Once the total
number of infractions and actions for each race were determined separately, the composition of
infractions and actions for each race was calculated by dividing the total number of infractions
for students in the race category by the total number and multiplying by 100. This calculation
resulted in composition index scores for each race for both infractions and action in every school.
The differences in composition index scores were calculated for each racial group and were used
to determine the degree of disproportionate discipline. The formulas used for calculation are
listed in Chapter 4 with the results.
Spreadsheets for each school were created to display the data resulting from calculations
for both infractions and actions and to allow for researcher analysis. Analytic memos for each
school were generated discussing trends noticed in the data, areas of concern and question, and
possible theories about disproportionate rates that informed the interview questions with the
principal of each school. This disaggregation of raw data by racial group and calculation of
composition differences provided a clear picture of student discipline for each school for the
target year and led the way for qualitative data collection.
Qualitative Data Analysis
Following each round of interviews with the administrators, the data was transcribed
using Rev.com. Transcripts were reviewed by the researcher and corrections made by listening to
the recordings. The data were then coded using descriptive coding based on the content of what
49
each participant said. As the data were being coded, a dialogic engagement partner worked
alongside the researcher to assist in the coding process and monitor bias. Once the initial round
of coding was completed, a review of all categories was conducted and codes were created to
represent units of meaning. Eleven major categories were derived from the first cycle of coding.
After the first cycle of coding was complete, the second cycle of coding focused on further
refinement of the data took place. The second cycle of coding resulted in the eleven categories
being broken down into a total of thirty-eight sub-codes, which further categorized the
information into more specific categories. The dialogic engagement partner also assisted with
this process of re-categorizing and breaking down the information into more specific codes. The
codebook in Appendix B contains a complete list of codes and descriptions. Figure 2 provides
the codes generated from both cycles of coding during the process of qualitative analysis.

50
Figure 2. Codes Generated from First and Second-Cycle Coding Leading to Theme
Development.
Once the codes were all assigned to a major category codes and sub-codes were
generated, analytic memos were created for each. During this process, all responses within the
code were reviewed, analyzed, and then summarized to gain a deeper understanding of
participant responses. Key quotes were also chosen to accompany each code that best
represented the participants’ thoughts. Researcher thoughts and analysis were then written for
each code.
Through this process of coding, re-coding, and generating analytic memos, patterns and
themes began to emerge both by school leader and overall. One of the patterns that began to
First Round Coding
Community
Demographics
Equity
Impact of study
External support
Relationships
Schoolwide Discipline System
Parent
Principal
Teacher
Social-Emotional Learning
Second Round Coding
Community: Community Support, Features of Rural, Racial Tension
Demographics: Poverty, Staff Demographics, Student Demographics
Impact of Study: Equity
External Support: Juvenile Court, Mental Health, Professional Development
Parent: Parent Apathy, Parent Barrier, Parent Support
Principal: Principal Aware of Disproportionality, Principal Culturally Aware, Principal Path to Administration, Taking Action - Creating Culture, Taking Action - Designing Interventions, Taking Action - Hiring Practices, Taking Action - Passive, Taking Action - Professional Development, Taking Action - Redesigning System
Relationships: Relationships with Families, Relationships with Staff, Relationships with Students
Schoolwide Discipline System: Students with Recurring Infractions, Discipline Actions, Discipline Data, Discipline Policy, Zero Tolerance Policies, Discipline Reporting, Discipline Story, PBIS
Social-Emotional Learning
Teacher: Teacher Barrier, Teacher Ownership
Development of Major
Themes and Sub-themes

51
appear early in this process was that individual participant responses were often heavy in certain
categories and absent in others. It became clear that three principals were taking specific actions
within their schools to meet the discipline needs of their students, including actions based on
student cultures, because all of the responses within Taking Action - Culturally Aware were only
from those leaders. On the other hand, in the category of Taking Action - Passive, the only
responses were from the three other leaders. When the rates of disproportionality in each of these
schools generated in the quantitative data analysis portion of this study were compared to the
responses of their leaders, conclusions were able to be drawn.
Trustworthiness
To establish trustworthiness for the study, protection of the participants first had to be
addressed. Safeguards were designed for use throughout the study to minimize the risk of harm
to participants based on the sensitive nature of the study. Informed consent was presented to
participants before each interview in written form and they knew that they had the opportunity to
opt out of the study at any time and remove their data. Confidentiality is another safeguard that
was provided to participants. To provide safety for participants in their responses through
interviews, pseudonyms were assigned to each participant at the beginning of the research
process and used throughout. This protected the identities of the participants and ensured that
their statements made about their own experiences would not cause damage to them either
personally or professionally. Schools and districts were also represented as pseudonyms, since
the participants are the principals in their schools. These safeguards protected participants related
to the ethical issues of the researcher’s position and the sensitive topic being studied.
Methods to ensure validity were also embedded within the design of this study by
utilizing processes and techniques to address transparency, collaboration and reflexivity.
52
Triangulation was used to enhance the validity of the study and provide insight from multiple
perspectives. According to Ravitch and Carl (2016), it is important to examine an issue from
differing vantage points, even if the data do not converge (p. 195). Within triangulation, there are
several different methods that were utilized in this study. Perspectival triangulation is a form of
triangulation where participants are selected because they can provide a different perspective
based on their role or occupation. Participants from schools with varying percentages of African
American students were included to provide varied perspectives within the same region. Another
form of triangulation used was methodological triangulation. Methodological triangulation
involves using multiple methods of data collection to answer the research questions (Ravitch &
Carl, 2016). In this study, two methods of data collection were used to answer the research
questions including collecting discipline data and conducting interviews. These methods were
chosen because they provided opportunities for participants to share their experiences in both
direct and indirect ways, providing a greater opportunity for the truth to emerge and differing
perspectives to be heard.
Another process utilized in this study to enhance trustworthiness using collaboration was
participant validation. According to Ravitch and Carl (2016), participant validation is a way for
the participants to “speak into and about the study” being conducted (p. 197). Throughout the
study, checks occurred to ensure that the researcher was capturing the experiences of the
participants and staying true to their meaning through analysis. After interviews were
transcribed, participants were invited to check their own transcripts for accuracy and clarify their
thoughts. Reflective questions were used to help the participants validate their experiences and
provide deeper insight if needed such as “Does this statement fully capture your true feelings on
this issue? If not, what would you add to it?” Prior to the second interview, participants were

53
asked to review the transcript from their first interview and reflective questions were asked to
determine if they felt they completely explained their views. This process helped to make the
data collection and analysis processes transparent for the participants and the researcher, reduce
researcher bias, and provide for validity of the findings.
Thick description was also used to increase the rigor of this study. The use of thick
description requires the researcher to provide enough description of the context where the
research is taking place to allow for thick interpretation (Ravitch & Carl, 2016). In this study,
thick description focused on the schools and their leader to allow readers to understand the
factors that situate this problem of practice. Much of the details for this thick description
emerged through the participants’ responses during their interviews, and some of the information
was collected through research using data provided to the public from the Arkansas Department
of Education on the MySchoolInfo website. The addition of these thick descriptions increased
transparency in the problem being studied and allows readers to determine the validity of the
data generated.
Dialogic engagement was used throughout the study as a way to challenge the
assumptions and biases of the researcher. These dialogic experiences took place at regular
intervals during the study and provided a framework for the critical examination of the emerging
data. The Associate Dean in the College of Education at a local university served as the primary
dialogic engagement partner for the researcher throughout the study. A fellow cohort member
and doctoral candidate also served as a critical friend in this process. Both dialogic engagement
partners were carefully selected for their understanding of qualitative methods, ability to
critically question the researcher, and level of trust. Care was taken in dialogic engagement to

54
preserve confidentiality for participants through the use of pseudonyms and careful selection of
data shared.
In addition to dialogic engagement, structured reflexivity processes were used to enhance
validity. It was important for the researcher to actively and critically monitor positionality and
bias throughout the research process in order for the study’s findings to be valid, given the role
as an insider and outsider in the research data. Analytic memos were used as a reflective process
throughout the study to maintain a critical stance. Ideas of best practices in school discipline and
training experiences of the researcher were also important to recognize during data collection
and analysis. As this problem of practice was examined through a Critical Race Theory lens, the
researcher’s positionality as a member of the white, middle-class was also constantly examined.
A crucial tenet of CRT is the presence of racism in institutions due to implicit bias, and by
nature, implicit bias often takes place subconsciously. To control for implicit bias, dialogic
engagement was focused on reflecting on the level of bias in questions asked, comments offered,
and conclusions drawn throughout the research process. Because the goal was to represent the
experiences of the participants as accurately as possible, it was necessary to examine
positionality and bias throughout the study. Within the design of this study, processes and
techniques to increase rigor and trustworthiness were included. Their goal was to ensure the
accurate representation of the experiences of the participants and an unbiased examination of the
data.
Limitations and Delimitations
The limitations of this study include several external factors. One limitation of this study
is the type of participants who agreed to participate. Because disproportionality in discipline can
be a sensitive subject, those administrators who elected to participate may have a more open

55
view of racial disproportionality versus those who chose not to participate. Changes in school
discipline policies at the district, state, and federal level may have impacted the answers
principals gave during interviews, reflecting a difference in their views from what they were
during the target year from which the student discipline was data collected.
The delimitations of this study include the relatively small number of administrators
interviewed who are only from one region of the state. Those selected provided their experiences
with regard to school discipline and policies, but their views may not be representative of the
larger group of administrators in the region or in rural schools in general. Limitations and
delimitations are further discussed in Chapter 5, following the presentation of the findings and
discussion.
Chapter Summary
This study of disproportionate rates of discipline in rural schools in Southeast Arkansas
from the principal’s perspective was accomplished through an explanatory sequential mixed
methods study of five schools in the region. Critical Race Theory served as the conceptual lens
informing the methodological decisions made in the study. Quantitative data was collected from
the Arkansas Department of Education through a formal request of de-identified student data
including discipline incidents and actions for each demographic group. Data was disaggregated
by racial group for each school and composition index scores were calculated. Differences in
composition scores were calculated to determine if racial groups were over- or under-represented
in discipline infractions and actions based on the portion of the student population they comprise
for each school. Qualitative data was collected through a series of two interviews with each
building level administrator to gather their perspectives on discipline in their school and provide
insight from the results of the quantitative data collected. All interview data was transcribed and

56
coded until themes emerged and then combined with the quantitative data from each school to
gain a more complete picture of student discipline and disproportionality. The findings of this
study provide deeper insight into the issue of disproportionate discipline in rural schools and
contribute to administrator understanding of the impact of implicit bias in their discipline
decisions on marginalized students.

57
CHAPTER FOUR- ANALYSIS AND RESULTS
Introduction
The purpose of this study was to examine the problem of practice found in the
disproportionate rate of student discipline for African American students compared to White
students in rural schools in Southeast Arkansas. Chapter Four was designed to analyze the data
collected from the Arkansas Department of Education (ADE) as well as principals in the study
concerning student discipline in the selected rural schools. The findings in this chapter represent
the analysis of both quantitative and qualitative data gathered from a total of three separate and
distinct sources: Student and school demographic data collected from the MySchoolInfo website,
provided by ADE and fully available to the public; student discipline infraction and action data
obtained from ADE based on a formal data request; and two rounds of semi-structured
interviews drawn from a sample of five principals and one assistant principal in the selected
schools.
This chapter begins with a summary of the findings across all schools, starting with an
analysis of the quantitative data. The relative differences in composition for both African
American and White students in the schools studied are initially presented. Composition index
scores and relative differences in composition for student disciplinary infractions were calculated
using each individual school’s discipline data based on the 2017-2018 school year and provided
by ADE to provide a broad, overall picture of disproportionate discipline between African
American and White students. A description of the major findings of qualitative data analysis for
all schools are then discussed. Qualitative data consists of responses collected through two
rounds of interviews with each principal and analysis resulting in the identification of major
themes and subthemes. Following the descriptions of overall findings for both quantitative and

58
qualitative data, individual findings for each school are presented. To highlight the explanatory
sequential mixed methods approach, quantitative findings for each individual school are first
presented, followed by the qualitative findings. Presenting all data collected for each school
together reinforces the design of the instrumental collective case study approach focusing on the
phenomenon of disproportionate discipline between African American and White students in
these rural schools.
Results for All Schools
Quantitative Data Results
An analysis of 2017-2018 discipline data of each school in the study revealed the
statistical presence of disproportionate discipline between African American and White students.
Composition index scores and relative differences in composition were calculated for all schools
to provide more accurate information on the existence of disproportionality between African
American and White students in the schools studied using formulas found in the guide, School
Discipline Data Indicators: A Guide for Districts and Schools (Nishioka et al., 2017).
Composition index scores were initially calculated for each school to determine the proportion of
each student racial group comprising the total number of discipline infractions and actions when
compared to the student population. The composition index was calculated using the following
equation.
Number of discipline incidents for a racial group
Composition index = -------------------------------------------------------------------- x 100
Total number of incidents for all students
Following calculation of the composition index for disciplinary incidents within each
school by racial group, a relative difference in composition was then calculated to measure the

59
relative difference between discipline infractions in the different racial groups within the entire
student population. A positive value for a relative difference in composition means that a
particular student racial group is overrepresented in the number of disciplinary incidents, while a
negative value means the group is underrepresented. The relative difference in composition was
calculated using the following equation.
Composition of discipline incidents for each racial group -
Relative difference Composition of same racial group in the population
in Composition = -------------------------------------------------------------------- x 100
Composition of same racial group in the population
Table 6 displays the relative differences in student composition by race based on the number of
disciplinary infractions for each school, which provides a measure of the level of
disproportionality experienced by each student racial group in relation to the proportion of the
entire student population in a particular school.
Table 6
Relative Difference in Composition of Infractions and Enrollment Composition for Students in
All Schools by Race
School African American
students
White
students
Elementary A 8.3% -44.7%
Elementary B 61.5% -60.7%
Middle B 76.5% -47.5%
Elementary C 89.7% -44.3%
Middle C 29.1% -7.3%
Note: A relative difference in composition is the difference between the proportion of infractions
for a racial group and the representation of the racial group within the population. A positive
value for difference in composition indicates the racial group is overrepresented in infractions
when compared to the racial group’s representation in the total student population, while a
negative value means the group is underrepresented.
60
When examining the relative differences in composition, the higher the number, the
greater the level of observed disproportionality for that particular student racial group. Based on
calculations, all schools measured in the study revealed that African American students are
statistically overrepresented based on the number of disciplinary infractions in relation to White
students. Yet, some schools revealed higher levels of disproportionality in student discipline
compared to others. For example, Elementary A has the lowest relative difference in composition
for African American students, which likely reflects the fact that the largest percentage of their
student population is African American (48%) but also takes into consideration the portion of
infractions for African American students (52%). Elementary C, on the other hand, has the
highest relative difference in composition (89.7%), and a lower population of African American
students (27%). Elementary C also had the highest recorded number of disciplinary infractions of
all the schools in the study (902). In contrast, Middle C has the lowest population of enrolled
African American students of all the schools (24%), but still has a lower relative difference in
composition (29.1%) when compared to the other schools in the study. Elementary and Middle C
have similar percentages of African American students (27% and 24%), but have drastically
difference relative differences in composition of discipline infractions (89.7% and 29.1%) even
though they are in the same district. Elementary and Middle B have similar portions of their
student population who are African American (39% and 34%, respectively), and both show
higher relative differences in composition (61.5% and 76.5%).
The relative differences in composition for White students in all five of these schools
illustrates that they are significantly underrepresented in the number of disciplinary infractions,
with the exception of Middle C. This may be partially explained due to the smaller student
population of the school (299) or the fact that the majority of their students are White (68%).

61
Differences in relative composition can be sensitive to group sizes that represent a high or low
percentage of the population, which may affect disproportionality rates in these schools
(Nishioka et al., 2017). The underrepresentation of White students in discipline infractions
relative to the composition of the student population in all five of the schools studied may be an
indicator that the current discipline systems in place in these schools successfully deter White
students from misbehavior or that White students do not receive the same level of discipline
attention as African American students. It is also an indicator that implicit bias may be a
contributing factor in how disciplinary infractions are managed in these schools.
Analysis of the composition scores and relative differences in composition for African
American and White students within each school indicate that there are sizeable differences
related to disproportionate discipline in these schools. Elementary A and Middle C have lower
rates of disproportionate discipline for African American students, while Elementary B, Middle
B, and Elementary C have much higher rates. All schools, with the exception of Middle C, show
a high rate of disproportionate discipline for White students in that they are underrepresented in
discipline infractions. A more thorough breakdown of each school’s discipline data and
disproportionality rates are provided in the section for each school, which follows the overall
qualitative findings for all schools. Analysis of quantitative data provided insight into questions
asked of participants during the qualitative phase of the study to gain a deeper understanding of
the phenomenon of discipline disproportionality in each of the school settings.
Qualitative Data Results
Qualitative data were collected based on two rounds of interviews with principals within
each school. Interviews lasted for approximately one hour and the interviews were held six
weeks apart. Once all the interview data were collected, they were coded and re-coded as a

62
means to identify potential, emerging themes. As the principals discussed their individual views
on student discipline and disproportionality, they also shared information concerning their own
beliefs and experiences, the barriers they often faced, and the work they were currently engaged
in to improve student achievement outcomes. Two primary themes emerged in conjunction with
a number of sub-themes, providing further insight and perspective relating to the research
questions. Figure 3 details the dominant themes and sub-themes resulting from the interviews,
which will be discussed in greater detail in the discussion section that follows.
Figure 3. Major Themes and Sub-Themes Derived from Qualitative Data Analysis.
Theme 1: Principal Behaviors and Beliefs Impact Student Discipline Disproportionality Rates
The first major theme derived from the data was that principal behaviors and beliefs in
these rural schools have an impact on their school’s discipline disproportionality rates. Based on
analysis of the quantitative data, one school had significantly lower rates of disproportionate
discipline for African American students than the other schools in the study (Elementary A). The
principal of Elementary A shared many actions she was taking with her staff to improve
equitable discipline for all students, including providing professional development on culturally
Major Themes and Sub-Themes
Principal Behaviors and Beliefs Impact Student Discipline Disproportionality Rates.
"Culturally Aware" Principals who
Take Action have Lower Rates of
Disproportionality.
Different Types of Actions Make a
Difference.
Principals who Describe Actions Passively have Higher Rates of
Disproportionality.
Discipline Systems are Highly Varied Among Schools.
Discipline Reporting
Varies Widely Among Schools.
Discipline Decisions are Made
with Unclear or Non-
Developed Criteria.
Students with Recurring
Infractions are Defined and
Handled Differently in
Schools.

63
responsive teaching, implicit bias, and student engagement. Middle C also had a lower relative
difference in composition (29.1%), shared her beliefs about building relationships with students,
and specifically talked of how she handles African American students. The other three schools
had significantly higher relative differences in composition for African American students as
compared to the total student population in the school. When this knowledge was combined with
the data collected from both rounds of interviews, it became clear that the principals in the
schools with lower rates of disproportionate discipline shared many characteristics, while those
with the higher rates of disproportionate discipline did as well. The codes used to generate each
sub-theme were aligned with the articulated beliefs and behaviors of each of the principals and
provided deeper insight into the phenomenon of disproportionate discipline in rural schools. The
major categories and codes leading to this theme are listed in Figure 4.

64
Figure 4. First Major Theme, Sub-Themes, and Codes. Note: TA = Taking Action.
Sub-theme 1.1: “Culturally Aware” Principals Who Take Specific Actions Have
Lower Rates of Disproportionate Discipline Between African American and White
Students. Within the category of principal beliefs, the strongest emerging theme was that
principals who exhibited awareness of the students’ cultures in their schools through their
interview comments and take intentional actions to support those cultures have schools with
lower rates of disproportionate discipline between African American and White students.
Cultural awareness is defined as the ability of the principal to discuss the hidden aspects of
culture or those not easily observed, including the values, beliefs, attitudes, norms,
communication styles, and role expectations of the students (Nelson & Guerra, 2014). In the
Theme 1: Principal Behaviors and Beliefs Impact Student Discipline Disproportionality Rates
1.1 "Culturally Aware" Principals who Take Action
have Lower Rates of Disproportionality.
Principal Culturally
Aware
Principal Taking Action
1.2 Different Types of Actions Make a
Difference
TA -Creating Culture
TA -Professional Development
TA -Redesigning
System
TA - Hiring Practices
1.3 Principals who Describe Actions Passively
have Higher Rates of Disproportionality.
Principal Barrier
TA -Passive

65
code Principal - Culturally Aware, principals discussed many aspects of culture in their schools,
especially related to behavior. Some noted that they have observed that respect and disrespect
mean something very different to their African American and White students. They went on to
explain that students growing up in White homes are more often taught how to respond
respectfully to adults in their opinion while students in African American homes often tease and
ridicule each other as a way to "toughen" each other up. They felt that when African American
students come to school, this creates negative interactions because the majority of the adults their
students encounter in these schools are White women. One principal, in explaining the
difference, said:
I don't know. A big thing with our African American males is respect, and if they feel any
kind of slighted, or disrespect from anybody, teacher or students, they lash out a lot. It's
not all of them. It's just those few that have the most social problems, what I call ... they
don't have the social skills that a lot of kids have. Or they don't have the appropriate
social skills that I guess we connect with our culture that's going to be successful.
Several principals mentioned making eye contact as an example of respect, especially
with African American children looking down and away when they are upset. They also noted
that some of the African American children in their schools have a really hard time controlling
their anger, which creates problems at school. The "fight or flight" reaction of many African
American children seen at school often gets them in trouble, and one said that in their culture, the
kids “just bully each other.” Some noted that our "normal" is not their "normal" and that we
must learn more about how their culture works to truly understand. Another principal noted:
I try not to be racist, but you do notice differences. You notice differences in how people
react. I notice differences in these little African American boys. It's heartbreaking. It
really is. I try my best to show love for them, and care for them. I try to understand where
they're coming from. I build relationships with them, but it's hard. It's hard because their
behavior makes it hard for them to conform to white society's expectations in a
classroom, or in our culture, or in a job market. I don't know. It's just a whole societal
thing that's just really a hard problem to solve. All we can do is try to reach as many as

66
we can. Instill the love of education, instill that in the home, the importance of education,
because that is a way out.
Responses reflected that the principals viewed these cultural differences through a deficit
lens and were quick to note that their African American students have a much harder time fitting
into their school system successfully. According to Nelson and Guerra (2014), “Deficit thinking
stems from the ethnocentric notion that the beliefs and standards of the dominant group are
inherently correct (p. 71).” By viewing the problem as the students not being able to control
their anger and the parents not teaching them the right way to behave, the principals perceived
that the problem was with the students and families themselves rather than the system itself. One
principal had over thirty years of experience working in schools with a majority of African
American students and noted that parents often told her she could "see beyond their anger to the
potential they had." It's apparent that some principals in the group have deeper levels of cultural
awareness of their students than others, although none of the principals gave responses that
would align with the definition of culturally responsive (Nelson & Guerra, 2014). In their view,
educators who approach issues from a deep knowledge of invisible culture such as which
cultures are more group-oriented versus individual-oriented and use that knowledge to explain
how culture clashes occur are categorized as culturally responsive.
An analysis of the qualitative data indicated that some of the principals interviewed were
culturally aware and expressed a need to incorporate cultural awareness into their school culture,
while others did not see the value. One principal remarked,
Overall we don't spend a lot of time with culture and that kind of thing because we're so
focused on teaching reading, writing, and math. We don't make a big deal out of any
cultures, really.

67
During qualitative coding analysis, codes were examined for proximity and/or overlap in the data
set. Closely linked in the data for Principal – Culturally Aware were codes related either to the
Principal - Taking Action based on this knowledge or codes aligned to Principal - Passive (non-
active) responses to issues caused by cultural mismatches. In Figure 5, these codes are listed by
the number for each building leader to show relationships among the codes.
Figure 5. Quantity of Codes for Principal-Culturally Aware, Taking Action, and Passive by
Leader
When compiling the data from each building leader by code, the relationship between the
codes and the quantitative data became evident. Districts where the leader expressed a cultural
awareness had lower numbers of disproportionate rates of discipline between African American
and White students. The leaders in District C had the most codes for culturally aware as well as
the most codes tied to taking actions in their schools. However, Elementary C also had the
highest rate of differences in relative composition for African American students. Interestingly,
Elementary A has the highest number of codes for taking action but much fewer codes for
31 2
0
12 11
48
86
3
36
23
0
12
24
9
0 00
10
20
30
40
50
60
Elem A Elem B - Principal Elem B - Asst
Prin
Middle B Elem C Middle C
Principal Culturally Aware Taking Action Passive

68
Principal - Culturally Aware. This disparity may signal that the principal at Elementary A has
internalized the language of cultural awareness and has moved solidly into taking action without
the need to verbalize intent. In contrast, District B had the highest numbers of codes tied to
Principal - Passive and the lowest number of codes tied to Principal - Culturally Aware. Both
schools had high rates of disproportionality between African American and White students.
Sub-theme 1.2: Different Types of Specific, Concrete Actions Make a Difference in
Disproportionality Rates. All building leaders described actions they were taking in their
schools to improve student outcomes. Data for each of these codes included specific examples of
actions the principal had initiated at their school to meet a need for their students. Emergent
patterns in the data made clear that participant responses were heavy in certain categories and
absent in others. The data made clear three of the principals in the study were taking concrete
actions within their schools to meet the discipline needs of their students, including taking some
culturally responsive actions (Elementary A, Elementary C, Middle C). The other three leaders
(Elementary B Principal and Assistant Principal, Middle B) discussed actions passively, by
describing actions others should take, things they would do if a barrier did not exist, or not really
knowing what to do to address certain issues. When the rates of disproportionality generated in
the quantitative data analysis portion of this study were compared to the responses of their
leaders, the relationship between quantitative and qualitative data led to clear conclusions.
Within the category of Principal - Taking Action, several codes from the data were highly related
to actions being taken by the building leaders (Figure 6).

69
Figure 6. Highly Related Codes within Principal - Taking Action
In the data, principals with a high degree of cultural awareness also had more codes tied
to Taking Action –Hiring Practices. For Hiring Practices, culturally aware leaders described
what they were doing to actively recruit more African American teachers for their school such as
working with local universities and sending African American teachers to recruit at job fairs.
A common theme from these principals was that they wanted to hire the best person for the job,
but that they also understood how important it was for their students to see someone like them in
the teacher’s role. One principal remarked:
We've actively recruited African-Americans so they see some of the culture in some of
our staff members, too. Because if I have ... what is it? 61% white, and 27% African-
American, that should reflect in my staff. We've done a lot of our own. I've hired two or
three of our interns because you know what they can do. I hired the best teacher, not just
because it was an African-American teacher. I hired the best teacher.
Principal - Taking Action
Taking Action -
Hiring Practices
Principal Culturally Aware
Taking Action -Creating Culture
Taking Action -Professional Development
Taking Action -Redesign System
Taking Action -
PassivePrincipal Barrier

70
These principals also had more codes tied to the idea of Taking Action - Creating
Culture. They described the behaviors of students based on hidden motivators and norms and
their understanding of why students act the way they do at school. Principals with a high degree
of cultural awareness heavily predicated their talk in this category on the need to develop
relationships with students and families. These leaders had the deepest understanding of the
hidden rules of culture and its effect on students in school. In their work, these leaders are
actively working to create a school environment where their students feel “safe and cared for.”
Principals talked about their work implementing counseling groups for students needing specific
support, focusing on positive behavioral solutions and creating a culture of high expectations for
all students, as well as creating a culture of “empathy” where teachers truly understand what
their students’ lives are like at home.
These leaders also had a higher number of codes tied to Taking Action – Professional
Development. Many of the leaders were accomplishing this work through professional
development from external sources that they were engaged in with their teachers focused on
implementing specific actions to impact their building culture and make it more positive and
inclusive for all students. Elementary A had contracted with Solution Tree to support their work
in creating a more equitable environment for students. District B’s leaders mentioned
professional development from an outside speaker who focused on reaching the needs of
students in poverty, while District C was engaged in work through a grant from a state university
focused on implementing PBIS. For two of the districts, the professional development included
work in redesigning their discipline system. The school that had the most comprehensive
professional development plan was Elementary A, which had engaged in a rigorous equity audit
of data, and from there had determined to implement a plan focused on culturally-responsive

71
teaching. Their comprehensive plan consisted of multiple steps taking place throughout the year
and involved all stakeholders both in the formation of the plan and implementation in classrooms
on a daily basis. Both school leaders in District C outlined their plan for implementing PBIS in
their school for the coming school year, and were also able to share many systems already in
place in the district such as a community health clinic located in the school for all students and
staff and their program providing breakfast and lunch to all for free.
These school leaders also spoke of taking action by creating culture through redesigning
their discipline systems and these codes were highly related. The principals with the greatest
weight of codes tied to cultural awareness also had codes tied to Taking Action – Redesign
System. These data focused on ways principals were working to improve their discipline systems
including making the referral process more clear, creating a protocol for how to refer a student to
the office, and providing training for teachers on how to craft a student discipline referral.
District C was engaged in the most work here because of their implementation of PBIS. They
created a matrix for the district based on the positive behaviors they were encouraging students
to display, articulated tiers of discipline behaviors with their teachers, and were in the process of
drafting lesson plans for all teachers to use to teach their students the expected behaviors. This
work represents a mind shift for many of the teachers in District C because of the move away
from punitive discipline. Middle C’s principal remarked:
The big thing about PBIS is changing our behavior. The first thing we work on is
changing our behavior, before we start working on changing the behavior of the students.
Elementary A’s work in redesigning the system was focused on having a more objective system,
not letting bias impact decisions related to discipline, and building empathy for students’ lives at
home as well as cultural competence in the classroom.

72
Figure 7 details the codes for each school leader for the category Taking Action to show
the weight of specific actions being taken by each leader.
Figure 7. Quantity of Codes in Principal - Taking Action by Building Leader. TA = Taking
Action, PD = Professional Development.
The principals of the schools with lower rates of disproportionality for African American
students were characterized as highly engaged in taking formal, concrete actions within their
school, even though the schools were not taking identical actions. The analyzed data suggest that
principals who took actionable steps to redesign disciplinary systems and supported that work
with comprehensive professional development had the highest impact on reducing rates of
student disproportionality in disciplinary between African American and White students in these
rural schools. Relatedly, these principals also had the lowest measured rates of disproportionate
discipline between African American and White students in their respective schools compared to
the other schools in the study.
9
20
1
1110
20
1 10
12 2
3
0
42
24
31
0
7
2
11
1 1 1
14
8
0
5
10
15
20
25
30
Elem A Elem B -Principal
Elem B - AsstPrin
Middle B Elem C Middle C
TA-Creating Culture TA-Design Interventions TA-Hiring Practices TA-PD TA-Redesign system

73
Sub-theme 1.3: Principals Who Responded to Taking Action with Passive Responses
Experienced Higher Rates of Disproportionate Discipline Between African American and
White Students. In contrast to the actions and codes described by three principals in Sub-theme
1.2, the other three principals (all in District B) had the highest quantity of codes in Taking
Action – Passive. The data within Taking Action – Passive illustrated that there were nuances to
the type of passivity each principal expressed. Some of the comments were coded passive
because the principal did not assume responsibility for taking action either through vague
comments like, “Someone should look into that,” or by saying that they weren’t really allowed to
do anything about the issue. For example, when asked about the differences in staff and student
demographics, all six leaders were quick to point out the abundance of White female teachers
and the lack of African American teachers in their schools. However, these three leaders
described the issue passively by saying things like, “Yes. I don't know why they don't apply here.
That's something we should be finding out.” One went on to describe that they had an African
American teacher several years prior, but that she had moved to another campus in the district
after only a few months and they hadn’t had one apply since then. Another nuance of the
responses coded as passive was that one leader in this district was an assistant principal in the
building. In that role, she often does not have the authority to take direct actions, but instead
must follow the principal’s lead. This may account for the high number of responses coded as
passive in her case. In speaking about discipline referral processes, she said, “I'm not happy
about that, but I've never been given an opportunity to do anything about it.” It is clear that these
responses were coded passive for a variety of reasons.
For Taking Action – Passive, the code Principal Barrier was highly correlated. Principal
barriers include failing to think about or question the policies leaders were implementing through

74
the lens of equity, making assumptions about teachers and students related to their words and
actions, and being unaware of racial differences by describing themselves as “colorblind.”
Another principal barrier was not understanding the importance of celebrating the diversity
within their student body and not spending any time or money on training teachers to understand
cultural responsiveness. All of the data within Principal Barrier came from the same leaders
who supplied the data for Taking Action – Passive and work in the same district. The second
major theme that emerged from the data is focused on the discipline systems themselves in these
schools.
Theme 2: Disciplinary Systems in these Rural Schools Are Highly Varied and Poorly Funded
in Comparison to Other School Districts
The second major theme that emerged from the data concerned the discipline systems
currently being used in the schools, including the office referral process, coding of the types of
infractions, consistency in consequences, and available systems to monitor data. All principals
were directly involved in student discipline in their schools, and reported seeing students daily
for various discipline reasons. However, their descriptions revealed systems that were not clearly
defined for their teachers, students, or parents, especially during the 2017-2018 school year. The
overall theme that emerged is that these systems were highly variable in terms of discipline
decisions being made by both teachers and administrators, how discipline is reported and
monitored, and the level of support provided for students with recurring discipline incidents.
Figure 8 details Theme 2, the sub-themes that emerged, and the related codes from the data.

75
Figure 8. Second Major Theme, Sub-Themes, and Codes.
Sub-theme 2.1. Discipline Decisions Are Made by Teachers and Administrators with
Unclear or Non-Developed Criteria. The first sub-theme that emerged from the data was that
the discipline systems in place are based on practices and “known” rules that principals have
used for many years. Although all principals reported that they had discipline policies published
in their handbooks, they said they intentionally left them vague to not “tie their hands” in dealing
with discipline situations. They reported that they had office referral forms for teachers to
complete, but that they would often send students back to the classroom if they didn’t feel the
referral was worthy of being sent to the office. They also stated that some teachers sent many
Theme 2: Discipline Systems are Highly Varied
Discipline Decisions are Made by Teachers and
Administrators with Unclear or Non-Developed Criteria.
Unpublished Systems
Root Cause
Teacher/ Administrator
Miscommunication
Implicit Bias
Different Reporting Varies Widely
Coding Inconsistencies
Lack of Reporting
Data Monitoring
Systems
Students with Recurring Infractions Need More than
Schools can Provide.
Outside Mental Health Providers
Juvenile Court
Principal Barrier

76
students to the office (especially novice teachers), while others wouldn’t send one for the entire
year. Some principals left it up to the individual grade levels to determine their discipline
processes, while others said they covered with their staff at the beginning of the year how to refer
a student to the office. One said that they had a referral form with tiers of offenses on it, but that
they hadn’t really used that part for several years because nobody really understood it. Another
had begun using a tiered chart with her teachers based on student offenses, and remarked that it
had dramatically cut down on the number of referrals that year. However, she was the only
principal of the six leaders using such a system. Several principals discussed how their goal was
to get to the “root of the behavior” with their students to teach them proper behavior, and
because of that, they hesitated to have systems that were written down to follow.
In determining the cause of a student’s misbehavior, principals shared many techniques
they try. They often rely on their school counselor to assist with student behavior and talked
about teaching students the proper way to behave instead of just punishing them. One gave an
example of a student who kept being sent to the office for anger outbursts, and once she talked
the student, she discovered that he was embarrassed because of his eczema on his head. Once
they figured that out, they were able to do a 504 plan for him and allow him to wear his hoodie
while at school. In digging down to the root of the issue, principals reported that they often
didn’t follow a prescribed series of steps, but rather tried to figure out what the student most
needed and meet that need. The process of trying to meet unmet needs of students at times led to
miscommunication between teachers and administrators, which is another aspect of the discipline
systems having unclear criteria.
In working with students individually to meet needs, principals noted that they would
often try unconventional methods. This was especially true of principals with lower elementary

77
grades on their campus. For example, one principal told the story of a young student who was
being sent to the office daily for a number of misbehaviors. Instead of trying to work on all of
them at once, the principal and student worked together to agree on a plan to reduce the student’s
behavior of throwing things when he became angry. The principal checked in with the student
several times each day, and gave him a sticker each time he made it for a specified amount of
time without throwing something. The teacher was unaware of the plan, and instead became
angry because every time the student came back from the office, he had another sticker. The
principal talked about how she had learned of the importance of communicating with her
teachers to ensure they understood the plan of action and why she was only working on one
behavior at a time with the student. Other principals shared similar stories of miscommunication
where it became clear that teachers were not treating all students with respect or had escalated
discipline situations by how they responded. The code of Teacher Barrier was highly related to
Teacher – Administrator Miscommunication.
The final code related to unclear systems in the data that emerged was Implicit Bias.
Because the discipline systems in these schools give a lot of leeway to teachers, there are
opportunities for implicit bias to happen at several junctures. The first is in the classroom when
the teacher makes the decision to refer (or not) a student. Principals told stories where students
had been referred to the office and upon investigation, they found that the student had not done
what they were accused of. Instead, teachers had made assumptions based on what other students
said or on the student’s previous behavior when making the referral. One principal has cameras
in her classrooms and shared how this had helped tremendously with eliminating bias in making
referrals because she could pull up the camera at any time and see what happened in the
classroom. One principal told a story of how she had assumed a student crying in the hallway

78
was in trouble again, because she was always in trouble for something. However, when she
found out the student was upset because her grandmother had just died, the principal felt
horrible. Implicit bias can also happen at the point where the administrator makes a decision
about the student’s consequence. Principals reported that they often utilize progressive discipline
and make decisions based on a student’s prior discipline referrals, but that they don’t have a set
list of consequences for each offense that they follow every time. In these cases, it is possible
that implicit bias plays a role in the consequence a student receives.
Sub-theme 2.2: Discipline Data Reporting Varies Widely from School-to-School, Not
Just District-to-District. The second sub-theme that emerged from the data relates to discipline
reporting and the wide variations noted among schools and districts. Principals shared
information about how their discipline data codes are determined and who is responsible for the
coding. None of the principals were aware of definitions from the state related to the official
state discipline codes, although two mentioned that they had just seen new codes and definitions
for the 2019-2020 school year and were excited to have some guidance. One principal said the
state codes were not really appropriate for the students in her school because of their age (lower
elementary), while another said they were only “allowed” to use certain codes for state reporting.
When asked about who it was that told them this, the principal was unsure. She just said “we’ve
always been told not to use certain ones.” This illustrates what happens in many discipline
systems where principals rely on what has always been done, but may not understand why it is
that way or who made it that way. In terms of their definitions of what the codes meant,
principals were fairly consistent in defining what they considered a fight, but less in agreement
about what constituted disorderly conduct and insubordination. They mentioned repeatedly that
their teachers often had different ideas of what those codes meant and that they would mark a

79
code on a referral which the principal would later change. Two of the principals said that their
secretaries were responsible for the coding that went into eSchool, which is the online state
accounting system. Principals were often contradictory of their own information with regard to
coding. When asked about codes, they would define them and then would say things like “we
never use Disorderly Conduct as a code because that’s too harsh” or “we hate the Other category
and never use it because it doesn’t explain what the student did.” However, when we would
view the data from their school together, it would become apparent that almost all of their
discipline was coded as Disorderly Conduct or Other. This was confusing to the principals and
they were unsure of where the breakdown was with their own data and coding.
Another code that emerged from the data was that discipline infractions and actions are
likely underreported in these schools. Every principal interviewed shared information about
referrals that they had chosen not to enter into the discipline system because they didn’t feel that
they were worthy of an office referral, had determined the referral was not accurate, or that they
just didn’t have time to enter them. One principal noted, “If you saw the list of discipline
referrals that I have…and I have a drawer full right now that I'm not going to even put into the
system.” Another noted that because they had taught their teachers how to write referrals at the
beginning of the year and were focused on accurate reporting that the number of referrals they
had just in the first month of school had been “ridiculous.” Because of the huge increase, they
had decided only to enter the most serious discipline referrals for the rest of the year because
they didn’t want their school to look bad. Because of the lack of discipline reporting and unclear
systems in place, the discipline data is difficult to compare from one school to the next.
The final code within discipline reporting is related to the way the discipline data is
monitored in these schools. Several principals mentioned that they monitor their data on a

80
weekly basis and that they counselor is responsible for providing it for them. One principal
(Elementary A), knew her discipline data very well and mentioned her current number of
referrals and that they were on track to reduce their referral rate by 18% over the previous year.
One principal said that he hadn’t really looked at his data recently but that his teachers were
doing some work with it in designing interventions for students. It is interesting to note here that
the principal who was most well acquainted with her school discipline data also had the lowest
rates of disproportionate discipline in her school and the principal who relied on his teachers to
look at the data had one of the highest rates of disproportionality.
In looking at the systems that these principals are using to monitor their discipline data,
all mentioned using the system provided by the state for reporting (eSchool). Some relied on
their counselors or secretaries to pull the data for them, and said that they weren’t trained on how
to use the system. They also discussed how difficult it was to use the system and that it was not
easy to locate their data or break it down in a way that showed them areas of concern. One
principal said that she was thinking of using a Google form for discipline referrals for the 2019-
2020 school year to have an easier way to monitor the data without having to use the eSchool
system. None of the schools had purchased a data system or dashboard to supplement their data
reporting, and several mentioned concerns about money in their districts and cutbacks that were
taking place because of the new requirements of the salary schedule for teachers. Because these
rural schools were struggling with finances and thus had to rely on only the state-provided data
reporting system to track their discipline data, they are at a disadvantage to other larger school
districts who are able to purchase data systems that show them in real time areas of
disproportionate discipline within their school with the click of a button.

81
Sub-theme 2.3. Students with Recurring Infractions Require More Support Than
Schools Can Provide. The final sub-theme on discipline systems involves students with frequent
referrals and how principals handle them. Principals defined these students differently, ranging
from a student having more than one referral in a year to those having more than five referrals in
a semester. Most said that they considered students with multiple referrals in a short period of
time as students with recurring infractions and that in reality, about 90% of their office referrals
come from about 10% of the students. When asked about the number of students they believed
had recurring infractions, they named numbers between 10 and 20. Some of these students spent
as much time as 54 days in ISS last year, and one principal said she had a student who had more
than 30 referrals in a school year. In terms of what principals do to support their students with
recurring infractions, they said that they begin with parent contact and communication, which
one described as a “back and forth” between the school and the parents to determine what was
really going on with the student. Principals felt that most of these students were dealing with
mental health issues or difficulties at home, and were quick to call in outside support. Several
principals mentioned out-patient treatment facilities and having the juvenile court officer on
“speed-dial” as measures they employ when faced with severe behavior issues. The elementary
leaders mentioned utilizing mental health counselors and juvenile court most often, while the
middle school principals both mentioned placement in an Alternate Learning Environment
(ALE) as an option for students with recurring infractions.
Several principals talked about those with severe problems as being “more than they are
trained to handle” in the school, and that because of that, they are forced to rely on outside
providers. District C has an in-district health clinic and mentioned that for the 2019-2020 school
year, they were bringing in a nurse practitioner who specialized in mental health treatment

82
because of the great need they see from their students. Overwhelmingly principals expressed
frustration at not being able to help support these students and feeling like the numbers of
students with severe behavior issues was increasing. They were quick to point out that
punishment clearly did not work for students with chronic behavior problems, but that their
systems were not equipped to handle these students on campus. Three of the elementary
principals discussed mental health issues they were seeing with students in kindergarten this
school year and how it was an increase over previous years. The frustration and tendency to
outsource support for these students so quickly may speak to the shifting focus in schools today
from supporting just academics to supporting social-emotional learning as well.
Summary Across Schools
Once both the quantitative and qualitative data were collected and analyzed for each
school, they were compiled across all five schools to draw conclusions. Table 7 provides the
relative differences in compositions and the top recorded codes for each principal.
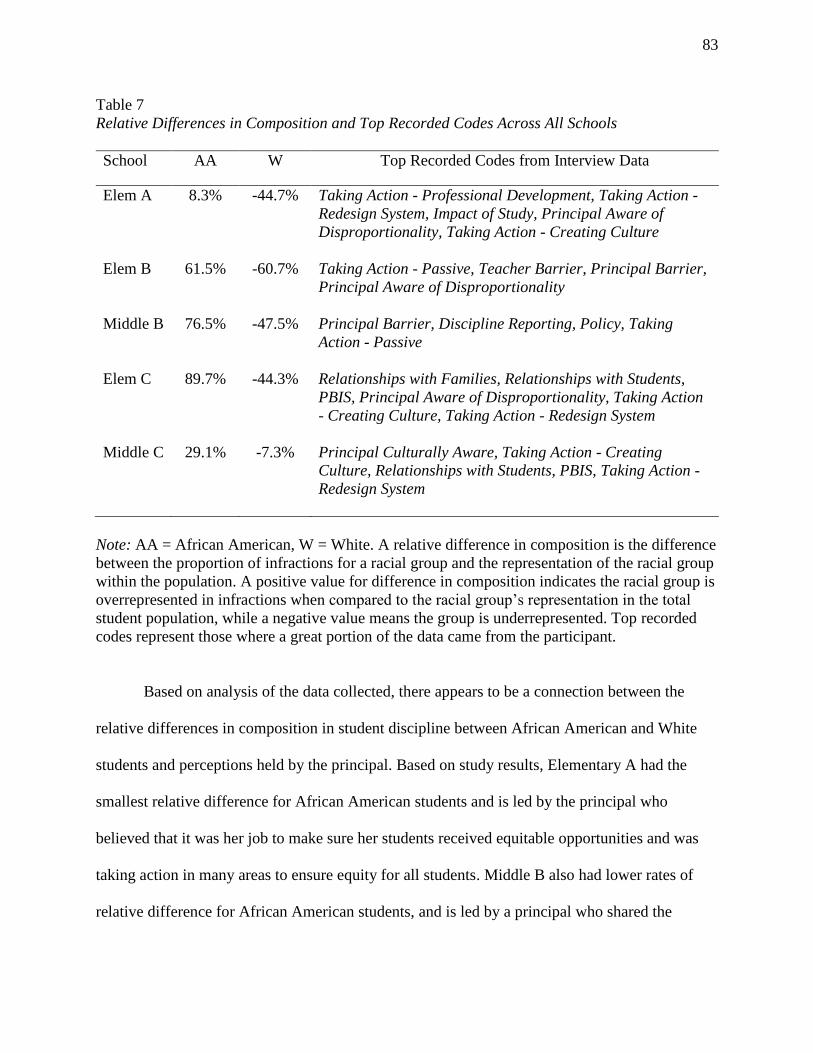
83
Table 7
Relative Differences in Composition and Top Recorded Codes Across All Schools
School AA W Top Recorded Codes from Interview Data
Elem A 8.3% -44.7% Taking Action - Professional Development, Taking Action -
Redesign System, Impact of Study, Principal Aware of
Disproportionality, Taking Action - Creating Culture
Elem B 61.5% -60.7% Taking Action - Passive, Teacher Barrier, Principal Barrier,
Principal Aware of Disproportionality
Middle B 76.5% -47.5% Principal Barrier, Discipline Reporting, Policy, Taking
Action - Passive
Elem C 89.7% -44.3% Relationships with Families, Relationships with Students,
PBIS, Principal Aware of Disproportionality, Taking Action
- Creating Culture, Taking Action - Redesign System
Middle C 29.1% -7.3% Principal Culturally Aware, Taking Action - Creating
Culture, Relationships with Students, PBIS, Taking Action -
Redesign System
Note: AA = African American, W = White. A relative difference in composition is the difference
between the proportion of infractions for a racial group and the representation of the racial group
within the population. A positive value for difference in composition indicates the racial group is
overrepresented in infractions when compared to the racial group’s representation in the total
student population, while a negative value means the group is underrepresented. Top recorded
codes represent those where a great portion of the data came from the participant.
Based on analysis of the data collected, there appears to be a connection between the
relative differences in composition in student discipline between African American and White
students and perceptions held by the principal. Based on study results, Elementary A had the
smallest relative difference for African American students and is led by the principal who
believed that it was her job to make sure her students received equitable opportunities and was
taking action in many areas to ensure equity for all students. Middle B also had lower rates of
relative difference for African American students, and is led by a principal who shared the

84
deepest knowledge of student culture in her building and whose leadership style is based on
building caring relationships both with students and families. The remaining schools had
significantly higher relative differences in composition for African American students, and are
led by principals who described actions passively and were more focused on academics than
behavior. The only exception here is Elementary C, which had the highest relative difference in
composition scores for African American students, but was actively taking action to reduce
disproportionate discipline in her school based on her own analysis of her 17-18 school
discipline data. This work was evidenced by her report that they had already cut their discipline
infraction rate in half over the previous year for all students and were actively working to reduce
disproportionate rates. Further analysis of each school’s discipline data and responses from their
principal provided deeper insight into the unique characteristics of each rural school setting.
Findings for Individual Schools
Elementary A Findings
Quantitative Data
Elementary A is a majority-minority school with 673 students in grades Pre-K – 4th
grade. Sixty-three percent of its student body is categorized as part of a minority group (N=420).
The total percentage of African American, White, and Other students is listed in Table 8. Also
within the chart are the composite index scores for discipline incidents and enrollment, as well as
the relative differences in composition.

85
Table 8
Elementary A Enrollment and Discipline Infractions by Racial Group, 2017-2018
Student
racial
group
Number
of
students
enrolled
Composition
of school
enrollment
(percent)
Number of
discipline
infractions
Composition
of
infractions
by racial
group
(percent)
Difference
in
composition
(percentage
points)
Relative
difference
in
composition
of
infractions
and
enrollment
composition
(percent)
African
American
320 48 293 52 4 8.3
White 253 38 120 21 -17 -44.7
Other 100 15 152 27 12 80
Total 673 na 565 na na na
Note: Difference in composition is the percentage point difference between the composition of
two groups. (For example, composition of incidents for White students minus composition of
White students in school enrollment: 21 – 38 = -17 percent.) A relative difference in composition
is the difference between the proportion of incidents for a racial group and the representation of
the racial group within the school population. (For example, difference in composition of
incidents for White students/composition of White students in school enrollment x 100: -17/38 x
100 = -44.7 percent.) A positive value for difference in composition or relative difference in
composition indicates a student group is overrepresented in incidents compared to the group’s
representation in the total student population, while a negative value means the group is
underrepresented. Na = not applicable because composition scores can only be calculated for
subgroups.
Once the composition index score and relative differences for composition for infractions
were calculated, the composition index score for discipline actions was calculated and compared
to the percentage of population for each racial group. Figure 9 shows the composition index
scores for population, infractions, and actions for each racial group.

86
Figure 9. Composition of population, infractions, and actions by race in Elementary A.
Differences in composition were calculated between the composition of population,
infractions, and actions for each race group and indicate levels of disproportionality based on
population. Table 9 provides the differences.
Table 9
Composition Differences in Student Infractions and Actions in Elementary A
Student Racial group Infractions Actions
African American 4% 7%
White -17% -16%
Other 12% 9%
Note: Differences were calculated based on the percentage of the total population each race
comprised. Positive values represent a higher percentage of infractions or actions than the
percentage of population each race comprises, while negative values represent a lower
percentage of infractions or actions than the percentage of population for each race.
In analyzing the overall composition of actions and infractions for students as compared
to their percent of the total population, the largest area of disproportionality is the
48%
38%
15%
52%
21%
27%
54%
22% 24%
0%
10%
20%
30%
40%
50%
60%
African American White Other
Elementary A
% of Population % of Infractions % of Actions

87
underrepresentation of White students in both categories. This is followed by the percentages for
students of Other races, and the lowest degree of disproportionality is for African American
students when compared to the percentage of the population they comprise.
Infractions. Analysis of the types of infractions students received revealed further
information about what types of infractions students were being referred for and the percentage
of each race receiving each type of infraction. Elementary A reported 565 infractions during the
2017-2018 school year. Although there were twenty-five possible categories available to code
infractions, only eleven had data reported. Of the eleven categories with data, the five most
commonly used were analyzed for disproportionality to allow for comparisons between schools.
The total number of infractions reported in Elementary A for the five categories were:
Insubordination (N=51), Disorderly Conduct (N=230), Bullying (N=11), Fighting (N=29), and
Other (N=41). The remaining 198 other infractions were reported in the following categories:
Cell Phone, Cyber Bullying, Sexual Harassment, Public Displays of Affection, Stealing, and
Terroristic Threatening.
To calculate the number of infractions per student overall, the number of referrals was
divided by the number of students. Based on the total of 565 infractions, the rate is .8 of an
infraction per student (less than one). When calculated by each racial group, the infraction rates
are as follows: .9 infractions per African American student, .5 infractions per White student, and
1.5 infractions per Other race students. Based on these calculations, students of Other races have
the highest infraction rate when compared to their percentage of the population, followed by
African American students, and then by White students. The rate of referral for students of Other
races is 1.3:1 when compared to White students, while African American students receive
infractions at a rate of 2.4:1 when compared to White students.

88
Once the total number of infractions for each category was determined, the composition
of each racial group receiving infractions was calculated. After percentages were calculated,
composition differences were calculated to determine the difference that existed by infraction.
Results are reported in Table 10.
Table 10
Composition Differences by Type of Infraction in Elementary A
Note: Differences were calculated based on the percentage of the total population each race
comprised and the total percentage of infractions by race. Positive values represent a higher
percentage of infractions than the percentage of population each race comprises, while negative
values represent a lower percentage of infractions than the percentage of population for each
race.
Based on analysis of the types of infractions students received, the highest degree of
difference in composition overall was for African American students in all five categories.
Significantly higher differences were noted in Insubordination, Disorderly Conduct, Fighting,
and Other than in Bullying. Differences also exists by the type of infraction for White students,
through a negative relationship. White students are underrepresented in each category when
analyzed by the type of infraction. Underrepresentation for White students in Insubordination
and Fighting is highest, which is also the same categories where the African American students
were overrepresented. Differences for students in the Other race category are all within single
digits of the percentage of the population they comprise.
Student Racial
Group
Insubordination Disorderly
Conduct
Bullying Fighting Other
African American 25% 23% 7% 28% 20%
White -18% -13% -2% -21% -14%
Other 3% 4% -6% -8% -8%
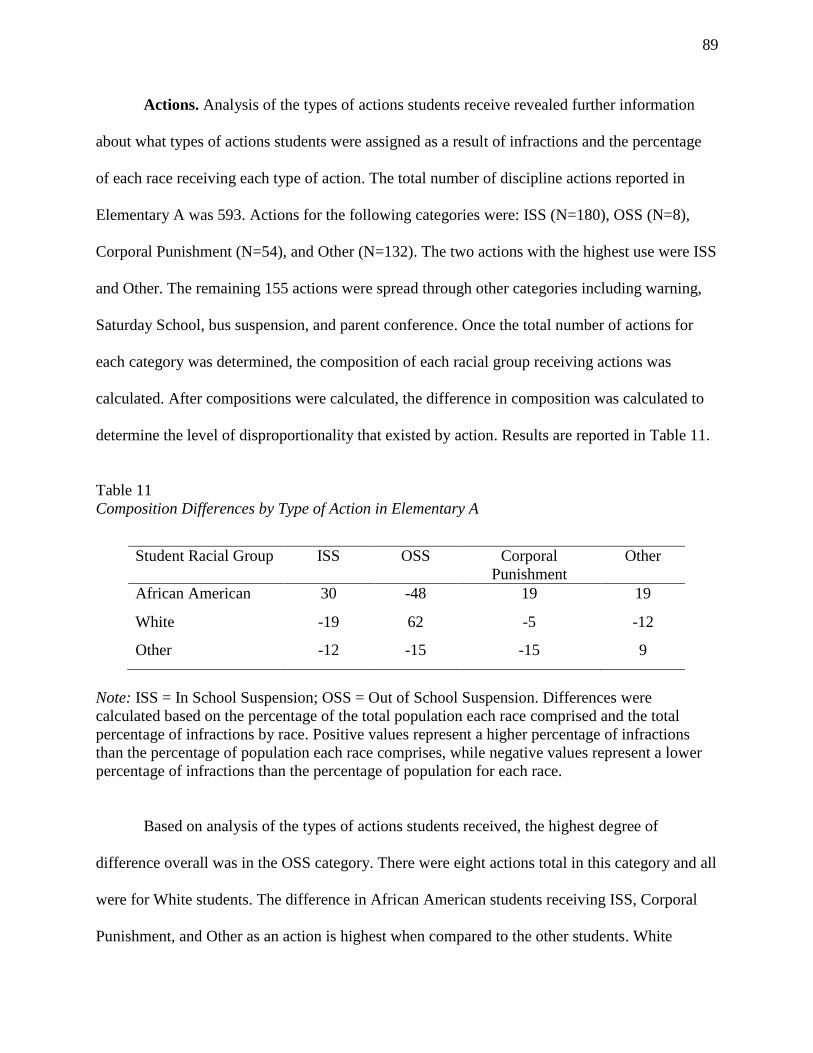
89
Actions. Analysis of the types of actions students receive revealed further information
about what types of actions students were assigned as a result of infractions and the percentage
of each race receiving each type of action. The total number of discipline actions reported in
Elementary A was 593. Actions for the following categories were: ISS (N=180), OSS (N=8),
Corporal Punishment (N=54), and Other (N=132). The two actions with the highest use were ISS
and Other. The remaining 155 actions were spread through other categories including warning,
Saturday School, bus suspension, and parent conference. Once the total number of actions for
each category was determined, the composition of each racial group receiving actions was
calculated. After compositions were calculated, the difference in composition was calculated to
determine the level of disproportionality that existed by action. Results are reported in Table 11.
Table 11
Composition Differences by Type of Action in Elementary A
Note: ISS = In School Suspension; OSS = Out of School Suspension. Differences were
calculated based on the percentage of the total population each race comprised and the total
percentage of infractions by race. Positive values represent a higher percentage of infractions
than the percentage of population each race comprises, while negative values represent a lower
percentage of infractions than the percentage of population for each race.
Based on analysis of the types of actions students received, the highest degree of
difference overall was in the OSS category. There were eight actions total in this category and all
were for White students. The difference in African American students receiving ISS, Corporal
Punishment, and Other as an action is highest when compared to the other students. White
Student Racial Group ISS OSS Corporal
Punishment
Other
African American 30 -48 19 19
White -19 62 -5 -12
Other -12 -15 -15 9

90
students are underrepresented in all actions other than OSS, and students in the Other category
are underrepresented in all categories except for Other actions.
Analysis of the quantitative data revealed several areas that were explored further through
two interviews with the principal including the disproportionate rates for African American
students in each type of infraction, the underrepresentation of White students in both infractions
and actions, the high incidence of Disorderly Conduct infractions, and the frequent use of ISS
and Other as discipline actions for all students.
Qualitative Data
Two interviews were conducted with the principal of Elementary A to gain deeper insight
into the discipline data as well as obtain her perspective on discipline, race, and
disproportionality in her school. Elementary A’s principal has been the principal in the school for
six years, and has spent a total of 17 years in the district. She is a white female and has only
worked in District A during her career. She is an established member of the community and first
moved into administration at the encouragement of the middle school principal. Throughout both
interviews, the principal of Elementary A described actions that she had initiated in her school to
improve outcomes for all students, including contracting with Solution Tree, a nationally-known
professional development provider focused on implementing the professional learning
community (PLC) process. She cited student- and school-level data as a source of information
when determining needs and talked freely about discipline referral rates and the actions they
were taking to reduce them. She was aware of her data and was able to pull it out to reference
when speaking to me in interviews, and noted, “I feel safer if I have my data here to refer to” to
ensure that she didn’t tell me any incorrect numbers. The top codes based on quantity of codes
supplied for the principal of Elementary A are presented in Figure 10.

91
Figure 10. Top codes (based on quantity) for principal of Elementary A.
Elementary A’s principal was aware of disproportionate rates of discipline in her school
and gave several examples of things they had done as a staff to combat those rates, resulting in
Principal Aware of Disproportionality as a top code. One example was that she and her
leadership team had analyzed the students who were their students with recurring infractions
because they had multiple discipline referrals within a short amount of time. She stated that they
determined that “all but three of the students were living in a single-parent home” and then
detailed the plan the team came up with to support these students, including shifting testing
responsibilities away from their counselor so she could spend more time with students in small
group sessions, building empathy with all staff members by creating an awareness of students
from single-parent homes, and implementing positive rewards for going without discipline
referrals for a certain period of time. She also had reached out to resources within the state,
including inviting the current Arkansas Teacher of the Year to speak to her staff about culturally
Elementary A
Taking Action -
Redesign System
Taking Action -
Creating Culture
Principal Aware of
Disproportionality
Impact of Study
Taking Action -
Professional Development

92
responsive teaching, taking advantage of workshops at the local Education Service Cooperative
on poverty and behavior management, and worked on her own leadership skills by participating
in all three years of the Arkansas Leadership Academy’s Master Principal program. Data
collected about these actions resulted in a top code of Taking Action – Creating Culture.
One of the areas that Elementary A’s principal had experienced that the other principals
did not mention was the backlash from the community because she was implementing specific
strategies to reduce disproportionate discipline and suspensions for African American students.
She detailed a recent experience where she was interviewed on the news for the work they were
doing to support African American students, which caused parents within the community, both
African American and White, to lash out using social media at one another and at the school for
being “racist.” She said there has been racial tension in the community for years, and that people
who don’t really understand what they are doing and how they are trying to support their
students tend to be the ones who are the most vocal. This experience was unsettling for her as a
leader, she explained, but she did not let it deter her from the work.
Hiring practices were mentioned several times during the interviews by Elementary A’s
principal. She was aware that there was a mismatch between the demographics of her staff and
students, with the majority of her staff being White female (one African American teacher). To
combat that, she described a new initiative she was undertaking where she sent her African
American teacher to a job fair at a historically African American university and used her as part
of her efforts to recruit other African American teachers. She had secured two new African
American teachers using this method for the next school year, and was eager to continue the
practice. She said that they had begun focusing on this because the mismatch between staff and

93
student demographics had become clear during the equity audit they conducted as part of their
work with Solution Tree.
Elementary A’s principal also detailed a comprehensive professional development plan
for the 2018 - 2019 school year they had implemented as a result of their work with Solution
Tree, resulting in Taking Action - Professional Development as a top code. The plan included on-
site professional development and coaching by Solution Tree associates, an equity audit, a parent
equity lab, a book study for all staff each month focused on implementing culturally responsive
strategies in the classroom, instructional rounds where peers observe one another using the
strategies, and constant data monitoring. Based on the data review, Elementary A’s principal
noted that they had seen huge decreases in the number of student discipline referrals over the
course of the year, and were on track to exceed their school improvement goal of reducing
discipline referrals by 10% (they were currently reduced by 18% as of May 1 that year). As part
of this work they also focused on learning to understand what their students’ home lives were
really like, building solid relationships with all students, and digging in to figure out what could
be at the root of a student’s behavior instead of just punishing them. She also explained that this
work had been part of her own action research project that she was conducting for the Arkansas
Leadership Academy’s Master Principal program, of which she was in the third and final year.
With regard to the discipline system in place at the school, Elementary A’s principal
explained that their system has evolved from a system with no clear steps or categories during
the 2017 - 2018 school year, to one that is more organized and clear cut. She detailed work they
had just completed to define each discipline code so that all staff members had the same
understanding of what each code meant, and was looking forward to implementing the work in
the 2019 - 2020 school year. She expressed frustrations at having no clear direction from the

94
state for discipline coding prior to this year, and said that their data was likely incomplete due to
multiple people coding discipline data using their own interpretation. She remarked:
But at the same time, what training have you had? Nobody ever sat down and said,
"Define these behaviors, make sure that what we're entering in the eSchool matches up,
or even data, for that matter.... Before this year, I wouldn't have been able to tell you,
"Well, Pam, she's the one that has eight discipline referrals, so she's the one messed up
our data."
The work of creating a more objective system and monitoring student discipline data was being
taken on by her leadership team, as well as the teaching staff, resulting in Taking Action –
Redesign System as a top code.
When presented with the disproportionality rates for her school based on 2017 -2018
discipline data, her reaction was one of deep reflection. She asked many questions to make sense
of the data, and also asked what the other schools in my study looked like. She wanted to know
what her data from the most recent school year would look like using this type of disaggregation
as well, and wanted to share it with her staff. She also expressed concern that she was just now
seeing her data broken down this way, rather than years ago when she became a principal. She
said:
Yeah. I can feel the tears in the very back. I mean, I'm not going to start crying or
anything, but it's almost kind of sad, you know? That we've done this... Yes, we can do
way better... the bottom line is we can do better...
She discussed being able to use the data generated in this study as a tool to help her staff see
areas of improvement and also inquired about she could go about calculating data using the same
process for the most recent school year to establish patterns of disproportionate discipline for
them to analyze, resulting in Impact of Study as a top code. Her resolve to make positive changes
for all students was apparent in both her words and in the concrete actions described throughout
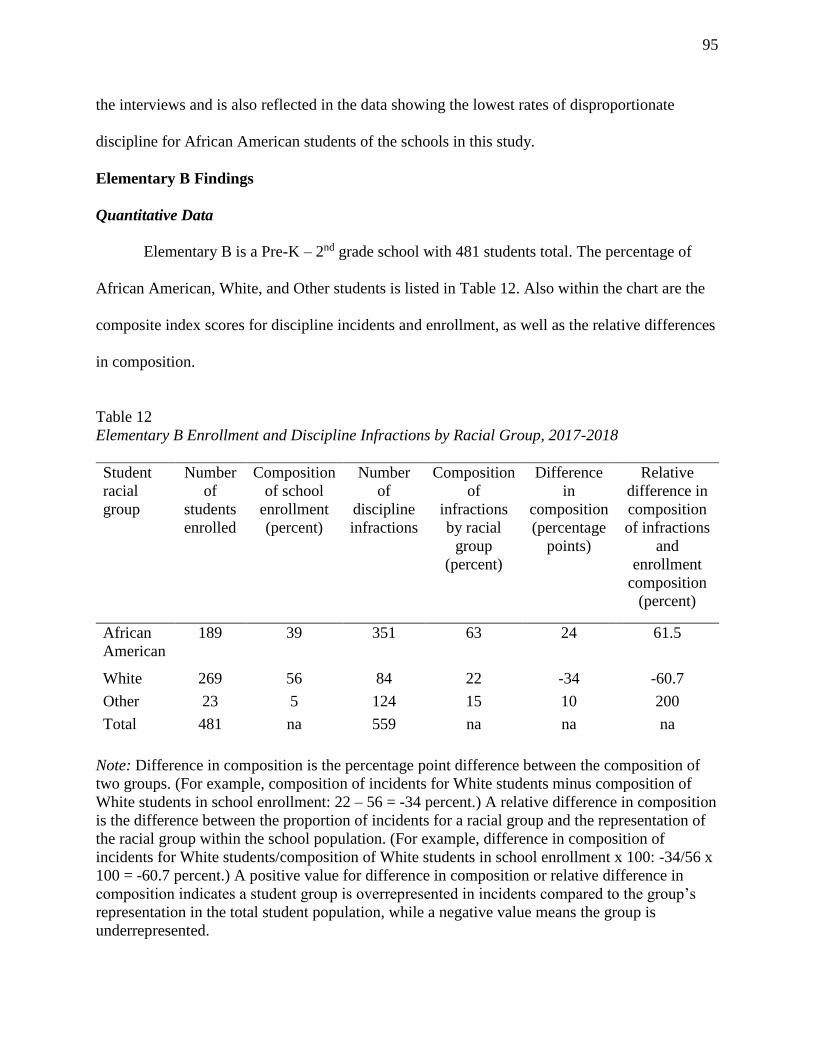
95
the interviews and is also reflected in the data showing the lowest rates of disproportionate
discipline for African American students of the schools in this study.
Elementary B Findings
Quantitative Data
Elementary B is a Pre-K – 2nd grade school with 481 students total. The percentage of
African American, White, and Other students is listed in Table 12. Also within the chart are the
composite index scores for discipline incidents and enrollment, as well as the relative differences
in composition.
Table 12
Elementary B Enrollment and Discipline Infractions by Racial Group, 2017-2018
Student
racial
group
Number
of
students
enrolled
Composition
of school
enrollment
(percent)
Number
of
discipline
infractions
Composition
of
infractions
by racial
group
(percent)
Difference
in
composition
(percentage
points)
Relative
difference in
composition
of infractions
and
enrollment
composition
(percent)
African
American
189 39 351 63 24 61.5
White 269 56 84 22 -34 -60.7
Other 23 5 124 15 10 200
Total 481 na 559 na na na
Note: Difference in composition is the percentage point difference between the composition of
two groups. (For example, composition of incidents for White students minus composition of
White students in school enrollment: 22 – 56 = -34 percent.) A relative difference in composition
is the difference between the proportion of incidents for a racial group and the representation of
the racial group within the school population. (For example, difference in composition of
incidents for White students/composition of White students in school enrollment x 100: -34/56 x
100 = -60.7 percent.) A positive value for difference in composition or relative difference in
composition indicates a student group is overrepresented in incidents compared to the group’s
representation in the total student population, while a negative value means the group is
underrepresented.

96
Once the composition index score and relative differences for composition for infractions
was calculated, the composition index score for discipline actions was calculated and compared
to the percentage of population for each racial group. Figure 11 shows the composition index
scores for population, infractions, and actions for each racial group.
Figure 11. Composition of population, infractions, and actions by race in Elementary B.
Differences in composition were calculated between the composition of population,
infractions, and actions for each race group and indicate levels of disproportionality based on
population. Table 13 provides the differences.
39%
56%
5%
63%
22%
15%
65%
22%
13%
0%
10%
20%
30%
40%
50%
60%
70%
African American White Other
Elementary B
% of Population % of Infractions % of Actions

97
Table 13
Composition Differences in Student Infractions and Actions in Elementary B
Note: Differences were calculated based on the percentage of the total population each race
comprised. Positive values represent a higher percentage of infractions or actions than the
percentage of population each race comprises, while negative values represent a lower
percentage of infractions or actions than the percentage of population for each race.
In analyzing the overall composition of actions and infractions for students as compared
to their percent of the total population, the largest area of disproportionality is the
underrepresentation of White students in both categories. This is followed by the difference for
African American students, and then the students of Other races when compared to the
percentage of the population they comprise. One area to note here is that African American
students had more actions than infractions, which indicates that some discipline actions were
reported but may not have had a corresponding infraction reported. The students from Other
races had lower differences in composition in infractions and actions than White or African
American students.
Infractions. Analysis of the types of infractions students receive revealed further
information about what types of infractions students were being referred for and the composition
by race for each type of infraction. Elementary B reported 559 infractions during the 2017-2018
school year. Although there were twenty-five possible categories available to code infractions,
only nine had data reported. Of the nine categories with data, the five most commonly used were
analyzed for composition differences to allow for comparisons between schools. The total
number of infractions reported in Elementary B for the five categories were: Insubordination
Student Racial Group Infractions Actions
African American 24% 26%
White -34% -34%
Other 10% 8%
98
(N=33), Disorderly Conduct (N=382), Bullying (N=0), Fighting (N=27), and Other (N=0).
Almost all of the discipline infractions were reported as Disorderly Conduct, and both Bullying
and Other reported zero infractions. The remaining 118 other infractions were reported in the
following categories: Cell Phone, Cyber Bullying, Sexual Harassment, Public Displays of
Affection, Stealing, and Terroristic Threatening.
To calculate the number of infractions per student overall, the number of referrals was
divided by the number of students. Based on the total of 559 infractions, the rate is 1.2
infractions per student. When calculated by each racial group, the infraction rates are as follows:
1.9 infractions per African American student, .5 infractions per White student, and 3.7
infractions per Other race students. Based on these calculations, students of Other races have the
highest infraction rate when compared to their percentage of the population, followed by African
American students, and then by White students. The rate of infractions for students of Other
races is .7:1 when compared to White students, while African American students receive
infractions at a rate of 2.8:1 when compared to White students.
Once the total number of infractions for each category was determined, the composition
of each racial group receiving infractions was calculated, followed by composition differences.
Results are reported in Table 14.

99
Table 14
Composition Differences by Type of Infraction in Elementary B
Note: Z = Zero incidents reported. Differences were calculated based on the percentage of the
total population each race comprised and the total percentage of infractions by race. Positive
values represent a higher percentage of infractions than the percentage of population each race
comprises, while negative values represent a lower percentage of infractions than the percentage
of population for each race.
Based on analysis of the types of infractions students received, the largest composition
difference was for African American students in all three categories reporting data. In all three of
the categories (Insubordination, Disorderly Conduct, and Fighting). Regardless of whether the
incident category had a lower number of incidents (Insubordination, N=33) or a higher number
(Disorderly Conduct, N=382), the degree of difference was similar for African American
students. The degree of difference for White students in types of incidents was opposite from
African American students and shows underrepresentation. These differences indicate that White
students are underrepresented in infractions by type, whereas the African American students are
overrepresented. There were zero incidents reported in any category for Other students.
Actions. Analysis of the types of actions students receive revealed further information
about what types of actions students were assigned as a result of infractions and the composition
by race receiving each type of action. The total number of actions reported in Elementary B was
535. Total actions for the following categories were: ISS (N=9), OSS (N=2), Corporal
Punishment (N=15), and Other (N=416). The overwhelming majority of actions used in
Elementary B was Other. The remaining 93 actions were spread across categories including
Student Racial Group Insubordination Disorderly
Conduct
Bullying Fighting Other
African American 34% 37% Z 31% Z
White -29% -32% Z -26% Z
Other Z Z Z Z Z

100
parent conference, warning, bus suspension, and detention. Once the total number of actions for
each category was determined, the percentage of each racial group receiving actions was
calculated. After compositions were calculated, the differences in composition were calculated to
determine differences that existed by action. Results are reported in Table 15.
Table 15
Composition Differences by Type of Action in Elementary B
Note: Z = Zero actions reported. Differences were calculated based on the percentage of the total
population each race comprised and the total percentage of infractions by race. Positive values
represent a higher percentage of infractions than the percentage of population each race
comprises, while negative values represent a lower percentage of infractions than the percentage
of population for each race.
Based on analysis of the types of actions students received, the highest difference in
composition overall was in the OSS category. There were two actions total in this category and
both were for White students. The difference in African American students receiving ISS or
Other as an action were similar, while the difference was lower for Corporal Punishment. The
difference for Corporal Punishment was smaller for both White and African American students.
White students were underrepresented in all actions other than OSS, and students in the Other
category were underrepresented in all categories with zero actions being reported.
Analysis of the quantitative data revealed several areas that were explored further through
interviews with the principal and assistant principal of Elementary B, including the high
composition differences for African American students in each type of infraction, the
Student Racial
Group
ISS OSS Corporal Punishment Other
African American 39% Z 21% 38%
White -22% 44% -16% -33%
Other Z Z Z Z

101
underrepresentation of White students in both infractions and actions, the high incidence of
Disorderly Conduct infractions, and the frequent use of Other as discipline actions for all
students.
Qualitative Data
Both the principal and the assistant principal for Elementary B were interviewed as part
of the qualitative data collection. Elementary B’s principal is White female who has been the
principal for six years in the school. She has been in the district for close to twenty years, and has
38 years in education total. She served as a literacy coach in the school and at the state level
under the Reading First grant before moving into administration. The assistant principal is also a
White female who has been the assistant principal for the past 17 years in the school. She has a
total of 23 years in education, and has taken a position as an elementary principal in a
neighboring district for the 2019-2020 school year. The assistant principal was included in the
interview process because she has been in the school for an extended period of time and has been
responsible for discipline as a major component of her role during that time.
Interviews were conducted individually with each leader, but many similarities were
noted in responses. Both administrators discussed declining population in their school and
community as a stressor, as well as the increased mental health needs of students. However, not
all responses were similar. In the area of racial tension, the principal was quick to point out
examples of things that had happened at school that hinted of racial tension in the community
and said that if it had not been there, issues at school would not be “blown out of proportion” like
they have been where race is concerned. The assistant principal, on the other hand, noted that she
didn’t believe racial tension existed in the community and instead said that she felt that poverty

102
was more of an issue in the community. Because both administrators work in the same school,
their data was combined to determine top codes for the school (Figure 12).
Figure 12. Top codes (based on quantity) for principal and assistant principal of Elementary B.
The professional development described by both administrators at Elementary B centered
on poverty. Both played a role in bringing in a national speaker to talk to the entire district about
meeting the needs of students in poverty before school began for the 2018-2019 school year, and
both expressed disappointment in how the staff of the district received the message. They felt
that the teachers did not understand or care where their students were coming from, teachers
were critical of the speaker herself, and the teachers didn’t believe that her message impacted
their work. Because of the negative feedback, both felt that the session had probably done more
harm than good in supporting students from homes of poverty. The assistant principal said that
she had hoped to follow-up on the work throughout the year, but that it just hadn’t happened.
This was the only outside source of professional development either administrator discussed,
although they did share about focus areas within their school using internal resources such as
Elementary B
Principal Barrier
Taking Action -Passive
Principal Aware of
Disproportionality
Teacher Barrier

103
working to increase student attendance and implementing Science of Reading practices in their
classrooms.
Both the principal and assistant principal were aware of a mismatch between their staff
and student demographics, and reported that all of their teachers were White females, with the
exception of the PE coach (male). When asked about hiring practices that might increase
diversity among staff members, both said that they just didn’t have African American applicants.
The assistant principal remarked:
I think it's important to have diverse representation because students need to see someone
who's "like me". We've been really unsuccessful in hiring any African American
candidates… I don't know why they don't apply here. That's something we should be
finding out.
The principal also stated that they had a school board member who would often ask why she
didn’t have any African American teachers. Her answer was, “They just don’t apply.” She also
discussed the difficulty they have hiring any teachers with a teacher shortage in the area, and the
fact that they haven’t been able to hire for the past several years due to declining enrollment of
students. With regard to celebrating or honoring diversity within the school, both leaders stated
that they observe Black History month and that beyond that, they depend on the teachers to
incorporate cultural activities into their classrooms as needed. Both leaders were aware of the
disproportionate rates of discipline among their students, resulting in a top code of Principal
Aware of Disproportionality. However, when prompted to go deeper about what could be done
to reduce those rates, both leaders gave responses that were passive, resulting in a top code of
Principal Taking Action – Passive.
Both administrators described their discipline approach as being one of teaching their
students appropriate behaviors rather than punishing students and said they are well-aligned with
one another in terms of their actions. The assistant principal described the discipline system as

104
being a tiered system that helps teachers know what to do in response to certain behaviors. The
administrators take the students and teach them the appropriate behavior, rather than punishing
the students and send them back to class. Both said they have more of a “counseling” approach
and work closely with parents and the court system to help get students the support they need.
When asked about the number of referrals for the current year (2018-2019) as compared to 2017-
2018, both remarked that the number was “ridiculous.” Further probing determined that they had
made a concerted effort in the current year to document all discipline referrals, as opposed to
previous years where only the most serious were entered into the discipline tracking system. As a
result, they said they had experienced a huge increase in referral numbers and that they had many
repeat offenders. They also noted an increase in the students coming to school with poor self-
regulation skills, especially in kindergarten, and mental health needs. They relied heavily on
outside mental health providers to meet the needs of these students, although there had been
changes in the level of support each provider was able to give on-site. The assistant principal felt
that one of the reasons why numbers had increased exponentially for student discipline in
addition to the push to document all referrals was that they had not had time as a staff at the
beginning of the school year to establish expectations and procedures for the teachers to use. She
also felt that the school struggled to establish a professional culture where teachers were excited
to learn and grow together. Data collected here resulted in a top code of Teacher Barrier.
In terms of the discipline data, both the principal and assistant principal for Elementary B
said they track it weekly through a report provided to them by the secretary. However, there were
some inconsistencies between what they noted before seeing their data and after. For example,
the assistant principal said “I never mark Disorderly Conduct on a referral” and then after seeing
the data and the high number for Disorderly Conduct, said, “Maybe I do mark it after all…”

105
Both were disturbed by the high number of referrals for African American students when
compared to White students, and when looking at the disproportionality rates, the principal said,
“I mean, I knew it was disproportionate, but didn't know it was this much disproportionate.”
When questioned about why they believed the numbers were so disproportionate, both leaders
cited the mismatch between the culture and background of their teachers versus those of their
students. Both told stories of how they had stepped into discipline situations where a teacher was
“lambasting” an African American student and they could see the student getting angrier and
angrier. They believed that being proactive in preventing these situations and providing some
kind of training for their teachers might help improve this, but had no concrete plans to do so at
the time of the interview, resulting in a top code of Principal Barrier.
Although both leaders offered ideas of things that might help to improve rates of
disproportionality among students, they offered very little in the way of concrete action steps
they had taken or were taking. Instead they took a passive approach and shifted responsibility to
others. For example, when asked about diverse hiring practices, they put the responsibility on the
applicants and when asked about what they believed was causing disproportionate rates of
discipline, they said the teachers didn’t know how to handle the students appropriately.
Professional development was viewed as a one-shot event, and there was little follow-through on
plans made at the beginning of the year, even though both mentioned that it would have been
helpful to do that. Although both leaders said they received a weekly report of discipline and
attendance data from the secretary, neither shared how they were responding to the data other
than on an individual student basis to seek out mental health services.
Elementary B had high differences in composition for African American students
(overrepresented) and White students (underrepresented) in discipline infractions and actions

106
based on quantitative analysis. The data collected through interviews indicates that leaders are
aware of some disproportionality among students and can pinpoint factors that may contribute to
those rates, but cannot articulate actions they are taking to reduce them. This led to the
conclusion that it’s not enough for a leader to be aware of disproportionate rates in their school
to effect change. It follows that the leaders must be aware and also take actionable concrete steps
to increase equity for all students.
Middle B Findings
Quantitative Data
Middle B is a 6th – 8th grade school with 417 students total, and is located in the same
district as Elementary B. The percentage of African American, White, and Other students is
listed in Table 16. Also within the chart are the composite index scores for discipline incidents
and enrollment, as well as the relative differences in composition.

107
Table 16
Middle B Enrollment and Discipline Infractions by Racial Group, 2017-2018
Student
racial
group
Number
of
students
enrolled
Composition
of school
enrollment
(percent)
Number
of
discipline
infractions
Composition
of
infractions
by racial
group
(percent)
Difference
in
composition
(percentage
points)
Relative
difference in
composition
of infractions
and
enrollment
composition
(percent)
African
American
143 34 353 60 26 76.5
White 253 61 192 32 -29 -47.5
Other 21 5 48 8 3 60
Total 417 na 593 na na na
Note: Difference in composition is the percentage point difference between the composition of
two groups. (For example, composition of incidents for White students minus composition of
White students in school enrollment: 32 - 61 = -29 percent.) A relative difference in composition
is the difference between the proportion of incidents for a racial group and the representation of
the racial group within the school population. (For example, difference in composition of
incidents for White students/composition of White students in school enrollment x 100: -29/61 x
100 = -47.5 percent.) A positive value for difference in composition or relative difference in
composition indicates a student group is overrepresented in incidents compared to the group’s
representation in the total student population, while a negative value means the group is
underrepresented.
Once the composition index score and relative differences for composition for infractions
were calculated, the composition index score for discipline actions was calculated and compared
to the percentage of population for each racial group. Figure 13 shows the composition index
scores for population, infractions, and actions for each racial group.

108
Figure 13. Composition of population, infractions, and actions by race in Middle B.
Differences in composition were calculated between the composition of population,
infractions, and actions for each race group and indicate levels of disproportionality based on
population. Table 17 provides the differences.
Table 17
Composition Differences in Student Infractions and Actions in Middle B
Student Racial Group Infractions Actions
African American 26% 26%
White -29% -29%
Other 3% 2%
Note: Differences were calculated based on the percentage of the total population each race
comprised. Positive values represent a higher percentage of infractions or actions than the
percentage of population each race comprises, while negative values represent a lower
percentage of infractions or actions than the percentage of population for each race.
34%
61%
5%
60%
32%
8%
60%
32%
7%
0%
10%
20%
30%
40%
50%
60%
70%
African American White Other
Middle B
% of Population % of Infractions % of Actions

109
In analyzing the overall composition of actions and infractions for students as compared
to their percent of the total population, the largest area of difference is the underrepresentation of
White students in both categories. This is followed by the difference for African American
students, and then the students of Other races when compared to the percentage of the population
they comprise.
Infractions. Analysis of the types of infractions students receive revealed further
information about what types of infractions students were being referred for and the composition
by race receiving each type of infraction. Middle B reported 593 infractions during the 2017-
2018 school year. Although there were twenty-five possible categories available to code
infractions, only nine had data reported. Of the nine categories with data, the five most
commonly used were analyzed for disproportionality to allow for comparisons between schools.
The total number of infractions reported in Middle B for the following categories were:
Insubordination (N=84), Disorderly Conduct (N=216), Bullying (N=26), Fighting (N=37), and
Other (N=142). The bulk of the infractions were either Disorderly Conduct, followed by Other.
The remaining 88 other infractions were reported in the following categories: Truancy, Student
Assault, Cell Phone, Terroristic Threatening, Cyberbullying, Sexual Harassment, Public Displays
of Affection, and Stealing.
To calculate the number of infractions per student overall, the number of referrals was
divided by the number of students. Based on the total of 593 infractions, the rate is 1.4
infractions per student. When calculated by each racial group, the infraction rates are as follows:
2.4 infractions per African American student, .8 infractions per White student, and 2.2
infractions per Other race students. Based on these calculations, African American students have
the highest infraction rate when compared to their percentage of the population, followed by

110
students of Other races, and then by White students. The rate of infractions for students of Other
races is .25:1 when compared to White students, while African American students receive
infractions at a rate of 1.8:1 when compared to White students.
The category with the highest number of infractions was Disorderly Conduct, followed
by Other. Relatively small numbers of Bullying and Fighting infractions were reported. Once the
total number of infractions for each category was determined, the composition of each racial
group receiving infractions was calculated. After composition scores were calculated, differences
in composition were calculated. Results are reported in Table 18.
Table 18
Composition Differences by Type of Infraction in Middle B
Note: Differences were calculated based on the percentage of the total population each race
comprised and the total percentage of infractions by race. Positive values represent a higher
percentage of infractions than the percentage of population each race comprises, while negative
values represent a lower percentage of infractions than the percentage of population for each
race.
Based on analysis of the types of infractions students received, the highest difference in
composition was in the category of Insubordination. Differences for both African American and
White students are similar, although they are opposite one another, with African American
students overrepresented and White students underrepresented. The same pattern was observed
in the Other category. The differences between African American and White students in the
other three categories (Disorderly Conduct, Bullying, and Fighting) also show an inverse
Student Racial
Group
Insubordination Disorderly
Conduct
Bullying Fighting Other
African American 37% 26% 20% 23% 34%
White -34% -23% -15% -20% -32%
Other -4% -3% -5% -2% -2%

111
relationship, but the differences are somewhat lower. Differences for students in the Other race
category are minimal, with few infractions being reported for students in this category.
Actions. Analysis of the types of actions students receive revealed further information
about what students were assigned as a result of infractions and the composition by race for each
type of action. The total number of actions reported in Middle B was 588. Total actions for the
following categories were: ISS (N=107), OSS (N=54), Corporal Punishment (N=26), and Other
(N=83). The action used most often was ISS, followed by Other. Smaller numbers of corporal
punishment and OSS were reported. The remaining 318 actions were either detention or warning.
Once the total number of actions for each category was determined, the composition by race was
calculated, followed by differences in composition. Results are reported in Table 19.
Table 19
Composition Differences by Type of Action
Note: Differences were calculated based on the percentage of the total population each race
comprised and the total percentage of infractions by race. Positive values represent a higher
percentage of infractions than the percentage of population each race comprises, while negative
values represent a lower percentage of infractions than the percentage of population for each
race.
Based on analysis of the types of actions students received, the largest difference overall
was in both the ISS and OSS categories. The differences for both African American and White
students were similar, although in opposition to one another. African American students were
overrepresented while the White students were underrepresented at the same rate of difference.
Student Racial
Group
ISS OSS Corporal Punishment Other
African American 36% 35% 12% 23%
White -34% -35% -11% -20%
Other -2% 1% -1% -3%

112
The differences for the Other category of actions showed a similar relationship, although both
differences were smaller. The same was true for Corporal Punishment, with similar differences
that are the inverse of one another. The differences for the Other students’ category were
minimal when compared to the percentage of the population they comprise. This data indicates
that overall African American students are receiving discipline actions at much higher rates than
expected given their percentage of the overall population, while White students are receiving
much less discipline action than expected.
Analysis of the quantitative data revealed several areas that were explored further through
two interviews with the principal including the disproportionate rates for African American
students in each type of infraction and action, the underrepresentation of White students in both
infractions and actions, the high incidence of Insubordination infractions for African American
students, and the frequent use of ISS as a discipline action for all students.
Qualitative Data
Two interviews were conducted with the principal of Middle B, who is a White male with
ten years of experience in building-level administration. He has been the principal of Middle B
for the past six years, and prior to that was an administrator in a neighboring district. He has also
served in the military, and was called to active duty in the Middle East prior to serving as
principal in this school. Although the principal for Middle B does not live in the community
where his school is, he does live in a nearby rural community.
Middle B has been part of a PLC pilot program provide by the Arkansas Department of
Education for the past two years, where the state pays for Solution Tree to work on-site with the
campus over a three-year period. The 2017-2018 school year was the first year of the grant, and
they are currently entering their third and final year. Middle B’s principal described the support

113
from Solution Tree as being very beneficial for his staff members and students, and said that they
had made many academic gains since beginning the pilot program. He felt that there had been a
reduction of discipline referrals since beginning with Solution Tree because of the increased
academic performance, but he said that he hadn’t really looked at the numbers to verify. Solution
Tree associates are on his campus several days each month and work directly with teams of
teachers to implement changes. Although their work has not focused on student behavior for the
first two years, he did state that they were going to be focusing more on behavioral interventions
for students in the 2019-2020 school year. Top codes for Middle B are listed in Figure 14.
Figure 14. Top codes (based on quantity) for principal of Middle B.
As far as cultural celebrations, Middle B’s principal said they don’t really celebrate
anything other than “African American History” month. He was quick to point out the there was
a mismatch between the demographics of his staff (99% White and 1% African American) and
his students, and that it had an effect on how the students behave at school. However, he did not
articulate anything the school was doing or planned to do to make changes in this area, resulting
Middle B
Principal Barrier
Taking Action -Passive
Discipline Policy
Discipline Reporting

114
in a top code of Taking Action – Passive. He also discussed the impact of social media, single
parent homes, and unemployment as factors in school discipline. With regard to the school
discipline system, Middle B’s principal said that he has “zero tolerance for not following policy,”
resulting in a top code of Discipline Policy. He states that he is very consistent in implementing
policy so that all students are treated the same, regardless of who they see when they receive a
discipline referral. He described his discipline system as a series of steps to be implemented with
students, and once they have cycled through them, then a placement decision at an Alternate
Learning Environment (ALE) within the district is usually made. When discussing discipline
coding, he noted that the codes provided by the state are “wide-ranging” and leave themselves
open for interpretation. Because of that, he felt that there was room for subjectivity in his
discipline data and wasn’t entirely sure if the data were represented accurately or not. However,
when we examined his data during the second interview, he felt that it was fairly accurate based
on the students he sees. The data collected with regard to a lack of knowledge of the discipline
data resulted in a top code of Principal Barrier. He also talked about the impact students with
recurring infractions had on the discipline data. One of the frustrations he raised was not being
able to have discipline data readily available for him to look at without going through eSchool
and pulling up reports. Data collected in these areas resulted in a top code of Discipline
Reporting.
Middle B’s principal asked many questions about the data and asked to share it with his
staff to get their input as well. His main focus was what is causing the disproportionate rates and
how they could better work to reduce the numbers of referrals and the disproportionality. He felt
that the students perhaps don’t know what’s expected of them, which resulted in such high

115
numbers of referrals for certain student groups. He also felt that a lack of communication and
parental involvement were part of the issue as well.
Both Elementary B and Middle B had high composition differences when compared to
the other schools in this study for African American and White students. Most of the differences
analyzed were high, with the African American students being overrepresented in discipline
infractions at almost the exact same rate that the White students were underrepresented. The
leaders at both schools also displayed similarities in how they perceived discipline in their
schools, and shared little about concrete actions they were leading in their schools to reduce
those rates. The top codes, based on quantity from all three leaders in the schools were similar as
well. Both schools appeared to be more focused on student academic achievement rather than
behavioral concerns with students, which may reflect the focus of District B, rather than
priorities at the individual schools.
Elementary C Findings
Quantitative Data
Elementary C is a Pre-K – 4th grade school with 471 students total. The percentage of
African American, White, and Other students is listed in Table 20. Also within the chart are the
composite index scores for discipline incidents and enrollment, as well as the relative differences
in composition.

116
Table 20
Elementary C Enrollment and Discipline Infractions by Racial Group, 2017-2018
Student
racial
group
Number
of
students
enrolled
Composition
of school
enrollment
(percent)
Number
of
discipline
infractions
Composition
of
infractions
by racial
group
(percent)
Difference
in
composition
(percentage
points)
Relative
difference in
composition
of infractions
and
enrollment
composition
(percent)
African
American
126 27 462 51 24 89.7
White 287 61 303 34 -27 -44.3
Other 58 12 137 15 3 24.4
Total 471 na 902 na na na
Note: Difference in composition is the percentage point difference between the composition of
two groups. (For example, composition of incidents for White students minus composition of
White students in school enrollment: 34 – 61 = -27 percent.) A relative difference in composition
is the difference between the proportion of incidents for a racial group and the representation of
the racial group within the school population. (For example, difference in composition of
incidents for White students/composition of White students in school enrollment x 100: -27/61 x
100 = -44.3 percent.) A positive value for difference in composition or relative difference in
composition indicates a student group is overrepresented in incidents compared to the group’s
representation in the total student population, while a negative value means the group is
underrepresented.
Once the composition index score and relative differences for composition for infractions
was calculated, the composition index score for discipline actions was calculated and compared
to the percentage of population for each racial group. Figure 15 shows the composition index
scores for population, infractions, and actions for each racial group.

117
Figure 15. Composition of population, infractions, and actions by race in Elementary C.
Differences in composition were calculated between the composition of population,
infractions, and actions for each race group and indicate levels of disproportionality based on
population. Table 21 provides the differences.
Table 21
Composition Differences in Student Infractions and Actions in Elementary C
Student Racial Group Infractions Actions
African American 24% 25%
White -27% -27%
Other 3% 2%
Note: Differences were calculated based on the percentage of the total population each race
comprised. Positive values represent a higher percentage of infractions or actions than the
percentage of population each race comprises, while negative values represent a lower
percentage of infractions or actions than the percentage of population for each race.
In analyzing the overall composition of actions and infractions for students, the largest
area of difference is the underrepresentation of White students in both categories. This is
27%
61%
12%
51%
34%
15%
52%
34%
14%
0%
10%
20%
30%
40%
50%
60%
70%
African American White Other
Elementary C
% of Population % of Infractions % of Actions

118
followed by the difference for African American students, and then the students of Other races
when compared to the percentage of the population they comprise.
Infractions. Analysis of the types of infractions students receive revealed further
information about what types of infractions students were being referred for and the composition
by race receiving each type of infraction. The total number of infractions reported in Elementary
C (N=902) for the following categories were: Insubordination (N=142), Disorderly Conduct
(N=164), Bullying (N=84), Fighting (N=87), and Other (N=205). Elementary C reported 902
infractions during the 2017-2018 school year. Although there were twenty-five possible
categories available to code infractions, only fourteen had data reported. Of the fourteen
categories with data, the five most commonly used were analyzed for disproportionality to allow
for comparisons between schools. The total number of infractions reported in Elementary C for
the five categories were: Insubordination (N=142), Disorderly Conduct (N=164), Bullying
(N=84), Fighting (N=87), and Other (N=205). The largest category of infractions was Other,
followed by Insubordination and Disorderly Conduct. The remaining 220 other infractions were
reported in the following categories: Truancy, Student Assault, Knife, Handgun, Cell phone,
Sexual harassment, Cyber bullying, Terroristic threatening, Stealing, and Public Displays of
Affection.
To calculate the number of infractions per student overall, the number of referrals was
divided by the number of students. Based on the total of 902 infractions, the rate is 1.9
infractions per student. When calculated by each racial group, the infraction rates are as follows:
3.7 infractions per African American student, 1.1 infractions per White student, and 2.4
infractions per Other race students. Based on these calculations, African American students have
the highest infraction rate when compared to their percentage of the population, followed by

119
students of Other races, and then by White students. The rate of infractions for students of Other
races is .5:1 when compared to White students, while African American students receive
infractions at a rate of 1.5:1 when compared to White students.
Once the total number of infractions for each category was determined, the composition
by race of students receiving infractions was calculated, followed by composition differences.
Results are reported in Table 22.
Table 22
Differences by Type of Infraction in Elementary C
Note: Differences were calculated based on the percentage of the total population each race
comprised and the total percentage of infractions by race. Positive values represent a higher
percentage of infractions than the percentage of population each race comprises, while negative
values represent a lower percentage of infractions than the percentage of population for each
race.
Based on analysis of the types of infractions students received, the highest degree of
difference in composition was in Fighting for African American students (45%). The
composition of infractions for African American students in the other four categories are high,
indicating overrepresentation in these areas. Infractions for Bullying, Fighting, and Other for
White students are also high (but negative), showing that they are underrepresented in these
infractions. Infractions for Disorderly Conduct and Insubordination for White students are also
high. For the Other students’ category, all differences are minimal.
Student Racial
Group
Insubordination Disorderly
Conduct
Bullying Fighting Other
African American 24% 26% 29% 45% 31%
White -20% -22% -32% -39% -26%
Other -4% -4% 3% -6% -5%
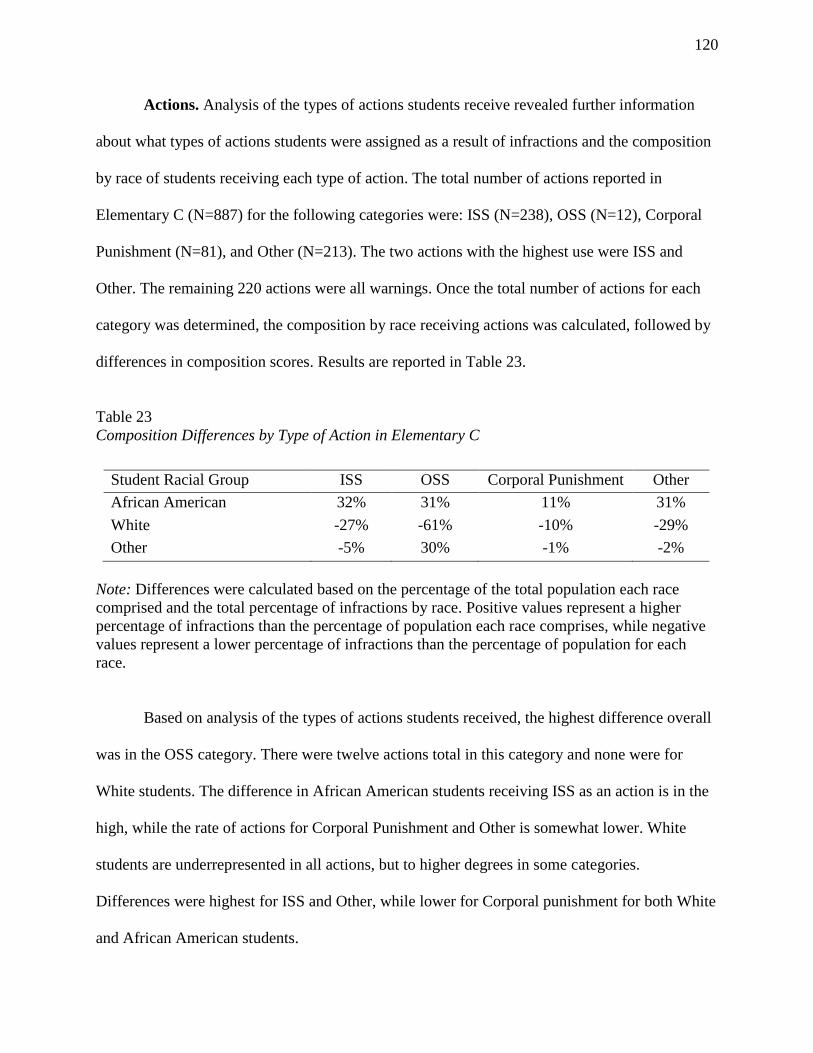
120
Actions. Analysis of the types of actions students receive revealed further information
about what types of actions students were assigned as a result of infractions and the composition
by race of students receiving each type of action. The total number of actions reported in
Elementary C (N=887) for the following categories were: ISS (N=238), OSS (N=12), Corporal
Punishment (N=81), and Other (N=213). The two actions with the highest use were ISS and
Other. The remaining 220 actions were all warnings. Once the total number of actions for each
category was determined, the composition by race receiving actions was calculated, followed by
differences in composition scores. Results are reported in Table 23.
Table 23
Composition Differences by Type of Action in Elementary C
Note: Differences were calculated based on the percentage of the total population each race
comprised and the total percentage of infractions by race. Positive values represent a higher
percentage of infractions than the percentage of population each race comprises, while negative
values represent a lower percentage of infractions than the percentage of population for each
race.
Based on analysis of the types of actions students received, the highest difference overall
was in the OSS category. There were twelve actions total in this category and none were for
White students. The difference in African American students receiving ISS as an action is in the
high, while the rate of actions for Corporal Punishment and Other is somewhat lower. White
students are underrepresented in all actions, but to higher degrees in some categories.
Differences were highest for ISS and Other, while lower for Corporal punishment for both White
and African American students.
Student Racial Group ISS OSS Corporal Punishment Other
African American 32% 31% 11% 31%
White -27% -61% -10% -29%
Other -5% 30% -1% -2%
121
Analysis of the quantitative data revealed several areas that were explored further through
two interviews with the principal including the composition differences for African American
students in each type of infraction, the underrepresentation of White students in both infractions
and actions, the high incidence of Other infractions, and the frequent use of ISS and Other as
discipline actions for all students.
Qualitative Data
Two interviews were conducted with the principal of Elementary C, who is a White
female in her eighth year as the principal at this school. She has been in the district for twenty-
six years and didn’t graduate from college until she was 40. She has only worked in District C
during her entire career in education. The principal of Elementary C shared in-depth information
about the processes their school has gone through in the past few months to implement PBIS.
She stated that prior to the 2017-2018 school year they had an average of 300 office referrals for
students. However, in 2017- 2018 they had almost 1000 referrals and since that time had been
actively seeking resources to support their work in this area. Their superintendent wrote a grant
for PBIS support through a state university, and they received the grant for the district. As a
result, the administrators and teachers had already begun receiving training on full
implementation and were working on their plan for the 2019-2020 school year. Data collected on
this topic resulted in a top code of PBIS for the principal of Elementary C. Figure 16 provides a
visual representation for the top codes for the principal of Elementary C, who had numerous
codes with top numbers when compared to the other administrators

122
Figure 16. Top codes (based on quantity) for principal of Elementary C.
District C is located in the same rural community as District B, although they
traditionally have had the students residing in the county rather than those within the city limits,
as well as the students from a small African American community about ten miles away.
However, with school choice, they are now pulling more students from within the city limits.
They have a very high poverty rate and as a district, have a philosophy of providing whatever
their students need at school. They feed all of their students breakfast, lunch, and a snack each
day, and also have a health clinic on-site for students and staff members that has been there for
two years. For the 2019 - 2020 school year they are adding mental health services and a mental
health nurse practitioner to the clinic to better meet the needs of their students. When asked
about racial tensions in the community, the principal of Elementary C was quick to point out that
they felt the effects of them in their school. She said that even though they had a relatively small
percentage of African American students, there were definite tensions among students and with
Elementary C
Taking Action -
Creating Culture
Relationships with Students
Relationships with Families
Redesign System
Principal Aware of
Disproportionality
Principal Culturally
Aware
PBIS

123
parents. She also explained how her experiences in the classroom had helped her to understand
more about the African American culture and how not to treat students at school. She cited
examples of how you must deal with their discipline privately and not embarrass or disrespect
these students in any way, resulting in a top code of Principal Culturally Aware. Although she
was able to articulate the nuances of her students’ behavior and how it was likely influenced by
hidden cultural norms, she did mention several times that many of her teachers still didn’t
understand this.
In terms of hiring practices, the principal of Elementary C has the most aggressive plan
for hiring teachers from diverse backgrounds, resulting in five African American teachers in a
staff of thirty-five certified teachers. When asked about how she secures African American
teachers, she talked about how she intentionally recruits them. She said that the most successful
way for her to hire African American teachers is by hiring student teachers who have interned at
her school. Because this school is located in close proximity to a local university, students are
often eager to do their student teaching in her school. Once they intern there and she sees what
kind of a teacher they are, she said that she works to actively recruit them. She gave the example
of one intern who had gone to teach in another district for thirteen years, but that she called her
every year and offered her a job. She finally came back and is one of her teachers now. All of the
African American teachers currently teaching in her school were interns or in the AmeriCorps
program at her school in the past, and she intentionally recruited them to increase the diversity of
her teaching staff and reduce disproportionality.
The school has implemented several changes over the past year to their discipline system
in an effort to reduce the number of student discipline referrals. These changes include creating a
tiered system of behaviors and consequences, so that teachers know when to send students to the

124
office and when to handle the issue on their own, creating a matrix of positive behavioral
expectations for each setting in the school, and by consistently using their discipline processes.
She said several times that she has been very consistent this year in sending students back to the
classroom who were written up for minor infractions and asked the teacher to fully implement
the process correctly. When asked about if the changes had made a difference, she stated:
It's been better this year. We've had a lot fewer referrals because I've tightened up on if I
get a referral and it's not completed, like no date or if it's very unclear what's happened, or
if I feel like it's Tier one, I send it right back and I'll send a copy of the matrix.
By the end of the 2018 - 2019 school year, they had cut their referral rate from having
almost 1000 student referrals to having only 500. They are continuing to implement changes and
revise their processes and matrix for the 2019 - 2020 school year, but she was hopeful about
PBIS and focusing on the positives for students. They are also working to tighten up on the
coding of discipline infractions better than they have in the past. She said that in the past, the
teachers marked the type of infraction, and that if she felt it didn’t represent it, then she or the
secretary would change it. She also remarked that the “Other” category was too vague and was
of no help to them in analyzing their data. She said they were going to try not to use the “Other”
category at all this year. One of the positives that she noted really helps with discipline is the
presence of cameras in all of their classrooms. She said that this has helped her to get very
accurate data on incidents and feel confident when investigating them. Other changes they are
planning on implementing for the 2019 - 2020 school year include eliminating the use of
corporal punishment as part of their discipline system, in large part due to a new law that went
into effect saying that schools could not utilize corporal punishment with students with
disabilities. Data collected here resulted in a top code of Taking Action – Redesigning System.

125
Students with recurring infractions played a role in the data as well. She gave the
example of one student who spent 54 days in ISS the previous school year, and had close to 100
discipline referrals. He was an African American male, and because the African American
population is relatively small, it’s possible that his data alone is skewing the numbers of
disproportionality for her school.
The principal of Elementary C was also aware of the disproportionate rates in her school
and noted that often her ISS room is full of students who are African American. During the
interview she said, “Let me check my list for today (finds the list) …Yes, all of the students in
ISS today are African American.” When asked about the cause of more African American
students being in ISS than White students, given that the total African American population of
the school is 29%, she cited the cultural differences between the teaching staff and the students.
She said:
I think it's the difference in expectations in culture. It really is. A lot of us are older White
women. We grew up in a time when things were black and white, and it's just, from our
experiences, we can't imagine what their experiences are like growing up, and that's
another reason that I worked at the beginning of the year a lot on being culturally
responsive to our kids.
These data resulted in a top code of Principal Aware of Disproportionality and Principal
Culturally Aware.
When compared to the other schools in this study, the difference in composition is
highest of all schools for African American students. However, based on data collected during
interviews, it appears that the principal took action within a year of realizing their discipline
system was not being effective and has continued to take steps each year. The principal is asking
questions and wants to make a difference. While viewing her data, she remarked:

126
I think there are a lot of disproportionate write ups, and consequences, too. What do we
do? What do we do about it? What can do? Can we change the behavior, or change our
perception, or even change one of our parent's perception, too?
She also mentioned several times how important it is to filter discipline referrals for bias and to
make sure that decisions being made are focused on hard evidence, such as what she sees on the
cameras. She has concrete plans to train her teachers in how to deal with different cultures and
how to implement positive behavior supports for all of her students, which resulted in a top code
of Taking Action – Creating Culture. As part of creating culture, she also mentioned the steps
she and her staff were taking to intentionally build strong relationships with their students and
parents, including providing for all of their needs, going to visit them at home often, and
spending time in the community promoting reading and education. The data collected her
resulted in top codes of Relationships with Students and Relationships with Families.
Middle C Findings
Quantitative Data
Middle C is a 5th – 8th grade school with 299 students total. The percentage of African
American, White, and Other students is listed in Table 24. Also within the chart are the
composite index scores for discipline incidents and enrollment, as well as the relative differences
in composition.

127
Table 24
Middle C Enrollment and Discipline Infractions by Racial Group, 2017-2018
Student
racial
group
Number
of
students
enrolled
Composition
of school
enrollment
(percent)
Number
of
discipline
infractions
Composition
of
infractions
by racial
group
(percent)
Difference
in
composition
(percentage
points)
Relative
difference in
composition
of infractions
and
enrollment
composition
(percent)
African
American
72 24 205 31 7 29.1
White 204 68 416 63 -5 -7.3
Other 23 8 43 6 -2 -26
Total 299 na 664 na na na
Note: Difference in composition is the percentage point difference between the composition of
two groups. (For example, composition of incidents for White students minus composition of
White students in school enrollment: 21 – 38 = -17 percent.) A relative difference in composition
is the difference between the proportion of incidents for a racial group and the representation of
the racial group within the school population. (For example, difference in composition of
incidents for White students/composition of White students in school enrollment x 100: -17/38 x
100 = -44.7 percent.) A positive value for difference in composition or relative difference in
composition indicates a student group is overrepresented in incidents compared to the group’s
representation in the total student population, while a negative value means the group is
underrepresented.
Once the composition index score and relative differences for composition for infractions
was calculated, the composition index score for discipline actions was calculated and compared
to the percentage of population for each racial group. Figure 17 shows the composition index
scores for population, infractions, and actions for each racial group.
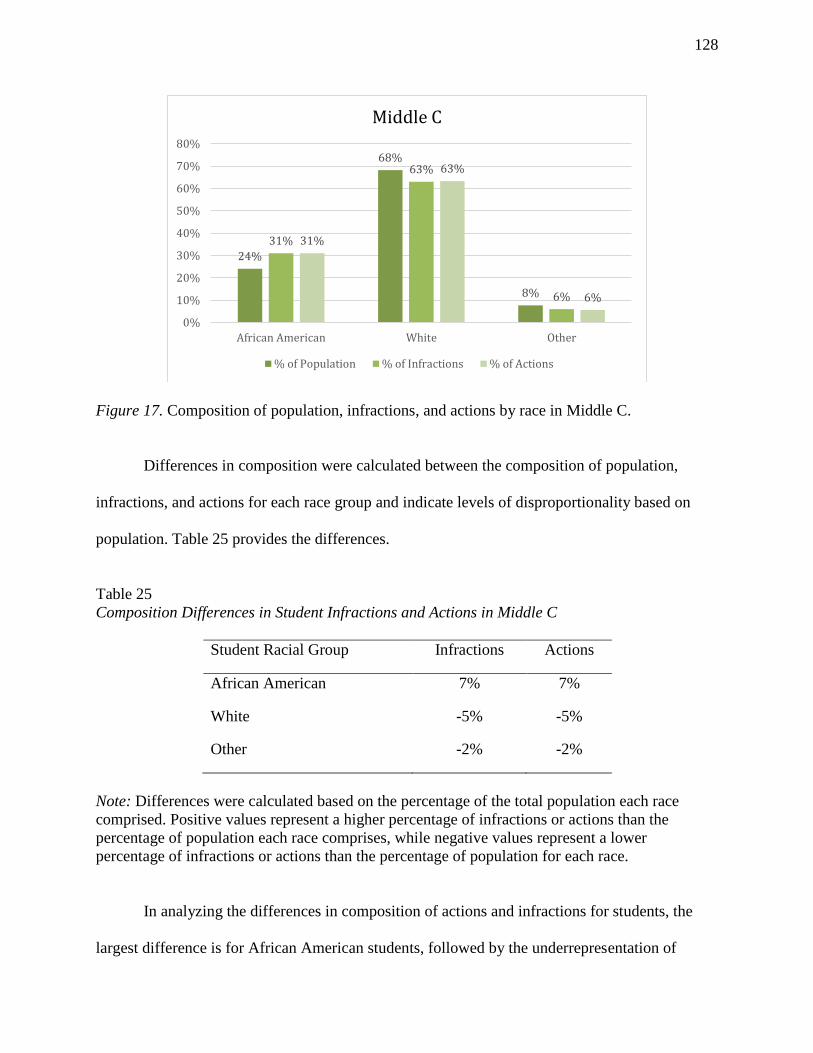
128
Figure 17. Composition of population, infractions, and actions by race in Middle C.
Differences in composition were calculated between the composition of population,
infractions, and actions for each race group and indicate levels of disproportionality based on
population. Table 25 provides the differences.
Table 25
Composition Differences in Student Infractions and Actions in Middle C
Student Racial Group Infractions Actions
African American 7% 7%
White -5% -5%
Other -2% -2%
Note: Differences were calculated based on the percentage of the total population each race
comprised. Positive values represent a higher percentage of infractions or actions than the
percentage of population each race comprises, while negative values represent a lower
percentage of infractions or actions than the percentage of population for each race.
In analyzing the differences in composition of actions and infractions for students, the
largest difference is for African American students, followed by the underrepresentation of
24%
68%
8%
31%
63%
6%
31%
63%
6%
0%
10%
20%
30%
40%
50%
60%
70%
80%
African American White Other
Middle C
% of Population % of Infractions % of Actions

129
White students in both categories. This is followed by students of Other races, which has a
minimal difference. Middle C’s differences in composition for infractions and actions are
significantly smaller than the other four schools included in this study.
Infractions. Analysis of the types of infractions students receive revealed further
information about what types of infractions students were being referred for and the composition
by race of students receiving each type of infraction. Middle C reported 664 infractions during
the 2017-2018 school year. Although there were twenty-five possible categories available to
code infractions, only fourteen had data reported. Of the fourteen categories with data, the five
most commonly used were analyzed for differences to allow for comparisons between schools.
The total number of infractions (N=664) reported in Middle C for the following categories were:
Insubordination (N=62), Disorderly Conduct (N=71), Bullying (N=35), Fighting (N=31), and
Other (N=310). Almost half all of the discipline infractions were reported as Other, with the
other categories having relatively smaller numbers. The remaining 155 other infractions were
reported in the following categories: Drugs, Truancy, Vandalism, Cell Phone, Cyberbullying,
Sexual Harassment, Public Displays of Affection, Stealing, Terroristic Threatening, and Knife.
To calculate the number of infractions per student overall, the number of referrals was
divided by the number of students. Based on the total of 664 infractions, the rate is 2.2
infractions per student. When calculated by each racial group, the infraction rates are as follows:
2.8 infractions per African American student, 2 infractions per White student, and 1.9 infractions
per Other race students. Based on these calculations, African American students have the highest
infraction rate when compared to their percentage of the population, followed by students of
Other races, and then by White students. The rate of infractions for students of Other races is .1:1

130
when compared to White students, while African American students receive infractions at a rate
of .5:1 when compared to White students.
Once the total number of infractions for each category was determined, the composition
by race of students receiving infractions was calculated, followed by composition differences.
Results are reported in Table 26.
Table 26
Differences by Type of Infraction in Middle C
Note: Differences were calculated based on the percentage of the total population each race
comprised and the total percentage of infractions by race. Positive values represent a higher
percentage of infractions than the percentage of population each race comprises, while negative
values represent a lower percentage of infractions than the percentage of population for each
race.
Based on analysis of the types of infractions students received, the highest difference of
composition overall was for African American students in three categories (Bullying, Fighting,
Other). However, in Insubordination and Disorderly Conduct, the differences were minimal. This
is different from all four of the other schools included in the study. The differences for White
students in Insubordination and Disorderly Conduct are minimal, but they are positive
differences, whereas negative differences were observed in all the other schools. The differences
for the remaining categories for White and Other students are all negative values but are small,
showing that they are underrepresented given the percentage of the student population they
comprise.
Student Racial Group Insubordination Disorderly
Conduct
Bullying Fighting Other
African American -1% 0% 16% 15% 12%
White 9% 8% -8% -10% -5%
Other -8% -8% -8% -5% -7%

131
Actions. Analysis of the types of actions students receive revealed further information
about what types of actions students were assigned as a result of infractions and the composition
by race of students receiving each type of action. The total number of actions reported in Middle
C (N=657) for the following categories were: ISS (N=210), OSS (N=33), Corporal Punishment
(N=39), and Other (N=81). The remaining actions (N=294) were all detention or warnings. The
action used most frequently was assignment to ISS. Once the total number of actions for each
category was determined, the composition by race of students receiving actions was calculated,
followed by composition differences. Results are reported in Table 27.
Table 27
Differences by Type of Action in Middle C
Note: Z= Zero actions reported. Differences were calculated based on the percentage of the total
population each race comprised and the total percentage of infractions by race. Positive values
represent a higher percentage of infractions than the percentage of population each race
comprises, while negative values represent a lower percentage of infractions than the percentage
of population for each race.
Based on analysis of the types of actions students received, the largest difference overall
was in the OSS category for African American students. The difference for Other students is also
relatively small as a negative value. There were zero actions for Other students in both
categories. The percentages for White students in ISS, Corporal Punishment, and Other are all
minimal, which is different from the other schools in the study. All of the differences in
composition are in the single digits.
Student Racial Group ISS OSS Corporal
Punishment
Other
African American 6% 9% 6% 6%
White 1% -4% 1% 2%
Other -7% Z -8% Z

132
Analysis of the quantitative data revealed several areas that were explored further through
two interviews with the principal including the disproportionate rates for African American
students in each type of infraction, the slight underrepresentation of White students in both
infractions and actions, the high incidence of Disorderly Conduct infractions, and the frequent
use of ISS and Other as discipline actions for all students.
Qualitative Data
Two interviews were conducted with the principal of Middle C, who is a White female
finishing her fourth year as principal in the school. She has been in this district for the past seven
years, and has thirty-one years of experience in education. She has extensive experience working
with African American students in the region, and before coming to District C, she worked as a
teacher and literacy facilitator in several surrounding districts with a majority of African
American students and staff members. Figure 18 is a visual representation of the top codes for
Middle C’s principal.
Figure 18. Top codes (based on quantity) for principal of Middle C.
Middle C
Taking Action-
Creating Culture
Principal Culturally
Aware
Taking Action-
Redesign System
Relationships with Students
PBIS
133
The staff of Middle C is almost all White, but there is one African American teacher who
teaches Special Education. The principal doesn’t do any special outreach to recruit African
American teachers, but noted that the principal of Elementary C was very successful at being
able to hire them in her school. She did note, however, that she had done her own research on
respect and relationships with African American students while pursuing a graduate degree and
that she was very particular about how teachers handled her students. She said:
I'm very particular about how kids are handled and... that’s been hard. I don't like them to
be screamed at. Now, I'm firm with these kids, but I feel like if I respect them, they'll
respect me.
This data resulted in a top code of Principal Culturally Aware. Like the principal of Elementary
C, she discussed the implementation of PBIS as a district-wide initiative and the work they had
done to create a matrix with expectations clearly laid out for students (PBIS, Taking Action –
Redesigning System). She also discussed how their teachers have been working to create lesson
plans to explicitly teach expectations and school behaviors. She felt hopeful about the focus on
positive behavior and thinks that the changes start first with them, rather than the students
(Taking Action – Creating Culture). She also discussed how they were implementing new data
measures including having all teachers review their discipline write-ups from the previous year
to determine trends and patterns, having the leadership team regularly monitor and disaggregate
discipline data instead of just the principal doing it, and revising their discipline referral form to
give them better information about infractions, location of the incident, and the time of day. Her
hope was that these new measures being implemented along with PBIS would make great
reductions in their student referral rates.
The principal of Middle C also talked about how important it is to truly build
relationships with students who are having behavior problems and that sometimes, you have to
134
go the extra mile for them. She told the story of a student who had serious behavior problems
and had been in the Alternate Learning Environment (ALE) for most of the year, which is a
consortium that they participate in with District B. He had reached the point at ALE where the
director called and said he wasn’t going to be able to return because of his discipline issues. She
knew that he wouldn’t do well back in her school, but she didn’t want to see him expelled where
he would lose the entire year. Since he didn’t live in her district, she told the parent that he
should return to his home school (Middle B), and finish out the year. Then he could return the
next year. However, she then found out that the Superintendent of District B was going to expel
the student without letting him return to Middle B. To prevent that from happening, she worked
out a deal with her Superintendent to bring him back to her campus and place him in ISS with an
aide for the remainder of the year so he could complete his education. This was one example of
the lengths that this principal was willing to go to in support of her students with discipline
problems, and she said that other parents would come to her and tell her how much they trusted
her because they saw how much she cared for their students (Relationships with Students).
Middle C had discipline rates that were almost proportionate in all categories for all
students. The composition differences were very small, making this school’s data an outlier
when compared to the other schools in the study. When asked if the size of the school could be a
determining factor, she said:
It could be. having less than 80, 85 kids or fewer in each grade... I know these kids more
than if I had seven hundred fifty of them or eight hundred of them or you know, a large
middle school in Little Rock or whatever. It's just I have gotten to know their parents and
their parents trust me and that's a big deal.
Another determining factor making the difference in this school could be the extensive
experience this principal has in teaching African American students and working with colleagues
who are African American. One thing the Principal of Middle C was interested in knowing was

135
how students with recurring infractions were affecting the data and if her data from the 2018 -
2019 school year would look the same. This principal was committed to making whatever
changes were needed to ensure that all students in her school received an equitable opportunity at
school.
Chapter Summary
The data collected in this study provided deep insight into the understanding of the
beliefs, practices, and perspectives of each principal in these schools, as well as the effects of
their discipline systems on both African American and White students for the target year.
Chapter Four explained in detail the findings from both the quantitative and qualitative data
collection across all schools, as well as an in-depth description of the findings for each individual
school. The next chapter provides a discussion of the findings in light of the research questions
and conceptual framework and concludes with implications for professional practice and future
research.

136
CHAPTER FIVE – DISCUSSION, RECOMMENDATIONS, AND CONCLUSIONS
Introduction
The purpose of this study was to examine the problem of practice found in the
disproportionate rate of student discipline for African American students compared to White
students in rural schools in Southeast Arkansas. Chapter Five was designed to interpret the data
collected from the Arkansas Department of Education (ADE) and building leaders interviewed in
the study concerning student discipline disproportionality in the selected rural schools. The
interpretations in this chapter represent analysis of both quantitative and qualitative data gathered
from three different sources: (1) Student and school demographic data collected from the
MySchoolInfo website, provided by ADE to the public; (2) Student discipline infraction and
action data obtained from ADE through a data request; and (3) Two rounds of semi-structured
interviews with five principals and one assistant principal in the selected schools. This chapter is
organized around the two research questions proposed throughout the study: (1) How is
discipline disproportionality defined in rural schools from the principal’s perspective? and (2)
What factors are most influential in explaining discipline disproportionality from the principal’s
perspective?
This study employed an explanatory sequential mixed methods design to address the
research questions. Data collection and analysis began with the quantitative data first, consisting
of the relative differences in composition for both African American and White students in the
schools studied. Composition index scores and relative differences in composition for discipline
infractions were calculated using each school’s discipline data for the 2017-2018 school year and
provided by ADE to provide an overall picture of disproportionate discipline between African
American and White students in each school. The qualitative portion of the study followed an

137
instrumental collective case study approach, focused on the phenomenon of disproportionate
discipline between African American and White students in five rural schools in Southeast
Arkansas. Informed by the results of analysis of the quantitative data from each school, two
rounds of interviews were conducted with each building leader and analysis resulted in the
identification of major themes and subthemes.
Chapter Five begins with a discussion of each research question, informed by quantitative
and qualitative data collected and analyzed throughout the study. After discussion of the research
questions is a discussion of the conceptual framework, followed by the limitations and
delimitations of the study, concluding with implications for current practice and future research.
Research Questions
Research Question 1: How is Discipline Disproportionality Perceived in Rural Schools
from the Principal’s Perspective?
The perceptions of the principal can have a great impact on their school, given that they
are placed in a position of authority and make decisions that affect many students (DeMatthews
et. al, 2017). Skiba et al. (2012) found that schools led by principals who supported alternatives
to suspension were less likely to suspend students. Principal beliefs about students, success,
culture, and discipline are often reflected in the decisions they make and impact the culture of the
school.
Awareness of Disproportionate Discipline
Principals perceived disproportionality in different ways throughout the study. All six
leaders were quick to point out that they were aware of disproportionalities by race, specifically
mentioning that they see African American students more than they see any other race. However,
among the participants there was a range of the depth of awareness of disproportionate discipline

138
in their school. At one end of the spectrum was a principal who had been recommended by the
Arkansas Secretary of Education to be interviewed on television for her work in reducing
disproportionate rates of discipline for student in her school, while at the opposite end was a
principal who said that he hadn’t really checked into the rate since he had been an assistant
principal (six years prior), although he knew rates were still disproportionate by race. The other
leaders fell in between those two extremes, but all freely discussed the fact that they knew their
discipline rates were disproportionate with African American students being disciplined more
often than White students. The only exception here was the principal of Middle C, who stated, “I
don’t really think my discipline is disproportionate, to be honest.” Her feelings were fairly
accurate, as the smallest differences in composition for African American students were noted in
her school.
Perceptions of Degree of Disproportionate Discipline
Although principals were aware of disproportionate rates (albeit at differing levels of
depth and reflection), some were not aware of the degree of disproportionality given the portion
of the population each group comprised in their school. The composition index scores and
differences in composition were effective in helping them to analyze in numeric form what their
discipline rates looked like for the target year in a way they had not looked at them before.
Several expressed surprise to see such large gaps between the percentage of the population and
percentage of infractions or actions for each group. One remarked, “I mean, I knew it was
disproportionate, but didn't know it was this much disproportionate.” Another said, “When you
break it down like this, it’s a real eye-opener.” All of the principals expressed an interest in
having the data from the current school year disaggregated using composition index scores and
difference in composition for them to be able to share with their staff members and begin to track
139
the rates over time. None of the principals in this study were aware of how to calculate
composition scores on their own, although they expressed an interest in learning the process to
use with future data. One principal expressed frustration at the fact that she was just now seeing
how to look at her data in this way by saying, “But the sad thing is, you don't learn any different.
You know what I'm saying? Here I am, I think I'm going on year seven as a principal. Seven
years? Come on!” This suggests that principals could benefit from training to help them
understand how to calculate their own composition scores or from having a data management
system that specifically provided this information using current data.
Reactions to Disproportionate Discipline Rates
In viewing the differences in composition for their own school during the interviews,
differing reactions from principals were noted. One principal shared that it was emotional for her
to see her data this way, and noted,
Yeah. I could feel the tears in the very back. I mean, I'm not going to start crying or
anything, but it's almost kind of sad, you know? That we've done... Yes, we can do way
better, but... The bottom line is we can do better, and that, I know.
Another principal mentioned, “I'm not happy with the disproportionate rates,” upon being
presented with the data, while another said,
It's very alarming to see that this number of Black students are in trouble… I think we need
to really start looking at that and trying to determine are they in trouble? Are they really
breaking rules in orderly environments? Are they really causing this much of a problem or
do we just not know how to work with them effectively? It's very alarming. It bothers me
to tell you the truth. I don't like for anyone to be treated unfairly. I've always tried to be
equitable and make sure that I'm doing right by kids and by people in general. This is very
much a concern, and I know the principal was concerned about it too because she did
mention that it was really bad.
The reactions of these leaders show that although they knew one group of students was being
disciplined more often than others, they were not aware of how severe the differences were.

140
Some expressed dismay and concern, and raised many questions as to why this was happening in
their school. They were obviously concerned by their data and felt that something should be done
to correct it. However, they also recognized that this is a complex issue, and that solutions may
not come easily. One, upon seeing the data remarked,
My impressions or thoughts... I really have none because there's so many different other
factors that could be, you know, considered because of that. Yeah, of course, you can see
there's a whole lot more referrals of African Americans than there are whites, percentage-
wise. It makes you wonder why that is? Is it because there are more disruptions and, from
African Americans, or is it a viewpoint of the referees, or the referrers who's actually
making the referrals?
These questions indicate that the leader is thinking about why these rates are occurring in his
school, but is unsure of the root cause.
Overall principal perceptions of disproportionate rates indicate that they see it as a
problem that needs to be fixed in their schools, although they aren’t sure how to tackle the issue
effectively. Throughout the interviews all leaders asked the researcher to share any findings with
them after the study that would help them to reduce their rates, because they were interested in
making positive changes. These findings are consistent with those of DeMatthews et. al (2017)
who found that principals who are aware of injustices in their schools don’t always act in ways to
correct those them. Although some of the principals who were aware were engaged in activities
focused on changing these outcomes for students, others were aware, but had no plans to change
their discipline system or provide support to their teachers in dealing with student discipline in
the classroom.

141
Research Question 2: What Factors Are Most Influential in Explaining Discipline
Disproportionality from the Principal’s Perspective?
With regard to the factors that are most influential in explaining discipline
disproportionality, principals cited cultural mismatch between teachers and students as the
primary reason, with student trauma and mental health issues as the other biggest reason.
Cultural Mismatch
When asked, principals reported that they believed the biggest factor contributing to
disproportionate rates of discipline in their school was a cultural mismatch, particularly between
their teachers and the students. They knew that the teaching staff in each school did not represent
the demographics of the student body, and two principals talked about ways they were actively
recruiting a more diverse teaching staff. This finding is consistent with the work of Townsend
(2000) and Ferguson (2001) whose work suggests that the prevalence of a White, female
teaching force and their lack of understanding of African American males is a cause of
disproportionate rates of discipline in schools. However, they felt that the biggest way that the
cultural mismatch played out was in the classroom with teacher and student interactions. They
told discipline stories where they had to calm students down after teachers had caused situations
to escalate, and that when they took the time to really listen to the students, they found that the
teachers often were making assumptions about students and behavior. These actions led them to
believe that some of their teachers had a lack of understanding about the cultures of their
students and their own personal biases. One principal said,
But I think there's a disconnect with teachers and their understanding of the African
American male population and the female population, about the culture, about how to
address… we've talked about this and talked about this, but I think there's still a disconnect
with our population of teachers about how to address these things. Because I think it gets
out of control really, really fast. Because I'm like, you know, “You need to watch how you

142
say things to the students… your demeanor, how you express yourself, not only in words,
but your body language, everything, how you...”
In addition to a lack of understanding of the different cultures of their students, principals
also believed that their teachers lacked the skills to deal appropriately with students in discipline
situations. They said that some teachers will yell back when a student yells at them, that they
often trigger kids and escalate situations with their own behavior and responses, the don't take
the time to find out what really happened in a discipline situation which often leads to them
assuming the problem student did it (even when it's proven they did not). One principal said,
You’ve got to understand their culture sometime. African American males, a lot of
them…it’s fight or flight mode for them a lot of the times. A lot of that comes from home
and survival at home. Often in their home and their community, the pastime is to tear down
each other and ridicule each other and tease each other. It's a cultural thing. I guess a way
of toughening them up. I don't know.
When teachers witness this type of behavior and intervene, they come into direct contact with
cultural beliefs, often unknowingly, and react based on their beliefs. Students become angry
because they are being punished for acting this way at school, when at home the behavior is
acceptable. They often argue with the teacher and lash out at them, and sometimes call their
teachers “racist.” The words principals used to describe these situations with students included
"battle with kids", "lambast them" in front of other students, and that teachers often "brow-beat"
kids. One principal noted,
Relationships, in the end, just that trust and then letting them have a voice and say…like, I
had one just a little while ago who was yelling out in the front. So I went out and... I think
how some people handle the situation. Like kids start yelling, they started yelling back. I've
learned that's not the way to do it. You just got to give them a minute. You've got to know
your kids. And we have so many that are... You trigger them.
These kinds of combative interactions can be exacerbated when the teachers aren’t aware
of their students’ cultures and how their actions are being interpreted by the students. Once

143
interactions like this happen, the teachers are more likely to send them to the office and less
likely to want to work with the student on their behavior. Although all principals described
behaviors like this from some of their teachers, they were quick to point out that this doesn’t
represent all of their teachers. They knew which teachers tended to refer students of a certain
race, and expressed frustration that these teachers did not know how to handle their students.
However, only one principal of the six interviewed had actually provided professional
development for her teachers on cultural responsiveness. This finding is consistent with the work
of Gregory and Weinstein (2008), who found that the style of classroom management for some
teachers had a significant effect on the discipline outcomes for African American students.
The cultural mismatch also related to parent relationships with the school. Principals
noted that they felt parents did not show much support for the school with regard to discipline,
and were quick to ask what was happening to the other students involved in a discipline incident
rather than focus on how to help their own child. The Principal of Elementary C noted that there
was a distrust of the school by the African American community, and that they were often
labeled “racist” when they disciplined African American students by parents and students or
when they tried to take actions to support African American students. She discussed a portion of
her student population from one smaller community that had been consolidated with her school
many years prior. In this community she noted,
It's a very different culture. It's not a culture that I'm really familiar with that much, but I
need to be more familiar with. There's some great people over there, some great families
over there, and I have built some great relationships with a lot of the families. But there's
still a few that are very distrustful, and they feel like we're racist, that we don't care about
their kids. Some of that comes out of nowhere.
She went on to talk about the importance of spending time outside of school in the community to
build relationships with families and to build that trust. Even though she’s been doing that for

144
several years, she still felt that there was distrust from the parents in the community and
attributes it to differences in culture.
The principal of Elementary A, who had been interviewed in the local media for her
efforts to reduce inequities between African American and White students in discipline in her
school was also labeled as “racist” by parents from both groups. She felt that her work had
caused a race war in the community, with both sides crying foul. She noted,
I guess before maybe people would have denied what they saw, I don't know, but, yes,
we're saying there's a problem and here are some things we want to do about it, but now
what I'm saying, it's like they don't want that either. Some know that we're doing the right
work…And I had one that got on social media and lambasted me and everything. But, I'm
the type of person, I’m just going to call you and say my piece and explain it to you and
try to educate you.
It’s clear that confronting racial equity head-on is tough work for principals in rural areas, and
that few are willing to take it on. However, it appears that whether the school ignores the issue or
tries to address it, the principals still end up being called “racist” by one or more factions in their
community.
The cultural mismatch was also mentioned with regard to the school system itself by a
few of the principals. One said, “The way we do business, I think, is in itself a barrier for the
students that we have today.” From the teaching methods we use in the classrooms to the ways
we address misbehavior, some felt that our expectations were too far off from what the students
themselves deal with in their homes. One principal noted,
I don't know. A big thing with our black males is respect, and if they feel any kind of
slighted, or disrespect from anybody, teacher or students, they lash out a lot. It's not all of
them. It's just those few that had the most social problems is what I call ... they don't have
the social skills that a lot of kids have. Or they don't have the appropriate social skills that
we I guess connect with our culture that's going to be successful.

145
Although several were involved with redesigning their systems, only the principal of Elementary
C mentioned that the system itself might be causing disproportionality and was redesigning her
system to address it. The teaching strategies used in classrooms were also mentioned as a
possible cause of disproportionate rates. Another principal said,
Our delivery method... when you have to be explicit and systematic... It's "Be quiet and
listen to me," and then you rehearse it. Students really struggle with that so that's something
that we have that's... We've got to change the way we do business.
Some of the principals were engaged in the work of changing their systems to be more
responsive to student needs and less punitive, but not all were. In fact, some that recognized that
the system itself was a barrier had not taken any concrete actions to change their discipline
systems, even when they knew it was a barrier for some students. Rather than changing the
system, some preferred to deal with students on a case-by-case basis and get to the “root of their
issue” rather than changing how discipline and culture are perceived as a whole in their school.
Student Trauma and Mental Health Issues
Another factor in disproportionate discipline rates mentioned by principals was that of
student trauma. Based on a survey by Sacks and Murphey (2018), Arkansas ranks highest of all
states in the percent of children who have been subjected to adverse childhood experiences
(ACES). Common ACES include exposure to drug use in the home, verbal abuse, domestic
violence, divorce, neglect, and having an incarcerated parent. They found that on average, 60%
of children in Arkansas have experienced at least one ACE, while the average for the nation is
45%. In Arkansas, one in seven children has experienced more than three ACES, which also
places the state in the high-risk category. They attribute the large number of rural communities in
the state as a contributing factor to the high number of ACES, due to the level of stress
experienced in poverty. They also found that different races do not experience ACES at the same

146
rate. Nationally, 61% of African American students have experienced at least one ACE, while
only 40% of White students have. The principals with kindergarten students in their building
were especially aware of the impact of ACES and mentioned that they are seeing traumatized
students more and more each year. One principal said, “If I haven't wrestled a kindergartner
every day, I haven't done my job. They're just so traumatized. They're just like… it’s
heartbreaking.” Drug use, addiction, and poverty is the reason these principals believe so many
of their students are coming to school with trauma, which leads to a lack of coping skills, trust,
and insecurity on the part of students.
Closely related to student trauma and often overlapping with it were the mental health
issues that students are dealing with in schools. For those students with repeated discipline
referrals in a short period of time, the school leaders talked about reaching out for mental health
services to support these students. So many of the students with recurring infractions are dealing
with some type of issue, whether it be trauma or mental health issues. One principal said when
talking about how you deal with the growing numbers of students who struggle to behave on a
daily basis,
That's what I told my husband the other day. He said, “How do you deal with that?” I said,
“Well,” I said, “These kids can't help it. They're damaged goods.” And when they get to
school they just can't, a lot of that stuff they can't help. They really can't so we try to get to
the bottom of the problem with mental health. So trying to find quality help is the key.
The struggle to find quality help for students was one mentioned by several principals as well.
Although they had access to numerous providers, they were quick to point out that not all
services were effective with students and in some cases, could further traumatize students. One
of the schools had a health clinic on campus and had made plans to add a nurse practitioner for
the coming school year who specialized in mental health issues. The others talked of having to

147
build relationships with providers in the community and rely on them for support because the
school did not have the capacity to help these students. Juvenile court was also utilized to coax
parents into getting help for their child when they were not responding to school requests. It was
clear that most schools were not equipped to handle the types of serious behaviors they are
seeing from students, starting at the earliest ages. Principals noted that their counselors play a
huge role in helping students of trauma and those struggling with mental health issues, but that
they don’t always have the skills to provide what the students need.
Research has established that African American students are diagnosed with disabilities
such as mental retardation, emotional disturbance, and learning disabilities at higher rates than
White students. (Donovan & Cross, 2002; US Commission on Civil Rights, 2019). These
students also experience ACES at higher rates, which can lead to identification of a disability.
When these students encounter the middle class structures in place in schools, conflict often
occurs. With higher numbers of African American students being diagnosed with these types of
disabilities and needing support, it follows that the numbers of discipline infractions and actions
in schools are impacted as well. All principals, in discussing students with recurring infractions,
believed that African American males made up the majority of this group, which could be
skewing their overall disproportionality rates.
Conceptual Framework Revisited
In revisiting the conceptual framework for this study, the interaction of the discipline
policies and practices being utilized in schools (the discipline system), the training that the
administrators and teachers have had, particularly in culturally responsive techniques, and the
opportunities for implicit bias are all contributing to disproportionate rates of discipline in these

148
schools, in addition to the tenets of Critical Race Theory. Figure 19 is a visual representation of
this framework.
Figure 19. Conceptual Framework
Critical Race Theory
When each of the four basic tenets of Critical Race Theory (CRT) noted by Delgado and
Stefanic (2006) are layered upon the findings from this study, conclusions can be drawn. The
first tenet, that racism is institutionalized in the United States, speaks directly to the discipline
systems the schools have in place. The principals in this study recognized that the way we do
business in our schools is a barrier for some students, especially those of color. From the
instructional strategies being used in classrooms to the way teachers handle student misbehavior,
principals noted that many of their African American students were struggling. One noted that
she thought the students were coming to school without the skillset to match “the way we define

149
success in our society.” Their recognition of the fact that the system itself is a barrier for some
students alludes to how school systems have been created to cater to the majority race. The
discipline data from each school confirms that White students in these schools are being
disciplined at much lower rates than African American students, which relates to the second
tenet of CRT.
The second tenet of CRT is that because this system of institutionalized racism advances
the interests of Whites, many are not interested in abandoning it. It is also confirmed through the
findings of this study, particularly for White students. Although the principals (who were all
White) were aware that their systems were disproportionately affecting African American
students, only half of them were actively making changes to change their systems. The other
three leaders were aware of disproportionate discipline rates and concerned by them, but did not
place a high priority on making actionable changes to their system. These three leaders were
from the same district, and explained that the priorities of the school district were more focused
on the academic achievement of the students than any other aspect. This leads to the conclusion
that because the White students were not being overly affected by the discipline rates, that the
issue had not risen to the level of becoming either a school or district priority. The other finding
in this study that relates here is that in all five of the schools, White students were significantly
underrepresented in both discipline infractions and actions when compared to the portion of the
population they comprise. This reinforces the tenet that the systems in place at these schools are
advancing the interest of Whites, because the discipline systems appear to be working for White
students. Smaller numbers of White students are being referred for discipline infractions and
receiving discipline actions than the African American students, which likely leads to more time
in class, more instruction, and higher achievement for White students.

150
The third tenet of CRT, that race is a social construction, is also reinforced in the findings
of this work. According to Simson (2014), opportunities for bias occur when teachers and
administrators use their socially constructed views of race to make decisions related to student
disciplinary actions. The teaching and administrative staff in each of the schools in this study
were overwhelmingly comprised of White females. Among the teaching staff in all five schools,
only eight African American teachers were currently employed, out of approximately two
hundred certified teachers. Principals noted in interviews that their teachers were mostly “White,
middle class women” and were quick to point out that their teachers were unaware of what life
was like for the students from different races and economic backgrounds than their own. The
administrators interviewed were also all White females, with one male principal. When
examining the demographics in light of Simson’s work, it follows that the patterns of decisions
being made in light of each player’s socially constructed view of race could be the root cause of
disproportionate discipline rates in these schools. It is interesting to note here that in the school
with the smallest rate of disproportionate discipline for African American students, the principal
was highly aware of the African American culture and saw her role as the gatekeeper for
ensuring that these students were not being singled out or punished at higher rates than other
students. This suggests that her social construction of race for African American students differs
from the administrators at the other schools, likely due to her extensive work in schools with a
majority of African American students.
The final tenet of CRT, that groups are racialized differently throughout history, usually
in response to the labor market, also comes into play in light of these findings. Because the
demographics of the teachers are so different from the African American students in these
schools and principals noted the presence of cultural mismatch, teachers and administrators may
151
perceive the actions of African American students differently. When a misunderstanding occurs
due to limited cultural knowledge of the other race, conflict often occurs. If the teachers perceive
their students as threatening, aggressive, or dangerous then they are more likely to push these
students out for discipline reasons, leading to administrators taking discipline action against
them. In light of the research findings in this study that African American students are being
disciplined at higher rates in these schools than White students and that principals believe the
primary factor is a cultural mismatch, implicit bias is implicated. Recent studies have confirmed
the presence of implicit bias in schools and its role in disparate rates of discipline for African
American students (U.S. Commission on Civil Rights, 2019).
Implicit Bias
According to McIntosh et. al (2014), the more ambiguous a decision is, the more
opportunities for implicit bias. In finding the unclear and non-developed discipline systems in
place in these schools, there are multiple chances for implicit bias to impact the discipline
decisions made. The composition of subjective discipline offenses was much higher for African
American students than they were for White students, which suggests implicit bias is present at
the classroom level when teachers make the decision to refer students to the office. This finding
is consistent with the work of Skiba et al (2002), who found that African Americans were more
likely to be referred to the office for offenses that were more subjective in nature, such as
disrespect, threats, and excessive noise, while White students were more likely to be referred for
more objective offenses, such as smoking, vandalism, and obscene language. In four of these
schools, African American students were overrepresented at high rates for Insubordination and
Disorderly Conduct, with composition differences ranging from 24% to 37% for Insubordination
and 23% to 37% for Disorderly Conduct. White students were underrepresented in both

152
categories at high rates as well. Both types of offenses were broadly defined by principals
including a wide range of behaviors, from actively defying what the teacher told them to do to
throwing chairs and causing a substantial disruption to class. Some even noted that these
categories were a “catch-all” for behaviors of students and that there were differences based on
who the referring teacher was.
One school (Middle C), however, had composition differences in these categories for
African American students that were minimal (-1% for Insubordination and 0 for Disorderly
Conduct), with White students overrepresented in these categories at much lower rates than the
other schools (9% for Insubordination and 8% for Disorderly Conduct.) This outlier could be
due to several causes, including having a principal who has developed deep knowledge of
African American culture and student behaviors, a different social construction of race for
African American students, and a focus on building caring relationships with African American
students. She also conveyed that she doesn’t allow her teachers to handle students
inappropriately, and that she is able to get to the root of what is wrong with a student fairly
quickly because of the relationships she has built with them. In telling the story of an African
American student who was about to be expelled from the alternative school for behavior, she told
of how she had devised a plan to have him come back to her campus and stay in the ISS room to
finish out the year so he would not have to redo the entire grade. She said,
And I told him, baby, I'm working on let you have a real schedule, play football, whatever
you want to do. Academically, he was an A/B student, but he just has a temper... he's gone
to residential two or three times and they just couldn't…So we're trying, we're going to be
really try. But I know some people probably would criticize and say that was a weakness
on my part. I just didn't want to expel him… I just felt like that wasn’t what was best. And
I've had a lot of African American parents come to see me about that and just tell me that's
why they are happy their child's here, that I can see beyond, you know, his anger and see
the potential in them. And I'm hoping that he's going to make it.

153
Her compassion for this student and willingness to see beyond his behavior has built trust with
not just his family, but others in the community as well. It is clear that the role of the principal
can have a significant impact on combatting implicit bias in schools when they are aware and
understand the cultures of their students (DeMatthews, 2016; Warren et al., 2009).
Administrative and Teacher Training
Administrator and teacher training is also implicated in the findings of this study. Two of
the schools were engaged in work with Solution Tree, a nationally-known professional
development provider for schools that focuses on implementation of professional learning
communities (PLC). Through their work, Solution Tree coaches were working directly with the
administrators and teachers to help them focus on their most immediate areas of need. Both
schools were engaged in creating structures in their schools for teachers to collaborate with one
another to increase student learning. However, in one school the work was more focused on
academic needs (Middle B), although the principal mentioned that they were going to be more
focused on the other needs of students, including behavior interventions, in the 2019-2020 school
year. The other school (Elementary A), was specifically focused on creating more equitable
opportunities in their school based on the results of an audit conducted by Solution Tree. Middle
B is one of ten schools that was selected to be in the first cohort of a statewide grant for schools
to implement PLC processes over a three-year period. They received this support free of charge,
while Elementary A contracted on their own for one year to receive coaching services from
Solution Tree. Elementary A has since been selected to be part of the third cohort of the PLC
statewide grant and will receive three years of free coaching.
The work of Solution Tree in both schools speaks to the impact an outside professional
development provider can have in rural schools, especially when they are geographically

154
isolated. It was apparent through the interviews with both principals that their teachers were
engaged in meaningful, job-embedded professional development through a long-term
relationship with the provider. The discipline data in this study is from the 2017-2018 school
year, which is prior to either school working with Solution Tree and therefore cannot be used to
draw conclusions about the long-term effects of this work on student achievement in each
school. However, the data collected from the principals through interviews suggests that these
schools are engaged in the work of implementing systems of collaboration and data analysis that
can be used to help them address issues of inequity regarding student discipline.
Another type of training that two of the schools were engaged in involves implementation
of a PBIS system. Both Elementary and Middle C were part of a grant from Arkansas State
University to implement the system in their district. They had just begun the work to implement
and had been working with teachers to create a matrix of positive behavior expectations and
lesson plans for each teacher to use to teach them to all students. Through the grant they were
allowed to take a team of teachers from each school to Little Rock for a series of trainings to
learn the importance and methods of utilizing positive behavior interventions with students.
Although the training was not on-site as Solution Tree is, it was clear through interviews that
both principals believed in the approach and were excited about the work that was going on in
their schools. Both also spoke of making the shift from only the administrators monitoring
discipline data to having a lead team of teachers who were responsible for regular monitoring. As
part of this work they also were working to develop a discipline referral form that required
information such as the location and time of day of the discipline incident, to better track areas of
concern for students. McKintosh et. al (2014) found that when principals work to make their
discipline systems as objective as possible, operationalize staff expectations, and provide training

155
in how to respond instructionally to student behavior, it can have a positive impact on discipline
referral rates. The use of positive behavior and support systems, such as those implemented in
PBIS, have been shown to be so effective that the US Commission on Civil Rights recommended
the Department of Justice provide guidance for all schools in the nation on its implementation
(July 2019). Recent studies have shown that implementing Culturally Responsive PBIS
(CRPBIS) can have an even greater effect on reducing disproportionate rates of discipline for
African American students, which may be more appropriate for this district based on the results
of this study (Johnson et al., 2018). Although these systems are being implemented for the 2019-
2020 school year and did not impact the discipline data in this study, it appears that these two
schools are committed to implementing an effective system to improve discipline outcomes for
all students.
A final type of administrator training that is implicated in this study is the work of the
Arkansas Leadership Academy’s (ALA) Master Principal Program. The Master Principal
Program is a selection-based program created in 2003 by the Arkansas legislature to “provide
training programs and opportunities to expand the knowledge base and leadership skills of public
school principals.” The three-year program equips principals with the skills to achieve
“designation”, which is a rigorous review process documenting the principal’s effect on raising
student achievement in their school. The state provides annual financial bonuses to Master
Principals who achieve this designation and extra incentive for those serving as principals in
“high need” schools.
The principal of Elementary A had been involved in this training for three years at the
time of the interview and there were marked positive differences both in her level of skill in
distributed leadership and in the focused and intentional work going on in her school when

156
compared to the others that can be contributed to her training at ALA. The comprehensive nature
of the professional development being provided to her teachers speaks to her skill in
understanding that the most effective training for teachers is job-embedded, delivered on an on-
going basis over a long period of time, and allows opportunities for practice and feedback.
(Joyce & Showers, 2002). The focus of her work began through a needs assessment utilizing
various sources of data in her school, including discipline data, attendance data, and the
academic performance of students. She led her team through analyzing the data and deciding on
a specific area of focus for them to work on as a school using the tools learned in ALA. They
chose to focus collectively on decreasing the discipline referral rate for all students, including
those with recurring infractions. In addition to involving the staff in each aspect of planning for
how to address the area they chose to focus on, she planned a series of varied and differentiated
learning experiences to address the issue from multiple perspectives including using student data
to dig deeper into the backgrounds of students with recurring infractions, empathy-training for
teachers, creating an awareness of culturally-responsive teaching strategies, allowing teams of
teachers to attend intensive behavior training at the regional cooperative for students needing
extra support, conducting a book study on culturally-responsive techniques, and utilizing the
practice of instructional rounds to for teachers to observe other teachers using the strategies. This
type of comprehensive planning for professional development, use of data to guide decisions,
and distribution of leadership is the focus of ALA’s work with principals in crafting systems that
lead to high student achievement. It was apparent that this principal was able to utilize Solution
Tree to enhance her work, but knew how to address this because of her work with ALA’s Master
Principal program. She referred to her work with ALA throughout both interviews as the impetus
that empowered her to embark on this work and what equipped her with the strategies and skills

157
needed to sustain it and take it to scale. This finding is consistent with the work of Peer (2012),
who conducted a qualitative study of designated Master Principals trained by ALA and found
that they showed significant improvement in leadership skills, knowledge, and successfully
shifted their school culture toward one of collaboration and distributed leadership.
It is clear that the role of administrator and teacher training is imperative in helping to
move schools forward in addressing equity for all students. In four of the five the schools in this
study, the presence of outside professional development support, through grants and their own
funding, was a necessary component of helping them to move forward. In the one school that
was not involved with any outside professional development other than a one-time, all-day
session for the entire district on poverty at the beginning of the school year, the principal readily
admitted that she didn’t have the knowledge and skills to know how to address the issue of
disproportionate discipline for students. Continuing to provide this type of support to schools and
districts, especially in rural areas, through state funding and grants is a critical component in
helping school leaders and their staff understand and implement processes to better meet the
needs of all students.
Discipline Policies and Practices
The discipline policies and practices in place in the schools studied are a final important
piece in the picture of disproportionate discipline for students. Although all schools receive the
same federal and state guidance with regard to discipline policies, the way they are interpreted on
the local level differs. All principals pointed out that the policies were necessary to “back them
up” when they made tough discipline decisions, but they also mentioned that they were careful to
make their policies in the handbook vague enough so that they didn’t “tie their hands” when it
came to dealing with discipline. All of the schools mentioned having zero tolerance policies for

158
the most serious offenses, which in their opinion included drugs, alcohol, and weapons. One of
the schools had expelled a student during the 2017-2018 school year for bring a loaded gun to
campus with the intent to kill another student. This child was in preschool and four years old, but
the principal was clear that her first responsibility was to ensure the safety of all children in her
care, regardless of the age of the offender. When specifically asked about zero tolerance policies,
the principals were all in agreement that they were to be used only for the most severe situations
and they often had much better results when they focused on getting to the cause of the discipline
problem rather than just punishing the student for it. The principals of the lower elementary
schools felt that there might be more of a place for zero tolerance policies with older students,
but said they rarely used them. All said that zero tolerance policies were ineffective and created
more harmful experiences for the students, but that they would use them for the most serious
offenses.
The practices being used in these schools, although aligned to policies, were more
inconsistent. Each principal discussed and told stories to illustrate the nature of dealing with
student discipline, and it is clear that there are multiple factors that come into play before a
decision can be made. Although policies provided some guidance as to consequences for
discipline incidents, most preferred to use a progressive form of discipline that became
increasingly more severe with repeated incidents. All schools were in the practice of using ISS as
consequence for students with repeated behavior problems, even for students as young as
kindergarten. In all five of the schools, African American students received ISS as a consequence
at disproportionately higher rates given their composition of the population, while White
students were underrepresented. Corporal punishment was mentioned by principals as being used
sparingly, based on parent request. The composition differences for corporal punishment for

159
African American and White students were smaller than they were for ISS, which may be due to
African American parents choosing to opt out of corporal punishment for their children. If this is
the case, then principals said that ISS was their other option. This use of parent request as a
parameter for the administration of corporal punishment may be a reason why the numbers are
higher for African American students for ISS. Out-of-school suspension was seen as a last resort
for the most serious offenses, and the elementary campuses used it little, if at all. This may be
due to legislation banning the use of OSS for students in grades K-5 except under the most
serious of circumstances. Expulsion was only used once out of all five schools, for the preschool
student with the loaded handgun. It was not seen as a viable option for students at any level by
the principals, because of the loss of credit and adverse effect it had on students.
The impact of discipline policies and practices in schools can have an effect on
disproportionate rates, when utilized consistently. It is clear that at the federal level with the
implementation of ESSA that schools are encouraged to look closely at equity with regard to
student discipline, and state legislation is increasingly more concerned with that as well. At the
conclusion of the 2019 legislative session, several new laws had been passed that impact student
discipline, including one banning the use of corporal punishment on students with disabilities
(Act 557 of 2019). Principals discussed the impact of this new law and how it was leading them
to ban the use of corporal punishment for all students, in at least two of the schools in the study.
Discipline policies are helpful in that they set the guidelines for what can and can’t be done in
schools, but it is really the everyday practices that have the most impact on reducing
disproportionality when used consistently. The implementation of discipline systems with clear
expectations for students and staff, a system for monitoring student discipline data on an on-
going basis, and supports for students to learn the expected behaviors instead of just being

160
punished for misbehavior can have a significant impact. Implementing these systems is the work
that principals can and should foster in their schools to ensure equity for all students.
Limitations and Delimitations
There are several limitations to this study, including the sensitive nature of the
phenomenon studied and changes that have occurred related to school discipline at the federal,
state, and local levels during the course of the study. Because the focus of this study involved
race and implicit bias, participants may have withheld their true beliefs on the topic. Their
positions as administrators in small schools within a single region in the state could possibly lead
to repercussions in the media and their communities if their true beliefs could be construed as
“racist” by others. Therefore, this limitation means that the data collected in the qualitative
portion of the study may not reflect the administrators’ true beliefs. Another limitation is the
policy changes that took place during the course of the study at various levels. Guidance from
the federal level requiring schools to examine their discipline data for disparate impact was
revoked during the course of the study, causing some confusion for schools as to where they
should focus their efforts. State and local guidance on student discipline also developed during
the study as a result of ongoing implementation of the requirements of the Every Student
Succeeds Act (ESSA) related to school discipline means that the data collected may not reflect
the current state of these schools. Data collected for the 2017-2018 school year in the study
reflects actions under previous state and local guidelines and current discipline data may show
different rates of disproportionate discipline under the new guidelines. This also includes the
implementation of Act 557 of 2019, a new state law prohibiting corporal punishment for students
with disabilities which went into effect at the beginning of the 2019-2020 school year. This new

161
law may impact disproportionate rates of discipline because all five schools in the study were
using corporal punishment as a discipline option for all students at the time it was conducted.
Delimitations include the sample of principals that were interviewed and schools selected
for the study, as well as a lack of students with recurring infraction data available at the student
level for each school. The principals that were included in the study all had personal
relationships with the researcher and were selected through convenience sampling. This decision
was made due to the sensitive nature of the topic and the likelihood that they would feel
comfortable sharing their true beliefs about disproportionate rates of discipline in their school.
However, the sample could have been expanded to other principals in the region to determine if
the same patterns of disproportionate discipline were occurring in their schools. The schools
included in the study were all located within one region of the state, and therefore results are not
generalizable to all rural schools in the state. The schools were selected in this region because of
the rural nature of the area and the researcher’s previous role as a principal in the region. The
final delimitation is the lack of chronic offender data at the student level which could further
explain the extent of disproportionate discipline in these schools. Because of the current data
reporting system in use in Arkansas for schools, only total numbers of infractions and actions by
each demographic were available to the researcher. Being able to get the infraction and action
data by student would help to account for any skewing of the data because of students with
recurring infractions and offer a more realistic picture of discipline disproportionate rates in each
school. However, the decision was made to include each principal’s perception of how
representative their rates of disproportionality were based on their experience even though exact
numbers were unable to be determined.

162
Implications for Professional Practice
The work of creating equitable opportunities and outcomes for all students is a goal of
every school. However, many school leaders are currently working in schools with
disproportionate rates of student discipline for African American students but may not know, as
the leaders in this study expressed, what specific actions they can take to reduce those rates.
There are several areas of implication for current practitioners, including processes to implement
and implications for graduate education leadership preparation training.
Primary Actions for Professional Practice
The processes necessary for taking action with regard to disproportionate discipline rates
include having a system for discipline referrals that is clear and objective and minimizes
opportunities for subjective decisions to be made. Time should be taken to involve the teachers
in the creation of a discipline system that operationalizes the expectations for all students, clearly
defines behaviors that are to be handled in the classroom and those to be managed by the office,
and gives examples. These systems should be written down and readily available to staff,
parents, and students to increase consistency and transparency. A clear process for when and
how to refer a student to the office should also be included. As part of the discipline system, a
system for regularly monitoring student discipline data for disparate effect on groups of students,
including African American students, should also be in place. Training in how to examine data
for disparate impact should be provided for staff members if needed, and is readily available
from a variety of sources, including the PBIS data manual (McIntosh, Barnes, Eliason & Morris,
2014).
In addition, principals can provide training for their staff in several areas to decrease
disproportionate rates of discipline and increase equitable opportunities for all students. Training

163
in awareness of implicit bias and empathy has been proven to be effective in reducing bias in
decisions (Fenning & Jenkins, 2018). Use of the Implicit Association Test is one way to help
teachers understand their own implicit biases and then work can begin on how to reduce their
impact in decisions. See Appendix E for more information on the Implicit Association Test. Just
being aware that you have certain biases against groups can be an effective way to reduce their
impact. Training and awareness in culturally-responsive practices for teachers and administrators
should also be included, specifically related to the student and family groups within the school.
With regard to discipline, culturally-responsive classroom management techniques should be
included in the training, as well as relationship-building with students and families in culturally-
responsive ways.
Graduate Educational Leadership Preparation Programs
The findings in this study also provide implications for principal preparation and training
programs. As part of their preparation, principals need more specific training in what disparate
impact is and how it can have negative long-term effects on students. In addition to
understanding what it is, programs should include practical training in how to calculate discipline
rates for each student group to determine if disproportionate rates are occurring in their school.
They also need a deep understanding of implicit bias and how it can impact students in schools,
as well as how to create systems that minimize its impact. Although principal preparation
programs typically contain a component of culturally-responsive training, it needs to go much
further than a cursory course on diversity or multiculturalism. These courses should include the
different aspects of culturally-responsive pedagogy, including classroom management,
curriculum and materials, engagement strategies, relationship-building, and the importance of
rigor. According to DeMatthews (2016), the Professional Standards for Educational Leaders

164
(PSEL) provide some guidance for addressing equity issues with future principals, but fall short
in advocating leadership for social justice. By learning about the different aspects of cultural
responsiveness, principals will be in a better position to address the needs of their school.
Data Systems and Training in Schools
The work of this study also implicates work that can be done to reduce inequity in the
data systems in place in rural schools. All of the schools in this study relied on the free, state-
provided data system as their primary source to track discipline incidents and actions. This is
likely due to the cost of purchasing data systems that break down information and show areas of
disproportionate discipline that many larger districts purchase. One such system, Smart Data by
White River Solutions, is an automated data dashboard and early warning system for school
districts that many larger districts in the state have already purchased. This system allows school
personnel to easily examine and analyze discipline data, provides areas of disproportionate
discipline, and supports the work of Response to Intervention (RtI) and PBIS teams. The system
pulls from the state reporting system, but breaks the data down into a format that is easy to
access and understand. In fact, the system is so well-designed that the Arkansas Department of
Education’s Research and Technology team is promoting its use purporting that it is a better
solution for tracking data than anything provided by the state. However, the system comes at a
cost of $10 per student, per year. Rural schools that are struggling with finances find it difficult
to purchase these systems, resulting in inequitable outcomes for students in their schools. When
the funds are not available to purchase these systems, the principals are left to create their own
data-monitoring systems, which often looks different from school-to-school. To mediate this
issue, professional development for principals can be provided to help them understand how to
break down their data into a meaningful format for easy use by teams. Online professional

165
development modules provided at low or no-cost could help to support this work as well.
Another solution would be for the state to negotiate with Smart Data or a similar service and
provide free access to the dashboard for all schools to reduce inequities in data availability and
use in rural schools across the state.
Implications for Future Research
Although much research has been conducted around disproportionate discipline in
schools, this study opens up areas of further research within the field with regard to principal
impact, rural schools, and cultural responsiveness. To more completely understand the
phenomenon of disproportionate discipline for students in rural schools, this study should be
replicated in other contexts. These schools were located in one geographic region of the state, but
replication could include other regions of the state or rural districts in other states across the
nation. Replication could help to establish patterns of impact that principals can have on
disparate impact and also measure effects of systems put into place to address it.
To expand the work of this study, focus groups of teachers, parents, and students could be
conducted to add their voices to the research. Teachers in these schools or other rural schools
with established disproportionate rates of discipline should be included, and both African
American and White students should be included for their perceptions. Another expansion of this
study would be to revisit these schools using their discipline data from the 2019-2020 school
year to determine if changes have occurred in disproportionate rates. Because the principals
spoke of systems they were currently implementing and some were focused on reducing those
rates, it would be interesting to measure the type of impact realized after implementation and to
determine if participation in this study had an impact on their practice.

166
This study showed a relationship between the level of cultural-responsiveness of the
principal and their rate of disproportionate discipline for African American and White students.
Future research could consider comparing the school culture in schools where culturally-
responsive professional development has occurred as compared to those who have not engaged
in any work around culture. A final implication would be to compare the responses of principals
from urban schools with disproportionate rates of discipline to those of the principals in rural
schools to determine if there is a difference based on context.
Conclusion
The purpose of this study was to examine the problem of practice found in the
disproportionate rate of student discipline for African American students compared to White
students in rural schools in Southeast Arkansas. The concern was that African American students
were being disciplined at much higher rates than their White counterparts in rural schools, even
though they comprised a smaller portion of the student population. Existing research has shown
that African American students in Arkansas receive 117.6 discipline referrals per 100 students,
whereas White and Other race students receive 37 – 40 per 100 students (Anderson, 2018).
Research seems to indicate that students receiving higher rates of exclusionary discipline are at
heightened risk of lower student achievement, dropping out, and ultimately prison (Alexander,
2012.) This study reveals that principals, though aware of the disproportionate rates of discipline
for African American students in their schools, are unsure of the best ways to reduce this
phenomenon. The findings appear to indicate that principals who are culturally aware of the
student diversity in their respective schools and take specific, concrete actions to ensure equity
for all students, are most successful in reducing rates of disproportionate discipline. This study
also shows a need for clear, objective discipline systems in schools that minimize the impact of

167
implicit bias. Until all educators understand the impact of implicit bias in schools, the role we all
play in ensuring equitable outcomes for students, and how best to ensure equity for all, there is
work to be done.
168
References
Alexander, M. (2012). The new Jim Crow: Mass incarceration in the age of colorblindness.
The New Press.
American Psychological Association Zero Tolerance Task Force. (2008). Are zero tolerance
policies effective in the schools? An evidentiary review and recommendations. American
Psychologist, 63, 852-862. https://doi.org/10.1037/0003-066X.63.9.852
Anderson, K. (2018). Arkansas student discipline report. Arkansas Education Report (16)2, 1-36.
http://www.officeforeducationpolicy.org/downloads/2018/09/arkansas-student-discipline-
report.pdf
Anderson, K. P., & Ritter, G. W. (2017). Disparate use of exclusionary discipline: Evidence on
inequities in school discipline from a U.S. state. Education Policy Analysis Archives,
25(49). http://dx.doi.org/10.14507/epaa.25.2787
Anderson, K.P., Ritter, G.W., & Boyd, A. (2015). Do school discipline policies treat students
fairly? A second look at school discipline rate disparities. University of Arkansas
Working Paper Series, 2015(11). https://doi.org/10.1.1.709.1155&rep=repl&type=pdf
Blake, J. J., Keith, V. M., Luo, W., Le, H., & Salter, P. (2017). The role of colorism in
explaining African American females' suspension risk. School Psychology Quarterly:
The Official Journal of the Division of School Psychology, American Psychological
Association, 32(1), 118-130. https://doi.org/10.1037/spq0000173
Bottiani, J. H., Bradshaw, C. P., & Gregory, A. (2018). Nudging the gap: Introduction to the
special issue “Closing in on discipline disproportionality”. School Psychology
Review, 47(2), 109-117. http://0-dx.doi.org.library.uark.edu/10.17105/SPR-2018-
0023.V47-2
Bradshaw, C. P., Mitchell, M. M., O’Brennan, L. M., & Leaf, P. J. (2010). Multilevel
exploration of factors contributing to the overrepresentation of black students in office
disciplinary referrals. Journal of Educational Psychology, 102(2), 508–520.
https://0-doi-org.library.uark.edu/10.1037/a0018450
Cagle, J. F. (2017) The cost of color in public education – An examination of
disproportionate suspensions. Journal of Organizational & Educational Leadership.
(3)1. https://digitalcommons.gardner-webb.edu/joel/vol3/iss1/3
Children's Defense Fund. (1975). School suspensions: Are they helping children?
Washington Research Project. https://files.eric.ed.gov/fulltext/ED113797.pdf
Creswell, J. W. (2014). Research design: Qualitative, quantitative, and mixed methods
approaches (4th ed.). Sage Publications, Inc.

169
Creswell, J.W. & Poth, C. N. (2018). Qualitative inquiry & research design (4th ed.). Sage
Publications, Inc.
Delgado, R. & Stefancic, J. (2011). Critical race theory: An introduction. New York University
Press.
DeMatthews, D.E. (2016). Effective leadership is not enough: Critical approaches to closing the
racial discipline gap. Clearing House, 89(1), 7-13.
https://doi.org/10.1080/00098655.2015.1121120
DeMatthews, D. E., Carey, R. L., Olivarez, A., & Moussavi Saeedi, K. (2017). Guilty as
Charged? Principals’ perspectives on disciplinary practices and the racial discipline
gap. Educational Administration Quarterly, 53(4), 519–555.
https://doi.org/10.1177/0013161X17714844
Diem, S., & Carpenter, B. W. (2012). Social justice and leadership preparation: Developing a
transformative curriculum. Planning and Changing, 43(1), 96-112. http://0-
search.proquest.com.library.uark.edu/docview/1506941477?accountid=8361
Donovan, M.S., & Cross, C.T. (2002). Minority students in special and gifted education.
National Academies Press.
Ferguson, A.A. (2001). Bad boys: Public schools and the making of Black masculinity.
University of Michigan Press.
Fenning, P. & Jenkins, K. (2018). Racial and ethnic disparities in exclusionary school discipline:
Implications for administrators leading discipline reform efforts. NASSP Bulletin 2019,
102(4), 291 - 302.
https://uark.summon.serialssolutions.com/2.0.0/link?t=1575161280006
Forman, L. M., McKenzie, S. C. & Ritter, G. W. (2018). Arkansas teacher supply. Arkansas
Education Report, 16(1), 1-88.
http://www.officeforeducationpolicy.org/downloads/2018/08/16-1-teacher-supply.pdf
Fowler, W., & Walberg, H. (1991). School size, characteristics, and outcomes. Educational
Evaluation and Policy Analysis, 13(2), 189-202. http://0-
www.jstor.org.library.uark.edu/stable/1164583
Gion, C., McIntosh, K., & Smolkowski, K. (2018). Examination of American Indian/Alaska
native school discipline disproportionality using the vulnerable decision points
approach. Behavioral Disorders, 44(1), 40-52. http://0-
dx.doi.org.library.uark.edu/10.1177/0198742918773438

170
Girvan, E. J., Gion, C., McIntosh, K., & Smolkowski, K. (2017). The relative contribution of
subjective office referrals to racial disproportionality in school discipline. School
Psychology Quarterly, 32(3), 392–404, https://0-doi-
org.library.uark.edu/10.1037/spq0000178
Greenwald, A.G., McGhee, D.E., & Schwartz, J.L. (1998). Measuring individual differences in
implicit cognition: The implicit association test. Journal of Personality and Social
Psychology, 74(6), 1464 – 1480. https://0-doi-org.library.uark.edu/10.1037/0022-
3514.74.6.1464
Gregory, A., & Weinstein, S. R. (2008). The discipline gap and African Americans: Defiance or
cooperation in the high school classroom. Journal of Social Psychology, 46, 455 - 475.
https://doi.org/10.1016/j.jsp.2007.09.001
Gregory, A., Skiba, R. J., & Noguera, P. A. (2010). The achievement gap and the discipline
gap: Two sides of the same coin? Educational Researcher, 39(1), 59. http://0-
search.proquest.com.library.uark.edu/docview/216910683?accountid=8361
Gullo, G., Capatosto, K., Staats, C. (2019). Implicit Bias in Schools. Routledge.
Harvard Law School Mississippi Delta Project. (2014, Spring). Implementing positive behavior
systems in rural schools: A discipline intervention for the Quitman County School
District. https://www.pdffiller.com/jsfiller-
desk18/?projectId=373455684#92eb8596a1784d8f04d27611e7e38d36
IDEA Data Center (May, 2014). Methods for Assessing Racial/Ethnic Disproportionality in
Special Education: A Technical Assistance Guide (Revised). Westat.
Johnson, A. D., Anhalt, K., & Cowan, R. J. (2018). Culturally responsive school-wide positive
behavior interventions and supports: A practical approach to addressing disciplinary
disproportionality with African-American students. Multicultural Learning and
Teaching, 13(2) http://0-dx.doi.org.library.uark.edu/10.1515/mlt-2017-0013
Joyce, B., & Showers, B. (2002). Student achievement through staff development.
https://0-ebookcentral-proquest-com.library.uark.edu
Kramarczuk V.C., Fergus, E., & King T.K.A. (2017). Pursuing Equity:
Disproportionality in special education and the reframing of technical solutions to
address systemic inequities. Review of Research in Education, 41(1), 61–87.
https://doi.org/10.3102/0091732X16686947
Lavalley, M. (2018). “Out of the Loop.” National School Board Association: Center for Public
Education. January 2018. https://cdn-files.nsba.org/s3fs-public/10901-
5071_CPE_Rural_School_Report_Web_FINAL.pdf

171
Lindsay, C.A. & Hart, C.M.D. (2017). Exposure to same-race teachers and student disciplinary
outcomes for Black students in North Carolina. Educational Evaluation and Policy
Analysis 39(3), 485-510. https://doi.org/10.3102/0162373717693109
Loeber, R., & Schmaling, K. B. (1985a). Empirical evidence for overt and covert patterns of
antisocial conduct problems: A meta-analysis. Journal of Abnormal Child Psychology,
13, 337-352. https://doi.org/10.1007/BF00910652
Losen, D. (2011). Discipline policies, successful schools, and racial justice.
National Education Policy Center. http://escholarship.org/uc/item/4q441361g.
Losen, D. J., & Gillespie, J. (2012). Opportunities suspended: The disparate impact of
disciplinary exclusion from school. Center for Civil Rights Remedies at The Civil Rights
Project at UCLA. https://www.semanticscholar.org/paper/Opportunities-Suspended%3A-
The-Disparate-Impact-of-Losen-
Gillespie/4059446619020f023fe0897bdeeb357709f8fa5d
Losen, D. J, & Skiba, R. J. (2010). Suspended education: Urban middle schools in crisis. UCLA:
The Civil Rights Project / Proyecto Derechos Civiles.
https://escholarship.org/uc/item/8fh0s5dv
Mallett, C. A. (2016). The School-To-Prison Pipeline: A Comprehensive Assessment.
Springer Publishing Company. http://0-
search.ebscohost.com.library.uark.edu/login.aspx?direct=true&db=nlebk&AN=1081574
&site=ehost-live&scope=site
Marzano, R. J., Warrick, P., & Simms, J.A. (2014). A handbook for High Reliability Schools:
The next step in school reform. Marzano Research.
McIntosh, K., Barnes, A., Eliason, B., & Morris, K. (2014). Using discipline data within
SWPBIS to identify and address disproportionality: A guide for school teams. OSEP
Technical Assistance Center on Positive Behavioral Interventions and Supports.
www.pbis.org.
McKintosh, K., Girvan, E. J., Horner, R. H., Nese, R. N. & Smolkowski, K. (2016). Vulnerable
decision points for disproportionate office discipline referrals: Comparisons of discipline
for African American and white elementary students. Behavioral Disorders, 41(4), 178-
195. http://0-search.proquest.com.library.uark.edu/docview/1819652819?accountid=8361
McIntosh, K.E.K., McCall, L., & Girvan, E. J. (2018). Using Discipline Data to
Enhance Equity in School Discipline. Intervention in School and Clinic, 53(3), 146–152.
doi: https://doi.org/10.1177/1053451217702130

172
McKintosh, K., Girvan, E. J., Horner, R. H. & Smolkowski, K. (2014). Education not
incarceration: A conceptual model for reducing racial and ethnic disproportionality in
school discipline. Journal of Applied Research on Children, 5(2), 1-22.
http://digitalcommons.library.tmc.edu/childrenatrisk/vol5/iss2/4
McIntosh, K., Girvan, E. J., Horner, R. H., Smolkowski, K., & Sugai, G. (2014).
Recommendations for addressing discipline disproportionality in education. OSEP
Technical Assistance Center on Positive Behavioral Interventions and Supports.
https://www.txbehaviorsupport.org/Assets/recommendations-for-addressing-discipline-
disprop.pdf
Morse, J. M. (1991). Approaches to qualitative-quantitative methodological triangulation.
Nursing Research, 40(1), 120 – 123. https://www.ncbi.nlm.nih.gov/pubmed/2003072
Nathan, B., McEachin, A., Mills, J.N., & Valant, J. (2017). Disparities in student discipline by
race and family income. Education Research Alliance, Technical Report.
https://educationresearchalliancenola.org/files/publications/010418-Barrett-McEachin-
Mills-Valant-Disparities-in-Student-Discipline-by-Race-and-Family-Income.pdf
Nelson, S.W. and Guerra, P.L. (2014). Educator beliefs and cultural knowledge: Implications for
school improvement efforts. Educational Administration Quarterly 2014, Vol. 50(1) 67-
95. https://uark.summon.serialssolutions.com/2.0.0/link?t=1575162383910
Nishioka, V. (with Shigeoka, S., & Lolich, E.). (2017). School discipline data indicators: A
guide for districts and schools (REL 2017–240). U.S. Department of Education, Institute
of Education Sciences, National Center for Education Evaluation and Regional
Assistance, Regional Educational Laboratory Northwest.
https://files.eric.ed.gov/fulltext/ED573680.pdf
Noltemeyer, A., & Mcloughlin, C. S. (2010). Patterns of exclusionary discipline by school
typology, ethnicity, and their interaction. Perspectives on Urban Education, 7(1), 27–40.
https://files.eric.ed.gov/fulltext/EJ894465.pdf
Pearson, A. R., Dovidio, J. F., & Gaertner, S. L. (2009). The nature of contemporary prejudice:
Insights from aversive racism. Social and Personality Psychology Compass, 3, 314 –338.
http://dx.doi .org/10.1111/j.1751-9004.2009.00183.x
Peer, D. (2012). "Master principals' perceptions of the impact of the Arkansas leadership
academy's master principal program on leadership practices, school cultures and student
achievement" Theses and Dissertations. 617. https://scholarworks.uark.edu/etd/617
Peguero, A. A., Ovink, S. M., & Li, Y. L. (2016). Social bonding to school and educational
inequality: Race/ethnicity, dropping out, and the significance of place. Sociological
Perspectives, 59(2), 317–344. https://doi.org/10.1177/0731121415586479

173
Ravitch, S.M. & Carl, N. M. (2016). Qualitative Research: Bridging the Conceptual,
Theoretical, and Methodological. Sage Publications, Inc.
Sacks, V. & Murphey, D. (2018). The prevalence of adverse childhood experiences,
nationally, by state, and by race or ethnicity. Child Trends Research Brief #2018-
03. https://www.childtrends.org/wp-
content/uploads/2018/02/ACESBriefUpdatedFinal_ChildTrends_February2018.pdf
Seidman, I. (2013). Interviewing as qualitative research: A guide for researchers in the
education and the social sciences (4th ed.) Teachers College Press.
Sensoy, O. & DiAngelo, R. Is Everyone Really Equal? An Introduction to Key Concepts in
Social Justice Education (Second Edition). Teachers College Press.
Simson, D. (2014). Exclusion, Punishment, Racism and Our Schools: A Critical Race Theory
Perspective on School Discipline. UCLA Law Review, 61(2), 506–563.
http://0-search.ebscohost.com.library.uark.edu/login.aspx?direct=true&db=bsu&AN=103
535974&site=ehost-live&scope=site
Skiba, R. J., Chung, C. G., Trachok, M., Baker, T. L., Sheya, A., & Hughes, R. L. (2014) Parsing
disciplinary disproportionality: Contributions of infraction, student, and school
characteristics to out-of-school suspension and expulsion. American Educational
Research Journal, 51 (4), 640 - 670. https://0-doi-
org.library.uark.edu/10.3102/0002831214541670
Skiba, R. J., Horner, R. H., Chung, C. G., Rausch, M. K., May, S. L., & Tobin, T. (2011). Race
is not neutral: A national investigation of African American and Latino disproportionality
in school discipline. School Psychology Review, 40(1), 85-107. https://0-search-proquest-
com.library.uark.edu/docview/860230091?pq-origsite=summon
Skiba, R. J., Michael, R. S., Nardo, A. C. & Peterson, R. L. (2002). The color of discipline:
Sources of racial and gender disproportionality in school punishment. The Urban Review,
34, 317-342. https://doi.org/10.1023/A:1021320817372.
Skiba, R. J., Poloni-Staudinger, L., Simmons, A. B., Feggins-Azziz, L., & Chung, C. (2005).
Unproven links: Can poverty explain ethnic disproportionality in special education? The
Journal of Special Education, 39(3), 130-144. http://0-
dx.doi.org.library.uark.edu/10.1177/00224669050390030101
Stake, R. E. (1995). The art of case study research. Sage Publications, Inc.
State of Arkansas (2013). Act 1329: An act to evaluate the impact of school discipline on student
achievement; and for other purposes.
http://www.arkleg.state.ar.us/assembly/2013/2013R/Acts/Act1329.pdf

174
State of Arkansas (2019). Act 557: To prohibit the use of corporal punishment on a child with a
disability. http://staging.arkleg.state.ar.us/ftproot/bills/2019R/public/SB381.pdf
State of Arkansas (2017). Act 1015: To amend provisions to the Arkansas code concerning
effective school discipline.
http://www.arkleg.state.ar.us/assembly/2017/2017R/Amendments/HB1859-H1.pdf
State of Arkansas (2017). Act 1059: An act to amend provisions of Title 6 of the Arkansas code
concerning discipline of students in public schools and for other purposes.
http://www.arkleg.state.ar.us/assembly/2017/2017R/Acts/Act1059.pdf
Tajalli, H., & Garba, H. A. (2014). Discipline or prejudice? Overrepresentation of minority
students in disciplinary alternative education programs. The Urban Review, 46(4),
620-631. http://0-dx.doi.org.library.uark.edu/10.1007/s11256-014-0274-9
Tieken, M.C. (2014). Why Rural Schools Matter. North Carolina Press.
Townsend, B.L. (2000). The disproportionate discipline of African-American learners: Reducing
school suspensions and expulsions. Exceptional Children, 66, 381-391. http://0-
search.proquest.com.library.uark.edu/docview/201092878?accountid=8361
U.S. Commission on Civil Rights (2019). Beyond Suspensions: Examining school discipline
policies and connections to the school-to-prison pipeline for students of Color with
disabilities. https://www.usccr.gov/pubs/2019/07-23-Beyond-Suspensions.pdf
U.S. Department of Education, Arkansas Compilation of School Discipline Laws and
Regulations, April 2019.
https://safesupportivelearning.ed.gov/sites/default/files/discipline-
compendium/Arkansas%20School%20Discipline%20Laws%20and%20Regulations.pdf
U.S. Department of Education, Office for Civil Rights (2018) 2015-2016 Civil Rights Data
Collection: School Climate and Safety, 2018,
https://www2.ed.gov/about/offices/list/ocr/docs/school-climate-and-safety.pdf
U.S. Department of Education, Office for Civil Rights (2014). Discipline Snapshot: School
Discipline, Issue Brief No. 1 (Washington DC: Department of Education).
https://ocrdata.ed.gov/downloads/crdc-school-discipline-snapshot.pdf
U.S. Department of Justice Civil Rights Division and U.S. Department of Education Office of
Civil Rights. Joint “Dear Colleague” Letter. Jan. 8, 2014.
https://www2.ed.gov/about/offices/list/ocr/letters/colleague-201401-title-vi.html
U.S. Federal Commission on School Safety. Final Report, December 18, 2018.
https://www2.ed.gov/documents/school-safety/school-safety-report.pdf

175
Wald, J. & Losen, D.J. (2003). Defining and redirecting a school-to-prison pipeline. New
Directions for Youth Development, 2003(99), 9-15. https://doi.org/10.1002/yd.51
Wallace, J. M., Jr, Goodkind, S., Wallace, C. M., & Bachman, J. G. (2008). Racial, ethnic, and
gender differences in school discipline among U.S. high school students: 1991-2005.
Negro Educational Review, 59(1), 47-62,125-126.
http://0-search.proquest.com.library.uark.edu/docview/219037950?accountid=8361
Warren, M.R., Hong, S., Rubin, C.L. and Uy, P.S. (2009). Beyond the bake sale: A community-
based relational approach to parent engagement in schools. Teachers College Record
111(9): 2209-54. http://www.lsna.net/uploads/lsna/documents/beyond_the_bake_sale.pdf
Whitford, D. K. (2017). School discipline disproportionality: American Indian students in special
education. The Urban Review, 49(5), 693-706. http://0-
dx.doi.org.library.uark.edu/10.1007/s11256-017-0417-x
Williams, N. A. (2015). “Are the racial disparities in school discipline the result of or a function
of systemic racism mediated by educators' dispositions?” Theses and Dissertations
http://0-search.proquest.com.library.uark.edu/docview/1732677715?accountid=8361
Welch, K., & Payne, A. (2010). Racial threat and punitive school discipline. Social
Problems, 57(1), 25-48. https://doi.org/10.1525/sp.2010.57.1.2

176
Appendix A: Interview Protocols
Interview 1
Research Questions:
1. How is discipline disproportionality perceived in a specific rural school setting from the
building-level administrator’s perspective?
2. From a building-level administrator’s perspective, what factors are most influential in
explaining discipline disproportionality in a rural school setting?
● Tell me about your experience as a school administrator.
Years in this school
Educational background – preparation to be an admin.
Are you from this community? Live in the community? How long have you been
a part of it?
Why did you decide to become an administrator?
● Tell me about your community.
Would you classify it as rural? If so, what makes it rural?
How do you think being a rural community impacts your school?
What are the most positive aspects of your community?
What challenges does your community face?
What makes your community unique from other communities in this region?
How would you describe how your community perceives education?
Does your community support your school?
● Tell me about your school.

177
Demographics of staff and students
Do the demographics of your school match those of the community? If not, why?
How well does the makeup of your staff represent the demographics of your
student body? Do you believe this has an effect on your school?
Free/reduced lunch rate
What cultures are represented among students and staff?
Describe any patterns you see with different culture groups.
In what ways do you honor differences among cultures in your school?
● What is your school’s approach to student discipline?
Goals?
Who is responsible for discipline in your school?
Describe your discipline system and consequences. Which consequences do you
give most often?
How do you think the staff perceives discipline?
Do you think that your school’s classification as rural impacts student discipline?
If so, how?
Reconstruct a discipline issue that stands out in your mind. Detail how you
handled it, from start to finish.
Do you do anything differently for students with recurring infractions?
How do you involve parents in student discipline?
Are there mandated consequences for discipline actions? If so, what are they?
Who created your system? What is it based on?
What is your opinion on zero tolerance policies for student discipline?
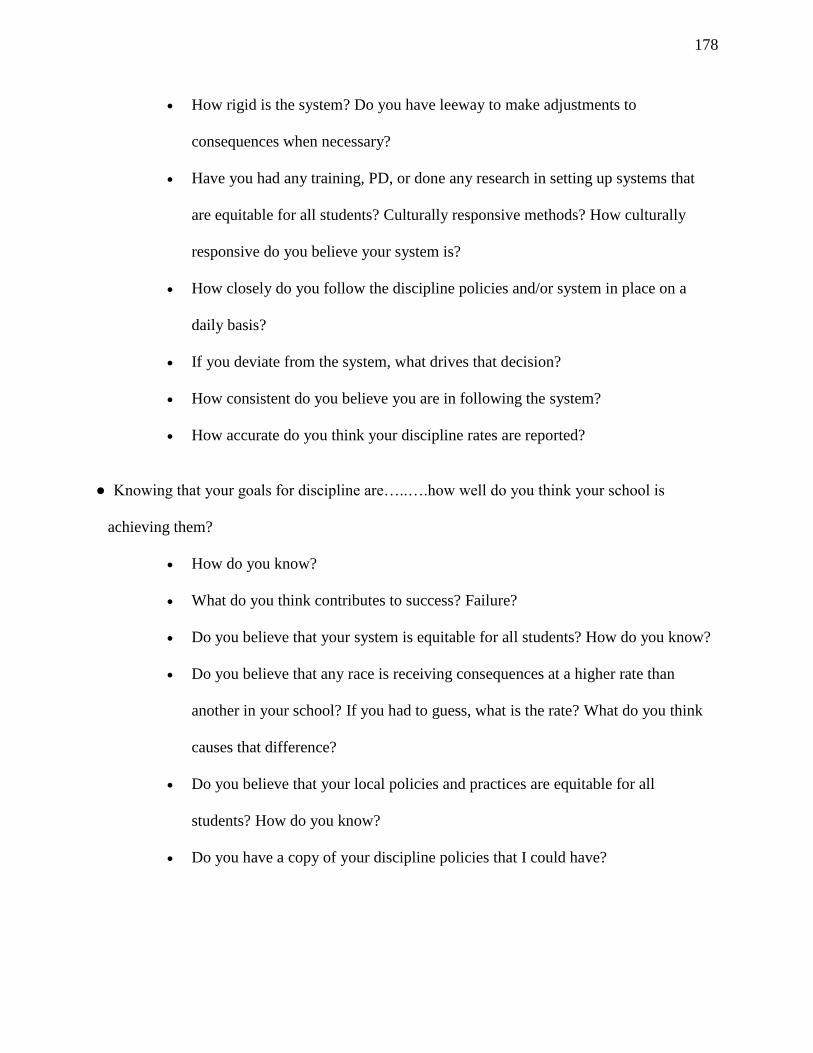
178
How rigid is the system? Do you have leeway to make adjustments to
consequences when necessary?
Have you had any training, PD, or done any research in setting up systems that
are equitable for all students? Culturally responsive methods? How culturally
responsive do you believe your system is?
How closely do you follow the discipline policies and/or system in place on a
daily basis?
If you deviate from the system, what drives that decision?
How consistent do you believe you are in following the system?
How accurate do you think your discipline rates are reported?
● Knowing that your goals for discipline are…..….how well do you think your school is
achieving them?
How do you know?
What do you think contributes to success? Failure?
Do you believe that your system is equitable for all students? How do you know?
Do you believe that any race is receiving consequences at a higher rate than
another in your school? If you had to guess, what is the rate? What do you think
causes that difference?
Do you believe that your local policies and practices are equitable for all
students? How do you know?
Do you have a copy of your discipline policies that I could have?

179
Interview 2
Research Questions:
1. How is discipline disproportionality perceived in a specific rural school setting from the
building-level administrator’s perspective?
2. From a building-level administrator’s perspective, what factors are most influential in
explaining discipline disproportionality in a rural school setting?
Review informed consent and gain agreement verbally.
I shared with you the transcript from your first interview. Is there anything in there you
want to clarify or provide more information on? Remind if there is, they can always
contact me.
Discuss discipline data from 17/18.
o Pulled from ADE reports.
o Restricted values – had to calculate based on difference and evenly divide among
categories. Not exact numbers for most, but close.
Infractions:
o Who determines the code for an infraction?
o What do you classify as Insubordination? Can you give me an example?
o What do you consider Disorderly Conduct? Example?
o What do you consider a fight? Example?
o What is included in the Other category? Example?
Actions: What does the Other category mean?

180
o Do parents have an option to refuse certain types of discipline action such as CP?
If so, what is their other option?
Data (Specific questions were tailored to each school’s data. These questions were used
for Middle B’s principal based on his data).
o I noticed there is a 7% difference between B population and infractions. Does that
surprise you? Any thoughts on the cause?
o There is a -5% difference between W population and infractions. What do you
think is causing that difference?
o When looking across the table at infractions, the numbers for each type of
infraction are almost proportionate when compared to the percentage of the
population they represent. What do you think explains this?
o The percentage of Black students for fighting and bullying is somewhat higher
than for insubordination and disorderly conduct. Thoughts?
o It looks like ISS is used most frequently for discipline action. Can you explain
why ISS is used often?
Now let’s talk about students with recurring infractions.
o How do you define a chronic offender? How many referrals before you consider
them one?
o How do you track students with recurring infractions? How quickly are you aware
that they’ve reached a certain number of referrals? Is there a report that you pull
from your data to help?
o What impact do you believe students with recurring infractions have on this data
set?

181
Big picture
o After looking at this data, what are your thoughts on discipline and
disproportionality?
o How do you define disproportionality in discipline?
o What do you believe are the biggest factors causing disproportionality in your
school?
o How do you think these factors differ in rural schools vs. urban? Or do they?
o What actions will you take as a result of analyzing your data?
o Your school’s data is most definitely an outlier in my data set. Of the five schools
studied, yours is the only one where the percentage of Black students being
referred and receiving discipline actions was lower than the percentage of white
students, regardless of the population. Why do you think this is?

182
Appendix B: Codebook
Code Description
COMMUNITY
Community Support Responses related to how the community provides support to the schools, or how the school gives back in the community.
Features of Rural Features of the participants' rural communities that they believe contribute to their designation as rural.
Racial Tension Responses that indicate conflict in school and community among races
DEMOGRAPHICS
Poverty Responses reflect how poverty impacts their school and students.
Staff Demographics Descriptions of staff demographics
Student Demographics Descriptions of student demographics EQUITY
Equity Responses that reflect issues of equity related to student discipline in the school
IMPACT OF STUDY
Impact of study Responses that reflect changes because of participation in the study
EXTERNAL SUPPORT
Juvenile Court Responses that describe court involvement and how they view their support.
Mental Health Responses that describe how they utilize outside mental health providers to support students with discipline issues.
Professional Development
Responses that describe how schools utilize outside support for professional development of teachers and leaders.
PARENT
Parent Apathy Responses that describe parent involvement that principals perceive as being apathetic.
Parent Barrier Responses that describe things that get in the way of true parent support of the school.
Parent Support Responses that describe how parents provide support to the school.
PRINCIPAL
Principal Aware of Disproportionality
Responses describe disproportionalities principals are aware of related to their schools.

183
Code Description
Principal Culturally Aware
Responses describe cultural differences between racial groups from the principal's perspective.
Principal Barrier Responses describe principal barriers to equitable outcomes for all students.
Principal Path to Administration
Response describe how they came to be administrators in their district.
Taking Action: Creating Culture
Responses describe actions taken by the principal to intentionally create a culture in the school.
Taking Action: Designing Interventions
Responses describe actions taken by the principal to design interventions to support students in discipline.
Taking Action: Hiring Practices
Responses describe actions taken by the principal to recruit Black teachers for their school.
Taking Action: Passive
Responses describe actions that could be taken to address issues of equity, but they haven't been or should be done by someone else.
Taking Action: Professional Development
Responses describe actions taken by the principal to implement professional development for their teachers related to student discipline.
Taking Action: Redesigning System
Responses describe actions taken by the principal to redesign the discipline system for greater effectiveness and equity.
RELATIONSHIPS
Relationships with Families
Responses describe ways the school builds relationships with families of students.
Relationships with Staff Responses describe ways the principal builds relationships with staff members.
Relationships with Students
Responses describe ways that principals build relationships with students.
SCHOOLWIDE DISCIPLINE SYSTEM (SWDS)
SWDS: Students with Recurring Infractions
Responses describe what constitutes a chronic offender and how they handle them.
SWDS: Discipline Actions
Responses describe discipline actions that principals routinely use for student infractions.
SWDS: Discipline Data Responses describe types of discipline data principals use and their awareness of actual rates.
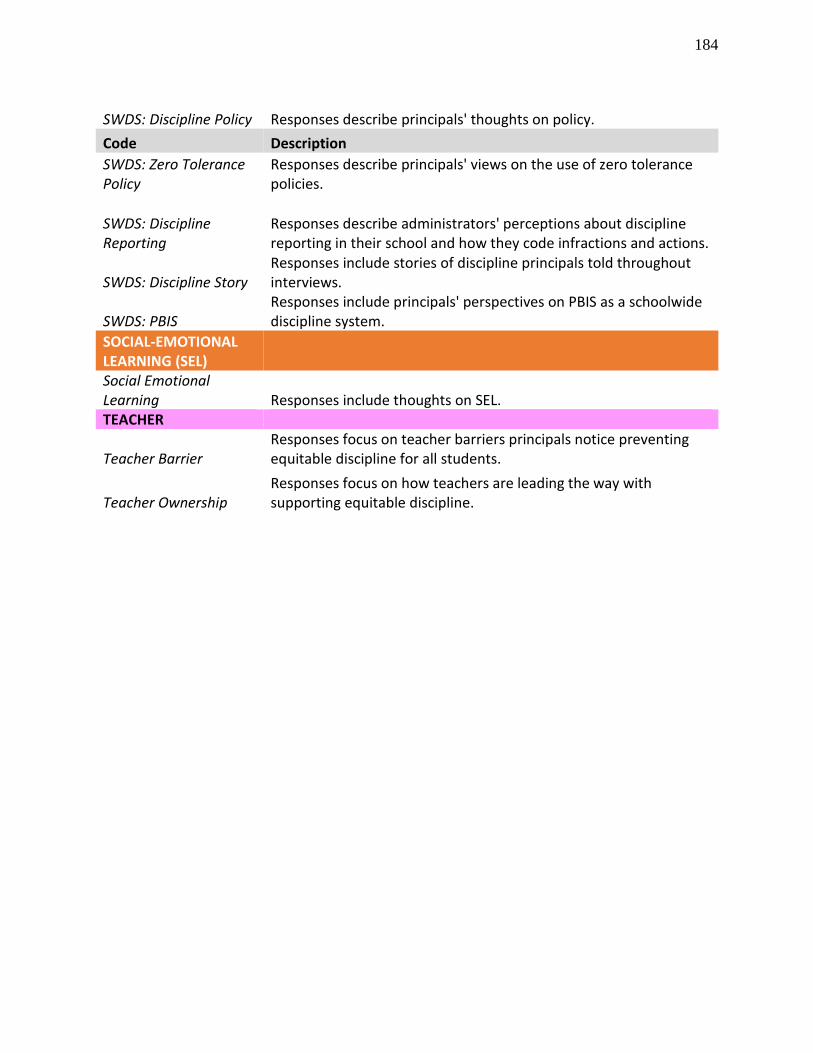
184
SWDS: Discipline Policy Responses describe principals' thoughts on policy.
Code Description
SWDS: Zero Tolerance Policy
Responses describe principals' views on the use of zero tolerance policies.
SWDS: Discipline Reporting
Responses describe administrators' perceptions about discipline reporting in their school and how they code infractions and actions.
SWDS: Discipline Story Responses include stories of discipline principals told throughout interviews.
SWDS: PBIS Responses include principals' perspectives on PBIS as a schoolwide discipline system.
SOCIAL-EMOTIONAL LEARNING (SEL) Social Emotional Learning Responses include thoughts on SEL. TEACHER
Teacher Barrier Responses focus on teacher barriers principals notice preventing equitable discipline for all students.
Teacher Ownership Responses focus on how teachers are leading the way with supporting equitable discipline.

185
Appendix C: Informed Consent
186

187
Appendix D: IRB Approval Letter

188
Appendix E: Implicit Association Test
The Implicit Association Test is a measure of the strength of associations between
concepts and evaluations or stereotypes. The test is available online for free and is the most
widely used instrument for implicit bias in education today (Gullo et. al, 2019). In the test, users
are shown stimuli and asked to categorize each based on categories on either the left or right-side
of the screen by clicking either the “e” or “i” key. There are five tasks within the test, including
the following: word sort, image sort, combined image and word sort, reversed image sort, and
reversed combined image and word sort. The reversal of the order of concepts for the final two
tasks reduces the effect of practice on results (Greenwald, McGhee, & Schwartz, 1998).
Bias is measured by the response times for how quickly associations are formed. For
example, if the concept is ladybugs versus spiders, and the user is quicker to associate ladybugs
(than spiders) with positive words like “pleasant” or “good” and slower to associate them with
negative words, then this would reveal a pro-ladybug bias. If the ladybugs and spiders are
replaced instead with words like “black” and “white” and the images are of black and white
faces, the test can be used to determine a user’s preferences for race. A key assumption made for
the test is that users prefer the concepts they associate with positive words. Because of the
availability of the test and its wide use, its consistency and accuracy is well-established. The test
is available for free at https://implicit.harvard.edu/implicit/takeatest.html.