how does deposit insurance affect bank risk?...
TRANSCRIPT

1
How Does Deposit Insurance Affect Bank Risk? Evidence from the Recent
Crisis
Deniz Anginer, Asli Demirguc-Kunt, Min Zhu1
August, 2013
Abstract
Deposit insurance is widely offered in a number of countries as part of a financial system safety
net to promote stability. An unintended consequence of deposit insurance is the reduction in the incentive
of depositors to monitor banks which lead to excessive risk-taking. We examine the relation between
deposit insurance and bank risk and systemic fragility in the years leading up to and during the recent
financial crisis. We find that generous financial safety nets increase bank risk and systemic fragility in the
years leading up to the global financial crisis. However, during the crisis, bank risk is lower and systemic
stability is greater in countries with deposit insurance coverage. Our findings suggest that the “moral
hazard effect” of deposit insurance dominates in good times while the “stabilization effect” of deposit
insurance dominates in turbulent times. The overall effect of deposit insurance over the full sample we
study remains negative since the destabilizing effect during normal times is greater in magnitude
compared to the stabilizing effect during global turbulence. In addition, we find that good bank
supervision can alleviate the unintended consequences of deposit insurance on bank systemic risk during
good times, suggesting that fostering the appropriate incentive framework is very important for ensuring
systemic stability.
JEL Classifications: G21, G28
Keywords: Bank risk, systemic risk, deposit insurance, bank supervision and regulation, financial crisis.
1 Anginer, World Bank, [email protected]; Demirguc-Kunt, World Bank, [email protected]; Zhu, World Bank, [email protected]. This paper’s findings, interpretations and conclusions are entirely those of the authors and do not necessarily represent the views of the World Bank, their Executive Directors, or the countries they represent.
2
1. Introduction
In response to the global financial crisis, a number of countries substantially increased the
coverage of their financial safety nets in order to restore market confidence and to avert potential
contagious runs on their banking sectors. This has rekindled the debate on the impact of deposit
insurance on banking sector stability and performance. While previous studies suggest that
deposit insurance exacerbates moral hazard problems in bank lending and is associated with
higher likelihood of banking crisis (Demirguc-Kunt and Detragiache 2002), to the best of our
knowledge, there is no study that examines the impact of deposit insurance on bank risk and
stability during a period of global financial instability. This is an important gap in the literature
since economic theories suggest that deposit insurance brings both benefits and costs that are
likely to vary with economic conditions. That is, while deposit insurance can increase moral
hazard and make financial systems more vulnerable to crises during good times, it can also
enhance depositor confidence and reduce the likelihood of contagious bank runs during turbulent
periods such as the recent global financial crisis. The net effect of deposit insurance on bank risk
and stability, therefore, depends on whether the benefits of deposit insurance can outweigh its
costs.
In this paper, we take advantage of the global financial crisis and study whether deposit
insurance schemes have a stabilizing effect during financially turbulent periods. Specifically,
using a sample of 4,109 publicly traded banks in 96 countries, we examine the impact of deposit
insurance on bank risk and systemic stability separately for the crisis period from 2007 to 2009,
as well as the three years from 2004 to 2006 leading up to the global financial crisis. We use z-
score and stock return volatility to measure standalone risk of an individual bank, and the
marginal expected shortfall (MES) of Acharya, Engle and Richardson (2012) to measure the risk
posed by an individual bank to the banking system as a whole. We find that generous financial
safety nets increase bank risk and reduce systemic stability in non-crisis years. However, bank
risk is lower and systemic stability is greater during the global financial crisis in countries with
deposit insurance coverage. Nevertheless, the overall effect of deposit insurance over the full
sample we study remains negative since the destabilizing effect during normal times is greater in
magnitude compared to the stabilizing effect during global turbulence. Consistent with the prior
literature, we also find that good supervision can enhance the positive effects of deposit
insurance during turbulent periods and dampen the negative effects due to moral hazard during
3
normal times. Our findings offer new insights into the effect of deposit insurance on banking
sector stability and have important policy implications for the design of banking sector
regulation and supervision.
Starting with Merton (1977), a number of theoretical papers have studied the relationship
between deposit insurance and banking sector stability.2 Deposit insurance protects the interests
of unsophisticated depositors and helps prevent bank runs which can improve social welfare.
This positive stabilization effect of deposit insurance is, naturally, more important during
economic downturns when contagious bank runs are more likely to occur. Consistent with this
view, Gropp and Vesala (2004) show that the adoption of deposit insurance is associated with
lower bank risk in the European Union. Chernykh and Cole (2011) also document that the
adoption of deposit insurance in Russia is associated with better financial intermediation. Karels
and McClatchey (1999) find stabilization effects from the adoption of deposit insurance for US
credit unions.
There is also considerable consensus in the literature that deposit insurance exacerbates
moral hazard problems in the banking sector by incentivizing banks to take on excessive risk.
Depositors can limit bank risk taking by charging higher interest rates. When deposits are
insured, however, bank depositors lack incentives to monitor (Demirguc-Kunt and Huizinga
2004 and Ioannidou and Penas 2010). The lack of market discipline leads to excessive risk taking
culminating in banking crises. Demirguc-Kunt and Detragiache (2002), Demirguc-Kunt and
Kane (2002) and Barth, Caprio and Levine (2004) find supportive evidence for this view.
Moreover, critics of deposit insurance, argue that the government may lack the resources,
information or incentives to correctly assess bank risk and charge deposit insurance premium
accordingly. Any risk based premium charged may be deemed “unfair” leading to distortions and
inefficiencies in the banking sector.
A number of papers have emphasized how design features of deposit insurance schemes
and the larger institutional environment may affect the relationship between deposit insurance
and banking risk and bank system fragility. In poor institutional settings, generous design
features tends to destabilize the banking system and to undermine market discipline. Hovakimian,
Kane and Laeven (2003) and Laeven (2002) show that weak institutional environments
2 See Morrison and White (2011) for recent development in the theoretical literature and references therein. The focus of the theoretical literature seems to be the design of the optimal deposit insurance scheme.

4
undermine deposit-insurance design. Cull, Senbet and Sorge (2004) produce evidence that, in
weak institutional environments deposit insurance reduces financial development. Features of a
country’s private and public contracting environments have been shown to be important in
deposit-insurance adoption and design (Demirgüç-Kunt and Kane, 2002).
In this paper we test to see if the impact of deposit insurance on bank risk and systemic
stability is different during normal times and during crises periods. It is possible that the positive
stabilization effects of deposit insurance can dominate the negative moral hazard effects during
economic downturns. During downturns banks may face tightened funding and limited
investment opportunities, leaving little room for excessive risk taking. Deposit insurance can
then help enhance depositor confidence and prevent systemic bank runs during the crisis, leading
to lower risk and greater systemic stability. During non-stress periods, however, the reverse
could be true since there would be plenty of investment opportunities and little need for
preventing bank runs. Alternatively, deposit insurance could also be a destabilizing (or
stabilizing) influence throughout the whole sample period.
For a sample of 4,109 banks in 96 countries over the time period 2004-2009, we find
supportive evidence that the influence of deposit insurance on bank risk is different during
normal periods and during systemic downturns. Specially, we show that existing deposit
insurance coverage is associated with lower systemic stability and higher bank risk in the 2004-
2006 pre-crisis period. However, the relationship between deposit insurance and bank risk and
systemic stability is reversed in the 2007-2009 crisis period. Nevertheless, the overall effect of
deposit insurance over the full sample we study remains negative since the destabilizing effect
during normal times is greater in magnitude compared to the stabilizing effect during global
turbulence.
Our paper is related to Demirguc-Kunt and Detragiache (2002), which studies the link
between deposit insurance and the occurrence of banking crisis. Unlike Demirguc-Kunt and
Detragiache (2002) who focus on the likelihood of crisis of a particular country, we study the
impact of deposit insurance on bank risk and system stability during a global crisis period and
compare it to normal times. Our paper is also related to Fahlenbrach, Prilmeier, and Stulz (2011)
and Beltratti and Stulz (2012), who investigate the determinants of bank performance during the
recent crisis. While their focus is on bank characteristics that affect performance, we focus on the
effect of deposit insurance on bank risk and stability. We also add to the literature that has

5
shown that features of a country’s private and public contracting environment to be important in
deposit-insurance adoption, design and performance (see for instance, Demirgüç-Kunt and Kane
2002). We show that good supervision can affect the state-varying benefits and costs of deposit
insurance. Strong supervision and regulation can enhance the stabilization effects during crisis
periods while dampening the negative effects associated with moral hazard during normal times.
While there is widespread agreement in the academic literature that deposit insurance
affects bank risk through two channels, stabilization and moral hazard, our paper is the first to
document that the net impact of deposit insurance varies with the relative importance of these
two effects. Our results indicate that deposit insurance indeed enhanced depositor confidence and
had positive stabilization effects during the recent global financial crisis, albeit having
contributed to the occurrence of the crisis in the first place, with an overall destabilizing effect
over the full sample. Our findings also emphasize the role of regulation and supervision in the
effectiveness of deposit insurance schemes by maximizing the benefits of deposit insurance
while minimizing costs associated with incentives and moral hazard.
The rest of the paper is organized as follows. Section 2 describes the construction of the
sample and variables. Section 3 presents the empirical results and discusses the implications.
Section 4 concludes.
2. Data
2.1. Sample and Bank Level Variables
Our sample consists of all publicly traded banks covered by the Bankscope database. We
use stock market information from Compustat for international banks and stock market
information from CRSP for U.S. banks. The Bankscope database reports detailed balance sheet
and income statement information for both public and private banks and covers over 90% of the
total banking assets in a given country. The Compustat database provides daily stock price
information for both active and delisted companies, accounting for 98% of the global stock
market capitalization. CRSP is the standard source for stock price information of U.S.
companies. Our final sample consists of 4,109 banks in 96 countries over the time period 2004-
2009.
Bank level variables are constructed from the Bankscope database. We follow Laeven
and Levine (2009) to compute z-score which is an accounting based measure of bank risk
6
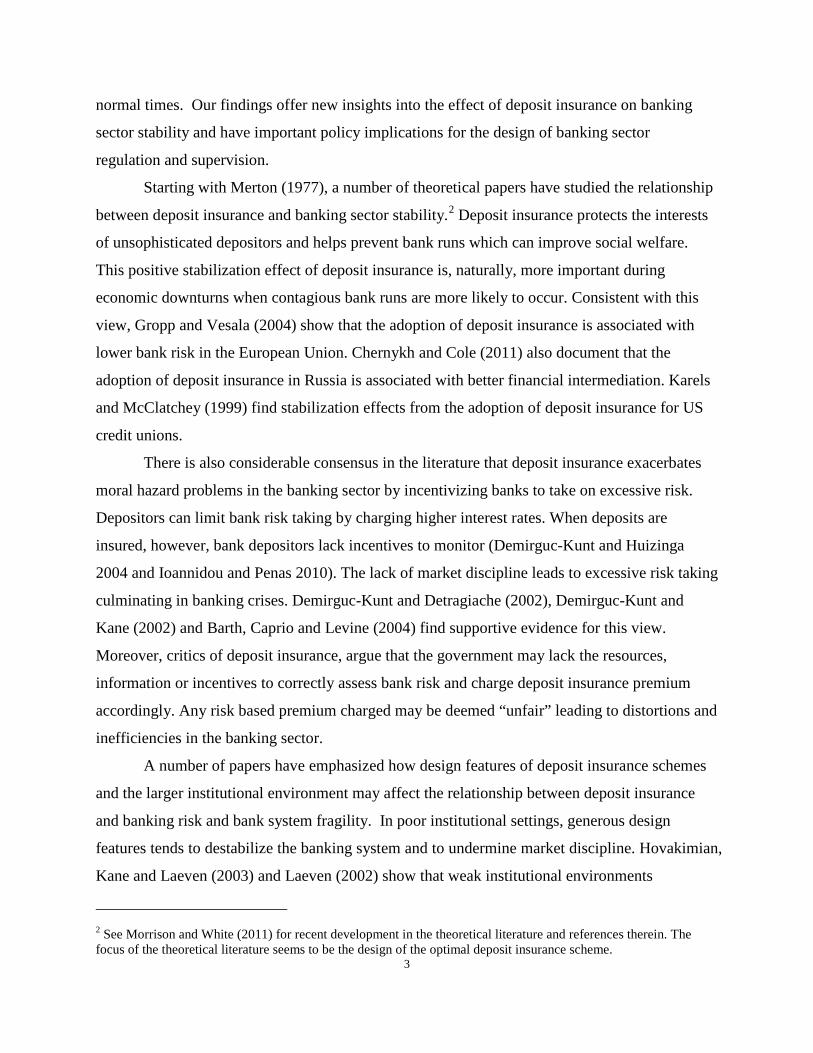
commonly used in the literature. Z-score is calculated as the sum of average bank return on
assets (net income divided by total assets) and bank equity to assets ratio, scaled by the standard
deviation of return on assets over a five-year rolling window. Higher z-score indicates lower
bank risk. We use the natural logarithm of z-score in our regressions because the distribution of
z-score is highly skewed. We also compute an additional measure of bank risk using market
prices. In particular, we use bank stock return volatility to measure bank risk. Bank stock return
volatility is calculated as the standard deviation of bank daily stock returns in a fiscal year.
Higher stock return volatility indicates higher bank risk.
In addition, for each bank, each year, we calculate bank size (natural logarithm of total
assets), leverage (liabilities divided by total assets), provisions (loan loss provisions divided by
total assets), reliance on deposits for funding (deposits divided by total assets), and profitability
(net income divided by total assets) as control variables. We winsorize all financial variables at
the 1st and 99th percentile level of their distributions to reduce the influence of outliers and
potential data errors.
2.2. Systemic Stability Measure
The global financial crisis has led to a re-examination of risk assessment practices and
regulation of the financial system, with a renewed interest in systemic fragility and macro-
prudential regulation. This requires a focus not on the risk of individual financial institutions, but
on an individual bank’s contribution to the risk of the financial system as a whole. Hence, there
is a growing consensus that from a regulatory perspective of ensuring systemic stability, the
correlation in the risk taking behavior of banks is much more relevant than the absolute level of
risk taking in any individual institution. In addition to the bank level standalone measures of risk
we also compute a measure of each bank’s contribution to the system as a whole. Our measure is
based on the expected capital shortfall framework developed by Acharya, Engle and Richardson
(2012).
The systemic expected shortfall of an institution describes the capital shortage a financial
firm would experience in case of a systemic event. It is based on the notion that a shortage of
capital is dangerous for the individual firm, but becomes dangerous for the whole economy if it
occurs just when the rest of the banking sector is also undercapitalized. This measure is meant to
capture how much each firm contributes to the risk of the banking system as a whole. The
7
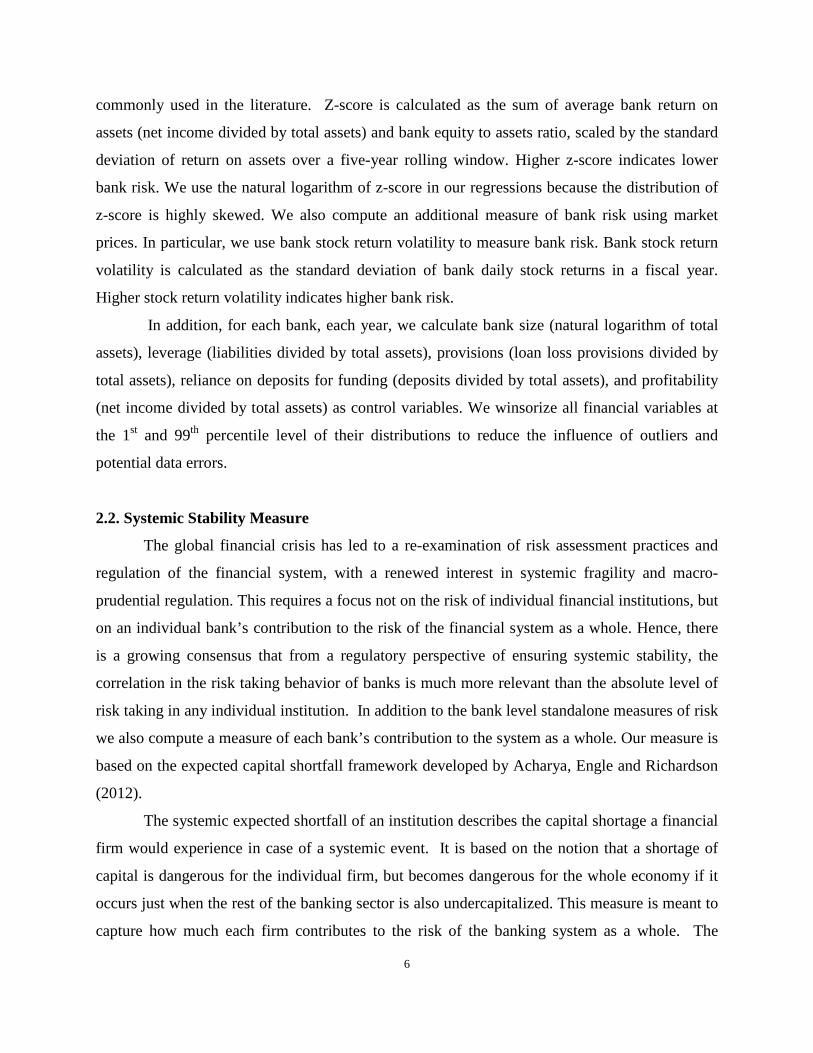
capital short fall depends on the firm’s leverage and equity loss conditional on an aggregate
market decline. Marginal Expected Shortfall (MES) of a firm is the expected loss an equity
investor in a financial firm would experience if the market declined substantially. Following
Acharya et al (2010), we use MES as our systemic risk measure.3 MES measures the average
firm return on days when the market as a whole is in the tail of its loss distribution:
𝑀𝐸𝑆𝑡𝑖 = 𝐸𝑅𝑡𝑖 𝑅𝑡𝑚 < 𝐶 (1)
Above, 𝑅𝑡𝑖 is the financial firm i’s equity return and 𝑅𝑡𝑚 is the aggregate market index return. A
systemic event is defined as a drop of the market index below a threshold, C, over a given time
horizon. The systemic event is thus denoted by 𝑅𝑡𝑚 < 𝐶. Acharya, Engle and Richardson (2012)
show that MES can be used to set capital limits based on systemic risk contributions. Since the
book value of debt will be will be relatively unchanged while equity values fall by MES, a
regulator can require a bank to hold equity to satisfy a prudential capital ratio of k% to make sure
that the systemic risk posed by the bank is zero:
𝐸𝑞𝑢𝑖𝑡𝑦𝑡𝑖 ≥
𝑘 × 𝐷𝑒𝑏𝑡𝑡𝑖
(1 − 𝑘) × 1 + 𝑀𝐸𝑆𝑡𝑖 (2)
We compute MES using a threshold that corresponds to the index at its lowest 5% level over the
previous one year of return data. 4 For this computation we use daily stock returns from
Compustat for international financial firms and daily stock market information from CRSP for
U.S. financial firms. For the aggregate market index, we use the country stock index in which the
financial firm is incorporated.5
3 We have found similar results using the conditional value-at-risk (CoVar) measure of Adrian and Brunnermeier
(2010). 4 We have found similar results using changes in Merton (1970) distance-to-default measure instead of stock market
returns. 5 For Bahrain, Botswana, Egypt, Jordan, Kenya, Kuwait, Lebanon, Morocco, Nigeria, Oman, Qatar, Saudi Arabia,
Tunisia, United Arab Emirates, we use the FTSE Middle East & Africa Index.

8
2.3. Deposit Insurance and other Country Level Variables
Country level variables are collected from a number of sources. We use two separate
measures of deposit insurance. The first measure comes from Barth, Caprio, and Levine (2008).
Specifically, deposit insurance dummy is created and set equal to 1 if a country has explicit
deposit insurance and depositors were fully compensated the last time a bank failed. It is set
equal to 0 otherwise. The second deposit insurance measure comes from Demirguc-Kunt, Kane,
and Laeven (2008). Full coverage dummy is created and set equal to 1 if a country offers full
coverage and 0 otherwise. Since deposit insurance schemes are often changed during times of
crises and we are interested in the impact of deposit insurance on bank risk during the recent pre-
crisis and crisis periods, we take the deposit insurance coverage in existence in 2003 as our
independent variable and use bank-year observations from 2004 to 2009 in our study to mitigate
the reverse causality problem. Although fixing the deposit insurance measure at year 2003 leads
to measurement error in the deposit insurance variable and may bias us against finding any
significant results, it alleviates the concern that some unobservable country characteristics drive
both changes in deposit insurance and bank risk.6
We also control for a number of country level variables to further deal with the potential
omitted variable problem. Specifically, since both bank performance and deposit insurance can
be affected by economic conditions in a country, we obtain economic development measures
from the World Bank’s World Development Indictor (WDI) database. We use the natural
logarithm of GDP per capita to measure the economic development of a country, the variance of
GDP growth rate to measure economic stability, the natural logarithm of population to measure
country size, and imports plus exports of goods and service divided GDP to measure global
integration (Karolyi, Lee, and Van Dijk 2011). We also use stock market capitalization divided
by GDP and private credit divided by GDP from the Financial Structure Dataset (Beck,
Demirguc-Kunt, and Levine (2010)) to control for differences in financial development and
6 It might be argued that the deposit insurance scheme in 2003 is positively correlated with government interventions in the recent crisis, which seems to favor our hypothesis that deposit insurance is associated with lower bank risk in the crisis. However, there is no evidence for such a claim and in contrast previous studies have suggested that lack of deposit insurance may increase the genorousity of financial safety nets (Gropp and Vesala 2004 and Demirguc-Kunt, Karacaovali, and Laeven 2005).

9
structure. We define a crisis dummy to be equal to 1 for years 2007 to 2009 and 0 for years 2004
to 2006.
As mentioned earlier, we are interested in how regulation and supervision impact the
relationship between deposit insurance on bank risk and systemic stability. The adverse
consequence of deposit insurance can potentially be mitigated through better bank regulation and
supervision. To examine this relationship, we use a bank supervisory quality index, which
measures whether the supervisory authorities have the power and the authority to take specific
preventive and corrective actions such as replacing the management team. This variable comes
from the banking surveys conducted by Barth, Caprio, and Levine (2008).7 The surveys were
conducted in the years 1999, 2002, and 2005. Because country level regulations change slowly
over time, we use the previously available survey data until a new survey becomes available.
3. Empirical Methodology and Results
3.1. Summary Statistics
Table 1 provides the summary statistics of variables used in this study. An average bank
in the sample has a logzscore of 3.50, stock return volatility of 0.03 and systemic risk of -2.46. In
addition, the average bank has log total asset value of 7.66, and leverage ratio of 0.90. These
numbers are comparable to those in previous studies such as Anginer, Demirguc-Kunt, and Zhu
(2012).
Table 2 presents the sub-sample comparisons of means of our main variables of interest.
In Panel A of Table 2, we partition our sample by whether a country offers deposit insurance and
whether the country is in a crisis period. The results suggests that in the non-crisis period, banks
7 This is a variable that ranges from zero to fourteen, with fourteen indicating the highest power of the supervisory authorities. For each of the following fourteen questions, a value of 1 is added to the index if the answer is yes: 1. Does the supervisory agency have the right to meet with external auditors to discuss their report without the approval of the bank? 2. Are auditors required by law to communicate directly to the supervisory agency any presumed involvement of bank directors or senior managers in illicit activities, fraud, or insider abuse? 3. Can supervisors take legal action against external auditors for negligence? 4. Can the supervisory authority force a bank to change its internal organizational structure? 5. Are off-balance sheet items disclosed to supervisors? 6. Can the supervisory agency order the bank's directors or management to constitute provisions to cover actual or potential losses? 7. Can the supervisory agency suspend the directors' decision to distribute: a) dividends? b) bonuses? c) management fees? 8. Can the supervisory agency legally declare-such that this declaration supersedes the rights of bank shareholders-that a bank is insolvent? 9. Does the banking Law give authority to the supervisory agency to intervene that is, suspend some or all ownership rights-a problem bank? 10. Regarding bank restructuring and reorganization, can the supervisory agency or any other government agency do the following: a) supersede shareholder rights? b) remove and replace management? c) remove and replace directors?

10
in countries without deposit insurance have higher z-score, lower return volatility, and lower
systemic risk. During crisis years bank risk, stock return volatility and systemic risk increases
substantially. More importantly, compared to countries with deposit insurance coverage,
countries without such coverage experience larger increases in bank risk, stock return volatility
and systemic risk. In Panel B of Table 2, we partition our sample by whether a country offers full
coverage and whether the country is in a crisis year. The results are similar to those in Panel A of
Table 2. The differences between deposit insurance and no deposit insurance samples are
statistically and economically significant. Overall, the univariate results in Table 2 are consistent
with our conjecture that the effect of deposit insurance on bank risk is time varying. Next, we
conduct formal tests of our hypothesis using multivariate regressions controlling for country and
firm differences.
3.2. Bank Risk
We first examine whether the impact of deposit insurance on bank risk varies during
crisis and pre-crisis years. As discussed earlier, while deposit insurance may lead to moral hazard
and excessive bank risk taking (e.g., Demirguc-Kunt and Kane 2002 and Demirguc-Kunt and
Huizinga 2004), it can also prevent bank runs (e.g., Merton 1977 and Matutes and Vives 1996)
and thus ensure investor confidence and systemic stability during economic downturns. To test
this relationship, we use ordinary least squares (OLS) to estimate the following regression
specification:
logzscoreijt = β0 + Ω×bank and country controlsijt-1 + β1×deposit
insuranceij2003×crisisijt + β2×deposit insuranceij2003×noncrisisijt + β3×crisisijt + εijt (3)
Our dependent variable is bank i’s risk (in country j in year t), logzscoreijt, which is equal
to the sum of average bank return on assets (net income divided by total assets) and bank equity
to assets ratio scaled by the standard deviation of return on assets over a five-year rolling
window. Main explanatory variables of interest are the two interaction terms: one between
deposit insurance coverage and crisis year dummy, and the other between deposit insurance
coverage and non-crisis year dummy. This specification allows deposit insurance to have
different effects on bank risk in crisis and non-crisis periods. Since we include a crisis dummy,
11
the coefficients on the interaction terms correspond to differences in risk for banks with deposit
insurance coverage and those without, similar to the differences we reported in Table 2. In the
regression, we control for bank characteristics that can affect risk. Bank level control variables
include log value of bank assets, leverage, provisions to net interest income ratio, reliance on
deposits for funding, and profitability. We also include country level controls including the
natural logarithm of GDP per capita, variance of GDP growth rate, natural logarithm of
population, imports plus exports of goods and service divided GDP, stock market capitalization
divided by GDP, private credit divided by GDP, and crisis year dummy. All explanatory
variables are lagged by one year to alleviate any reverse causality problems.
Table 3 presents the coefficient estimates. Column (1) of Table 3 shows that deposit
insurance has a positive and statistically significant effect on bank zscore in crisis years and a
negative and statistically significant effect on bank zscore in pre-crisis years. This suggests that
deposit insurance reduced bank risk during the recent crisis and increased bank risk in the years
leading up to the crisis. However, the average effect of deposit insurance over the full sample
period is still negative, since the destabilizing effect during normal times is greater in magnitude
compared to the stabilizing effect during the global financial crisis. In terms of control variables,
we find that banks with higher leverage ratios have higher risk and banks that rely more on
deposits have lower risk. Higher loan loss provisions seem to increase bank risk while greater
profitability tends to be associated with lower risk. For country level variables, we find that bank
risk is positively correlated with variance of GDP growth and is higher in crisis years, and bank
risk is negatively correlated with private credit offered by financial institutions. Finally, as
expected, bank risk is substantially higher in crisis years.
We consider an alternative regression specification that allows us to estimate an
incremental effect of deposit insurance on bank risk in crisis years directly.8 Specifically, we
estimate the following OLS regression:
logzscoreijt = β0 + Ω×bank and country controlsijt-1 + β1×deposit
insuranceij2003×crisisijt + β2×deposit insuranceij2003 + β3×crisisijt + εijt
(4)
8 Note that this specification is identical to the previous one except that it offers the magnitude and significance of the incremental effect of deposit insurance directly.

12
This is a diff-in-diff specification. The coefficient on the interaction term corresponds to the
difference during crisis and non-crisis period of the differences in risk for banks with deposit
insurance coverage and those without. Column (2) of Table 3 presents the results. Our
dependent variable is still bank i’s risk (in country j in year t) logzscoreijt. Our main explanatory
variables of interest are deposit insurance and the interaction term between deposit insurance
coverage and crisis year dummy. The control variables are similar to those we used in Column
(1). We find that the main effect of deposit insurance is negatively and statistically significant at
the 1% level. This indicates that, on average, deposit insurance exacerbates moral hazard and
leads to excess risk taking in non-crisis years. The interaction term between deposit insurance
and crisis year is positive and statistically significant at the 1% level. Moreover, the economic
magnitude of the incremental effect is greater than that of the main effect, suggesting that deposit
insurance enhances investor confidence and reduces bank risk during a crisis.
As an alternative measure of deposit insurance coverage, we use full coverage dummy to
replace the deposit insurance coverage dummy. The regression results are presented in Columns
(3) and (4) of Table 3, and they are consistent with those in Columns (1) and (2) of Table 3.
Overall, the evidence in Table 3 suggests that deposit insurance increases bank risk in pre-crisis
years and decreases bank risk in crisis years, with an average negative effect for the entire
sample period. In addition, Table 3 shows that the full coverage dummy has a slightly higher
time varying impact on bank risk, consistent with previous studies which suggest that full
coverage may further exacerbate the moral hazard problem (Demirguc-Kunt and Detragiache
2002).
3.3. Bank Stock Return Volatility
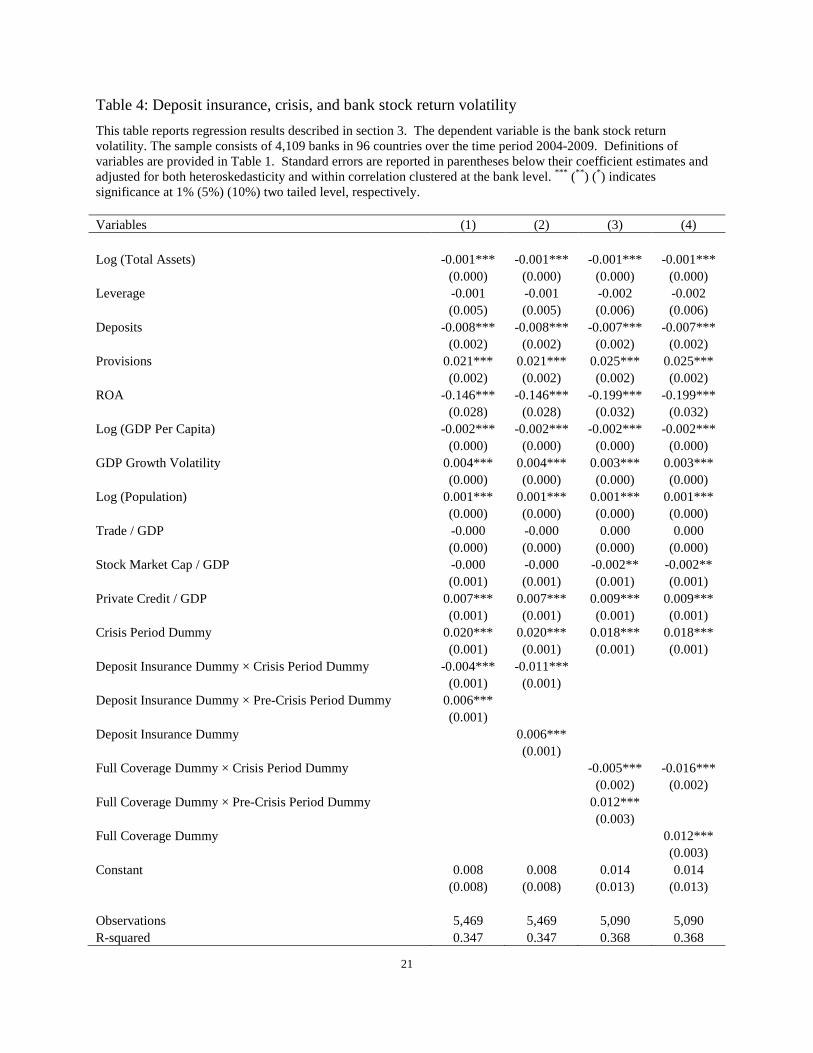
Next, we examine the impact of deposit insurance on bank stock return volatility. Our
dependent variable is bank i’s volatility (in country j in year t), which is calculated as the
standard deviation of daily stock returns in a fiscal year. The regression specifications and
control variables are the same as those used in Section 3.2 and the regression results are reported
in Table 4.
We find that, in Column (1) of Table 4, deposit insurance dummy is associated with
lower stock return volatility in crisis years but is correlated with higher stock return volatility in
pre-crisis years. Column (2) of Table 4 indicates that, deposit insurance increases bank stock

13
return volatility in non-crisis years but the positive relationship between deposit insurance and
stock return volatility is completely reversed during a crisis. In terms of control variables, we
find that banks with larger size, higher reliance on deposits as funding, lower loan loss
provisions, and higher profitability seem to have lower stock return volatility. For country level
variables, we find that countries with higher GDP per capita, lower variance of GDP growth,
smaller population, and lower private credits have banks with lower stock return volatility. In
addition, stock return volatility is substantially higher in crisis years.
In Columns (3) and (4) of Table 4, we replace the deposit insurance dummy with a full
coverage dummy. The results are consistent with those in Columns (1) and (2) of Table 4 and are
again consistent with our conjecture that deposit insurance increases bank risk in normal years
but reduces bank risk in crisis years.
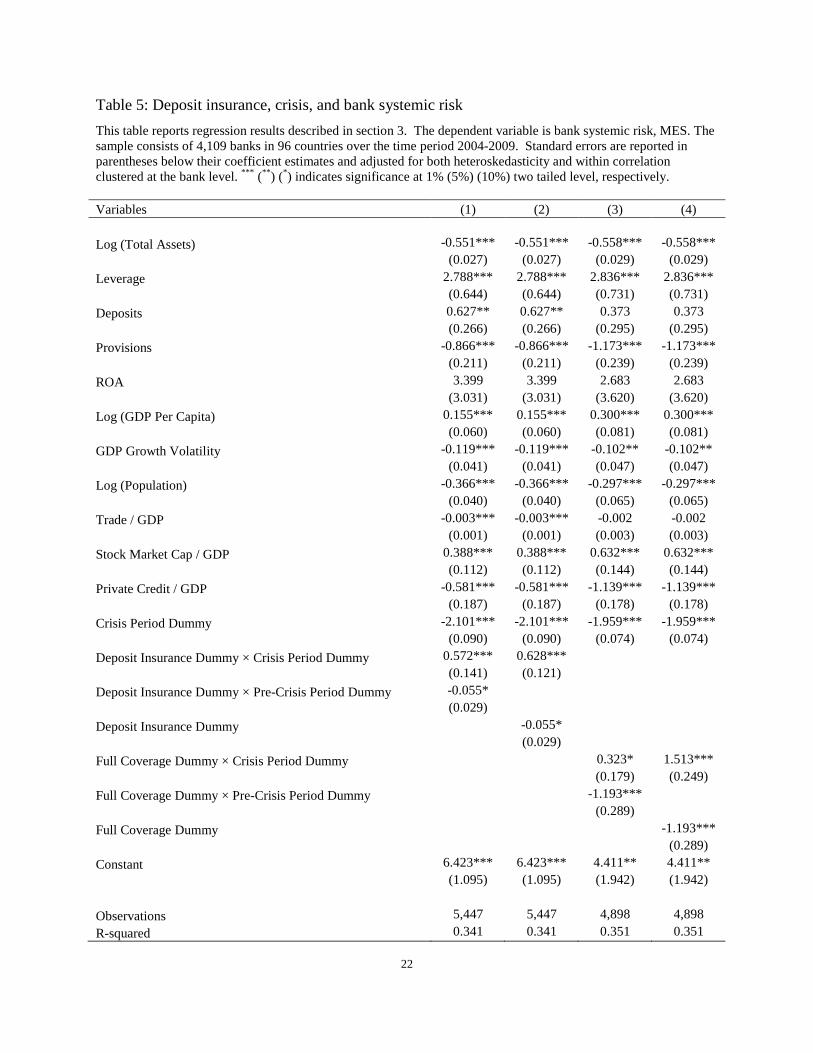
3.4. Bank Systemic Risk
From a regulatory perspective, there is a growing consensus that the correlation in the
risk taking behavior of banks is much more relevant than the absolute level of risk taking in any
individual institution. Acharya (2009) suggests that if there is an implicit guarantee provided by
the State to cover losses stemming from a systemic crisis, banks will have incentives to take on
correlated risks. Guaranteed banks will not have incentives to diversify their operations, since the
guarantee takes effect only if other banks fail at the same time. Although, the use of ex-ante
bank level systemic risk measures is relatively new (and allows us to test the effects of deposit
insurance during crisis and non-crisis periods), much of the earlier empirical work has also
examined the relationship between deposit insurance and systemic risk as measured by the
incidence of banking crisis. Thus, in this section, we examine the relationship between deposit
insurance and bank systemic risk. The regression specifications and control variables are the
same as those used in Section 3.2. We use marginal expected shortfall (MES) as the dependent
variable to measure bank i’s systemic risk (in country j in year t), described in Section 2.2.
Table 5 presents the regression results. The results in Column (1) of Table 5 indicates that
deposit insurance dummy is associated with lower bank systemic risk in crisis years but higher
bank systemic risk in non-crisis years, and the overall effect of deposit insurance over the entire
sample period is negative. Column (2) of Table 5 shows that deposit insurance increases bank
systemic risk in non-crisis years but the positive effect of deposit insurance on bank systemic
14
risk is reversed in crisis years. In terms of control variables, we find that banks with larger size,
lower leverage, lower reliance on deposits as funding, and higher loan loss provisions are
associated with higher systemic risk. For country level variables, we find that countries with
lower GDP per capita, higher GDP volatility, smaller populations, and lower international trade
have banks with higher systemic risk. These results are consistent with those in Anginer and
Demirguc-Kunt (2012). Not surprisingly, bank systemic risk is also higher in crisis years.
In Columns (3) and (4) of Table 5, we replace the deposit insurance dummy with a full
coverage dummy in the regression analysis of systemic risk. The results are consistent with those
in Columns (3) and (4) of Table 5, and are again supportive of our hypothesis.
3.5. Bank Supervision, Deposit Insurance, and Systemic Risk
We are also interested in the impact of the regulatory and institutional framework on the
deposit insurance and systemic risk relationship. The adverse consequence of deposit insurance
may well depend on the institutional environment and can potentially be mitigated through bank
regulation. For instance, better bank supervision may limit the extent to which banks can engage
in correlated risk taking activities in the presence of deposit insurance. We consider a bank
supervisory quality index, which measures whether the supervisory authorities have the power
and the authority to take specific preventive and corrective actions such as replacing the
management team. This variable comes from the banking surveys conducted by Barth, Caprio,
and Levine (2008) and described in Section 2.3.
Our dependent variable is bank i’s systemic risk, measured by MES described in Section
2.3. The regression specifications and control variables are the same as those used in Section 3.2.
Table 6 reports the coefficient estimates. We first partition the sample by the bank supervisory
quality index. Column (1) of Table 6 shows the regression results for the subsample where bank
supervisory quality is greater than or equal to sample median denoted as High Supervisory
Quality, and Column (2) of Table 6 presents that the regressions coefficients for the subsample
where bank supervisory quality is lower than sample median denoted as Low Supervisory
Quality. In Columns (3) and (4), we repeat the same regression using the full coverage as the
deposit insurance measure.
We find that, in Column (1) of Table 6, full coverage dummy is associated with lower
bank systemic risk during global crisis years and has no significant adverse impact on bank

15
systemic risk in non-crisis years, when bank supervision is strong. In contrast, Column (2) of
Table 6 indicates that, full coverage increases bank systemic risk in non-crises years and has no
significant positive impact during crisis years when bank supervision is weak. We obtain similar
results using the full coverage as the deposit insurance measure in Columns (3) and (4). The
results are stronger as full coverage is expected to lead to the most egregious moral hazard
problem during good times. Overall, the results in Table 6 suggest that better bank supervision
can help mitigate the adverse consequences of deposit insurance while weak bank supervision
exacerbates the negative impact of deposit insurance on bank stability.
4. Conclusion
As part of the International Monetary Fund’s best practice recommendations to
developing countries, deposit insurance has received increased attention from both academic
researchers and public policy makers. While deposit insurance is aimed at ensuring depositor
confidence and to prevent bank runs, it comes with an unintended consequence of encouraging
banks to take on excessive risk. In this paper, we study the relation between deposit insurance
and bank risk and system fragility during the global financial crisis and the period preceding it.
We show that generous financial safety nets increase bank risk and systemic fragility in the years
leading up to the crisis. However, both standalone bank risk and systemic risk are lower during
the global financial crisis in countries with deposit insurance coverage. Our results suggest that
deposit insurance seem to have offered significant stabilization effects during the recent banking
crisis. Nevertheless, the overall impact of deposit insurance on bank risk over the full sample
period remains negative, since the stabilization effect during the crisis period tends to be smaller
than destabilizing effect of the insurance in the period leading up to the crisis. We also find that
good bank supervision can alleviate the adverse consequence of deposit insurance on systemic
risk in good times. Our results stress the importance of the underlying regulatory and
institutional framework and lend support to the view that fostering the appropriate incentive
framework is very important for ensuring systemic stability.

16
References
Acharya, V. 2009. A theory of systemic risk and design of prudential bank regulation. Journal of
Financial Stability, 5(3), 224-255.
Acharya, V., R.F. Engle, T. Philippe, and M. Richardson. 2012. Capital Shortfall: A New
Approach to Ranking and Regulating Systemic Risks. American Economic Review
Papers and Proceedings, 59-64.
Acharya, V., L. Pedersen, T. Philippe, and M. Richardson. 2010. Measuring Systemic Risk.
Manuscript, Stern School, New York University.
Adrian, T., and M. K. Brunnermeier. 2010. CoVaR. Working Paper, Princeton University.
Anginer, D., A. Demirguc-Kunt, and M. Zhu. 2012. How does bank competition affect systemic
stability? World Bank Policy Research Working Paper No. 5981.
Anginer, D., and A. Demirguc-Kunt, 2012, “Has the global banking system become more fragile
over time?,” World Bank Policy Research Working Paper No. 5849.
Barth, J. R., G. Caprio Jr, and R. Levine. 2004. Bank regulation and supervision: what works
best? Journal of Financial Intermediation 13 (2):205-248.
Barth, J., G. Caprio, and R. Levine. 2008. Bank regulation and supervision database. The World
Bank.
Beck, T., A. Demirguc-Kunt, and R. Levine. 2010. Financial institutions and markets across
countries and over time: The updated financial development and structure database.
World Bank Economic Review 24 (1):77-92.
Beltratti , A., and R. M. Stulz. 2011. The credit crisis around the globe: Why did some banks
perform better? Journal of Financial Economics, forthcoming.
Chernykh, L., and R. A. Cole. 2011. Does deposit insurance improve financial intermediation?
Evidence from the Russian experiment. Journal of Banking and Finance 35 (2):388-402.
Cull, R., M. Sorge, and L. Senbet. 2004. Deposit insurance and bank intermediation in the long
run. BIS Working Paper #156.
Demirguc-Kunt, A., and E. Detragiache. 2002. Does deposit insurance increase banking system
stability? An empirical investigation. Journal of Monetary Economics 49 (7):1373-1406.
Demirguc-Kunt, A., and H. Huizinga. 2004. Market discipline and deposit insurance. Journal of
Monetary Economics 51(2), 375-399.

17
Demirguc-Kunt, A., and E. Kane. 2002. Deposit insurance around the globe: Where does it
work? Journal of Economic Perspectives 16(2), 175-195.
Demirguc-Kunt, A., E.J. Kane, and L. Laeven. 2008. Determinants of deposit-insurance adoption
and design. Journal of Financial Intermediation 17(3), 407-438.
Demirguc-Kunt, A., B. Karacaovali, and L. Laeven, 2005. Deposit insurance around the world:
A comprehensive database. World Bank Policy Research Working Paper No. 3628.
Elsinger, H., A. Lehar, and M. Summer. 2005. Using market information for banking system risk
assessment. Working Paper, Austrian National Bank.
Fahlenbrach, R., R. Prilmeier, and R. M. Stulz. 2011. This time is the same: Using bank
performance in 1998 to explain bank performance during the recent financial crisis.
NBER Working Paper 17038.
Gropp, R. and J. Vesala, 2004. Deposit insurance, moral hazard and market monitoring.
European Central Bank Working Paper No. 302.
Ioannidou, V. P., and M. F. Penas. 2010. Deposit insurance and bank risk-taking: Evidence from
internal loan ratings. Journal of Financial Intermediation 19 (1):95-115.
Karels, G. V., and C. A. McClatchey. 1999. Deposit insurance and risk-taking behavior in the
credit union industry. Journal of Banking and Finance 23 (1):105-134.
Karolyi, G.A., K.-H. Lee, and M.A. Van Dijk. 2011. Understanding commonality in liquidity
around the world. Journal of Financial Economics, forthcoming.
Laeven, L., and R. Levine. 2009. Bank governance, regulation and risk taking. Journal of
Financial Economics 93 (2):259-275.
Merton, R.C.. 1977. On the pricing of contingent claims and the Modigliani-Miller theorem.
Journal of Financial Economics 15, No. 2, 241-250.
Morrison, A. D., and L. White. 2011. Deposit insurance and subsidized recapitalizations. Journal
of Banking and Finance 35 (12):3400-3416.

18
Table 1: Summary statistics This table reports the summary statistics of the variables used in this paper. The sample consists of 4,109 banks in 96 countries over the time period 2004-2009. Log(z-score) is the natural logarithm of the sum of ROA and equity ratio (ratio of book equity to total assets), averaged over the past five years, divided by the standard deviation of ROA over the past five years. We require a bank to have at least four years of data in the past five years. Volatility is the stock return volatility, calculated as the standard deviation of daily stock return over the fiscal year. Log (Total Assets) is the log value of total assets in millions of US dollars. Leverage is total liabilities divided by total assets. Provisions is loan loss provisions divided by net interest income. Deposits is total deposits divided by total assets. ROA is net income divided by total assets. Log (GDP Per Capita) is the log value of GDP per capital in nominal constant US 2000 dollars. GDP Growth Volatility is the variance of GDP growth for the previous five years. Log (Population) is the log value of population in millions. Trade / GDP is imports plus exports of goods and services as a percentage of GDP. Stock Market Cap / GDP is stock market capitalization divided by GDP. Private Credit / GDP is private credit by deposit money banks and other financial institutions to GDP. Deposit Insurance Dummy is a variable that indicates whether a country has explicit deposit insurance (Yes=1/No=0) and whether depositors were fully compensated the last time a bank failed (Yes=1/No=0). The variable is equal to 1 if both are true in 2003 and 0 otherwise. Full Coverage Dummy is a variable that equals 1 if a country offers full insurance coverage in 2003 and 0 otherwise. Supervisory Quality is a variable that ranges from zero to fourteen, with fourteen indicating the highest power of the supervisory authorities. Variables N P25 Mean Median P75 STD Log (zscore) 14,664 2.854 3.500 3.598 4.256 1.076 Volatility 5,473 0.016 0.028 0.022 0.034 0.019 MES 6,188 -3.703 -2.455 -1.882 -0.631 2.584 Log (Total Assets) 14,664 6.231 7.655 7.155 8.901 1.952 Leverage 14,664 0.889 0.899 0.913 0.933 0.074 Deposits 14,664 0.669 0.725 0.781 0.846 0.184 Provisions 14,664 0.024 0.124 0.064 0.155 0.199 ROA 14,664 0.005 0.010 0.009 0.014 0.014 Log (GDP Per Capita) 14,664 10.003 9.931 10.491 10.554 1.067 GDP Growth Volatility 14,664 0.852 1.345 1.256 1.587 0.951 Log (Population) 14,664 17.907 18.466 19.487 19.505 1.500 Trade / GDP 14,664 25.220 53.536 28.849 60.506 51.215 Stock Market Cap / GDP 14,664 0.831 1.146 1.322 1.397 0.581 Private Credit / GDP 14,664 0.984 1.433 1.733 1.884 0.620 Deposit Insurance Dummy 14,634 0.000 0.324 0.000 1.000 0.468 Full Coverage Dummy 13,648 0.000 0.023 0.000 0.000 0.151 Supervisory Quality 14,632 11.000 11.872 13.000 13.000 2.041

19
Table 2: Sub-sample comparison of variable means The table reports univariate analyses of the impact of deposit insurance during crisis and non-crisis periods. The table reports average values of Log(zscore), Volatility and MES for the subsamples of banks created based on whether the bank is covered by deposit insurance and whether the it is a crisis time period. Panel A reports subsample means, the difference between banks with explicit deposit insurance and those without, as well as the pvalue for test of the differences. Panel B reports subsample means, the difference between banks with fully covered deposit insurance and those without, as well as the pvalue for test of the differences. The sample consists of 4,109 banks in 96 countries over the time period 2004-2009. Definitions of variables are provided in Table 1. Panel A Crisis Period Dummy Deposit Insurance Dummy 0 1 Diff in mean p-value
0 Log (zscore) 3.9580 3.0472 0.9107 0.0000
Volatility 0.0186 0.0202 -0.0016 0.0009
MES -0.9822 -1.8071 0.8249 0.0000
1 Log (zscore) 3.3349 3.2774 0.0574 0.0312
Volatility 0.0412 0.0276 0.0135 0.0000
MES -3.4114 -3.3303 -0.0811 0.4385
Panel B Crisis Period Dummy Full Coverage Dummy 0 1 Diff in mean p-value
0 Log (zscore) 3.7611 2.4710 1.2901 0.0000
Volatility 0.0184 0.0295 -0.0111 0.0000
MES -1.2617 -2.0150 0.7534 0.0001
1 Log (zscore) 3.3148 3.1170 0.1978 0.0218
Volatility 0.0369 0.0303 0.0067 0.0020
MES -3.3644 -3.0699 -0.2945 0.0000

20
Table 3: Deposit insurance, crisis, and bank risk This table reports regression results described in section 3. The dependent variable is the log value of bank zscore. The sample consists of 4,109 banks in 96 countries over the time period 2004-2009. Definitions of variables are provided in Table 1. Standard errors are reported in parentheses below their coefficient estimates and adjusted for both heteroskedasticity and within correlation clustered at the bank level. *** (**) (*) indicates significance at 1% (5%) (10%) two tailed level, respectively. Variables (1) (2) (3) (4) Log (Total Assets) 0.002 0.002 0.002 0.002
(0.009) (0.009) (0.009) (0.009)
Leverage -0.762*** -0.762*** -0.512* -0.512*
(0.273) (0.273) (0.304) (0.304)
Deposits 0.694*** 0.694*** 0.707*** 0.707***
(0.091) (0.091) (0.097) (0.097)
Provisions -1.320*** -1.320*** -1.483*** -1.483***
(0.067) (0.067) (0.072) (0.072)
ROA 2.888** 2.888** 4.889*** 4.889***
(1.255) (1.255) (1.408) (1.408)
Log (GDP Per Capita) 0.030 0.030 -0.007 -0.007
(0.026) (0.026) (0.030) (0.030)
GDP Growth Volatility -0.152*** -0.152*** -0.144*** -0.144***
(0.016) (0.016) (0.018) (0.018)
Log (Population) -0.009 -0.009 -0.025 -0.025
(0.016) (0.016) (0.024) (0.024)
Trade / GDP 0.000 0.000 -0.002 -0.002
(0.000) (0.000) (0.001) (0.001)
Stock Market Cap / GDP 0.004 0.004 0.041 0.041
(0.036) (0.036) (0.049) (0.049)
Private Credit / GDP 0.226*** 0.226*** 0.262*** 0.262***
(0.052) (0.052) (0.057) (0.057)
Crisis Period Dummy -0.555*** -0.555*** -0.365*** -0.365***
(0.024) (0.024) (0.023) (0.023)
Deposit Insurance Dummy × Crisis Period Dummy 0.221*** 0.693***
(0.042) (0.044)
Deposit Insurance Dummy × Pre-Crisis Period Dummy -0.472***
(0.049)
Deposit Insurance Dummy
-0.472***
(0.049)
Full Coverage Dummy × Crisis Period Dummy
0.245** 0.960***
(0.103) (0.136)
Full Coverage Dummy × Pre-Crisis Period Dummy
-0.716***
(0.150)
Full Coverage Dummy
-0.716***
(0.150)
Constant 3.837*** 3.837*** 4.138*** 4.138***
(0.456) (0.456) (0.665) (0.665)
Observations 14,634 14,634 13,648 13,648 R-squared 0.227 0.227 0.221 0.221
21
Table 4: Deposit insurance, crisis, and bank stock return volatility This table reports regression results described in section 3. The dependent variable is the bank stock return volatility. The sample consists of 4,109 banks in 96 countries over the time period 2004-2009. Definitions of variables are provided in Table 1. Standard errors are reported in parentheses below their coefficient estimates and adjusted for both heteroskedasticity and within correlation clustered at the bank level. *** (**) (*) indicates significance at 1% (5%) (10%) two tailed level, respectively. Variables (1) (2) (3) (4) Log (Total Assets) -0.001*** -0.001*** -0.001*** -0.001***
(0.000) (0.000) (0.000) (0.000)
Leverage -0.001 -0.001 -0.002 -0.002
(0.005) (0.005) (0.006) (0.006)
Deposits -0.008*** -0.008*** -0.007*** -0.007***
(0.002) (0.002) (0.002) (0.002)
Provisions 0.021*** 0.021*** 0.025*** 0.025***
(0.002) (0.002) (0.002) (0.002)
ROA -0.146*** -0.146*** -0.199*** -0.199***
(0.028) (0.028) (0.032) (0.032)
Log (GDP Per Capita) -0.002*** -0.002*** -0.002*** -0.002***
(0.000) (0.000) (0.000) (0.000)
GDP Growth Volatility 0.004*** 0.004*** 0.003*** 0.003***
(0.000) (0.000) (0.000) (0.000)
Log (Population) 0.001*** 0.001*** 0.001*** 0.001***
(0.000) (0.000) (0.000) (0.000)
Trade / GDP -0.000 -0.000 0.000 0.000
(0.000) (0.000) (0.000) (0.000)
Stock Market Cap / GDP -0.000 -0.000 -0.002** -0.002**
(0.001) (0.001) (0.001) (0.001)
Private Credit / GDP 0.007*** 0.007*** 0.009*** 0.009***
(0.001) (0.001) (0.001) (0.001)
Crisis Period Dummy 0.020*** 0.020*** 0.018*** 0.018***
(0.001) (0.001) (0.001) (0.001)
Deposit Insurance Dummy × Crisis Period Dummy -0.004*** -0.011***
(0.001) (0.001)
Deposit Insurance Dummy × Pre-Crisis Period Dummy 0.006***
(0.001)
Deposit Insurance Dummy
0.006***
(0.001)
Full Coverage Dummy × Crisis Period Dummy
-0.005*** -0.016***
(0.002) (0.002)
Full Coverage Dummy × Pre-Crisis Period Dummy
0.012***
(0.003)
Full Coverage Dummy
0.012***
(0.003)
Constant 0.008 0.008 0.014 0.014
(0.008) (0.008) (0.013) (0.013)
Observations 5,469 5,469 5,090 5,090 R-squared 0.347 0.347 0.368 0.368
22
Table 5: Deposit insurance, crisis, and bank systemic risk This table reports regression results described in section 3. The dependent variable is bank systemic risk, MES. The sample consists of 4,109 banks in 96 countries over the time period 2004-2009. Standard errors are reported in parentheses below their coefficient estimates and adjusted for both heteroskedasticity and within correlation clustered at the bank level. *** (**) (*) indicates significance at 1% (5%) (10%) two tailed level, respectively. Variables (1) (2) (3) (4) Log (Total Assets) -0.551*** -0.551*** -0.558*** -0.558***
(0.027) (0.027) (0.029) (0.029)
Leverage 2.788*** 2.788*** 2.836*** 2.836***
(0.644) (0.644) (0.731) (0.731)
Deposits 0.627** 0.627** 0.373 0.373
(0.266) (0.266) (0.295) (0.295)
Provisions -0.866*** -0.866*** -1.173*** -1.173***
(0.211) (0.211) (0.239) (0.239)
ROA 3.399 3.399 2.683 2.683
(3.031) (3.031) (3.620) (3.620)
Log (GDP Per Capita) 0.155*** 0.155*** 0.300*** 0.300***
(0.060) (0.060) (0.081) (0.081)
GDP Growth Volatility -0.119*** -0.119*** -0.102** -0.102**
(0.041) (0.041) (0.047) (0.047)
Log (Population) -0.366*** -0.366*** -0.297*** -0.297***
(0.040) (0.040) (0.065) (0.065)
Trade / GDP -0.003*** -0.003*** -0.002 -0.002
(0.001) (0.001) (0.003) (0.003)
Stock Market Cap / GDP 0.388*** 0.388*** 0.632*** 0.632***
(0.112) (0.112) (0.144) (0.144)
Private Credit / GDP -0.581*** -0.581*** -1.139*** -1.139***
(0.187) (0.187) (0.178) (0.178)
Crisis Period Dummy -2.101*** -2.101*** -1.959*** -1.959***
(0.090) (0.090) (0.074) (0.074)
Deposit Insurance Dummy × Crisis Period Dummy 0.572*** 0.628***
(0.141) (0.121)
Deposit Insurance Dummy × Pre-Crisis Period Dummy -0.055*
(0.029)
Deposit Insurance Dummy
-0.055*
(0.029)
Full Coverage Dummy × Crisis Period Dummy
0.323* 1.513***
(0.179) (0.249)
Full Coverage Dummy × Pre-Crisis Period Dummy
-1.193***
(0.289)
Full Coverage Dummy
-1.193***
(0.289)
Constant 6.423*** 6.423*** 4.411** 4.411**
(1.095) (1.095) (1.942) (1.942)
Observations 5,447 5,447 4,898 4,898 R-squared 0.341 0.341 0.351 0.351

23
Table 6: Deposit insurance, crisis, bank supervision, and systemic risk This table reports regression results described in section 3. The dependent variable is bank systemic risk, MES. The sample consists of 4,109 banks in 96 countries over the time period 2004-2009. We first partition the sample by the bank supervisory quality index. Columns (1) and (3) report the regression results for the subsample where bank supervisory quality is greater than or equal to sample median denoted as High Supervisory Quality, and Column (2) and (4) report regressions coefficients for the subsample where bank supervisory quality is lower than sample median denoted as Low Supervisory Quality Standard errors are reported in parentheses below their coefficient estimates and adjusted for both heteroskedasticity and within correlation clustered at the bank level. *** (**) (*) indicates significance at 1% (5%) (10%) two tailed level, respectively.
(1) (2) (3) (4)
VARIABLES
High Supervisory
Quality
Low Supervisory
Quality
High Supervisory
Quality
Low Supervisory
Quality Log (Total Assets) -0.728*** -0.435***
-0.491*** -0.773***
(0.038) (0.043)
(0.046) (0.044)
Leverage 4.722*** 0.264
0.924 5.366***
(1.072) (0.849)
(0.972) (1.220)
Deposits 0.332 1.029***
0.824** -0.120
(0.430) (0.372)
(0.388) (0.529)
Provisions -1.719*** 0.200
0.160 -2.603***
(0.386) (0.227)
(0.266) (0.559)
ROA 8.516 -2.710
-9.350** 9.678
(6.345) (3.311)
(4.179) (7.814)
Log (GDP Per Capita) -0.276** 0.221***
0.535*** -0.988***
(0.139) (0.079)
(0.088) (0.238)
GDP Growth Volatility -0.064 0.049
-0.037 0.048
(0.055) (0.062)
(0.067) (0.060)
Log (Population) -0.701*** -0.257***
-0.230*** -0.812***
(0.081) (0.070)
(0.082) (0.213)
Trade / GDP -0.006*** -0.007***
-0.009** -0.017*
(0.001) (0.002)
(0.004) (0.010)
Stock Market Cap / GDP 0.895*** 0.550***
1.040*** 1.078***
(0.224) (0.147)
(0.212) (0.281)
Private Credit / GDP -0.601* -0.248
-0.918*** 0.729
(0.326) (0.267)
(0.297) (0.571)
Crisis Period Dummy -2.212*** -1.046***
-1.653*** -2.403***
(0.101) (0.242)
(0.112) (0.109)
Deposit Insurance Dummy x Crisis Period Dummy 1.234*** 0.016
(0.261) (0.238) Deposit Insurance Dummy x Pre-
Crisis Period Dummy -0.141 -0.609***
(0.343) (0.220)
Supervisory Quality 1.762*** 0.140***
0.042 0.860**
(0.231) (0.039)
(0.046) (0.344)

24
Full Coverage Dummy x Crisis Period Dummy
1.054*** -0.986**
(0.332) (0.463)
Full Coverage Dummy x Pre-Crisis Period Dummy
-0.023 -3.397***
(0.277) (0.534)
Constant 39.613*** 4.990***
1.564 35.220***
(4.001) (1.814)
(2.390) (7.340)
Observations 2,885 1,828
2,571 1638 R-squared 0.401 0.297 0.439 0.317