how do you calculate and report on human capital data for 40,000 employees in under 15 minutes?
TRANSCRIPT

REMINDER
Check in on the
COLLABORATE mobile app
How Do You Calculate & Report on Human Capital
Data for 40,000 Employees in Under 15 Minutes?
Prepared by:
Pete Cammisa
Managing Partner | Chairperson
Innovus Partners | OAUGNJ
Using Hyperion to perform large calculations and aggregations for Human Capital Data Analytics
Session ID#: 10464
@petecammisa

Agenda
■ Presenter Bio
■ Company Info
■ OAUGNJ GEO Plug
■ The Challenge
■ Human Resources vs Finance / FP&A Needs
■ The Solution
■ Precautions
■ Let’s Recap
■ Open Discussion / Q&A

Presenter Bio
■ Pete Cammisa
▪ Managing Partner - Innovus Partners
▪ Chairperson & GEO Coordinator - OAUGNJ (New Jersey)
▪ Advocate for bringing users together to cooperatively share our
knowledge and experience
▪ Frequent speaker at local and national conferences
▪ Expert in designing and implementing Hyperion solutions
▪ Keep it simple, sustainable and supportable

Company Info
■ About Innovus
▪ Specialize in the design and implementation of Oracle Hyperion
EPM and BI solutions
▪ Oracle Certified Consultants and Industry Thought Leaders
▪ Innovative project development methodology ensures Project
Success
▪ Oracle Gold Partner and Active Leaders in the Oracle Application
Users Groups
▪ Clients are 100% reference-able!
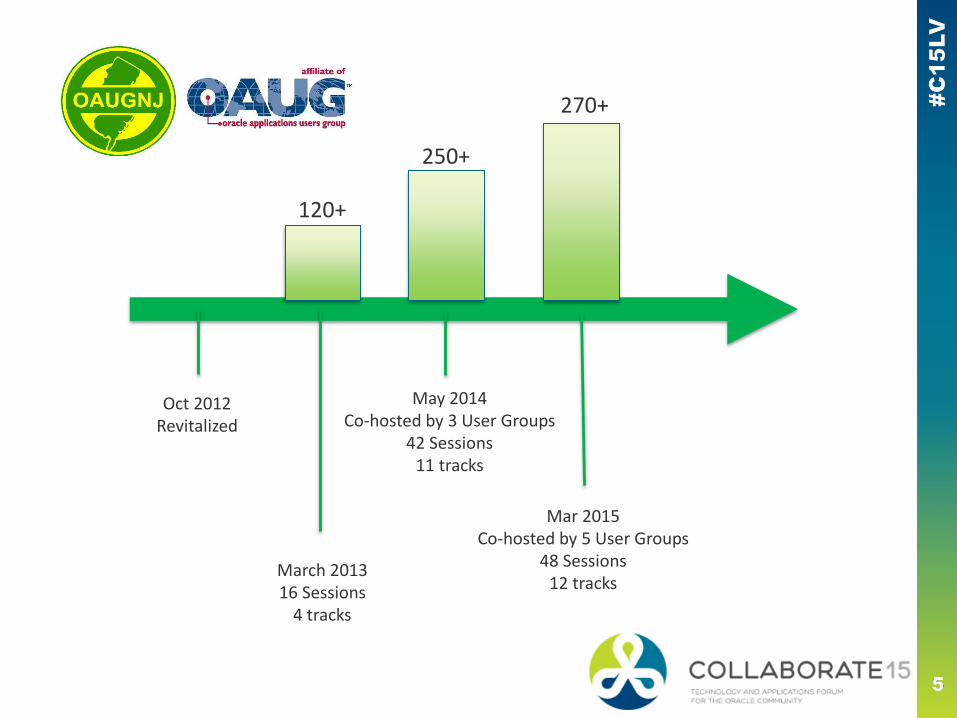
Oct 2012Revitalized
March 201316 Sessions
4 tracks
120+
250+
270+
May 2014Co-hosted by 3 User Groups
42 Sessions11 tracks
Mar 2015Co-hosted by 5 User Groups
48 Sessions12 tracks

The Challenge
Human Capital Reporting & Analysis…
…For FP&A
■ 40,000+ employees
■ 21 number of input points
■ 50+ number of expected outputs
▪ Headcount
▪ FTE related outputs
▪ Stats / Analytics
■ How fast?
▪ As fast as possible!

HR vs. FP&A Needs
■ Count heads
■ Length of service
■ Turnover
■ Org. chart
■ Employment requirements
■ Translation to facilities
requirements
■ Count & categorize heads
■ Count & categorize FTEs
■ Employee / Department /
Function Productivity
■ Employee / Department / Title
Utilization
■ Tenure
■ Span of Control
■ Cost of the workforce
■ Workforce expense plan and
forecast
■ Profitability
Human Resources Corporate Finance / FP&A

The Solution
■ Partner with Human Resources and HRIS
■ Collect required data elements from HR / payroll
■ Collect additional data elements from other relevant systems
■ Centralize data governance
■ Utilize Essbase to calculate and aggregate data for Actuals Reporting & Analysis
■ Deliver standard staffing packages to key stakeholders via highly-formatted reports
■ Present key analytic metrics to executives via dashboards
■ Initialize a workforce plan or forecast
■ Give back to HR!

The Solution
Calculation Cube
Reporting Cube
Data G
overn
ance Other apps
Reports

The Solution
■ Use the right tool for the right job
▪ Essbase BSO
— Initial recipient of data load
— Calculations performed at level-0
— No aggregations in this application
▪ Essbase ASO
— Identical dimensionality to BSO application
— Receives data from BSO application
— Performs aggregation
— Contains a few calculations
— End-Users only see the ASO application

Dimensionality
Database Outline
Accounts
Time Periods
Department
Entity
Employee
Scenario
Version
Year
Title
Manager

Dimensionality - Accounts

Accounts – Employee Properties
■ Status: Active / Terminated / Leave-of Absence
■ Employee Type: Regular / Home-Based / Temporary / Offshore
■ FT/PT: Full-Time / Part-Time
■ Start Date: Can be used for Tenure calculations and analysis
■ Annual Salary: For compensation analysis – also future use for
plan / forecast
■ Hourly Rate: Similar use to Annual Salary
■ Termination Date: Used for tenure analysis / turnover analysis

Dimensionality - Employee

Essbase BSO Application
■ Optimal Dense-Sparse Configuration (Modified Hourglass)
■ Initial recipient of data loads (system or manual entry)
■ Calculate upper levels for percent-to-total calculations only
■ Use Typed Measures to load dates
■ Use Attribute dimensions for Employee properties (e.g., Manager
and Title)
■ Optimize Index and Data Caches

Data Loads
■ Clear target intersections to be loaded
■ Load data from a relational data source to which Essbase can
connect directly**
■ Limit transformations in the load rule(s) – perform before in a tool
better suited for transformations
■ One month loaded at a time for Actuals (Consider load frequency)
■ Place Accounts (Dense) in columns
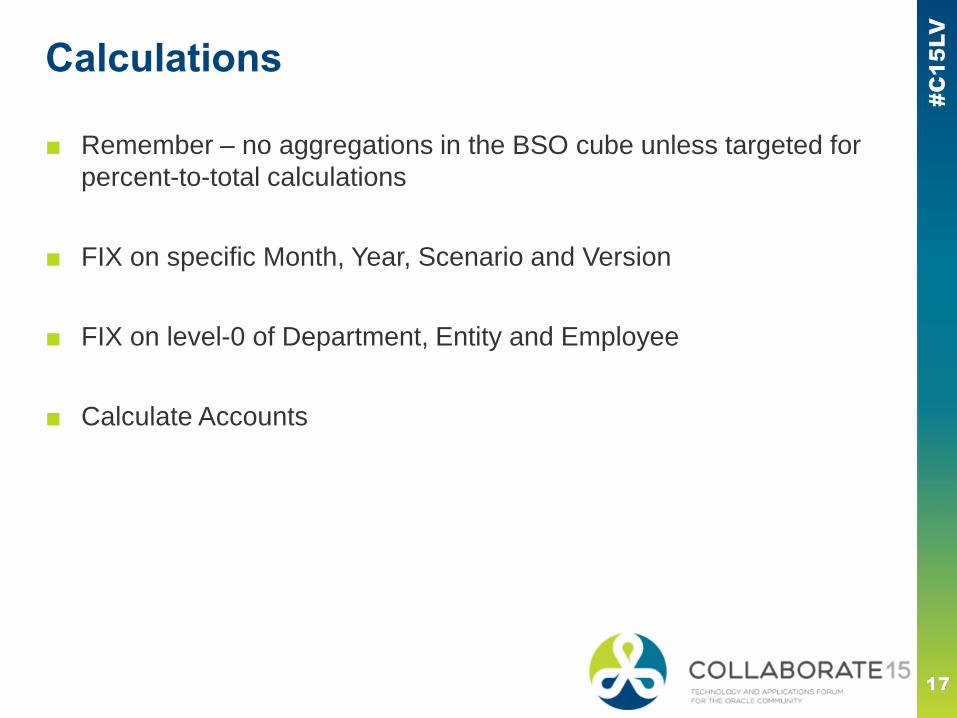
Calculations
■ Remember – no aggregations in the BSO cube unless targeted for
percent-to-total calculations
■ FIX on specific Month, Year, Scenario and Version
■ FIX on level-0 of Department, Entity and Employee
■ Calculate Accounts

Calculations - Headcount
■ If Status is not Terminated
▪ If Employee Type is Regular
— If FT/PT is FT then Full Time Onshore Headcount = 1
— If FT/PT is PT then Part Time Onshore Headcount = 1
▪ If Employee Type is Home-Based
— If FT/PT is FT then Full Time Home Based Headcount = 1
— If FT/PT is PT then Part Time Home Based Headcount = 1
▪ If Employee Type is Offshore then Traditional Offshore Headcount = 1
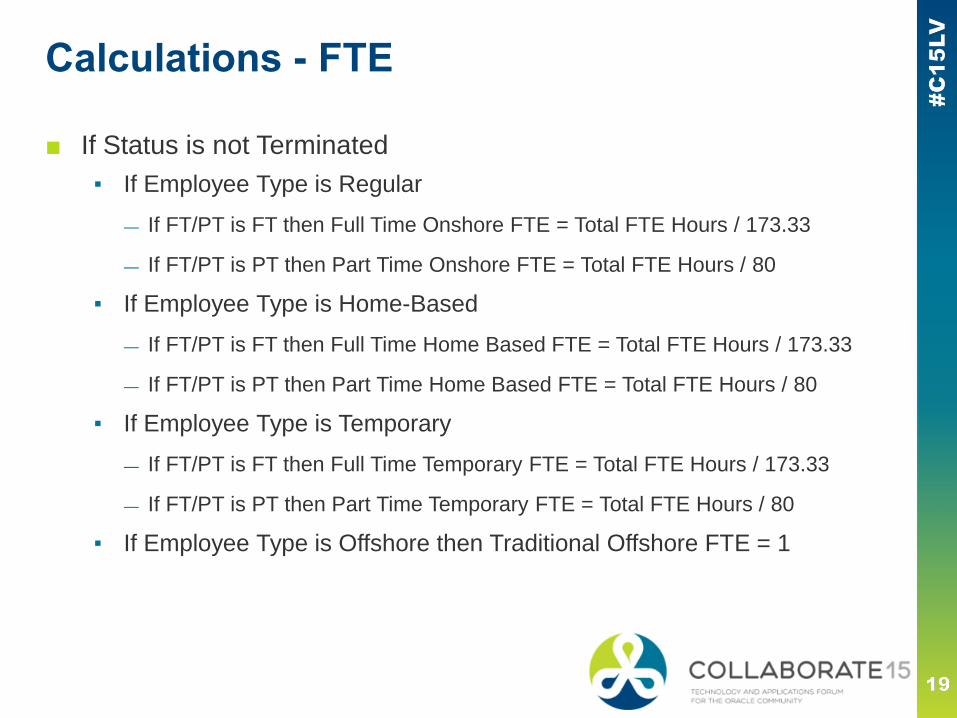
Calculations - FTE
■ If Status is not Terminated
▪ If Employee Type is Regular
— If FT/PT is FT then Full Time Onshore FTE = Total FTE Hours / 173.33
— If FT/PT is PT then Part Time Onshore FTE = Total FTE Hours / 80
▪ If Employee Type is Home-Based
— If FT/PT is FT then Full Time Home Based FTE = Total FTE Hours / 173.33
— If FT/PT is PT then Part Time Home Based FTE = Total FTE Hours / 80
▪ If Employee Type is Temporary
— If FT/PT is FT then Full Time Temporary FTE = Total FTE Hours / 173.33
— If FT/PT is PT then Part Time Temporary FTE = Total FTE Hours / 80
▪ If Employee Type is Offshore then Traditional Offshore FTE = 1
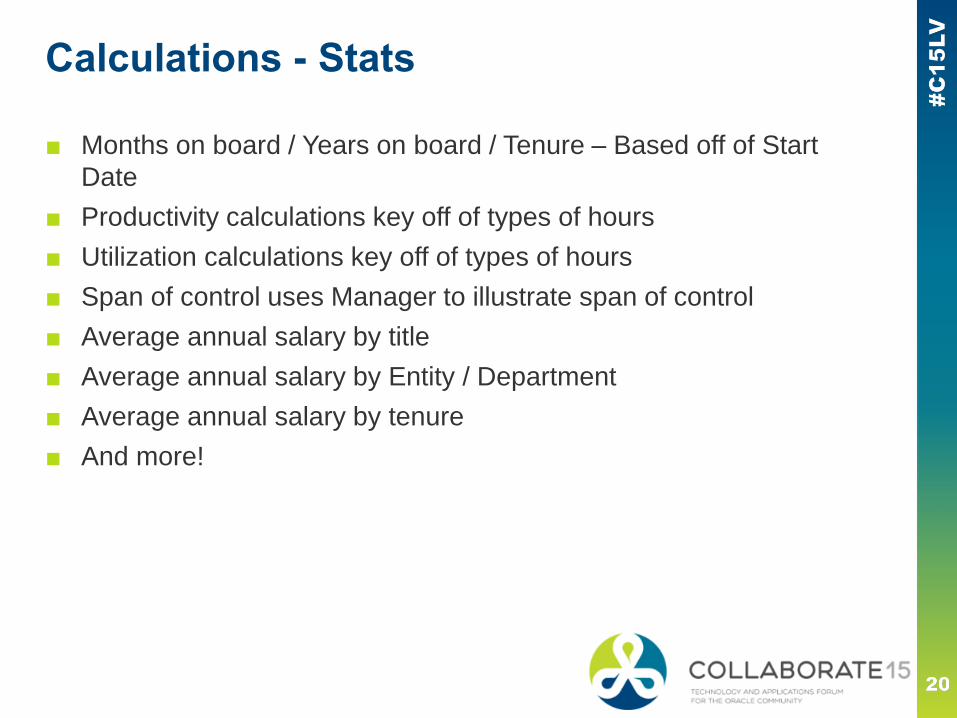
Calculations - Stats
■ Months on board / Years on board / Tenure – Based off of Start
Date
■ Productivity calculations key off of types of hours
■ Utilization calculations key off of types of hours
■ Span of control uses Manager to illustrate span of control
■ Average annual salary by title
■ Average annual salary by Entity / Department
■ Average annual salary by tenure
■ And more!

Data Transfer
■ Replicated Partition – Update changed cells only!
■ Export data from calc cube – use DATAEXPORT calc script

Essbase ASO Application
■ User-facing application (though identical to the BSO application)
■ Aggregates and makes the previously calculated information
available for consumption
■ Can perform additional calculations
■ Drives reports and dashboards

Watch Out For…
■ Data security / sensitivity
■ Use of an extremely large ASO application (metadata) will make level-0 exports impossible. But this might be okay as long as the BSO app has the same dimensionality – you can just use the level-0 from that application.
■ Use of an extremely large ASO application can limit reporting capabilities because of limitations on the amount of metadata you can query at one time – applies in Smart View, FR and Report scripts.
■ Too many percent-to-total calculations in BSO application can hinder performance.
■ Keep your outlines in-sync

Let’s Recap
Calculation Cube
Reporting Cube
Data G
overn
ance Other apps
Reports

Let’s Recap
■ Partner with Human Resources and HRIS
■ Collect required data elements from HR / payroll
■ Collect additional data elements from other relevant systems
■ Centralize data governance
■ Utilize Essbase to calculate and aggregate data for Actuals Reporting & Analysis
■ Deliver standard staffing packages to key stakeholders via highly-formatted reports
■ Present key analytic metrics to executives via dashboards
■ Initialize a workforce plan or forecast
■ Give back to HR!

May I suggest these sessions…
■ Come to hear from the real-
world company that is using
this solution.
■ Tuesday 3:15 - 4:15
■ Jasmine B
■ Come to this session to learn
more about the OAUGNJ and
how to get involved.
■ Tuesday 4:30 – 5:30
■ South Seas G
Session 10475 Session 10105

Let’s Continue the Conversation…
▪ Pete Cammisa
▪ Group – Innovus Partners EPM & BI
▪ Group – OAUGNJ
▪ @PeteCammisa
▪ @InnovusPartners
▪ @OAUGNJ

Please complete the session evaluationWe appreciate your feedback and insight
Reminder of Session ID - 10464
You may complete the session evaluation either
on paper or online via the mobile app