how do we reconcile echocardiography, computed...
TRANSCRIPT

J A C C : C A R D I O V A S C U L A R I M A G I N G V O L . 1 2 , N O . 2 , 2 0 1 9
ª 2 0 1 9 B Y T H E AM E R I C A N C O L L E G E O F C A R D I O L O G Y F O UN DA T I O N
P U B L I S H E D B Y E L S E V I E R
FOCUS ISSUE: IMAGING IN AORTIC STENOSIS: PART II
STATE-OF-THE-ART PAPER
How DoWe Reconcile Echocardiography,Computed Tomography, andHybrid Imaging in Assessing DiscordantGrading of Aortic Stenosis Severity?
Victoria Delgado, MD,a Marie-Annick Clavel, DVM, PHD,b Rebecca T. Hahn, MD,c Linda Gillam, MD,d Jeroen Bax, MD,aPartho P. Sengupta, MD,e Philippe Pibarot, DVM, PHDb
JACC: CARDIOVASCULAR IMAGING CME/MOC/ECME
CME/MOC/ECME Editor: Ragavendra R. Baliga, MD
This article has been selected as this issue’s CME/MOC/ECME activity,
available online at http://www.acc.org/jacc-journals-cme by selecting the
JACC Journals CME/MOC/ECME tab.
Accreditation and Designation Statement
The American College of Cardiology Foundation (ACCF) is accredited by
the Accreditation Council for Continuing Medical Education (ACCME) to
provide continuing medical education for physicians.
The ACCF designates this Journal-based CME/MOC/ECME activity for a
maximum of 1 AMA PRA Category 1 Credit(s) TM. Physicians should only claim
credit commensurate with the extent of their participation in the activity.
Successful completion of this CME activity, which includes participation in
the evaluation component, enables the participant to earn up to 1 Medical
KnowledgeMOC point in the American Board of Internal Medicine’s (ABIM)
Maintenance of Certification (MOC) program. Participants will earn MOC
points equivalent to the amount of CME credits claimed for the activity. It is
the CME activity provider’s responsibility to submit participant completion
information to ACCME for the purpose of granting ABIM MOC credit.
How Do We Reconcile Echocardiography, Computed Tomography, and
Hybrid Imaging in Assessing Discordant Grading of Aortic Stenosis
Severity? will be accredited by the European Board for Accreditation in
Cardiology (EBAC) for 1 hour of External CME credits. Each participant
should claim only those hours of credit that have actually been spent in
the educational activity. The Accreditation Council for Continuing
Medical Education (ACCME) and the European Board for Accreditation
in Cardiology (EBAC) have recognized each other’s accreditation
systems as substantially equivalent. Apply for credit through the post-
course evaluation. While offering the credits noted above, this
program is not intended to provide extensive training or certification
in the field.
Method of Participation and Receipt of CME/MOC/ECME Certificate
To obtain credit for this CME/MOC/ECME activity, you must:
1. Be an ACC member or JACC: Cardiovascular Imaging subscriber.
2. Carefully read the CME/MOC/ECME-designated article available
online and in this issue of the journal.
ISSN 1936-878X/$36.00
3. Answer the post-test questions. A passing score of at least 70% must
be achieved to obtain credit.
4. Complete a brief evaluation.
5. Claim your CME/MOC/ECME credit and receive your certificate
electronically by following the instructions given at the conclusion of
the activity.
CME/MOC/ECME Objective for This Article: Upon completion, the reader
should be able to: 1) reconcile the discordances in AS severity grading be-
tween the different imaging modalities and parameters; 2) implement a
systematic approach to confirm the validity of the Doppler-echocardio-
graphic measures of AS severity; 3) apply and interpret hybrid (Doppler/
multidetector computed tomography [MDCT]) imaging to corroborate
Doppler-echocardiographicmeasures of AS severity; 4) apply and interpret
stress echocardiography to differentiate true-severe versus pseudo-severe
AS in patients with low LVEF, low-flow, low-gradient AS; and 5) apply
and interpret aortic valve calcium scoring by MDCT to differentiate
severe versus non-severe AS in patients with preserved LVEF and
low-gradient AS.
CME/MOC/ECME Editor Disclosure: JACC: Cardiovascular Imaging
CME/MOC/ECME Editor Ragavendra R. Baliga, MD, has reported that he
has no relationships to disclose.
Author Disclosures: TheDepartmentofCardiologyof theLeidenUniversity
Medical Center has received unrestricted research grants from Biotronik,
Boston Scientific, Edwards Lifesciences, GE Healthcare, and Medtronic.
Drs. Hahn and Pibarot have received a research grant from Edwards Life-
sciences for echocardiography core laboratory analyses in the field of
transcatheter aortic valve replacement. Dr. Delgado has received speaker
fees from Abbott Vascular. Dr. Gillam oversees core laboratories that have
research contractswithEdwardsLifesciences LLCandMedtronic; and is an
advisor to Philips. All other authors have reported that they have no re-
lationships relevant to the contents of this paper to disclose.
Medium of Participation: Print (article only); online (article and quiz).
CME/MOC/ECME Term of Approval
Issue Date: February 2019
Expiration Date: January 31, 2020
https://doi.org/10.1016/j.jcmg.2018.11.027

Delgado et al. J A C C : C A R D I O V A S C U L A R I M A G I N G , V O L . 1 2 , N O . 2 , 2 0 1 9
Assessing Discordant Grading of AS Severity F E B R U A R Y 2 0 1 9 : 2 6 7 – 8 2
268
How Do We Reconcile Echo
cardiography,Computed Tomography, and Hybrid Imaging inAssessing Discordant Grading ofAortic Stenosis Severity? Victoria Delgado, MD,a Marie-Annick Clavel, DVM, PHD,b Rebecca T. Hahn, MD,c Linda Gillam, MD,d Jeroen Bax, MD,aPartho P. Sengupta, MD,e Philippe Pibarot, DVM, PHDb
ABSTRACT
Fro
CacCo
He
Vir
Bio
res
va
res
tha
Ma
Up to 40% of patients with aortic stenosis (AS) present with a “discordant grading” usually referred to as “low-gradient
AS.” This article presents a step-by-step integrative approach overview of the utility, limitations, and complementary role
of the different imaging modalities for the assessment of AS severity with a special emphasis on the reconciliation of
discordant grading. The first step is to confirm the validity of echocardiographic measures of AS severity. For example,
hybrid imaging can combine left ventricular outflow tract area measured by 3-dimensional echocardiography or contrast
enhanced multidetector row computed tomography with flow velocities measured by Doppler. The next step is to
differentiate severe from non-severe AS with the use of low-dose dobutamine stress echocardiography, especially in
patients with low left ventricular ejection fraction, low-flow, low-gradient AS. Aortic valve calcium scoring measured by
noncontrast multidetector row computed tomography is preferred in patients with low-gradient AS and preserved left
ventricular ejection fraction as well as in those with inconclusive results with dobutamine stress echocardiography.
(J Am Coll Cardiol Img 2019;12:267–82) © 2019 by the American College of Cardiology Foundation.
A ccurate assessment of aortic stenosis (AS)severity is key for optimal therapeutic deci-sion making. Doppler echocardiography is
the primary imaging modality used for the gradingof AS severity and the main criteria proposed in theguidelines to define severe AS are peak aortic jetvelocity $4 m/s, mean transvalvular gradient (MG)$40 mm Hg, aortic valve area (AVA) <1.0 cm2, andindexed AVA <0.6 cm2/m2 (1,2). In patients with highgradient, there is no ambiguity about the severity ofAS, and aortic valve replacement (AVR) is indicatedif the patient presents with symptoms and/or left ven-tricular (LV) systolic dysfunction; however, up to 40%of patients present with “discordant grading” (i.e. anAVA that is severe [<1.0 cm2 and <0.6 cm2/m2] butwith a low gradient/velocity [<40 mm Hg/<4 m/s]) on
m the aDepartment of Cardiology, Leiden University Medical Centre,
rdiologie et de Pneumologie de Québec/Québec Heart and Lung Institu
lumbia University Medical Center/NY Presbyterian Hospital, New York
alth System, Morristown, New Jersey; and the eWest Virginia Universit
ginia. The Department of Cardiology of the Leiden University Medical Ce
tronik, Boston Scientific, Edwards Lifesciences, GE Healthcare, and M
earch grant from Edwards Lifesciences for echocardiography core labo
lve replacement. Dr. Delgado has received speaker fees from Abbott Vasc
earch contracts with Edwards Lifesciences LLC and Medtronic; and is an
t they have no relationships relevant to the contents of this paper to dis
nuscript received August 17, 2018; revised manuscript received Novembe
Doppler echocardiography (3,4). This discordantgrading pattern, also referred to as “low-gradient AS,”raises uncertainty about the actual severity of thestenosis and thus about the therapeutic managementof the patient if symptomatic. This low-gradient ASentity includes 3 subtypes: 1) classical low-flow (strokevolume index: <35 ml/m2), low-gradient with reducedLV ejection fraction (LVEF <50%); 2) paradoxicallow-flow, low-gradient AS with preserved LVEF; and3) normal-flow (stroke volume index: >35 ml/m2),low-gradient AS. Among patients with low-gradientAS, a substantial proportion (30% to 70%) have truesevere AS and may benefit from AVR (3,4). It is thuscrucial to confirm AS severity in patients withlow-gradient AS, particularly if they present withsymptoms or LV systolic dysfunction.
Leiden, the Netherlands; bInstitut Universitaire de
te, Université Laval, Québec City, Québec, Canada;
, New York; dMorristown Medical Center/Atlantic
y Heart and Vascular Institute, Morgantown, West
nter has received unrestricted research grants from
edtronic. Drs. Hahn and Pibarot have received a
ratory analyses in the field of transcatheter aortic
ular. Dr. Gillam oversees core laboratories that have
advisor to Philips. All other authors have reported
close.
r 12, 2018, accepted November 14, 2018.

AB BR E V I A T I O N S
AND ACRONYM S
2D = 2-dimensional
3D = 3-dimensional
AA = ascending aorta
AS = aortic stenosis
AU = arbitrary unit
AVA = aortic valve area
AVC = aortic valve calcium
AVR = aortic valve
replacement
BSA = body surface area
DSE = dobutamine stress
echocardiography
ELI = energy loss index
LV = left ventricular
LVEF = left ventricular
ejection fraction
LVOT = left ventricular
outflow tract
MDCT = multidetector
computed tomography
MG = mean transvalvular
pressure gradient
TTE = transesophageal
echocardiography
J A C C : C A R D I O V A S C U L A R I M A G I N G , V O L . 1 2 , N O . 2 , 2 0 1 9 Delgado et al.F E B R U A R Y 2 0 1 9 : 2 6 7 – 8 2 Assessing Discordant Grading of AS Severity
269
This article presents an overview of the utility,limitations, and complementarity of the differentimaging modalities for the assessment of AS severitywith a special emphasis on the issue of discordantgrading with echocardiography and betweenmodalities.
The first section of this article is dedicated to theDoppler echocardiographic assessment of AS severityand particularly to the pitfalls in the measurement ofAVA and MG. The low-gradient AS pattern mayindeed be related to an underestimation of AVA and/or an underestimation of MG with echocardiography.This section also covers the role of stress echocardi-ography for the confirmation of AS severity in pa-tients with low-gradient AS (Central Illustration).
The second section describes the utility of hybrid(i.e., multidetector computed tomography [MDCT]Doppler) imaging to corroborate AVA measurementand AS grading severity (Central Illustration). AVA isthe echocardiographic parameter the most prone totechnical errors; the main pitfall in the assessment ofthis parameter is the underestimation of the LVoutflow tract (LVOT) area by 2-dimensional (2D)echocardiography. With hybrid imaging, the LVOTarea is obtained by contrast MDCT. The third sectionpresents the role of aortic valve calcium (AVC) scoringby noncontrast MDCT to confirm AS severity andgrading in patients with low-gradient AS (CentralIllustration).
THE CASE OF DOPPLER
ECHOCARDIOGRAPHY
Since initial studies validating Doppler-derived gra-dients and the continuity equation for calculation ofAVA (5–8), echocardiography has been recognized asthe modality of choice for assessing AS severity. Itsfirst-line status is confirmed in current AmericanCollege of Cardiology/American Heart Association(ACC/AHA) and European Society of Cardiology (ESC)guidelines for valvular heart disease and the 2017appropriate use criteria for multimodality imaging invalvular heart disease (1,2,9). Doppler echocardiog-raphy is typically the workhorse approach, althoughtransesophageal, exercise, and pharmacologic stresstechniques may also be helpful and 3-dimensional(3D) echocardiography is playing an increasinglyimportant role, particularly in transcatheter AVR.
Echocardiography provides a wealth of anatomicand functional information; is free of radiation; iswidely available, lending itself to bedside applica-tions; and is relatively inexpensive. Its widespreaduse for decades has provided a wealth of prognosticinformation that is available with no other technique.
In addition to assessing hemodynamics andcalculating AVA, this noninvasive test as-sesses valve morphology as well as the car-diac response to AS, including LV remodelingand both systolic and diastolic function,mitral regurgitation, and pulmonary hyper-tension. Concomitant changes in the struc-ture of the proximal aorta are alsoidentifiable. According to ACC/AHA guide-lines (1,10), cardiac catheterization should beused to assess AS severity in the setting ofinadequate echocardiographic assessment ordiscrepant clinical/echocardiographic dataonly.
ROUTINE ECHOCARDIOGRAPHIC
MEASURES OF AS SEVERITY
Several echocardiographic parameters can beused to evaluate the hemodynamic severityof AS; how to obtain these parameters is well-described in joint American and Europeanguidelines and will not be detailed here (11).These can be divided into 2 general categories(Table 1): flow-dependent and “relativelyflow-independent.” Flow-dependent mea-surements are obtained from continuous-
wave Doppler across the stenotic aortic valve andinclude peak jet velocity as well as peak and MGsderived using the Bernoulli equation with severe ASassociated with peak and mean gradients $64and $40 mm Hg, respectively, and a peak jetvelocity $4 m/s. The most widely used “relativelyflow-independent” measurements include AVAcalculated from the continuity equation (12–15) andthe Doppler velocity index. The continuity equationcalculation of AVA uses the conservation of massprinciple and normalizes for flow resulting in an ac-curate assessment of stenosis in different flow states.These parameters are not strictly flow independent,but they are much less flow dependent than the MG orpeak jet velocity. Table 2 shows the basic measure-ments required to assess both flow-dependent andflow-independent parameters.A velocity of 4 m/s correlates well with a MG of 35to 40 mm Hg (16), but a peak jet velocity of 4.0 m/sand MG of 40 mm Hg correlate by continuity equationand Gorlin equation to an AVA closer to 0.8 cm2 ratherthan the 1.0 cm2 cutoff used to define severe AS incurrent guidelines (16). Nonetheless, numerous out-comes studies have shown that a continuity equationvalve area of <1.0 cm2 predicts outcomes; thus, AVAremains a reliable tool for diagnosis and managementof these patients (17,18). Some authors have

CENTRAL ILLUSTRATION Algorithm for the Multimodality Imaging Assessment of Patients WithDiscordant Grading of AS Severity at Doppler Echocardiography
DISCORDANT GRADING - LOW GRADIENT AS at TTEAVA ≤1.0 cm2, AVAi <0.6 cm2/m2, MG <40 mm Hg (See Tables 1 & 2)
CONFIRM ACCURACY OF TTE MEASUREMENTS(See Table 3)
CORROBORATE AVA BY HYBRID MDCT-DOPPLER IMAGINGHybrid AVA <1.2 cm2 (See Figure 2)
CONFIRM AS SEVERITY
STEP 1:
STEP 2:
STEP 3:
LOW GRADIENT ASwith PRESERVED LVEF
AORTIC VALVE CALCIUMSCORE BY MDCT:
Severe AS:AVC ≥2000 AU in men,
≥1200 AU in women(See Figure 3)
(if stress echois inconclusive)
*
DOBUTAMINE STRESS ECHOSevere AS:
MG ≥40 mm Hgand AVA <1.0 cm2
Projected AVA <1.0 cm2
LOW GRADIENT ASwith REDUCED LVEF
Rest Stress
Delgado, V. et al. J Am Coll Cardiol Img. 2019;12(2):267–82.
AS ¼ aortic stenosis; AU ¼ arbitrary unit; AVA ¼ aortic valve area; AVC ¼ aortic valve calcification; AVAi ¼ indexed aortic valve area; MDCT ¼ multidetector computed
tomography; MG ¼ mean transvalvular pressure gradient; TTE ¼ transthoracic echocardiography.
TABLE 1 Echocardiographic Parameters Used to Assess the Severity of Aortic Stenosis
Mild Moderate Severe
Structural assessment � Mild leaflet calcification orthickening with reduction insystolic motion
� Mild-to-moderate leaflet calcificationof a bicuspid or tricuspid valve with somereduction in systolic motion or
� Rheumatic valve changes with commis-sural fusion
� Severe leaflet calcification or congenitalstenosis with severely reduced leafletopening
� Planimetered AVA <1.0 cm2
Quantitative parameters(flow-dependent)
Peak velocity 2.0-2.9 m/s 3-3.9 m/s $4 m/s
MG <20 mm Hg 20-39 mm Hg $40 mm Hg
Quantitative parameters(flow-independent)
Doppler index >0.5 0.25-0.5 <0.25
AVA >1.5 cm2 1.0-1.5 cm2 <1.0 cm2
AVA index* >0.90 cm2/m2 0.60-0.90 cm2/m2 <0.6 cm2/m2†
*Indexing the valve area is particularly important in smaller patients with height <135 cm (65 in.), BSA <1.5 m2, or BMI <22 kg/m2. †Cutoff used in setting of BMI <30 kg/m2. In the setting of aBMI $30 kg/m2, a cutoff #0.5 cm2/m2 may be more appropriate.
AVA ¼ aortic valve area; BMI ¼ body mass index; BSA ¼ body surface area; MG ¼ mean gradient.
Delgado et al. J A C C : C A R D I O V A S C U L A R I M A G I N G , V O L . 1 2 , N O . 2 , 2 0 1 9
Assessing Discordant Grading of AS Severity F E B R U A R Y 2 0 1 9 : 2 6 7 – 8 2
270

TABLE 2 Measurements and Calculations Required to Assess Hemodynamic Severity of Aortic Stenosis
Parameter Example Calculation
LVOT diameterMeasured at or just below the level of the aortic
annulus (A). In the setting of ectopic calcification inthe LVOT or annulus, the diameter measurementshould ignore this calcium and measure to the baseof the anterior mitral valve leaflet (B).
LVOT area ¼ 0.785 �(diameter)2
Pulsed wave spectral DopplerLaminar flow just proximal to flow acceleration. The
modal velocity should be traced to measure theLVOT VTI and not the faint higher velocity profile.(A, red line) An incorrectly traced Doppler signal.Reducing the gain or increasing the reject willresult in a (B, green tracing) modal velocity spec-tral profile.
LVOT SV ¼ LVOT area �LVOT VTI
Continuous wave spectral DopplerPerformed from any imaging window that obtains the
highest velocity, with the densest, most uniformcontinuous wave spectral profile. (A) Apical win-dows may not yield a higher velocity than a(B, right parasternal window) nonapical window.Peak velocity, peak and MG, and aortic VTI aremeasured.
Aortic valve area ¼ LVOT SVO aortic VTI
Doppler velocity index ¼LVOT VTI O aortic VTI
Continuous wave spectral Doppler, ejection dynamicsAT >110 ms and AT/ET ratio >0.36 suggests severe AS
Ratio ¼ AT/ET
AT ¼ acceleration time; ET ¼ ejection time; LVOT ¼ left ventricular outflow tract; MG ¼ mean gradient; SV ¼ stroke volume; VTI ¼ velocity time integral.
J A C C : C A R D I O V A S C U L A R I M A G I N G , V O L . 1 2 , N O . 2 , 2 0 1 9 Delgado et al.F E B R U A R Y 2 0 1 9 : 2 6 7 – 8 2 Assessing Discordant Grading of AS Severity
271
suggested decreasing the AVA cutpoint from 1.0 to0.8 cm2 to reconcile the AVA/MG cutpoints andtherefore reduce the proportion of patients withdiscordant grading (19–21). Several recent studiesreported however that patients with AVA between0.8 and 1.0 cm2 and low gradient are at increased riskof cardiac events and exhibit improved survival withAVR (22,23). It thus appears preferable to maintainthe status quo with regard to AVA (<1.0 cm2) and MG($40 mm Hg) cutpoint values of AS severity and usethe AVA threshold as a sensitive marker and the MGthreshold as a specific marker of severe AS.
There are a number of reasons for discordancebetween velocities and gradients and AVA. A sys-tematic assessment of the cause for discordance mayuncover errors that, when corrected, result inconcordant parameters. The 2 most frequent reasonsfor discordance are the incorrect measurement ofeither velocities or LVOT diameter. Current guide-lines recommend a multiwindow approach to imagingthe peak transaortic velocities (11). Failure to imagefrom nonapical windows may result in underestima-tion of the peak velocities in up to 50% of cases, as
reported in 1 study (24). The more acute the aorticroot angulation as measured by 2D echocardiography,the more likely a nonapical window will yield thehighest values of peak velocity. In fact, if only apicalwindows were used, 8% of patients in that studywould have been misclassified from high-gradientsevere AS to low-gradient severe AS, and another15% with severe AS (AVA: <1.0 cm2) were mis-classified as having moderate AS (AVA: >1.0 cm2).
Underestimation of the LVOT diameter contributessignificantly to discordant AS parameters. Althoughthe guidelines allow measurements of the LVOTdiameter to be performed up to 1.0 cm apical to theannulus, historically, the LVOT measurement hasbeen taken at the annulus (5,13,14), and outcomesdata upon which the guidelines are based use thismeasurement to calculate AVA (17,18). Using theannulus also makes sense knowing the relevantanatomy. The aortic annulus is primarily composed ofthe fibrous interleaflet trigones, (25) and varies lesswith the cardiac cycle (in fact, becoming more circularin systole) and thus can be more accurately andreproducibly measured (5,26,27). At a distance of 0.5
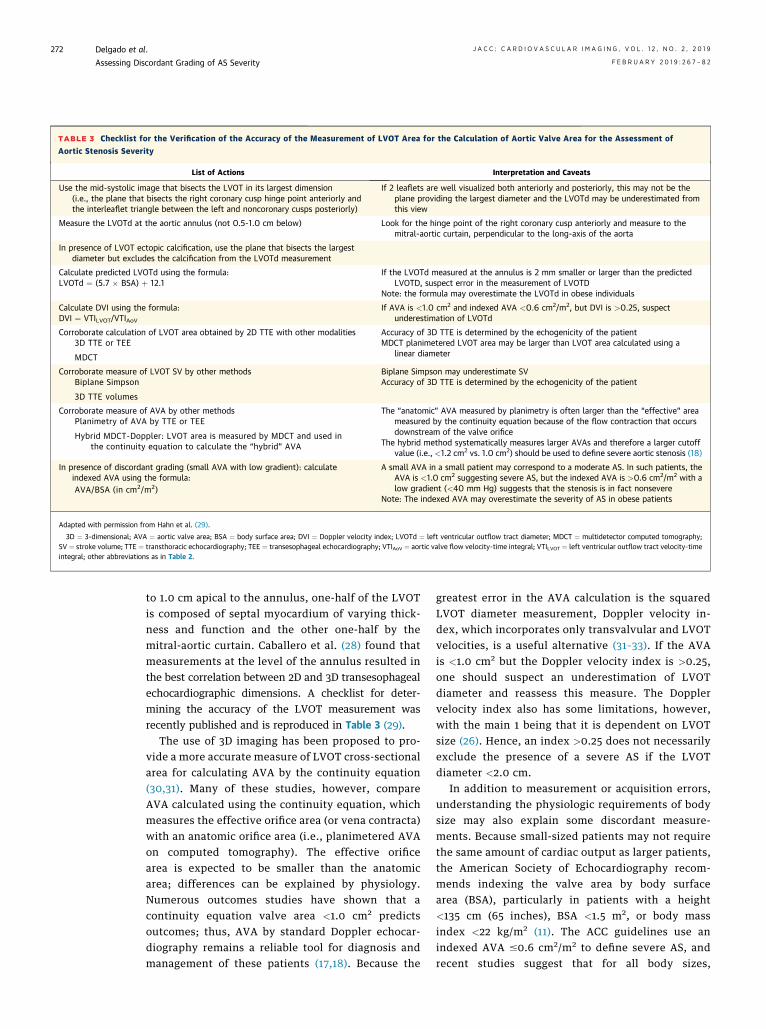
TABLE 3 Checklist for the Verification of the Accuracy of the Measurement of LVOT Area for the Calculation of Aortic Valve Area for the Assessment of
Aortic Stenosis Severity
List of Actions Interpretation and Caveats
Use the mid-systolic image that bisects the LVOT in its largest dimension(i.e., the plane that bisects the right coronary cusp hinge point anteriorly andthe interleaflet triangle between the left and noncoronary cusps posteriorly)
If 2 leaflets are well visualized both anteriorly and posteriorly, this may not be theplane providing the largest diameter and the LVOTd may be underestimated fromthis view
Measure the LVOTd at the aortic annulus (not 0.5-1.0 cm below) Look for the hinge point of the right coronary cusp anteriorly and measure to themitral-aortic curtain, perpendicular to the long-axis of the aorta
In presence of LVOT ectopic calcification, use the plane that bisects the largestdiameter but excludes the calcification from the LVOTd measurement
Calculate predicted LVOTd using the formula:LVOTd ¼ (5.7 � BSA) þ 12.1
If the LVOTd measured at the annulus is 2 mm smaller or larger than the predictedLVOTD, suspect error in the measurement of LVOTD
Note: the formula may overestimate the LVOTd in obese individuals
Calculate DVI using the formula:DVI ¼ VTILVOT/VTIAoV
If AVA is <1.0 cm2 and indexed AVA <0.6 cm2/m2, but DVI is >0.25, suspectunderestimation of LVOTd
Corroborate calculation of LVOT area obtained by 2D TTE with other modalities3D TTE or TEE
MDCT
Accuracy of 3D TTE is determined by the echogenicity of the patientMDCT planimetered LVOT area may be larger than LVOT area calculated using a
linear diameter
Corroborate measure of LVOT SV by other methodsBiplane Simpson
3D TTE volumes
Biplane Simpson may underestimate SVAccuracy of 3D TTE is determined by the echogenicity of the patient
Corroborate measure of AVA by other methodsPlanimetry of AVA by TTE or TEE
Hybrid MDCT-Doppler: LVOT area is measured by MDCT and used inthe continuity equation to calculate the “hybrid” AVA
The “anatomic” AVA measured by planimetry is often larger than the “effective” areameasured by the continuity equation because of the flow contraction that occursdownstream of the valve orifice
The hybrid method systematically measures larger AVAs and therefore a larger cutoffvalue (i.e., <1.2 cm2 vs. 1.0 cm2) should be used to define severe aortic stenosis (18)
In presence of discordant grading (small AVA with low gradient): calculateindexed AVA using the formula:AVA/BSA (in cm2/m2)
A small AVA in a small patient may correspond to a moderate AS. In such patients, theAVA is <1.0 cm2 suggesting severe AS, but the indexed AVA is >0.6 cm2/m2 with alow gradient (<40 mm Hg) suggests that the stenosis is in fact nonsevere
Note: The indexed AVA may overestimate the severity of AS in obese patients
Adapted with permission from Hahn et al. (29).
3D ¼ 3-dimensional; AVA ¼ aortic valve area; BSA ¼ body surface area; DVI ¼ Doppler velocity index; LVOTd ¼ left ventricular outflow tract diameter; MDCT ¼ multidetector computed tomography;SV ¼ stroke volume; TTE ¼ transthoracic echocardiography; TEE ¼ transesophageal echocardiography; VTIAoV ¼ aortic valve flow velocity-time integral; VTILVOT ¼ left ventricular outflow tract velocity-timeintegral; other abbreviations as in Table 2.
Delgado et al. J A C C : C A R D I O V A S C U L A R I M A G I N G , V O L . 1 2 , N O . 2 , 2 0 1 9
Assessing Discordant Grading of AS Severity F E B R U A R Y 2 0 1 9 : 2 6 7 – 8 2
272
to 1.0 cm apical to the annulus, one-half of the LVOTis composed of septal myocardium of varying thick-ness and function and the other one-half by themitral-aortic curtain. Caballero et al. (28) found thatmeasurements at the level of the annulus resulted inthe best correlation between 2D and 3D transesophagealechocardiographic dimensions. A checklist for deter-mining the accuracy of the LVOT measurement wasrecently published and is reproduced in Table 3 (29).
The use of 3D imaging has been proposed to pro-vide a more accurate measure of LVOT cross-sectionalarea for calculating AVA by the continuity equation(30,31). Many of these studies, however, compareAVA calculated using the continuity equation, whichmeasures the effective orifice area (or vena contracta)with an anatomic orifice area (i.e., planimetered AVAon computed tomography). The effective orificearea is expected to be smaller than the anatomicarea; differences can be explained by physiology.Numerous outcomes studies have shown that acontinuity equation valve area <1.0 cm2 predictsoutcomes; thus, AVA by standard Doppler echocar-diography remains a reliable tool for diagnosis andmanagement of these patients (17,18). Because the
greatest error in the AVA calculation is the squaredLVOT diameter measurement, Doppler velocity in-dex, which incorporates only transvalvular and LVOTvelocities, is a useful alternative (31–33). If the AVAis <1.0 cm2 but the Doppler velocity index is >0.25,one should suspect an underestimation of LVOTdiameter and reassess this measure. The Dopplervelocity index also has some limitations, however,with the main 1 being that it is dependent on LVOTsize (26). Hence, an index >0.25 does not necessarilyexclude the presence of a severe AS if the LVOTdiameter <2.0 cm.
In addition to measurement or acquisition errors,understanding the physiologic requirements of bodysize may also explain some discordant measure-ments. Because small-sized patients may not requirethe same amount of cardiac output as larger patients,the American Society of Echocardiography recom-mends indexing the valve area by body surfacearea (BSA), particularly in patients with a height<135 cm (65 inches), BSA <1.5 m2, or body massindex <22 kg/m2 (11). The ACC guidelines use anindexed AVA #0.6 cm2/m2 to define severe AS, andrecent studies suggest that for all body sizes,

J A C C : C A R D I O V A S C U L A R I M A G I N G , V O L . 1 2 , N O . 2 , 2 0 1 9 Delgado et al.F E B R U A R Y 2 0 1 9 : 2 6 7 – 8 2 Assessing Discordant Grading of AS Severity
273
indexing to the BSA (and not body mass index)effectively removes the confounding effect of bodysize on the calculation of AVA (34). This same groupshowed, however, that using an indexed AVA #0.6cm2/m2 increased the prevalence of severe AS,particularly in patients with a BSA >1.75 m2, withoutimproving the predictive accuracy of AVA for aorticvalve–related events and cardiovascular death (35). Arecent study showed that in a population of smallpatients (mean BSA: 1.50 � 0.15 m2), indexed AVAwas predictive of outcomes and the event-free sur-vival of patients with an indexed AVA $0.6 cm2/m2
was better than that for those with an indexedAVA <0.6 cm2/m2 (86% vs. 41% at 3 years; p < 0.01)(36). Others have suggested that an indexedAVA #0.5 cm2/m2 may be a more appropriate cutoffvalue for severe AS in most patients (26,35). Furtherstudy is clearly warranted to understand the role ofindexing for body size and whether a single cutoffvalue can be used for all patients.
When the sources of possible error in measurementof velocity/gradient or LVOT, as well as the contri-bution of body size, have been eliminated and thereremains discordance with low gradient but a smallAVA, then the most common etiology for this scenariois low flow.
Semiquantitative continuous-wave Doppler parame-ters of the ejection dynamics transvalvular velocitymay also be useful to corroborate stenosis severity,particularly in patients with low-gradient AS(Table 2). An acceleration time >110 ms or accelera-tion time/LV ejection time ratio >0.36 has beenassociated with hemodynamically severe AS andworse outcomes (37).
STRESS ECHOCARDIOGRAPHY FOR AS WITH
DISCORDANT MEASURES OF SEVERITY
Although exercise stress testing is contraindicated inpatients with symptomatic AS, pharmacologic stressechocardiography plays an important role, particu-larly in those with a low gradient (<40 mm Hg)despite AVAs in the severe range.
AS is a hemodynamically heterogeneous entity.Current ACC/AHA guidelines have subdivided thesevere, symptomatic AS group of patients into 3separate categories: high-gradient AS; “classical”low-flow, low-gradient AS with reduced LVEF; andlow-gradient AS with normal LVEF. The latter groupof patients can be further divided on the basis ofpreserved (normal-flow) versus reduced (paradoxicallow-flow) stroke volume using a stroke volume index
cutoff of 35 ml/m2. The stroke volume index is a goodmarker of LV pump function and outflow and is apowerful predictor of prognosis both prior and afterAVR. The mean transvalvular flow rate (stroke vol-ume divided by ejection time) is also important froma diagnostic standpoint because the mean gradient isnot only directly related to the stroke volume but alsoinversely related to the ejection time (inverselyrelated). A low-flow state as defined by a mean flowrate <200 ml/s is associated with worse prognosis andwith higher likelihood of “pseudo-moderate”gradient and/or pseudo-severe AVA (38–40).
Dobutamine stress echocardiography (DSE) is animportant tool in patients with classical (low LVEF)low-flow, low-gradient AS to assess the presence offlow reserve and to differentiate true versus pseudosevere stenosis (Central Illustration). DSE is, however,not recommended for patients with paradoxical(preserved LVEF) low-flow, low-gradient AS.Although AVA is relatively flow independent, whenflow is reduced, anatomically narrowed valves mayfail to reach their maximal potential opening. DSE isthus used to increase the transvalvular flow ratewhile avoiding myocardial ischemia. With normalizedflow, a patient with true severe AS will increasethe mean gradient and continue to have a smallcalculated AVA. If the patient has pseudo-severe AS,the valve area will increase with gradients remaininglow.
In the setting of LVEF <50%, the goal of DSE is todetermine if AVA will increase with higher (by at least20%) transvalvular flow rates and improved systolicperformance. Studies have shown that LV flowreserve resulting in an increase in strokevolume $20% is associated with better outcomes withAVR compared with medical therapy (41,42). Subse-quent studies have shown that although patientswithout flow reserve on DSE have high operative andshort-term mortality, survivors still benefit from AVR,with significantly lower 5-year mortality comparedwith medical management (43). Recent studies incontemporary surgical and transcatheter AVR series,however, reported low procedural and 1-year mor-tality rates in patients low LVEF, low-flow, low-gradient AS and did not find any association betweenflow reserve on DSE and outcomes (44–46). Hence,the main interest and purpose of DSE is to confirm thepresence of severe AS and the assessment of flowreserve appears to have fewer clinical implicationsnowadays.
The LV myocardial response to DSE, however, isnot always consistent, and suboptimal increases in

FIGURE 1 Measurement of the LVOT by Echocardiography
A B
LVOT 19 mm LVOT 17 mm
LVOT 19 mm
(A) On conventional 2-dimensional transthoracic echocardiography, from the parasternal long-axis view, the aortic valve is zoomed in to
obtain a better view of the LVOT. In the zoomed view, the diameter of the LVOT can be measured (double arrowhead). Two-dimensional
echocardiography assumes a circular anatomy of the LVOT. (B) The LVOT, however is oval, and with 3-dimensional transthoracic echocar-
diography, the off-axis planes can be avoided by placing the plane that bisects the LVOT correctly. (B, top) The orthogonal plane bisects the
LVOT in the maximum anteroposterior diameter, whereas at the bottom, the plane bisects the LVOT off-axis, leading to smaller LVOT
diameter in the orthogonal parasternal long-axis view. This leads to a significant underestimation of the aortic valve area. LVOT ¼ left
ventricular outflow tract.
Delgado et al. J A C C : C A R D I O V A S C U L A R I M A G I N G , V O L . 1 2 , N O . 2 , 2 0 1 9
Assessing Discordant Grading of AS Severity F E B R U A R Y 2 0 1 9 : 2 6 7 – 8 2
274
flow rate may prevent the accurate interpretation ofthis test. To overcome this limitation, the projectedAVA at a standardized normal flow rate has beensuggested as an alternative approach (44).
PARADOXICAL LOW-FLOW, LOW-GRADIENT AS.
In paradoxical low-flow, low-gradient AS with pre-served LVEF, a number of physiologic situationscan result in low flow in the setting of normalLVEF: tachycardia (47), bradycardia (48), hyperten-sion (49–51), small ventricular cavity (52), severediastolic dysfunction, severe mitral or tricuspid valvedisease (53), pulmonary hypertension, and rightventricular dysfunction (54). The ACC/AHA guide-lines do not advocate using DSE with LVEF >50%.Recent studies suggest that quantitative valve cal-cium scoring by MDCT may be useful, as discussed ina later section (55–57).
Patients with severe AS but normal flow and lowgradient are particularly vexing. This discordancein parameters may be related to inherent in-consistencies in the accepted grading scheme becausean AVA of 1.0 cm2 actually corresponds to mean gra-dients of 30 to 35 mm Hg (not 40 mm Hg) in normalflow conditions or to reduced arterial compliance thatresults in faster and earlier arterial pulse wavereflection from the periphery and ensuing dampeningof the transvalvular gradients. The normal-flow, low-gradient entity may also be related to measurementerrors that result in underestimation of stroke volumeand thus AVA and/or underestimation of gradient orfailure to account for the importance of body size. It isalso possible that patients with “normal flow/lowgradient” have normal stroke volume in the setting ofa prolonged ejection time, resulting in a low gradient.

FIGURE 2 Measurement of AVA by Hybrid Imaging
A C
E F
DB
LVOT 21 mm Mean gradient 36 mmHg Svi 38 ml/m2
AVA 0.93 cm2
487.7 HU ± 80.0446 mm2
AVA 0.49 cm2
Example of a patient with low-gradient normal flow severe aortic stenosis, with a calculated AVA of 0.49 cm2 based on 2-dimensional transthoracic echocardiography.
(A) Tricuspid aortic valve with limited opening. (B) The LVOT is measured on a zoomed parasternal view. (C, D) The mean transvalvular gradient and the pulsed wave
recording of the LVOT and stroke volume index, respectively. (E) After aligning the multiplanar reformation planes on the multidetector row computed tomography
data, (F) the cross-sectional area of the LVOT can be measured and included in the continuity equation resulting in an AVA of 0.93 cm2. AVA ¼ aortic valve area;
Svi ¼ stroke volume index; other abbreviation as in Figure 1.
J A C C : C A R D I O V A S C U L A R I M A G I N G , V O L . 1 2 , N O . 2 , 2 0 1 9 Delgado et al.F E B R U A R Y 2 0 1 9 : 2 6 7 – 8 2 Assessing Discordant Grading of AS Severity
275
OTHER MEASURES OF AS SEVERITY. A less widelyused measure of AS severity is aortic valve resistance,which is the pressure gradient/flow rate ratio. Byechocardiography, it is simply calculated as: 1.333�4Vpeak2/(area LVOT�velocity LVOT), in which Vpeakindicates peak velocity. As such, valve resistance is afunctional index of hemodynamic impairment andmay be less flow dependent than AVA (58). The en-ergy loss index (ELI) is another measure that attemptsto account for the total fluid mechanical energy lossrelated to both AVA and ascending aorta area (59).The ELI is calculated as: ELI ¼ [AVA � AA/AA � AVA]/BSA, where AA is the cross-sectional area of theascending aorta. Similar to AVA, it is less flowdependent than gradient or peak velocity, takes intoaccount pressure recovery, and is roughly equivalentto AVA measured by catheter (60). Using ELI, a
substudy of the SEAS (Simvastatin Ezetimibe in AorticStenosis) trial reclassified 47.5% of patients from se-vere to nonsevere AS (61). The energy loss is mostsignificant in patients with small aortas (<30 mm). AnELI #0.5 to 0.6 cm2/m2 is consistent with severe AS(61,62).
WHEN ARE COMPLEMENTARY MODALITIES FOR
ASSESSING AS SEVERITY MOST HELPFUL?
When imaging features, peak, MGs, and AVA areconsistent and unequivocally identify AS as severe,complementary imaging modalities are typically notrequired other than to plan transcatheter in-terventions. Similarly, in the patient with low-flow,low-gradient severe AS in whom stroke volumeincreases with an intervention, typically dobutamine,and gradients rise correspondingly, additional

FIGURE 3 Utility of Aortic Valve Calcification Score Measured by MDCT to Predict Hemodynamic and Clinical Outcomes in AS
7
6
5
4
3
Peak
Aor
tic J
et V
eloc
ity, (
m/s
)
Aortic Valve Calcification, (AU)
Associations Between Aortic Valve CalcificationLoad and Peak Aortic Jet Velocity
A B
D
Thresholds Identifying Severe Aortic Stenosis inWomen and Men
Effects of AVC Burden on Survival in Patientswith AS Under Medical Treatment
C Impact of AVC Burden on Mortality in Patients with AS,by Sex
WOMEN MEN
Follow-Up (Years)
Surv
ival
Unde
r Med
ical
Tre
atm
ent,
(%)
2
10 2000
Women; r = 0.75; p < 0.0001Men; r = 0.74; p < 0.0001
Pcov < 0.0001
4000 6000 8000 10000
100
Women
Men
Sex
0.91
0.92
-
-
0.90
0.89
AUC
1,274 AU
1,377 AU
1,200 AU
2,000 AU
2,065 AU
2,062 AU
AVC Thresholds
Clavel 2014
Reference
Pawade 2018
ESC/EACTS Guidelines
ESC/EACTS Guidelines
Clavel 2014
Pawade 2018
80
60
40
20
00 1 2 3 4 5
417 300
No193
41 ±6%
78 ±6%
p < 0.0001Adjusted p = 0.03
Severe AVC:101 70 50
377 125 65 32 18 13
Aortic Valve Calcification, (AU)
Rela
tive
Risk
of M
orta
lity
4.000Clavel 2014 Pawade 2018
1.000
0.125
500010
001500
20002500
30003500
4000
Aortic Valve Calcification, (AU)
Rela
tive
Risk
of M
orta
lity
4.000
1.000
0.125
500010
001500
20002500
30003500
4000
Yes
Clavel 2014 Pawade 2018
(A) AVC has been demonstrated to be lower in women than in men for the same AS severity, as measured by peak aortic jet velocity (69). (B) Sex-specific thresholds
have been derived and validated (57,70), (C) which have been confirmed by mortality studies (70,71) (D) in which severe AVC had an independent impact on mortality
(71). AS ¼ aortic stenosis; AU ¼ arbitrary unit; AUC ¼ area under the curve; AVC ¼ aortic valve calcification; EACTS ¼ European Association for Cardio-Thoracic Surgery;
ESC ¼ European Society of Cardiology.
Delgado et al. J A C C : C A R D I O V A S C U L A R I M A G I N G , V O L . 1 2 , N O . 2 , 2 0 1 9
Assessing Discordant Grading of AS Severity F E B R U A R Y 2 0 1 9 : 2 6 7 – 8 2
276
imaging will not be required. As discussed next,however, complementary imaging modalities may behelpful in other scenarios of low-gradient AS. Inva-sive hemodynamic assessment by left heart cathe-terization may also be considered in patients withdiscordant or uncertain grading of AS severity onDoppler echocardiography; however, this method isnot without risk for the patients and does not obviatethe need for dobutamine stress to confirm AS severityin patients with low states.
THE CASE OF HYBRID
MDCT-DOPPLER IMAGING
Accurate and reproducible measurement of the LVOTwith 2D echocardiography remains challenging. The
LVOT has an oval rather than circular geometry, andits area is a key measurement in the grading of AS(Figure 1A). The anteroposterior diameter, which issmaller than the septal to lateral diameter (in thecoronal plane), is generally used to measure the LVOTarea by 2D echocardiography. It is difficult to ascer-tain, however, that the anteroposterior diameter isappropriately measured because off-axis views arenot infrequent and may lead to significant underes-timation of the diameter and subsequently underes-timate the stroke volume and AVA (Figure 1B). Thismay be particularly challenging in sequential echo-cardiograms performed for AS severity surveillance.Data acquisition with different ultrasound systemsand different operators may result in different LVOTdiameter measurements. To minimize the impact of

FIGURE 4 Echocardiographic and Tomographic Measurements in a Low-Flow, Low-Gradient Patient With AS and Preserved LV Ejection Fraction
A EMan - 69 years old — Low-Flow, Low-Gradient Aortic Stenosis
Ao Valve measurements:Vpeak: 2.7m/sVTI: 65.7cmMean Gradient: 18 mmHgAVA: 0.96cm2
LVOT measurements:
VTI: 20.1cmSV: 63.1mlSVi: 31.6ml/m2
LVOTd: 2.0cm
cm/s
-80
-240
-160
-320
55bpm75mm/s-120
-100
-80
-40
-20
-60
cm/s
55bpm75mm/s
Echocardiography:LV Ejection Fraction: 65%Stroke Volume Index: 31.6 ml/m2
Flow rate: 180 ml/s
Stroke VolumeLV ejection time
Flow rate =
Computed Tomography:Aortic Valve Calcification: 1306 AU
AVC density: 403 AU/cm2
D
B
FC
Aortic Valve Area: 0.96 cm2
Indexed Aortic Valve Area: 0.48 cm2/m2
Mean gradient: 18 mm Hg
A 69-year-old man with preserved LV ejection fraction. In the (A) parasternal short-axis and (B) long-axis views, the valve appears to be thickened and calcified. (B) The
LVOTd is measured at 2.0 cm. The (C) pulsed-wave and (D) continuous-wave Doppler measurements demonstrated a low MG and a small aortic valve area. The stroke
volume index is <35 ml/m2, demonstrating a low-flow state, which is confirmed by a mean transvalvular flow rate of 180 ml/s. (E, F) The noncontrast MDCT shows a
moderately calcified aortic valve, with an AVC at 1,306 AU. Even after dividing the AVC by the surface of the aortic annulus area (calculated with echocardiography),
the AVC density remained in the nonsevere range. LVOTd ¼ left ventricular outflow tract diameter; MG ¼ mean transvalvular pressure gradient; MDCT ¼ multi-
detector row computed tomography; SV ¼ stroke volume; Vpeak ¼ peak aortic jet velocity; VTI ¼ velocity-time integral; other abbreviations as in Figures 1 to 3.
J A C C : C A R D I O V A S C U L A R I M A G I N G , V O L . 1 2 , N O . 2 , 2 0 1 9 Delgado et al.F E B R U A R Y 2 0 1 9 : 2 6 7 – 8 2 Assessing Discordant Grading of AS Severity
277
this problem in the stroke volume and AVA calcula-tion, current recommendations advocate the use ofsame LVOT diameter over time (11).
The use of 3D imaging techniques including 3Dtransesophageal echocardiography (TTE), MDCT, orcardiac magnetic resonance permits the reconstruc-tion of the LVOT plane where the cross-sectional areacan be measured. By introducing this value of LVOTarea into the continuity equation, a “hybrid” AVA canbe obtained that may be helpful to corroborate ASseverity in patients with discordant grading on TTE(Central Illustration). Several studies have shown theimpact of using 3D planimetered LVOT area on thegrading of AS (18,63–65). Ng et al. (63) demonstrated,in a study including 53 patients with severe ASreferred for transcatheter AVR, that 2D TTE under-estimated significantly the LVOT area and AVA
compared with 3D TTE and MDCT. By introducing theLVOT area planimetered on 3D TTE or MDCT re-constructions into the continuity equation, 25% of thepatients would have been reclassified into moderateAS (using a cutoff value <1 cm2 to define severe AS)(63). In a subsequent study by O’Brien et al. (64),including 51 patients with severe AS, the use of MDCTLVOT planimetered area into the continuity equationled to significantly larger AVA compared with stan-dard Doppler echocardiography (0.86 � 0.28 cm2 vs.0.67 � 0.13 cm2; p < 0.001). The percentage of pa-tients with severe AS and congruent AVA <0.8 cm2
and Doppler velocity index #0.25 increased from 59%to 92% when using hybrid MDCT-Doppler imagingversus standard echocardiography (64). These resultswere confirmed and extended by Kamperidis et al.(65) in a study of 191 patients with severe AS and
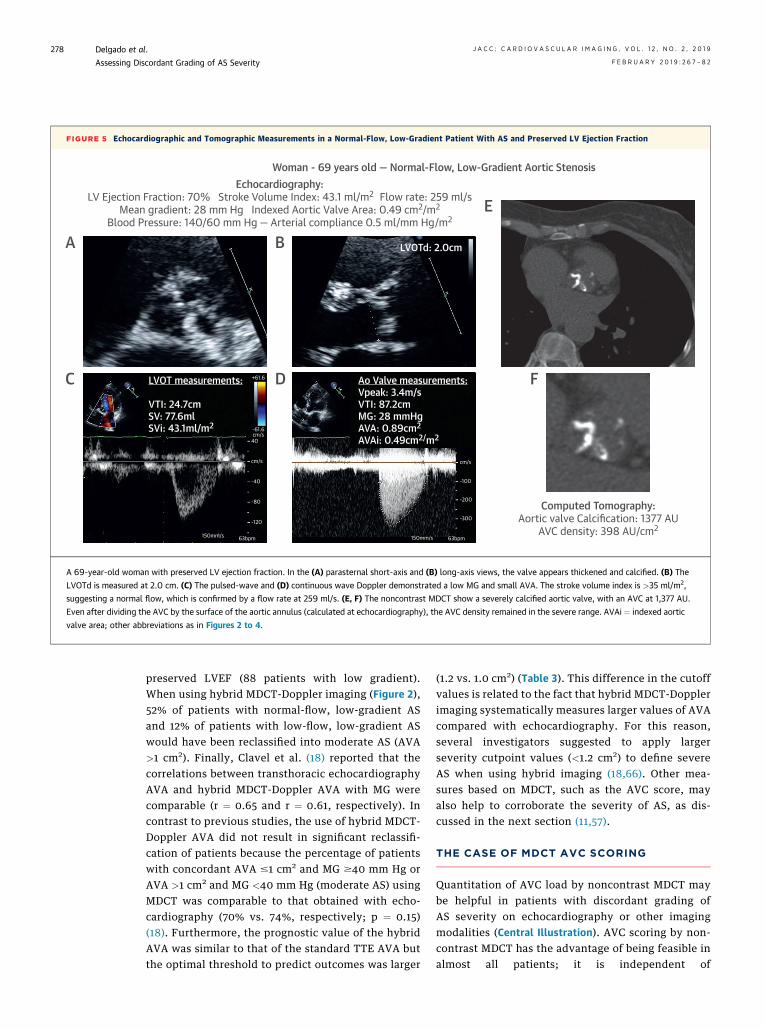
FIGURE 5 Echocardiographic and Tomographic Measurements in a Normal-Flow, Low-Gradient Patient With AS and Preserved LV Ejection Fraction
A
E
Woman - 69 years old — Normal-Flow, Low-Gradient Aortic Stenosis
Ao Valve measurements:Vpeak: 3.4m/sVTI: 87.2cmMG: 28 mmHgAVA: 0.89cm2
AVAi: 0.49cm2/m2
LVOT measurements:
VTI: 24.7cmSV: 77.6mlSVi: 43.1ml/m2
LVOTd: 2.0cm
cm/s
-100
-200
-300
63bpm150mm/s
-120
-80
-40
40
-61.6cm/s
+61.6
cm/s
63bpm150mm/s
Echocardiography:LV Ejection Fraction: 70% Stroke Volume Index: 43.1 ml/m2 Flow rate: 259 ml/s
Mean gradient: 28 mm Hg Indexed Aortic Valve Area: 0.49 cm2/m2
Blood Pressure: 140/60 mm Hg — Arterial compliance 0.5 ml/mm Hg/m2
Computed Tomography:Aortic valve Calcification: 1377 AU
AVC density: 398 AU/cm2
D
B
FC
A 69-year-old woman with preserved LV ejection fraction. In the (A) parasternal short-axis and (B) long-axis views, the valve appears thickened and calcified. (B) The
LVOTd is measured at 2.0 cm. (C) The pulsed-wave and (D) continuous wave Doppler demonstrated a low MG and small AVA. The stroke volume index is >35 ml/m2,
suggesting a normal flow, which is confirmed by a flow rate at 259 ml/s. (E, F) The noncontrast MDCT show a severely calcified aortic valve, with an AVC at 1,377 AU.
Even after dividing the AVC by the surface of the aortic annulus (calculated at echocardiography), the AVC density remained in the severe range. AVAi ¼ indexed aortic
valve area; other abbreviations as in Figures 2 to 4.
Delgado et al. J A C C : C A R D I O V A S C U L A R I M A G I N G , V O L . 1 2 , N O . 2 , 2 0 1 9
Assessing Discordant Grading of AS Severity F E B R U A R Y 2 0 1 9 : 2 6 7 – 8 2
278
preserved LVEF (88 patients with low gradient).When using hybrid MDCT-Doppler imaging (Figure 2),52% of patients with normal-flow, low-gradient ASand 12% of patients with low-flow, low-gradient ASwould have been reclassified into moderate AS (AVA>1 cm2). Finally, Clavel et al. (18) reported that thecorrelations between transthoracic echocardiographyAVA and hybrid MDCT-Doppler AVA with MG werecomparable (r ¼ 0.65 and r ¼ 0.61, respectively). Incontrast to previous studies, the use of hybrid MDCT-Doppler AVA did not result in significant reclassifi-cation of patients because the percentage of patientswith concordant AVA #1 cm2 and MG $40 mm Hg orAVA >1 cm2 and MG <40 mm Hg (moderate AS) usingMDCT was comparable to that obtained with echo-cardiography (70% vs. 74%, respectively; p ¼ 0.15)(18). Furthermore, the prognostic value of the hybridAVA was similar to that of the standard TTE AVA butthe optimal threshold to predict outcomes was larger
(1.2 vs. 1.0 cm2) (Table 3). This difference in the cutoffvalues is related to the fact that hybrid MDCT-Dopplerimaging systematically measures larger values of AVAcompared with echocardiography. For this reason,several investigators suggested to apply largerseverity cutpoint values (<1.2 cm2) to define severeAS when using hybrid imaging (18,66). Other mea-sures based on MDCT, such as the AVC score, mayalso help to corroborate the severity of AS, as dis-cussed in the next section (11,57).
THE CASE OF MDCT AVC SCORING
Quantitation of AVC load by noncontrast MDCT maybe helpful in patients with discordant grading ofAS severity on echocardiography or other imagingmodalities (Central Illustration). AVC scoring by non-contrast MDCT has the advantage of being feasible inalmost all patients; it is independent of

J A C C : C A R D I O V A S C U L A R I M A G I N G , V O L . 1 2 , N O . 2 , 2 0 1 9 Delgado et al.F E B R U A R Y 2 0 1 9 : 2 6 7 – 8 2 Assessing Discordant Grading of AS Severity
279
hemodynamics and, in particular for transvalvularflow, does not require any contrast or stress agent andis associated with low radiation exposure (<2 mSV).
The method used to assess AVC is the Agatstonmethod described for coronary artery calcificationevaluation in 1990 (67). Briefly, the software iden-tifies as calcification any area of 4 adjacent pixelswith density >130 Hounsfield units. The operator canthen manually select areas of calcification locatedwithin the aortic valve cusps. Measurement of AVCload by noncontrast MDCT is highly reliable andreproducible. Indeed, there is a strong correlationbetween AVC measured by MDCT and the content ofcalcium measured directly in explanted aortic valves(68); moreover, the intraobserver and interobservervariability of AVC measurement is excellent (w5%)(68,69).
AVC correlates well with the hemodynamicseverity of AS (56,68); however, until recently, thesignificant overlap in AVC between patients with he-modynamically severe and those with nonsevere ASmade its implementation difficult in clinical practice.This conundrum has been resolved with the demon-stration that women have a lower AVC load than menfor the same hemodynamic AS severity (Figure 3) (69).This finding led to the derivation of sex-specificthresholds of AVC for the identification of severeAS. Acknowledging this, the 2017 ESC guidelinesrecommend using different cutoff values of AVC toidentify severe AS in women ($1,200 arbitrary units[AU]) and in men ($2,000 AU) (2). The guidelines alsopropose thresholds beyond which the stenosis is verylikely severe ($1,600 AU in women and $3,000 AU inmen) and thresholds below which the stenosis is verylikely not severe (<800 AU in women and <1,600 AUin men). AVC may also be indexed for the cross-sectional area of the aortic annulus to calculate theAVC density. This indexing for aortic annulus, how-ever, does not reconcile the sex-related differences inthe severity thresholds; an AVC density $300 AU/cm2
in women or $500 AU/cm2 in men suggest severe AS.These thresholds of AVC and AVC density wereinitially proposed by Clavel et al. (57) and have beenrecently confirmed in a multicenter study (70)(Figure 3). Moreover, the use of different scanners forimage acquisition and different software for imageanalysis is reported not to have any significant effecton thresholds levels or accuracy of AVC (area underthe curve: $0.89) to identify severe AS (57,70). Thethresholds of AVC have also been validated byoutcome studies demonstrating that patients withsevere AVC experience an excess mortality undermedical management (Figure 3) (70,71). Moreover,
AVC load has prognostic value over clinical andechocardiographic assessment to predict both ASprogression rates and need for AVR (71,72), whichmay help in determining the optimal timing forintervention.
The 2017 ESC guidelines (2) recommend using theAVC measured by noncontrast MDCT to confirm ASseverity in: 1) patients with low LVEF, low flow, lowgradient in whom DSE remains inconclusive and 2)patients with low-gradient AS and preserved LVEF.Figures 4 and 5 present illustrative cases of patientswith paradoxical low-flow, low-gradient AS andnormal-flow, low-gradient AS in whom MDCT-derived AVC was used to confirm AS severity.
As with any imaging modality, the MDCT AVCscore is not a perfect method to assess AS severity.Indeed, this parameter is also subject to measure-ment errors and may underestimate AS severity,particularly in younger women with bicuspid AS (73).In such patients, the fibrotic valvular burden, which isnot captured by MDCT, is likely the main determinantof AS hemodynamic severity.
CONCLUSIONS
Up to 40% of patients present with a discordantgrading of AS (i.e., small AVA and low gradient) atDoppler echocardiography. In these patients, stenosisseverity remains uncertain and echocardiography andadditional imaging modalities may be required toconfirm AS severity and eventual indication for AVR.
The first step in these patients with discordantgrading is to confirm the validity of the echocardio-graphic measurements as described in the beginningof this article (Central Illustration). 1 of the mainsources of errors in stroke volume and AVA estima-tion by transthoracic echocardiography is the mea-surement of the LVOT area (Tables 2 and 3).
The LVOT cross-section is often elliptical; in suchcases, 2D echocardiography, which measures thesmaller diameter of the ellipse, may underestimatethe LVOT area. If the patient still harbors discordantgrading after ruling out measurement errors in theechocardiographic parameters, the second step is toperform hybrid imaging combining LVOT areameasured by contrast-enhanced MDCT or 3D echo-cardiography with flow velocities measured byDoppler to corroborate the measurement of AVA(Central Illustration). As previously noted, however,given that hybrid MDCT-Doppler imaging systemat-ically measures larger values of AVA compared withechocardiography, some studies suggest that largerseverity cutpoint values should be used to define

Delgado et al. J A C C : C A R D I O V A S C U L A R I M A G I N G , V O L . 1 2 , N O . 2 , 2 0 1 9
Assessing Discordant Grading of AS Severity F E B R U A R Y 2 0 1 9 : 2 6 7 – 8 2
280
severe AS when using hybrid imaging <1.2 cm2
(18,66).If discordant grading of AS (i.e., small AVA with
nonsevere gradient) persists after step 2, the nextstep (step 3) is to confirm stenosis severity usingother imaging modalities (Central Illustration): 1) low-dose DSE may be used especially in patients with lowLVEF, low-flow, low-gradient AS; 2) AVC scoring bynoncontrast MDCT may be used in patients with low-gradient AS and preserved LVEF as well as in thosewith inconclusive results with DSE. This method isbecoming 1 of the preferred approaches to confirm ASseverity in low-gradient AS and it is now recom-mended in the 2017 European guidelines for thispurpose (2).
There is no single modality and parameter able toaccurately grade AS severity in all patients. In patientswith concordant grading with transthoracic echocardi-ography, no other imaging modality is required toguide therapeutic management. In patients withdiscordant grading, however, a step-by-step integrativeapproach that includes several imaging modalities andparameters should be considered to confirm ASseverity and the need for AVR.
ADDRESS FOR CORRESPONDENCE: Dr. PhilippePibarot, Institut Universitaire de Cardiologie et dePneumologie de Québec, 2725 Chemin Sainte-Foy,Québec City, Québec G1V-4G5, Canada. E-mail:[email protected].
RE F E RENCE S
1. Nishimura RA, Otto CM, Bonow RO, et al. 2017AHA/ACC focused update of the 2014 AHA/ACCguideline for the management of patients withvalvular heart disease: a report of the AmericanCollege of Cardiology/American Heart AssociationTask Force on clinical practice guidelines. J AmColl Cardiol 2017;70:252–89.
2. Baumgartner H, Falk V, Bax JJ, et al. 2017 ESC/EACTS guidelines for the management of valvularheart disease: the Task Force for the managementof valvular heart disease of the European Societyof Cardiology (ESC) and the European Associationfor Cardio-Thoracic Surgery (EACTS). Eur Heart J2017;38:2739–91.
3. Clavel MA, Magne J, Pibarot P. Low-gradientaortic stenosis. Eur Heart J 2016;37:2645–57.
4. Clavel MA, Burwash IG, Pibarot P. Cardiacimaging for assessing low-gradient severe aorticstenosis. J Am Coll Cardiol Img 2017;10:185–202.
5. Oh JK, Taliercio CP, Holmes DR Jr., et al. Pre-diction of the severity of aortic stenosis byDoppler aortic valve area determination: pro-spective Doppler-catheterization correlation in100 patients. J Am Coll Cardiol 1988;11:1227–34.
6. Otto CM, Pearlman AS, Gardner CL, et al.Experimental validation of Doppler echocardio-graphic measurement of volume flow through thestenotic aortic valve. Circulation 1988;78:435–41.
7. Reimold SC, Ganz P, Bittl JA, et al. Effectiveaortic regurgitant orifice area: description of amethod based on the conservation of mass. J AmColl Cardiol 1991;18:761–8.
8. Chambers JB, Sprigings DC, Cochrane T, et al.Continuity equation and Gorlin formula comparedwith directly observed orifice area in native andprosthetic aortic valves. Br Heart J 1992;67:193–9.
9. Bonow RO, Brown AS, Gillam LD, et al. ACC/AATS/AHA/ASE/EACTS/HVS/SCA/SCAI/SCCT/SCMR/STS 2017 appropriate use criteria for the treatmentof patients with severe aortic stenosis: a reportof the American College of Cardiology AppropriateUse Criteria Task Force, American Associationfor Thoracic Surgery, American Heart Association,
American Society of Echocardiography, EuropeanAssociation for Cardio-Thoracic Surgery,Heart Valve Society, Society of CardiovascularAnesthesiologists, Society for CardiovascularAngiography and Interventions, Society of Car-diovascular Computed Tomography, Society forCardiovascular Magnetic Resonance, and Societyof Thoracic Surgeons. J Am Coll Cardiol 2017;70:2566–98.
10. Nishimura RA, Otto CM, Bonow RO, et al. 2014AHA/ACC guideline for the management of pa-tients with valvular heart disease: executive sum-mary. A report of the American College ofCardiology/American heart association task forceon practice guidelines. J Am Coll Cardiol 2014;63:2438–88.
11. Baumgartner H, Hung J, Bermejo J, et al.Recommendations on the echocardiographicassessment of aortic valve stenosis: a focusedupdate from the European Association of Cardio-vascular Imaging and the American Society ofEchocardiography. J Am Soc Echocardiogr 2017;30:372–92.
12. Hatle L. Assessment of aortic blood flow ve-locities with continuous wave Doppler ultrasoundin the neonate and young child. J Am Coll Cardiol1985;5:113S–9S.
13. Skjaerpe T, Hegrenaes L, Hatle L. Noninvasiveestimation of valve area in patients with aorticstenosis by Doppler ultrasound and two-dimensional echocardiography. Circulation 1985;72:810–8.
14. Otto CM, Pearlman AS, Comess KA,Reamer RP, Janko CL, Huntsman LL. Determina-tion of the stenotic aortic valve area in adultsusing Doppler echocardiography. J Am Coll Cardiol1986;7:509–17.
15. Zoghbi WA, Farmer KL, Soto JG, Nelson JG,Quinones MA. Accurate noninvasive quantificationof stenotic aortic valve area by Doppler echocar-diography. Circulation 1986;73:452–9.
16. Minners J, Allgeier M, Gohlke-Baerwolf C,Kienzle RP, Neumann FJ, Jander N. Inconsistenciesof echocardiographic criteria for the grading of
aortic valve stenosis. Eur Heart J 2008;29:1043–8.
17. Malouf J, Le Tourneau T, Pellikka P, et al.Aortic valve stenosis in community medical prac-tice: determinants of outcome and implications foraortic valve replacement. J Thorac Cardiovasc Surg2012;144:1421–7.
18. Clavel MA, Malouf J, Messika-Zeitoun D,Araoz PA, Michelena HI, Enriquez-Sarano M. Aorticvalve area calculation in aortic stenosis by CT andDoppler echocardiography. J Am Coll Cardiol Img2015;8:248–57.
19. Minners J, Allgeier M, Gohlke-Baerwolf C,Kienzle RP, Neumann FJ, Jander N. Inconsistentgrading of aortic valve stenosis by current guide-lines: haemodynamic studies in patients withapparently normal left ventricular function. Heart2010;96:1463–8.
20. Jander N, Minners J, Holme I, et al. Outcomeof patients with low-gradient “severe” aortic ste-nosis and preserved ejection fraction. Circulation2011;123:887–95.
21. Zoghbi WA. Low-gradient “severe” aortic ste-nosis with normal systolic function: time to refinethe guidelines? Circulation 2011;123:838–40.
22. Berthelot-Richer M, Pibarot P, Capoulade R,et al. Discordant grading of aortic stenosisseverity: echocardiographic predictors of survivalbenefit associated with aortic valve replacement.J Am Coll Cardiol Img 2016;9:797–805.
23. Mehrotra P, Jansen K, Tan TC, Flynn A,Hung JW. Clinical features and prognosis of pa-tients with isolated severe aortic stenosis andvalve area less than 1.0 cm2. Heart 2018;104:222–9.
24. Thaden JJ, Nkomo VT, Lee KJ, Oh JK. Dopplerimaging in aortic stenosis: the importance of thenonapical imaging windows to determine severityin a contemporary cohort. J Am Soc Echocardiogr2015;28:780–5.
25. Tretter JT, Spicer DE, Mori S, Chikkabyrappa S,Redington AN, Anderson RH. The significance ofthe interleaflet triangles in determining themorphology of congenitally abnormal aortic

J A C C : C A R D I O V A S C U L A R I M A G I N G , V O L . 1 2 , N O . 2 , 2 0 1 9 Delgado et al.F E B R U A R Y 2 0 1 9 : 2 6 7 – 8 2 Assessing Discordant Grading of AS Severity
281
valves: implications for noninvasive imaging andsurgical management. J Am Soc Echocardiogr2016;29:1131–43.
26. Michelena HI, Margaryan E, Miller FA, et al.Inconsistent echocardiographic grading of aorticstenosis: is the left ventricular outflow tractimportant? Heart 2013;99:921–31.
27. LaBounty TM, Miyasaka R, Chetcuti S, et al.Annulus instead of LVOT diameter improvesagreement between echocardiography effectiveorifice area and invasive aortic valve area. J AmColl Cardiol Img 2014;7:1065–6.
28. Caballero L, Saura D, Oliva-Sandoval MJ, et al.Three-dimensional morphology of the left ven-tricular outflow tract: impact on grading aorticstenosis severity. J Am Soc Echocardiogr 2017;30:28–35.
29. Hahn RT, Pibarot P. Accurate measurement ofleft ventricular outflow tract diameter: commenton the updated recommendations for the echo-cardiographic assessment of aortic valve stenosis.J Am Soc Echocardiogr 2017;30:1038–41.
30. Shahgaldi K, Manouras A, Brodin LA, Winter R.Direct measurement of left ventricular outflowtract area using three-dimensional echocardiog-raphy in biplane mode improves accuracy of strokevolume assessment. Echocardiography 2010;27:1078–85.
31. Gaspar T, Adawi S, Sachner R, et al. Three-dimensional imaging of the left ventricularoutflow tract: impact on aortic valve area esti-mation by the continuity equation. J Am SocEchocardiogr 2012;25:749–57.
32. Rusinaru D, Malaquin D, Maréchaux S, Debry N,Tribouilloy C. Relation of dimensionless index tolong-term outcome in aortic stenosis with pre-served LVEF. J Am Coll Cardiol Img 2015;8:766–75.
33. Jander N, Hochholzer W, Kaufmann BA, et al.Velocity ratio predicts outcomes in patients withlow gradient severe aortic stenosis and preservedEF. Heart 2014;100:1946–53.
34. Minners J, Gohlke-Baerwolf C, Kaufmann BA,et al. Adjusting parameters of aortic valve stenosisseverity by body size. Heart 2014;100:1024–30.
35. Jander N, Gohlke-Barwolf C, Bahlmann E,et al. Indexing aortic valve area by body surfacearea increases the prevalence of severe aorticstenosis. Heart 2014;100:28–33.
36. Saito T, Muro T, Takeda H, et al. Prognosticvalue of aortic valve area index in asymptomaticpatients with severe aortic stenosis. Am J Cardiol2012;110:93–7.
37. Ringle Griguer A, Tribouilloy C, Truffier A, et al.Clinical significance of ejection dynamics parame-ters in patients with aortic stenosis: an outcomestudy. J Am Soc Echocardiogr 2018;31:551–60.
38. Chahal NS, Drakopoulou M, Gonzalez-Gonzalez AM, Manivarmane R, Khattar R, Senior R.Resting aortic valve area at normal transaorticflow rate reflects true valve area in suspected lowgradient severe aortic stenosis. J Am Coll CardiolImg 2015;8:1133–9.
39. Saeed S, Senior R, Chahal NS, et al. Lowertransaortic flow rate is associated with increased
mortality in aortic valve stenosis. J Am Coll CardiolImg 2017;10:912–20.
40. Vamvakidou A, Jin W, Danylenko O, Chahal N,Khattar R, Senior R. Low transvalvular flowrate predicts mortality in patients with low-gradient aortic stenosis following aortic valveintervention. J Am Coll Cardiol Img 2018 Mar 9 [E-pub ahead of print].
41. Monin JL, Monchi M, Gest V, Duval-Moulin AM, Dubois-Rande JL, Gueret P. Aorticstenosis with severe left ventricular dysfunctionand low transvalvular pressure gradients: riskstratification by low-dose dobutamine echocardi-ography. J Am Coll Cardiol 2001;37:2101–7.
42. Quere JP, Monin JL, Levy F, et al. Influenceof preoperative left ventricular contractilereserve on postoperative ejection fraction inlow-gradient aortic stenosis. Circulation 2006;113:1738–44.
43. Tribouilloy C, Levy F, Rusinaru D, et al.Outcome after aortic valve replacement for low-flow/low-gradient aortic stenosis without con-tractile reserve on dobutamine stress echocardi-ography. J Am Coll Cardiol 2009;53:1865–73.
44. Clavel MA, Burwash IG, Mundigler G, et al.Validation of conventional and simplified methodsto calculate projected valve area at normal flowrate in patients with low flow, low gradient aorticstenosis: the multicenter TOPAS (True or PseudoSevere Aortic Stenosis) study. J Am Soc Echo-cardiogr 2010;23:380–6.
45. Annabi MS, Touboul E, Dahou A, et al.Dobutamine stress echocardiography for man-agement of low-flow, low-gradient aortic steno-sis. J Am Coll Cardiol 2018;71:475–85.
46. Ribeiro HB, Lerakis S, Gilard M, et al. Trans-catheter aortic valve replacement in patients withlow-flow, low-gradient aortic stenosis: theTOPAS-TAVI registry. J Am Coll Cardiol 2018;71:1297–308.
47. Parker JO, Mark AL, Sanghvi VR, West RO,Khaja F. Hemodynamic effects of pacing-inducedtachycardia in valvular aortic stenosis. Can MedAssoc J 1983;129:38–41.
48. Kadem L, Pibarot P, Dumesnil JG, et al. Inde-pendent contribution of left ventricular ejectiontime to the mean gradient in aortic stenosis.J Heart Valve Dis 2002;11:615–23.
49. Kadem L, Dumesnil JG, Rieu R, Durand L-G,Garcia D, Pibarot P. Impact of systemic hyperten-sion on the assessment of aortic stenosis. Heart2005;91:354–61.
50. Little SH, Chan KL, Burwash IG. Impact ofblood pressure on the Doppler echocardiographicassessment of severity of aortic stenosis. Heart2007;93:848–55.
51. Eleid MF, Nishimura RA, Sorajja P, Borlaug BA.Systemic hypertension in low-gradient severeaortic stenosis with preserved ejection fraction.Circulation 2013;128:1349–53.
52. Barasch E, Fan D, Chukwu EO, et al. Severeisolated aortic stenosis with normal left ventricu-lar systolic function and low transvalvular gradi-ents: pathophysiologic and prognostic insights.J Heart Valve Dis 2008;17:81–8.
53. Leong DP, Pizzale S, Haroun MJ, et al. Factorsassociated with low flow in aortic valve stenosis.J Am Soc Echocardiogr 2016;29:18–65.
54. Pibarot P, Dumesnil JG. Low-flow, low-gradient aortic stenosis with normal anddepressed left ventricular ejection fraction. J AmColl Cardiol 2012;60:1845–53.
55. Aksoy O, Cam A, Agarwal S, et al. Significanceof aortic valve calcification in patients with low-gradient low-flow aortic stenosis. Clin Cardiol2014;37:26–31.
56. Cueff C, Serfaty JM, Cimadevilla C, et al.Measurement of aortic valve calcification usingmultislice computed tomography: correlation withhaemodynamic severity of aortic stenosis andclinical implication for patients with low ejectionfraction. Heart 2011;97:721–6.
57. Clavel MA, Messika-Zeitoun D, Pibarot P, et al.The complex nature of discordant severe calcifiedaortic valve disease grading: new insights fromcombined Doppler-echocardiographic andcomputed tomographic study. J Am Coll Cardiol2013;62:2329–38.
58. Bermejo J, Garcia-Fernandez MA,Torrecilla EG, et al. Effects of dobutamine onDoppler echocardiographic indexes of aortic ste-nosis. J Am Coll Cardiol 1996;28:1206–13.
59. Heinrich RS, Marcus RH, Ensley AE, Gibson DE,Yoganathan AP. Valve orifice area alone is aninsufficient index of aortic stenosis severity: ef-fects of the proximal and distal geometry ontransaortic energy loss. J Heart Valve Dis 1999;8:509–15.
60. Baumgartner H, Hung J, Bermejo J, et al.Echocardiographic assessment of valve stenosis:EAE/ASE recommendations for clinical practice.J Am Soc Echocardiogr 2009;22:1–23. quiz 101–2.
61. Bahlmann E, Cramariuc D, Gerdts E, et al.Impact of pressure recovery on echocardiographicassessment of asymptomatic aortic stenosis: aSEAS substudy. J Am Coll Cardiol Img 2010;3:555–62.
62. Garcia D, Dumesnil JG, Durand LG, Kadem L,Pibarot P. Discrepancies between catheter andDoppler estimates of valve effective orifice areacan be predicted from the pressure recoveryphenomenon: practical implications with regard toquantification of aortic stenosis severity. J Am CollCardiol 2003;41:435–42.
63. Ng AC, Delgado V, van der Kley F, et al.Comparison of aortic root dimensions and geom-etries before and after transcatheter aortic valveimplantation by 2- and 3-dimensional trans-esophageal echocardiography and multislicecomputed tomography. Circ Cardiovasc Imaging2010;3:94–102.
64. O’Brien B, Schoenhagen P, Kapadia SR, et al.Integration of 3D imaging data in the assessmentof aortic stenosis: impact on classification of dis-ease severity. Circ Cardiovasc Imaging 2011;4:566–73.
65. Kamperidis V, van Rosendael PJ, Katsanos S,et al. Low gradient severe aortic stenosis withpreserved ejection fraction: reclassification ofseverity by fusion of Doppler and computedtomographic data. Eur Heart J 2015;36:2087–96.

Delgado et al. J A C C : C A R D I O V A S C U L A R I M A G I N G , V O L . 1 2 , N O . 2 , 2 0 1 9
Assessing Discordant Grading of AS Severity F E B R U A R Y 2 0 1 9 : 2 6 7 – 8 2
282
66. Arsalan M, Squiers JJ, Filardo G, et al. Effectof elliptical LV outflow tract geometry on classi-fication of aortic stenosis in a multidisciplinaryheart team setting. J Am Coll Cardiol Img 2017;10:1401–2.
67. Agatston AS, Janowitz WR, Hildner FJ,Zusmer NR, Viamonte M Jr., Detrano R. Quantifi-cation of coronary artery calcium using ultrafastcomputed tomography. J Am Coll Cardiol 1990;15:827–32.
68. Messika-Zeitoun D, Aubry MC, Detaint D, et al.Evaluation and clinical implications of aortic valvecalcificationmeasured by electron-beam computedtomography. Circulation 2004;110:356–62.
69. Aggarwal SR, Clavel MA, Messika-Zeitoun D,et al. Sex differences in aortic valve calcification
measured by multidetector computed tomographyin aortic stenosis. Circ Cardiovasc Imaging 2013;6:40–7.
70. Pawade T, Clavel MA, Tribouilloy C, et al.Computed tomography aortic valve calciumscoring in patients with aortic stenosis. Circ Car-diovasc Imaging 2018;11:e007146.
71. Clavel MA, Pibarot P, Messika-Zeitoun D, et al.Impact of aortic valve calcification, as measured byMDCT, on survival in patients with aortic stenosis:results of an international registry study. J Am CollCardiol 2014;64:1202–13.
72. Tastet L, Enriquez-Sarano M, Capoulade R,et al. Impact of aortic valve calcification and sexon hemodynamic progression and clinical out-comes in AS. J Am Coll Cardiol 2017;69:2096–8.
73. Shen M, Tastet L, Capoulade R, et al. Effect ofage and aortic valve anatomy on calcification andhaemodynamic severity of aortic stenosis. Heart2017;103:32–9.
KEY WORDS aortic stenosis, aortic valvereplacement, computed tomography,Doppler echocardiography, hybrid imaging
Go to http://www.acc.org/jacc-journals-cme to takethe CME/MOC/ECME quizfor this article.