how do price range shoppers differ from reference price point shoppers?
TRANSCRIPT
Available online at www.sciencedirect.com
ch 62 (2009) 31–38
Journal of Business ResearHow do price range shoppers differ from reference price point shoppers?☆
Sangkil Moon a,⁎, Glenn Voss b,1
a College of Management, North Carolina State University, United Statesb Cox School of Business, Southern Methodist University, United States
Received 19 December 2006; accepted 12 January 2008
Abstract
Existing research demonstrates that reference price models can explain a significant amount of the variation in customers' price perceptionsand purchase behaviors. This study extends the reference price literature by introducing the price range model, which proposes that pricejudgments are based on a comparison of the market price to the entire range of currently available prices. Our results demonstrate that the fit of astructural heterogeneity finite mixture model improves when the price range model is included along with internal and external reference pricemodels and that the price range model explains a substantial proportion of customers' purchase histories in the toilet tissue category. Profileanalysis indicates that internal reference price shoppers switch brands much less frequently than the other two segments and respond to featurepromotions for their preferred brand(s). External reference price shoppers have an intermediate level of brand preference and respond significantlyless than the other two segments to feature and display promotions. Price range shoppers have the lowest brand loyalty and respond most stronglyto both feature and display promotions.© 2008 Elsevier Inc. All rights reserved.
Keywords: Price range model; Reference price; Price perception; Customer segmentation and profiling
The reference price literature explains purchase behavior onthe basis of reference price point formation and customerheterogeneity (Kalyanaram and Winer 1995, Mazumdar, Raj,and Sinha 2005). Reference price point formation refers to theprocess whereby some customers compare the current price ofeach brand to an internal reference price (IRP) that is formed onthe basis of past prices for the brand (Winer 1986), whereasother customers—who are unlikely to remember past prices—form an external reference price (ERP) on the basis of thecurrently observed price of a focal brand (Hardie, Johnson, andFader 1993). Customer heterogeneity indicates that customers
☆ The authors thank Peter Rossi for providing access to the data for empiricalanalysis. The authors also thank Associate Editor Abhijit Biswas, two anonymousreviewers, Wagner Kamakura and Gary Russell for their invaluable comments. Theauthors also thank those who attended the session that included the presentation ofthis paper at the 2006Marketing ScienceConference at theUniversity of Pittsburgh.⁎ Corresponding author. Tel.: +1 919 515 1802; fax: +1 919 515 6943.E-mail addresses: [email protected] (S. Moon), [email protected]
(G. Voss).1 Tel.: +1 214 768 2236; fax: +1 214 768 4099.
0148-2963/$ - see front matter © 2008 Elsevier Inc. All rights reserved.doi:10.1016/j.jbusres.2008.01.017
use different reference price formation strategies (e.g., IPR andERP) to judge the attractiveness of an offered price (Mazumdarand Papatla 2000).
The reference price literature draws on Adaptation-LevelTheory (Helson 1964) to conceptualize reference prices asexplicit price points. However, Janiszewski and Lichtenstein(1999) use behavioral experiments to validate a price perceptionmodel that is consistent with Range Theory (Volkmann 1951),which proposes that customers use the full range of availableprices to evaluate the attractiveness of individual market prices.Niedrich, Sharma, and Wedell (2001) use behavioral experi-ments to demonstrate that experimental conditions determinewhich of three distinct price perception theories—Adaptation-Level Theory, Range Theory, and Range-Frequency Theory—best explains behavior.
The price perception literature is enriched by behavioralexperiments that support price range conceptualizations butadditional empirical research is required to fully validate theirimplications. We contribute to this stream of research in twoways. First, we develop an empirical Price Range (PR) model
32 S. Moon, G. Voss / Journal of Business Research 62 (2009) 31–38
based on the notion that customers evaluate market prices bycomparing each price to the current range of market prices. Weuse panel data to empirically test a structural heterogeneity finitemixture model (Kamakura, Kim, and Lee 1996) that includes aPR model in conjunction with IRP and ERP models. The resultsdemonstrate that the fit of the structural heterogeneity modelimproves when the PR model is included along with the IRPand ERP models and that the PR model explains a substantialportion (26%) of customers' price perception and shoppingbehaviors.
Second, we conduct additional analyses to examine therelationships between price response models and five customercharacteristics—(1) brand switching, (2) purchase on display,(3) purchase on feature, (4) shoppingbasket size, and (5) residencestatus. This profile analysis indicates that internal reference priceshoppers switch brands much less frequently than the other twosegments and respond to feature promotions for their preferredbrand(s). External reference price shoppers have an intermediatelevel of brand preference and respond significantly less than theother two segments to both feature and display promotions. Pricerange shoppers have the lowest brand loyalty and respond moststrongly to both feature and display promotions.
In the following section, we review the IRP and ERP modelsthat have dominated empirical price perception research andintroduce a PR model in the context of brand choice. We thenintegrate all three price-perception models into a structuralheterogeneity model for customer segmentation, which weempirically test using the toilet tissue product category. Wepresent the profile analysis and finish with a discussion of theresults.
1. Developing reference price and price range models
Reference price research draws on Adaptation-Level Theory(Helson 1964) and Prospect Theory (Kahneman and Tversky1979) to model customers' choice responses to price information.According to Adaptation-Level Theory, customers developprototypical reference prices that act as the adaptation level forcurrent price assessments (e.g., Mazumdar, Raj, and Sinha 2005).Prospect Theory enriches the reference price conceptualization bydistinguishing between losses, which occur when themarket priceis higher than the customer's reference price, and gains, whichoccur when the focal price is lower than the reference price.
Considerable research has focused on the distinctionbetween internal and external reference price formation.Conceptually, IRP represents the internalization of observedprices over time. For practical purposes, IRP is modeled as abrand-specific phenomenon so that each brand has a differentIRP (Briesch et al., 1997, Mazumdar and Papatla 2000). ERP iscontextually determined at the point of purchase and is modeledas the current price of the most-recently purchased brand so thatit is common across all brands (Hardie, Johnson, and Fader1993). Early empirical research (e.g., Rajendran and Tellis1994, Briesch et al., 1997) examined whether the internal orexternal reference price model explained purchase behaviorbetter under different conditions. Subsequent research incorpo-rated customer heterogeneity into models that allowed custo-
mers to use a mixture of internal and external reference prices(Mazumdar and Papatla 2000) or used a structural heterogeneityfinite mixture model to separate customers into segments thatfollow distinct price response models (Moon, Russell, andDuvvuri 2006). Empirical studies to date have focused onreference price effects and have ignored the effects of the pricerange or extreme price values. This focus belies early priceperception research (Monroe, Della Bitta, and Downey 1977),which proposed that price structure is defined by three factors—the reference price level, the range of prices, and extreme pricevalues—and recent behavioral studies (Janiszewski and Lich-tenstein 1999, Niedrich, Sharma, and Wedell 2001) that supporta price perception process consistent with Range Theory(Volkmann 1951). These exemplar models posit that referenceprice is represented by a distribution of prices.
We address this gap in the literature by using a finite mixturemodel that separates customers into segments that follow theIRP model, the ERP model, or the PR model. Compared to theprototypical IRP and ERP models, the PR model is based on therange or, more broadly, the variability of prices for a givenchoice alternative. Thus, we refer to IRP and ERP as referenceprice point models and PR as a price variability model. Weformally develop each model in the following sections.
1.1. The internal reference price (IRP) point model
Empirical reference price research has focused considerableattention on how to represent IRP (Kalyanaram and Winer1995, Briesch et al., 1997). Following the majority of earlierwork, we define IRP as the exponentially weighted average ofpast prices of the same brand.
IRPhjt ¼ kIRPhj t�1ð Þ þ 1� kð ÞPhj t�1ð Þ; ð1Þwhere λ(0≤λ ≤1) is a smoothing parameter that determinesthe weight of each past price that influences the current IRP.Since λ in Eq. (1) is a non-linear parameter in the multinomiallogit model described in Eq. (2) below, we apply the estimationmethod developed by Fader, Lattin, and Little (1992). Theutility function captures gains and losses as follows:
Uhjt ¼ aj þ bYLOYhj þ bPPhjt þ bL LhjtT Phjt � IRPhjt� �� �
þ bG GhjtT IRPhjt � Phjt
� �� �þ bcPChjt
þ bFFhjt þ bDDhjt þ ehjt;
ð2ÞwhereU = utility, LOY = loyalty, P = price, PC = price control (tocorrect for price endogeneity as explained below), F = feature,D = display, and ε = disturbance term. The subscript h indicateshousehold (i.e., customer), subscript j brand, and subscript tcategory purchase occasion. We expect price to have a negativeeffect on utility so the βP coefficient should be negative. L and Gindicate loss and gain functions, respectively. If PN IRP (loss),L=1 and G=0, and the size of the loss is (P− IRP). If Pb IRP(gain), L=0 and G=1, and the size of the gain is (IRP−P). Thus,Eq. (2) captures the magnitude of a gain or a loss as a nonnegativevalue. Because a loss should decrease the utility, βL should be
33S. Moon, G. Voss / Journal of Business Research 62 (2009) 31–38
negative (βLb0). Similarly, because a gain should increase theutility, βG should be positive (βGN0). The loss aversionphenomenon in Prospect Theory further predicts that the βLcoefficient will be larger than the βG coefficient.
The PC term in Eq. (2) alleviates the price endogeneityconcern, which has received considerable attention in marketingscience (Villas-Boas and Winer 1999, Moon, Russell, andDuvvuri 2006). PC is relevant in the IRP model because price isdefined as the shelf price net of coupon for the chosen brandonly. This common practice in analyzing grocery panel dataignores the possible presence of coupons for competitor brands.It creates a price endogeneity concern because coupon infor-mation is provided for chosen brands only, which can inflate theprice effect. Blundell and Powell (2004) maintain that thecoefficient for the potentially endogenous price variable will bestatistically consistent given the presence of the PC variable,which is computed based on residuals of the time-seriesregression of price at time t-1 on price at time t, for eachcombination of brand and segment. In summary, the PC termattenuates the price endogeneity problem and improves theconsistency of the price term estimate.
1.2. The external reference price (ERP) point model
In contrast to the IRP model in which customers recall pastprices from memory, ERP customers use prices observed in thecurrent choice environment to develop a reference price. Oncethe ERP value is established, ERP customers also evaluate priceaccording to the loss–gain mechanism. Accordingly, we definethe utility of an ERP customer as
Uhjt ¼ aj þ bYLOYhj þ bL LhjtT Phjt � ERPht� �� �
þ bG GhjtT ERPht � Phjt
� �� �þ bcPChjt þ bFFhjt
þ bDDhjt þ ehjt: ð3ÞThe ERP model also includes the PC term to correct forpotential price endogeneity and separate loss (βL) and gain (βG)effects. Unlike IRP, ERP is independent of brand j so that theERP value for household h at purchase occasion t is uniformlyapplied to all brands. This results in an identification problemthat prevents the inclusion of current market price P in theutility model (Briesch et al., 1997). Hardie, Johnson, and Fader(1993) argue that market price is not needed because customersdraw psychological meaning by comparing P to ERP. Follow-ing previous studies (Hardie, Johnson, and Fader 1993, Brieschet al., 1997, Moon, Russell, and Duvvuri 2006), we define ERPas the current price of the brand purchased by household h onthe previous purchase occasion (i.e., t-1). Instead of remember-ing past prices, customers construct ERP at the point of pur-chase by examining the current price for the most-recentlypurchased brand (i.e., the reference brand), which is easier toremember than past prices (Hardie, Johnson, and Fader 1993).
1.3. The price range (PR) model
Janiszewski and Lichtenstein (1999) and Niedrich, Sharma,and Wedell (2001) demonstrate that, rather than relying on
prototypical reference price, some customers may evaluatemarket prices in the context of the entire range of currentlyoffered prices. Following Janiszewski and Lichtenstein (1999),we define the measure of price range (PR) to be
PRhjt ¼ Phjt � LPht� �
= HPht � LPhtð Þ; ð4Þwhere LP denotes the lowest brand price and HP denotes thehighest price in a given product category. LP and HP depend onhousehold h and time t, but are independent of brand j becausethey are common across brands on the same purchase occasion.PR captures the percentile value (between 0 and 1) of the focalmarket price within the range of prices, so that a lower valuereflects a more attractive price evaluation. The psychologicallytransformed PR value in Eq. (4) is included in the PR utilityfunction as follows:
Uhjt ¼ aj þ bYLOYhj þ bRPRhjt þ bcPChjt þ BFFhjt
þ bDDhjt þ ehjt: ð5ÞWe assume that some customers compare the PR value of thefocal brand with the PR values for other brands in the productcategory. The current market price P does not enter into Eq. (5)as a separate term for conceptual and methodological reasons.Conceptually, Range Theory maintains that PR provides a betterrepresentation of customers' price judgment than P becausecustomers draw psychological meaning by comparing P withinthe context of the price range, which yields a price perceptionarising from PR rather than P. Methodologically, adding P toEq. (5) would create a multicollinearity problem because PRand P are highly correlated.
2. Empirical analysis
2.1. Customer segmentation
Following the approach used by Moon, Russell, and Duvvuri(2006), we use a finite mixture model that integrates all threeprice response models—IRP, ERP, and PR—and we assumethat each customer uses one type of price response model.Unlike a common finite mixture model used for customersegmentation (Kamakura and Russell 1989), this approachassumes a priori that three price perception segments accountfor the observed structural heterogeneity (Kamakura, Kim, andLee 1996). The finite mixture model computes the probabilitythat household h belonging to segment s will select brand j atpurchase occasion t as
Pr sð Þhjt ¼ exp U sð Þ
hjt
� �=XjV
exp UshjVt
� �: ð6Þ
Superscript (s) indicates a segment of customers who followeach price perception model. For each customer, we create thecustomer segment log likelihood expression as follows:
InLhs ¼ L h;Yh segment sð Þ; ð7Þwhere θ = parameters and Yh = observed information forhousehold h, which includes multiple purchase occasions. Next,
Table 1Toilet tissue brand summary
Brand Market share (%) Price Feature Display
Northern 33.4 1.12 .23 .14Charmin 30.5 1.15 .23 .22Cottonelle 19.9 1.13 .32 .17White Cloud 8.5 1.23 .19 .41Family Scott 7.7 .98 .25 .19
Notes: Price is expressed in dollars per 4000 sheets, which is an alternativevolume unit for 92% of brand alternatives in the category. The feature anddisplay indices are averages over dummy variables representing each brand'spromotional activities.
34 S. Moon, G. Voss / Journal of Business Research 62 (2009) 31–38
lnLhs is summed over all households in the dataset to obtain thefollowing overall log likelihood Lc:
ln Lc ¼XHh¼1
lnX3s¼1
psLhs½ �; ð8Þ
where πs = size of segment s.Because one objective for this study is to develop a profile
for each segment, we assume that each household belongs toonly one of the three segments. By constraining each segment tofollow a single price perception model, we require thathouseholds be placed into one of the three segments, each ofwhich is characterized by a different approach to interpretingprice information. In the structural segmentation model, eachsegment has a distinct, non-nested model structure, whichimplies a multi-modal parameter distribution in price response.This increases the likelihood that the segmentation model willrecover the true heterogeneity in the customer price perceptionmechanism (Andrews, Ainslie and Currim 2002).
The structural heterogeneity model does not captureunobserved preference heterogeneity related to individualdifferences in brand preferences and responses to the marketingmix variables. However, heterogeneity in logit model brandintercepts across brands and customers produces heterogeneityin own-price elasticities across brands and customers, even inthe absence of an explicit model for heterogeneity in marketresponse parameters across customers within each segment(Bucklin, Russell and Srinivasan 1998). Moreover, customerheterogeneity is explicitly captured by the loyalty variable thatappears in the utility Eqs. (2), (3) and (5), which controls forbrand preference heterogeneity and allows us to focus onheterogeneity in price perception structure and process. A keyadvantage to this approach is that it generates a deeperunderstanding of differences in customer characteristics acrossthe three segments.2
We also tested a segmentation model that allows for multiplesub-segments in each price response model. More specifically,we decomposed each of the three price response segments intomultiple sub-segments, each of which had different parametervalues with the same price response structure (parameterheterogeneity). Even though these expanded models capturedadditional customer heterogeneity, they did not change theresults with respect to segment profiling. Logically, differencesamong sub-segments in the same segment (parameter hetero-geneity in the same segment) will be much smaller thandifferences across the three structurally distinct model segments(structural heterogeneity across segments). This test is tanta-mount to the mixed logit specification proposed by Klapper,Ebling, and Temme (2005). Unlike the mixed logit specifica-tion, however, our test is based on the assumption that house-
2 Other approaches to incorporating customer heterogeneity include Mazum-dar and Papatla (2000), who use a hybrid model that allows customers to use amixture of IRP or ERP and Erdem, Mayhew and Sun (2001), who incorporateheterogeneity into the parameters governing consumer reactions to referenceprice. Neither approach can be used when the objective is to compare threestructurally distinct segment models.
hold parameter heterogeneity in each segment is discrete ratherthan continuous.
2.2. Sampling and variable definitions
We used a data set collected by the ERIM marketing testingservice in Sioux Falls, South Dakota, which is representative ofthe U.S. population as a whole. Sioux Falls had a population of81,340, an average household size of 2.6, with 64% reportingno children in the household. Magnetic ID cards issued to 2500households were presented at checkout when shopping atparticipating stores. The dataset covers 91 weeks. In analyzingthe data, two sub-periods were used—a 39 week initializationperiod and a 52 week estimation period. The initializationperiod was used to (a) estimate the initial IRP value (Eq. (1)),(b) estimate the loyalty value (Eq. (9) below), and (c) computecustomer characteristic indexes (Eq. (10) below).
We used the toilet tissue product category and analyzed thetop five brands—Northern, Charmin, Cottonelle, White Cloud,and Family Scott.3 Each of these brands had more than 5%market share (see Table 1) and collectively accounted for 83%of total purchases. During the entire period, 119,613 purchaseoccasions occurred in the product category. We excludedfamilies that made fewer than 7 purchases during the 91 weeksbecause the small number of purchases implies serious purchaserecording omissions. Systematic sampling of the remaininghouseholds generated a final sample of 341 families. Whenestimating the model, we limited to ten the number of purchaseoccasions for each household to prevent heavy purchasers of thecategory from dominating the results. We did examine therobustness of our results by replicating the analyses using allobservations without the ten-purchase restriction, whichgenerated results similar to the results reported in Tables 3and 4.
Most variables in the model are defined in a manner that iscommon in scanner data brand choice models. Price isoperationalized as price net of coupon when the brand ischosen and as shelf price when the brand is not chosen. Featureand display indices are binary (0–1) variables indicating thepresence or absence of feature and display conditions at the
3 We replicated all analyses using the peanut butter category, which producedvery similar results.
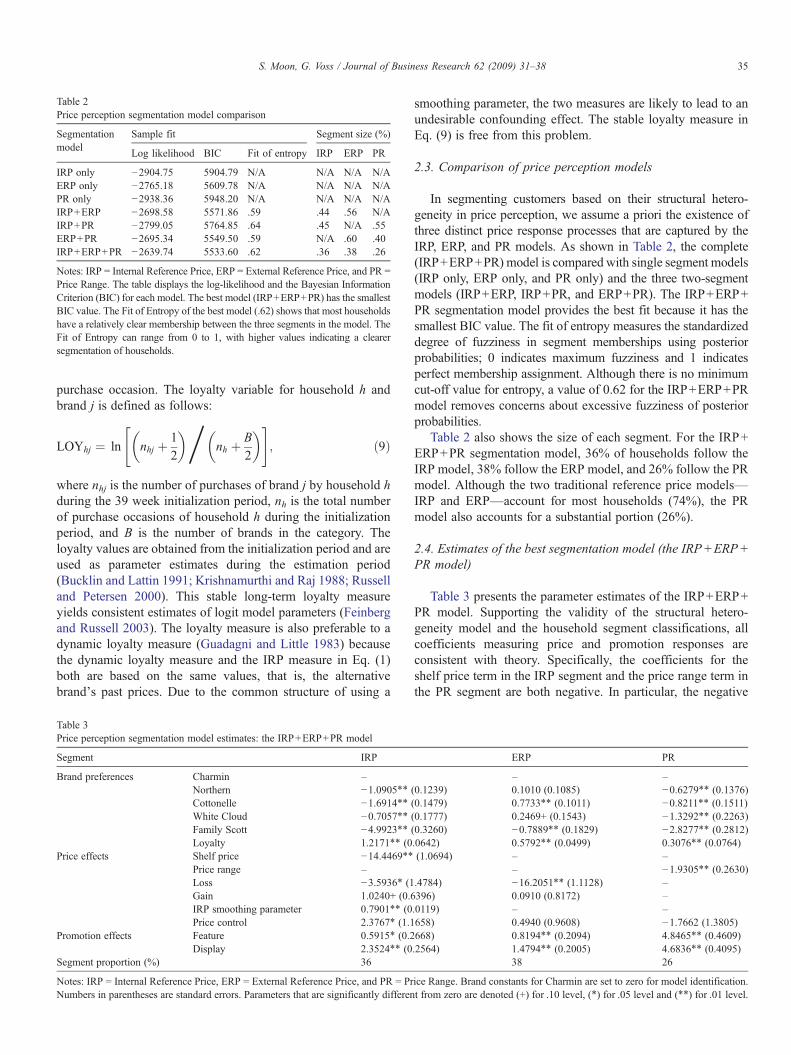
Table 2Price perception segmentation model comparison
Segmentationmodel
Sample fit Segment size (%)
Log likelihood BIC Fit of entropy IRP ERP PR
IRP only −2904.75 5904.79 N/A N/A N/A N/AERP only −2765.18 5609.78 N/A N/A N/A N/APR only −2938.36 5948.20 N/A N/A N/A N/AIRP+ERP −2698.58 5571.86 .59 .44 .56 N/AIRP+PR −2799.05 5764.85 .64 .45 N/A .55ERP+PR −2695.34 5549.50 .59 N/A .60 .40IRP+ERP+PR −2639.74 5533.60 .62 .36 .38 .26
Notes: IRP = Internal Reference Price, ERP = External Reference Price, and PR =Price Range. The table displays the log-likelihood and the Bayesian InformationCriterion (BIC) for each model. The best model (IRP+ERP+PR) has the smallestBIC value. The Fit of Entropy of the best model (.62) shows that most householdshave a relatively clear membership between the three segments in the model. TheFit of Entropy can range from 0 to 1, with higher values indicating a clearersegmentation of households.
35S. Moon, G. Voss / Journal of Business Research 62 (2009) 31–38
purchase occasion. The loyalty variable for household h andbrand j is defined as follows:
LOYhj ¼ ln nhj þ 12
� = nh þ B
2
� " #; ð9Þ
where nhj is the number of purchases of brand j by household hduring the 39 week initialization period, nh is the total numberof purchase occasions of household h during the initializationperiod, and B is the number of brands in the category. Theloyalty values are obtained from the initialization period and areused as parameter estimates during the estimation period(Bucklin and Lattin 1991; Krishnamurthi and Raj 1988; Russelland Petersen 2000). This stable long-term loyalty measureyields consistent estimates of logit model parameters (Feinbergand Russell 2003). The loyalty measure is also preferable to adynamic loyalty measure (Guadagni and Little 1983) becausethe dynamic loyalty measure and the IRP measure in Eq. (1)both are based on the same values, that is, the alternativebrand's past prices. Due to the common structure of using a
Table 3Price perception segmentation model estimates: the IRP+ERP+PR model
Segment IRP
Brand preferences Charmin –Northern −1.0905⁎⁎Cottonelle −1.6914⁎⁎White Cloud −0.7057⁎⁎Family Scott −4.9923⁎⁎Loyalty 1.2171⁎⁎ (0
Price effects Shelf price −14.4469⁎⁎Price range –Loss −3.5936⁎ (1Gain 1.0240+ (0.6IRP smoothing parameter 0.7901⁎⁎ (0Price control 2.3767⁎ (1.1
Promotion effects Feature 0.5915⁎ (0.2Display 2.3524⁎⁎ (0
Segment proportion (%) 36
Notes: IRP = Internal Reference Price, ERP = External Reference Price, and PR = PrNumbers in parentheses are standard errors. Parameters that are significantly differen
smoothing parameter, the two measures are likely to lead to anundesirable confounding effect. The stable loyalty measure inEq. (9) is free from this problem.
2.3. Comparison of price perception models
In segmenting customers based on their structural hetero-geneity in price perception, we assume a priori the existence ofthree distinct price response processes that are captured by theIRP, ERP, and PR models. As shown in Table 2, the complete(IRP+ERP+PR) model is compared with single segment models(IRP only, ERP only, and PR only) and the three two-segmentmodels (IRP+ERP, IRP+PR, and ERP+PR). The IRP+ERP+PR segmentation model provides the best fit because it has thesmallest BIC value. The fit of entropy measures the standardizeddegree of fuzziness in segment memberships using posteriorprobabilities; 0 indicates maximum fuzziness and 1 indicatesperfect membership assignment. Although there is no minimumcut-off value for entropy, a value of 0.62 for the IRP+ERP+PRmodel removes concerns about excessive fuzziness of posteriorprobabilities.
Table 2 also shows the size of each segment. For the IRP+ERP+PR segmentation model, 36% of households follow theIRP model, 38% follow the ERP model, and 26% follow the PRmodel. Although the two traditional reference price models—IRP and ERP—account for most households (74%), the PRmodel also accounts for a substantial portion (26%).
2.4. Estimates of the best segmentation model (the IRP+ERP+PR model)
Table 3 presents the parameter estimates of the IRP+ERP+PR model. Supporting the validity of the structural hetero-geneity model and the household segment classifications, allcoefficients measuring price and promotion responses areconsistent with theory. Specifically, the coefficients for theshelf price term in the IRP segment and the price range term inthe PR segment are both negative. In particular, the negative
ERP PR
– –(0.1239) 0.1010 (0.1085) −0.6279⁎⁎ (0.1376)(0.1479) 0.7733⁎⁎ (0.1011) −0.8211⁎⁎ (0.1511)(0.1777) 0.2469+ (0.1543) −1.3292⁎⁎ (0.2263)(0.3260) −0.7889⁎⁎ (0.1829) −2.8277⁎⁎ (0.2812).0642) 0.5792⁎⁎ (0.0499) 0.3076⁎⁎ (0.0764)(1.0694) – –
– −1.9305⁎⁎ (0.2630).4784) −16.2051⁎⁎ (1.1128) –396) 0.0910 (0.8172) –.0119) – –658) 0.4940 (0.9608) −1.7662 (1.3805)668) 0.8194⁎⁎ (0.2094) 4.8465⁎⁎ (0.4609).2564) 1.4794⁎⁎ (0.2005) 4.6836⁎⁎ (0.4095)
38 26
ice Range. Brand constants for Charmin are set to zero for model identification.t from zero are denoted (+) for .10 level, (⁎) for .05 level and (⁎⁎) for .01 level.
36 S. Moon, G. Voss / Journal of Business Research 62 (2009) 31–38
coefficient of PR demonstrates that PR shoppers react to rela-tively high prices negatively even after they interpret the shelfprice in the context of the price range. For the IRP and ERPsegments, the loss coefficients are significantly negative and thegain coefficients are positive but relatively weak, which may bedue to the presence of the price control variable, which canweaken or eliminate reference price effects (Chang, Siddarth,and Weinberg 1999; Bell and Lattin 2000). Our results confirmthat there are significant reference price effects even aftercontrolling for price endogeneity typical in grocery panel data.The results also support the loss aversion phenomenon(Kahneman and Tversky 1979), which implies that retailersneed to be more concerned with minimizing perceptions of lossthan with creating perceptions of gains. The IRP smoothingparameter is significant and quite large (λ=0.79), whichindicates that the IRP value does not vary much over time, aresult that is consistent with a mature, stable product category.The coefficients for loyalty, feature, and display are significantand have the expected positive sign.
3. Segment profiles
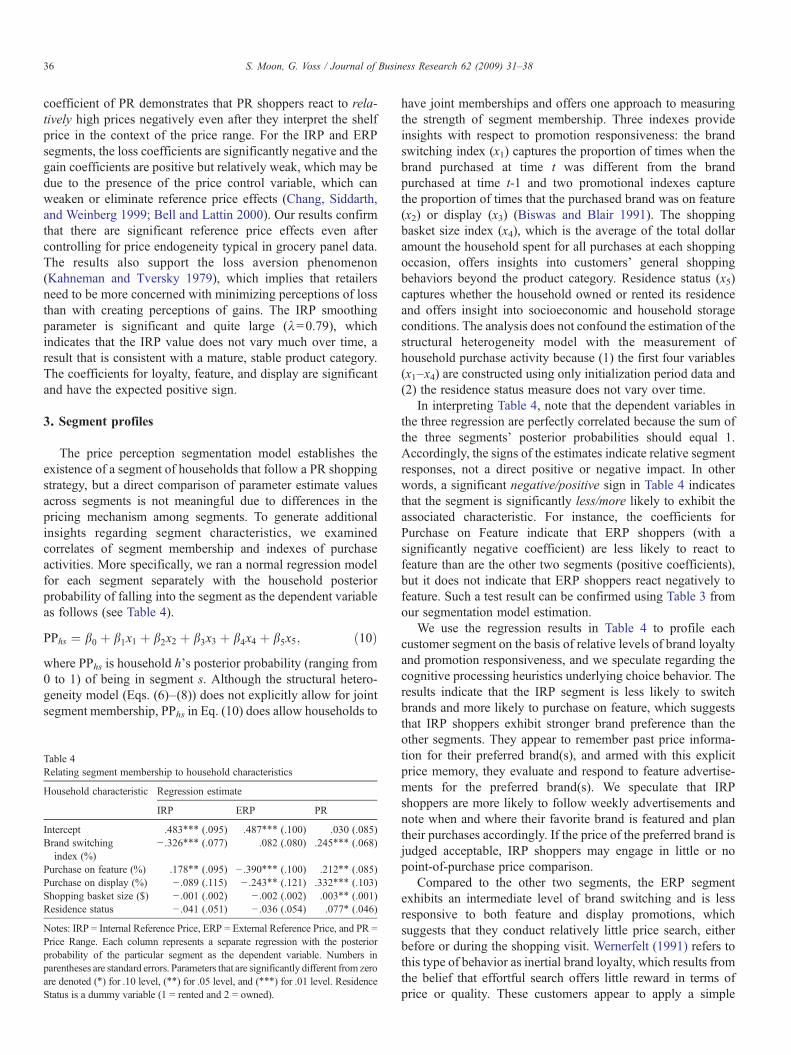
The price perception segmentation model establishes theexistence of a segment of households that follow a PR shoppingstrategy, but a direct comparison of parameter estimate valuesacross segments is not meaningful due to differences in thepricing mechanism among segments. To generate additionalinsights regarding segment characteristics, we examinedcorrelates of segment membership and indexes of purchaseactivities. More specifically, we ran a normal regression modelfor each segment separately with the household posteriorprobability of falling into the segment as the dependent variableas follows (see Table 4).
PPhs ¼ b0 þ b1x1 þ b2x2 þ b3x3 þ b4x4 þ b5x5; ð10Þwhere PPhs is household h's posterior probability (ranging from0 to 1) of being in segment s. Although the structural hetero-geneity model (Eqs. (6)–(8)) does not explicitly allow for jointsegment membership, PPhs in Eq. (10) does allow households to
Table 4Relating segment membership to household characteristics
Household characteristic Regression estimate
IRP ERP PR
Intercept .483⁎⁎⁎ (.095) .487⁎⁎⁎ (.100) .030 (.085)Brand switchingindex (%)
− .326⁎⁎⁎ (.077) .082 (.080) .245⁎⁎⁎ (.068)
Purchase on feature (%) .178⁎⁎ (.095) − .390⁎⁎⁎ (.100) .212⁎⁎ (.085)Purchase on display (%) − .089 (.115) − .243⁎⁎ (.121) .332⁎⁎⁎ (.103)Shopping basket size ($) − .001 (.002) − .002 (.002) .003⁎⁎ (.001)Residence status − .041 (.051) − .036 (.054) .077⁎ (.046)
Notes: IRP = Internal Reference Price, ERP = External Reference Price, and PR =Price Range. Each column represents a separate regression with the posteriorprobability of the particular segment as the dependent variable. Numbers inparentheses are standard errors. Parameters that are significantly different from zeroare denoted (⁎) for .10 level, (⁎⁎) for .05 level, and (⁎⁎⁎) for .01 level. ResidenceStatus is a dummy variable (1 = rented and 2 = owned).
have joint memberships and offers one approach to measuringthe strength of segment membership. Three indexes provideinsights with respect to promotion responsiveness: the brandswitching index (x1) captures the proportion of times when thebrand purchased at time t was different from the brandpurchased at time t-1 and two promotional indexes capturethe proportion of times that the purchased brand was on feature(x2) or display (x3) (Biswas and Blair 1991). The shoppingbasket size index (x4), which is the average of the total dollaramount the household spent for all purchases at each shoppingoccasion, offers insights into customers' general shoppingbehaviors beyond the product category. Residence status (x5)captures whether the household owned or rented its residenceand offers insight into socioeconomic and household storageconditions. The analysis does not confound the estimation of thestructural heterogeneity model with the measurement ofhousehold purchase activity because (1) the first four variables(x1–x4) are constructed using only initialization period data and(2) the residence status measure does not vary over time.
In interpreting Table 4, note that the dependent variables inthe three regression are perfectly correlated because the sum ofthe three segments' posterior probabilities should equal 1.Accordingly, the signs of the estimates indicate relative segmentresponses, not a direct positive or negative impact. In otherwords, a significant negative/positive sign in Table 4 indicatesthat the segment is significantly less/more likely to exhibit theassociated characteristic. For instance, the coefficients forPurchase on Feature indicate that ERP shoppers (with asignificantly negative coefficient) are less likely to react tofeature than are the other two segments (positive coefficients),but it does not indicate that ERP shoppers react negatively tofeature. Such a test result can be confirmed using Table 3 fromour segmentation model estimation.
We use the regression results in Table 4 to profile eachcustomer segment on the basis of relative levels of brand loyaltyand promotion responsiveness, and we speculate regarding thecognitive processing heuristics underlying choice behavior. Theresults indicate that the IRP segment is less likely to switchbrands and more likely to purchase on feature, which suggeststhat IRP shoppers exhibit stronger brand preference than theother segments. They appear to remember past price informa-tion for their preferred brand(s), and armed with this explicitprice memory, they evaluate and respond to feature advertise-ments for the preferred brand(s). We speculate that IRPshoppers are more likely to follow weekly advertisements andnote when and where their favorite brand is featured and plantheir purchases accordingly. If the price of the preferred brand isjudged acceptable, IRP shoppers may engage in little or nopoint-of-purchase price comparison.
Compared to the other two segments, the ERP segmentexhibits an intermediate level of brand switching and is lessresponsive to both feature and display promotions, whichsuggests that they conduct relatively little price search, eitherbefore or during the shopping visit. Wernerfelt (1991) refers tothis type of behavior as inertial brand loyalty, which results fromthe belief that effortful search offers little reward in terms ofprice or quality. These customers appear to apply a simple
4 Modeling the PR segment improves upon results reported by Moon,Russell, and Duvvuri (2006), who profiled three segments—IRP, ERP, and noreference price (NRP). They found that only 9% of households fell into theNRP segment. By comparison, 26% of households in our study fall into the PRsegment. They found that the NRP segment fell in between the other twosegments in terms of price responsiveness.
37S. Moon, G. Voss / Journal of Business Research 62 (2009) 31–38
decision heuristic wherein the price of the reference brand iscoded as acceptable or unacceptable, with additional search andprocessing occurring only if the reference brand price isperceived as a loss (see also the nonsignificant coefficient forGain in Table 3).
The PR segment has the highest brand switching index andthe strongest response to both featured and displayed promo-tion. Compared to IRP and ERP shoppers who rely on brandpreferences to direct their price search and purchase decisions,PR shoppers appear to focus primarily on price. These resultsare consistent with the idea that PR shoppers allocate lesscognitive effort to brand or quality assessments and morecognitive effort to comparing the full range of current prices inthe store. Consistent with Becker's (1965) theory of householdproduction, this segment appears to take advantage of storagecapabilities in their owned home to stock up on featured anddisplayed items, which results in basket sizes that are larger thanthe other two segments.
4. Discussion
Our study makes two contributions to the existing literature.First, althoughRange Theory has been applied to price perceptionstudies in laboratory settings (Janiszewski and Lichtenstein 1999,Niedrich, Sharma, and Wedell 2001), our study is the first toempirically test the theory using scanner panel data. The resultsindicate that a substantial portion (26%) of customers' purchasebehaviors followed the price rangemodel, supporting Janiszewskiand Lichtenstein's (1999) contention that price perceptionresearch should incorporate price range effects. We hope ourresults will expand future research beyond the two commonreference price models that have dominated previous empiricalprice perception research.
Second, the profile analysis enriches our understanding of eachsegment's shopping behaviors and underscores the conceptualand practical insights that emerge from considering the threereference price models. IRP shoppers appear to use a brand-directed heuristic that first establishes a preferred reference brand,perhaps on the basis of a quality assessment, with subsequentprice evaluations comparing current prices to past prices for thepreferred reference brand. At the other extreme, PR shoppersappear to use a price-directed heuristic that considers prices for theentire category with little consideration given to brand or qualitydifferences. ERP shoppers appear to use an effort-minimizingheuristic that allocates modest importance to brand or pricepromotion. We now consider the implications of our results.
4.1. Managerial and theoretical implications
Our results support prior research suggesting that IRPshoppers purchase fewer brands and respond more to couponfeatures and less to in-store displays (Rajendran and Tellis 1994;Mazumdar and Papatla 2000). Because these results suggest adecision heuristic that establishes the preferred brand(s) firstfollowed by price-shopping behavior, retailers could influenceretail patronage by targeting IRP shoppers (e.g., through directmail) with coupons for their preferred brands. By rotating
coupons for preferred brands over time, retailers may be able tobuild store loyalty among IRP shoppers, given their predis-position to stable purchase behavior. Additional research isneeded to confirm whether IRP shoppers are loyal to a single ormultiple brands, whether IRP shoppers use relational behaviorto reduce the cognitive effort required to remember past pricesfor one or two brands rather than for many, and whether IRPshoppers would be more (or less) responsive to targetedcoupons.
Our results are inconsistent with prior research suggestingthat ERP shoppers should be more responsive to in-storedisplays. This result may be related to our inclusion of a PRsegment, which creates two distinct segments that usecontextual price information to create a reference price point(ERP shoppers) or range (PR shoppers). Although ERPshoppers were the least responsive to both feature and displaypromotion, PR shoppers were the most responsive. We suspectthat ERP shoppers may devote less cognitive effort toprocessing price information, both during and between shop-ping trips. This segment appears to be the least price-sensitive,which suggests that price promotions targeting this segmentwould yield smaller returns than would price promotionstargeting the other two segments. Additional research isnecessary to confirm whether ERP shoppers are more (orless) price sensitive and whether they would be more (or less)responsive to price promotions.
Our results with respect to PR shoppers are consistent withprevious research indicating that deal-prone shoppers areresponsive to the range of available prices (Kumar, Karande,and Reinartz 1998). PR shoppers exhibit little brand loyalty andrespond to both feature and display promotion, which suggeststhat they may be pure price- or value-seeking shoppers. Al-though this segment should respond positively to any form ofprice promotion, it seems unlikely that targeted promotionswould ultimately build loyalty or enhance customer profit-ability. Additional research is needed to confirm these initialfindings with respect to the PR segment.4
4.2. Limitations and future research
The limitations of our study also suggest directions for futureresearch. The structural heterogeneity model requires a priorispecification of segment models based on prior knowledge anddoes not allow customers to change models across purchaseoccasions. Although developing a model that can accommodatetemporal changes in segment memberships would require a longpurchase history and be very challenging, it could beilluminating. We believe that customers may use differentprice perception mechanisms to adjust to the purchaseenvironment. For example, IRP customers may implement thePR model when they go to a less familiar store because they
38 S. Moon, G. Voss / Journal of Business Research 62 (2009) 31–38
question the relevance of past price observations at a differentstore. It also would be worthwhile to investigate price responseheterogeneity in the context of a category purchase incidencemodel (Bell and Bucklin 1999). This line of research couldinvestigate which customer characteristics influence the priceresponse model in the context of the category purchaseincidence model along with managerial implications.
It also would be instructive to link segment behaviors,especially promotion responsiveness, to individual segment andoverall store profitability. As suggested above, targeted multi-period promotions could have a positive effect on the profit-ability of IRP customers if they increased store loyalty, but theycould have a negative effect if the frequent promotionsdecreased the IRP, ultimately producing a negative impact oncurrent price perceptions. From another perspective, IRP shouldhave greater implications for HiLo stores, where frequentpromotions increase price variabilities over time, which willgenerate a situation where IRP loss and gain effects arepronounced. We expect that promotion has a positive impact onERP customers irrespective of promotion frequency, whichpartially explains why frequently promoted brands still attractcustomers in spite of the widely-accepted negative long-termeffect of frequent promotions. And finally, we expect that PRshoppers offer the smallest margins across product categories,as they switch brands in search of the best available price.
References
Andrews RL, Ainslie A, Currim IS. An empirical comparison of logit choicemodels with discrete versus continuous representations of heterogeneity.J Mark Res 2002;39:479–87 (November).
Becker GS. A theory of the allocation of time. Econ J 1965;75:493–517(September).
Bell DR, Bucklin RE. The role of internal reference points in the categorypurchase decision. J Consum Res 1999;26:128–43 (September).
Bell DR, Lattin JM. Looking for loss aversion in scanner panel data: theconfounding effect of price response heterogeneity. Mar Sci 2000;19:185–200(Spring).
Biswas A, Blair EA. Contextual effects of reference prices in retail adver-tisements. J Mark 1991;55:1–12 (July).
Briesch RA, Krishnamurthi L, Mazumdar T, Raj SP. A comparative analysis ofreference price models. J Consum Res 1997;24:202–14 (September).
Blundell RW, Powell JL. Endogeneity in semiparametric binary responsemodels. Rev Econ Stud 2004;71:655–79.
Bucklin RE, Lattin JM. A two-state model of purchase incidence and brandchoice. Mark Sci 1991;10(1):24–39.
Bucklin RE, Russell GJ, Srinivasan V. A relationship between price elasticitiesand brand switching probabilities. J Mark Res 1998;35:99–113 (February).
Chang K, Siddarth S, Weinberg CB. The impact of heterogeneity in purchasetiming and price responsiveness on estimates of sticker shock effects. MarkSci 1999;18(2):178–92.
Erdem T, MayhewG, Sun B. Understanding the reference price sensitive shopper:a within and cross-category analysis. J Mark Res 2001;38(4):445–57.
Fader PS, Lattin JM, Little JDC. Estimating nonlinear parameters in themultinomial logit model. Mark Sci 1992;11(4):372–85.
Feinberg, F., Russell, G.J. A consistent loyalty measure for generalized logitmodels. working paper, Tippie College of Business, University of Iowa; 2003.
Guadagni PM, Little JDC. A logit model of brand choice calibrated on scannerdata. Mark Sci 1983;2:203–38 (Summer).
Hardie BGS, Johnson EJ, Fader PS. Modeling loss aversion and referencedependence effects on brand choice. Mark Sci 1993;12:378–94 (Fall).
Helson H. Adaptation-level theory. New York: Harper and Row Publishers, Inc.;1964.
Janiszewski C, Lichtenstein DR. A range theory account of price perception.J Consum Res 1999;25:353–68 (March).
Kahneman D, Tversky A. Prospect theory: an analysis of decision under risk.Econometrica 1979;47:263–91 (March).
Kalyanaram G, Winer RS. Empirical generalizations from reference priceresearch. Mark Sci 1995;14(3):G161–9 Part 2 of 2.
Kamakura WA, Kim B, Lee J. Modeling preference and structural heterogeneityin consumer choice. Mark Sci 1996;15(2):152–72.
Kamakura WA, Russell GJ. A probabilistic choice model for market segmentationand elasticity structure. J Mark Res 1989;26:379–90 (November).
Klapper D, Ebling C, Temme J. Another look at loss aversion in brand choice data:canwe characterize the loss averse consumer? Int J ResMark 2005;22:239–54.
Krishnamurthi L, Raj SP. A model of brand choice and purchase quantity pricesensitivities. Mark Sci 1988;7:1–20 (Winter).
Kumar V, Karande K, ReinartzWJ. The impact of internal and external referenceprices on brand choice: the moderating role of contextual variables. J Retail1998;74(3):401–26.
Mazumdar T, Papatla P. An investigation of reference price segments. J MarkRes 2000;37:246–59 (May).
Mazumdar T, Raj SP, Sinha I. Reference price research: review and propositions.J Mark 2005;69:84–102 (October).
Monroe KB, Della Bitta AJ, Downey SL. Contextual influences on subjectiveprice perceptions. J Bus Res 1977;5:277–91 (December).
Moon S, Russell GJ, Duvvuri SD. Profiling the reference price consumer.J Retail 2006;82(1):1–11.
Niedrich RW, Sharma S, Wedell DH. Reference price and price perceptions: acomparison of alternative models. J Consum Res 2001;28:339–54(December).
Rajendran KN, Tellis GJ. Contextual and temporal components of referenceprice. J Mark 1994;58:22–34 (January).
Russell GJ, Petersen A. Analysis of cross category dependence in market basketselection. J Retail 2000;76(3):367–92.
Villas-Boas JM, Winer RS. Endogeneity in brand choice models. Manage Sci1999;45(10):1324–38.
Volkmann J. Scales of judgment and their implications for social psychology. In:Rohrer John H, Sherif Muzafer, editors. Social Psychology at the Crossroads;1951. p. 273–96.
Wernerfelt B.Brand loyalty andmarket equilibrium.Mark Sci 1991;10(3):229–45.Winer RS. A reference price model of brand choice for frequently purchased
products. J Consum Res 1986;13:250–6 (Spring).