how do family ownership, control, and management affect
TRANSCRIPT

How Do Family Ownership, Control, and Management Affect Firm Value?∗
Belén Villalonga Harvard Business School
Soldiers Field Boston, MA 02163
Telephone: (617) 495-5061 Fax: (617) 496-8443
E-Mail: [email protected]
Raphael Amit The Wharton School
University of Pennsylvania 3620 Locust walk
Philadelphia, PA 19104 Telephone: (215) 898-7731
Fax: (215) 573-7189 E-Mail: [email protected]
August 20, 2004
* Both authors contributed equally to this paper. We would like to thank Carliss Baldwin, Lucien Bebchuk, Wilbur Chung, Harold Demsetz, Ben Esty, Mara Faccio, Stuart Gilson, Robin Greenwood, Louis Kaplow, Ian MacMillan, Anita McGahan, Andrew Metrick, Todd Millay, Cynthia Montgomery, Urs Peyer, Thomas Piper, Stefano Rossi, Richard Ruback, Andrei Shleifer, Jordan Siegel, Howard Stevenson, Peter Tufano, Sidney Winter, Julie Wulf, Bernard Yeung, seminar participants at Boston University, Harvard Business School, the Harvard Law, Economics, and Organization seminar, MIT, UCLA, Wharton, the BYU-University of Utah 2004 Winter Conference, the European Finance Association 2004 Annual Meeting, the National Bureau of Economic Research 2004 Summer Institute, and the Harvard Economics Ph.D. students in the Corporate Finance class for their comments. We thank Jessica Grimes, Amee Kamdar, Blanca Moro and Mary Margaret Spence for their tireless contributions to the data collection effort. Raphael Amit is grateful for the financial support of the Robert B. Goergen Chair at the Wharton School and the Wharton Global Family Alliance. Belén Villalonga gratefully acknowledges the financial support of the Division of Research at the Harvard Business School.

1
How Do Family Ownership, Control, and Management Affect Firm Value?
ABSTRACT Using proxy data on all Fortune 500 firms during 1994-2000, we find that family ownership
creates value only when the founder serves as the CEO of the family firm or as its Chairman with
a hired CEO. Dual share classes, pyramids, and voting agreements reduce the founder’s
premium. When descendants serve as CEOs, firm value is destroyed. Our findings suggest that
the classic owner-manager conflict in non-family firms is more costly than the conflict between
family and non-family shareholders in founder-CEO firms. However, the conflict between
family and non-family shareholders in descendant-CEO firms is more costly than the owner-
manager conflict in non-family firms.

2
Several recent studies show that family firms are at least as common among public
corporations around the world as are widely held and other non-family firms (Shleifer and
Vishny, 1986; La Porta, López de Silanes, and Shleifer, 1999; Claessens, Djankov, and Lang,
2000; Faccio and Lang, 2002; Anderson and Reeb, 2003).1 Whether family firms are more or
less valuable than non-family firms remains an open question. Among large U.S. corporations,
Holderness and Sheehan (1988) find that family firms have a lower Tobin’s q than non-family
firms, while Anderson and Reeb (2003) find the opposite. In other economies, the evidence is
scarce but also mixed (Morck, Stangeland, and Yeung, 2000; Claessens, Djankov, Fan, and
Lang, 2002; Cronqvist and Nilsson, 2003).
We posit that, in order to understand whether and when family firms trade at a premium
or discount relative to non-family firms, we must distinguish among three fundamental elements
in the definition of family firms: ownership, control, and management. The theory and evidence
thus far raises questions about all three.
First, does family ownership, per se create or destroy value? Berle and Means (1932)
suggest that ownership concentration should have a positive effect on value because it alleviates
the conflict of interests between owners and managers. On the other hand, Demsetz (1983)
argues that ownership concentration is the endogenous outcome of profit-maximizing decisions
1 Shleifer and Vishny (1986) report on the identity of the largest shareholders in a sample of 456 of the Fortune 500 corporations in 1980: 207 are institutions, 149 are families represented on the board of directors, and 100 are other corporations or family holding companies not represented on the board. La Porta et al. (1999) examine the ownership and control structures of the 20 largest publicly traded firms in each of the 27 generally richest economies, as well as of 10 smaller firms in some of these countries. To establish who controls the firms, they look at the identities of the ultimate owners of capital and voting rights. They find that 36 percent of the large firms in their sample are widely held, 30 percent are controlled by families or individuals, 18 percent are controlled by the State, five percent are controlled by a widely-held financial institution, and five percent are controlled by a widely-held corporation. For the smaller firms and using a less restrictive definition of control (a 10 percent threshold as opposed to 20 percent), the fraction of family-controlled firms in their sample rises to 53 percent. Claessens et al. (2000) examine 2,980 corporations in nine East Asian countries and find that over two thirds of firms are controlled by families or individuals. Faccio and Lang (2002) analyze the ultimate ownership and control of 5,232 public corporations in 13 Western European countries and find that 44 percent of firms are family-controlled, and 34 percent are widely held. Anderson and Reeb (2003) find that founding families are present in one-third of the S&P 500 corporations during 1992–1999.

3
by current and potential shareholders, so that, as a result, it should have no effect on firm value.
Demsetz and Lehn (1985), Himmelberg, Hubbard, and Palia (1999), and Demsetz and Villalonga
(2001) provide evidence in support of Demsetz’s arguments. Three recent studies focus more
narrowly on the effect of ownership in the hands of families and other large shareholders:
Claessens et al. (2002), Anderson and Reeb (2003), and Cronqvist and Nilsson (2003). Yet,
because they do not separate family ownership from both family control and family
management, the effect of ownership per se cannot be ascertained from these studies.2
Second, does family control create or destroy value? Individual- and family-controlled
firms are the foremost example of the corporation modeled by Shleifer and Vishny (1986), one
with a large shareholder and a fringe of small shareholders. In such a corporation, the classic
owner-manager conflict described by Berle and Means (1932) or Jensen and Meckling (1976)
(which we shall refer to as, “Agency Problem I”) is mitigated due to the large shareholder’s
greater incentives to monitor the manager. However, a second type of conflict appears (“Agency
Problem II”): The large shareholder may use its controlling position in the firm to extract private
benefits at the expense of the small shareholders. If the large shareholder is an institution such as
a bank, an investment fund, or a widely held corporation, the private benefits of control are
diluted among several independent owners. As a result, the large shareholder’s incentives for
expropriating minority shareholders are small, but so are its incentives for monitoring the
manager, so we revert to Agency Problem I for those firms. If the large shareholder is an
individual or a family, it has greater incentives for both expropriation and monitoring, which are
likely to lead Agency Problem II to overshadow Agency Problem I.
2 Claessens et al. (2002) and Cronqvist and Nilsson (2003) distinguish between family ownership of cash flow rights and ownership of voting rights, but do not separate these from the effect of family management. Anderson and Reeb (2003) examine the effects of family ownership and management but do not distinguish ownership from control.

4
But which of the two agency problems is more detrimental to shareholder value? The
evidence on this point is scant and inconclusive. Claessens et al. (2002) and Lins (2003) show
that, in East Asian economies, the excess of large shareholders’ voting rights over cash flow
rights reduces the overall value of the firm, albeit not enough to offset the benefits of ownership
concentration. Cronqvist and Nilsson (2003) find that, in Sweden, it is cash flow ownership, not
excess voting rights, that has a negative impact on value. Moreover, neither of these studies
controls for the endogeneity of ownership and control, which earlier research shows is a major
determinant of its effect on firm value (Demsetz and Villalonga, 2001).
Third, does family management create or destroy value? Because family management
reduces and can even eliminate Agency Problem I, agency theory would predict a positive effect
on value of family management. Yet, this effect may be offset by the costs of family
management if hired professionals are better managers than are family founders or their heirs
(Burkart, Panunzi, and Shleifer, 2003). Consistent with the view that family management
mitigates the classic agency problem, Palia and Ravid (2002), Adams, Almeida, and Ferreira
(2004), and Fahlenbrach (2004) find that founder-CEO firms trade at a premium relative to other
firms. On the other hand, Smith and Amoako-Adu (1999) and Pérez-González (2001) find that
the stock market reacts negatively to the appointment of family heirs as managers.
These findings raise several questions related to family management: Is there a positive
family effect on firm value beyond that of founders? Does the positive effect of founders require
that they occupy the CEO position in the firm, or, do non-founder CEOs with a founder as
Chairman of the Board fare equally well (perhaps even better)? Is the effect of descendants
neutral or negative? And does it vary across generations?
We use detailed data from the proxy filings of all Fortune 500 firms between 1994 and
2000 to examine these questions about the value effects of family ownership, control, and
5
management. We find that family ownership only creates value for all of the firm’s shareholders
when the founder is still active in the firm either as CEO or as Chairman with a hired CEO.
When family firms are run by descendant-CEOs, minority shareholders in those firms are worse
off than they would be in non-family firms where they would be exposed to the classic agency
conflict with managers. This result holds even when the founder is present in the firm as
Chairman. Founders create the most value when no control-enhancing mechanisms facilitate the
expropriation of non-family shareholders. Examples include multiple share classes with
differential voting rights, pyramids, cross-holdings, or voting agreements. Descendant-CEOs
destroy value whether or not the family has established control-enhancing mechanisms.
We also find that the negative effect of descendant-CEOs is entirely attributable to
second-generation family firms. The incremental contribution to q of third-generation firms is
positive and significant, which points to a non-monotonic effect of generation on firm value.
Our results are generally robust to the use of alternative specifications and econometric
techniques, including multivariate OLS regressions of q and industry-adjusted q on continuous
and categorical measures of family ownership and control, fixed- and random-effects panel data
models, and treatment effect models to control for endogeneity.
We conclude by going back to the overarching question of whether family firms are more
or less valuable than are non-family firms. We show that, as a result of the different effects that
family ownership, control, and management have on firm value, the answer to this question
depends on how these three elements are incorporated into the definition of a family firm.
The paper is organized as follows: In Section I we describe our data. In Section II we
present our main results, and analyze their robustness in Section III. In Section IV, we conclude.

6
I. Data and Variables
A. Sample
Our sample comprises a panel of 52,787 shareholder-firm-year observations, representing
2,808 firm-years from 508 Fortune 500 firms during the period 1994–2000. These are firms that
are in the Fortune 500 in any of these years, have Compustat data on sales, assets, and market
value during that period, and whose primary industry is not financial services, utilities, or
government. The primary industries of our sample firms span 53 different two-digit SIC codes
and 41 of the 48 industries defined by Fama and French (1997). For those firms that meet our
criteria, we include all years with available data between 1994 and 2000, even if the firm is not
in the Fortune 500 list in a particular year.
Our data collection process involves two distinct phases. In Phase I, we build a database
at the individual shareholder level which covers, for each firm-year in the sample, all of its
insiders (officers and/or directors), blockholders (owners of five percent or more of the firm’s
equity), and the five largest institutional shareholders. We compile our Phase I data set from four
sources: proxy statements for detailed information about blockholder and insider ownership, and
about the firm’s voting and board structures; Spectrum data on institutional holdings; Hoover’s,
corporate websites, and web searches about company histories and family relationships; and
various SEC filings, to clarify the identity of ultimate owners whenever firms are controlled
through intermediate corporations or “pyramids.” This data set comprises 52,787 shareholder-
firm-year observations.
Phase II of our data collection process centers on aggregating our shareholder-level
database from Phase I into firm-years, and obtaining data on a broad range of firm characteristics
from three other sources: Compustat, CRSP, and the Investor Responsibility Research Center
(IRRC), which provides data on governance provisions in charters, bylaws, and the Securities

7
and Exchange Commission (SEC) filings. This aggregation results in 2,808 firm-year
observations from 508 different firms. Table I describes the main variables of our study.
B. Founders, families, and family firms
We define family firms as those where the founder or a member of his or her family by
either blood or marriage is an officer, a director, or a blockholder, either individually or as a
group. Our main analyses are based on this definition, which does not require a minimum
threshold for family ownership or control above those imposed by SEC reporting requirements.
We later examine how our results change when we impose additional conditions for family firms
to qualify as such. Those conditions include a minimum control threshold of 20 percent of the
votes, being the largest shareholder or voteholder, having family officers or directors, or being in
second or later generation.
Several clarifications are in order with respect to the precise meaning of “founder.” First,
the founder may have founded either our sample firm or a predecessor firm. The latter is the
case, among many others, of the Martini family in Berger-Brunswig, of Ted Turner in Time
Warner, and of the Lorberbaum family in Mohawk Industries.3
Second, when there is more than one founder, either because there were two or more co-
founders of the firm or because our sample firm is the outcome of a merger of family firms, we
consider as founding family the one with the largest voting stake. For instance, the families of
Hewlett-Packard co-founders Bill Hewlett and David Packard are both large shareholders with 3 Bergen Brunswig resulted from the merger, in 1969, of the Brunswig Drug Company (founded in 1885 by Lucien Napoleon Brunswig) and Bergen Drug (founded in 1947 by Emil Martini, who died and was succeeded by his son Emil Jr. in 1956). Emil Jr. took the helm of the merged entity and was succeeded at his death by his brother, Robert Martini, who took over as Chairman and CEO and appears in the proxy as the largest non-institutional shareholder. Time Warner became a family firm in 1996 as a result of its acquisition of Turner Broadcasting Systems, whose founder Ted Turner became the largest shareholder in the merged entity. Mohawk Industries became a family firm in 1995 as a result of its acquisition of Aladdin, which was itself controlled by founder Alan Lorberbaum and his son, Jeffrey. Prior to the merger, the largest shareholder of Mohawk was Citicorp, with a 31 percent ownership stake in the firm. After the merger, Citicorp’s stake was reduced to 18 percent and the Lorberbaum family as a group became the largest shareholder with a combined stake of 42 percent.

8
board presence during our sample period. Because the Packard family has almost twice as many
shares as the Hewlett family in all years in our sample, we consider the Packards, and not the
Hewletts, as the controlling family. In Kellogg, the largest individual shareholder is George
Gund III, as a result of his father, George Gund II’s sale for stock of one of his companies to
Kellogg in 1927. In addition, George III’s brother Gordon is a director. Yet the Kellogg family,
through the W.G. Kellogg foundation, owns about three times as many shares as does the Gund
family. We therefore consider the Kelloggs, and not the Gunds, as the controlling family.
Third, we note that the person who is generally recognized as a firm’s founder is the one
responsible for the firm’s early growth and development into the business that it became known
for, yet this need not be the same individual who started and incorporated the company or a
predecessor business, nor the one who took the company public. For instance, the Ochs-
Sulzberger family in the New York Times, the Graham family in the Washington Post, and the
Galvin family in Motorola all “started” their firms with the acquisition of bankrupt (and hence
previously existing) companies. Paul Fireman became Reebok’s “official founder” through his
acquisition of the U.K. company’s distribution rights for the U.S. in 1979. Robert Walter is
generally perceived as Cardinal Health’s founder after he shifted Cardinal’s core business from
food wholesaling to health services.4
To reduce arbitrariness, we only consider as founders those individuals that are identified
as such in at least two public data sources, and no other data source that we are aware of
mentions a different person as the founder. We systematically do not consider as founders any of
the following individuals: executives who became the largest non-institutional shareholder in
their company through the accumulation of stock-based compensation, through a spin-off, or
4 Walter acquired Cardinal Foods in a leveraged buyout in 1971. Cardinal first moved into pharmaceuticals distribution in 1980 with the acquisition of Zanesville and went public in 1983 as Cardinal Distribution.

9
through a management or leveraged buy-out (with the exception of Cardinal Health for the
reasons mentioned); families behind investment management companies such as Fidelity
(controlled by Edward Johnson and his daughter, Abigail), whose funds are the largest
shareholder in 18 percent of our sample and one of the three largest in 35 percent, or Franklin
Resources (controlled by Charles and Rupert Johnson); and general partners in venture capital
funds or leveraged buyout funds such as KKR (controlled by Henry Kravis and George Roberts,
who are first cousins).
C. Family Holdings of Shares and Votes
Only in a few cases (e.g., Nordstrom, Murphy Oil) does the proxy itself provide an
aggregate figure for the percentage of shares held by the family as a group. Therefore, we
compute this figure by aggregating, across all classes of shares and across all family members or
representatives, the shares held by the family with investment and/or voting power.
We consider as family representatives all co-trustees that are beneficial owners by virtue
of their association to the family in those trusts, as well as family-designated directors. We
include the shares of family representatives because they owe their job—or their position as
beneficial owners—to the family. Therefore, we can assume that their incentives are aligned with
those of the family. For instance, in the Washington Post during 1994, a significant fraction of
the shares held by the Graham family were held in trusts in which Katherine Graham, her son,
Donald Graham, and director George Gillespie were co-trustees. We consider Gillespie as a
family representative and include all shares held in such trusts.5
On the other hand, we do not include any shares over which the family shares investment
or voting power with a non-member of the family that cannot reasonably be considered as a 5 We include both the shares over which family representatives share investment or voting power with the family and those they hold individually, but the latter are typically insignificant relative to the family’s overall holdings. In contrast, including or excluding the shares over which they share investment or voting power with the family can significantly affect the estimated family holdings.

10
family representative. To continue with the Washington Post example, in 1994, Berkshire
Hathaway (of which Warren Buffett and his wife owned approximately 43.8 percent) was the
beneficial owner of, and held investment power over 1,727,765 (14.8 percent) shares of Class B
Stock in the Post. Pursuant to an agreement dated 1977 and extended in 1985, Warren Buffett,
Berkshire, and its subsidiaries granted Donald Graham a proxy to vote such shares at his
discretion. Because we cannot consider Buffett as a Graham family representative, we include
his shares in our measure of the percentage of votes held by the family, but not in the percentage
of shares held by the family.
D. Tobin’s q
Tobin’s q is the ratio of the firm’s market value to the replacement cost of its assets.
Following recent finance studies, we use the firm’s market-to-book value as a proxy for Tobin’s
q, and we use the market value of common equity plus the book value of preferred stock and
debt as a proxy for the firm’s market value.6 For firms with a single class of shares, the market
value of common equity is the product of the share price at fiscal year-end times the number of
common shares outstanding. We obtain both items from Compustat. For firms with multiple
classes of tradable shares, the procedure is the same for each class of stock and only requires
adding the market value of all classes (Zingales, 1995, Nenova, 2003). For firms with multiple
share classes, including at least one class that is not publicly traded, we multiply the total shares
outstanding of all classes by the share price of the tradable shares to estimate the market value of
common equity. This approach, which is also used in Gompers, Ishii, and Metrick (2004),
amounts to valuing the non-tradable shares at the same price per share as the tradable shares.7
6 This measure is being increasingly used to avoid the arbitrary assumptions about depreciation and inflation rates that more sophisticated measures of q require, and also in light of the high correlation between adjusted and unadjusted measures. For instance, Chung and Pruitt (1994) find that this proxy explains at least 96.6 percent of the variability of Lindenberg and Ross’s (1981) measure of Tobin’s q.

11
II. Main Results
A. Descriptive Statistics7
Table II provides descriptive statistics for our sample, broken down by family and non-
family firms. Family firms represent 37 percent of our sample: 1,041 family firm-years from 193
different firms. The mean q of family firms is 0.23 higher than the q of non-family firms, and the
difference is statistically significant at the 10 percent level using clustered standard errors. The
difference is larger on an industry-adjusted basis: Family firms have a 0.40 higher q, which is
significant at the one percent level. The data thus suggest that family firms are better performers
than are non-family firms, which is consistent with the findings of Anderson and Reeb (2003).
On average, family firms are smaller (in assets, sales, and employees) than are non-
family firms, but not significantly so. They are, however, significantly younger (63 versus 74
years old) and exhibit significantly higher growth than do non-family firms. These characteristics
may raise a concern that the superior performance of family firms is driven by the predominance
among them of early-stage, high-growth firms that have reached the Fortune 500 while still
under founder management or control. Because Tobin's q varies positively with growth
prospects, the higher q of these firms could simply reflect different growth stages. This problem
could be particularly severe in the time period of our sample, which covers the late 1990s boom,
when high-growth companies may have been overvalued.
Several factors attenuate this concern. First, a firm’s inclusion in the Fortune 500 is
dictated solely by its revenues and not by its market value as it occurs, for instance, in the S&P
500 index. Hence, our sample should be unaffected by the bull market of the late 1990s. In fact,
7 Two alternative approaches have been used to value non-tradable shares. One is to ignore the shares outstanding of all non-tradable classes (Anderson and Reeb, 2003). This approach amounts to valuing the non-tradable shares at zero, and therefore underestimates q for firms with non-tradable share classes. Another approach is to value the non-tradable shares at the average premium on traded supervoting shares relative to the common traded shares, e.g. two to 10 percent (Cronqvist and Nilsson, 2003). This approach ignores the liquidity discount that non-tradable shares are subject to, and therefore overestimates q for firms with this type of shares.

12
the highest q’s in our sample typically belong to R&D-intensive firms such as pharmaceutical
companies, which are widely held. Nevertheless, as a robustness check, we re-estimate our
regressions excluding technology firms. We also exclude outliers, which we initially define as
firms with a q greater than 10 (later we use alternative thresholds). Second, family firms also
have higher profitability than do non-family firms, although not significantly so. Third, Palia and
Ravid (2002), Adams et al. (2004), and Fahlenbrach (2004) find the founder-CEO premium to be
robust to a variety of self-selection tests. Fourth, of the family firm-years in our sample, 32
percent are in their first generation, 32 percent are in their second generation, 21 percent are in
their third generation, and 14 percent are in their fourth or later generation (the oldest Fortune
500 firm, Du Pont de Nemours, was founded in 1800 and is a seventh-generation family firm).
All of this suggests that our finding of a higher q for family firms may be subject to a
different kind of selection bias, one that affects second- and later-generation family firms as well
as founder-led firms. We test and control for the presence of this bias in our robustness checks.
We also control for firm age and sales growth in all of the regressions that follow.
Table II shows significant differences between family and non-family firms for all
variables related to governance and control. Families own an average of 16 percent of the equity
of the Fortune 500 firms in which they are present. Yet 50 percent of them use some control-
enhancing mechanism that entitles them to a fraction of the total votes outstanding greater than
their share ownership stake. These mechanisms include dual share classes with differential
voting rights, pyramids, cross-holdings, and voting agreements. Families make significantly
more frequent use of these mechanisms than do other large shareholders in non-family firms (50
percent vs. 13 percent, respectively). Family voteholdings in excess of shares owned average 17
percent for all family firms.

13
The Governance Index is the measure of corporate governance developed by Gompers,
Ishii, and Metrick (2003) based on the Investor Responsibility Research Center (IRRC) data. The
index is a count of the number of governance provisions in the firm’s charter, bylaws, or SEC
filings that reduce shareholder rights. These are largely anti-takeover and officer or director
protection provisions.8 The index is thus a proxy for weak corporate governance. In our sample,
the index ranges between two and 16 and is significantly greater for non-family firms. This
finding, taken together with the evidence on families’ excess voteholdings, is consistent with the
view that minority shareholders’ risk of expropriation comes from two different sources in
family and non-family firms: controlling shareholders in the former, management in the latter.
The average equity ownership by non-family blockholders is significantly lower in
family firms than it is in non-family firms. Perhaps more surprisingly, the mean level of
ownership by non-family blockholders in family firms is exactly the same as the mean family
ownership in these firms (16 percent). Family firms have a significantly lower proportion of
independent directors than do non-family firms. This finding suggests that independent directors
provide better protection of minority shareholder rights against the threat of managers than the
protection they provide against the threat of large shareholders. Family firms also have
significantly lower dividend rates and leverage than do non-family firms. Both dividends and
debt can play a role in limiting minority shareholder expropriation by removing corporate wealth
from family control (Jensen, 1986; Faccio, Lang, and Young, 2001). Yet, our findings suggest
8 The provisions are described in detail in Gompers et al. (2003), and include: (1) tactics for delaying hostile bidders such as staggered boards, special meetings, requirement of written consent, or “blank checks”; (2) officer/director protection provisions such as compensation plans, contracts, golden parachutes, indemnification, liability, or severance agreements; (3) voting provisions including secret ballots, supermajorities, unequal voting rights, and the absence of cumulative voting; (4) other anti-takeover provisions such as antigreenmail, directors’ duties, fair price, poison pills, and silver or pension parachutes; and (5) state laws that make certain governance provisions apply automatically.

14
that dividend policy and capital structure in U.S. family firms exacerbate rather than dampen the
problem.
Family and non-family firms also differ significantly in their investment policies. Family
firms have relatively higher capital expenditures but slightly lower R&D expenditures. They are
also less prone to being diversified than are their non-family counterparts. Consistent with their
diversification profile, family firms’ stock returns show higher levels of risk, both systematic and
idiosyncratic. This pattern contrasts with the conventional wisdom that families may be inclined
to diversify their firms to make up for their lack of personal diversification.
To recapitulate, family and non-family firms differ significantly in age, growth,
performance, corporate governance and control, financial policies, and investment policies. We
next assess the contribution of these variables to the valuation differential between the two
groups of firms.
B. Main Effects of Family Ownership, Control, and Management on Firm Value
Table III reports results of multivariate OLS regressions of value on different measures of
family ownership, control, and management. In columns (1) and (2), we use Tobin’s q as our
dependent variable and use year and Fama-French industry dummies to control for time and
industry effects. In columns (3) and (4), we control for these two effects by using industry-
adjusted q as our dependent variable, and we drop the industry and year dummies. We construct
industry-adjusted q as the difference between the firm’s q and the asset-weighted average of the
imputed q’s of its segments, where a segment’s imputed q is the industry average q, and q is
measured as before. We compute industry averages at the most precise SIC level for which there
is a minimum of five single-segment firms in the industry-year.
In columns (1) and (3), we measure family ownership by a family firm dummy, and
family control by a dummy that indicates the presence of control-enhancing mechanisms such as

15
multiple share classes, pyramids, cross-holdings, or voting agreements. Following La Porta et al.
(1999) and Bebchuk et al. (2000), we assume that the use of these mechanisms reflects the
family’s ability to extract private benefits of control. In columns (2) and (4), we use continuous
measures of both family ownership and control. We measure family ownership by the percentage
of shares of all classes held by the family as a group. We measure family control (in excess of
ownership) by percentage of votes owned by the family in excess of the percentage of shares
they own. In all columns, we measure family management using a dummy that indicates the
presence of a family CEO.9 The regression control variables include most of those whose
descriptive statistics we report in Table II.
Columns (1) and (3) in Table III confirm the univariate differences in q reported in Table
II. The coefficient of the family firm dummy is 0.26 in the Tobin’s q regression, 0.25 in the
industry-adjusted q regression, and it is statistically significant in both. Control-enhancing
mechanisms have a negative and significant effect on q (0.21). This finding suggests that family
firm shareholders pay a price for the family’s appropriation of private benefits. The effect of
control-enhancing mechanisms on industry-adjusted q is also negative but not significant.
Columns (2) and (4) provide further quantification of the value effects of family
ownership and control. We find a positive and significant coefficient of family ownership that is
identical for both industry-adjusted and unadjusted q (0.66). However, we find that the benefits
of continuous family ownership are partially offset by the costs of family excess voteholdings:
The coefficient on the excess voteholdings variable is negative and significant (-0.12 in both
regressions). What is notable about our result is that we find it in a sample of firms that trade in
U.S. stock markets, where the degree of shareholder protection is very high relative to, among
9 We obtain similar results if, instead of the family CEO dummy, we use a dummy that indicates the presence of family members in any management position.
16
others, the Asian economies in Claessens et al. (2002), the Swedish economy in Cronqvist and
Nilsson (2003), or the emerging markets in Lins (2003). Nevertheless, our result is consistent
with the finding that, in U.S. dual-class companies, firm value is increasing in cash flow
ownership but decreasing in voting ownership (Gompers et al., 2004).
Altogether, our findings about family ownership and control suggest that, despite the
costs associated to the family’s excess control, the benefits of family ownership make minority
shareholders better off than they would have been in a non-family firm. Family management, as
measured by the presence of a family CEO, has no significant effect on value.
The coefficients of the statistical control variables have the same sign and similar size
across all the specifications in Table III. The governance index, which proxies for weak
corporate governance, is negatively related to firm value, as in Gompers et al. (2003), and is
significant in three out of the four regressions. Non-family blockholder ownership also has a
negative coefficient that is significant in the unadjusted q models. This result runs contrary to the
notion that outside blockholders play a valuable monitoring role. In unreported regressions, we
find that the effect of blockholders is significantly more negative for non-family firms than it is
for family firms. This finding suggests that families play a moderating role in the agency conflict
between other large shareholders and minority shareholders. Alternatively, one can interpret it as
evidence of reverse causation (Holderness, 2003): Blockholders are more likely to take control of
underperforming firms, especially those that are not already controlled by a family.
We also find that the proportion of independent directors on the board does not
significantly affect firm value. Again, this runs contrary to the much-touted monitoring role that
independent directors are expected to play in corporations, yet our findings are consistent with
earlier evidence on their effectiveness (Hermalin and Weisbach, 2003).

17
C. Interaction Effects of Family Ownership, Control, and Management on Firm Value
We next examine how family ownership, control and management interact with one
another in their effects on firm value. We specifically exploit the interaction between the family
control and family CEO dummies to address the question of which of the two agency problems is
more costly, the conflict between owners and managers or the conflict between large and small
shareholders. Although the actual presence of either agency problem in a firm is difficult to
measure directly, in family firms we can at least measure the absence of Agency Problem I by
assuming that having a family CEO eliminates the conflict between owners and managers. We
also assume that the use by families of mechanisms that enhance their voting power over and
above their equity ownership stake proxies for the divergence of interests between large (family)
and small (non-family) shareholders (Agency Problem II).
The interaction between these two dummies yields a useful classification of our sample
firms into four groups, according to the presence or absence of agency problems in each group:
• Type I: Family firms with control-enhancing mechanisms (dual-share classes, pyramids,
cross-holdings, or voting agreements) and a family CEO. These firms might have Agency
Problem II, but not Agency Problem I.
• Type II: Family firms with control-enhancing mechanisms but no family CEO. These firms
might have both agency problems.
• Type III: Family firms with a family CEO but no control-enhancing mechanisms. These
firms do not have either agency problem.
• Type IV: Non-family firms, which may have Agency Problem I, but not Agency Problem II.
In our sample, there are 260 Type I family firms, 262 Type II family firms, 271 Type III
family firms, and 1,767 non-family (Type IV firms). There are also 248 family firms that, like

18
the non-family firms, have neither control-enhancing mechanisms nor a family CEO.10 The
similarity of the Type IV family firms to the non-family firms in the agency problems they face
is reflected in a non-significant difference between their Tobin’s q’s. Therefore, in our
subsequent analyses we group these family firms and the non-family firms together under Type
IV. Although not reported, the results are similar if we exclude the family firms from the group.
We use this classification to test the impact on firm value of the two agency problems,
either alone or in combination with each other, by comparing the average q of the four types of
firms. Table IV reports the results of these tests. The most notable result is that the absence of
any agency problem is associated with the highest average q among the four groups, 2.66. The
differences between this value and the mean q of any of the other three groups are all statistically
significant. This is also the case for industry-adjusted q. In other words, family firms whose CEO
is a member of the family, and which have no control-enhancing mechanisms in place (Type III
firms), enjoy the highest performance.
The unadjusted q’s of the other three types of firms range from 1.93 to 1.97 and are not
statistically different from one another. Yet there are significant differences in industry-adjusted
q between Type I and Type IV firms. Type I family firms, which are exposed to Agency Problem
II, have an industry-adjusted q that is 0.26 higher than the q of Type IV firms, which are exposed
to Agency Problem I. Because in these two types of firms the two agency problems appear in
isolation from each other, this result speaks directly to the question of which of the two problems
is more harmful to shareholder value. It thus illuminates the theoretical debate about the relative
importance of each agency problem (see, e.g., Burkart et al., 2003).
10 There are 242 out of the 1,767 non-family firm years that have multiple classes of shares with different voting rights. Because, in those firms, any private benefits of control appropriated by the largest shareholder (e.g., a bank, investment fund, or widely held corporation) would be diluted among several independent owners, we assume that there is no Agency Problem II.

19
D. Family firm generations
The results we have reported thus far do not distinguish among generations of family
firms or family CEOs. However, earlier studies suggest that founders and descendants may have
a very different impact on firm value (Pérez-González, 2001; Fahlenbrach, 2004, etc.). In this
section we investigate these differences in detail.
Table V examines the effects that founders and descendants have on the value of family
firms when they occupy the position of CEO or Chairman of the Board. Panel A reports on the
prevalence of founders and descendants in these positions. We also report the mean q of firms
for the six combinations of founders, descendants, and hires in the roles of chairman and CEO.
Firms with a founder-CEO (and Chairman) have the highest average q, 3.12. The q of firms
where the founder remains as Chairman but hires an outside CEO is almost as high (2.81), and
not significantly different from the previous (t-statistic of 0.76). When the founder remains as
Chairman but is succeeded by a descendant in the role of CEO, the resulting mean q is the lowest
across all categories (0.61). As a caveat, we note that this last finding is based only on ten
observations and therefore has no statistical significance. The next-lowest-q belongs to firms that
have a descendant-Chairman and CEO.
Panel B of Table V contains more formal tests of the value effect of Chairman/CEO
founders and descendants. It reports coefficients from OLS regressions of q on dummy variables
that indicate whether the firm is a family firm with its founder, a descendant, or a hired
individual in any of those two roles. The top row in Panel B shows the value effect of founders,
descendants, and hires in the role of CEO. The results confirm that founder-CEO firms are the
most valuable of all (family and non-family firms); descendant-CEO firms are the least valuable
(and significantly so); and family firms with a hired CEO are not significantly different in value
20
from non-family firms. The bottom row in Panel B shows similar results for founders,
descendants, and hires in the role of Chairman of the Board and/or CEO.
The results in Table V show that founder- and descendant-led firms are at opposite ends
of the distribution of value across family and non-family firms. This finding accounts for the lack
of significance of the family-CEO dummy in Table III.
Our results confirm prior findings that founders bring valuable skills to their firms
(Morck et al., 2000; Fahlenbrach, 2004, etc.). However, when we look at the Chairman position
as well as the CEO’s, what we find is that founders’ skills are almost as valuable when they
bring them to the firm through their position as Chairman but have a hired CEO in place. One
likely explanation for this finding is in the nature of the skills that founders bring to their firms:
Founders may be inspiring leaders, great visionaries, or exceptionally talented scientists. But
they may not––and need not––be good managers as well.
Our findings are also consistent with the longitudinal evidence on abnormal returns to the
appointment of family heirs as managers (Pérez-González, 2001). We complement that stream of
research by showing that, as a result of those successions, descendant-CEO firms trade at a
discount not just relative to the same or other firms led by their founders, but also with respect to
non-family firms.
In Table VI, we analyze the effects of different generations of descendants on firm value.
Panel A reports the effect of family firm generation, that is, the latest generation of family
members that are active in the firm as managers, directors, or blockholders, in relation to the
founder. The concept is slightly different from the previous distinction between founder and
descendant chairman/CEOs: A firm with a founder-chairman or CEO may be in its second
generation if the descendants are also blockholders or are active in the firm’s management or
board of directors.

21
In the first row of Panel A, the generation dummies equal one if the firm is a family firm
in the generation indicated by the column heading (e.g., third), and zero otherwise. In the second
row of coefficients, the generation dummies equal one if the firm is a family firm in that
generation or in a later one, and zero otherwise. Hence, the first set of coefficients measure the
difference between family firms in each generation and non-family firms, while the second set of
coefficients measure the incremental contribution to q of each generation.
The results show that the positive value effect of family firms reported in Table III is
entirely attributable to first-generation family firms. Second-generation firms are not
significantly different from non-family firms, and yet their marginal contribution to q relative to
first-generation family firms is negative and significant. The marginal contribution of later
generations is not significant, that is, there is no drop in q when one moves from second-
generation family firms to third-generation firms, or from third-generation firms to fourth-
generation firms.
Panels B and C of Table VI show the effect of the CEO or Chairman’s generation.
Because the founder’s generation is defined to be the first and no founder in our sample is a
blockholder without also being chairman or CEO, the first-generation coefficients are the same
as the founder coefficients reported in Table V. The new information that Table VI provides is
the breakdown of descendant Chairman/CEO effects by generation. Panel B shows that only
second-generation descendant-CEO firms are on average significantly less valuable than are non-
family firms. Third- and later-generation family firms are not significantly different in value
from non-family firms. However, the results about the incremental contribution to q of each
generation of descendant-led firms show a non-monotonic effect of generation on firm value:
second-generation firms alone account for the negative effect of descendant-CEOs. The marginal
contribution of third-generation firms is positive and significant at the 10 percent level. The

22
marginal contribution of fourth-generation firms is not significant. Panel C shows that the results
for descendant-Chairmen/CEOs are consistent with those for descendant-CEOs, but are generally
less significant.
E. Founder-CEO Benefits and Agency Costs
In light of the differences between founder- and descendant-led family firms, in Table
VII we re-examine the results reported in Table IV about the relative costs of the two agency
problems by subdividing the two groups of firms that have a family-CEO (Types I and III) into
founder-CEO and descendant-CEO categories.
Table VII shows that the results in Table IV are driven by the presence of founder-CEO
firms among family firms. The highest-q category are the Type III founder-CEO firms, which
have no owner-manager conflict (Agency Problem I), and no control-enhancing mechanisms that
might create a conflict of interests between the founder and other shareholders (Agency Problem
II). These firms have an average q of 3.42, which is significantly higher (1.45) than the q of non-
family firms. The difference is similar in terms of industry-adjusted q (1.43).
Agency Problem I alone is more costly than is Agency Problem II in founder-CEO
firms: An average q of 2.44 for Type I founder-CEO firms and a q of 1.97 for non-family firms
yields a 0.47 difference in q between the two groups. The difference in industry-adjusted q is
0.67 and is statistically significant at the five percent level. This result suggests that, in Type I
founder-CEO firms, the benefits brought about by founders are large enough to offset the costs
of family excess control. Nevertheless, these firms exhibit a substantial significant discount in
value relative to founder-CEO firms with no control-enhancing mechanisms (Type III firms):
0.98 in q or 0.76 in industry-adjusted q. The latter is also statistically significant. These findings
suggest that the absence of control-enhancing mechanisms curbs the family’s power to
expropriate minority shareholders and thus reduces the price that families pay for control. This
23
interpretation is consistent with our finding that firm value increases with the cash-flow
ownership of the largest shareholder, but decreases when the control rights of the largest
shareholder exceed its cash-flow ownership.
Our results complement the finding of a “control premium” in earlier studies (Barclay
and Holderness, 1989; Zingales, 1995). The premium refers to the excess value of shares that
confers on those shareholders special control rights relative to shares that are otherwise identical
(e.g., in their cash-flow rights). Prior studies interpret this premium as a proxy for the private
benefits of control that owners extract from the firm. However, estimates of the control premium
do not provide a measure of the cost, if any, that the appropriation of such private benefits
imposes on minority shareholders. The control premium literature typically assumes that private
benefits come at the expense of minority shareholders, but it is possible that the incentives
provided by those benefits lead to higher value creation and that the benefits reflect a fair price
for the large shareholders’ monitoring function in the firm.
Our findings suggest that, whenever founders extract private benefits of control through
their use of control-enhancing mechanisms, they and the minority shareholders in the firms they
control pay a price in the form of a discount in value. In firms where there is a single class of
shares, the cost of founder control is spread among all shareholders (including the founder and
his/her family) in proportion to their ownership. If there are multiple share classes and the
family's supervoting shares trade, or are valued, at a premium relative to the other class, minority
shareholders pay a disproportionate share of the price for the founder’s control.
Panel B shows a sharply contrasting picture for descendant CEOs. Descendant-CEO
firms without control-enhancing mechanisms (Type III firms) are significantly less valuable than
are non-family firms (a 0.25 discount in q). Descendant-CEO firms with control-enhancing
mechanisms (Type I firms) exhibit a similar but nonsignificant discount of 0.22 relative to non-

24
family firms. Hence, under descendant leadership, the value effect of control-enhancing
mechanisms is small and opposite to what we see in founder-CEO firms. One possible
explanation for this finding is that, in descendant-CEO firms, the presence of control-enhancing
mechanisms is not so much an indication of the desire to expropriate minority shareholders as it
is of the families’ resistance to the dilution of their ownership stake as the firm grows. Indeed,
second- and later-generation family firms are much heavier users of control-enhancing
mechanisms than are first-generation firms: 37 percent of all first-generation firms and 56
percent of all second- and later-generation firms use these mechanisms, which yields an excess
voting average for each group of 0.11 and 0.20 percent, respectively.
III. Sensitivity Analyses
A. Alternative econometric techniques
Table VIII analyzes the sensitivity of our main results to the use of alternative
specifications and econometric techniques: industry-adjusted q, fixed-effects and random-effects
panel data models, and treatment effects models. We report only selected coefficients from more
complete multivariate specifications that include the same statistical controls as Table III.
Column (1) reports coefficients of a family firm dummy using the same specification as the first
column in Table III. Columns (2) through (6) report coefficients of a regression where the family
firm dummy of column (1) is broken down into five different dummies representing the
categories analyzed in the previous section. The regression is the same for any given row (with
five dummies), except for the treatment effect models, where each of the five dummies uses a
regression of its own. Thus, columns (2) through (6) examine the robustness of the univariate
results reported in Tables IV and VII. To facilitate the comparison, we reproduce the univariate
results in the first row of Table VIII.

25
Row (2) shows that the multivariate results are qualitatively similar to the univariate. The
multivariate specification shifts the coefficients of all family firm types on q to the left but does
not change their sign: the founder premium becomes smaller, and the descendant discount
becomes larger. Row (3) shows that, in industry-adjusted q, both the premium and the discount
become smaller than they are in the univariate regression but remain statistically significant.
In all the analyses reported in this paper, we use clustered standard errors to account for
the error term’s lack of independence across firms. In row (4) of Table VIII, we use random
effects as an alternative way to take into consideration the panel nature of our data. The results
are closest to the multivariate regression coefficients of row (2).
We also use fixed-effects panel data models to control for unobserved heterogeneity. The
results, shown in row (5) of Table VIII, are qualitatively similar to the previous, but are not
statistically significant. This lack of significance is to be expected since the fixed-effects
coefficients are only identified from within-firm changes from the family to the non-family
category, and there are only 21 such changes in our sample.
Our final sensitivity analysis addresses the endogeneity or self-selection of family
ownership, control, and management. Because all three elements are a likely result of
endogenous decisions, the observed relation between each of them and firm value may be subject
to alternative interpretations to value creation or destruction. For instance, in the presence of
information asymmetries, families may have incentives to reduce their equity stake if they
believe their stock is overvalued, or even “abandon the ship” if they foresee a substantial loss in
value. If such were the case, then the positive relation that we observe between family ownership
and value could be subject to a reverse causality interpretation. Also, families may be more
likely to put in place control-enhancing mechanisms in low-performing firms, to counter the
dilution they will experience if they need to issue equity to finance new investments. If this is the

26
case, the negative relation between excess control and value that we observe in our sample may
be no indication of a control discount as we have previously argued.
The relations observed between family management and value may also be subject to
reverse causality interpretations. Family members that are no longer active as managers may be
asked to return upon failures of hired CEOs. Examples include: Apple Computer’s founder,
Steve Jobs, Ford’s William Clay Ford Jr. (fourth generation), or Corning’s James Houghton
(fifth generation). Descendants may also be called on to succeed founders when the firm is
performing poorly. These endogenous successions can potentially account for our results.
We use treatment effects models to address these self-selection and reverse causality
concerns. The treatment indicator is a dummy that equals one for family firms as a whole or for
one of the five categories previously analyzed. The outcome variable is Tobin’s q. Because the
family firm category dummies are themselves an interaction of two treatments (family control
and family management), which, in turn, require family ownership as a precondition, we
effectively model family ownership, control, and management as a jointly endogenous choice.
The treatment effect regressions are estimated, using Heckman’s (1979) two-step procedure, as
separate regressions on subsamples that include only the family firms in the category being
analyzed and the non-family firms.
To meet the exclusion restrictions that are necessary for identification in Heckman’s
model, we include two variables in the probit model that we do not include in the second-stage
regression: idiosyncratic risk, and lagged q. We use idiosyncratic risk as an instrument because
q, as a measure of firm value, should be a function of expected cash flows and expected returns.
According to the Capital Asset Pricing Model (CAPM), the latter should only be a function of
market risk, but not of idiosyncratic or firm-specific risk. Yet, family firm owners, who are
imperfectly diversified, should care about both types of risk. We also include lagged q in the

27
probit model to test for a potential reverse causation between value and the family’s decision to
maintain their ownership of the firm, enhance control beyond their ownership stake, or
participate in management. Our results are similar to those reported here if we use either of the
two instruments alone. They are also robust to using a propensity score-matching estimator,
which does not require exclusion restrictions for identification but assumes selection on
observables (Villalonga, 2004).
Rows (6) through (8) in Table VIII show selected results from the estimation of the
treatment effect models: Row (6) reports the coefficient of lagged q from the first-stage probit
models; row (7) reports the coefficient of the self-selection parameter λ; and row (8) reports the
family firm dummy (treatment) coefficients from the second stage. The probit results confirm
that family ownership, control, and management are themselves a function of prior performance.
The coefficient of lagged q is positive and significant for the two types of founder-CEO firms (I
and III), as well as for family firms in general. The same coefficient is negative and significant
for Type I descendant-CEO firms. These findings are consistent with the reverse causality
arguments outlined above.
The coefficient of λ is statistically significant in all regressions, which provides evidence
of sample selection bias in the one-stage estimates of family firm effects. Nevertheless, after
controlling for this bias, the effects are even stronger. Founder-CEO firms of both types have a
negative λ coefficient, as do family firms as a whole. This negative sign implies that the
unobserved factors that encourage founders or families to remain at the firms they founded are
negatively correlated with firm value. Yet, by maintaining their holdings and/or keeping the
founder at the helm, families manage to command a premium for their firms relative to the value
the same firms would have had without the family. Descendant-CEO firms of both types, as well
as Type II family firms (those with a non-family CEO), have a positive λ coefficient. The

28
positive sign on λ suggests that the unobserved factors that prompt families to appoint
descendants or professional managers to run their firms while maintaining their ownership stake
are positively correlated with value. Yet, as a result of these decisions, the firms end up trading at
a discount relative to what they would have been worth had the families divested their stake.
Our sensitivity analyses confirm the robustness of our findings and support their
interpretation as evidence of value creation or destruction. In unreported regressions, we find that
our results are also qualitatively unchanged when we use different thresholds for the exclusion of
outliers (q greater than six, seven, or 10), when we exclude technology firms (SIC codes 35, 36,
38, and 73), and when we use Return on Assets as the dependent variable instead of Tobin’s q.
B. Alternative definitions of family firm
We began our study with the overarching question of whether family firms are more or
less valuable than non-family firms. Our findings about the range of effects that family
ownership, control, and management have on firm value suggest that the answer to this question
is going to depend on how the definition of a family firm incorporates these three elements.
Table IX shows how definition matters by comparing the average differences in q
between family and non-family firms across nine alternative definitions of a family firm. The
definitions are listed in the first column and range from the least restrictive one used earlier in
the paper (Definition 1), to a very restrictive definition (Definition 9), under which the family is
the largest vote-holder, has at least 20 percent of the votes, has family officers and family
directors, and is in the second or later generation. Only seven percent of our sample meets this
more stringent definition. Companies such as the New York Times, Estée Lauder, Marriott, Cox,
Hasbro, Timken, or Coors, fall under the latter definition of family firms, and also under most of
the other definitions, which are generally less restrictive. At the other extreme are companies
such as Tektronik during 1994–1996, where the founder’s widow was the largest individual

29
shareholder, but the largest shareholder of all was an institution that owned between three and
five times as many shares as did the widow. A company like Tektronik can only qualify as a
family firm under a broad definition such as our baseline one, but not under any other.
The coefficients reported in Table IX are those of a family firm dummy in OLS
regressions that use the same specification as our earlier multivariate analyses. The table shows
that the value effect of family firms ranges widely depending on how family firms are defined.
When we use the most restrictive definition (Definition 9), the average premium of 0.23 found
under our baseline definition turns into a significant discount of -0.28. Two other definitions also
yield significant—and larger—premiums: Definition 2 (“there is at least one family officer and
one family director”), and Definition 4 (“the family is the largest shareholder”).
We therefore find that the existence of a family firm premium in our sample is contingent
on the definition of a family firm used. This finding helps us reconcile the discrepancy in earlier
studies: Anderson and Reeb’s (2003) finding of a family premium is based on a definition of
family firms similar to our own. Holderness and Sheehan’s (1988) finding of a discount is based
on a definition of family firms as firms where families or individuals are majority shareholders.
IV. Conclusion
Although family firms play a vital role in the world economy, this sector has received
relatively little attention, partly because of the difficulty of obtaining reliable data on these firms.
We assemble a uniquely detailed panel data set on a sample of publicly traded U.S. firms that are
in the Fortune 500 in at least one year during the period 1994–2000. Using this data, we examine
the impact of family ownership, control, and management on firm value.
We find that family ownership creates value only when it is combined with certain forms
of family management and control. Family management adds value as long as the founder serves
as the CEO of the family firm, or as its Chairman with a non-family CEO. When descendants of

30
the founder serve as CEOs, firm value is destroyed. Family control in excess of ownership is
often manifested in the form of multiple share classes, pyramids, cross-holdings, or voting
agreements. These mechanisms reduce shareholder value, particularly in founder-CEO firms,
where the presence of control-enhancing mechanisms gives rise to a significant discount in
industry-adjusted q of 0.76 relative to founder-CEO firms without such mechanisms.
Despite this “control discount,” minority shareholders are likely to be better off in a
family firm than they would have been in a non-family firm. Founder-CEO firms with control-
enhancing mechanisms are about 25 percent more valuable than non-family firms (averaging the
founder-CEO dummy coefficient across estimation methods and dividing it by the average q of
non-family firms, which is 1.95). Assuming, conservatively, that the value of the private benefits
appropriated by the family averages 10 percent of the value of family holdings, or 1.6 percent of
the value of the firm’s total equity (family holdings average 16 percent), non-family shareholders
are being expropriated of 1.9 percent of the value of their holdings (1.6 over 84).11 Hence, the
benefits to non-family shareholders brought about by founders are one order of magnitude higher
than the costs of expropriation.
In descendant-CEO firms, control-enhancing mechanisms have a mildly positive impact
on value. This positive impact suggests that the mechanisms play a different role in these firms
or at least send a weaker signal to the market: If control-enhancing mechanisms are put in place
by descendants, it may be perceived as a defensive move on their part to counter the dilution of
their ownership stake that comes with firm or family growth. If it is the founder who sets up the
mechanisms, it may be seen as a more proactive move to appropriate private benefits of control.
11 Prior estimates of the average control premium on tradable supervoting shares in the U.S. range between five percent (Lease, McConnell and Mikkelson, 1983) and 10.5 percent (Zingales, 1995). Because most of the supervoting shares in our sample are non-traded, our estimate of a ten percent control premium is conservative.

31
Nevertheless, non-family shareholders in descendant-CEO firms are worse off than they would
have been in a non-family firm.
Our evidence sheds light on a longstanding question in corporate governance: Which of
the two agency problems that minority shareholders can be exposed to is more damaging to firm
value, the conflict of interest with managers or the conflict with large controlling shareholders?
We find that, in the context of family firms, the answer to this question hinges crucially on
whether the CEO is the founder or a descendant. Further research about the nature of the
founder’s role in the firm may help us understand their unique contribution to firm value.
Finally, we note that our estimates of the relative importance of family firms are likely be
conservative because the firms in our sample are among the largest in the world, are listed on an
exchange in a country with a high degree of shareholder protection, are frequent investment
targets for index funds, and are generally old and thus more difficult to maintain under family
control. Yet, for the same reasons, it is unclear how our estimates of the value effects of family
ownership, control, and management would change if evaluated on a different sample. Further
research may show how our findings about the differential effects of founders and descendants,
the incremental effects of different family firm generations, or the relative costs of the two major
agency problems, are affected by institutional differences across countries.

32
REFERENCES
Adams, Renée B., Heitor Almeida, and Daniel Ferreira, 2004, Understanding the relationship between founder-CEOs and firm performance, working paper, New York University.
Anderson, Ronald and David M. Reeb, 2003, Founding family ownership and firm performance: Evidence from the S&P 500, Journal of Finance 58, 1301–1329.
Barclay, Michael J. and Clifford G. Holderness, 1989, Private benefits from control of public corporations, Journal of Financial Economics 25, 371–395.
Bebchuk, Lucien, Reinier Kraakman and George Triantis, 2000, Stock pyramids, cross-ownership, and dual class equity, in Randall K. Morck, ed.: Concentrated Corporate Ownership, University of Chicago Press, Chicago, IL, 295–315.
Berle, Adolph, and Gardiner Means, 1932, The Modern Corporation and Private Property. Harcourt, Brace, & World, New York, NY.
Burkart, Mike, Fausto Panunzi, and Andrei Shleifer, 2003, Family firms, Journal of Finance 58, 2167–2202.
Chung, Kee H. and Stephen W. Pruitt, 1994, A simple approximation of Tobin’s q, Financial Management 23, 70–74.
Claessens, Stijn, Simeon Djankov, and Larry H.P. Lang, 2000, Separation of ownership from control of East Asian firms, Journal of Financial Economics 58, 81–112.
Claessens, Stijn, Simeon Djankov, Joseph P.H. Fan, and Larry H.P. Lang, 2002, Disentangling the incentive and entrenchment effects of large shareholdings, Journal of Finance 57, 2741–2772.
Cronqvist, Henrik, and Mattias Nilsson, 2003, Agency costs of controlling minority shareholders, Journal of Financial and Quantitative Analysis 38, 695–719.
Demsetz, Harold, 1983, The structure of ownership and the theory of the firm, Journal of Law and Economics 26, 375–390.
Demsetz, Harold, and Kenneth Lehn, 1985, The structure of corporate ownership: Causes and consequences, Journal of Political Economy 93, 1155–1177.
Demsetz, Harold, and Belén Villalonga, 2001, Ownership structure and corporate performance, Journal of Corporate Finance 7, 209–233.
Faccio, Mara, and Larry H.P. Lang, 2002, The ultimate ownership of Western European corporations, Journal of Financial Economics 65, 365–395.
Faccio, Mara, Larry H.P. Lang, and Leslie Young, 2001, Dividends and expropriation, American Economic Review 91, 54–78.

33
Fahlenbrach, Rüdiger, 2004, Founder-CEOs and stock market performance, working paper, Wharton School, University of Pennsylvania.
Fama, Eugene F., and Kenneth R. French, 1997, Industry costs of equity, Journal of Financial Economics 43, 153–193.
Gompers, Paul, Joy Ishii, and Andrew Metrick, 2003, Corporate governance and equity prices, Quarterly Journal of Economics, 107–155.
Gompers, Paul, Joy Ishii, and Andrew Metrick, 2004, Incentives vs. control: An Analysis of U.S. dual-class companies, NBER working paper 10240, National Bureau of Economic Research, Cambridge, MA.
Heckman, James J., 1979, Sample selection bias as a specification error, Econometrica 47, 153–161.
Hermalin, Benjamin E., and Michael S. Weisbach, 2003, Boards of directors as an endogenously determined institution: A survey of the economic literature, Federal Reserve Bank of New York Economic Policy Review 9, 7–26.
Himmelberg, Charles P., R. Glenn Hubbard, and Darius Palia, 1999, Understanding the determinants of managerial ownership and the link between ownership and performance, Journal of Financial Economics 53, 353–84.
Holderness, Clifford G., 2003, A survey of blockholders and corporate control, Federal Reserve Bank of New York Economic Policy Review 9, 51–63.
Holderness, Clifford G., and Dennis P. Sheehan, 1988, The role of majority shareholders in publicly held corporations, Journal of Financial Economics 20, 317–346.
Jensen, Michael C., 1986, Agency costs of free cash flow, corporate finance, and takeovers, American Economic Review 76, 2, 323–329.
Jensen, Michael C. and William Meckling, 1976, Theory of the firm: Managerial behavior, agency costs and ownership structure, Journal of Financial Economics 3, 305–360.
La Porta, Rafael, Florencio López De Silanes, and Andrei Shleifer, 1999, Corporate ownership around the world, Journal of Finance 54, 471–517.
Lease, Ronald C., John J. McConnell, and Wayne H. Mikkelson, 1983, The market value of control in publicly-traded corporations, Journal of Financial Economics 11, 439–471.
Lindenberg, Eric B. and Stephen A. Ross, 1981, Tobin’s q ratio and Industrial Organization, Journal of Business 54, 1, 1–32.
Lins, Karl V., 2003, Equity ownership and firm value in emerging markets, Journal of Financial and Quantitative Analysis 38, 159–184.

34
Morck, Randall K., David A. Stangeland, and Bernard Yeung, 2000, Inherited wealth, corporate control, and economic growth. The Canadian disease?, in Randall K. Morck, ed.: Concentrated Corporate Ownership, University of Chigaco Press, Chicago, IL, 319–369.
Nenova, Tatiana, 2003, The value of corporate voting rights and control: A cross-country analysis, Journal of Financial Economics 68, 325–351.
Palia, Darius, and S. Abraham Ravid, 2002, The role of founders in large companies: Entrenchment or valuable human capital?, working paper, Rutgers University.
Pérez-González, Francisco, 2001, Does inherited control hurt firm performance?, working paper, Columbia University.
Shleifer, Andrei, and Robert Vishny, 1986, Large shareholders and corporate control, Journal of Political Economy 94, 461–488.
Smith, Brian F., and Ben Amoako-Adu, 1999, Management succession and financial performance of family controlled firms, Journal of Corporate Finance 5, 341–368.
Villalonga, Belén, 2004, Does diversification cause the ‘diversification discount’?, Financial Management, forthcoming.
Zingales, Luigi, 1995, What determines the value of corporate votes?, Quarterly Journal of Economics, 1047–1073.

35
Table I Variable Definitions
Variable Description 1 Family firm Firm whose founder or a member of the family by either blood or marriage is an officer, a
director, or the owner of at least five percent of the firm’s equity, individually or as a group. Table IX considers alternative definitions. Source: Proxies.
2 Founder Individual responsible for the firm’s early growth and development. Founders have to beidentified as such in at least two public data sources and have no other source mention a different person as the founder. Sources: Proxies and other SEC documents, Hoover’s, corporate websites, and web searches about company histories and family relationships.
3 Firm age Number of years since the founding of the firm or the oldest of its predecessor companies. Sources: Same as for founder.
4 Family ownership stake
Ratio of the number of shares of all classes held by the family to total shares outstanding. The numerator includes all shares held by family representatives (e.g., co-trustees, and family-designated directors). It includes all shares over which any family member has shared investment or voting power with a family member (which are only counted once), but none of the shares over which the investment or voting power is shared with a non-member of the family. Source: Proxies.
5 Control-enhancing mechanisms
Voting or control structures that enable the family’s voting rights to exceed its cash flow rights. These structures include: multiple share classes, pyramids, cross-holdings, and voting agreements. Multiple share classes are voting structures where the firm has issued two or more classes of stock with differential voting rights. Pyramids are control structures where the family holds shares in the firm through one or more intermediate entities such as trusts, funds, foundations, limited partnerships, holdings or any other form of corporation of which the family owns less than 100 percent. Cross-holdings are control structures where the firm owns shares in a corporation that belongs to the family’s chain of control in the firm. Voting agreements are pacts among shareholders that result in the family’sholding voting power over a larger number of shares than what it owns with investment power. Source: Proxies.
6 Family vote-holdings in excess of shares owned
Difference between the percentage of all votes outstanding held by the family and the percentage of all shares outstanding owned by the family. The family’s holdings include all shares and votes held by family representatives (see [4]). The number of votes held by each family member/representative is the product of the number of shares with voting power of each class, times the number of votes per share of that class. Source: Proxies.
7 Governance index
Number of governance provisions in the firm’s charter, bylaws, or SEC filings that reduce shareholder rights (Gompers-Ishii-Metrick (2003) measure). Source: IRRC.
8 Non-family blockholder ownership
Ratio of the number of shares (of all classes) held by all non-family blockholders to the total shares outstanding. Blockholders are individuals or institutions listed in the proxy as beneficial owners of at least five percent of the firm. Source: Proxies.
9 Non-family outside directors
Number of non-family outside directors (i.e., directors that are not managers as well, either active or retired), divided by the total number of directors on the Board. Source: Proxies.
10 Tobin’s q Ratio of the firm’s market value to total assets. For firms with non-tradable share classes, the non-tradable shares are valued at the same price as the publicly traded shares. Sources: Compustat and Proxies.
11 Industry- adjusted q
Difference between the firm’s Tobin’s q and the asset-weighted average of the imputed q’s of its segments, where a segment’s imputed q is the industry average q. Industry averages arecomputed at the most precise SIC level for which there is a minimum of five single-segment firms in the industry-year. Sources: Compustat and Proxies.
12 ROA Ratio of operating income after depreciation to total assets. Source: Compustat. 13 Market risk
(beta) Estimate from market model in which the firm’s monthly returns over the past five years are
regressed on the S&P 500 monthly returns. Source: CRSP. 14 Idiosyncratic risk Standard error of estimate from market model in which the firm’s monthly returns over the
past five years are regressed on the S&P 500 monthly returns. Source: CRSP. 15 Diversification Equals one if the firm has two or more segments in Compustat, zero otherwise.

36
Table II Summary Statistics for Family and Non-Family Firms
t-statistics are based on clustered (by firm) standard errors from OLS regressions of each variable on a family firm dummy. Family firms are defined as those where one or more family members are officers or directors or own 5% or more of the firm’s equity either individually or as a group. The sample comprises 2,808 firm-year observations from 508 Fortune 500 firms listed in U.S. stock markets during 1994-2000. Asterisks denote statistical significance at the 1% (***), 5% (**), or 10% (*) level.
[a] All Firms
[b] Family Firms
[c] Non-Family Firms
Mean Std Dev Mean Std Dev Mean Std Dev
Diff. in Means
[b] - [c] t-stat.
Tobin’s q 2.03 1.60 2.17 1.83 1.95 1.44 0.23 1.65 * Industry-adjusted q -0.32 1.43 -0.07 1.59 -0.47 1.29 0.40 3.43 *** Assets ($ Millions) 9,510 21,816 8,080 22,855 10,352 21,141 -2,271 -1.04 Sales ($ Millions) 9,272 16,696 8,196 17,159 9,906 16,389 -1,711 -1.05 Employees 43,190 72,799 39,695 83,417 45,240 65,718 -5,545 -0.76 Firm age since founding 69.93 41.71 62.68 39.17 74.19 42.57 -11.51 -2.96 *** Generation 0.77 1.19 2.07 1.06 0.00 0.00 2.07 27.06 *** Sales growth 15.9% 61.0% 19.6% 69.5% 13.8% 55.2% 5.9% 2.02 ** ROA 11.1% 6.9% 11.6% 6.8% 10.9% 6.9% 0.7% 1.25
Family ownership 0.06 0.14 0.16 0.18 0.00 0.00 0.16 12.49 *** Control-enhancing mechanisms 0.27 0.44 0.50 0.50 0.13 0.34 0.37 9.59 *** Family excess voteholdings 0.06 0.48 0.17 0.78 0.00 0.00 0.17 3.35 *** Governance index 9.66 2.73 9.05 2.70 10.02 2.68 -0.97 -3.85 *** Non-family blockholdings 0.19 0.24 0.16 0.22 0.21 0.25 -0.05 -2.46 ** Non-family outside directors 0.74 0.20 0.66 0.19 0.79 0.19 -0.14 -8.17 *** Dividends/Book equity 0.06 0.28 0.05 0.13 0.07 0.34 -0.03 -2.14 ** Debt/Market value of equity 0.46 0.99 0.38 0.81 0.51 1.08 -0.13 -2.21 **
Market risk (beta) 1.05 0.41 1.10 0.42 1.02 0.39 0.08 2.32 ** Idiosyncratic risk 0.27 0.19 0.30 0.24 0.26 0.16 0.04 2.62 *** Diversification dummy 0.56 0.50 0.50 0.50 0.60 0.49 -0.09 -2.31 ** R&D/Sales 0.02 0.04 0.02 0.04 0.02 0.04 -0.01 -2.09 ** CAPX/PPE 0.23 0.22 0.26 0.32 0.22 0.14 0.04 2.35 **
Number of firm-years 2,808 1,041 1,767 Number of firms 508 193 336

37
Table III OLS Regressions of Tobin’s q on Family Ownership, Control, and Management
The family ownership dummy equals one when one or more family members are officers or directors or own five percent or more of the firm’s equity either individually or as a group. Family ownership stake is the percentage of shares of all classes held by the family as a group. Control-enhancing mechanisms is a dummy that equals one when there are multiple share classes, pyramids, cross-holdings, or voting agreements that create family excess voteholdings. Family excess voteholdings is the difference between the percentage of all votes outstanding held by the family and the family ownership stake. Tobin’s q is measured as the ratio of the firm’s market value to total assets. For firms with non-tradable share classes, the non-tradable shares are valued at the same price as the publicly traded shares. Observations with q greater than 10 are considered outliers and excluded from estimation. Industry-adjusted q is the difference between the firm’s q and the asset-weighted average of the imputed q’s of its segments, where a segment’s imputed q is the industry average q. Industry averages are computed at the most precise SIC level for which there is a minimum of five single-segment firms in the industry-year. The (unadjusted) q regressions include dummies for all years except 1994, and for 40 Fama-French industries. The governance index measures the number of charter provisions that reduce shareholder rights. The sample comprises 2,808 firm-year observations from 508 Fortune 500 firms listed in U.S. stock markets during 1994-2000. t-statistics from clustered (by firm) standard errors appear in parentheses. Asterisks denote statistical significance at the 1% (***), 5% (**), or 10% (*) level.
Dependent Variable: Tobin’s q Dep. Var.: Industry-Adjusted q (1) (2) (3) (4)
0.26 ** 0.25 ** Family ownership dummy (2.57) (2.27)
0.66 * 0.66 *Family ownership stake (1.88) (1.85)
-0.21 ** -0.07 Control-enhancing mechanisms dummy (-2.35) (-0.77)
-0.12 * -0.12 *Family excess voteholdings (-1.69) (-1.92)
-0.03 0.05 0.12 0.23 *Family CEO dummy (-0.20) (0.40) (0.94) (1.91)
-0.02 * -0.01 -0.04 ** -0.03 **Governance index (-1.66) (-0.99) (-2.44) (-2.10)
-0.36 ** -0.33 ** -0.34 -0.32Non-family blockholder ownership (-2.15) (-2.08) (-1.53) (-1.42)
0.09 0.09 0.13 0.09Non-family outside directors (%) (0.56) (0.55) (0.78) (0.54)
0.27 0.25 0.30 0.29Dividends/Book value of equity (1.52) (1.42) (1.58) (1.54)-0.20 *** -0.21 *** -0.22 *** -0.22 ***Debt/Market value of equity
(-3.40) (-3.52) (-3.40) (-3.50)0.15 ** 0.16 ** 0.02 0.03Market risk (beta)
(2.02) (2.05) (0.30) (0.39)-0.22 *** -0.23 *** -0.25 *** -0.25 ***Diversification dummy
(-3.02) (-3.17) (-3.08) (-3.09)7.29 *** 7.53 *** 0.61 0.64R&D/Sales
(2.97) (3.06) (0.33) (0.35)0.42 0.40 * 0.32 0.33CAPX/PPE
(1.63) (1.66) (1.34) (1.40)0.02 0.03 0.06 0.06Ln (assets)
(0.63) (0.85) (1.53) (1.63)Sales growth 0.05 0.06 0.07 0.07 (1.48) (1.53) (1.58) (1.64)Ln (age) -0.04 -0.05 -0.01 -0.01 (-1.11) (-1.31) (-0.25) (-0.29)Intercept 1.60 *** 1.43 *** -0.46 -0.49 (4.24) (3.61) (-1.18) (-1.20)R-Squared 0.38 0.38 0.10 0.10

38
Table IV Impact of Agency Problems on Firm Value
The top number in each cell is the mean Tobin’s q, the middle number is industry-adjusted q (in italics), and the bottom number is the number of firms of each type (in square brackets). Family firms are defined as those where one or more family members are officers or directors or own five percent or more of the firm’s equity either individually or as a group. The presence of Agency Problem I is measured by the absence of a family-CEO in the firm. The presence of Agency Problem II is measured by a dummy that equals one when there are control-enhancing mechanisms (such as multiple share classes, pyramids, cross-holdings, or voting agreements) that lead family voteholdings to exceed family shareholdings. Tobin’s q is measured as the ratio of the firm’s market value to total assets. For firms with non-tradable share classes, the non-tradable shares are valued at the same price as the publicly traded shares. Industry-adjusted q is the difference between the firm’s q and the asset-weighted average of the imputed q’s of its segments, where a segment’s imputed q is the industry average q. Industry averages are computed at the most precise SIC level for which there is a minimum of five single-segment firms in the industry-year. The sample comprises 2,808 firm-year observations from 508 Fortune 500 firms listed in U.S. stock markets during 1994-2000. t-statistics from clustered (by firm) standard errors appear in parentheses. Asterisks denote statistical significance at the 1% (***), 5% (**), or 10% (*) level.
Conflict of Interest Between Owners and Managers (Agency Problem I)
No Yes
Differences (t-stats)
Type I Family Firms Type II Family Firms (I) – (II) 1.93 1.94 -0.01 (-0.07) -0.16 -0.32 0.16 (1.05)
Yes
[260] [262]
Type III Family Firms Type IV (Non-Family) Firms (III) – (IV) 2.66 1.97 0.69 (2.16)** 0.30 -0.42 0.72 (2.81)***
Conflict of
Interest Between Large and Minority
Shareholders (Agency
Problem II)
No
[271] [2,015] (I) – (III) (II) – (IV) (I) – (IV)
-0.73 (-2.21)** -0.03 (-0.26) -0.05 (-0.27)
Differences (t-stats)
-0.46 (-1.71)* 0.10 (0.84) 0.26 (1.78)*

39
Table V Prevalence and Value Effect of Founders and Descendants as Chairman or CEO
This table reports on the distribution of the roles of Chief Executive Officer and Chairman of the Board in family firms between founders, descendants, and hired individuals, and on its effect on firm value. In Panel A, the top number in each cell is the mean Tobin’s q, and the bottom number is the number of firms in each group (in square brackets). Panel B reports coefficients from OLS regressions of Tobin’s q on dummy variables that equal one if the firm is a family firm with its founder, a descendant, or a hired individual as CEO (first regression, top row) or as either Chairman or CEO (second regression, bottom row). Family firms are defined as those where one or more family members are officers or directors or own 5% or more of the firm’s equity either individually or as a group. Tobin’s q is measured as the ratio of the firm’s market value to total assets. For firms with non-tradable share classes, the non-tradable shares are valued at the same price as the publicly traded shares. The sample comprises 2,808 firm-year observations from 508 Fortune 500 firms listed in U.S. stock markets during 1994-2000. t-statistics from clustered (by firm) standard errors appear in parentheses. Asterisks denote statistical significance at the 1% (***), 5% (**), or 10% (*) level.
Panel A: Mean q and Number of Family Firms with Founders, Descendants, or Hires as Chairman or CEO Founder-CEO Descendant-CEO Hire-CEO Total Founder-Chairman of the Board 3.12 1.61 2.81 3.00 [215] [10] [73] [298] Descendant-Chairman of the Board - 1.74 1.81 1.76 [0] [306] [78] [384] Hire-Chairman of the Board - - 1.94 1.94 [0] [0] [359] [359] Total 3.12 1.74 2.04 2.17 [215] [316] [510] [1,041]
Panel B: Value Effect of Family Firms’ Chairman or CEO
Founder Descendant Hire
1. CEO 1.16 *** -0.23 * 0.02 (2.80) (-1.93) (0.12)2. Chairman/CEO 1.07 *** -0.19 * -0.04 (3.10) (-1.67) (-0.35)

40
Table VI Effect of Family Firm Generation on Firm Value
This table reports coefficients from OLS regressions of Tobin’s q on dummy variables that equal one when the firm is a family firm in the generation indicated in each column heading. The first generation is the founder’s. Family firms are defined as those where one or more family members are officers or directors or own five percent or more of the firm’s equity either individually or as a group. Tobin’s q is measured as the ratio of the firm’s market value to total assets. For firms with non-tradable share classes, the non-tradable shares are valued at the same price as the publicly traded shares. The sample comprises 2,808 firm-year observations from 508 Fortune 500 firms listed in U.S. stock markets during 1994-2000. t-statistics from clustered (by firm) standard errors appear in parentheses. Asterisks denote statistical significance at the 1% (***), 5% (**), or 10% (*) level.
First Second Third Fourth/ Later
Panel A. Latest Generation of Family Officers, Directors, or Blockholders Effect relative to non-family firms 0.86 *** -0.18 0.00 0.00 (2.78) (-1.43) (0.02) (0.00) Incremental effect -1.04 *** 0.18 0.00 (-3.27) (1.16) (-0.01)
Panel B. Generation of Family CEO Effect relative to non-family firms 1.16 *** -0.38 *** 0.02 0.12 (2.80) (-3.21) (0.10) (0.34) Incremental effect -0.46 *** 0.40 * 0.10 (-3.13) (1.90) (0.26)
Panel C. Generation of Family Chairman or CEO Effect relative to non-family firms 1.07 *** -0.30 ** -0.04 0.00 (3.10) (-2.38) (-0.23) (-0.01) Incremental effect -0.26 * 0.26 0.04 (-1.93) (1.41) (0.12)
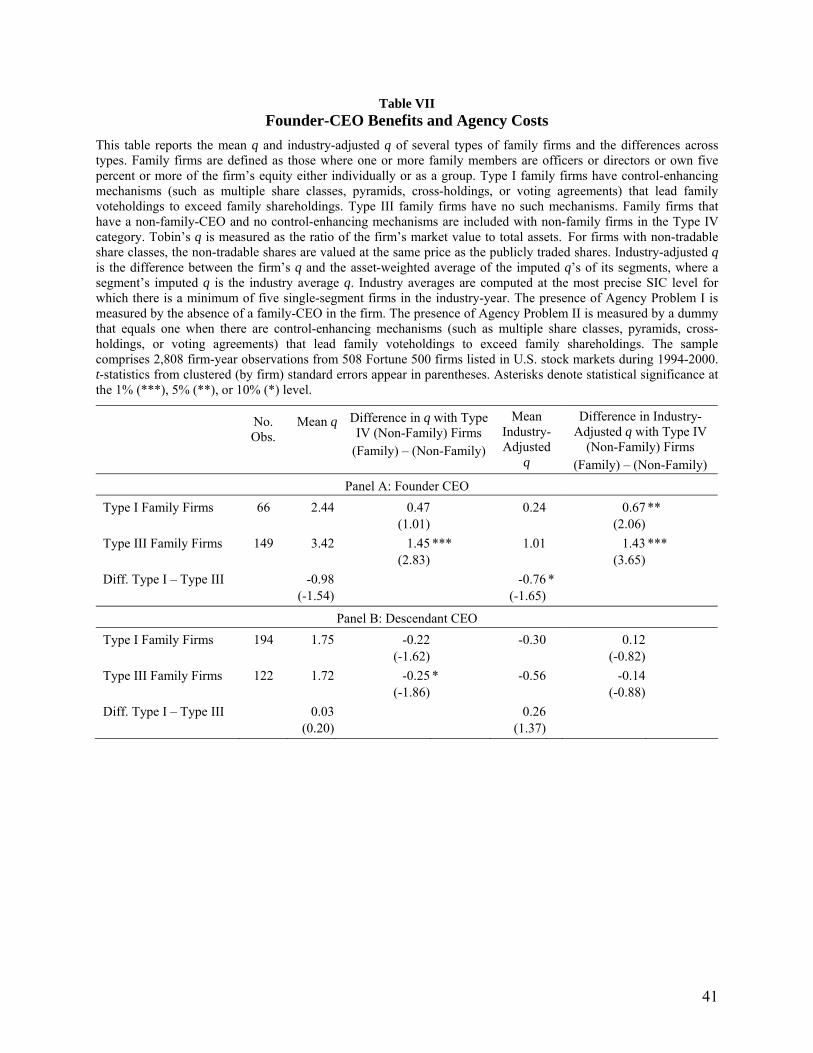
41
Table VII Founder-CEO Benefits and Agency Costs
This table reports the mean q and industry-adjusted q of several types of family firms and the differences across types. Family firms are defined as those where one or more family members are officers or directors or own five percent or more of the firm’s equity either individually or as a group. Type I family firms have control-enhancing mechanisms (such as multiple share classes, pyramids, cross-holdings, or voting agreements) that lead family voteholdings to exceed family shareholdings. Type III family firms have no such mechanisms. Family firms that have a non-family-CEO and no control-enhancing mechanisms are included with non-family firms in the Type IV category. Tobin’s q is measured as the ratio of the firm’s market value to total assets. For firms with non-tradable share classes, the non-tradable shares are valued at the same price as the publicly traded shares. Industry-adjusted q is the difference between the firm’s q and the asset-weighted average of the imputed q’s of its segments, where a segment’s imputed q is the industry average q. Industry averages are computed at the most precise SIC level for which there is a minimum of five single-segment firms in the industry-year. The presence of Agency Problem I is measured by the absence of a family-CEO in the firm. The presence of Agency Problem II is measured by a dummy that equals one when there are control-enhancing mechanisms (such as multiple share classes, pyramids, cross-holdings, or voting agreements) that lead family voteholdings to exceed family shareholdings. The sample comprises 2,808 firm-year observations from 508 Fortune 500 firms listed in U.S. stock markets during 1994-2000. t-statistics from clustered (by firm) standard errors appear in parentheses. Asterisks denote statistical significance at the 1% (***), 5% (**), or 10% (*) level.
No. Obs.
Mean q Difference in q with Type IV (Non-Family) Firms
(Family) – (Non-Family)
Mean Industry-Adjusted
q
Difference in Industry-Adjusted q with Type IV
(Non-Family) Firms (Family) – (Non-Family)
Panel A: Founder CEO Type I Family Firms 66 2.44 0.47 0.24 0.67 ** (1.01) (2.06) Type III Family Firms 149 3.42 1.45 *** 1.01 1.43 *** (2.83) (3.65) Diff. Type I – Type III -0.98 -0.76 * (-1.54) (-1.65)
Panel B: Descendant CEO Type I Family Firms 194 1.75 -0.22 -0.30 0.12 (-1.62) (-0.82) Type III Family Firms 122 1.72 -0.25 * -0.56 -0.14 (-1.86) (-0.88) Diff. Type I – Type III 0.03 0.26 (0.20) (1.37)

42
Table VIII Sensitivity Analyses
This table reports dummy variable coefficients from different regressions of Tobin’s q on those dummies and on several control variables. The dummies equal one when the firm is a family firm in the category indicated in each column heading and zero when it is a non-family firm. Family firms are defined as those where one or more family members are officers or directors or own five percent or more of the firm’s equity either individually or as a group. Type I family firms have a family-CEO (founder or descendant) and control-enhancing mechanisms such as multiple share classes, pyramids, cross-holdings, and voting agreements. Type II family firms have control-enhancing mechanisms but no family-CEO. Type III family firms have a family-CEO but no control-enhancing mechanisms. Family firms that have a non-family-CEO and no control-enhancing mechanisms are included with non-family firms in the Type IV category. The dependent variable in all regressions is Tobin’s q, except in the industry-adjusted q model. Tobin’s q is measured as the ratio of the firm’s market value to total assets. For firms with non-tradable share classes, the non-tradable shares are valued at the same price as the publicly traded shares. Industry-adjusted q is the difference between the firm’s q and the asset-weighted average of the imputed q’s of its segments, where a segment’s imputed q is the industry average q. Industry averages are computed at the most precise SIC level for which there is a minimum of five single-segment firms in the industry-year. All regressions include the following control variables: Governance index (number of charter provisions that reduce shareholder rights), non-family blockholder ownership, proportion of non-family outside directors, market risk (beta), diversification, R&D/Sales, CAPX/PPE, dividends/book value of equity, debt/market value of equity, log of assets, log of age, and sales growth. All regressions except for the industry-adjusted q and the fixed-effects models also include year and Fama-French industry dummies. The treatment effects regressions are estimated, using Heckman’s two-step procedure, as five separate regressions on subsamples that include only the family firms in the category indicated in each column heading, and the 2,015 Type IV (non-family) firms. The first-stage probit model includes all variables listed above as well as idiosyncratic risk and lagged q, and excludes the industry dummies that completely determine family ownership for its category. The second-stage equation excludes idiosyncratic risk and lagged q. The full sample comprises 2,808 firm-year observations from 508 Fortune 500 firms listed in U.S. stock markets during 1994-2000. t-statistics from clustered (by firm) standard errors appear in parentheses. Asterisks denote statistical significance at the 1% (***), 5% (**), or 10% (*) level.
Type I Family Firms Type III Family Firms All Family Firms Founder CEO
Descendant CEO
Type II Family Firms Founder CEO
Descendant CEO
1. OLS Univariate 0.26 ** 0.47 -0.22 -0.03 1.45 *** -0.25 * (2.57) (1.01) (-1.62) (-0.26) (2.83) (-1.86) 2. OLS Multivariate 0.26 ** 0.37 -0.26 * -0.05 1.09 *** -0.31 *** (2.57) (1.04) (-1.74) (-0.39) (2.73) (-1.43)
0.25 ** 0.51 * 0.11 0.08 1.15 *** -0.13 3. OLS Industry-adjusted q (2.27) (1.70) (0.69) (0.69) (3.18) (-0.68)
4. Fixed Effects 0.11 0.34 -0.07 0.09 0.56 *** 0.07 (0.60) (1.24) (-0.43) (0.65) (2.63) (0.41) 5. Random Effects 0.22 ** 0.48 ** -0.15 0.01 0.86 *** -0.07 (2.04) (2.34) (-1.17) (0.14) (5.62) (-0.49)
0.09 ** 0.14 * -0.21 ** -0.02 0.11 *** 0.02 6. Lagged q coefficient in Probit Model (2.56) (1.85) (-2.29) (-0.44) (2.86) (0.24)
-1.10 *** -0.49 ** 1.65 *** 0.67 *** -1.93 *** 0.84 ***7. Selection Parameter (λ) from Heckman model (-8.42) (-1.99) (9.01) (3.07) (-9.59) (4.33)
1.99 *** 1.05 ** -3.09 *** -1.21 *** 3.91 *** -1.76 ***8. Treatment Effects (Heckman) (9.06) (2.37) (-9.18) (-3.13) (11.14) (-4.96)
Number of family firms 1,041 66 194 262 149 122

43
Table IX Effect of Family Firm Definition on the Relative Prevalence and Value of Family Firms
This table reports, for different definitions of a family firm, the coefficient of a family firm dummy variable in multivariate OLS regressions of Tobin’s q on that dummy and on several control variables. The family refers to the founder or a member of his/her family by either blood or marriage. Blockholders are owners of five percent or more of the firm’s equity, either individually or as a group. Tobin’s q is measured as the ratio of the firm’s market value to total assets. For firms with non-tradable share classes, the non-tradable shares are valued at the same price as the publicly traded shares. The control variables are: Governance index (number of charter provisions that reduce shareholder rights), non-family blockholder ownership, proportion of non-family outside directors, market risk (beta), diversification, R&D/Sales, CAPX/PPE, dividends/book value of equity, debt/market value of equity, log of assets, log of age, sales growth, and year and Fama-French industry dummies. The sample comprises 2,808 firm-year observations from 508 Fortune 500 firms listed in U.S. stock markets during 1994-2000. t-statistics from clustered (by firm) standard errors appear in parentheses. Asterisks denote statistical significance at the 1% (***), 5% (**), or 10% (*) level.
Definition
Proportion of Family Firms in
the Sample
OLS regression coefficients
37% 0.23 * 1. One or more family members are officers, directors, or blockholders (1.82)
2. There is at least one family officer and one family director 26% 0.29 * (1.97) 3. The family is the largest voteholder 20% 0.29 (1.63) 4. The family is the largest shareholder 19% 0.32 * (1.82)
19% -0.13 5. One or more family members from the 2nd or later generation are officers, directors, or blockholders (-1.24)
14% 0.33 6. The family is the largest voteholder and has at least one family officer and one family director (1.58)
7. The family is the largest shareholder and has at least 20% of the votes 12% 0.15 (0.79)
8% 0.06 8. One or more family members are directors or blockholders, but there are no family officers (0.53)
7% -0.28 ** 9. The family is the largest voteholder, has at least 20% of the votes, one family officer and one family director, and is in 2nd or later generation (-1.99)