how do currency fluctuations affect exports of china, japan, … · 2006-06-10 · according to the...
TRANSCRIPT

How Do Currency Fluctuations Affect Exports of
China, Japan, and South Korea?a
Muqun Li, Wei Liu, and Shunfeng Songb
This version: June 2006
Abstract
This paper examines trades and trade relationships among China, Japan, and South Korea. It shows that China possesses a large comparative advantage in labor-intensive products, while Japan and Korea maintain large comparative advantages in capital-intensive products. Using quarterly data for the three countries from 1981 to 2002, the paper evaluates the effect caused by depreciation of Yen on the exports of China and South Korea. Our empirical results prove a positive impact of depreciation of Yen on China’s export but a negative impact on Korea’s export. This finding suggests that Japan is competing with South Korea in terms of exports, but not with China. The perceived threat of China may not exist, although it could be a catalyst for promoting economic development and international competitiveness of the three countries.
a Paper prepared for “WTO, China, and the Asian Economies” Beijing, China June 24-25, 2006 b Muqun Li is currently a Ph.D student at Agricultural & Applied Economics Department, University of Wisconsin, Madison, WI 53706-1513. Wei Liu is a former graduate student at Department of Economics of University of Nevada, Reno. Shunfeng Song is a professor at Department of Economics, University of Nevada, Reno, NV 89557-0207, USA. For information, please contact [email protected].

1
1. Introduction
Over a long period of time, international trade has been regarded as major factor of
economic development. Many researchers stated that international trade is an important
“engine” that drives economic growth of nations and international competitiveness is the
“fuel” that empowers that engine (e.g., Ezeala-Harrison, 1999).
The classical theory of international trade and its role in economic development are
based on the principle of comparative advantage. The comparative advantage paradigm
states that a country performs better when concentrating on the productions of those goods
and services for which it possesses a comparative advantage over others and then trading
these goods with other countries. By doing so, each country can produce its products more
cheaply than others so that through trade all countries would benefit by obtaining goods more
cheaply than they would have if they produce all goods themselves. Classical and
neoclassical economics have concluded that trade is a vent for surplus, for it is trade that
enables a country to overcome the limits set by the extent of the market against specialization
and the division of labor.
In this tradition, classical and neoclassical economics vigorously support free and
unrestricted trade among nations by asserting that trade opens up opportunities for people in
all countries to improve their welfare. Through such free trade and exchange, over time
international income redistributions take place as free product and factor mobility equalize
prices and incomes across countries. This implies a more equitable distribution of the
benefits of international progress and, therefore, a more even spread of economic
development across the world. International trade is also advocated as a powerful engine of
economic growth for countries. For example, international trade expands market demand
across country borders and thus removes constraints that may limit a country’s ability to

2
increase its production scale. In turn, this would enable a country to expand its output and
create job opportunities within its borders, thus stimulating its economy.
There are two aspects to a country’s international trade: exports and imports.
Mainstream development economists recognize the superiority of a trade strategy of export
promotion (EP) over that of import substitution industrialization (ISI). Previous empirical
studies (Feder, 1982; Krueger, 1978; Lal and Rajapatirana, 1987) have illustrated that in
contrast to the dismal performance of those countries that overdid the ISI strategy, developing
countries that adopted an export-promoting strategy realized higher rates of increase in per
capita income. They also have demonstrated superior performance in terms of increases in
saving ratios, investment ratios, total factor productivity, employment, and real wages, as
well as a declining incremental capital-output ratio, a more equitable distribution of income,
and better adjustment to external shocks.
Why has export promotion had such a strong favorable impact on development? As
for the effect on the balance of payments, one might think that there is little difference
between earning a unit of foreign exchange through exports and saving a unit of foreign
exchange through imports substitution. But the domestic resource cost of earning foreign
exchange had been shown to be less than the domestic resource cost of saving foreign
exchange at the margin (Meier, 1989). Moreover, export-promoting countries have become
more creditworthy and their foreign exchange constraint have been relaxed (Krueger and
Jones, 1990). Especially significant is the fact that an export-oriented industrialization
strategy has resulted in not simply a once for all improvement in resource allocation
according to the country’s comparative advantage in international trade, but more importantly
in the realization of dynamic benefits. While a reallocation of resource in conformity with
comparative advantage can raise the income level, the dynamic gains have been most
important in increasing the rate of growth in productivity (Melitz, 2003).

3
Export also increases capacity utilization of plant and realization of economies of
scale (Amsden, 1985). It creates employment through export of labor-intensive products and
generates a multiplier effect that gives rise to an increased demand for intermediate inputs
and consumer consumption, and an increase in total factor productivity. Nishimizu and
Robinson (1984) showed that export expansion, unlike import substitution, is positively
correlated to changes in total factor productivity. Feder (1982) showed that marginal factor
productivities in export-oriented industries are significantly higher than in the non-export-
oriented industries.
Over the past two decades, especially since the normalization of the diplomatic
relations between China and Korea in 1992, trades among China, Japan, and Korea have been
active and significant. Table 1 presents the values of exports and imports among the three
countries. It shows that from 1992 to 2003, China’s export to Japan increased from $11.68
billion to $59.42 billion and its import from Japan increased from $13.68 billion to $74.15
billion. Japan is China’s largest trading partner (Ministry of Commerce of the PRC, 2004).
During the same period, Korea’s export to China increased from $2.65 billion to $35.11
billion and its import from China increased from $3.72 billion to $21.91 billion. In 2003,
China became the largest export destination for Korea, and Korea’s trade surplus with China
amounted to $13.2 billion, representing about 80 percent of its total trade surplus (Nam,
2004). Still, Japan remains the largest source of Korea’s imports. In 2003, import from
Japan accounted for around 20 percent of Korea’s total imports, followed by the USA (14%)
and China (12.3%) (Nam, 2004).
Amid the fascination with expanding trade among the three countries, however, there
are concerns in both Japan and Korea about the so-called China threat. For instance, some
Koreans fear that China is creating a “black hole” by sucking in Korea’s outward direct
investment. This fear of hollowing-out has been amplified by the move of large

4
conglomerates that have shifted their production bases to China and have set up R&D centers
in China (Nam, 2004). In Japan, there is also a prevalent of “China threat,” probably because
of China’s great successes in its market-oriented reforms and opening-up.
It is interesting to observe that in recent years many scholars and government
organizations in the three countries are promoting a stronger economic cooperation by
forming a CJKFTA (China-Japan-Korea free trade area) (e.g., Choeng, 2002; Lee, 1999; Luo,
1999). For example, Liu (2004) examines various issues related to CJKFTA, including the
principles, organization structures, goals, and timetable. Ryou and Wang (2004) discuss the
possibility of financial cooperation in East Asia by investigating the Chiang Mai Initiative
and the Manila framework. They argue that China and Japan should provide leadership in
forging a common political will for integration in East Asia. Using a multi-country CGE
model, Ianchovichina and Walmsley (2005) find that China’s accession to WTO increases the
exports of Japan and the NIEs (Hong Kong, South Korea, Singapore and Taiwan), thanks to
China’s increasing demand in high quality textile and electronic inputs from those exporters,
while negatively affects Indonesia, Malaysia, Philippines, Thailand, and Vietnam’s exports,
because these countries are competitors on textile and garment industries.
This paper examines trade relationships among China, Japan, and South Korea. It also
investigates the effects of currency fluctuations on their exports of these countries. A better
understanding of the trade structures and relationships will help to promote regional
cooperation among the three countries.
2. Trade Patterns of Japan, China, and South Korea
First of all, we examine trade patterns of Japan, China, and South Korea and their trade
relationships by focusing on their exports to the United States. The United States was chosen
as the importing country because it is not only the biggest economy in the world but also a

5
major trade partner of China, Japan, and South Korea. Moreover, the import structure of the
United States illustrates that Japan is competing with South Korea but not with China.
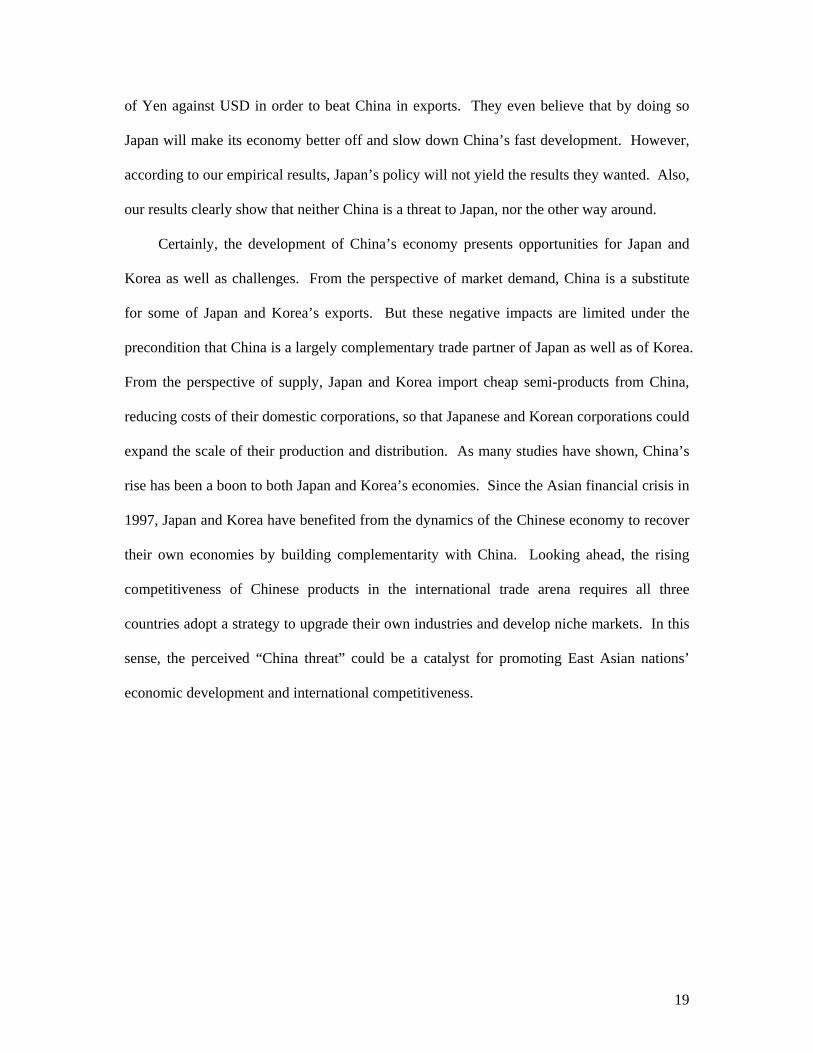
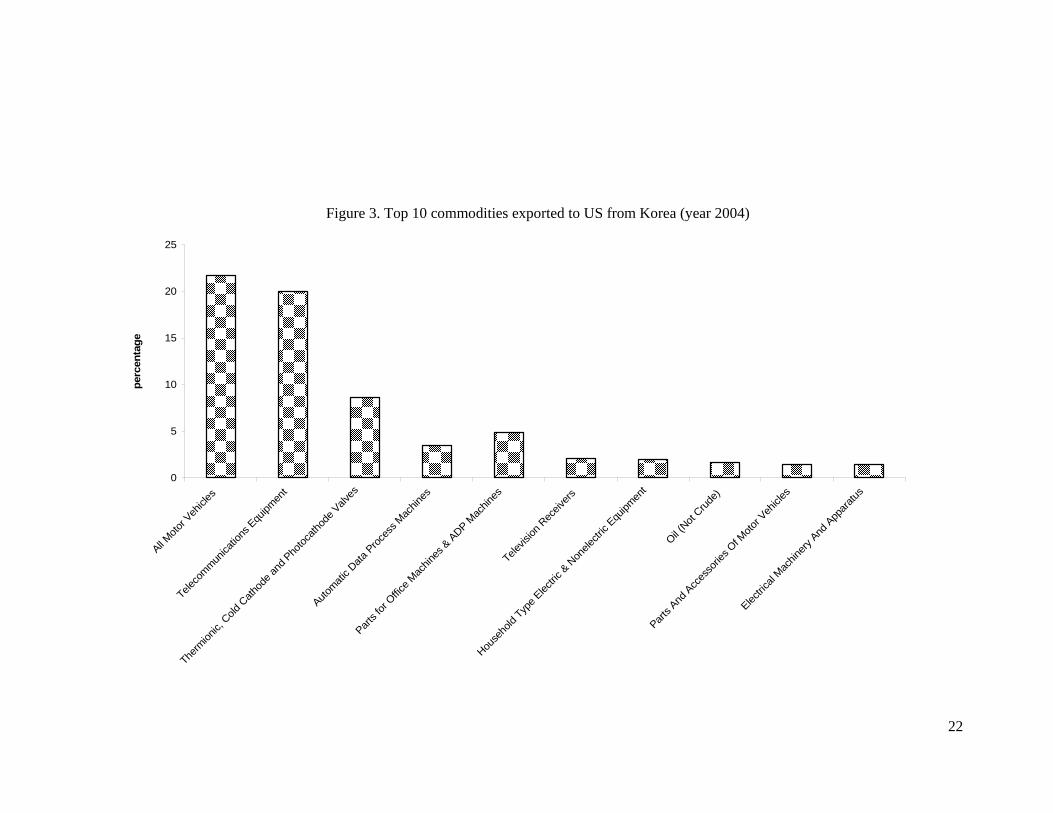
Figures 1-3 present the top 10 commodities exported to the United States in 2004 from China,
Japan and South Korea. Figure 4 shows the top five categories of exports to the United States
from these three countries between 1997 and 2004.
From the perspective of commodities exported in 2004, for China, automatic data
processing machines accounted for 18.9 percent of total exports to the United States, the
biggest portion of all commodities. The second largest composition of China’s exports to the
United States was toys and sporting goods (13.6%). Other major exports include footwear
(8.8%), furniture & bedding accessories (8.4%), telecommunications equipments (9.3%),
parts for office machines & ADP machines (7.1%), sound recorders and TV recorders (5.9%),
household type electric & non-electric equipments (3.5%), articles of plastics (3.3%) and
Trunks, Suitcases, Vanity Cases, and Briefcases (3.1%). For Japan and South Korea,
however, motor vehicles are the most exported commodities to the United States, which took
up 25 and 21.7 percent of their total exports, respectively. Also, South Korea’s third largest
export commodity - thermionic, cold cathode and photo cathode valves (8.7%) - is Japan’s
fifth largest export commodity (2.6%). Parts and accessories of motor vehicles, which China
seldom exports, is Japan’s second largest export commodity (6.9%) and South Korea’s
fourteenth largest exported commodity (1.4%). It is notable that Japan and South Korea
share significant similarities in export structure trading with the Unites States, while China is
different from these two countries.
Figure 4 shows trends in export structures in 1997-2004. For both Japan and South
Korea, motor vehicles are increasing as the most exported commodity. For China, footwear
and toys and sporting goods remained in the top three most exported commodity during the
same period (exports of automatic data process machines became number one exported

6
commodity in 2004). Also notice that, during 1997-2004, China exported mainly labor-
intensive products, such as toys, furniture and clothes to the United States, while Japan and
South Korea exported technology-intensive products, like motor vehicles, thermionic, cold
cathode and photo cathode valves.
Moreover, enlarging the prospective of trading partner from the United States to the
world, we calculate the revealed comparative advantage (RCA) of China, Japan and Korea to
examine the degree of competitiveness of each good from these three countries on the world
market. Country i ’s RCA on commodity m is defined as,
,
,,
,
/m t
m t
iim ti i
m t i im t
m i m
xxRCA
x x
⎛ ⎞ ⎛ ⎞⎜ ⎟ ⎜ ⎟= ⎜ ⎟ ⎜ ⎟⎜ ⎟ ⎜ ⎟⎝ ⎠ ⎝ ⎠
∑∑ ∑∑
Where, ,im tx is country i ’s total export of commodity m . So the numerator is country i ’s
commodity m ’s export share of this country’s total export. While denominator is world’s
commodity m ’s export share of world total export. The higher the RCA of a product, the
more advantage a country has on exporting this particular good. In general, China has
comparative advantage on low digit commodities such as textile and garment industry, food,
and other agricultural products, while Japan excels at producing high-tech commodities, like
telecommunication, photographic, optical goods, road vehicles, iron and steel, office
machines, and electric machinery, etc. Korean industries, which are comparably competitive
on the world market, are much closer to their Japanese counterparts, and more so over time.
Therefore, we conclude that Japan and South Korea are competing with each other in
exports to the Unites States as well as to the world, while China is a complementary exporter
to both of them.
Regarding China and Japan, there is a prevalent of “China threat” in Japan, probably
because of China's great successes in its market-oriented reforms and opening-up. In the
international trade arena, China’s annual export increased from $9.75 billion in 1978 to

7
$325.6 billion in 2002, and its annual imports increased from $10.89 billion to $295.2 billion,
respectively (NBS, 2003, p. 654). The total international trade raised almost 30 folds in the
past 25 years. In addition, China has run trade surplus every year since 1994. In 1997 and
1998, trade surplus reached the highest level of more than $40 billon. In 2002, China still
had an annul trade surplus of $30.4 billion (NSB, 2003, p. 654).
There should be no disagreement that Japan has a larger scale of export and a more
advanced export structure than China. But, with the development of China’s industrial
economy, difference of trade patterns between China and Japan is diminishing overtime,
shown in Figure 5. This phenomenon might lead to the argument that China is becoming
stronger, even to extent to be able to compete with Japan.
When it comes to considering whether or not China is competing with Japan, two
points must be taken into account. First, Japan is exporting high-class products
(comparatively higher quality and more expensive), while China’s exports belong to much
lower class. Take television as an example, the price difference between an ordinary
television made in China and a high definition television made in Japan can be as much as
one digit. Second, China relies more on semi-manufactured goods and accessories compared
to Japan. Government statistical data show that China’s exports contain more than 50 percent
imported components, and this ratio is higher for high-tech products. In other words, China’s
competitiveness is limited in those industries that require less technology.
It may even be reasonable to say that China and Japan are more compensative to each
other than to any other countries. Japan is the largest trade target country of China and China
is the second largest trade target country of Japan. The total trade amount between these two
countries exceeded $100 billions in 2002. Total exports of Japan to China were more than
$0.5 billion. It is also noticeable that Japan has maintained a trade surplus towards China all
these years.

8
In fact, it is interesting to speculate how depreciation of Yen would affect China’s
economy. On one hand, depreciation of Yen may enhance Japanese products’
competitiveness. Therefore, depreciation of Yen may adversely impact China’s export. But
this negative impact could be very limited because China’s export is labor-intensive but
Japan’s export is technology-intensive. These two countries are barely competing with each
other in the international market. Consequently, even though depreciation of Yen enhances
Japan’s price competitiveness in the international market, the extension of Japan scrambling
China’s export demand is still very limited.
On the other hand, depreciation of Yen may also have positive impact on China’s
economy. Depreciation of Yen causes prices of imported productions to decrease and eases
the burden of China’s foreign loan repayments. In the first instance, depreciation of Yen will
lower the prices of enginery products and semi-finished products that China needs from
Japan, which will help China to reduce its production costs. In 2000, for example, China’s
imports from Japan were fairly concentrated. Semiconductors and other electronic
components accounted for 7.9 percent of the total imports, steel 7.0 percent, organic
compound 5.6 percent, and plastic 4.7 percent (International Trade Statistics Yearbook
compiled by the United Nations). Take China’s high-tech intermediate goods import as an
example, goods imported from Japan and Korea account for over 20 and 13 percent,
respectively in 2004, and this share was much higher for Japan in earlier years, shown in
Figure 6. Among China’s total exports of high tech intermediate goods, the percentages of
China’s direct or indirect inputs imported from Japan are 54.98, 80.19 and 87.54 percent in
1980’s, 1990’s and after 2000 period, respectively.1
In the second instance, with depreciation of Yen, China’s debts, mostly government
loans calculated in Yen, will be reduced when transferred into US dollars from Japanese Yen,
easing the burden of repaying foreign principal and interest.

9
Furthermore, intuitively, even if depreciation of Yen to RMB doesn’t reduce the
demand of China’s import from other countries, prices of exports from China into Japan will
go up, which should negatively affect China’s export to Japan. But after examining export
structure of China to Japan (Figure 7), we found that commodities exported from China
concentrate on natural resource and low-end manufactured goods especially in early periods,
and it is well known that these goods have low income elasticity. As a result, it is expected
that depreciation of Yen will not deteriorate China’s export to Japan too much. Combining
both the negative and positive impacts, depreciation of Yen probably will not work against
China’s export.
The trade relationship between South Korea and Japan, however, seems quite
different from that between China and Japan. As Figures 2 and 3 shows, for both Japan and
South Korea in 2001, motor vehicles are the most exported commodities to the United States,
accounting for 25 percent and 18 percent of their total exports, respectively. Among their top
10 exported commodity categories, six are the same: motor vehicles, automatic data process
machines, thermionic-cold cathode-photocathode valves, parts for office machine and ADP
machines, sound records and TV recorders, and telecommunication equipments. Hence,
export structures of Japan and South Korea are largely similar, making them trade
competitors.
There is an interesting phenomenon that illustrates the competitive relationship
between Japan and South Korea. South Korea exports very few automobiles to Japan, and
vice verse. In consequence, few Korean cars run on streets in Japan, and vice verse.
However, both Japan and South Korea export their automobiles to other Asian countries and
the rest of the world.
Because South Korea is competing with Japan in the international market, South
Korea’s exports change with the fluctuation of Yen. For instance, export of South Korea
10
automobiles tends to climax when Yen appreciates. The other way round, when Yen
depreciates, export of South Korean automobiles tends to stagnate. More generally, we
conclude that the exports of South Korea are better off when Yen appreciates and worse off
when Yen depreciates.
3. Estimation and Results
Based on the above discussion, we expect that depreciation of Yen has no negative
impact on China’s export performance while depreciation of Yen negatively affects the
export of Korea.
To test our hypotheses, we build a relationship between net export and exchange rate
by employing the concept of export intensity (EI), which is defined as a ratio of the volume of
net exports to the total volume of goods and services transacted within the economy (GDP)
during a given time period:
h
h
XEIY
= (1)
where hX is the net exports and hY is GDP of the home country.
Previous studies have illustrated EI as a function of growth rate of real exchange rate
of domestic currency to foreign currency and GDP ratio between two nations (domestic GDP
divided by foreign GDP):
, f
h
YEI f E
Y⎛ ⎞
= ⎜ ⎟⎝ ⎠
(2)
Where hY , and fY are home country and foreign country’s GDP, respectively.
Previous studies, however, have also shown a lag and J-curve effect of changes of
exchange rate on international trade. According to the J-curve theory, it is observed that a
country’s current account worsens immediately after real currency depreciation and begins to
improve only some months later (e.g., Krugman and Obstfeld, 2000).

11
In the models we specify below, to study how depreciation of Yen relative to RMB
and WON affects China’s and South Korea’s exports, respectively we take lag value of
exchange rate change to take into account of the J-curve effect. Moreover lagging exchange
rate may give us the advantage of dealing with potential endogenous problem2.
Specifically, we have the following regression model:
4ˆ jtiit iti i jt i it
it it jt
YX PeY Y P
α β γ ε−= + + + for ,i cn sk= ; j jp=
Where itX is country i’s exports to the rest of the world at year t. 1ˆijte − is change rate of real
exchange rate of country i against Japanese Yen. itY , and jtY are country i and Japan’s nominal GDP at year t. itP and jtP are price index of country i and Japan, respectively. So
jt it
it jt
Y PY P
is supposed to pick up the effect of relative country size. itε is white noise.
If our above arguments are valid, China and Japan are complementary trade partners,
and the positive change rate of RMB relative to Yen, i.e. RMB depreciates against Yen,
should have negative effect on China’s export. We expect that increasing Japan’s real GDP
will attract more China’s exports to Japan. Due to their competitive relationship, for South
Korea’s export regression, the expected signs of β , which is the coefficient of Won relative
to Yen, should be positive. We expect the growth rate of Won relative to RMB to be
negative, for the same reason as for China-Japan in terms of the relationship between GDP
and export.
Data sets used in this research come from the following resources. First, all of the
data sets are from 1981 to 2002. We bought quarterly exports and imports data (1981 to 2002)
from the Department Customs of People’s Republic of China. Quarterly data of China’s CPI
was obtained from the website of Census Bureau of China (www.stats.gov.cn). Quarterly CPI
data sets of Japan, South Korea and the United States were downloaded from Noruiel
Roubini’s Global Macroeconomic and Financial Policy website (Stern School of Business,
12
New York University, www.stern.nyu.edu/globalmacro). All of the quarterly exchange rates
were found in the government website of Federal Reserve System (www.federalreserve.gov).
From United Nations Conference on Trade and Development (http://www.unctad.org), we
also obtained quarterly Japan’s and South Korea’s exports and imports data as well as the
United State’s imports data from China, Japan and South Korea.
The export intensity variables use the quarterly data from the 3rd quarter of 1982 to the
4th quarter of 2001 (derived by dividing the quarterly total exports of China and South Korea
by quarterly real GDP of China and South Korea, respectively). The growth rates of the real
exchange rate were also calculated from the 3rd quarter of 1982 to the 4th quarter of 2001.
The growth rate of the real exchange rate variables is lagged for four quarters. The GDP ratio
variables are derived by dividing the quarterly real GDP of Japan, respectively by the
quarterly real GDP of China and South Korea (all of the real GDP are in 1995 prices).
Results from ordinary least squared regression are consistent with our predication,
appreciation of Yen relative to RMB (increase in our measure) didn’t have statistically
significant positive effect on China’s export performance. But we should keep in mind that
all of the exports variables are quarterly data starting from the 1st quarter of 1985 and
continuing through the 4th quarter of 2001. Serial correlation is the most common potential
problem in a time series model. From the Durbin-Watson (DW) statistics of the two OLS
regressions, we find that both of them have the problem of serial correlation. In detail, the
DW-statistics of regressions, which are 0.9448 and 0.3763, respectively, indicate that there is
a positive serial correlation. This implies that the coefficients estimated by OLS regressions
are biased. In this case, we use the CORC method to rerun regressions in order to correct
serial correlations.3 The results of CORC regressions satisfy our purposes. All of the DW-
statistics of CORC regressions indicate that there are no serial correlations.

13
Table 2 presents results of OLS and CORC. Obviously, positive signs of coefficients of
GDP ratios illuminate that increases in the GDP of Japan has a positive impact on export
intensity in both China and South Korea. In other words, China and South Korea exports will
increase if real GDP increases in Japan, holding all other indicators constant. Based on the
regressions, the lag of growth rate of real exchange rate of RMB against Yen has a negative
impact on export intensity of China, while lag of growth rate of real exchange rate of Won
against Yen has a positive impact on South Korea’s export intensity. This is to say, holding
China’s and South Korea’s GDP constant, a depreciation of Yen leads to an increase of
China’s total exports and decrease of South Korea’s total exports. This finding affirms our
original hypotheses. In turns, it shows that China and Japan are complementary trade
partners while South Korea and Japan are competitors.
After examining one country’s total exports to the whole world, let’s focus on China,
South Korea and Japan’s exports to the Unites States, because the United States is a major
trade partner of China, South Korea, and Japan. Practically all the values of exports depend
on many variables. Among those variables, real GDP of the importing country and exchange
rate of currencies of exporting countries against importing country are our main concerns.
Based on previous discussion and hypotheses, China and Japan are considered
complementary or non-competing trade partners. We expect that depreciation of Yen against
US dollar will not negatively affect exports of China to the United States. Since South Korea
is a substitute trade partner of Japan, we expect that depreciation of Yen against the US dollar
will deteriorate South Korea’s exports to the United States. Also, depreciation of Yen against
USD will raise Japan’s trade competitiveness, thus increasing its exports to the United States.
To show how the exchange rate of the US dollar to other currencies and how the US
economy affects exports to the United States from China, Japan and South Korea, we specify
the following models:
14
( ), ,us us usit us it jtX f Y e e= for , , ,i j cn jp sk=
where usitX and usY are country i’s real export to the United State at year t and real GDP of the
United States, which we use to capture the income of the United State, after adjusting for US
CPI. usite is country i’s real exchange rate relative to USD.
In order to achieve stationarity in our data, we take logarithm to reduce the probability
of correlations.4 Therefore, our model can be formulated into:
,ln ln lnus usit i j jt i us t it
jX e Yα β γ ε= + + +∑ for , , ,i j cn jp sk=
Theoretically, when a country’s economy is doing well, it will import more from other
countries to improve the living standard of its people. As a result, an increase in US GDP
will cause an increase of exports to the Unites States from all three countries. This means
that the expected signs of all three iγ are positive. Depreciation of the domestic country’s
currency and complementary trade partner countries will not negatively impact domestic
exports. On the contrary, depreciation of currencies of substitutive trade partners will help
boost exports of substitutive trade partners so that exports of domestic country will be
deteriorated. This makes us believe that most expected signs of exchange rate will be non-
negative, except in either Japan or Korea export regression we expect coefficient on exchange
rate of the other country’s currency against US dollar to be negative.
Table 3 presents the results of OLS and CORC regressions on the three time series
models. Satisfactorily, most coefficients have the expected signs. For China export
regression, the results prove our hypothesis that both depreciation of Yen and RMB against
Dollar lead to an increase in the level of China’s exports to the United States by showing that
every percentage increase in real exchange rate of Yen against USD (Yen depreciation)
would result in an 5.58% increase of exports to the US from China, respectively. When a real

15
depreciation of RMB against USD exists, imports of the United States from China will also
go up, though not statistically significant.
For Korea export, the signs of real exchange rate of Yen relative to USD in both OLS
and CORC regressions are negative, indicating that depreciation of Yen decreases imports of
the United States from South Korea. This is because Japan is competing with South Korea
for exports to the United States. Depreciation of Yen makes Yen cheaper relative to USD,
holding the exchange rate of the Won against USD constant. In this case, the United States is
willing to import more similar products from Japan instead of from South Korea. As a result,
South Korea’s total export to the United States decreases if exchange rate of the Won against
the USD remains the same.
In our Japan model, the positive sign of RMB relative to US dollar bears out again
that China and Japan are not competitors in export. Depreciation of the RMB against USD
actually increases the exports of Japan to the United States. On the contrary, the coefficient
of the log of the exchange rate of the Won against USD has a negative sign, suggesting signal
that depreciation of Won against USD leads to a drop in exports from Japan to the United
States. This is also consistent with the result of the Korea model that depreciation of Yen
against USD decreases the exports of South Korea to the United States because they are
substitute trade partners.
Coefficients of exchange rate of Won and RMB from the Korea model have
unexpected signs, and they are both negative. The value of coefficient on Won means that a
one percent increase of the exchange rate of Won against USD will decrease China’s exports
to the US by 0.44 percent. The value of coefficient on RMB tells that a one percent increase
of the exchange rate of RMB against USD will decrease Korea’s exports to the US by 0.003
percent. From China’s regression, one percent depreciation of Won against USD decreases
China’s export to the US by 0.133 percent. These results show a possible trade competition
16
between China and South Korea. However, the latter two coefficients are not statistically
significant, or the trade competition between China and South Korea is minimal.
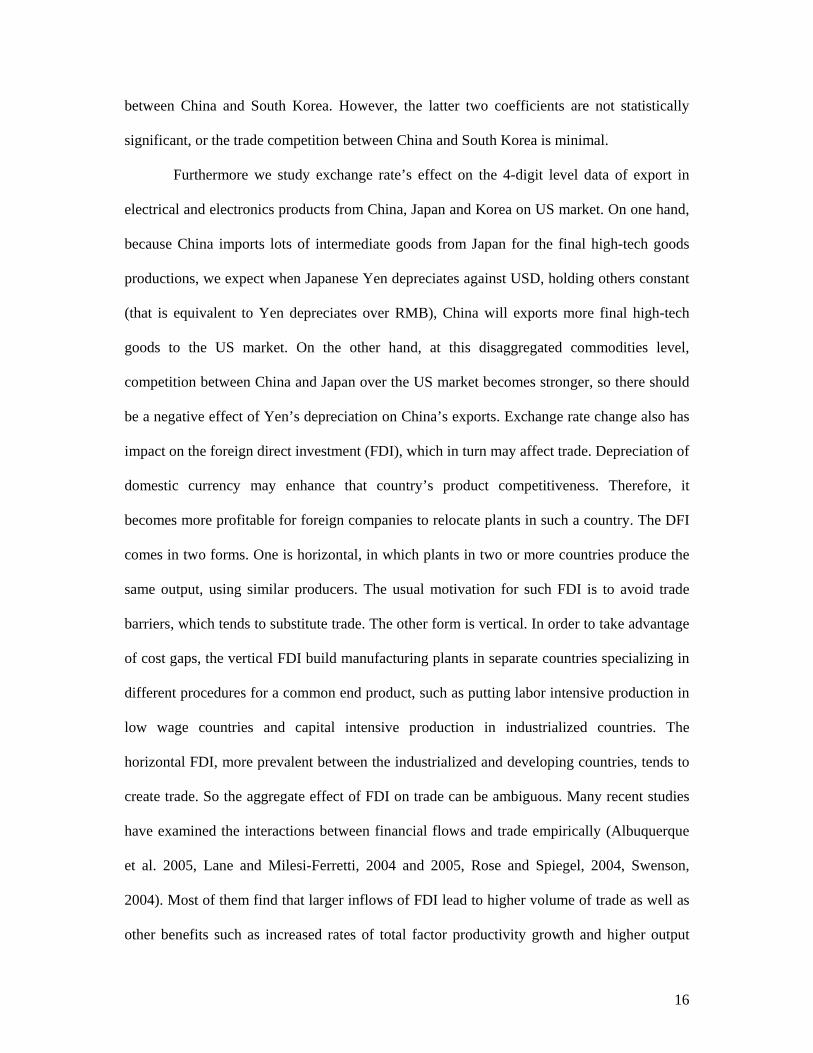
Furthermore we study exchange rate’s effect on the 4-digit level data of export in
electrical and electronics products from China, Japan and Korea on US market. On one hand,
because China imports lots of intermediate goods from Japan for the final high-tech goods
productions, we expect when Japanese Yen depreciates against USD, holding others constant
(that is equivalent to Yen depreciates over RMB), China will exports more final high-tech
goods to the US market. On the other hand, at this disaggregated commodities level,
competition between China and Japan over the US market becomes stronger, so there should
be a negative effect of Yen’s depreciation on China’s exports. Exchange rate change also has
impact on the foreign direct investment (FDI), which in turn may affect trade. Depreciation of
domestic currency may enhance that country’s product competitiveness. Therefore, it
becomes more profitable for foreign companies to relocate plants in such a country. The DFI
comes in two forms. One is horizontal, in which plants in two or more countries produce the
same output, using similar producers. The usual motivation for such FDI is to avoid trade
barriers, which tends to substitute trade. The other form is vertical. In order to take advantage
of cost gaps, the vertical FDI build manufacturing plants in separate countries specializing in
different procedures for a common end product, such as putting labor intensive production in
low wage countries and capital intensive production in industrialized countries. The
horizontal FDI, more prevalent between the industrialized and developing countries, tends to
create trade. So the aggregate effect of FDI on trade can be ambiguous. Many recent studies
have examined the interactions between financial flows and trade empirically (Albuquerque
et al. 2005, Lane and Milesi-Ferretti, 2004 and 2005, Rose and Spiegel, 2004, Swenson,
2004). Most of them find that larger inflows of FDI lead to higher volume of trade as well as
other benefits such as increased rates of total factor productivity growth and higher output
17
growth rates. Annual data on bilateral trade flows are from the UN Commodity Trade
Statistics Database (UN Comtrade) and we use HS 1996 four-digit commodities goods from
year 1996 to 2004. Annual FDI inflow data from 1996 to 2004 are from the World Bank’s
world development indicators.
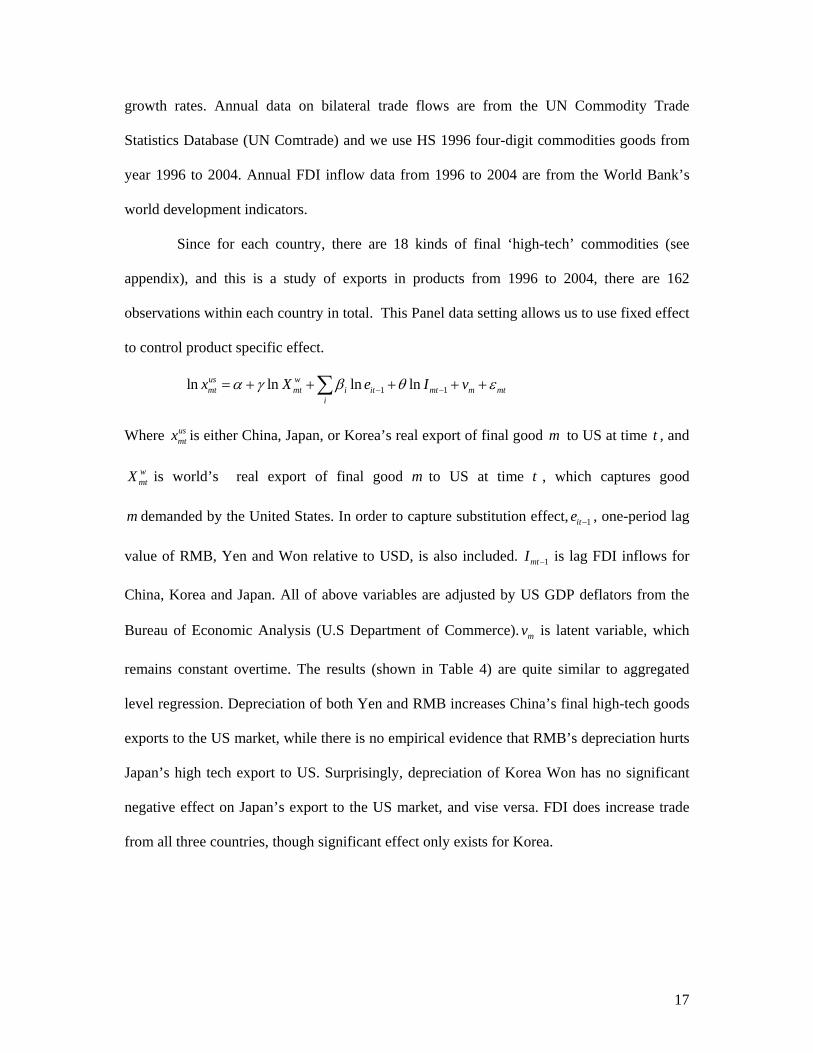
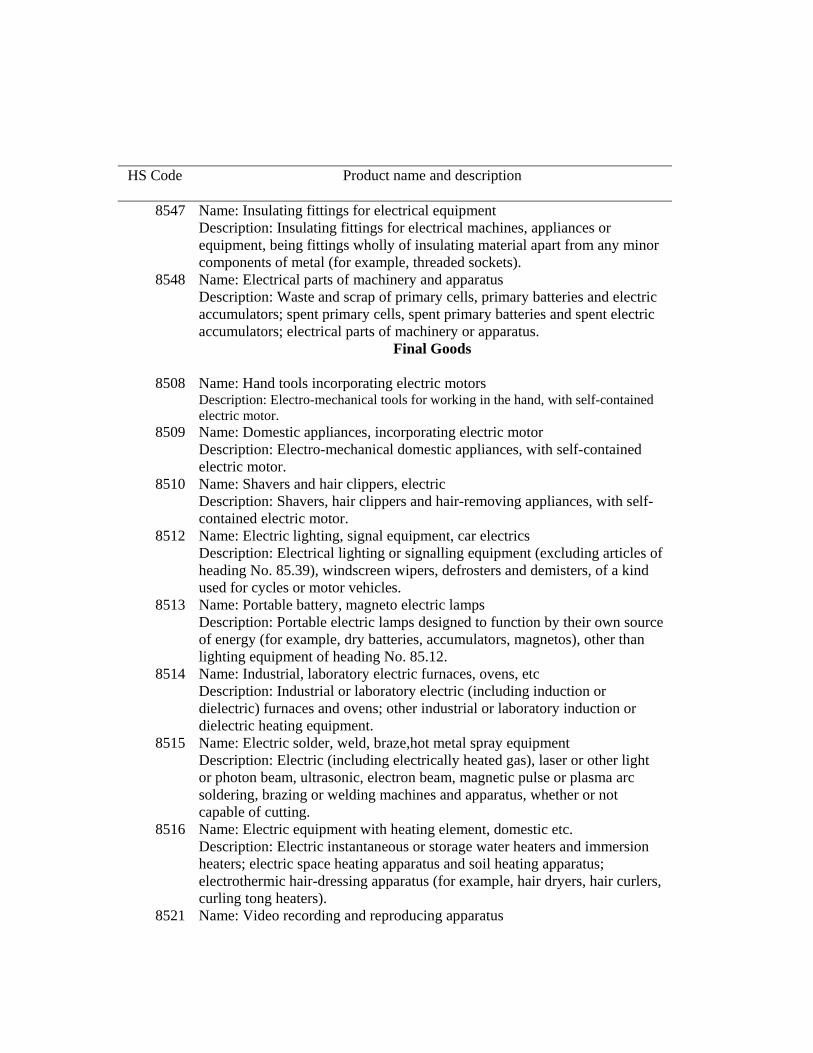
Since for each country, there are 18 kinds of final ‘high-tech’ commodities (see
appendix), and this is a study of exports in products from 1996 to 2004, there are 162
observations within each country in total. This Panel data setting allows us to use fixed effect
to control product specific effect.
1 1ln ln ln lnus wmt mt i it mt m mt
ix X e I vα γ β θ ε− −= + + + + +∑
Where usmtx is either China, Japan, or Korea’s real export of final good m to US at time t , and
wmtX is world’s real export of final good m to US at time t , which captures good
m demanded by the United States. In order to capture substitution effect, 1ite − , one-period lag
value of RMB, Yen and Won relative to USD, is also included. 1mtI − is lag FDI inflows for
China, Korea and Japan. All of above variables are adjusted by US GDP deflators from the
Bureau of Economic Analysis (U.S Department of Commerce). mv is latent variable, which
remains constant overtime. The results (shown in Table 4) are quite similar to aggregated
level regression. Depreciation of both Yen and RMB increases China’s final high-tech goods
exports to the US market, while there is no empirical evidence that RMB’s depreciation hurts
Japan’s high tech export to US. Surprisingly, depreciation of Korea Won has no significant
negative effect on Japan’s export to the US market, and vise versa. FDI does increase trade
from all three countries, though significant effect only exists for Korea.

18
4. Conclusions
Since the normalization of diplomatic relations between China and Korea in 1992, the
total export and import volume between the two countries has expanded dramatically, from
$25.36 billion in 1992 to $133.57 billion 2004. In 2003, China became the largest export
destination of Korea, and Korea’s trade surplus with China reached $13.2 billion,
representing about 80 percent of its total trade surplus. Still, Japan remains the largest import
source for both China and Korea.
This paper has examined the trade relationships among China, Japan, and South
Korea. We concluded that China possesses a large comparative advantage in labor-intensive
products, such as toys, sporting goods, and footwear. Japan and Korea maintain large
comparative advantages in capital-intensive products. In 2001, for example, motor vehicles
were the largest export commodity for both Japan and Korea. There is little competition
between Chinese and Japanese export products, while a relative high level of competition
exists between Japanese and Korean export products. China and Japan are complementary
trade partners, while Japan and Korea are trading competitors.
The paper has empirically evaluated the effect depreciation of Yen against RMB or
Korea Won on the exports of China and South Korea. Based on regression results, we found
that depreciation of Yen has a positive impact on China’s export but has a negative impact on
Korea’s export. The same findings remain when we restrict our dependent variables to
China’s and Korea’s commodities export or final high-tech goods export to the US market.
The econometric tests confirm our hypotheses that Japan is competing with South Korea in
exports, but not with China. This conclusion could be of some value to the Japanese
government in its policy-making. Recently, the authorities of the Japanese government
assume China as the biggest threat to Japan in the international market. Under this
assumption, the Japanese government directly or indirectly supports a policy of depreciation
19
of Yen against USD in order to beat China in exports. They even believe that by doing so
Japan will make its economy better off and slow down China’s fast development. However,
according to our empirical results, Japan’s policy will not yield the results they wanted. Also,
our results clearly show that neither China is a threat to Japan, nor the other way around.
Certainly, the development of China’s economy presents opportunities for Japan and
Korea as well as challenges. From the perspective of market demand, China is a substitute
for some of Japan and Korea’s exports. But these negative impacts are limited under the
precondition that China is a largely complementary trade partner of Japan as well as of Korea.
From the perspective of supply, Japan and Korea import cheap semi-products from China,
reducing costs of their domestic corporations, so that Japanese and Korean corporations could
expand the scale of their production and distribution. As many studies have shown, China’s
rise has been a boon to both Japan and Korea’s economies. Since the Asian financial crisis in
1997, Japan and Korea have benefited from the dynamics of the Chinese economy to recover
their own economies by building complementarity with China. Looking ahead, the rising
competitiveness of Chinese products in the international trade arena requires all three
countries adopt a strategy to upgrade their own industries and develop niche markets. In this
sense, the perceived “China threat” could be a catalyst for promoting East Asian nations’
economic development and international competitiveness.

20
Figure 1. Top 10 commodities exported to US from China (year 2004)
0
2
4
6
8
10
12
14
16
18
20
Toys a
nd Spo
rting G
oods
Footw
ear
Automati
c Data
Proc
ess M
achin
es
Furnitu
re & B
eddin
g Acc
esso
ries
Teleco
mminica
tions
Equ
ipmen
ts
Parts F
or Offic
e Mac
hines
& A
DP Mac
hines
Sound
Rec
orders
and T
V Rec
orders
House
hold
Type E
lectric
& Non
electr
ic Equ
ipmen
tArtic
les O
f Plas
tics
Trunks
, Suit
case
s, Van
ity C
ases
, and
Brie
fcase
spe
rcen
tage
s

21
Figure 2. Top 10 Commodities Exported to US from Japan (year 2004)
0
5
10
15
20
25
30
All Moto
r Veh
icles
Parts a
nd A
cces
sorie
s of M
otor V
echic
les
Automati
c Data
Proces
s Mac
hines
Intern
al Com
busti
on Pist
on E
ngine
s
Therm
ionic,
Cold
Cath
ode a
nd P
hotoc
athod
e Valv
es
Parts f
or Offic
e Mac
hines
& ADP M
achin
es
Sound
Rec
orders
and T
V Rec
orders
Electric
al Mac
hinery
and A
ppara
tus
Teleco
mminica
tions
Equ
ipmen
ts
Automati
c Data
Proces
s Mac
hines
perc
enta
ge
22
Figure 3. Top 10 commodities exported to US from Korea (year 2004)
0
5
10
15
20
25
All Moto
r Veh
icles
Teleco
mmunica
tions
Equ
ipmen
t
Therm
ionic,
Cold
Cath
ode a
nd P
hotoc
athod
e Valv
es
Automati
c Data
Proc
ess M
achin
es
Parts f
or Offic
e Mac
hines
& A
DP Mac
hines
Televis
ion R
eceiv
ers
House
hold
Type E
lectric
& N
onele
ctric
Equipm
ent
Oil (Not
Crude)
Parts A
nd A
cces
sorie
s Of M
otor V
ehicl
es
Electric
al Mac
hinery
And
App
aratus
perc
enta
ge
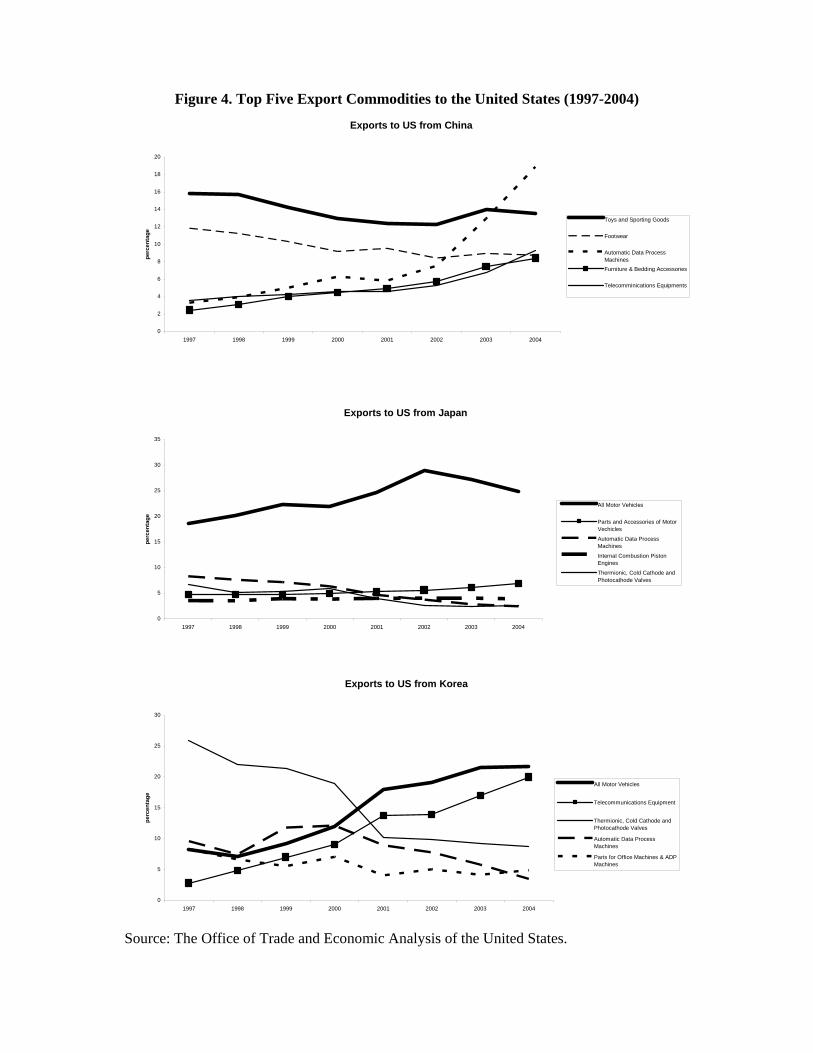
Figure 4. Top Five Export Commodities to the United States (1997-2004)
Exports to US from China
0
2
4
6
8
10
12
14
16
18
20
1997 1998 1999 2000 2001 2002 2003 2004
perc
enta
ge
Toys and Sporting Goods
Footwear
Automatic Data ProcessMachinesFurniture & Bedding Accessories
Telecomminications Equipments
Exports to US from Japan
0
5
10
15
20
25
30
35
1997 1998 1999 2000 2001 2002 2003 2004
perc
enta
ge
All Motor Vehicles
Parts and Accessories of MotorVechicles
Automatic Data ProcessMachines
Internal Combustion PistonEngines
Thermionic, Cold Cathode andPhotocathode Valves
Exports to US from Korea
0
5
10
15
20
25
30
1997 1998 1999 2000 2001 2002 2003 2004
perc
enta
ge
All Motor Vehicles
Telecommunications Equipment
Thermionic, Cold Cathode andPhotocathode Valves
Automatic Data ProcessMachines
Parts for Office Machines & ADPMachines
Source: The Office of Trade and Economic Analysis of the United States.

Figure 5. Competitive Degree of China, Japan and Korea in World market
5.1 China v.s. Japan 80's RCA
0
2
4
6
8
10
12
Live
ani
mal
s ch
iefly
Fish
, cru
stac
ean
and
Sug
ar, s
ugar
Mis
cella
neou
s ed
ible
Hid
es, s
kins
and
Cor
k an
d w
ood
Cru
de fe
rtiliz
er a
nd
Coa
l, co
ke a
nd
Ani
mal
and
Dye
ing,
tann
ing
and
Ferti
lizer
s,
Che
mic
al m
ater
ials
Cor
k an
d w
ood,
cor
k
Non
-met
allic
min
eral
Man
ufac
ture
s of
Met
alw
orki
ng
Tele
com
mun
icat
ions
,
Oth
er tr
ansp
ort
Trav
el g
oods
,
Pro
fess
iona
l,
Arm
oure
d fig
htin
g
JapanChina
Figure 5.2 Japan v.s. Korea 80's RCA
0
1
2
3
4
5
6
7
8
9
10
Live
ani
mal
s ch
iefly
Fish
, cru
stac
ean
and
Sug
ar, s
ugar
Mis
cella
neou
s ed
ible
Hid
es, s
kins
and
Cor
k an
d w
ood
Cru
de fe
rtiliz
er a
nd
Coa
l, co
ke a
nd
Ani
mal
and
Dye
ing,
tann
ing
and
Ferti
lizer
s,
Che
mic
al m
ater
ials
Cor
k an
d w
ood,
cor
k
Non
-met
allic
min
eral
Man
ufac
ture
s of
Met
alw
orki
ng
Tele
com
mun
icat
ions
,
Oth
er tr
ansp
ort
Trav
el g
oods
,
Pro
fess
iona
l,
Arm
oure
d fig
htin
g
JapanKorea

Figure 5.3 China v.s. Japan 90's RCA
0
1
2
3
4
5
6
7
Live
ani
mal
s ch
iefly
Fish
, cru
stac
ean
and
Sug
ar, s
ugar
Mis
cella
neou
s ed
ible
Hid
es, s
kins
and
Cor
k an
d w
ood
Cru
de fe
rtiliz
er a
nd
Coa
l, co
ke a
nd
Ani
mal
and
Dye
ing,
tann
ing
and
Ferti
lizer
s,
Che
mic
al m
ater
ials
Cor
k an
d w
ood,
cor
k
Non
-met
allic
min
eral
Man
ufac
ture
s of
Met
alw
orki
ng
Tele
com
mun
icat
ions
,
Oth
er tr
ansp
ort
Trav
el g
oods
,
Pro
fess
iona
l,
Arm
oure
d fig
htin
g
JapanChina
Figure 5.4 Japan v.s. Korea 90's RCA
0
1
2
3
4
5
6
Live
ani
mal
s ch
iefly
Fish
, cru
stac
ean
and
Sug
ar, s
ugar
Mis
cella
neou
s ed
ible
Hid
es, s
kins
and
Cor
k an
d w
ood
Cru
de fe
rtiliz
er a
nd
Coa
l, co
ke a
nd
Ani
mal
and
Dye
ing,
tann
ing
and
Ferti
lizer
s,
Che
mic
al m
ater
ials
Cor
k an
d w
ood,
cor
k
Non
-met
allic
min
eral
Man
ufac
ture
s of
Met
alw
orki
ng
Tele
com
mun
icat
ions
,
Oth
er tr
ansp
ort
Trav
el g
oods
,
Pro
fess
iona
l,
Arm
oure
d fig
htin
g
JapanKorea
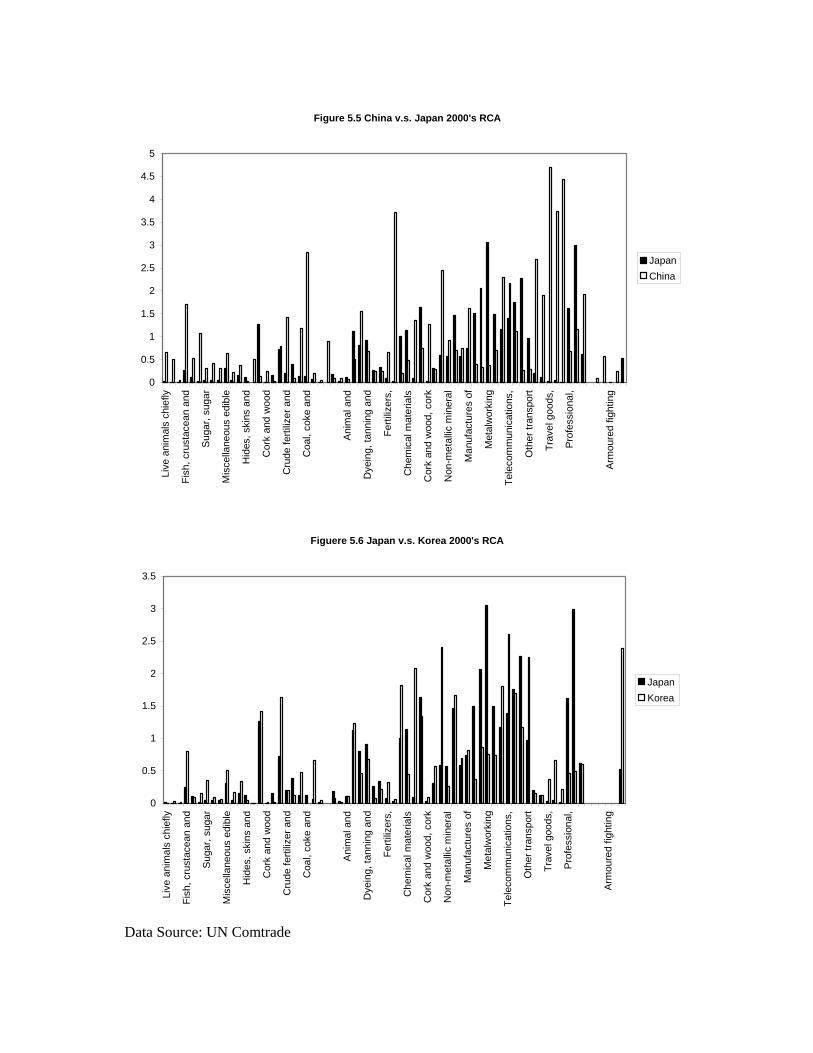
Figure 5.5 China v.s. Japan 2000's RCA
0
0.5
1
1.5
2
2.5
3
3.5
4
4.5
5Li
ve a
nim
als
chie
fly
Fish
, cru
stac
ean
and
Sug
ar, s
ugar
Mis
cella
neou
s ed
ible
Hid
es, s
kins
and
Cor
k an
d w
ood
Cru
de fe
rtiliz
er a
nd
Coa
l, co
ke a
nd
Ani
mal
and
Dye
ing,
tann
ing
and
Ferti
lizer
s,
Che
mic
al m
ater
ials
Cor
k an
d w
ood,
cor
k
Non
-met
allic
min
eral
Man
ufac
ture
s of
Met
alw
orki
ng
Tele
com
mun
icat
ions
,
Oth
er tr
ansp
ort
Trav
el g
oods
,
Pro
fess
iona
l,
Arm
oure
d fig
htin
g
JapanChina
Figuere 5.6 Japan v.s. Korea 2000's RCA
0
0.5
1
1.5
2
2.5
3
3.5
Live
ani
mal
s ch
iefly
Fish
, cru
stac
ean
and
Sug
ar, s
ugar
Mis
cella
neou
s ed
ible
Hid
es, s
kins
and
Cor
k an
d w
ood
Cru
de fe
rtiliz
er a
nd
Coa
l, co
ke a
nd
Ani
mal
and
Dye
ing,
tann
ing
and
Ferti
lizer
s,
Che
mic
al m
ater
ials
Cor
k an
d w
ood,
cor
k
Non
-met
allic
min
eral
Man
ufac
ture
s of
Met
alw
orki
ng
Tele
com
mun
icat
ions
,
Oth
er tr
ansp
ort
Trav
el g
oods
,
Pro
fess
iona
l,
Arm
oure
d fig
htin
g
JapanKorea
Data Source: UN Comtrade

Figure 6 China's High Tech Intermediate Good Imports
0%
5%
10%
15%
20%
25%
30%
35%
40%
1996 1997 1998 1999 2000 2001 2002 2003 2004
Year
Perc
enta
ge a
s to
tal i
mpo
rts
from
RO
W
Japan
Korea
Figure 7.1 China exports to Japan 1984
0%
10%
20%
30%
40%
50%
60%
Live
ani
mal
s ch
iefly
for f
ood
Dai
ry p
rodu
cts
and
bird
s' e
ggs
Cer
eals
and
cer
eal p
repa
ratio
ns
Suga
r, su
gar p
repa
ratio
ns a
nd h
oney
Feed
ing
stuf
f for
ani
mal
s (n
ot in
clud
ing
Beve
rage
s
Hid
es, s
kins
and
furs
kins
, raw
Cru
de ru
bber
(inc
ludi
ng s
ynth
etic
and
Pulp
and
was
te p
aper
Cru
de fe
rtiliz
er a
nd c
rude
min
eral
s
Cru
de a
nim
al a
nd v
eget
able
mat
eria
ls, n
es
Petro
leum
, pet
role
um p
rodu
cts
and
rela
ted
Fixe
d ve
geta
ble
oils
and
fats
Org
anic
che
mic
als
Dye
ing,
tann
ing
and
colo
urin
g m
ater
ials
Oils
and
per
fum
e m
ater
ials
; toi
let a
nd
Expl
osiv
es a
nd p
yrot
echn
ic p
rodu
cts
Che
mic
al m
ater
ials
and
pro
duct
s, n
es
Rub
ber m
anuf
actu
res,
nes
Pape
r, pa
perb
oard
, and
arti
cles
of p
ulp,
of
Non
-met
allic
min
eral
man
ufac
ture
s, n
es
Non
-ferr
ous
met
als
Pow
er g
ener
atin
g m
achi
nery
and
equ
ipm
ent
Met
alw
orki
ng m
achi
nery
Offi
ce m
achi
nes
and
auto
mat
ic d
ata
Elec
tric
mac
hine
ry, a
ppar
atus
and
Oth
er tr
ansp
ort e
quip
men
t
Furn
iture
and
par
ts th
ereo
f
Artic
les
of a
ppar
el a
nd c
loth
ing
acce
ssor
ies
Prof
essi
onal
, sci
entif
ic, c
ontro
lling
Mis
cella
neou
s m
anuf
actu
red
artic
les,
nes

Figure 7.2 China's export to Japan 1994
0%
5%
10%
15%
20%
25%
30%
Live
ani
mal
s ch
iefly
for f
ood
Dai
ry p
rodu
cts
and
bird
s' e
ggs
Cer
eals
and
cer
eal p
repa
ratio
ns
Sug
ar, s
ugar
pre
para
tions
and
hon
ey
Feed
ing
stuf
f for
ani
mal
s (n
ot in
clud
ing
Beve
rage
s
Hid
es, s
kins
and
furs
kins
, raw
Cru
de ru
bber
(inc
ludi
ng s
ynth
etic
and
Pulp
and
was
te p
aper
Cru
de fe
rtiliz
er a
nd c
rude
min
eral
s
Cru
de a
nim
al a
nd v
eget
able
mat
eria
ls, n
es
Petro
leum
, pet
role
um p
rodu
cts
and
rela
ted
Fixe
d ve
geta
ble
oils
and
fats
Org
anic
che
mic
als
Dye
ing,
tann
ing
and
colo
urin
g m
ater
ials
Oils
and
per
fum
e m
ater
ials
; toi
let a
nd
Expl
osiv
es a
nd p
yrot
echn
ic p
rodu
cts
Che
mic
al m
ater
ials
and
pro
duct
s, n
es
Rub
ber m
anuf
actu
res,
nes
Pap
er, p
aper
boar
d, a
nd a
rticl
es o
f pul
p, o
f
Non
-met
allic
min
eral
man
ufac
ture
s, n
es
Non
-ferr
ous
met
als
Pow
er g
ener
atin
g m
achi
nery
and
equ
ipm
ent
Met
alw
orki
ng m
achi
nery
Offi
ce m
achi
nes
and
auto
mat
ic d
ata
Elec
tric
mac
hine
ry, a
ppar
atus
and
Oth
er tr
ansp
ort e
quip
men
t
Furn
iture
and
par
ts th
ereo
f
Arti
cles
of a
ppar
el a
nd c
loth
ing
acce
ssor
ies
Prof
essi
onal
, sci
entif
ic, c
ontro
lling
Mis
cella
neou
s m
anuf
actu
red
artic
les,
nes
Anim
als,
live
, nes
, (in
clud
ing
zoo
anim
als,
Figure 7.3 China's exports to Japan 2004
0%
5%
10%
15%
20%
25%
Mea
t and
pre
para
tions
Fish
, cru
stac
ean
and
mol
lusc
s, a
nd
Vege
tabl
es a
nd fr
uit
Cof
fee,
tea,
coc
oa, s
pice
s, a
nd
Mis
cella
neou
s ed
ible
pro
duct
s an
d
Toba
cco
and
toba
cco
man
ufac
ture
s
Oil
seed
s an
d ol
eagi
nous
frui
t
Cor
k an
d w
ood
Text
ile fi
bres
(not
woo
l top
s) a
nd th
eir
Met
allif
erou
s or
es a
nd m
etal
scr
ap
Coa
l, co
ke a
nd b
rique
ttes
Gas
, nat
ural
and
man
ufac
ture
d
Fixe
d ve
geta
ble
oils
and
fats
Org
anic
che
mic
als
Dye
ing,
tann
ing
and
colo
urin
g m
ater
ials
Oils
and
per
fum
e m
ater
ials
; toi
let a
nd
Expl
osiv
es a
nd p
yrot
echn
ic p
rodu
cts
Che
mic
al m
ater
ials
and
pro
duct
s, n
es
Rub
ber m
anuf
actu
res,
nes
Pape
r, pa
perb
oard
, and
arti
cles
of p
ulp,
of
Non
-met
allic
min
eral
man
ufac
ture
s, n
es
Non
-ferro
us m
etal
s
Pow
er g
ener
atin
g m
achi
nery
and
equ
ipm
ent
Met
alw
orki
ng m
achi
nery
Offi
ce m
achi
nes
and
auto
mat
ic d
ata
Elec
tric
mac
hine
ry, a
ppar
atus
and
Oth
er tr
ansp
ort e
quip
men
t
Furn
iture
and
par
ts th
ereo
f
Artic
les
of a
ppar
el a
nd c
loth
ing
acce
ssor
ies
Pro
fess
iona
l, sc
ient
ific,
con
trolli
ng
Mis
cella
neou
s m
anuf
actu
red
artic
les,
nes
Anim
als,
live
, nes
, (in
clud
ing
zoo
anim
als,
Coi
n (o
ther
than
gol
d co
in),
not b
eing
lega
l
Data Source: UN Comtrade
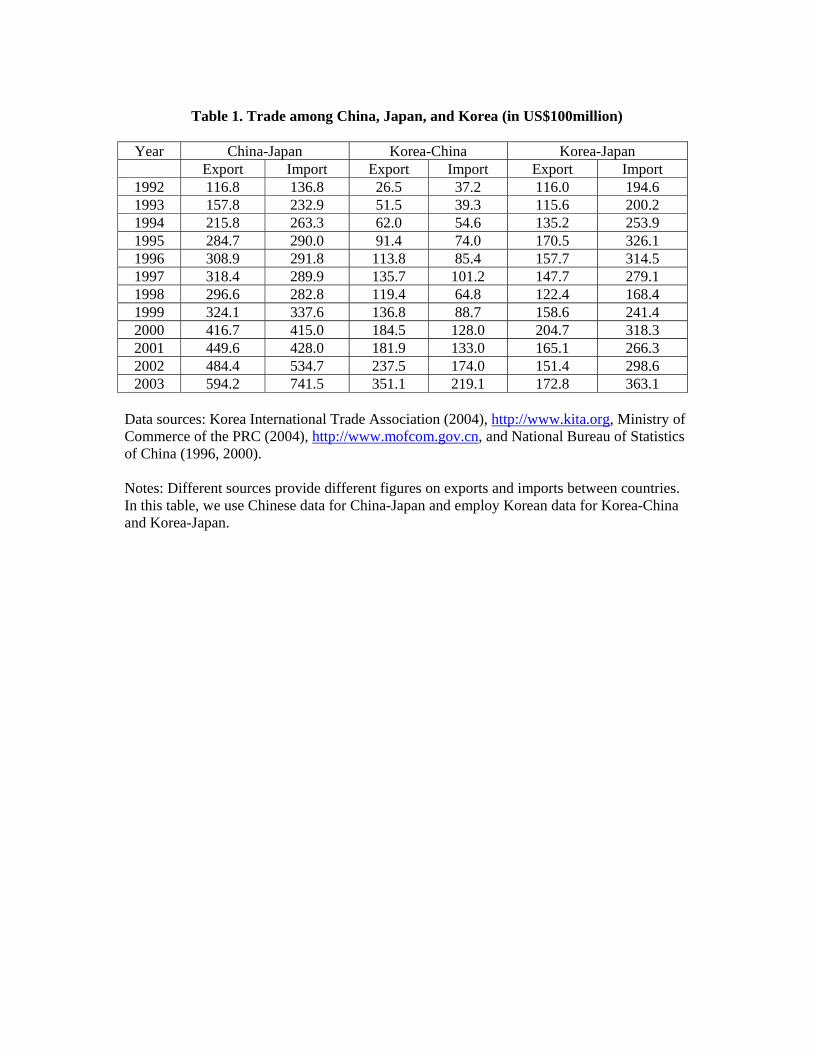
Table 1. Trade among China, Japan, and Korea (in US$100million)
Year China-Japan Korea-China Korea-Japan
Export Import Export Import Export Import 1992 116.8 136.8 26.5 37.2 116.0 194.6 1993 157.8 232.9 51.5 39.3 115.6 200.2 1994 215.8 263.3 62.0 54.6 135.2 253.9 1995 284.7 290.0 91.4 74.0 170.5 326.1 1996 308.9 291.8 113.8 85.4 157.7 314.5 1997 318.4 289.9 135.7 101.2 147.7 279.1 1998 296.6 282.8 119.4 64.8 122.4 168.4 1999 324.1 337.6 136.8 88.7 158.6 241.4 2000 416.7 415.0 184.5 128.0 204.7 318.3 2001 449.6 428.0 181.9 133.0 165.1 266.3 2002 484.4 534.7 237.5 174.0 151.4 298.6 2003 594.2 741.5 351.1 219.1 172.8 363.1
Data sources: Korea International Trade Association (2004), http://www.kita.org, Ministry of Commerce of the PRC (2004), http://www.mofcom.gov.cn, and National Bureau of Statistics of China (1996, 2000). Notes: Different sources provide different figures on exports and imports between countries. In this table, we use Chinese data for China-Japan and employ Korean data for Korea-China and Korea-Japan.
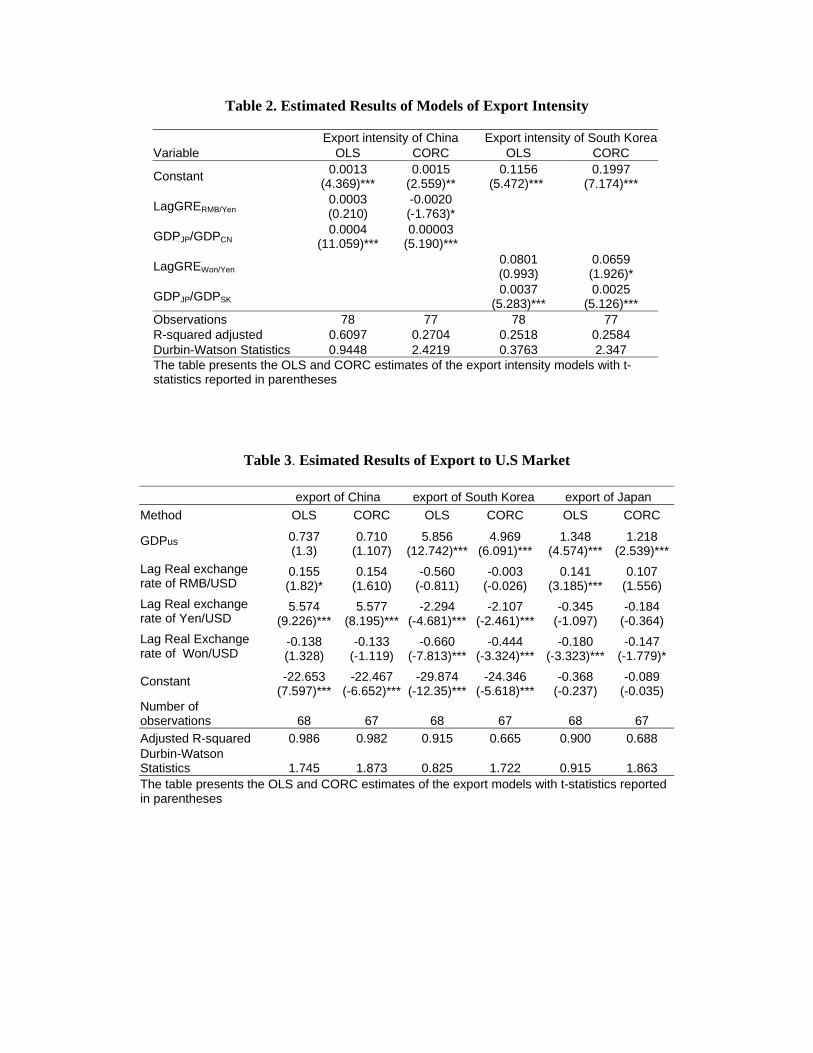
Table 2. Estimated Results of Models of Export Intensity Export intensity of China Export intensity of South KoreaVariable OLS CORC OLS CORC
Constant 0.0013 (4.369)***
0.0015 (2.559)**
0.1156 (5.472)***
0.1997 (7.174)***
LagGRERMB/Yen 0.0003 (0.210)
-0.0020 (-1.763)*
GDPJP/GDPCN 0.0004 (11.059)***
0.00003 (5.190)***
LagGREWon/Yen 0.0801 (0.993)
0.0659 (1.926)*
GDPJP/GDPSK
0.0037 (5.283)***
0.0025 (5.126)***
Observations 78 77 78 77 R-squared adjusted 0.6097 0.2704 0.2518 0.2584 Durbin-Watson Statistics 0.9448 2.4219 0.3763 2.347 The table presents the OLS and CORC estimates of the export intensity models with t-statistics reported in parentheses
Table 3. Esimated Results of Export to U.S Market export of China export of South Korea export of Japan Method OLS CORC OLS CORC OLS CORC
GDPus 0.737 (1.3)
0.710 (1.107)
5.856 (12.742)***
4.969 (6.091)***
1.348 (4.574)***
1.218 (2.539)***
Lag Real exchange rate of RMB/USD
0.155 (1.82)*
0.154 (1.610)
-0.560 (-0.811)
-0.003 (-0.026)
0.141 (3.185)***
0.107 (1.556)
Lag Real exchange rate of Yen/USD
5.574 (9.226)***
5.577 (8.195)***
-2.294 (-4.681)***
-2.107 (-2.461)***
-0.345 (-1.097)
-0.184 (-0.364)
Lag Real Exchange rate of Won/USD
-0.138 (1.328)
-0.133 (-1.119)
-0.660 (-7.813)***
-0.444 (-3.324)***
-0.180 (-3.323)***
-0.147 (-1.779)*
Constant -22.653 (7.597)***
-22.467 (-6.652)***
-29.874 (-12.35)***
-24.346 (-5.618)***
-0.368 (-0.237)
-0.089 (-0.035)
Number of observations 68 67 68 67 68 67 Adjusted R-squared 0.986 0.982 0.915 0.665 0.900 0.688 Durbin-Watson Statistics 1.745 1.873 0.825 1.722 0.915 1.863 The table presents the OLS and CORC estimates of the export models with t-statistics reported in parentheses

Table 4 Estimated Results of High Tech Final Goods
Exported to U.S Market
Variable Export of China
(FE) Export of Korea
(FE) Export of Japan
(FE)
World exports to US 1.2073 (4.70)***
0.6248 (1.92)*
0.5072 (3.22)***
Real exchange rate of RMB/USD
6.5626 (5.10)***
2.6324 (1.78)*
-2.5525 (-1.04)
Real exchange rate of Yen/USD
1.6173 (1.66)*
1.0488 (0.95)
-0.1390 (-0.12)
Real exchange rate of Won/USD
0.3831 (0.54)
-1.9303 (-1.75)*
-0.5267 (-0.31)
FDI inflow 0.9505 (1.01)
0.1901 (2.01)**
0.0388 (0.37)
Constant -49.5562 (-2.83)***
1.5847 (0.30)
14.3620 (1.37)
Number of groups 18 18 18 Number of observations 162 162 160 R-squared: Within 0.5504 0.0994 0.0920 : Between 0.6128 0.8538 0.5949 : Overall 0.6021 0.7518 0.5541 The table presents panel data regression fixed effect of the export models with t-statistics reported in parentheses
*** 1% level significant ** 5% level significant * 10% level significant

HS Code
Product name and description
Intermediate Goods
8501 Name: Electric motors and generators, except generating sets Description: Electric motors and generators (excluding generating sets).
8502 Name: Electric generating sets and rotary converters Description: Electric generating sets and rotary converters.
8503 Name: Parts for electric motors and generators Description: Parts suitable for use solely or principally with the machines of
heading No. 85.01 or 85.02. 8504 Name: Electric transformers, static converters and rectifiers
Description: Electrical transformers, static converters (for example, rectifiers) and inductors.
8505 Name: Electro and permanent magnets, equipment using magnets Description: Electro-magnets; permanent magnets and articles intended to
become permanent magnets after magnetisation; electro-magnetic or permanent magnet chucks, clamps and similar holding devices; electromagnetic couplings, clutches and brakes.
8506 Name: Primary cells and primary batteries Description: Primary cells and primary batteries.
8507 Name: Electric accumulators Description: Electric accumulators, including separators therefor, whether or
not rectangular (including square). 8511 Name: Ignition/starter equipment, internal combustion engine
Description: Electrical ignition or starting equipment of a kind used for sparkignition or compression-ignition internal combustion engines (for example, ignition magnetos, magneto-dynamos, ignition coils, sparking plugs and glow plugs.
8529 Name: Parts for radio, tv transmission, receive equipment Description: Parts suitable for use solely or principally with the apparatus of
headings Nos. 85.25 to 85.28. 8532 Name: Electrical capacitors, fixed, variable or adjustable
Description: Electrical capacitors, fixed, variable or adjustable (pre-set). 8533 Name: Electrical resistors and rheostats except for heating
Description: Electrical resistors (including rheostats and potentiometers), other than heating resistors.
8534 Name: Electronic printed circuits Description: Printed circuits.
8535 Name: Electrical apparatus for voltage over 1 kV Description: Electrical apparatus for switching or protecting electrical
circuits, or for making connections to or in electrical circuits (for example, switches, fuses, lightning arresters, voltage limiters, surge suppressors, plugs, junction boxes).

HS Code
Product name and description
8536 Name: Electrical switches, connectors, etc, for < 1kV Description: Electrical apparatus for switching or protecting electrical
circuits, or for making connections to or in electrical circuits (for example, switches, relays, fuses, surge suppressors, plugs, sockets, lamp-holders, junction boxes).
8537 Name: Electrical power, etc, control and distribution boards Description: Boards, panels, consoles, desks, cabinets and other bases,
equipped with two or more apparatus of heading No.85.35 or 85.36, for electric control or the distribution of electricity, including those incorporating instruments or apparatus.
8538 Name: Parts for electrical switches, protectors, connectors Description: Parts suitable for use solely or principally with the apparatus of
heading No. 85.35, 85.36 or 85.37. 8539 Name: Electric filament, discharge lamps
Description: Electric filament or discharge lamps, including sealed beam lamp units and ultra-violet or infra-red lamps; arc-lamps.
8540 Name: Thermionic and cold cathode valves and tubes Description: Thermionic, cold cathode or photo-cathode valves and tubes
(for example, vacuum or vapour or gas filled valves and tubes, mercury arc rectifying valves and tubes, cathode-ray tubes, television camera tubes).
8541 Name: Diodes, transistors, semi-conductors, etc Description: Diodes, transistors and similar semiconductor devices;
photosensitive semiconductor devices, including photovoltaic cells whether or not assembled in modules or made up into panels; light emitting diodes.
8542 Name: Electronic integrated circuits and microassemblies Description: Electronic integrated circuits and microassemblies.
8543 Name: Electrical machinery and apparatus, nes Description: Electrical machines and apparatus, having individual functions,
not specified or included elsewhere in this Chapter. 8544 Name: Insulated wire and cable, optical fibre cable
Description: Insulated (including enamelled or anodised) wire, cable (including co-axial cable) mand other insulated electric conductors, whether or not fitted with connectors; optical fibre cables, made up of individually
8545 Name: Carbon electrodes, brushes and electrical items Description: Carbon electrodes, carbon brushes, lamp carbons, battery
carbons and other articles of graphite or other carbon, with or without metal, of a kind used for electrical purposes.
8546 Name: Electrical insulators of any material Description: Electrical insulators of any material.
HS Code
Product name and description
8547 Name: Insulating fittings for electrical equipment Description: Insulating fittings for electrical machines, appliances or
equipment, being fittings wholly of insulating material apart from any minor components of metal (for example, threaded sockets).
8548 Name: Electrical parts of machinery and apparatus Description: Waste and scrap of primary cells, primary batteries and electric
accumulators; spent primary cells, spent primary batteries and spent electric accumulators; electrical parts of machinery or apparatus.
Final Goods
8508 Name: Hand tools incorporating electric motors Description: Electro-mechanical tools for working in the hand, with self-contained
electric motor. 8509 Name: Domestic appliances, incorporating electric motor
Description: Electro-mechanical domestic appliances, with self-contained electric motor.
8510 Name: Shavers and hair clippers, electric Description: Shavers, hair clippers and hair-removing appliances, with self-
contained electric motor. 8512 Name: Electric lighting, signal equipment, car electrics
Description: Electrical lighting or signalling equipment (excluding articles of heading No. 85.39), windscreen wipers, defrosters and demisters, of a kind used for cycles or motor vehicles.
8513 Name: Portable battery, magneto electric lamps Description: Portable electric lamps designed to function by their own source
of energy (for example, dry batteries, accumulators, magnetos), other than lighting equipment of heading No. 85.12.
8514 Name: Industrial, laboratory electric furnaces, ovens, etc Description: Industrial or laboratory electric (including induction or
dielectric) furnaces and ovens; other industrial or laboratory induction or dielectric heating equipment.
8515 Name: Electric solder, weld, braze,hot metal spray equipment Description: Electric (including electrically heated gas), laser or other light or photon beam, ultrasonic, electron beam, magnetic pulse or plasma arc soldering, brazing or welding machines and apparatus, whether or not capable of cutting.
8516 Name: Electric equipment with heating element, domestic etc. Description: Electric instantaneous or storage water heaters and immersion
heaters; electric space heating apparatus and soil heating apparatus; electrothermic hair-dressing apparatus (for example, hair dryers, hair curlers, curling tong heaters).
8521 Name: Video recording and reproducing apparatus

Description: Video recording or reproducing apparatus, whether or not incorporating a video tuner.
HS Code
Product name and description
8522 Name: Parts, accessories of audio, video recording equipment Description: Parts and accessories suitable for use solely or principally with
the apparatus of headings Nos. 85.19 to 85.21. 8523 Name: Prepared unrecorded sound recording media (non-photo)
Description: Prepared unrecorded media for sound recording or similar recording of other phenomena, other than products of Chapter 37.
8524 Name: Sound recordings other than photographic equipment Description: Records, tapes and other recorded media for sound or other
similarly recorded phenomena, including matrices and masters for the production of records, but excluding products of Chapter 37.
8525 Name: Radio and TV transmitters, television cameras Description: Transmission apparatusfor radio-telephony, radio- telegraphy,
radio-broadcasting or television, whether or not incorporating reception apparatus or sound recording or reproducing apparatus; television cameras; still image video cameras.
8526 Name: Radar, radio navigation and remote control apparatus Description: Radar apparatus, radio navigational aid apparatus and radio
remote control apparatus. 8527 Name: Radio, radio-telephony receivers
Description: Reception apparatus for radio-telephony, radio-telegraphy or radio-broadcasting, whether or not combined, in the same housing, with sound recording or reproducing apparatus or a clock.
8528 Name: Television receivers, video monitors, projectors Description: Reception apparatus for television, whether or not incorporating
radio-broadcast receivers or sound or video recording or reproducing apparatus; video monitors and video projectors.
8530 Name: Electrical signalling and traffic control equipment Description: Electrical signalling, safety or traffic control equipment for
railways, tramways, roads, inland waterways, parking facilities, port installations or airfields (other than those of heading No. 86.08).
8531 Name: Electric sound or visual signal equipment Description: Electric sound or visual signalling apparatus (for example, bells,
sirens, indicator panels, burglar or fire alarms), other than those of heading No. 85.12 or 85.30.
1 Use percentage of average value within 80’s, 90’s and 2000 to 2004 2 Someone may argue that there are some trade or monetary policies or other variables we didn’t include in our model, which results that our exchange rate variable is correlated with the regression error term. OLS will not nor generate consistent estimation. In Cochrance-Orcutt procedure, the algorithm will converge to a local

maximum instead of global maximum. The resulting GLS estimate need not be a consistent estimate. Lagged value is suggested by Durbin (1960), because it is believed to be uncorrelated with the error term. 3 In this paper, we use Feasible Generalized Least Squares (FGLS) to estimate 2σ by adopting the Cochrane and Orcutt (1949) estimator (CORC). But we need to be careful about our model assumption, since OLS only requires 0)( =ii exE , which is a quite weak assumption. When 0)|( =ii xeE , according to Gauss-Markov
theorem, the best (minimum-variance) unbiased linear estimator is GLS, though if 0)|( ≠ii xeE , our estimation will be inconsistent. 4 All these models are time serial models, which contains the value of a variable in time t in the series is dependent on the value of that variable in time t-1 (or some higher lag), such as real GDP and exports. This creates the problem of non-stationarity. Stationarity occurs in a time series when the mean value of the series remains constant over the time series. A stricter definition of stationarity also requires that the variance remain homogenous for the series. Sometimes this can be achieved by taking the logarithm of the data. There are still other reasons for preferring the )log(Y regression to the Y regression. First, it may be the case that
))log(|)(log( ii xyE is roughly linear in )log( ix over the support of ix , while the regression )|( ii xyE is non-linear (which we believe to be true in our case), and linear models are easier to report and interpret. Second, and this may be the most important reason, if the distribution of iy is highly skewed, the conditional mean
)|( ii xyE may not be a useful measure of central tendency, and estimates will be undesirably influenced by
extreme observations (“outliers”). In this case, the conditional mean ))log(|)(log( ii xyE may be a better measure of central tendency, and hence more interesting to estimate and report. Because many time series (most economic indicators, for instance, GDP) tend to rise, simple application of regression methods to time series encounters spurious correlations and even multicollinearity.

References Amsden, Alice H. (1985), “The Division of Labor is Limited by the Rate of Growth of the Market: The Taiwan Machine Tool Industry in the 1970s,” Cambridge Journal of Economics, 9, 271-84. Bank of Korea (June 2004), Monthly Bulletin, Seoul: Bank of Korea. Cheong, Inkyo (2002), East Asian Economic Integration: Recent Development of FTAs and Policy Implications, KIEP, Seoul, Korea. Cochrane, D., and G. Orcutt (1949), Application of Least Squares Regression to Relationship Containing Autocorrelated Error Terms, Journal of the American Statistical Association, 44, pp 32-61 Durbin, James (1960), Estimation of Parameters in Time-Series Regression Models, Journal of the Royal Statistical Society Series B, 22, pp 139-53 Ezeala-Harrison, Fidelis (1999), Theory and Policy of International Competitiveness, Praeger Publisher. Feder, G. (1982), On Exports and Economic Growth, Journal of Development Economics, 12 (1/2), 59-73. Hamilton, James D (1994) Time Series Analysis, Priceton University Press Ianchovichina, Elena and Walmsley, Terrie (2005) Impact of China's WTO Accession on East Asia, Contemporary Economic Policy, 23(2), 261-277 Korea International Trade Association (2004), http://www.kita.org. Krueger, Anne O (1978), Liberalization Attempts and Consequences, Cambridge, MA: Ballinger Publishing Co. Krueger, Anne O and Jones, Ronald W. (1990), The Political Economy of International Trade, Basil: Blackwell Publisher. Krugman, Paul R. and Obstfeld, Maurice (2000), International Economics, fifth edition. Addison-WesleyLongman, Inc. Lal, Deepak, and Rajapatirana, Sarath (1987), “Foreign Trade Regimes and Economic Growth in Developing Countries,” World Bank Research Observer, 2 (2), 189-216. Lee, Chang-Jae (1999), “A New Approach towards Enhanced Northeast Asian Economic Cooperation,” in The Road to Greater Northeast Asian Economic Cooperation in the 21st Century, KIEP, Seoul, Korea.

Liu, Wei (2004), “Regional Economic Cooperation Arrangements between China, Japan, and Korea,” presented at the Beijing Forum: The Harmony and Prosperity of Civilizations, August 23-25, 2004, Beijing, China. Luo, Zhaohong (1999), “Prospects of Northeast Asian Economic Cooperation,” in The Road to Greater Northeast Asian Economic Cooperation in the 21st Century, KIEP, Seoul, Korea. Meier, G.M. (1989), Trade Policy and Development in Public Policy and Economic Development, edited by M.F.G. Scott and Deepak Lal, Oxford: Oxford University Press. Melitz, Marc (2003), “The Impact of Trade on Intra-Industry Reallocations and Aggregate Industry Productivity,” Econometrica 71(6) 1695-1725 Ministry of Commerce of the PRC (2004), http://www.mofcom.gov.cn. Nam, Young-Sook (2004), “Impact of China’s Economic Emergence on Korea,” presented at the annual conference of the Chinese Economists Society, June 18-20, 2004, Beijing. National Bureau of Statistics of China (2003), China Statistical Yearbook, Beijing: China Statistics Press. National Bureau of Statistics of China (1996, 2000), China Foreign Economic Statistical Yearbook, Beijing: China Statistics Press. Nishimizu, Mieko and Robinson, Sherman (1984), “Trade Policies and Productivity Change in Semi-Industrialized Countries,” Journal of Development Economics, 16, 177-206. Ryou, Jai-Won and Wang, Yunjong (2004), “Financial Cooperation in East Asia: Major Issues and Future Prospects,” presented at the annual conference of the Chinese Economists Society, June 18-20, 2004, Beijing.