how did the world’s poorest fare in the...
TRANSCRIPT
How did the world’s poorest fare in the 1990s?
Shaohua Chen and Martin Ravallion
Development Research Group, World Bank
Drawing on 265 national sample surveys spanning 83 countries we find that there was a
net decrease in the overall incidence of consumption poverty over 1987-98. But it was not
enough to reduce the total number of poor by various definitions. The incidence of
poverty fell in Asia and the Middle East—North Africa. It changed little in Latin America
and Sub-Saharan Africa, and it rose sharply in Eastern Europe— Central Asia. We point
to two main proximate causes of the disappointing rate of poverty reduction: too little
economic growth in many of the poorest countries and persistent inequalities that
inhibited the poor from participating in the growth that did occur.
Note: We are grateful to numerous colleagues at the World Bank and the Inter-AmericanDevelopment Bank who helped us obtain the necessary data and answer our many questions. Wehave also benefited from discussions with Yonas Biru, Lionel Demery, Giovanna Prennushi andMichael Walton. Julie Williams provided very able assistance. These are the views of the authorsand should not be attributed to the World Bank or any affiliated organization. Address forcorrespondence: [email protected] or (until 8/2000): Martin Ravallion, ARQADE,Université des Sciences Sociales, Manufacture des Tabacs, 21 Allée de Brienne, 31 000Toulouse, France.

2
1. Introduction
This paper tries to assess progress in reducing consumption poverty in the
developing and transition economies in 1987-98. We consider various definitions of
what it means to be “poor”. One definition says that someone is poor if she lives in a
household with a per capita expenditure (whether in cash or kind) that is insufficient
when judged by what “poverty” typically means in the world’s poorest countries. This
definition judges poverty by standards common in South Asia and much of Sub-Saharan
Africa, no matter where one actually lives.
We also consider two broader definitions. In one, we count as poor all those who
would be judged so by standards more typical of developing countries in East Asia
(except China), North Africa, and poorer countries in Eastern Europe and Central Asia.
In another definition, we say someone is poor if she would probably be judged so if
living in the poorest countries, or if she has an unusually low consumption level relative
to others in the actual country of residence.
While we try to be eclectic about the definition of consumption poverty, we
recognize that there are limitations of all our definitions — limitations that we cannot do
anything about with the data available. Potentially important examples are the fact that
our definition of poverty does not directly reflect inequality within the household, and
that differences in command over non-market goods are ignored.
Implementing even our somewhat narrow definitions is nonetheless difficult
given the data available. Our assumptions in this paper closely follow those of Chen et
al., (1994) and Ravallion and Chen (1997), which provide more complete descriptions of
the pros and cons of the methods used. Here we focus on the differences with our past
3
methods, and present the main results of our up-date, drawing on new survey data and
new price data for exchange rate conversions.1 These estimates override all previous
estimates from this project, in that we have re-calculated everything back in time in the
light of the new data.
The next section describes country coverage of the data set we have constructed.
Section 3 describes the poverty line and exchange rates, while section 4 focuses on the
measures of poverty. Our main results for absolute poverty are discussed in section 5.
Section 6 tests their sensitivity to using instead a measure that takes account of relative
consumption when deciding who is poor. Section 7 discusses the proximate causes or
our main findings, drawing on other literature. Section 8 concludes.
2. Coverage of the data set
The first estimate under this project was for 1985 and was based on household
surveys for 22 countries, with an extrapolation model used for another 64 countries
(World Bank, 1990, Chapter 2; Ravallion et al., 1991). As more survey data became
available, the extrapolation model was dropped in favor of the assumption that the
average poverty rate for countries without distributional data equaled that for countries
with such data at the regional level; Chen et al., (1994) discuss this assumption further.
The first attempt to assess progress over time was Chen et al., (1994), which
provided estimates for 1985 and 1990 using data for 44 countries. The last up-date prior
to this paper used data from 122 surveys for 67 countries to make estimates for 1987,
1990 and 1993 (World Bank, 1996; Ravallion and Chen, 1997). The data set then
1 A web site is also in preparation that will give further details, including the individual countryestimates. The latest year’s estimates at country level are also published in the World Bank’sWorld Development Indicators (see, for example, World Bank, 2000a).
4
represented 85% of the population of the developing world (by which we mean Part 2
member countries of the World Bank). The present up-date provides estimates for 1987,
1990, 1993, 1996 and 1998 using distributions from 265 national surveys from 83
countries representing 88% of the total population of the developing world.
As in the past estimates, all poverty and inequality measures are estimated from
the primary (unit record or tabulated) survey data. Unlike all other compilations of
distributional data that we know of, no secondary sources are used; we have not used any
pre-existing estimates from other compilations or country studies. The measures of
household living standards are normalized by household size. The distributions are
weighted by household size and sample expansion factors (when relevant) so that a given
fractile (such as the poorest decile) should have the same share of the country-specific
population across the sample.2 The data come in various forms, ranging from micro data
to grouped tabulations; Chen et al. (1994) and Ravallion and Chen (1997) discuss our
estimation methods for grouped data.
As in past work, we have tried to eliminate any obvious comparability problems,
either by re-estimating the consumption/income aggregates or the more radical (though
thankfully not common) step of dropping a survey. However, there are comparability
problems that we cannot deal with; for example, it is known that differences in survey
method (such as in questionnaire design) and definitions can create non-negligible
differences in the estimates obtained for consumption or income. Aggregation will
presumably reduce these problems but any regional differences will remain.
2 It is still surprisingly common to mix household fractiles and person fractiles in data sets, andit is often unclear which is which; this matters since household size is negatively correlated withconsumption per person, and the size of this correlation varies from country to country.
5
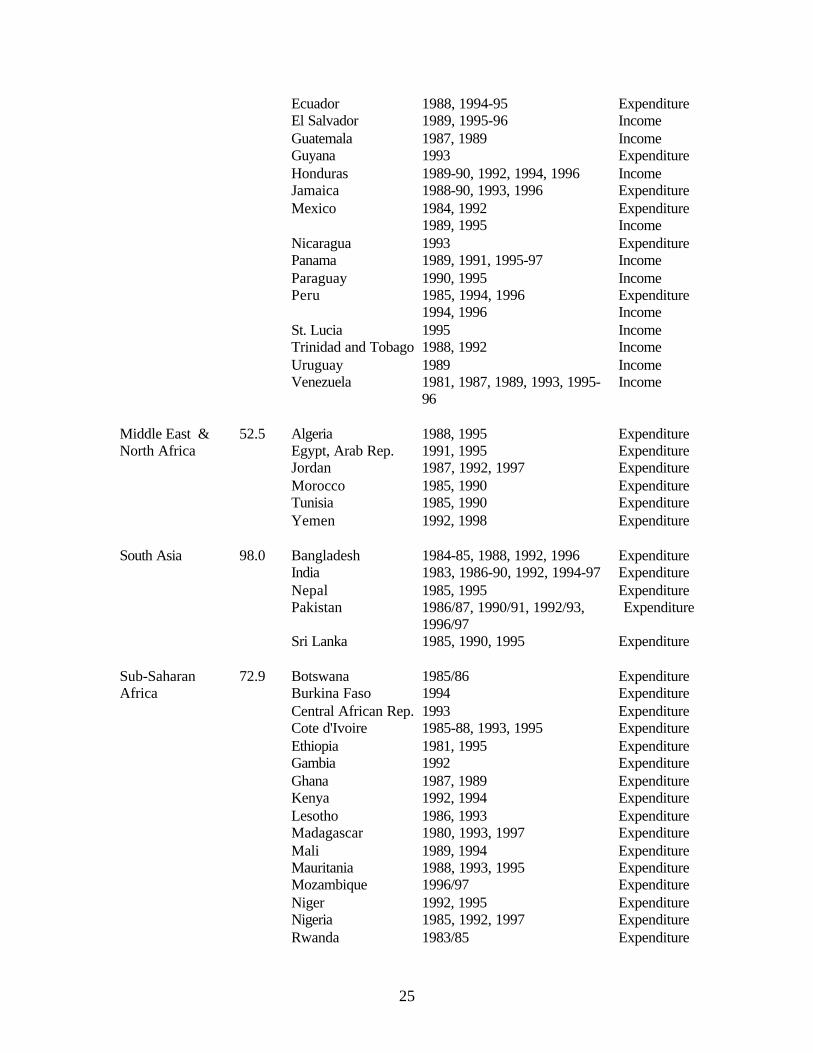
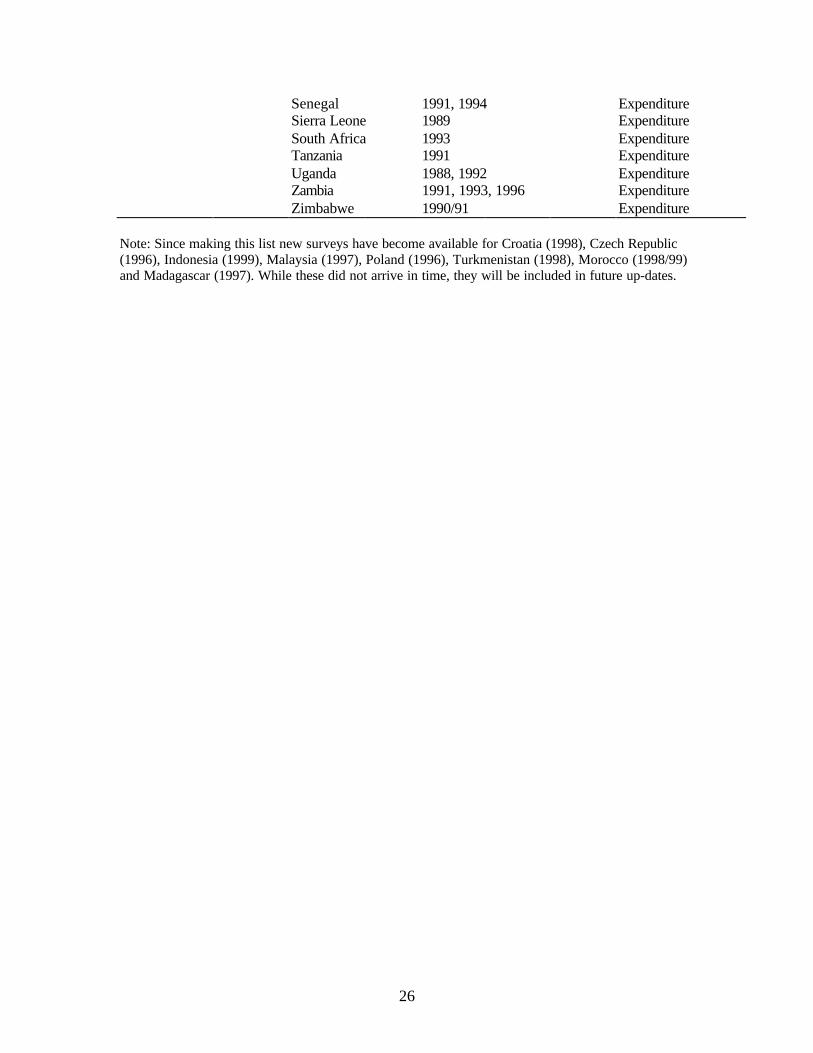
Table 1 lists the surveys used, with their dates and welfare indicators, and
population coverage. Coverage varies greatly by region, ranging from 53% of the
population of the Middle East and North Africa to 98% of the population of South Asia.
Not all of the surveys available were included. We also had access to survey data
for Cambodia, Croatia, Djibouti, Guinea, Guinea-Bissau, Papua New Guinea and
Vietnam, but data were missing on either the purchasing power parity exchange rates of
consumer price indices. (These data are discussed further in the next section.) We also
had surveys for Tanzania (1993) and Ghana (1992 and 1997) but we chose not to use
them because of serious comparability problems that we could not resolve satisfactorily.
3. Exchange rates and poverty lines
Past estimates used the Penn World Tables (PWT) as the source of Purchasing
Power Parity (PPP) exchange rates for consumption (Ravallion et al., 1991; Chen et al.,
1994; Ravallion and Chen, 1997). However, in this version of the data set we have
switched to the consumption PPP estimates produced by the World Bank, both because of
their availability and for consistency with other World Bank data. The Bank’s 1993 PPPs
are based on new price and consumption basket data collected by the 1993 International
Comparison Project (ICP) which covered 110 countries. PPPs from PWT 5.6 are based
on 1980s ICP data and covered only 60 countries. The two sets of PPPs are not
comparable with each other even for the same year.
The international poverty line in our past work was set at $1 per day at 1985 PPP.
We re-assessed this poverty line to be consistent with the 1993 PPP’s. The original
$1/day poverty line was chosen as being representative of the poverty lines found
amongst low-income countries (Ravallion et al., 1991). The same principle was applied
6
in up-dating the poverty line with the new PPPs. The equivalent line in 1993 PPP is
about $1.08 a day in 1993 price ($32.74 per month); this is the median of the lowest ten
poverty lines within the same set of countries used by Ravallion et al. (1991). This is the
main poverty line we will focus on here, and we will simply call it the $1/day line.3
We also re-ran the regression model for poverty lines reported in Ravallion et al.
(1991), using the new PPPs. That paper regressed the log of the country-specific poverty
line on a quadratic function of consumption per capita, also at PPP; we can re-write that
specification in the equivalent form:
εγβα iiii cc cc = z +−+−+ 2minmin )()(ln (i=1,..,n) (1)
where iz is the poverty line for country i with consumption per capita ic (with mincci ≥ ,
the lowest consumption per capita in the sample) in a sample of n countries while γβα ,,
are parameters we include a zero mean i.i.d. error term. Notice that the intercept in (1)
gives the lower bound to the log poverty line, for the poorest country in the sample.
We estimated equation (1) on the Ravallion et al., (1991) data set of poverty lines
for 33 countries (though one was dropped because the 1993 PPP rate was not available).
Our estimate of α was 3.46 (with a t-ratio of 40.5, based on the White standard error),
representing $1.05 per day ($31.96 per month), with a 95% confidence interval of ($0.88,
$1.24). (The regression coefficients on mean consumption and its squared value were
0.0040 and –1.56x10⁻⁶ with t-ratios of 6.54 and 2.81 respectively, and R2=0.88.) So our
$1.08 poverty line is a close approximation to the poverty line one would expect to find
in the poorest country. The fact that there is such close agreement between the estimated
3 The original “$ per day” line was also rounded off; it was actually $31 per month (Ravallion etal., 1991). Later this was changed to $30.42 per month (Chen et al. (1994).

7
intercept of equation (1) and the median poverty line amongst the poorest 10 countries in
this sample illustrates that the relationship is very flat amongst poor countries.
The poverty rate on this basis must thus be deemed a conservative estimate,
whereby aggregate poverty in the developing world is defined by perceptions of poverty
found in the poorest countries. We also give results for twice this line (to give a poverty
line more typical of low-middle income countries), as well as a relative poverty line,
which varies with mean consumption in the country of residence. Naturally these give
higher estimates of the extent of poverty, though our main concern here is with how
much impact they have on our assessment of the extent of progress in reducing poverty.
4. Measuring absolute consumption poverty
In keeping with past work, we measure poverty in terms of household
consumption expenditure per capita. Of the 265 surveys, 181 allow us to estimate the
distribution of consumption expenditures; this is true of all the surveys used in the Middle
East and North Africa, South Asia and Sub-Saharan Africa (Table 1). For about one
quarter of the cases in which we do not have consumption distributions we do have
survey-based estimates of mean consumption, in which case we replace the income mean
by the consumption mean. (There is however no obvious basis for adjusting the Lorenz
curve; one expects higher inequality in an income distribution than a consumption
distribution for the same place and data.) When only an income distribution is available,
we follow past practice of re-scaling mean income by one minus the national saving rate.4
4 We also re-estimated the poverty measures without this assumption; our main findings ontrends over time and regional comparisons are unaffected; the main quantitative effect is todecrease the poverty rate in Latin America (for which income distributions are more commonthan other regions) by a few percentage points. Details are available from the authors.
8
Having converted the international poverty line to local currency at PPP in 1993
we convert to the prices prevailing at each survey date using the country-specific official
Consumer Price Index (CPI). The weights in this index may or may not accord well with
consumer budget shares at the poverty line. In periods of relative price shifts, this will
bias our comparisons of the incidence of poverty over time, depending on the extent of
utility-compensated substitution possibilities for the people at the poverty line.
To estimate regional poverty at a given reference year (1996, say) we "line up"
the surveys in time using the same method described in Chen et al., (1994) and Ravallion
and Chen (1997). Within 83 countries in our data set, 17 have only one survey; 31 have
two surveys and 35 have three or more surveys over the period 1980 to 1998. If there is
only one survey for a country, then we estimate measures for each reference year by
applying the growth rate in real private consumption per person from the national
accounts to the survey mean — assuming in other words that the Lorenz curve for that
country does not change.5 When the reference date (1993 say) is between two surveys
(1989 and 1995 say), we do the following. We first estimate the mean consumption at the
reference year using the NA growth rate between the survey year and the reference year.
Based on the example here, we have two means at the reference year based on two
surveys, M93(89) and M93(95) where M93(t) is the estimated mean for 1993 using the
survey for year t. Then we calculate the mean at the reference year M93 using a time
weighted average of M93(89) and M93(95). Next we estimate the poverty rate at the
reference year. Based on the 1989 distribution and M93, we get the H93(89). Similarly,
5 For some countries (Kazakhstan, Kyrgyz, Latvia, Lithuania, Moldova, Turkmenistan) the NAconsumption data was incomplete. Then we used instead the GDP per capita growth rate.
9
based on the 1995 distribution and M93, we get H93(95). Then the poverty headcount for
1993 is the simple average of H93(89) and H93(95).
We had not originally planned making an estimate for 1998, but we wanted to see
how much impact the East Asia crisis might have had. The estimate for 1998 is naturally
the weakest; we only have actual 1998 surveys for China, Russia, Thailand, Belarus,
Latvia, Yemen, and 1997 surveys for India, Jordan, Nigeria, Panama and Pakistan. For
other countries, the calculated poverty measures assume that the distribution is
unchanged, and adjust mean consumption by applying the private consumption growth
rate between the latest survey date and 1998. Given the weaker coverage, we call the
1998 estimate “preliminary” (though there is a sense in which this is true of the estimates
for all years, which, as in the past, we will up-date in the future as new data are obtained).
5. Results
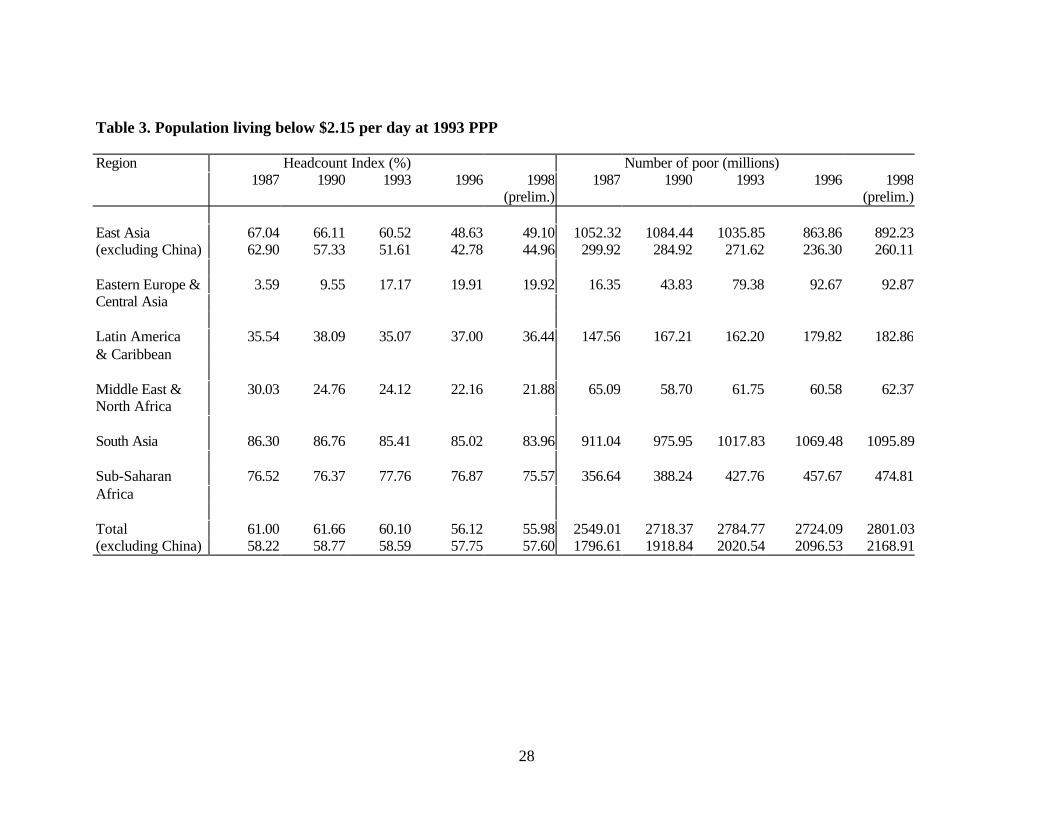
Table 2 gives our estimates of the headcount indices for $1.08 at 1993 PPP. Table
3 gives the results for twice this poverty line.
There are some notable differences with our previous estimates. Comparing the
most recent common year (1993), we estimate a slightly lower aggregate headcount index
(28.2% below $1 per day, versus 29.4% in Ravallion and Chen, 1997). But there are
some notable differences in the regional composition of poverty. The estimated poverty
rate for 1993 has risen sharply in Sub-Saharan Africa (49.7%, versus 39.1% in Ravallion
and Chen), but fallen sharply in Latin America (15.3% versus 23.5%) and the Middle
East and North Africa (1.9% versus 4.1%), with small declines in South Asia (42.4%
versus 43.1%) and East Asia (25.2% versus 26.0%), and a small increase in Eastern
Europe and Central Asia (4.0% versus 3.5%). While there have been many changes in
10
the survey data available, these changes in the estimated regional composition of
aggregate poverty are largely due to the changes in PPP exchange rates.
The new estimates suggest that the aggregate poverty rate has fallen over the
period, from 28.3% of the 1987 population living in households with consumption per
capita below $1 per day to 24.0% in 1998. Over the longest comparable period (1987-
1993) our new results suggest less progress in reducing poverty. (In Ravallion and Chen,
1997, we found that the aggregate poverty rate fell by 4% from 30.7% in 1987 to 29.4%
in 1993; over the same period, we find less than a 1% decline.) This reflects the higher
share of poverty attributed to Sub-Saharan Africa, where (by both sets of estimates) the
poverty rate increased over the period 1987-93.
In common with past estimates, we find however that the decrease in the average
poverty rate was not sufficient to reduce the aggregate number of poor, with 1.2-1.3
billion people living below $1 per day line. If we exclude China, the total number of
poor has risen steadily over the period (Table 2).
We find that the trend reduction in poverty in East Asia reversed at the time of the
crisis. The aggregate change is small — a 0.4 percentage point increase in the proportion
of the population living under $1 per day in the region. However (in common with most
other assessments of the welfare impact of such crises), this “before-after” comparison
does not take account of what the poverty rate in the region would have been without the
crisis. The counter-factual increase is clearly larger, given the progress prior to 1998.
To assess the counter-factual we forecast forward from the data prior to the crisis.
In particular, we fit a least squares line through the data for East Asia prior to the crisis,
and use this to predict what the incidence of poverty would have been in 1998 without the
11
crisis. This assumes that the pre-crisis pace of poverty reduction would have been
sustainable without the crisis. We ignore any impacts on China’s poor; the welfare impact
of the crisis on China was thought to be small at the time, and this is consistent with the
fact that 76% of the increase in the number of people living under $1 per day in the
region was outside China (Table 2). Fitting a linear trend to the $1 per day poverty rates
for 1987-96 for East Asia (excluding China) one obtains an estimate of 7.42% for the
headcount index in 1998 (with a standard error of 1.06).6 Comparing this to the estimate
for 1998 in Table 2 suggests that the crisis increased the incidence of poverty in the
region (excluding China) by four percentage points, representing 22 million people —
more than twice the impact suggested by the “before-after” comparison. The aggregate
number of poor (over all regions) rose by eight million (Table 2). So this assessment of
the counter-factual suggests that we would have seen a continuing decrease in the number
of poor in the developing world after 1993 if not for the East Asia crisis.
Performing the same calculation for the $2 poverty line, the projected poverty rate
for 1998 is 39.34% (standard error of 1.36), as compared to the figure of 44.96% in Table
3. Thus the number of people living under $2 per day would have fallen by an extra 33
million without the East Asia crisis. Unlike the $1 line, this would not have been
sufficient to achieve a reduction in the aggregate number of poor in 1998, which rose by
more than 33 million when compared to 1996 (Table 3).
These calculations must be treated with some caution. For example, it should be
recalled that for many countries the 1998 estimate is a distribution-neutral extrapolation;
if distribution improved (worsened) in the crisis, these calculations will over- (under-)
6 The regression line is 7.42–1.49(year–1998) with t-ratios of 7.01 and –10.26 (significant at the2% and 1% levels respectively); the R-squared is 0.98.
12
estimate its impact relative to the counter-factual. There is no obvious basis for a
judgement of the likely bias, from the evidence available.7 Nor can we be sure that the
pre-crisis rate of growth would have continued if there had been no crisis (though the
high growth rates were not widely thought to be unsustainable at the time).
Turning to other regions, we find a trend increase in poverty in Eastern Europe
and Central Asia. The number of people in this region estimated to live below the $1 per
day line increased from 1 million to 24 million over this period. Over the whole period,
the poverty rate has changed little in Latin America and the Caribbean, though there are
signs of a small net gain to the poor in the 1990s. There is a marked fall in the incidence
of poverty in the Middle East and North Africa, though most of this was in the late 1980s.
There is a trend decrease in the poverty rate in South Asia, with a five percentage- point
drop in the percentage of the population living under $1 per day. This was not enough to
prevent rising total number of poor in this region. There was no net reduction in the
poverty rate of Sub-Saharan Africa over the period.
Throughout the period, the region with the highest poverty incidence relative to
the $1 per day line is Sub-Saharan Africa, followed closely by South Asia, though the
ranking reverses if one uses the “$2” poverty line in Table 3. Together these two regions
accounted for 68% of those living below $1 per day in 1998, up from 58% in 1987; six
percentage points of this increase was in Sub-Saharan Africa, which accounted for 24%
of the poor in 1998 by this measure, up from 18% in 1987.
East Asia came third in terms of the incidence of poverty initially, but its rapid
reduction in poverty (up to the crisis) meant that Latin America overtook it in the mid-
7 World Bank (2000b) present evidence of a decrease in inequality in Indonesia during the 1998crisis, but there was a small increase in (urban) inequality in Korea and Thailand.
13
1990s. Eastern Europe and Central Asia started the period as the region with the lowest
poverty incidence, but by the end of the period it had overtaken Middle-East and North
Africa, though this is not robust to the choice of poverty line (comparing Tables 2 and 3).
Comparing Tables 2 and 3 we see sizable differences in how much doubling the
poverty line adds to the headcount index. This has bearing on the poverty impact of
consumption growth. From Tables 2 and 3 we can calculate the percentage reduction in
the $2 per day headcount index from a doubling of mean consumption holding the Lorenz
curve constant.8 The aggregate impact is a 57% reduction. The lowest impact is in Sub-
Saharan Africa for which the $2 poverty rate falls by 39%, and the highest is Middle East
and North Africa, where it falls by 91%. Between these extremes, a doubling of mean
consumption reduces the $2 poverty rate by 69% in East Asia, 74% in Eastern Europe
and Central Asia, 57% in Latin America, and 52% in South Asia.
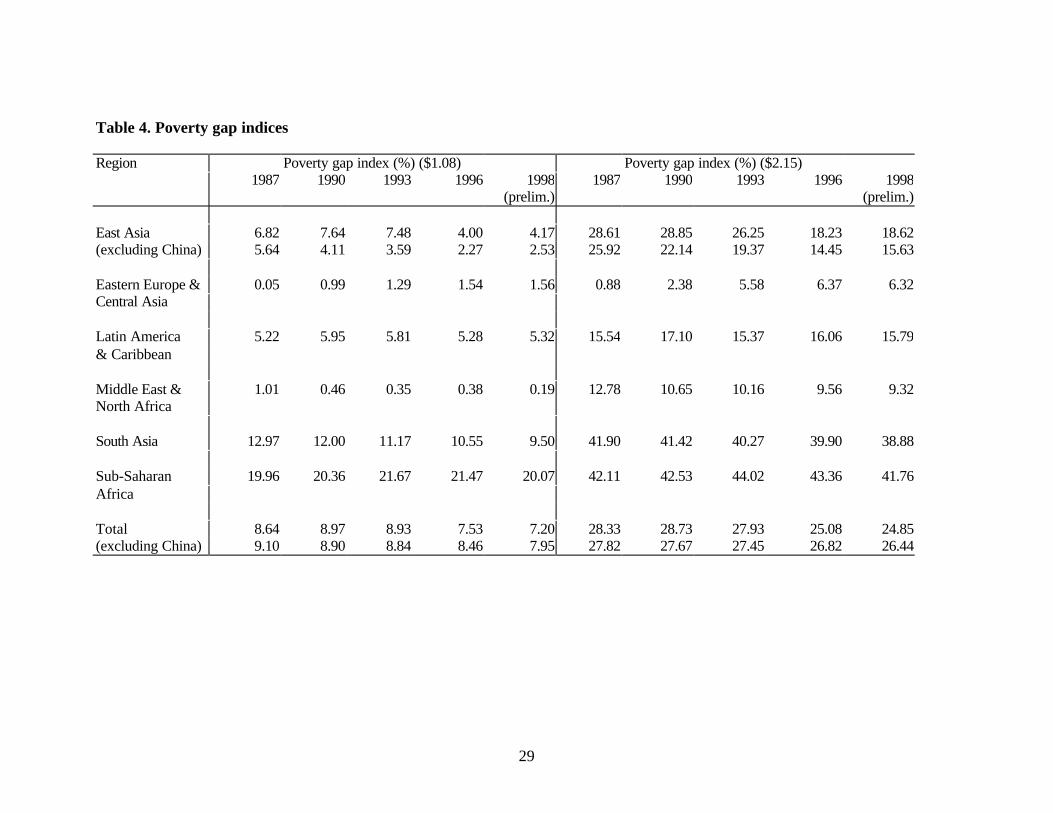
Table 4 gives the poverty gap indices; these follow a similar pattern to the
headcount indices.9 The regional rankings are identical to the headcount index, but there
are some differences in magnitudes. The most notable is the proportionately larger
difference in the poverty gap index between Sub-Saharan Africa and South Asia;
although the headcount index is only slightly higher in Africa, the poverty gap index for
the $1 per day line is far higher.
Thus there is greater depth of poverty in Africa, suggesting that (unless inequality
falls) it will take more growth to have the same proportionate impact on Sub-Saharan
Africa’s poverty gap as South Asia’s, similarly to what we found for the headcount index.
8 This calculation uses the fact that the headcount index is homogeneous of degree zero betweenthe mean and the poverty line, holding the Lorenz curve constant.9 The poverty gap index is mean distance below the poverty line where the mean is taken overthe whole population, counting the non-poor as having zero poverty gap.
14
This is borne out by the Kakwani (1993) elasticities of the poverty gap index to
distribution-neutral growth, which are –1.31 for Sub-Saharan Africa versus –3.21 in
South Asia (for the $1 per day line in 1998).10 The corresponding elasticities for other
regions are –2.67 for East Asia (–3.45 excluding China), –2.29 for Eastern Europe and
Central Asia, –1.93 for Latin America, –9.26 for the Middle East and North Africa
(though this is deceptive, given that proportionately fewer people live below the $1 per
day line in this region; using the $2 line the elasticity falls sharply, to –1.35). The overall
elasticity for the developing world is –2.33. This has changed little over time (the value
for 1987 is –2.28), and it has also proved quite resistant to changes in the data and
assumptions (the first estimate for 1985 was –2.2; see Ravallion et al., 1991).
Poverty-gap comparisons over time are also similar to the headcount index. One
noticeable difference is how much faster this index of poverty has fallen in South Asia
than the headcount index; over the period 1987-98 we find a 27% drop in South Asia’s
poverty gap index for the $1 per day line, versus 11% for the headcount index.
6. Allowing for low relative consumption
So far we have aimed to treat the same consumption level (at PPP) the same way
no matter what country a person lives in. It has been argued that this does not capture
relative deprivation, such that a poor person needs higher consumption when living in a
rich country, so as to participate fully in that society.
While one might accept this point in principle, it is far from clear how exactly one
should implement it empirically. A common practice in measuring poverty in OECD
10 The elasticity of the poverty gap index (PG) to growth in the mean holding the Lorenz curveconstant is 1–H/PG, where H is the headcount index (Kakwani, 1993).
15
countries is to use a poverty line that is half of mean income in each country (Atkinson,
1998 and Smeeding, 1997). However, this would entail counting people as not being
poor in poor countries even though they fall below prevailing poverty lines in those
countries. One could instead draw on the poverty measures that are actually used in the
countries concerned. (World Bank, 2000a, provides a compilation from the World Bank’s
own poverty assessments.) However, this raises further concerns about comparability in
the country-specific welfare indicators used; some countries prefer income, some
consumption, for example. And the measures do not line up in time. Yet another option is
to use the poverty lines actually found in country studies, but apply them to our
distributional data. However, there are clearly idiosyncratic factors in these poverty lines;
they are often geared to specific features of the welfare indicator used, and they are not
immune from local political manipulation. A more attractive option might be to adjust the
poverty line according to equation (1).11 However, while this equation makes sense as a
basis for estimating the expected poverty line in the poorest country, it is not the most
obvious way one can think about setting relative poverty lines.12
Atkinson and Bourguignon (1999) propose an alternative approach in which the
poverty line is $1/day in the poorest country but does not rise with average consumption
until it reaches a critical value, after which it rises proportionately to consumption. They
derive this specification by assuming that a person is deemed poor if she does not attain
11 In comments on Ravallion et al., (1991), the late Bela Balassa suggested that equation (1)should be used for this purpose. The suggestion was never pursued, on the grounds that the focusshould remain absolute poverty in terms of consumption. Of course, if instead one definesabsolute poverty in the space of utility and assumes that utility depends on both own consumptionand relative consumption then it is easy to see that the consumption poverty line will rise withmean consumption (Ravallion, 1998). A similar argument can be made in the space ofcapabilities, following Sen (1985).

16
either the $1 per day consumption level (loosely interpretable as physical needs), or a
given proportion of mean consumption (“social needs”).
In principle one can also generate a smooth convex curve such as in equation (1)
by allowing for a list of social needs, each proportional to consumption, but at different
rates. Then the Atkinson-Bourguignon specification will be smoothed out, depending on
how many of these needs there are. With this extension to their model one can also
rationalize the type of smooth convex model in Ravallion et al (1991) and Ravallion
(1998). However, the Atkinson-Bourguignon proposal offers a more intuitive and
parsimonious representation of the relationship than equation (1), and fits the data quite
well, with a sum of squared residuals only slightly higher than the specification in
equation (1).
We chose a slightly modified version of the Atkinson-Bourguignon specification
in measuring relative poverty in this section. In particular, we assume that to be deemed
“not poor” a person must meet both the “$1 per day” absolute consumption standard and
consume more than some proportion of the mean consumption in the country of
residence. We set the constant of proportionality to avoid social exclusion at one third;
this gave the best fit to the data used in setting the $1.08 poverty line.13 The poverty line
in $’s per day at 1993 PPP for any country is then given by )3/,08.1max($ ic where c is
mean consumption per capita in 1993 at 1993 PPP.14
12 The elasticity of the poverty line to mean consumption is unbounded above using equation (1).However, unity would seem a plausible upper bound.13 By eye-balling the data, Atkinson and Bourguignon chose a slope of 0.37, based on theRavallion et al., (1991) data. On the new 1993 PPP rates, a slope of one in three fits the dataslightly better in terms of the sum of squared errors (based on a line search at 0.01 intervalsbetween 0.30 and 0.50).14 Countries in a neighborhood of the kink (+/- 15% of $3.23 consumption per day in 1993)include Cote d’Ivoire, Gambia, Ghana, Moldova, Pakistan, Senegal, and Zimbabwe.
17
However, we do not change the real value of the poverty line over time in any
given country. If we did, then for those countries with mean consumption above $3.24
per day, the poverty measures would then be independent of absolute levels of
consumption (an depend solely on the percentile of the population for which the Lorenz
curve as a slope of 1/3). Furthermore, while less poor countries tend to have higher
poverty lines, it appears to be rare to observe changes (in either direction) in the real
value of the poverty line in developing countries with changes in average consumption
over the length of time we are considering here.
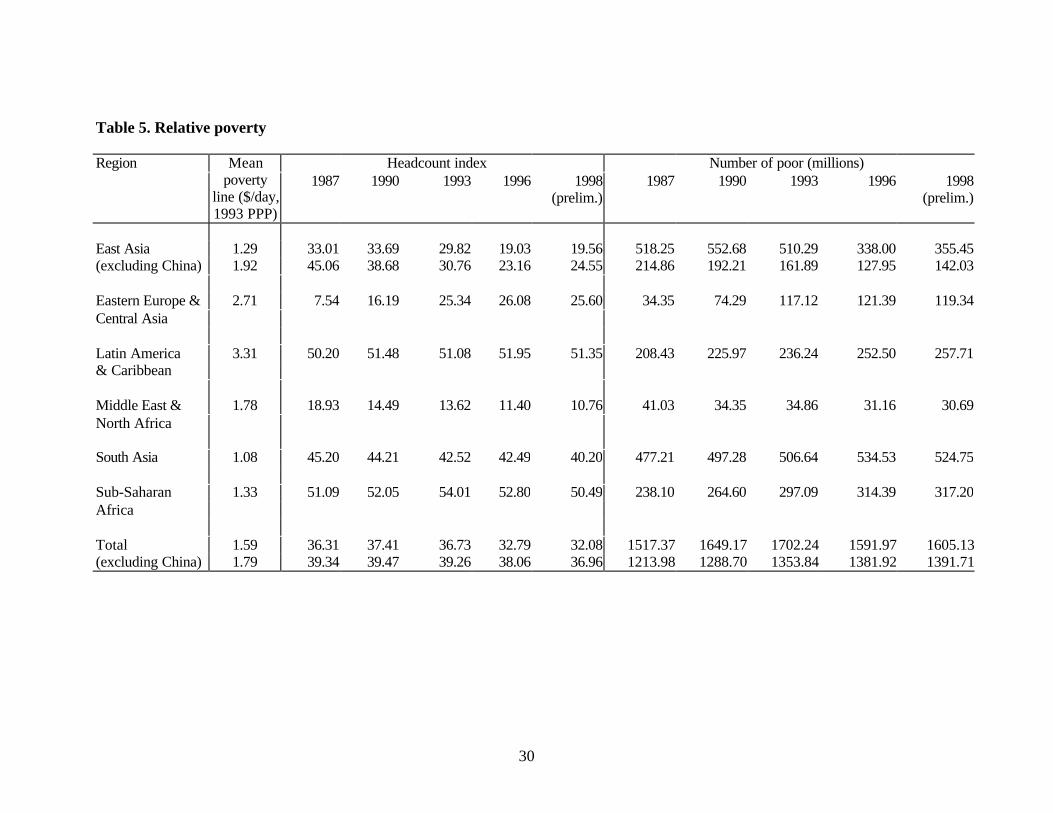
Table 5 gives the results. As one would expect the poverty rate rises sharply in
East Asia (outside China), Eastern Europe and Central Asia, Latin America, and the
Middle East and North Africa. The overall headcount of the poor rises to 1.6 billion.
Trends over time are little affected.
The greatest proportionate impacts on the headcount index of allowing for low
relative consumption are for the Middle East/North Africa and Eastern Europe/Central
Asia. However, the impact on Latin America and the Caribbean is probably more notable
because this region now emerges as the one with the highest incidence of poverty, with
slightly over half the region’s population live in poverty by this definition. The mean
poverty line for Latin America is three times the $1.08 line (Table 5).15 With this
magnitude of upward adjustment to the poverty line it is not surprising that this region
overtakes South Asia and Sub-Saharan Africa. Of course, as one can already guess from
Table 3, much more than half of the populations of South Asia and Africa live below
Latin America’s mean poverty line.
15 We present the (population-weighted) mean poverty lines in Table 5 for expository purposesonly; country-specific poverty lines were used for the calculations.
18
7. Why was there not more progress against poverty?
In the aggregate, and for some large regions, all our measures suggest that the
1990s did not see much progress against consumption poverty in the developing world.
Yet this was a period of aggregate economic growth; the overall rate of growth in real per
capita private consumption for the low- and middle-income countries over 1990-97 was
2.6% per year (World Bank, 2000a). The elasticity of the aggregate ($1/day) poverty gap
in 1987 was –2.3. Even assuming no growth from 1987 to 1990, an annual rate of growth
in mean consumption of 2.6% over 1990-97 alone would have virtually halved the
aggregate poverty gap, as long as overall inequality did not worsen.
What went wrong? Rising inequality was one factor. As the first paper from this
project showed (Ravallion, et al., 1991), the world distribution of consumption in 1985
was such that it would not take much of an increase in overall inequality to wipe out the
benefits to the world’s poor of modest growth in consumption per capita. The simulations
in Ravallion et al. (1991) indicated that about a four percent increase in the world’s Gini
index, spread over 15 years from 1985, would be sufficient to wipe out the gains to the
poor from a sustained one percent per annum rate of growth in consumption per capita.16
There is now evidence of quite sharply rising inter-personal income inequality in the
world during this period; Milanovic (1999) estimates that the world Gini index increased
by 5% between 1988 and 1993 (from 0.63 to 0.66). This could easily wipe out the gains
to the world’s poor from global economic growth.
16 The simulations assumed that the world Lorenz curve shifts out by an equal proportion at allpoints (following the assumption made by Kakwani, 1993).
19
Why was world inequality rising? Very few individual countries have
experienced a trend increase in inequality over the longer term (a few decades, say)
(Bruno et al., 1998).17 Over shorter periods (one to five years) one finds rising inequality
in about half the developing countries, though this is uncorrelated with growth rates in
average household consumption per capita (Ravallion and Chen, 1997).
The more important factor in rising global inequality has been rising inequality
between countries. This accounts for three-quarters of the increase in the world Gini
index from 1988 to 1993 (Milanovic, 1999). The unconditional growth divergence we
have seen in the 1980s and 1990s — whereby growth rates have tended to be lower in
poorer countries (Pritchett, 1997) — appears to be a far more important reason for the
low rate of aggregate poverty reduction than rising inequality within poor economies.
Nonetheless, even when it is not rising, inequality within countries is an important
constraint on prospects for pro-poor growth. There is evidence that the same rate of
growth can have very different impacts on absolute consumption poverty (Ravallion,
1997). Differences in the growth elasticities of absolute poverty appear to arise in large
part from initial inequalities in incomes, education attainments and other dimensions
(including geographic differences within countries). Indeed, there is evidence that initial
inequality is too high in some countries to assure poverty-reducing growth even when the
fundamentals are conducive to growth (Ravallion, 1997).18
While Sub-Saharan Africa is certainly not the only place where inequality
impedes pro-poor growth, the depth of poverty (even relative to its high incidence) in that
17 China is one of the few cases of steadily rising inequality since the mid-1980s, though givenits population weight, this is an important exception.18 On the role of inequalities in both non-income dimensions in inhibiting pro-poor growth seeRavallion and Datt (1999) (using data for India).
20
region carries a warning for the future. Africa will probably need a higher growth rate
than South Asia (where the incidence of poverty is currently only slightly lower than
Africa) to achieve the same rate of poverty reduction in the coming years. Yet private
consumption per capita contracted in Sub-Saharan Africa over 1990-97 (at –1.2% per
year, versus 2.6% growth for low and middle income countries as a whole; World Bank,
2000a).
8. Conclusions
We have provided new estimates of the extent and depth of absolute consumption
poverty in the developing world, and the incidence of relative consumption poverty, over
1987-98. In measuring absolute consumption poverty we have followed past practice in
using an international poverty line that accords with an idea of “poverty” typical of the
poorest countries. This gives a poverty line of about $1 per day, though we have also
considered a line arbitrarily set at twice this value. In estimating the incidence of relative
consumption poverty, we also count as poor people who consumed more than $1 per day
but less than one third of mean consumption in their country of residence. We have
drawn on new household survey and price data, and all past estimates from this project
have been revised in the light of the new data.
We find that the percentage of the population of the developing world living
below $1 per day in 1998 was 24%, about four points lower than 1987. Factoring in our
allowance for low relative consumption brings the incidence of poverty in 1998 up to
32%, also four percentage points lower than in 1987. The total number of poor was about
the same at the end of this period as the beginning. Roughly 1.2 billion people lived
below $1 per day, while a further 0.4 billion consumed more than this amount, but less
21
than one third of the mean in their country of residence. Between 1993 and 1998 we did
see a fall in the number of poor, by about 100 million; this is largely accountable to a
sharp decline in the number of people consuming less than $1 per day in China.
Without the East Asia crisis, a continuation of the trend decline in poverty in East
Asia would have meant a slightly lower number of people living below $1 per day in the
1998 than 1987. However, even factoring out the effect of the crisis, the number living
below $2 per day rose over the period.
These aggregates hide diverse experiences over time and across regions. Only two
regions saw falling numbers of consumption poor, namely East Asia (though with a
reversal due to the crisis) and the Middle East and North Africa. The proportion of people
living below $1 per day fell steadily in South Asia, but not enough to prevent rising
numbers of poor. The proportion fell in Sub-Saharan Africa after 1993, though again not
enough to prevent rising numbers of poor. The poverty rate fluctuated with no clear trend
in Latin America. And it rose dramatically in Eastern Europe and Central Asia, though
from a low base by the standards of what poverty means in poor developing countries.
Drawing on other literature, we have suggested two proximate causes of the low
overall rate of poverty reduction in the 1990s, despite aggregate economic growth in the
developing world. Firstly, too little of that economic growth was in the poorest countries.
Secondly, persistent inequalities (in both income and non-income dimensions) within
those countries and elsewhere prevented the poor from participating fully in the growth
that did occur.
22
References
Atkinson, A.B., Poverty in Europe. Oxford: Blackwell, 1998.
Atkinson, A.B., and Bourguignon, F., Poverty and Inclusion from a World
Perspective. Paper prepared for the World Bank’s ABCDE Europe
Conference, Paris, 1999.
Bruno, M., Ravallion, M., and Squire L., Equity and Growth in Developing Countries:
Old and New Perspectives on the Policy Issues, in Income Distribution and High-
Quality Growth (edited by Vito Tanzi and Ke-young Chu), Cambridge, Mass:
MIT Press, 1998.
Chen, S., Datt, G., and Ravallion, M., Is Poverty Increasing or Decreasing in the
Developing World?, Review of Income and Wealth, 40, 359-376, 1994.
Kakwani, N., Poverty and Economic Growth with Application to Côte D’Ivoire,
Review of Income and Wealth 39, 121-139, 1993.
Milanovic, B., True World Income Distribution: 1988 and 1993: First
Calculations Based on Household Surveys Alone, mimeo, World Bank,
1999.
Pritchett, L., Divergence, Big Time, Journal of Economic Perspectives 11, 3-17,
1997.
Ravallion, M., Can High Inequality Developing Countries Escape Absolute
Poverty? Economics Letters 56, 51-57, 1997.
___________, Poverty Lines in Theory and Practice, Living Standards
Measurement Study Working Paper 133, World Bank, Washington DC.,
1998.
23
Ravallion, M. and Chen, S., What Can New Survey Data Tell Us about Recent
Changes in Distribution and Poverty?, World Bank Economic Review,
11(2), 357-82, 1997.
Ravallion, M. and Datt, G., When is Growth Pro-Poor? Evidence from the Diverse
Experience of India’s States”, Policy Research Working Paper WPS 2263, World
Bank, 1999.
Ravallion, M., Datt, G., and van de Walle, D., Quantifying Absolute Poverty in
the Developing World”, Review of Income and Wealth 37, 345-361, 1991.
Sen, Amartya K., Commodities and Capabilities, Amsterdam: North-Holland, 1985.
Smeeding, T., Poverty in Developed Countries: The Evidence from the
Luxembourg Income Study, in Human Development Papers, New York:
United Nations Development Programme.
World Bank, World Development Report, New York: Oxford University Press,
1990.
_________, Poverty Reduction and the World Bank: Progress and Challenges in the
Early 1990s, Washington DC., World Bank, 1996.
_________, World Development Indicators, Washington DC: World Bank, 2000a.
_________, Global Economic Prospects and the Developing Countries, Washington
DC: World Bank, 2000b.

24
Table 1. Coverage of the Data Set
Region % of 1998population
Country Survey dates Welfare indicator
represented
East Asia 90.8 China 1985, 1990, 1992-1998
Income
Indonesia 1984, 1987, 1990, 1993, 1996 ExpenditureKorea 1988, 1993 IncomeLaos 1992 ExpenditureMalaysia 1984, 1987, 1992, 1995 IncomeMongolia 1995 ExpenditurePhilippines 1985, 1988, 1991, 1994, 1997 ExpenditureThailand 1981, 1988 Income
1988, 1992, 1996, 1998 Expenditure
Eastern Europe 81.7 Albania 1997 Expenditure& Central Asia Belarus 1988, 1993, 1995, 1998 Income
Bulgaria 1989, 1992, 1994, 1995 ExpenditureCzech Republic 1988, 1993 IncomeEstonia 1988, 1993, 1995 IncomeHungary 1989, 1993 IncomeKazakhstan 1988, 1993 Income
1993, 1996 ExpenditureKyrgyz Republic 1988, 1993 Income
1993, 1997 ExpenditureLatvia 1988, 1993, 1995, 1998 IncomeLithuania 1988, 1993, 1994, 1996 IncomeMoldova 1988, 1992 IncomePoland 1985, 1987, 1989, 1993 Income
1990, 1992, 1993-96 ExpenditureRomania 1989, 1992, 1994 IncomeRussian Federation 1988, 1993 Income
1993, 1996, 1998 ExpenditureSlovak Republic 1988, 1992 IncomeSlovenia 1987, 1993 IncomeTurkey 1987, 1994 ExpenditureTurkmenistan 1988, 1993 IncomeUkraine 1988, 1992 Income
1995, 1996 ExpenditureUzbekistan 1988, 1993 Income
Latin America 88.0 Bolivia 1990 Income& Caribbean Brazil 1985, 1988-89, 1993, 1995-96 Income
Chile 1987, 1990, 1992, 1994 IncomeColombia 1988, 1991, 1995-96 IncomeCosta Rica 1986, 1990, 1993, 1996 IncomeDominican Republic 1989, 1996 Income
25
Ecuador 1988, 1994-95 ExpenditureEl Salvador 1989, 1995-96 IncomeGuatemala 1987, 1989 IncomeGuyana 1993 ExpenditureHonduras 1989-90, 1992, 1994, 1996 IncomeJamaica 1988-90, 1993, 1996 ExpenditureMexico 1984, 1992 Expenditure
1989, 1995 IncomeNicaragua 1993 ExpenditurePanama 1989, 1991, 1995-97 IncomeParaguay 1990, 1995 IncomePeru 1985, 1994, 1996 Expenditure
1994, 1996 IncomeSt. Lucia 1995 IncomeTrinidad and Tobago 1988, 1992 IncomeUruguay 1989 IncomeVenezuela 1981, 1987, 1989, 1993, 1995-
96Income
Middle East & 52.5 Algeria 1988, 1995 ExpenditureNorth Africa Egypt, Arab Rep. 1991, 1995 Expenditure
Jordan 1987, 1992, 1997 ExpenditureMorocco 1985, 1990 ExpenditureTunisia 1985, 1990 ExpenditureYemen 1992, 1998 Expenditure
South Asia 98.0 Bangladesh 1984-85, 1988, 1992, 1996 ExpenditureIndia 1983, 1986-90, 1992, 1994-97 ExpenditureNepal 1985, 1995 ExpenditurePakistan 1986/87, 1990/91, 1992/93,
1996/97Expenditure
Sri Lanka 1985, 1990, 1995 Expenditure
Sub-Saharan 72.9 Botswana 1985/86 ExpenditureAfrica Burkina Faso 1994 Expenditure
Central African Rep. 1993 ExpenditureCote d'Ivoire 1985-88, 1993, 1995 ExpenditureEthiopia 1981, 1995 ExpenditureGambia 1992 ExpenditureGhana 1987, 1989 ExpenditureKenya 1992, 1994 ExpenditureLesotho 1986, 1993 ExpenditureMadagascar 1980, 1993, 1997 ExpenditureMali 1989, 1994 ExpenditureMauritania 1988, 1993, 1995 ExpenditureMozambique 1996/97 ExpenditureNiger 1992, 1995 ExpenditureNigeria 1985, 1992, 1997 ExpenditureRwanda 1983/85 Expenditure
26
Senegal 1991, 1994 ExpenditureSierra Leone 1989 ExpenditureSouth Africa 1993 ExpenditureTanzania 1991 ExpenditureUganda 1988, 1992 ExpenditureZambia 1991, 1993, 1996 ExpenditureZimbabwe 1990/91 Expenditure
Note: Since making this list new surveys have become available for Croatia (1998), Czech Republic(1996), Indonesia (1999), Malaysia (1997), Poland (1996), Turkmenistan (1998), Morocco (1998/99)and Madagascar (1997). While these did not arrive in time, they will be included in future up-dates.
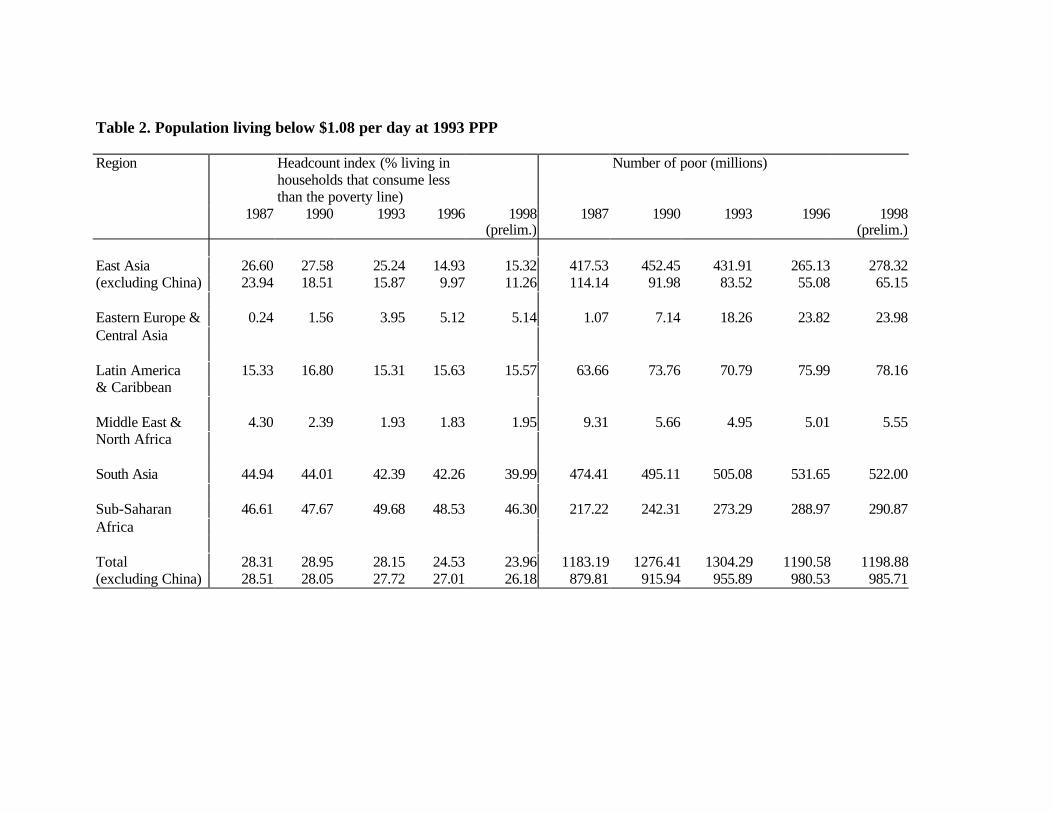
Table 2. Population living below $1.08 per day at 1993 PPP
Region Headcount index (% living inhouseholds that consume lessthan the poverty line)
Number of poor (millions)
1987 1990 1993 1996 1998(prelim.)
1987 1990 1993 1996 1998(prelim.)
East Asia 26.60 27.58 25.24 14.93 15.32 417.53 452.45 431.91 265.13 278.32(excluding China) 23.94 18.51 15.87 9.97 11.26 114.14 91.98 83.52 55.08 65.15
Eastern Europe & 0.24 1.56 3.95 5.12 5.14 1.07 7.14 18.26 23.82 23.98Central Asia
Latin America 15.33 16.80 15.31 15.63 15.57 63.66 73.76 70.79 75.99 78.16& Caribbean
Middle East & 4.30 2.39 1.93 1.83 1.95 9.31 5.66 4.95 5.01 5.55North Africa
South Asia 44.94 44.01 42.39 42.26 39.99 474.41 495.11 505.08 531.65 522.00
Sub-Saharan 46.61 47.67 49.68 48.53 46.30 217.22 242.31 273.29 288.97 290.87Africa
Total 28.31 28.95 28.15 24.53 23.96 1183.19 1276.41 1304.29 1190.58 1198.88(excluding China) 28.51 28.05 27.72 27.01 26.18 879.81 915.94 955.89 980.53 985.71
28
Table 3. Population living below $2.15 per day at 1993 PPP
Region Headcount Index (%) Number of poor (millions)1987 1990 1993 1996 1998
(prelim.)1987 1990 1993 1996 1998
(prelim.)
East Asia 67.04 66.11 60.52 48.63 49.10 1052.32 1084.44 1035.85 863.86 892.23(excluding China) 62.90 57.33 51.61 42.78 44.96 299.92 284.92 271.62 236.30 260.11
Eastern Europe & 3.59 9.55 17.17 19.91 19.92 16.35 43.83 79.38 92.67 92.87Central Asia
Latin America 35.54 38.09 35.07 37.00 36.44 147.56 167.21 162.20 179.82 182.86& Caribbean
Middle East & 30.03 24.76 24.12 22.16 21.88 65.09 58.70 61.75 60.58 62.37North Africa
South Asia 86.30 86.76 85.41 85.02 83.96 911.04 975.95 1017.83 1069.48 1095.89
Sub-Saharan 76.52 76.37 77.76 76.87 75.57 356.64 388.24 427.76 457.67 474.81Africa
Total 61.00 61.66 60.10 56.12 55.98 2549.01 2718.37 2784.77 2724.09 2801.03(excluding China) 58.22 58.77 58.59 57.75 57.60 1796.61 1918.84 2020.54 2096.53 2168.91
29
Table 4. Poverty gap indices
Region Poverty gap index (%) ($1.08) Poverty gap index (%) ($2.15)1987 1990 1993 1996 1998
(prelim.)1987 1990 1993 1996 1998
(prelim.)
East Asia 6.82 7.64 7.48 4.00 4.17 28.61 28.85 26.25 18.23 18.62(excluding China) 5.64 4.11 3.59 2.27 2.53 25.92 22.14 19.37 14.45 15.63
Eastern Europe & 0.05 0.99 1.29 1.54 1.56 0.88 2.38 5.58 6.37 6.32Central Asia
Latin America 5.22 5.95 5.81 5.28 5.32 15.54 17.10 15.37 16.06 15.79& Caribbean
Middle East & 1.01 0.46 0.35 0.38 0.19 12.78 10.65 10.16 9.56 9.32North Africa
South Asia 12.97 12.00 11.17 10.55 9.50 41.90 41.42 40.27 39.90 38.88
Sub-Saharan 19.96 20.36 21.67 21.47 20.07 42.11 42.53 44.02 43.36 41.76Africa
Total 8.64 8.97 8.93 7.53 7.20 28.33 28.73 27.93 25.08 24.85(excluding China) 9.10 8.90 8.84 8.46 7.95 27.82 27.67 27.45 26.82 26.44
30
Table 5. Relative poverty
Region Headcount index Number of poor (millions)Meanpoverty
line ($/day,1993 PPP)
1987 1990 1993 1996 1998(prelim.)
1987 1990 1993 1996 1998(prelim.)
East Asia 1.29 33.01 33.69 29.82 19.03 19.56 518.25 552.68 510.29 338.00 355.45(excluding China) 1.92 45.06 38.68 30.76 23.16 24.55 214.86 192.21 161.89 127.95 142.03
Eastern Europe & 2.71 7.54 16.19 25.34 26.08 25.60 34.35 74.29 117.12 121.39 119.34Central Asia
Latin America 3.31 50.20 51.48 51.08 51.95 51.35 208.43 225.97 236.24 252.50 257.71& Caribbean
Middle East & 1.78 18.93 14.49 13.62 11.40 10.76 41.03 34.35 34.86 31.16 30.69North Africa
South Asia 1.08 45.20 44.21 42.52 42.49 40.20 477.21 497.28 506.64 534.53 524.75
Sub-Saharan 1.33 51.09 52.05 54.01 52.80 50.49 238.10 264.60 297.09 314.39 317.20Africa
Total 1.59 36.31 37.41 36.73 32.79 32.08 1517.37 1649.17 1702.24 1591.97 1605.13(excluding China) 1.79 39.34 39.47 39.26 38.06 36.96 1213.98 1288.70 1353.84 1381.92 1391.71