how consumer choice is changing the uk energy system · how consumer choice is changing the uk...
TRANSCRIPT
People powerHow consumer choice is changing the UK energy system
© Green Alliance 2017
Green Alliance’s work is licensed under a Creative Commons Attribution-Noncommercial-No derivative works 3.0 unported licence. This does not replace copyright but gives certain rights without having to ask Green Alliance for permission.
Under this licence, our work may be shared freely. This provides the freedom to copy, distribute and transmit this work on to others, provided Green Alliance is credited as the author and text is unaltered. This work must not be resold or used for commercial purposes. These conditions can be waived under certain circumstances with the written permission of Green Alliance. For more information about this licence go to http://creativecommons.org/licenses/by-nc-nd/3.0/
People powerHow consumer choice is changing the UK energy system
by Caterina Brandmayr, Dustin Benton, Anisha George and Chaitanya Kumar
Green AllianceGreen Alliance is a charity and independent think tank focused on ambitious leadership for the environment. We have a track record of over 35 years, working with the most influential leaders from the NGO, business, and political communities. Our work generates new thinking and dialogue, and has increased political action and support for environmental solutions in the UK.
AcknowledgementsWith thanks to Matthew Lockwood, Phil Lawton, Nick Eyre, Seb Henbest, Keith MacLean, Steve Pye, Philip Baker, Andreas Jahn, Richard Sedano and Jim Lazar for their advice.
We are grateful to the Green Alliance Low Carbon Energy consortium for supporting this work
Green Alliance11 Belgrave Road London SW1V 1RB 020 7233 7433
[email protected]: greenallianceblog.org.uktwitter: @GreenAllianceUK
The Green Alliance Trust Registered charity no. 1045395 Company limited by guarantee (England and Wales) no. 3037633Registered at the above address
Published by Green Alliance April 2017ISBN 978-1-909980-85-3
Designed by Howdy
1
Contents
Executive summary 2
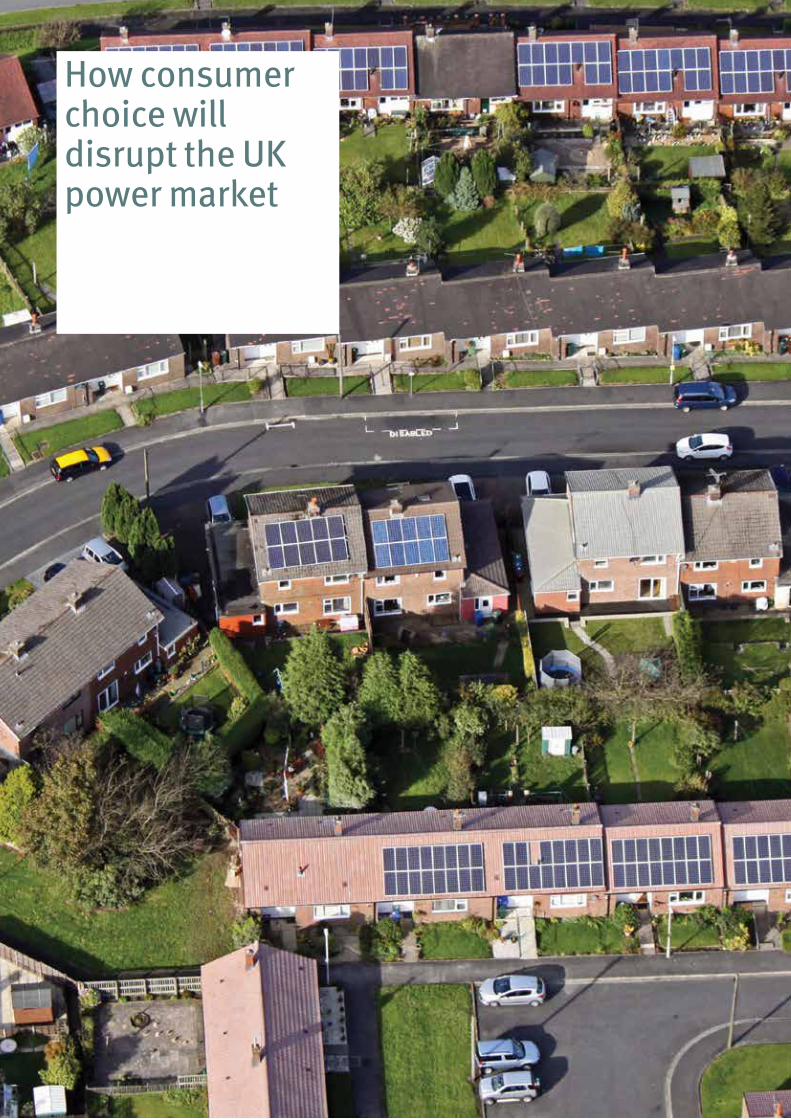
How consumer choice will disrupt the UK power market 4
Small scale energy technologies: cheap and everywhere 7
Learning from experience: examples from the UK and abroad 12
The tipping point for the UK 24
Governing the energy transition 28
Conclusion 32
Annex 33
Endnotes 34
“We are entering a new era where the consumer really can take control.”
2
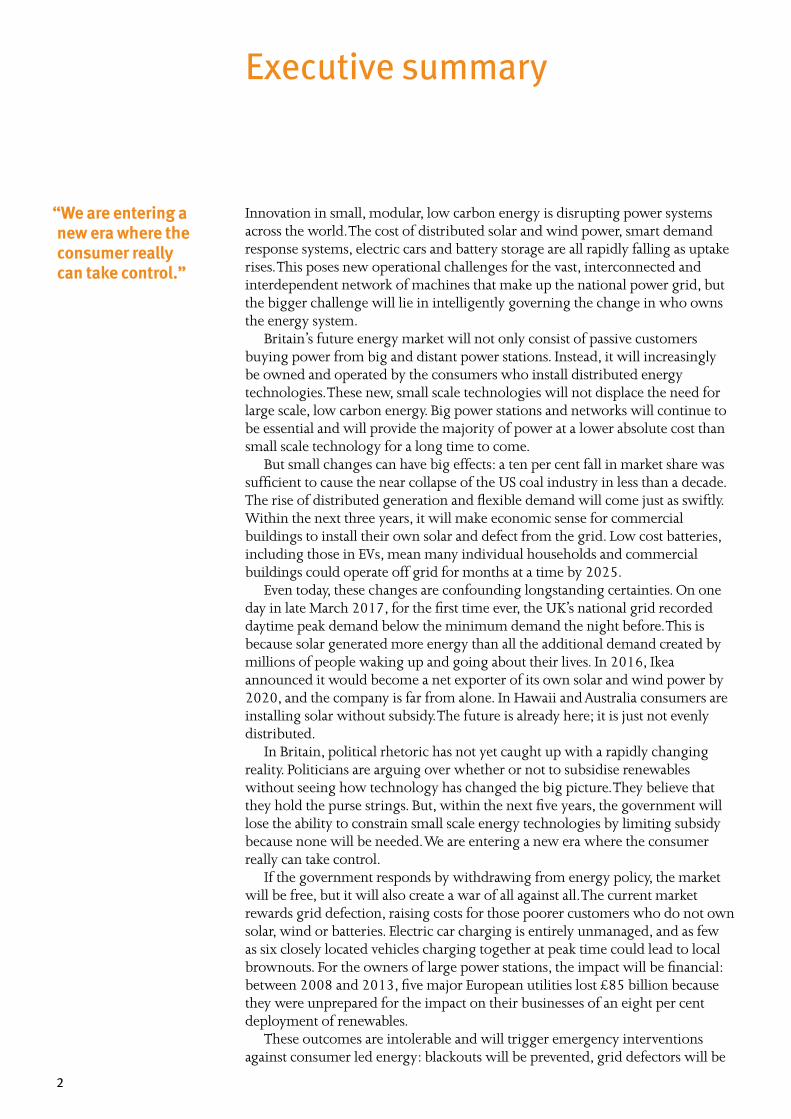
Innovation in small, modular, low carbon energy is disrupting power systems across the world. The cost of distributed solar and wind power, smart demand response systems, electric cars and battery storage are all rapidly falling as uptake rises. This poses new operational challenges for the vast, interconnected and interdependent network of machines that make up the national power grid, but the bigger challenge will lie in intelligently governing the change in who owns the energy system.
Britain’s future energy market will not only consist of passive customers buying power from big and distant power stations. Instead, it will increasingly be owned and operated by the consumers who install distributed energy technologies. These new, small scale technologies will not displace the need for large scale, low carbon energy. Big power stations and networks will continue to be essential and will provide the majority of power at a lower absolute cost than small scale technology for a long time to come.
But small changes can have big effects: a ten per cent fall in market share was sufficient to cause the near collapse of the US coal industry in less than a decade. The rise of distributed generation and flexible demand will come just as swiftly. Within the next three years, it will make economic sense for commercial buildings to install their own solar and defect from the grid. Low cost batteries, including those in EVs, mean many individual households and commercial buildings could operate off grid for months at a time by 2025.
Even today, these changes are confounding longstanding certainties. On one day in late March 2017, for the first time ever, the UK’s national grid recorded daytime peak demand below the minimum demand the night before. This is because solar generated more energy than all the additional demand created by millions of people waking up and going about their lives. In 2016, Ikea announced it would become a net exporter of its own solar and wind power by 2020, and the company is far from alone. In Hawaii and Australia consumers are installing solar without subsidy. The future is already here; it is just not evenly distributed.
In Britain, political rhetoric has not yet caught up with a rapidly changing reality. Politicians are arguing over whether or not to subsidise renewables without seeing how technology has changed the big picture. They believe that they hold the purse strings. But, within the next five years, the government will lose the ability to constrain small scale energy technologies by limiting subsidy because none will be needed. We are entering a new era where the consumer really can take control.
If the government responds by withdrawing from energy policy, the market will be free, but it will also create a war of all against all. The current market rewards grid defection, raising costs for those poorer customers who do not own solar, wind or batteries. Electric car charging is entirely unmanaged, and as few as six closely located vehicles charging together at peak time could lead to local brownouts. For the owners of large power stations, the impact will be financial: between 2008 and 2013, five major European utilities lost £85 billion because they were unprepared for the impact on their businesses of an eight per cent deployment of renewables.
These outcomes are intolerable and will trigger emergency interventions against consumer led energy: blackouts will be prevented, grid defectors will be
Executive summary

3
punished and large utilities may even be bailed out. This is how governments across the world have responded so far. Hawaii has stopped blackouts by blocking residential solar. Nevada has punished grid defectors by retrospectively changing electricity tariffs. And the UK has biased the capacity market in favour of unabated coal, despite its firm commitment to phase it out. Emergency policy making has led to an ever deeper, if accidental, embrace of energy policy by the state, and a ferocious backlash by consumers: in Nevada, consumer pressure not only reversed tariff changes, but the grid administration was sacked.
There is an alternative. Rather than intervening to restrict popular, small scale energy in favour of large generators, the state can govern intelligently and actively, and enable large and small to work together. Doing so would mean seeing consumer led, market driven, small scale energy as primary, even if it is not the largest source of power. Large scale energy would need a new, more explicit governance framework to enable it to support small scale energy, particularly in the winter time, allowing the whole system to decarbonise at least cost while keeping the lights on.
Active energy governance in the UK requires four main interventions:
• An independent system designer should provide robust technical analysis and option testing of the best ways to integrate small energy into the overall system. Its remit needs to go beyond that of the current system operator, to cover transport and heat, as both of these sectors will increasingly affect the electricity system. The government will need to continue to provide strategic direction, especially for large scale energy, with the system designer advising and implementing.
• Distribution network operators should become distribution system operators capable of monitoring and managing new, distributed technologies. They will need to work closely with the system designer to strategically plan the overall system.
• The capacity market should value small scale energy technologies, so underutilised, distributed, flexible sources can help to balance the grid, rather than undermining it.
• Aggregators and automation should be introduced, ahead of ‘time of use’ tariffs. Current tariffs encourage grid defection and hamper flexibility, but the alternative, to use dynamic ‘time of use’ tariffs, is unpopular because consumers resent having to change their habits in response to changing grid requirements. The solution is to provide incentives for aggregators and the automation of demand response first, leading to lower bills and less bother for consumers.
The changing dynamic between small, individually owned, market driven energy and large, essential and increasingly state dominated energy is the new challenge politicians have to address. The government cannot escape its role in the energy system but, if politicians want to maximise the space for market decisions in energy, they should actively govern large scale energy to support the consumer led future which is rapidly unfolding.
4
How consumer choice will disrupt the UK power market
5
In the 1980s and 90s, electricity provision and distribution was largely invisible to the public. Privatisation of the industry coincided with a boom in cheap gas from the North Sea. The result was falling costs, limited infrastructure and benign political neglect. Now, the picture could not be more different: rising fossil fuel prices and a technological revolution in large scale renewables have brought politics back into energy policy with a vengeance.
Politicians have reacted with a set of reforms which both promote and undermine market decisions. Most want the market to decide what sort of energy technologies the UK builds over the next decade. But the main market, the wholesale power market, has such low prices that the government itself recognises that “no form of power generation […] can be built without government intervention”.1 So, the government has repeatedly intervened. Initially, support was given to renewables but, more recently, clear support has been given to gas and nuclear power. A major policy u-turn in 2015 marked the end of government support for onshore wind, solar PV and the carbon capture and storage programme. The result is that risk premiums for private generators are rising.
Even where the market has independently signalled a clear preference, the government has reversed its decisions. For instance, it limited applications by diesel generators in the capacity market auction of December 2016, following a large procurement of them in previous auctions.
In response, some have advocated an abrupt return to a market led system, invoking the UK’s successful private electricity market in the 1990s as an ideal model. The debate between continuing to intervene and attempting to revert to a previous market model has dominated policy thinking. Central questions have been whether or not subsidy is appropriate and how to fix the failures of the wholesale electricity market.
However, these lines of argument rest on an enormous, and erroneous, assumption: that large scale energy technologies will continue to dominate power markets in the future. They have ignored the revolution underway in small scale, distributed technologies. Within the next few years, small scale technologies will begin to fundamentally reshape the power market and, in doing so, they will completely change the government’s role in the energy system.
The biggest difference between small and large scale technologies is that the deployment of small scale energy assets will be driven by the unsubsidised choices of individual consumers and non-power sector businesses. The resulting system will feature multiple buyers and multiple sellers, and will look much more like other markets for goods, in contrast with the current energy market where individual consumers have almost no choice over what sort of power generation is built.
“Within the next few years, small scale technologies will completely change the government’s role in the energy system.”
6
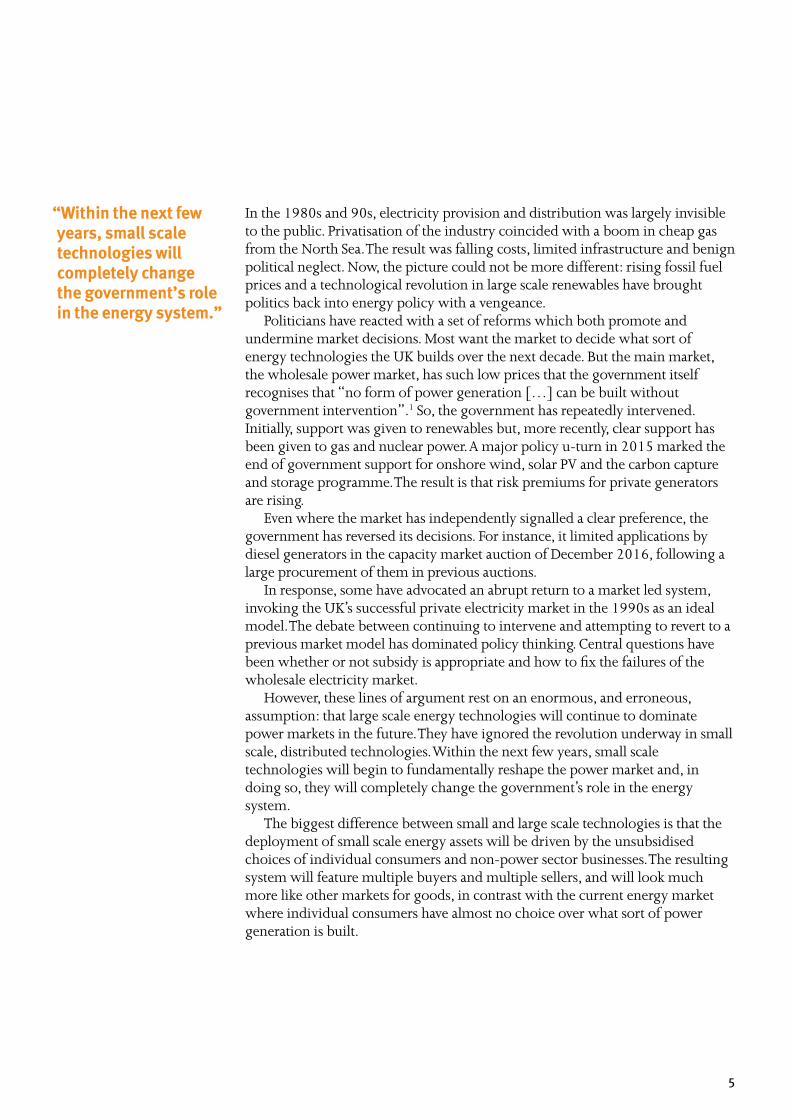
A polarised energy market
• Large scale technologies: have long lifetimes, monolithic character and a slow rate of technological change. They require state intervention to underwrite high capital cost and long lifetimes.
• Small scale technologies: are subject to rapid technology change, and are modular and distributed; they are usually owned by non-energy specialists. Previously, uptake has been driven by government subsidy, but they will soon be cheap and consumer driven.
Nuclear
Large scale technologies
Increasingly state led Soon to be consumer led
Small scale technologies
Heat pumps
Offshore wind
Carbon capture and storage
Combined cycle gas turbines
Tidal lagoons
Interconnectors
Solar
Electric vehicles
Batteries
Demand sideresponse
Onshore wind
This revolution in small scale technologies will not make large scale assets obsolete. Far from it: the bulk power provided by large energy technologies will still be necessary. Small scale energy is a long way from powering the UK. But it will disrupt the market significantly, and the government will need to pursue a more active role in ensuring the system works for all and delivers affordable, clean energy, from both large and small scale technologies.
7
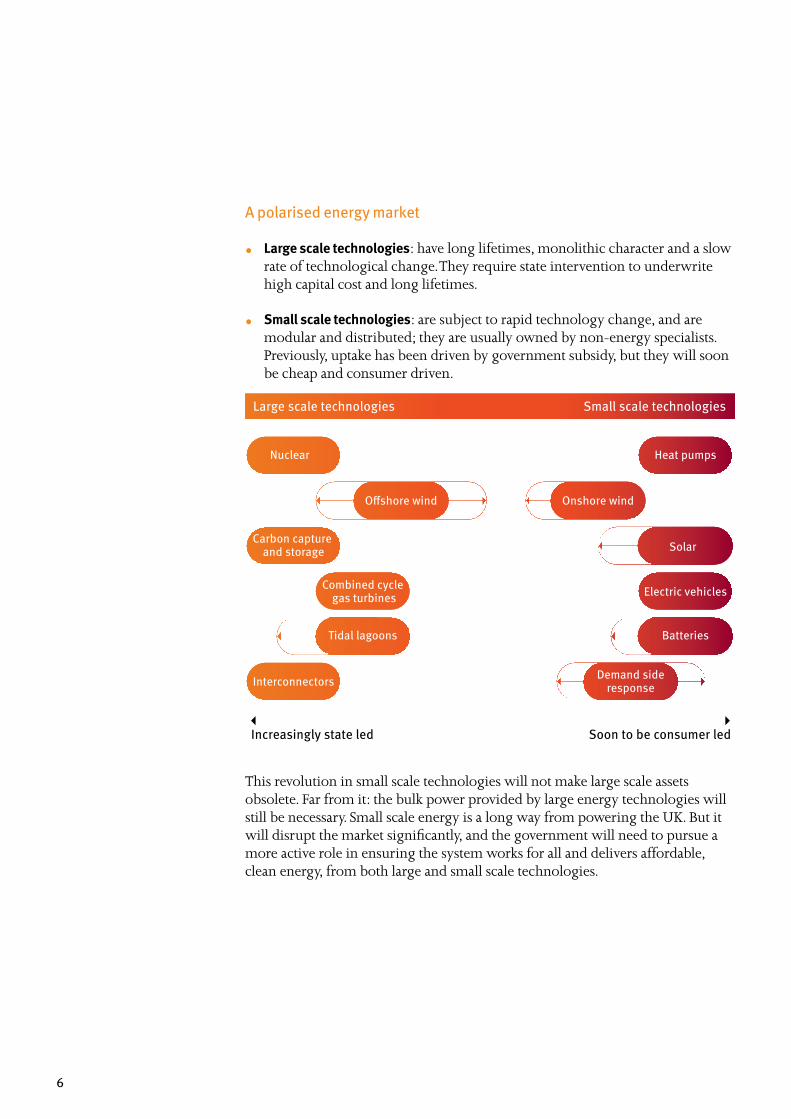
Small scale energy technologies: cheap and everywhere

8
“For households and non-energy businesses, small scale energy technologies will be economic as soon as 2020.”
Policy makers are still working on the basis that the rise of small scale energy will take many years, but they are mistaken.2 For households and non-energy businesses, small scale energy technologies will be economic as soon as 2020.
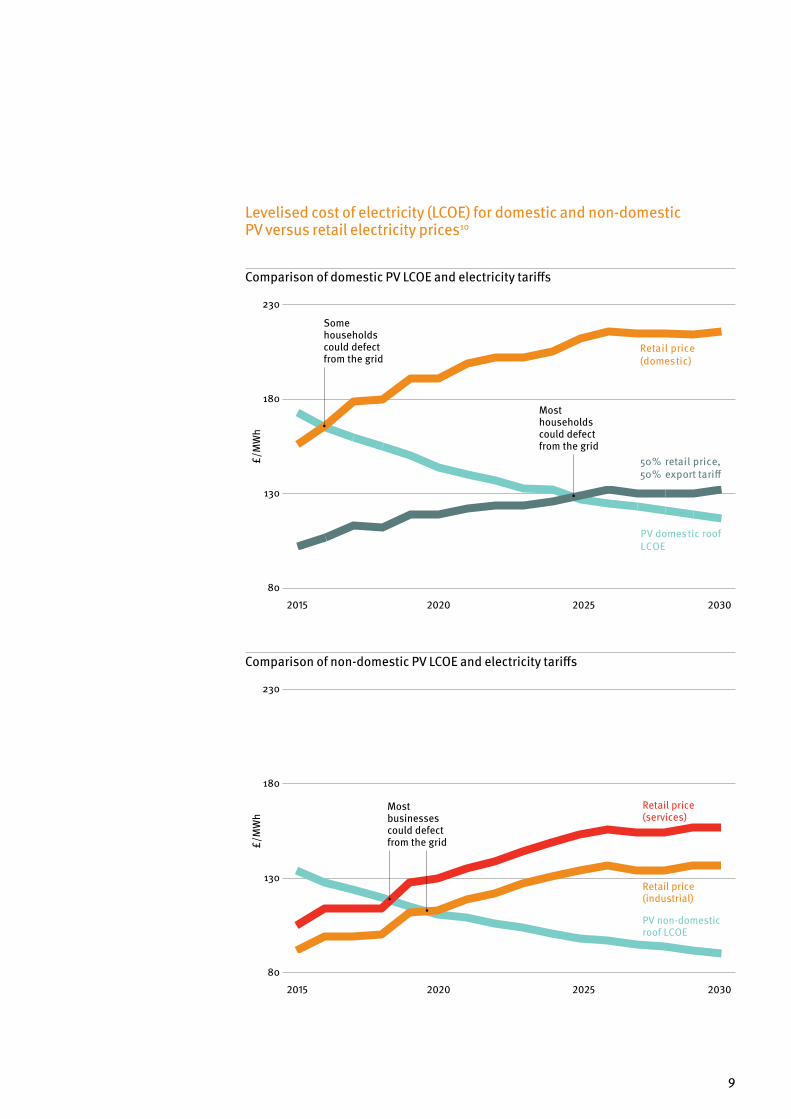
Residential customers: solar photovoltaics, batteries and electric cars by 2025 Solar PV has consistently grown much faster than expected. In the UK, forecasts for 9GW by 2026 were met in 2015. Unlike traditional generators, it is connected to residential dwellings, industrial premises or distribution networks.3 Although PV uptake has slowed due to reductions in government incentives, the UK is still leading solar growth in Europe.4 More significantly, the cost of PV has already fallen by 90 per cent since 2009 and it will achieve payback periods below ten years across England and Wales by 2025.5 Its popularity has grown as its cost has fallen, and it is clear that latent consumer demand will pick up once small scale solar becomes cheaper than retail electricity. The graph on page nine shows a cost comparison between domestic PV and electricity tariffs, including the electricity tariff for consumers that achieve only 50 per cent self-consumption (50 per cent retail price, 50 per cent export tariff).
Batteries have seen a similar trajectory, and costs fell by 65 per cent between 2010 and 2015 as a result of innovation and economies of scale.6 Some residential battery storage already has payback periods of between six and eight years, and costs are projected to halve over the next decade.7 There may be scope for even cheaper batteries too: repurposing second-life EV batteries for stationary applications could be achieved at £39/kWh, which is a quarter of the cheapest battery systems today.8 With rising electricity prices and the declining cost of small scale PV, self-generated consumption will become an attractive proposition for households and businesses. In England, solar plus battery systems will be available with a payback period of below 15 years by 2020.9
9
Levelised cost of electricity (LCOE) for domestic and non-domestic PV versus retail electricity prices10
Comparison of domestic PV LCOE and electricity tariffs
£/M
Wh
Some households could defect from the grid
Mosthouseholds could defect from the grid
80
130
180
230
2015 2020 2025 2030
Retail price (domestic)
50% retail price, 50% export tariff
PV domestic roof LCOE
Comparison of non-domestic PV LCOE and electricity tariffs
£/M
Wh
80
130
180
230
2015 2020 2025 2030
Retail price (services)
Retail price (industrial)
PV non-domestic roof LCOE
Most businessescould defect from the grid
10
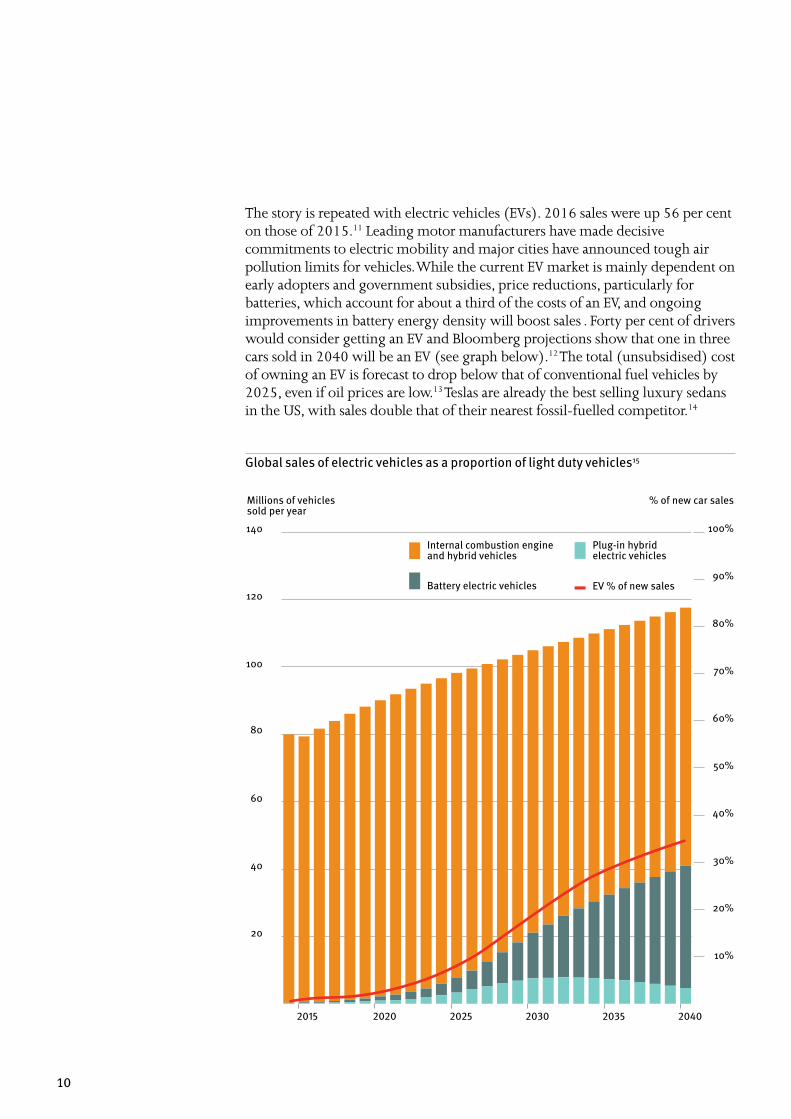
The story is repeated with electric vehicles (EVs). 2016 sales were up 56 per cent on those of 2015.11 Leading motor manufacturers have made decisive commitments to electric mobility and major cities have announced tough air pollution limits for vehicles. While the current EV market is mainly dependent on early adopters and government subsidies, price reductions, particularly for batteries, which account for about a third of the costs of an EV, and ongoing improvements in battery energy density will boost sales . Forty per cent of drivers would consider getting an EV and Bloomberg projections show that one in three cars sold in 2040 will be an EV (see graph below).12 The total (unsubsidised) cost of owning an EV is forecast to drop below that of conventional fuel vehicles by 2025, even if oil prices are low.13 Teslas are already the best selling luxury sedans in the US, with sales double that of their nearest fossil-fuelled competitor.14
Global sales of electric vehicles as a proportion of light duty vehicles15
20
40
60
80
100
120
140 100%
90%
80%
70%
60%
50%
40%
30%
20%
10%
2015 2020 2025 2030 2035 2040
Internal combustion engine and hybrid vehicles
Battery electric vehicles
Plug-in hybridelectric vehicles
EV % of new sales
Millions of vehicles sold per year
% of new car sales
11
Businesses: solar, onshore wind, demand response and heat pumps by 2020 The rise of small scale energy will not be limited to households. Businesses are larger consumers and have access to higher levels of credit, so they can take advantage of greater economies of scale. Because of this, businesses and industrial users are starting to opt for renewable self-generation.
Major businesses are leading the way. Ikea already produces 53 per cent of its energy from renewables and, in 2016, it announced it would become a net exporter of its own solar and wind power by 2020.16 Tata Steel has opted for on-site green power: in 2015 it signed a power purchase agreement with Kinetica Solar to receive an average of seven per cent of its electricity requirements in Scunthorpe from the nearby Raventhorpe Solar Park.17 Nestlé has signed a deal to purchase its power from a Scottish windfarm that will cover half of the company’s power needs in the UK.18 Amazon has announced the deployment of solar PV on 50 of its centres globally by 2020.19 And the list continues to grow.20 But self-generation will not be limited to large businesses. Payback periods for commercial rooftop solar in the UK will drop below 15 years by 2020, allowing smaller businesses to benefit from unsubsidised self-generation (see graphic on page 9 for a cost comparison between non-domestic PV and electricity tariffs).21
Equally significant, businesses have proven to be much more open to new demand reduction and load shifting technologies. Mostly business led demand response in the US enables up to nine per cent peak reduction (compared to only 1.7 per cent in the UK), driven by capacity markets, aggregators and smart meters.22 In the UK, industrial and commercial customers, attracted by the opportunity for new revenues and cost savings, are increasingly looking to participate in demand side response while aggregators, such as KiWi Power, Open Energi and others, have specialised in co-ordinating and aggregating flexible consumer loads.
Finally, businesses often have more complex heating and cooling systems, which may be better suited to the foreseen switch to heat pumps: between 30 and 75 per cent of building heat is projected to be electric.23 And, while heat pump deployment drivers might be different from the other technologies discussed, heat pumps are also likely to disrupt the current energy system and potentially offer greater demand flexibility.

12
Learning from experience: examples from the UK and abroad

13
“Matching 21st century technologies with 20th century energy markets is a recipe for disaster.”
As we have highlighted, small scale, low carbon technologies will grow rapidly as a result of consumer choice, and will disrupt the existing energy market as they are deployed.
The UK’s energy system is designed for older, large scale generation assets. The experience of countries which have seen rapid growth in small scale technologies shows that matching 21st century technologies with 20th century energy markets is a recipe for disaster. It leads to grid congestion, expensive grid upgrades, inadequate generation at peak times, and a utility death spiral, as customers opt for self-generation, resulting in rising bills, blackout risk and angry consumers.
There is nothing inevitable about the clash between small and large scale technologies. If regulators, operators, utilities and politicians can evolve the system to value and support small scale energy, consumers can have more freedom to choose these technologies, the system can function and large scale energy can continue to play its role. Other countries’ experiences show that actively governing the transition to create an enabling framework for small scale energy can lead to good outcomes, with decentralised generation working alongside large scale generation, leading to new sources of system flexibility, affordable costs and satisfied customers.
In this chapter, we look at experiences from the UK and abroad of solar, electric vehicle and demand response roll-outs, to see what has and has not worked.
14
Solar PV How not to do it
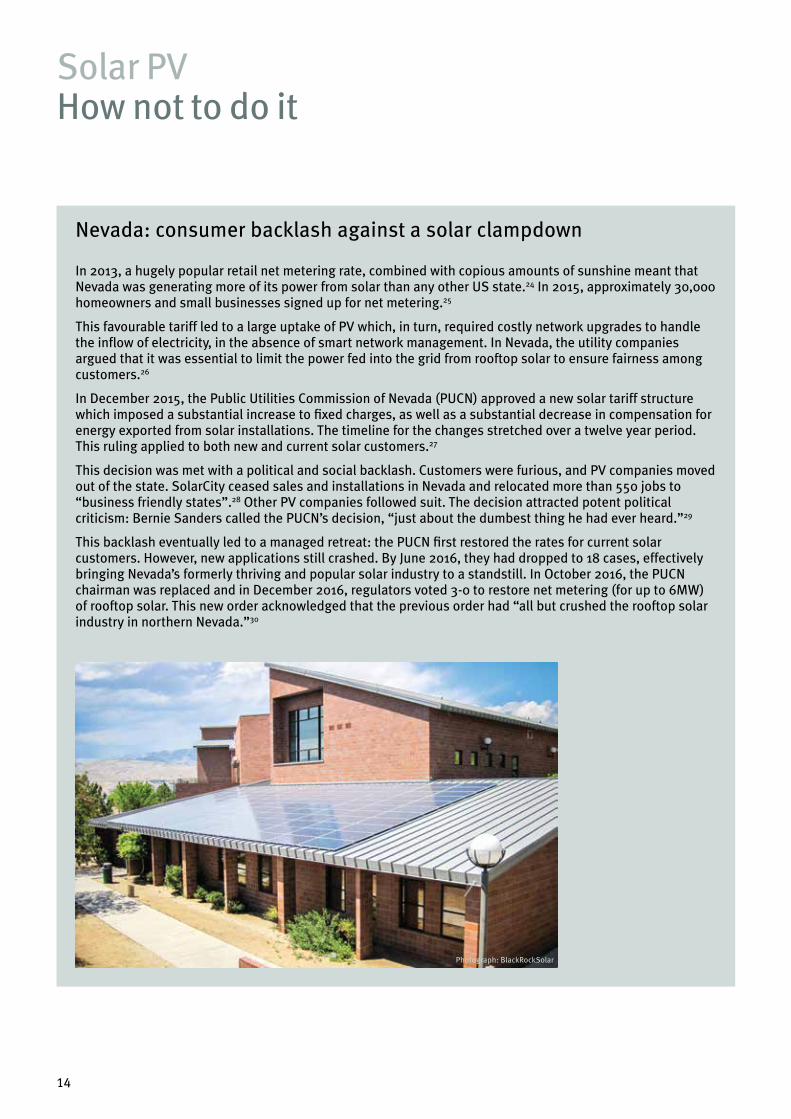
Nevada: consumer backlash against a solar clampdown
In 2013, a hugely popular retail net metering rate, combined with copious amounts of sunshine meant that Nevada was generating more of its power from solar than any other US state.24 In 2015, approximately 30,000 homeowners and small businesses signed up for net metering.25
This favourable tariff led to a large uptake of PV which, in turn, required costly network upgrades to handle the inflow of electricity, in the absence of smart network management. In Nevada, the utility companies argued that it was essential to limit the power fed into the grid from rooftop solar to ensure fairness among customers.26
In December 2015, the Public Utilities Commission of Nevada (PUCN) approved a new solar tariff structure which imposed a substantial increase to fixed charges, as well as a substantial decrease in compensation for energy exported from solar installations. The timeline for the changes stretched over a twelve year period. This ruling applied to both new and current solar customers.27
This decision was met with a political and social backlash. Customers were furious, and PV companies moved out of the state. SolarCity ceased sales and installations in Nevada and relocated more than 550 jobs to “business friendly states”.28 Other PV companies followed suit. The decision attracted potent political criticism: Bernie Sanders called the PUCN’s decision, “just about the dumbest thing he had ever heard.”29
This backlash eventually led to a managed retreat: the PUCN first restored the rates for current solar customers. However, new applications still crashed. By June 2016, they had dropped to 18 cases, effectively bringing Nevada’s formerly thriving and popular solar industry to a standstill. In October 2016, the PUCN chairman was replaced and in December 2016, regulators voted 3-0 to restore net metering (for up to 6MW) of rooftop solar. This new order acknowledged that the previous order had “all but crushed the rooftop solar industry in northern Nevada.”30
Photograph: BlackRockSolar

15
Solar PV How to do it
New Mexico: storing up sunshine
New Mexico has an installed solar capacity of 634 MW, which ranks 15th in the US.31 Noticing the potential for smoothing and demand shifting, the Public Service Company of New Mexico (PNM) undertook the PNM Prosperity energy storage project and pilot tested the nation’s first solar storage facility.
The 5.8 million dollar project started in September 2011 and aimed to demonstrate that combining solar and battery storage can stabilise voltage levels and cut peak load by at least 15 per cent at a local level.
Smoothing high frequency PV output variability (from intermittent cloud cover) reduces the need for costly operating reserve to be set aside, while lowering peak load reduces demand for more network and generation capacity.
The project was undertaken on a 4.9 acre sub-station site south east of Albuquerque, New Mexico, and was primarily funded by the US Department of Energy and the PNM. It involved installing two battery systems (a 500 kW energy smoothing battery and a 250 kW energy shifting battery), co-located with a 500 kW solar PV plant.32
The project succeeded in its initial aims and has proved its ability to provide smoothing and energy shifting tasks on demand. It is an example of a renewable energy resource that helps to support the grid. Data from the project are being used to learn how to integrate a variable power source into grid design.
16
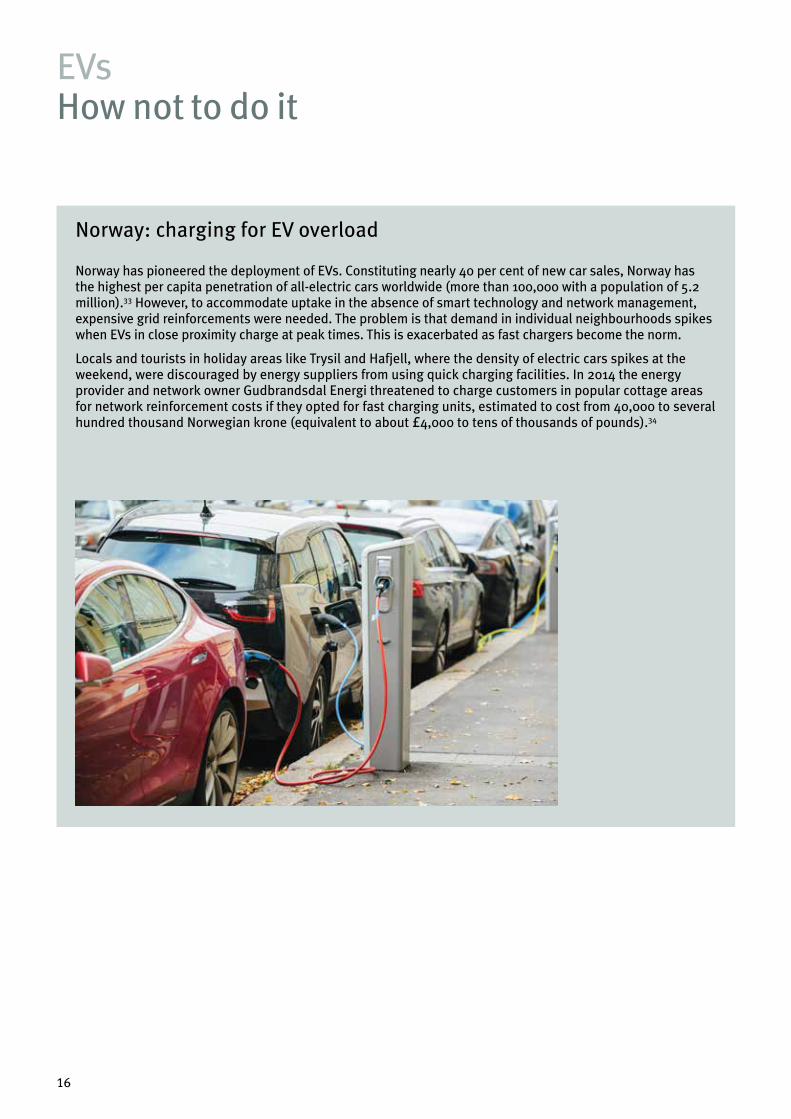
Norway: charging for EV overload
Norway has pioneered the deployment of EVs. Constituting nearly 40 per cent of new car sales, Norway has the highest per capita penetration of all-electric cars worldwide (more than 100,000 with a population of 5.2 million).33 However, to accommodate uptake in the absence of smart technology and network management, expensive grid reinforcements were needed. The problem is that demand in individual neighbourhoods spikes when EVs in close proximity charge at peak times. This is exacerbated as fast chargers become the norm.
Locals and tourists in holiday areas like Trysil and Hafjell, where the density of electric cars spikes at the weekend, were discouraged by energy suppliers from using quick charging facilities. In 2014 the energy provider and network owner Gudbrandsdal Energi threatened to charge customers in popular cottage areas for network reinforcement costs if they opted for fast charging units, estimated to cost from 40,000 to several hundred thousand Norwegian krone (equivalent to about £4,000 to tens of thousands of pounds).34
EVs How not to do it
17
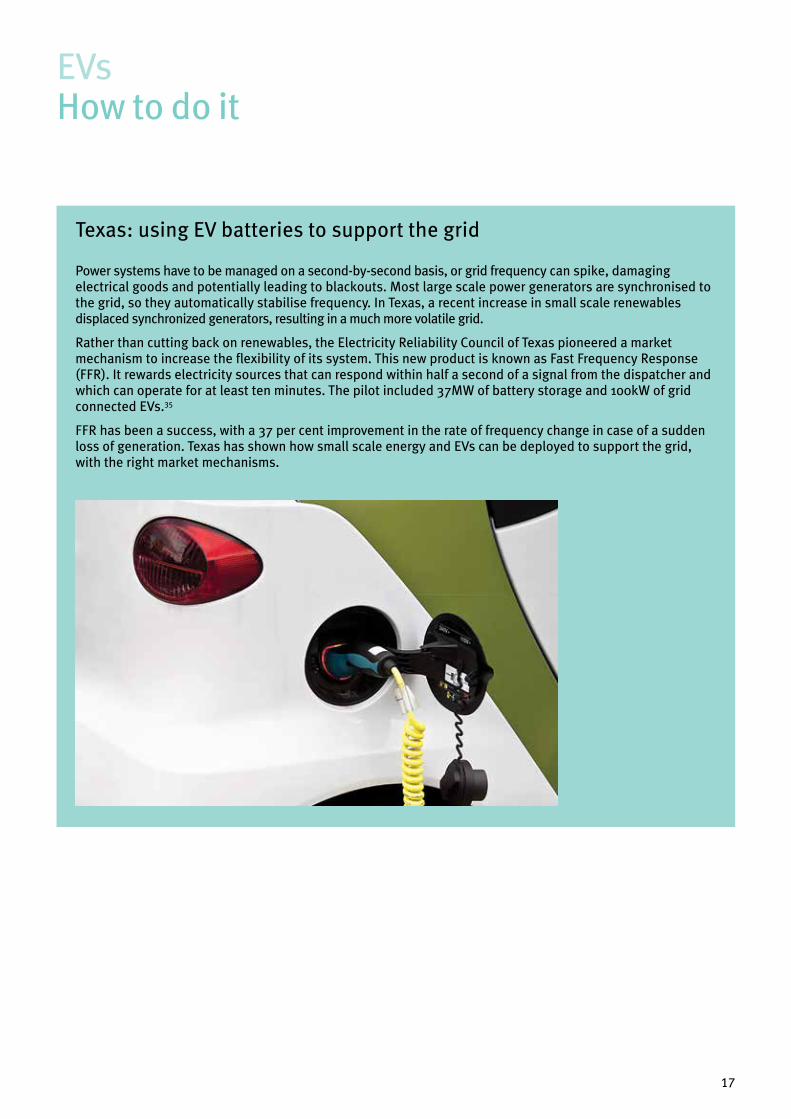
Texas: using EV batteries to support the grid
Power systems have to be managed on a second-by-second basis, or grid frequency can spike, damaging electrical goods and potentially leading to blackouts. Most large scale power generators are synchronised to the grid, so they automatically stabilise frequency. In Texas, a recent increase in small scale renewables displaced synchronized generators, resulting in a much more volatile grid.
Rather than cutting back on renewables, the Electricity Reliability Council of Texas pioneered a market mechanism to increase the flexibility of its system. This new product is known as Fast Frequency Response (FFR). It rewards electricity sources that can respond within half a second of a signal from the dispatcher and which can operate for at least ten minutes. The pilot included 37MW of battery storage and 100kW of grid connected EVs.35
FFR has been a success, with a 37 per cent improvement in the rate of frequency change in case of a sudden loss of generation. Texas has shown how small scale energy and EVs can be deployed to support the grid, with the right market mechanisms.
EVs How to do it
18
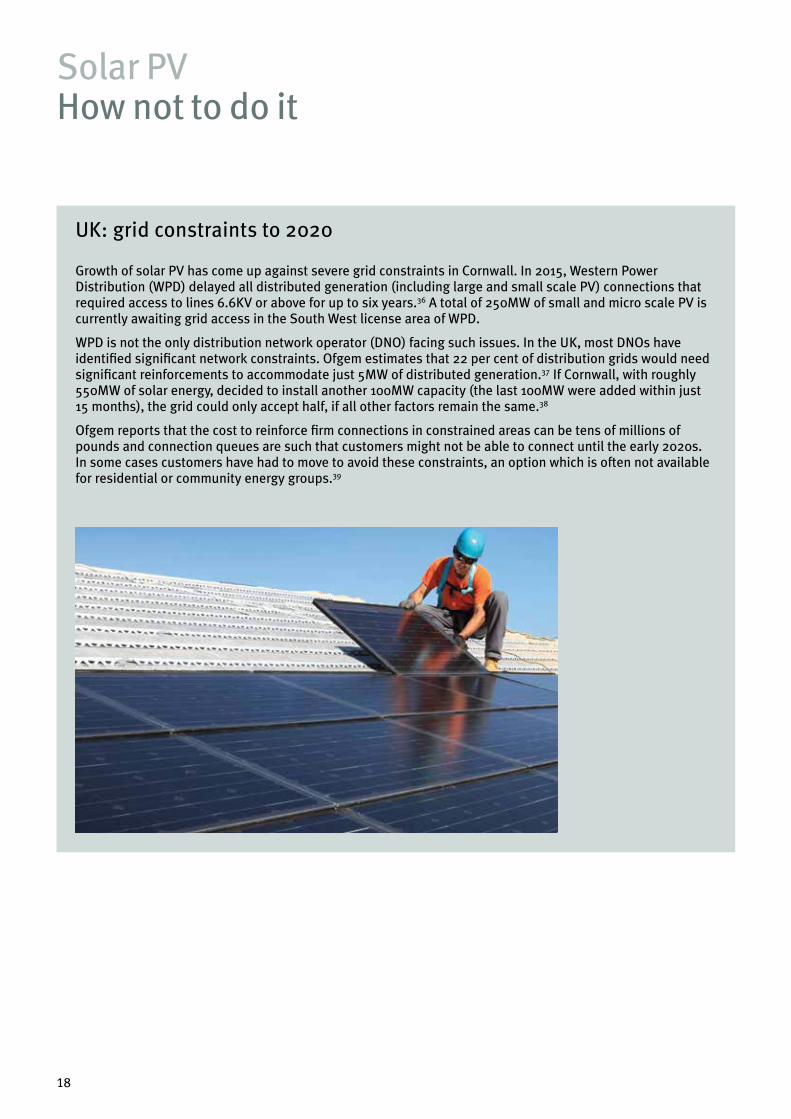
UK: grid constraints to 2020
Growth of solar PV has come up against severe grid constraints in Cornwall. In 2015, Western Power Distribution (WPD) delayed all distributed generation (including large and small scale PV) connections that required access to lines 6.6KV or above for up to six years.36 A total of 250MW of small and micro scale PV is currently awaiting grid access in the South West license area of WPD.
WPD is not the only distribution network operator (DNO) facing such issues. In the UK, most DNOs have identified significant network constraints. Ofgem estimates that 22 per cent of distribution grids would need significant reinforcements to accommodate just 5MW of distributed generation.37 If Cornwall, with roughly 550MW of solar energy, decided to install another 100MW capacity (the last 100MW were added within just 15 months), the grid could only accept half, if all other factors remain the same.38
Ofgem reports that the cost to reinforce firm connections in constrained areas can be tens of millions of pounds and connection queues are such that customers might not be able to connect until the early 2020s. In some cases customers have had to move to avoid these constraints, an option which is often not available for residential or community energy groups.39
Solar PV How not to do it
19
Germany: giving consumers freedom to take control
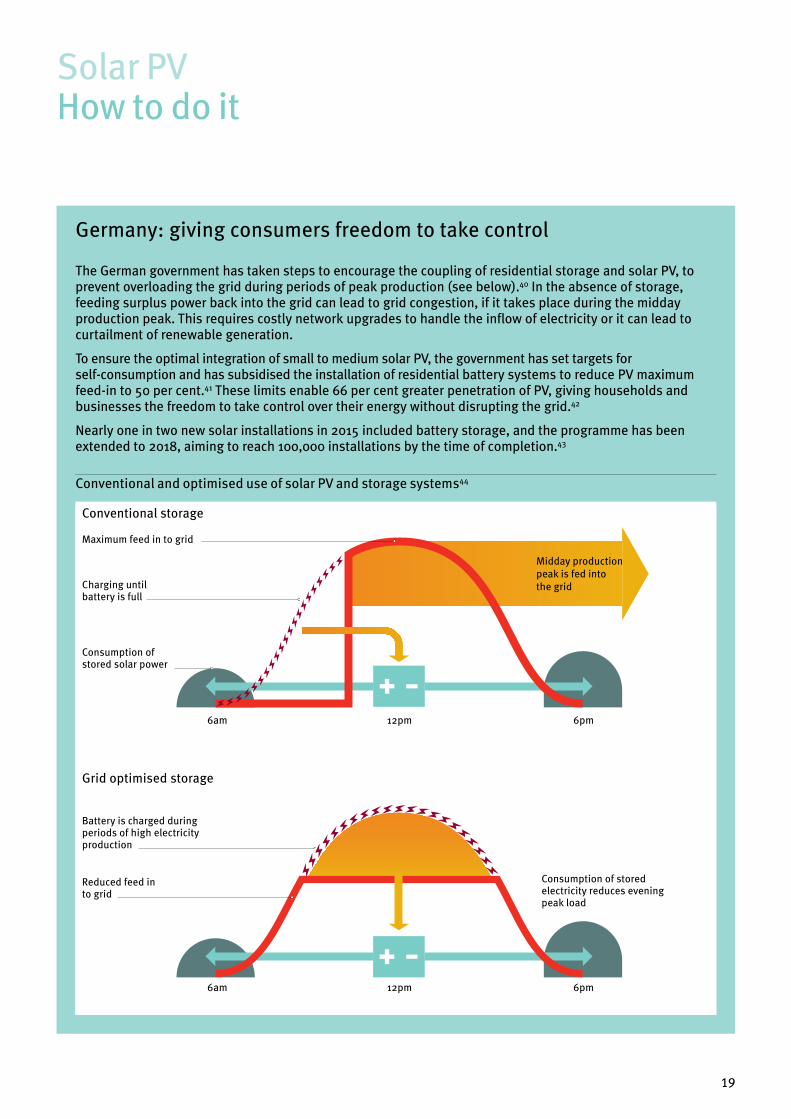
The German government has taken steps to encourage the coupling of residential storage and solar PV, to prevent overloading the grid during periods of peak production (see below).40 In the absence of storage, feeding surplus power back into the grid can lead to grid congestion, if it takes place during the midday production peak. This requires costly network upgrades to handle the inflow of electricity or it can lead to curtailment of renewable generation.
To ensure the optimal integration of small to medium solar PV, the government has set targets for self-consumption and has subsidised the installation of residential battery systems to reduce PV maximum feed-in to 50 per cent.41 These limits enable 66 per cent greater penetration of PV, giving households and businesses the freedom to take control over their energy without disrupting the grid.42
Nearly one in two new solar installations in 2015 included battery storage, and the programme has been extended to 2018, aiming to reach 100,000 installations by the time of completion.43
Conventional and optimised use of solar PV and storage systems44
Solar PV How to do it
Charging until battery is full
Battery is charged during periods of high electricity production
Reduced feed into grid
Consumption of stored solar power
Consumption of stored electricity reduces eveningpeak load
Grid optimised storage
Conventional storage
6am 12pm 6pm
6am 12pm 6pm
Midday production peak is fed into the grid
Maximum feed in to grid

20
UK: ‘time of use’ tariffs fail without smart technology
Implementation of ‘time of use’ tariffs for energy demand shifting, in the absence of smart technologies, can negatively impact those customers who are less engaged or able to adapt their consumption patterns. Automation is critical to shifting consumption patterns and encouraging customers to sign up for ‘time of use’ tariffs, as has been reported in a number of studies.45
In the UK, Western Power Distribution launched a Sunshine Tariff trial to provide cheaper connection options to distributed generators (mainly solar PV). The idea was to shift local demand patterns to daytime hours to reduce network congestion. Their approach used a static ‘time of use’ tariff to encourage energy use at times when the sun is shining (10am to 4pm from April to September) and customers could shift consumption through manual or automated interventions.
Only an average of five per cent of demand was shifted in the sunny hours when participants did not have automation, compared to 13 per cent for those with automated response. Customers with automation were also more likely to sign up to the tariff.46 And because the trial was voluntary and small scale, the response from customers who might not feel able to shift their demand was not tested.
Managing demand How not to do it
21
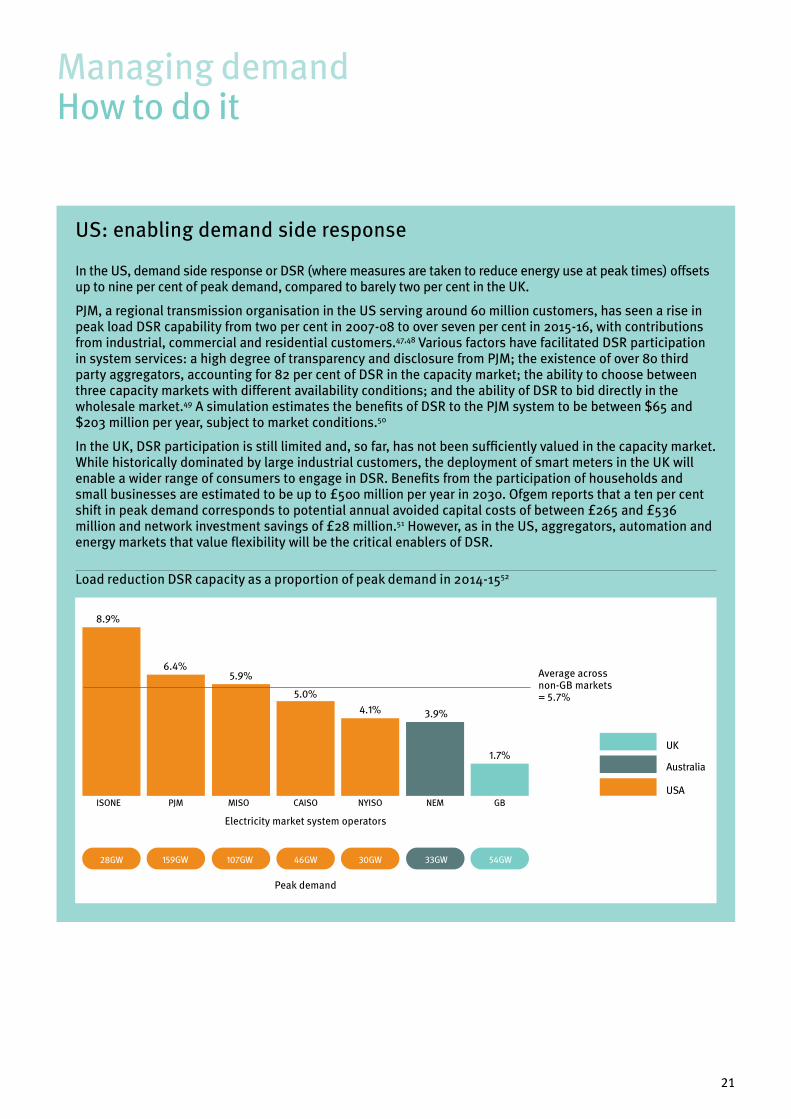
US: enabling demand side response
In the US, demand side response or DSR (where measures are taken to reduce energy use at peak times) offsets up to nine per cent of peak demand, compared to barely two per cent in the UK.
PJM, a regional transmission organisation in the US serving around 60 million customers, has seen a rise in peak load DSR capability from two per cent in 2007-08 to over seven per cent in 2015-16, with contributions from industrial, commercial and residential customers.47,48 Various factors have facilitated DSR participation in system services: a high degree of transparency and disclosure from PJM; the existence of over 80 third party aggregators, accounting for 82 per cent of DSR in the capacity market; the ability to choose between three capacity markets with different availability conditions; and the ability of DSR to bid directly in the wholesale market.49 A simulation estimates the benefits of DSR to the PJM system to be between $65 and $203 million per year, subject to market conditions.50
In the UK, DSR participation is still limited and, so far, has not been sufficiently valued in the capacity market. While historically dominated by large industrial customers, the deployment of smart meters in the UK will enable a wider range of consumers to engage in DSR. Benefits from the participation of households and small businesses are estimated to be up to £500 million per year in 2030. Ofgem reports that a ten per cent shift in peak demand corresponds to potential annual avoided capital costs of between £265 and £536 million and network investment savings of £28 million.51 However, as in the US, aggregators, automation and energy markets that value flexibility will be the critical enablers of DSR.
Load reduction DSR capacity as a proportion of peak demand in 2014-1552
Managing demand How to do it
Average acrossnon-GB markets= 5.7%
Peak demand
UK
Australia
USAISONE
8.9%
6.4%
PJM
5.9%
MISO
5.0%
CAISO
4.1%
NYISO
3.9%
NEM
1.7%
GB
Electricity market system operators
28GW 30GW46GW107GW 33GW 54GW159GW
22
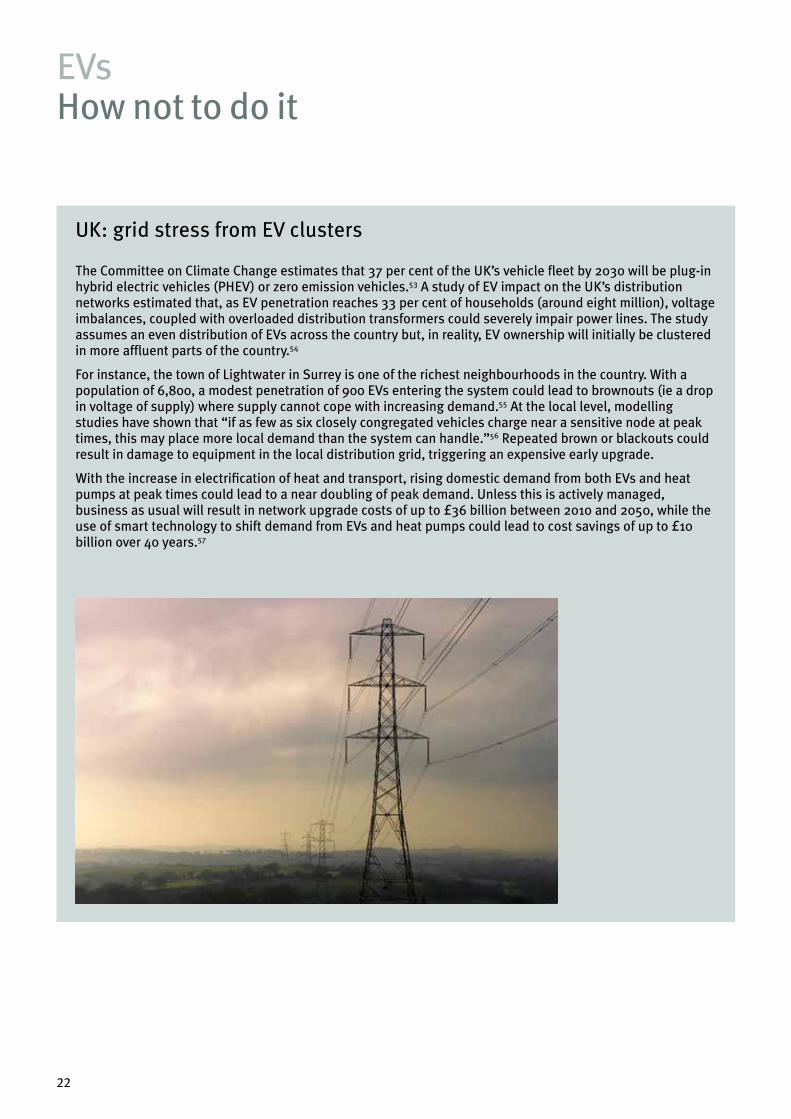
UK: grid stress from EV clusters
The Committee on Climate Change estimates that 37 per cent of the UK’s vehicle fleet by 2030 will be plug-in hybrid electric vehicles (PHEV) or zero emission vehicles.53 A study of EV impact on the UK’s distribution networks estimated that, as EV penetration reaches 33 per cent of households (around eight million), voltage imbalances, coupled with overloaded distribution transformers could severely impair power lines. The study assumes an even distribution of EVs across the country but, in reality, EV ownership will initially be clustered in more affluent parts of the country.54
For instance, the town of Lightwater in Surrey is one of the richest neighbourhoods in the country. With a population of 6,800, a modest penetration of 900 EVs entering the system could lead to brownouts (ie a drop in voltage of supply) where supply cannot cope with increasing demand.55 At the local level, modelling studies have shown that “if as few as six closely congregated vehicles charge near a sensitive node at peak times, this may place more local demand than the system can handle.”56 Repeated brown or blackouts could result in damage to equipment in the local distribution grid, triggering an expensive early upgrade.
With the increase in electrification of heat and transport, rising domestic demand from both EVs and heat pumps at peak times could lead to a near doubling of peak demand. Unless this is actively managed, business as usual will result in network upgrade costs of up to £36 billion between 2010 and 2050, while the use of smart technology to shift demand from EVs and heat pumps could lead to cost savings of up to £10 billion over 40 years.57
EVs How not to do it
23
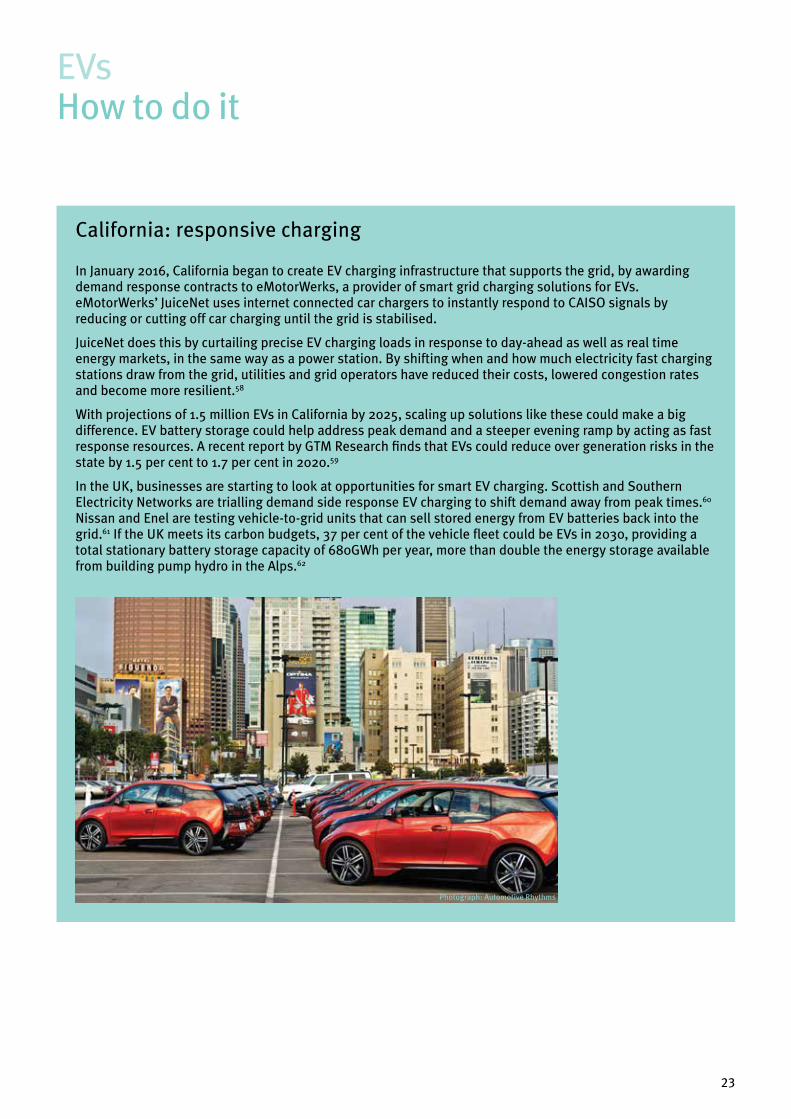
California: responsive charging
In January 2016, California began to create EV charging infrastructure that supports the grid, by awarding demand response contracts to eMotorWerks, a provider of smart grid charging solutions for EVs. eMotorWerks’ JuiceNet uses internet connected car chargers to instantly respond to CAISO signals by reducing or cutting off car charging until the grid is stabilised.
JuiceNet does this by curtailing precise EV charging loads in response to day-ahead as well as real time energy markets, in the same way as a power station. By shifting when and how much electricity fast charging stations draw from the grid, utilities and grid operators have reduced their costs, lowered congestion rates and become more resilient.58
With projections of 1.5 million EVs in California by 2025, scaling up solutions like these could make a big difference. EV battery storage could help address peak demand and a steeper evening ramp by acting as fast response resources. A recent report by GTM Research finds that EVs could reduce over generation risks in the state by 1.5 per cent to 1.7 per cent in 2020.59
In the UK, businesses are starting to look at opportunities for smart EV charging. Scottish and Southern Electricity Networks are trialling demand side response EV charging to shift demand away from peak times.60 Nissan and Enel are testing vehicle-to-grid units that can sell stored energy from EV batteries back into the grid.61 If the UK meets its carbon budgets, 37 per cent of the vehicle fleet could be EVs in 2030, providing a total stationary battery storage capacity of 680GWh per year, more than double the energy storage available from building pump hydro in the Alps.62
EVs How to do it
Photograph: Automotive Rhythms
24
The tipping point for the UK
25
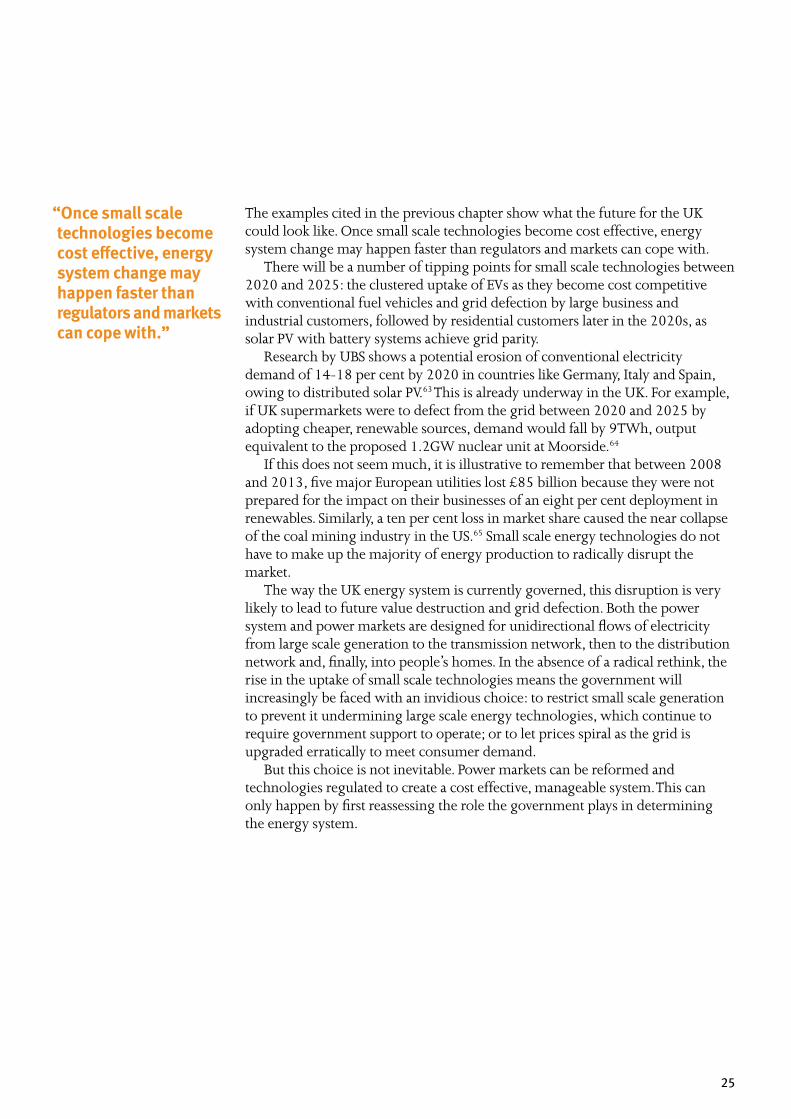
“Once small scale technologies become cost effective, energy system change may happen faster than regulators and markets can cope with.”
The examples cited in the previous chapter show what the future for the UK could look like. Once small scale technologies become cost effective, energy system change may happen faster than regulators and markets can cope with.
There will be a number of tipping points for small scale technologies between 2020 and 2025: the clustered uptake of EVs as they become cost competitive with conventional fuel vehicles and grid defection by large business and industrial customers, followed by residential customers later in the 2020s, as solar PV with battery systems achieve grid parity.
Research by UBS shows a potential erosion of conventional electricity demand of 14-18 per cent by 2020 in countries like Germany, Italy and Spain, owing to distributed solar PV.63 This is already underway in the UK. For example, if UK supermarkets were to defect from the grid between 2020 and 2025 by adopting cheaper, renewable sources, demand would fall by 9TWh, output equivalent to the proposed 1.2GW nuclear unit at Moorside.64
If this does not seem much, it is illustrative to remember that between 2008 and 2013, five major European utilities lost £85 billion because they were not prepared for the impact on their businesses of an eight per cent deployment in renewables. Similarly, a ten per cent loss in market share caused the near collapse of the coal mining industry in the US.65 Small scale energy technologies do not have to make up the majority of energy production to radically disrupt the market.
The way the UK energy system is currently governed, this disruption is very likely to lead to future value destruction and grid defection. Both the power system and power markets are designed for unidirectional flows of electricity from large scale generation to the transmission network, then to the distribution network and, finally, into people’s homes. In the absence of a radical rethink, the rise in the uptake of small scale technologies means the government will increasingly be faced with an invidious choice: to restrict small scale generation to prevent it undermining large scale energy technologies, which continue to require government support to operate; or to let prices spiral as the grid is upgraded erratically to meet consumer demand.
But this choice is not inevitable. Power markets can be reformed and technologies regulated to create a cost effective, manageable system. This can only happen by first reassessing the role the government plays in determining the energy system.
26
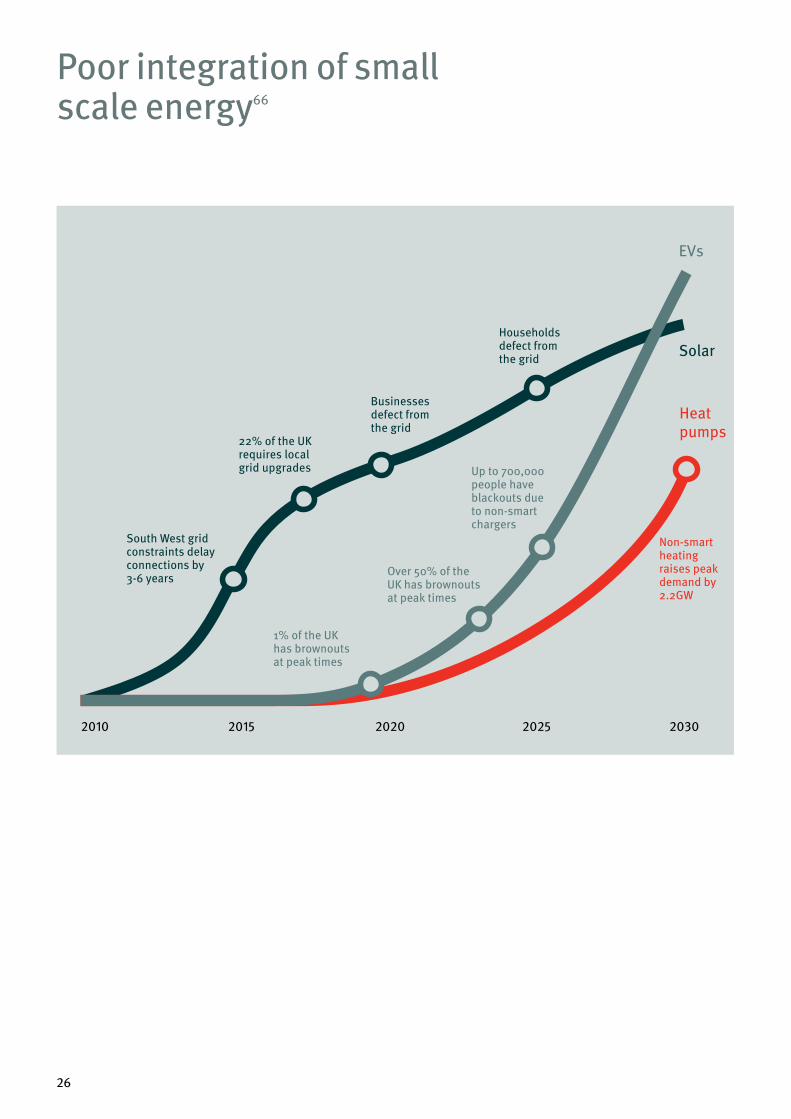
South West grid constraints delay connections by 3-6 years
22% of the UK requires local grid upgrades
Businesses defect from the grid
Households defect from the grid
EVs
Solar
Heat pumps
1% of the UK has brownouts at peak times
Over 50% of the UK has brownouts at peak times
Up to 700,000 people have blackouts due to non-smart chargers
Non-smart heating raises peak demand by 2.2GW
2010 2015 2020 2025 2030
Poor integration of small scale energy66
27
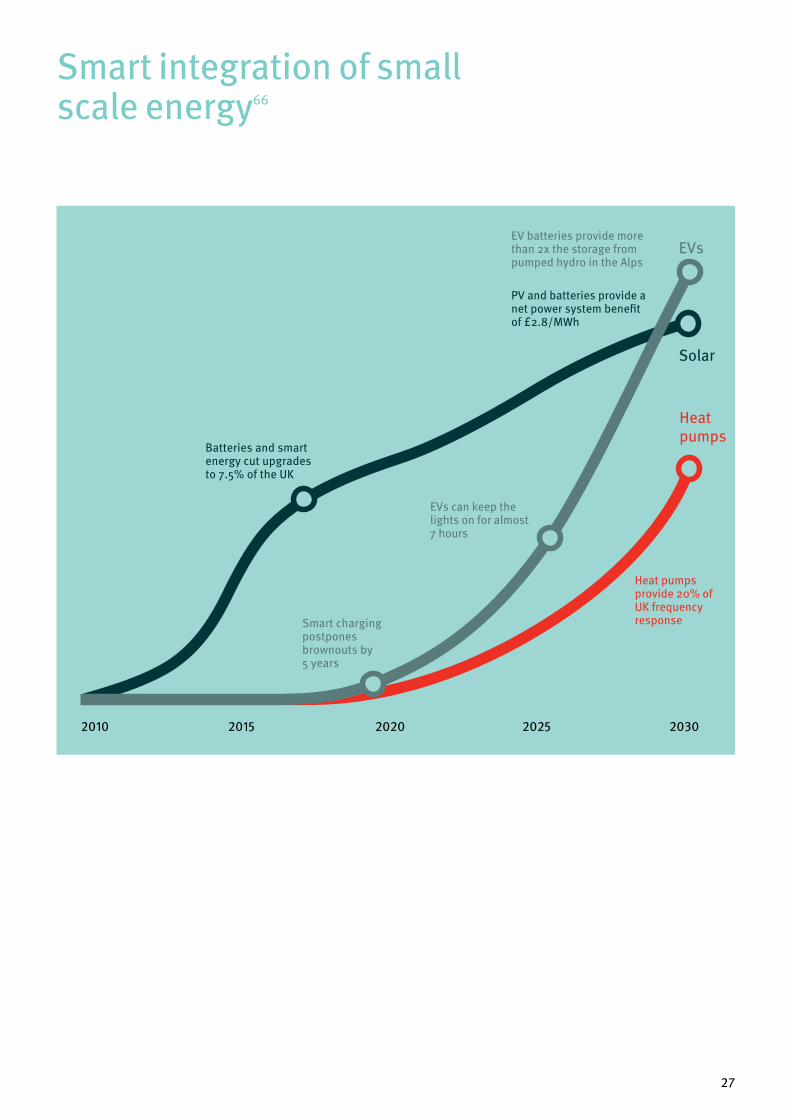
EVs
Solar
Heat pumps
2010 2015 2020 2025 2030
Batteries and smart energy cut upgrades to 7.5% of the UK
PV and batteries provide a net power system benefit of £2.8/MWh
EV batteries provide more than 2x the storage from pumped hydro in the Alps
Smart charging postpones brownouts by 5 years
EVs can keep the lights on for almost 7 hours
Heat pumps provide 20% of UK frequency response
Smart integration of small scale energy66
28
Governing the energy transition
29
“Since falling prices are a global trend, business as usual is not an option.”
The government will decide which energy future the UK ends up with. Its response to the challenges posed by small scale technologies should not be to prevent their deployment, especially if it desires a free market in unsubsidised low carbon energy options. The backlash seen in Nevada (see page 14) in response to attempts to restrict consumer choice is a vivid example of what policy makers should avoid. And, since falling prices of small scale technologies are a global trend, business as usual is not an option.
Instead, the government should see the growth of these technologies as an opportunity to give consumers real choice over their energy generation and consumption. But ending up with a smart, low carbon and affordable energy system will require the government to take an active, intelligent role in transitioning the UK energy system. There is a need for action in five areas:
Govern large energy infrastructure to support small scale energy choices To maximise consumer choice, a new underlying reasoning should be adopted. Small scale energy technologies should be the primary system driver. If the government wants a consumer led energy market, it should support small scale energy technologies, not with subsidy but with a power system designed to maximise their role. Large scale energy should be secondary: filling the gaps and providing the cheap, low carbon bulk power the UK needs.
Doing this means more explicitly governing large scale infrastructure, including electric heat and transport, an approach which underpins the energy systems in Germany, New York and Denmark, providing the coherence and visibility needed to facilitate private financing of delivery. In the UK, this will mean reforming the current complex and fragmented institutional framework governing the energy sector by creating an independent system designer.67
Create an independent body to guide system designLack of whole system design capability is one of the main limitations of the current energy system, particularly in relation to the future decarbonisation of transport and heat.68 If the government is to make good policy decisions, they need to be underpinned by robust technical analysis and option testing. Setting up an independent body to inform and translate the strategic decisions taken at government level into system design planning would help to ensure the best technical, economic and social outcomes.
Some system design functions are currently in the remit of the system operator within National Grid. However, its mandate is limited to the electricity system and the recent proposal to create a more independent system operator will not change this.69 As such, it will not be able to do the comprehensive system design required for optimal system performance in a distributed and complex energy landscape.
Instead, a successful system designer could be modelled on the system architect proposed by the Institution of Engineering and Technology, or based on the independent integrated system operator suggested by the University of Exeter.70 It would have a number of key functions, including: the provision of expert advice and modelling capability to support decision making across electricity, transport and heat; the development of plans, to support political decisions to optimise whole system functioning; analysing when strategic

30
decisions have to be taken, to avoid negative impacts of tipping points; and the identification of smart technical standards for emerging technologies.
Transform distribution network operators into distribution system operators The UK collects too little information about the location and capability of rapidly growing small scale energy installations. Almost all of this growth is happening at distribution level, beyond the immediate oversight of the system operator.
Distribution network operators (DNOs) are supposed to innovate and plan for changing demands, but too many of their forecasts rely on modelled assumptions, in part because installers and purchasers do not always notify them of new equipment.71 As a result, DNOs did not forecast the rapid growth of low carbon distributed generation which occurred up to 2016.72 The result was reactive network management and upgrades, which is costly.73
To solve this problem, distribution network operators need to evolve into distribution system operators. This new role would have three key aspects. First, they would need to actively monitor the deployment of small scale energy technologies. Second, they would need to manage the local network, directly or indirectly, in co-ordination with the system operator, including through operation of new technologies like battery storage.74 Finally, they should work with the system designer on strategic infrastructure planning, in line with modelled whole system options, tipping points and decisions across other energy sectors.
Enable small scale technologies to provide system flexibilityElectricity policy has been historically dominated by large scale energy infrastructure, and that bias persists, particularly when it comes to flexibility services.75 Distributed energy starts with limited access to markets for ancillary services and balancing for the transmission grid, while its services to distribution networks are undervalued.76 Similarly, battery storage is treated neither as generation nor as demand, which adds complexity to the connection process and results in double charging of storage operators upon charging and discharging of batteries. And proposed capacity market rule changes from incumbents risk undermining the ability of batteries to qualify to participate.77
While small scale technologies could provide useful system services, the UK’s response to their growth has been to try to limit it, instead of encouraging more flexiblility to support the system. For instance, Ofgem is consulting on reducing so-called ‘embedded benefit’, ie payments made to distribution-connected generation below 100MW, which is expected to undermine small scale, local generation and the emerging storage industry.78 And potential low carbon flexibility from distributed resources went untapped over the last three winters, while the £180 million Supplemental Balancing Reserve went unused which, like its successor, the capacity market, mostly supported old and polluting coal units.79
A better solution would be to enable small scale technologies to participate in a stratified capacity market, where different types of flexibility can be procured through separate auctions.80 The example from California (page 23) highlights how aggregated EV charging and discharging could bid into the capacity market.
31
In principle, such a solution could be applied at the local level as well as national, with trials for local balancing already underway in the UK and abroad. 81
Use automation and aggregators to make ‘time of use’ tariffs attractiveCurrently, system costs, ie payments for the grid, flexibility and backup, are paid mainly on an electricity consumption per unit basis (£/kWh). As more consumers opt for self-generation, this charging model shifts costs, currently around 24 per cent of electricity bills, onto those consumers that cannot afford small scale energy technologies. And customers have no way of knowing when they are adding to system costs, for example by consuming or producing power at the wrong time.
‘Time of use’ tariffs are not a solution on their own. As the Sunshine Tariff example shows (page 20), there is little demand for them in the absence of automation, with the result that imposing them is more likely to lead to backlash than a reconfiguring of supply and demand patterns.
Instead, automation and aggregators should be used. Smart appliances, EVs and heat pumps can facilitate demand management by automating responses to ‘time of use’ tariffs. Studies show peak demand reduction is 60 to 200 per cent higher for smart tariffs with automation compared to those without.82 This matters, because, by 2030, EVs and heat pumps could contribute to 82 per cent of National Grid’s forecast frequency response requirements, with potential yearly revenues of £45 per EV and £70 per residential heat pump.83
If automation is to be taken up, it needs to be built into appliances, chargers and small scale generation. However, there are no mandatory standards to ensure the deployment, interoperability or security of these smart technologies. Many appliances have long replacement cycles, so a lack of standards will, at best, delay progress towards a smart grid or, at worst, result in infrastructure lock-in. For example, including frequency response capability in new EV charging points is straightforward, while retrofitting existing charge points would be challenging, both in terms of physically fitting the components and in integrating with existing hardware and software.84
The government is making progress in this area, and has announced that its Modern Transport Bill will outline requirements for smart charge point grid balancing.85 This should extend beyond EVs to domestic appliances and heat pumps. Direction on technical requirements should be provided by the system designer, followed by government approval, which should further consider how to ensure interoperability, consumer data privacy and grid security.
These technology rules should be supported by Ofgem regulation to encourage new aggregators that can help customers become more flexible, building on its ‘innovation link’ proposals.86 There is clearly interest in this, with new entrants, like Google’s Deep Mind, exploring opportunities to use artificial intelligence in energy balancing, while existing players, including E.ON and RWE are shifting their business models to facilitate a distributed, consumer led energy system.87
32
Conclusion
The UK can have both a vibrant consumer led market in small scale technology, and economically viable large scale infrastructure which is able to make the overall system flexible, resilient, low carbon and affordable. But this will not happen without more active and strategic involvement by the government in whole system design.
Small scale technologies are disrupting the UK energy system, driven by consumer preference and falling prices. The old system, dominated by passive customers buying power from big and distant power stations, will change into one where homeowners and businesses play an increasingly active role, by installing small scale energy technologies. In this new system, centralised, large scale technology will continue to be essential, but will have to operate alongside distributed, small scale energy, helping to fill the gaps and provide the bulk power the UK will undoubtedly need.
This changing dynamic between large and small sources of power is the real energy policy problem UK politicians now need to address. The government cannot avoid the problem, but if it wants to maximise its role in improving market decisions, it should actively govern the new energy future which is rapidly unfolding.
33
Annex
Analysis of technology tipping pointsTechnology uptake curves are based on data from: National Grid, 2016, Future Energy Scenarios (solar PV); C Cluzel et al, 2013, Pathways to high penetration of electric vehicles (EVs); and Frontier Economics, 2013, Pathways to high penetration of heat pumps (heat pumps, based on the critical path).
Technology timeline for PV: points are based on information reported by Western Power Distribution.88 Distribution grid constraints refer to the need for grid upgrades as reported by Ofgem.89 Domestic and non-domestic customers grid defection is assumed to take place once the levelised cost of electricity is equal or lower to the retail electricity tariff.90 Reduced need for grid upgrades is calculated based on 66 per cent greater penetration of solar that can be achieved if coupled with smart use of battery storage.91 Reported intermittency cost for 40GW of solar with 8GW of batteries are scaled to 30GW of PV deployed in 2030, since PV integration costs display a linear relationship with solar capacity and we assume that costs of battery deployment also vary linearly.92 Costs of battery deployment would be even lower if EV batteries were utilised for balancing of PV generation.
Technology timeline for EVs: points are based on a 2013 analysis of EVs integration using data from Nord-Trondelag Elektrisitetsverk, which demonstrated that an EV penetration of seven per cent results in brownouts. Once penetration reaches 50 per cent, localised blackouts are observed. The same study shows that smart charging can mitigate voltage fluctuations for up to 20 per cent EV penetration levels.93 Based on the forecast uptake of EVs in the UK (penetration of EVs is 1.9 per cent in 2020, 13 per cent in 2025 and 37 per cent in 2030, see above), deployment was modelled based on seven clusters to account for uneven uptake across the UK.94 Potential storage provided by EVs is based on an average 50kWh battery per vehicle, which is compared to the average UK power demand and the energy storage available from building pumped hydro in the Alps.95
Technology timeline for heat pumps: the rise in peak demand is calculated as the difference between the business as usual and smart scenarios as modelled by Pudjianto et al.96 The relative rise in peak demand was scaled to the forecast number of heat pumps in 2030 (see above) and compared to the current peak demand.97 Frequency response was calculated based on the reported potential of 30 per cent of projected 2030 requirement resulting from 3.8 million heat pumps, scaled to 2.6 million heat pumps in 2030.98
34
Endnotes
1 Department of Energy and Climate Change, 2015, Amber Rudd’s speech on a new direction for UK energy policy
2 D Roberts, 12 October 2015, ‘The International Energy Agency consistently underestimates wind and solar power. Why?’, Vox
3 M Lockwood, 6 May 2016, ‘New thinking: solar surprise, revisited’, IGov
4 A Vaughan, 7 March 2017, ‘Solar power growth leaps by 50% worldwide thanks to US and China’, The Guardian
5 M Liebreich, 23 November 2016, PRASEG guest lecture; G Redi and G Wynn, 2015, The future of solar power in the United Kingdom, Energies, Volume 8, p 7818-7832
6 National Grid, 2016, Future Energy Scenarios7 IRENA, 2015, Battery storage for renewables:
market status and technology outlook8 McKinsey & Company and Bloomberg, 2016, An
integrated perspective on the future of mobility9 IRENA, 2015, Renewables and electricity storage: a
technology roadmap for Remap 2030; G Redi and G Wynn, 2015, op cit
10 Source: adapted from REA, 2015, UK solar beyond subsidy: the transition, a REA report produced by KPMG
11 M Liebreich and A McCrone, 18 January 2017, ‘The shift to ‘base-cost’ renewables: 10 predictions for 2017’, Bloomberg New Energy Finance (BNEF)
12 J Murray, 27 March 2017, ‘Survey: 40 percent of drivers would consider buying an EV’, BusinessGreen; BNEF, 25 February 2016, ‘Electric vehicles to be 35% of global new car sales by 2040’, BNEF
13 BNEF, 25 February 2016, op cit14 T Randall, 12 October 2016, ‘Tesla dominates U.S.
luxury sedan sales’, BNEF15 Source: adapted from BNEF, 25 February 2016,
op cit; T Randall, 25 February 2016, ‘Here’s how electric cars will cause the next oil crisis’, BNEF
16 E Howard, 27 May 2016, ‘Ikea vows to be net exporter of renewable energy by 2020’, The Guardian
17 Scunthorpe Telegraph, 15 February 2015, ‘New solar park’s green energy for Tata Steel Scunthorpe will mean 20,000 tonnes less carbon dioxide being released’
18 P Clark, 22 June 2016, ‘Nestlé buys into Scottish wind power’, Financial Times
19 D Pratt, 6 March 2017, ‘Amazon announces global solar roll-out by 2020’, Clean Energy News
20 M Geuss, 3 February 2017, ‘Amazon pledges to cover 15 massive warehouse rooftops with solar panels’, Ars Technica
21 G Redi and G Wynn, 2015, op cit22 Aurora Energy Research, 15 June 2016,
www.twitter.com/AuroraER_Oxford/status/743126219328237569
23 Carbon Connect, 2014, Pathways for heat: low carbon heat for buildings
24 SEIA, 2016, State Solar Policy: Nevada Solar www.seia.org/state-solar-policy/nevada
25 J Hidalgo, 13 September 2016, ‘Nevada regulators unanimously approve rooftop solar grandfathering deal’, Reno Gazette-Journal
26 J Hidalgo, 16 May 2015, ‘Net metering, solar cap debate sizzles in Nevada’, Reno Gazette-Journal
27 Nevada Public Utilities Commission, 2015, Order, Docket No. 15-07042, Document ID No. 8414, www.puc.nv.gov/Dockets/Dockets
28 SolarCity, 6 January 2016, ‘Following Nevada PUC’s Decision to Punish Rooftop Solar Customers, SolarCity Forced to Eliminate More than 550 Jobs in Nevada’
29 S Lucas, 28 December 2015, ‘In NLV speech, Sanders calls PUC solar decision “just about the dumbest thing I have ever heard”’, Las Vegas Sun
30 Nevada Public Utilities Commission, 2016, Docket Number 16-06006, www.pucweb1.state.nv.us/PDF/AXImages/Agendas/25-16/6801.pdf; D Rothberg, 20 September 2016, ‘Sandoval shakes up PUC by appointing 2 new commissioners’, Las Vegas Sun
31 SEIA, ‘New Mexico Solar’, www.seia.org/state-solar-policy/new-mexico
32 D Roberson et al, 2014, Performance assessment of the PNM prosperity electricity storage project, SAND 2014-2883
33 P Hockenos, 7 February 2017, ‘Power to the EV: Norway spearheads Europe’s electric vehicle surge’, The Guardian
34 NRK, 2 May 2014, ‘El-bil-eiere kan få sjokkregning’, www.nrk.no/ho/forbyr-elbiler-a-hurtiglade-1.11692959; DN, 2 May 2014, ‘Sier nei til hurtigladere’, www.dn.no/privat/dnBil/2014/05/02/Elbil/sier-nei-til-hurtigladere
35 S Aggarwal and R Orvis, 2016, Grid flexibility: methods for modernizing the power grid, Energy Innovation
36 Western Power Distribution, 14 April 2015, ‘DG Connections’, presentation
37 Ofgem, 2017, Unlocking the capacity of the electricity networks
38 Green Alliance analysis of: Ofgem, 2017, ibid. 40-50 per cent of all DNO license areas are severely constrained to accept large distributed generation units without either flexible connections or grid reinforcements. Cornwall falls within the South West distribution network area. Solar capacity data was obtained from: Renewable Energy March 2017, at www.cornwall.gov.uk/media/8997290/Renewable-Capacity-Data.pdf (accessed on 10 April 2017); timeline of deployment taken from: P Bratby, 2016, The disastrous impact of renewable energy in Devon
39 Ofgem, 2017, Unlocking the capacity of the electricity networks
40 KfW, 18 April 2013, ‘KfW and Federal Environment Ministry launch programme to promote use of the energy storage in solar PV installations’; IRENA, 2015, Renewables and electricity storage: a technology roadmap for Remap 2030

35
41 A Jones, 2017, Germany’s energy transition. A survey of energy storage policies
42 IRENA, 2015, Battery storage for renewables:market status and technology outlook
43 IRENA, 2015, Renewables and electricity storage: a technology roadmap for Remap 2030; Jones, 2017, op cit; The Energy Collective, 18 July 2016, ‘Germany sets a new solar storage record’
44 Source: adapted from Bundesverband Solarwirtschaft, www.solarwirtschaft.de/en
45 Western Power Distribution and Regen SW, 2017, Sunshine tariff summary report; Frontier Economics, 2015, Future potential for DSR in GB, a report prepared for DECC by Frontier Economics with support from LCP and Sustainability First; DECC, 2012, Demand side response in the domestic sector – a literature review of major trials, undertaken by Frontier Economics and Sustainability First
46 Western Power Distribution and Regen SW, 2017, ibid
47 Energy Policy Research Group, 13 May 2016, ‘Exploring the market for demand-side response’, presentation
48 Environmental Change Institute and Oxford Institute for Energy Studies University of Oxford, 2015, Assessment of demand response market potential and benefits in Shanghai
49 Energy Policy Research Group, 13 May 2016, op cit; Ofgem, 2016, Aggregators – barriers and external impacts
50 Environmental Change Institute and Oxford Institute for Energy Studies University of Oxford, 2015, op cit
51 Ibid52 Source: adapted from Aurora Energy Research
graphic, tweeted on 15 June 2016, www.twitter.com/AuroraER_Oxford/status/ 743126219328237569
53 C Cluzel et al, 2013, Pathways to high penetration of electric vehicles – report prepared for Committee on Climate Change
54 P Papadopoulos et al, 2012, Electric vehicles’ impact on British distribution networks. IET Electr Syst Transp
55 Green Alliance analysis of: deprivation indices data for 2015 (taken from http://dclgapps.communities.gov.uk/imd/idmap.html), assuming 33 per cent of EV penetration and an average UK household of 2.5 inhabitants.
56 L Phillips, 2015, Norway’s electric vehicle revolution: Lessons for British Columbia
57 D Pudjianto et al, 2013, ‘Smart control for minimizing distribution network reinforcement cost due to electrification’, Energy policy, Volume 42, p 76-84
58 eMotorWerks, 11 January 2016, ‘eMotorWerks awarded contracts in California ISO’s demand response auction mechanism’
59 J Pyper, 21 November 2016, ‘How electric vehicles are becoming a tool for grid stability’, Greentech Media; H K Trabish, 21 November 2016, ‘How California utility regulators are turning electric vehicles into grid resources’, Utility Dive
60 A Vaughan, 20 March 2017, ‘Charge electric cars smart to take pressure off national grid – minister’, The Guardian
61 Nissan Insider, 10 May 2016, ‘Nissan and Enel launch vehicle-to-grid trial’
62 Green Alliance analysis of: G Rudelle, 19 October 2016, ‘eStorage project update’, presentation
63 P Hummel et al, 2013, European utilities, UBS Investment Research
64 Green Alliance analysis of: S A Tassou et al, 2011, ‘Energy consumption and conservation in food retailing’, Applied thermal engineering, Volume 31, p 147-156. Supermarkets represent roughly three per cent of the total electricity demand in the country. Considering the country’s total yearly demand of 300TWh, 9TWh can be attributed to supermarkets.
65 L Sussams and J Leaton, 2017, Expect the unexpected. The disruptive power of low-carbon technology, Carbon Tracker Initiative and Grantham Institute Imperial College London
66 See Annex67 K MacLean, 2016, Energy governance and
regulation frameworks – time for a change?, a paper for the ETI
68 Ibid69 Ofgem, 2017, Future arrangements for the
electricity system operator: its role and structure70 Institution of Engineering and Technology, 2014,
Britain’s power system. The case for a system architect; C Mitchell et al, 2016, Governing for innovation, sustainability and affordability: an institutional framework
71 M Lockwood, 2014, Energy networks and distributed energy resource in Great Britain
72 Ibid; M Lockwood, 6 May 2016, op cit73 P Heptonstall et al., 2017, The costs and impacts of
intermittency – 2016 update, UKERC74 Western Power Distribution, 26 May 2016,
‘Transition from DNO (Distribution Network Operator) to DSO (Distribution System Operator)’, presentation, www.projects.exeter.ac.uk/igov/wp-content/uploads/2016/06/WPD-DSP_DSO-26_05_16.pdf
75 BEIS and Ofgem, 2016, A smart, flexible energy system; S Hall and K Roelich, 2016, ‘Business model innovation in electricity supply markets: the role of complex value in the United Kingdom’, Energy Policy, Volume 92, p 286-298
76 For details concerning how embedded generation is undervalued, see: Cornwall Energy, 2016, A review of embedded benefits accruing to distribution connected generation in GB, a report commissioned by the Association for Decentralised Energy

36
77 BEIS and Ofgem, 2016, op cit; L Glazebrook, 22 September 2016, ‘Proposal for a capacity market rules change’, www.ofgem.gov.uk/system/files/docs/2016/09/engie_-_capacity_market_rules_cp164.pdf
78 Ofgem, 2017, ‘Embedded benefits: consultation on CMP264 and CMP265 minded to decision and draft impact assessment’; M Lockwood, 13 March 2017, ‘The embedded generator saga and codes governance’
79 ECIU, 2017, Overpowered: has the UK paid over the odds for energy security?
80 A Mount, E Coats and D Benton, 2016, Smart investment: valuing flexibility in the UK electricity market, Green Alliance; P Heptonstall et al, 2017, The costs and impacts of intermittency – 2016 update, UKERC
81 Centrica, 22 February 2017, ‘Centrica launches local energy market to Cornish businesses’; B Nogrady, 22 February 2017, ‘Australian consortium launches world-first digital energy marketplace for rooftop solar’, The Guardian
82 Frontier Economics, 2015, op cit; BEIS and Ofgem, 2016, op cit
83 Element Energy, 2015, Frequency sensitive electric vehicle and heat pump power consumption, a report for National Grid
84 Ibid85 D Pratt, 13 February 2017, ‘Government sets out
new powers to shape electric vehicle charging infrastructure’, Clean Energy News
86 Ofgem, 2017, The Innovation Link, www.ofgem.gov.uk/about-us/how-we-engage/innovation-link
87 M Murgia and N Thomas, 12 March 2017, ‘DeepMind and National Grid in AI talks to balance energy supply’, Financial Times; S Jennings, 23 May 2016, ‘Innovation in the energy utilities sector’, PwC
88 Western Power Distribution, 14 April 2015, op cit89 Ofgem, 2017, Unlocking the capacity of the
electricity networks 90 REA, 2015, UK solar beyond subsidy: the transition,
p 18-19
91 Speicherstudie 2013 cited in: H Wirth, 2017, Recent facts about photovoltaics in Germany, Fraunhofer ISE
92 Aurora Energy Research, 2016, Intermittency and the cost of integrating solar in the GB power market, a report commissioned by the Solar Trade Association
93 Øystein Sagosen, 2013, Analysis of large scale integration of electric vehicles in Nord-Trøndelag, NTNU-Trondheim
94 Imperial College and Element Energy, 2014, Infrastructure in a low-carbon energy system to 2030: Transmission and distribution, p 56, table 25
95 Energy in the United Kingdom, https://en.wikipedia.org/wiki/Energy_in_the_United_Kingdom#cite_note-3, accessed on 10 April 2017; G Rudelle, 19 October 2016, op cit
96 D Pudjianto et al, 2013, op cit97 Frontier Economics, 2013, Pathways to high
penetration of heat pumps98 Element Energy, 2015, op cit


Green Alliance11 Belgrave RoadLondon SW1V 1RBT 020 7233 [email protected]
blog: greenallianceblog.org.uktwitter: @GreenAllianceUK
The Green Alliance Trust Registered charity no. 1045395 Company limited by guarantee (England and Wales) no. 3037633Registered at the above address