how carmax uses mpulse - akamai€¦ · • carmax sought out to innovate • transitioned to...
TRANSCRIPT

How CarMax uses mPulseInsights to Support Product Innovation
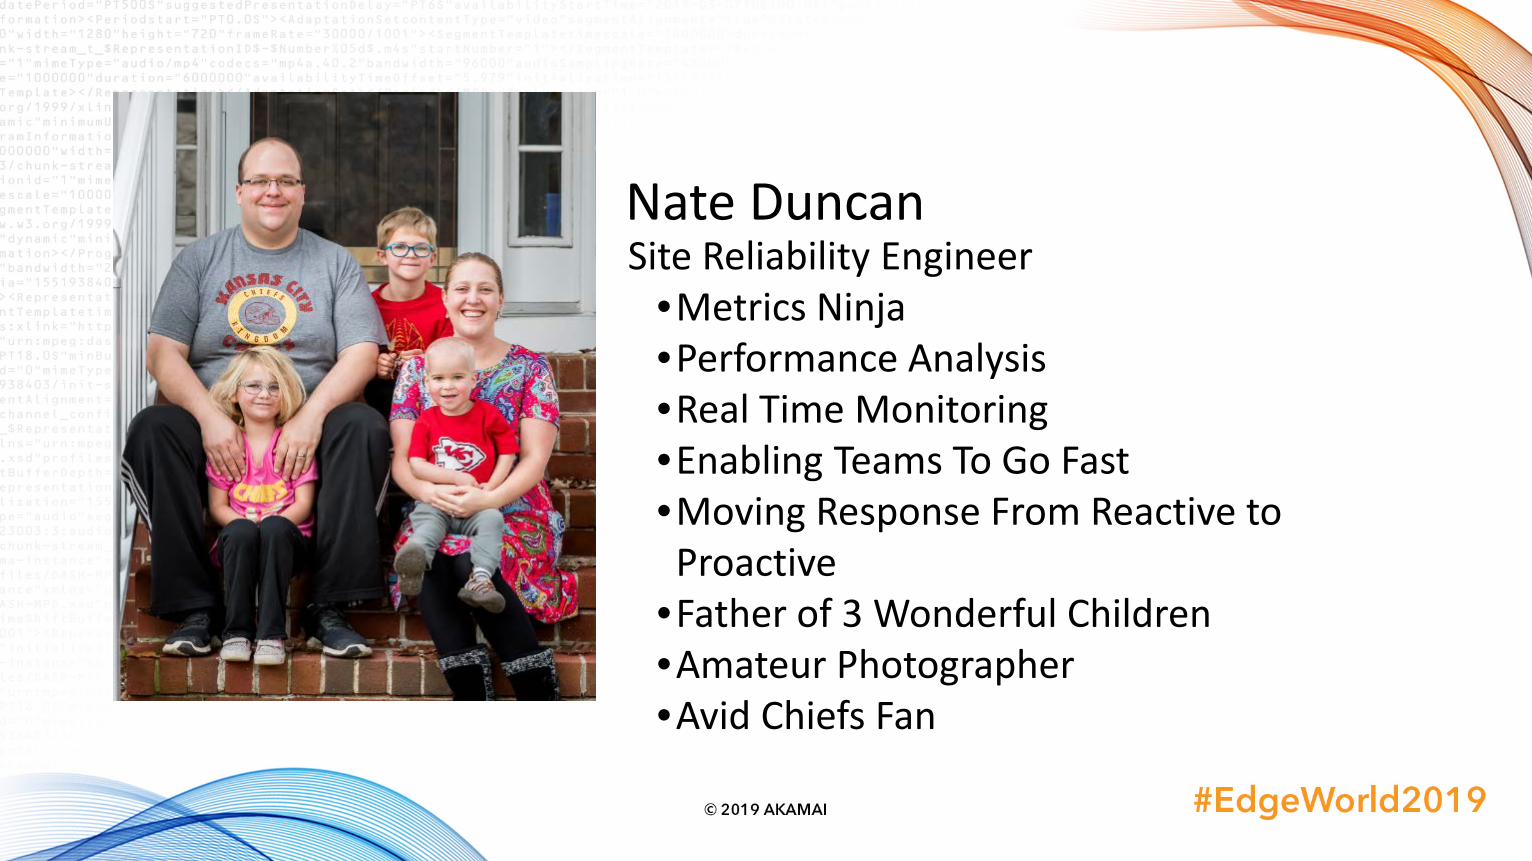
Nate DuncanSite Reliability Engineer
•Metrics Ninja•Performance Analysis•Real Time Monitoring•Enabling Teams To Go Fast•Moving Response From Reactive to Proactive
•Father of 3 Wonderful Children•Amateur Photographer•Avid Chiefs Fan
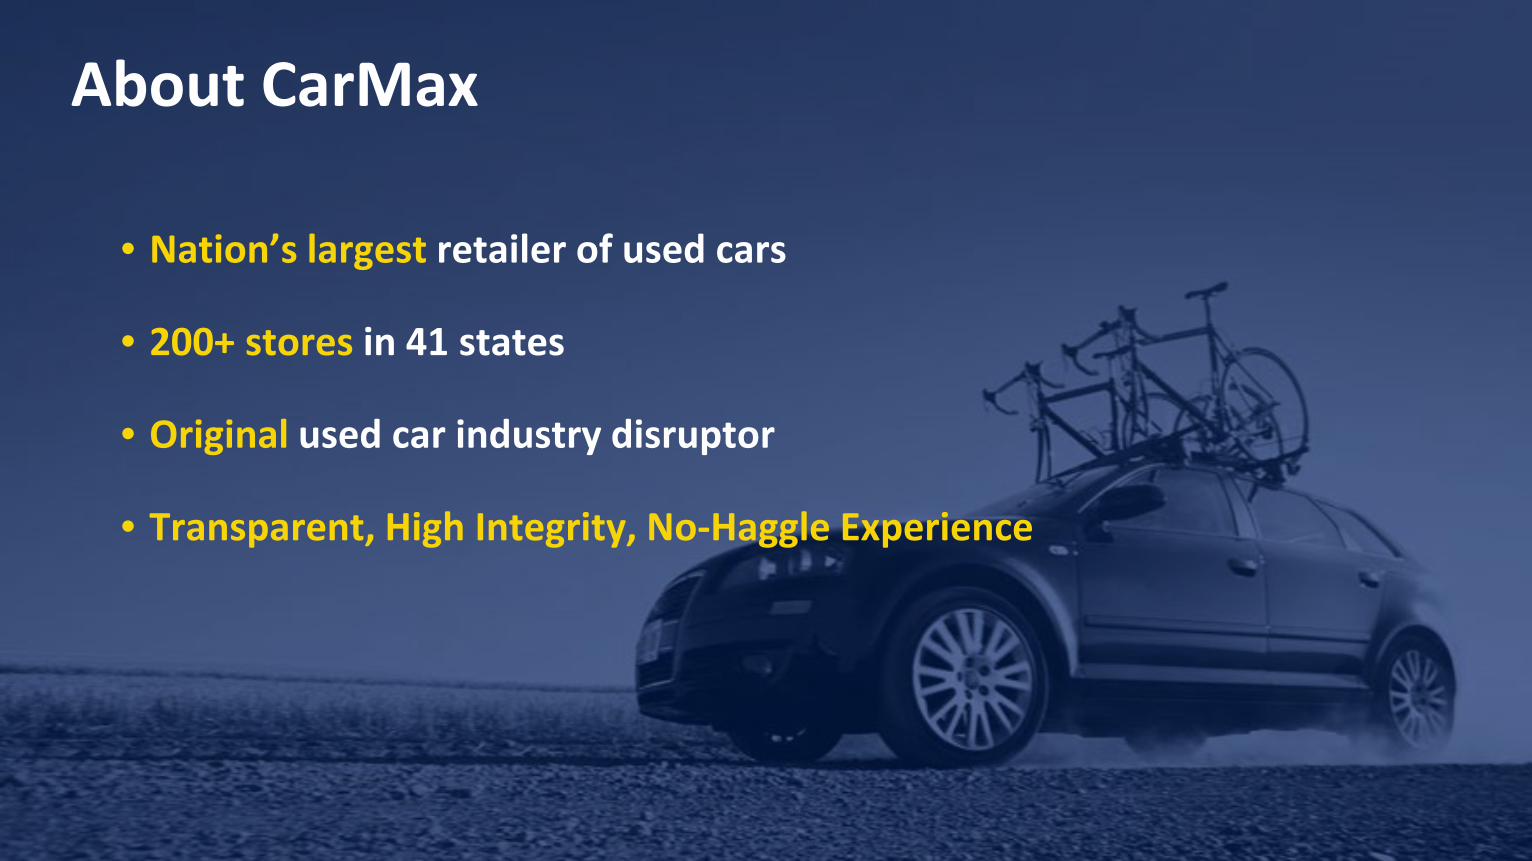
• Nation’s largest retailer of used cars
• 200+ stores in 41 states
• Original used car industry disruptor
• Transparent, High Integrity, No-Haggle Experience
About CarMax

To drive integrity by being
honest & transparent in every interaction
Our Purpose

About CarMax.com• Millions of website hits per day• Hybrid Model
o 100+ .NET Applications, Sites, and Services On-Prem
o 50+ .NET Azure AppServiceso Mix of On-Prem and Cloud
Infrastructure• Active migration into the cloud

Business Needs• Commitment to customer
experience• Competition
o Increased competitiono Advanced Technology
• Changing Needso Enabling Customerso Online Shoppingo More Technologyo Seamless Experienceo Help on Their Terms
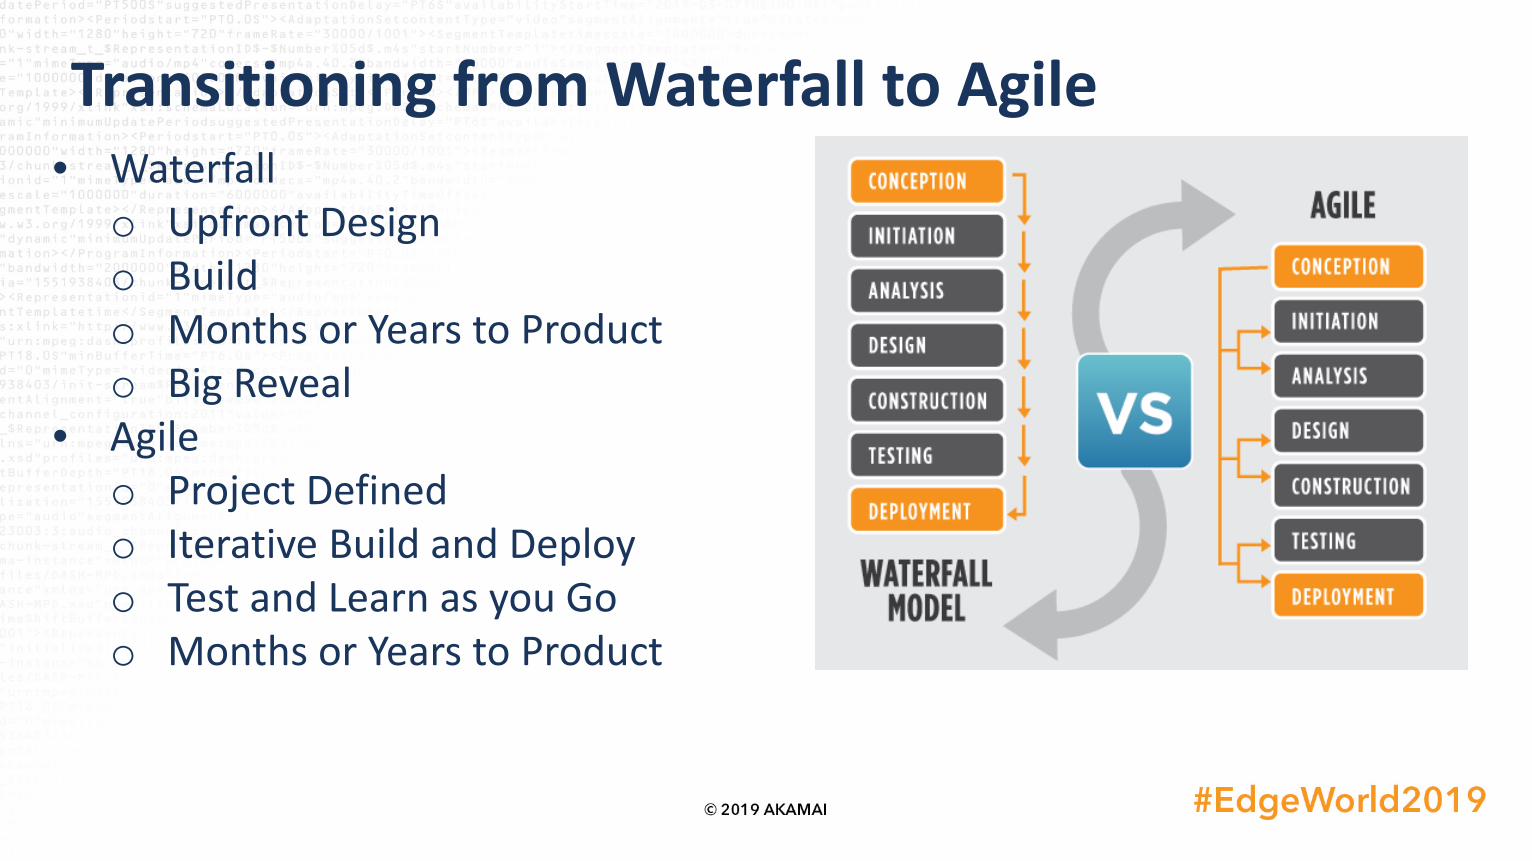
Transitioning from Waterfall to Agile• Waterfall
o Upfront Designo Buildo Months or Years to Producto Big Reveal
• Agileo Project Definedo Iterative Build and Deployo Test and Learn as you Goo Months or Years to Product
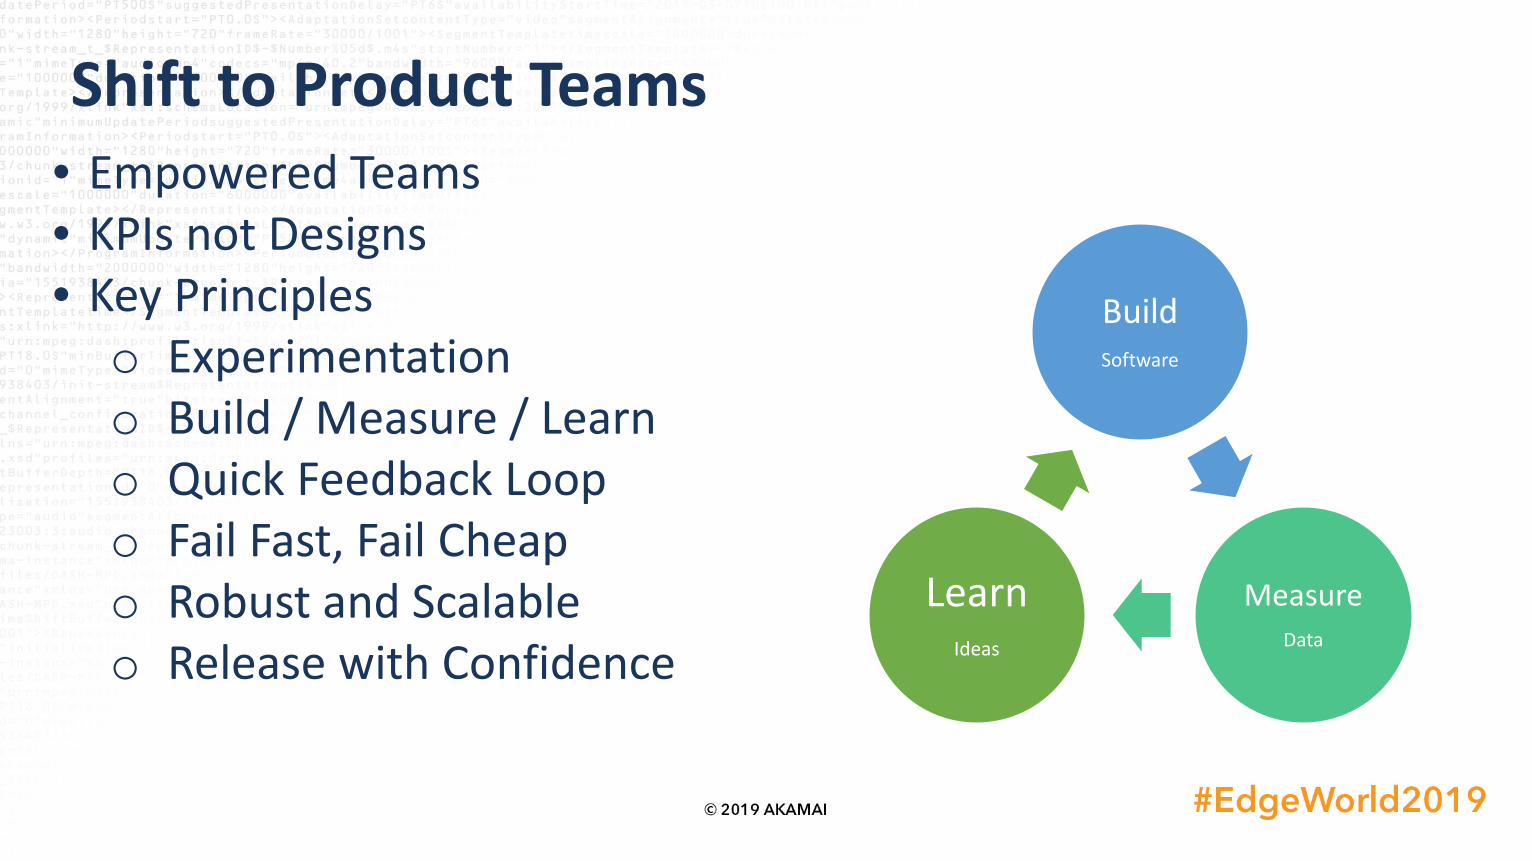
Shift to Product Teams• Empowered Teams• KPIs not Designs• Key Principleso Experimentationo Build / Measure / Learno Quick Feedback Loopo Fail Fast, Fail Cheapo Robust and Scalableo Release with Confidence
BuildSoftware
MeasureData
LearnIdeas
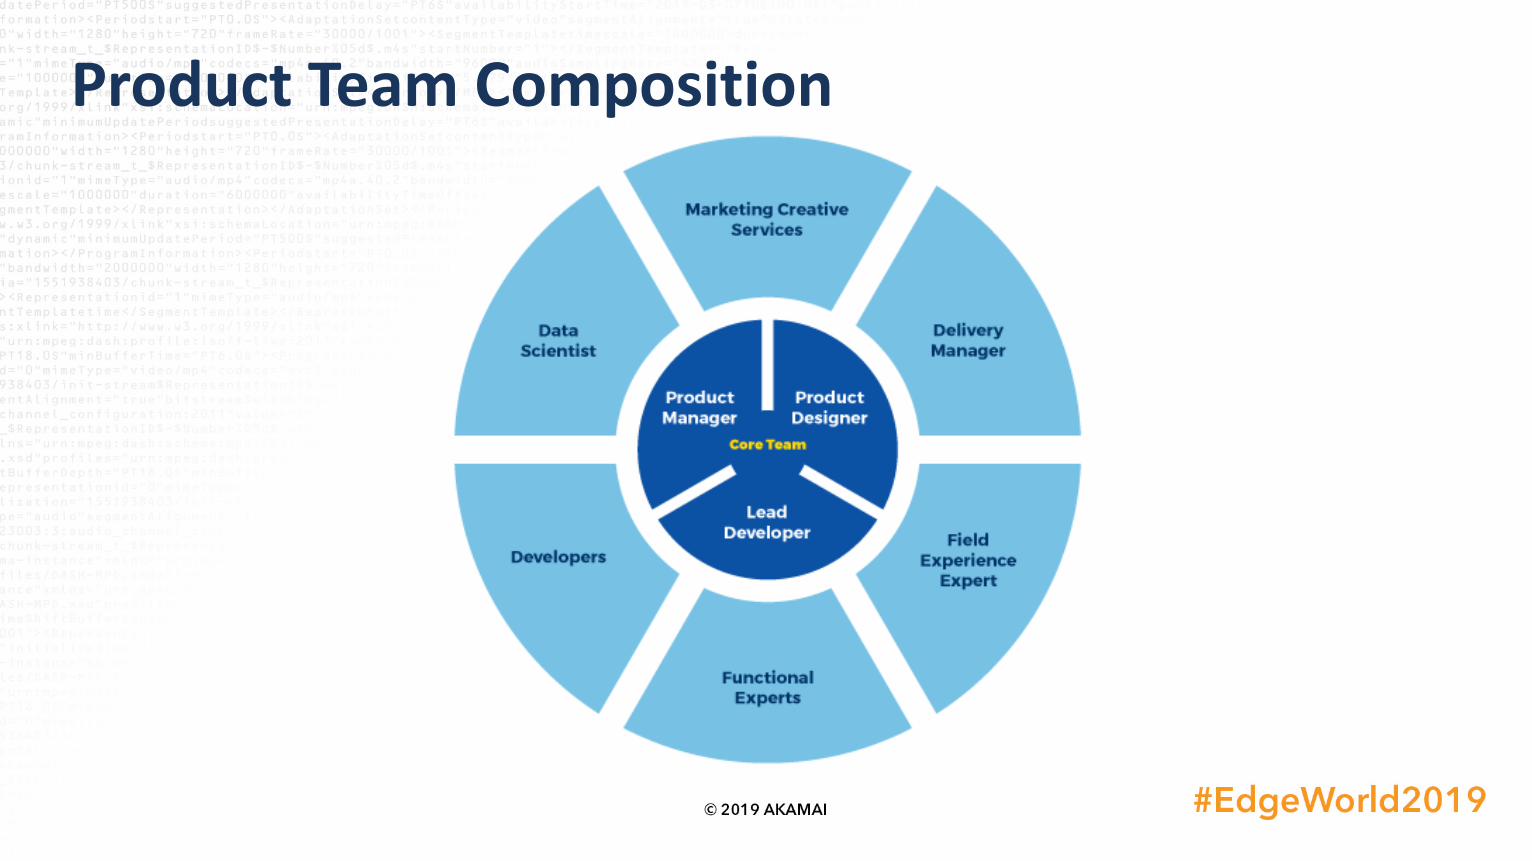
Product Team Composition
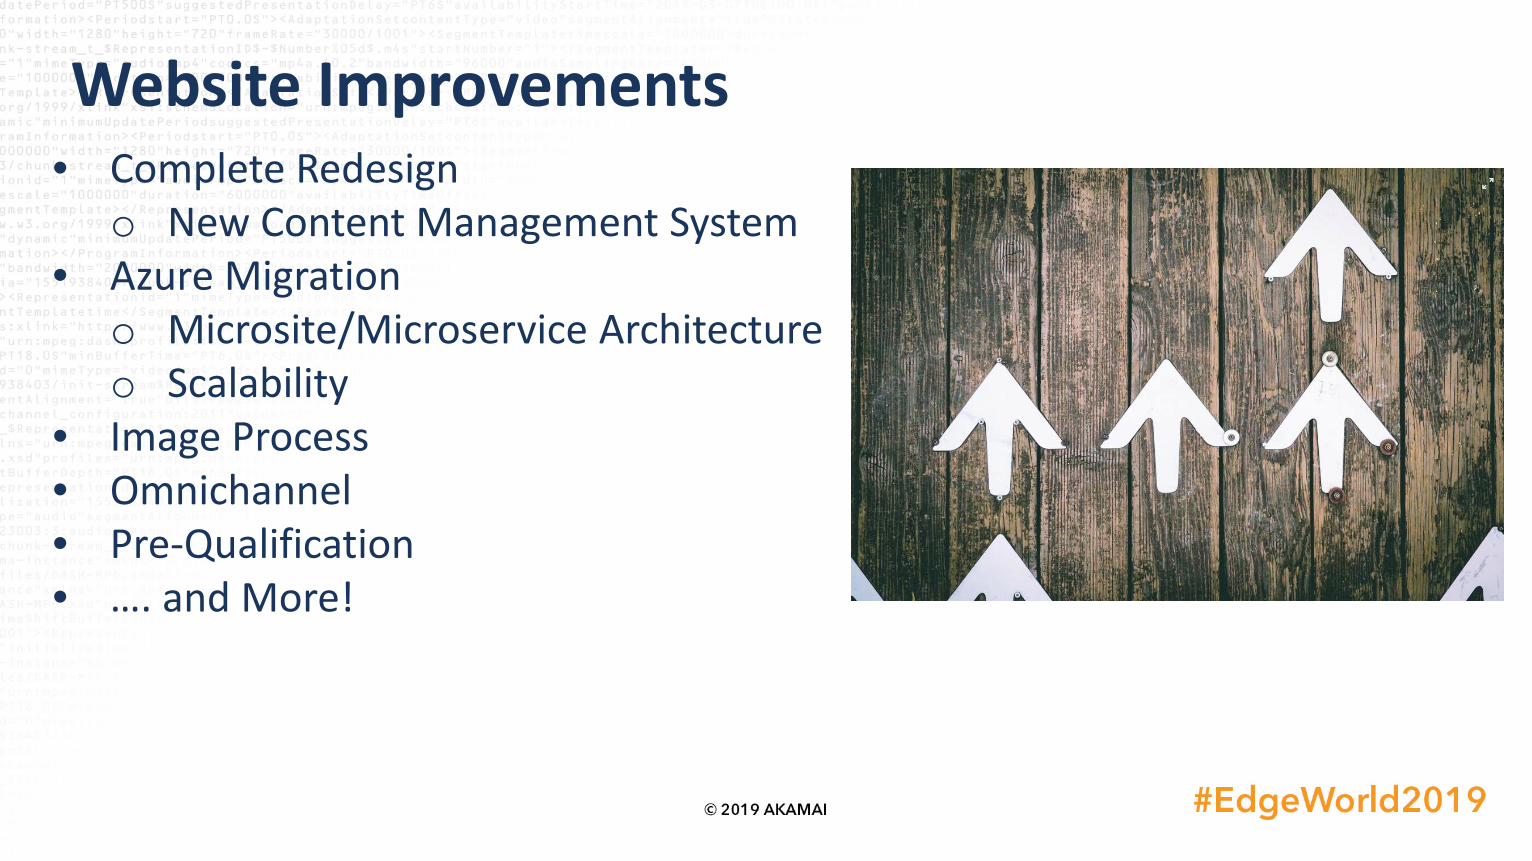
Website Improvements• Complete Redesign
o New Content Management System• Azure Migration
o Microsite/Microservice Architectureo Scalability
• Image Process• Omnichannel• Pre-Qualification• …. and More!
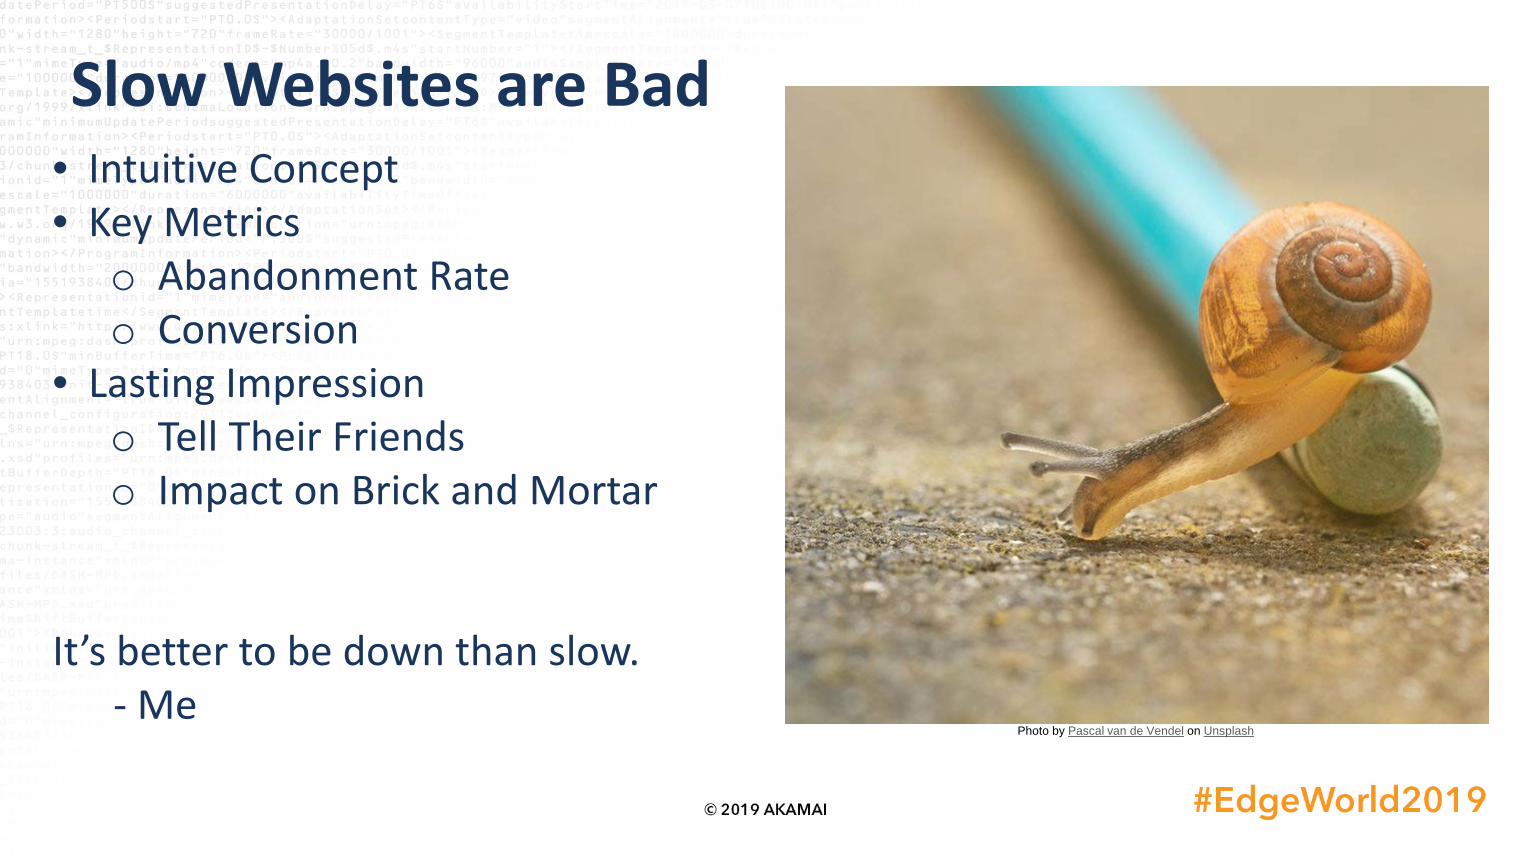
Slow Websites are Bad• Intuitive Concept• Key Metrics
o Abandonment Rateo Conversion
• Lasting Impressiono Tell Their Friendso Impact on Brick and Mortar
It’s better to be down than slow.- Me
Photo by Pascal van de Vendel on Unsplash
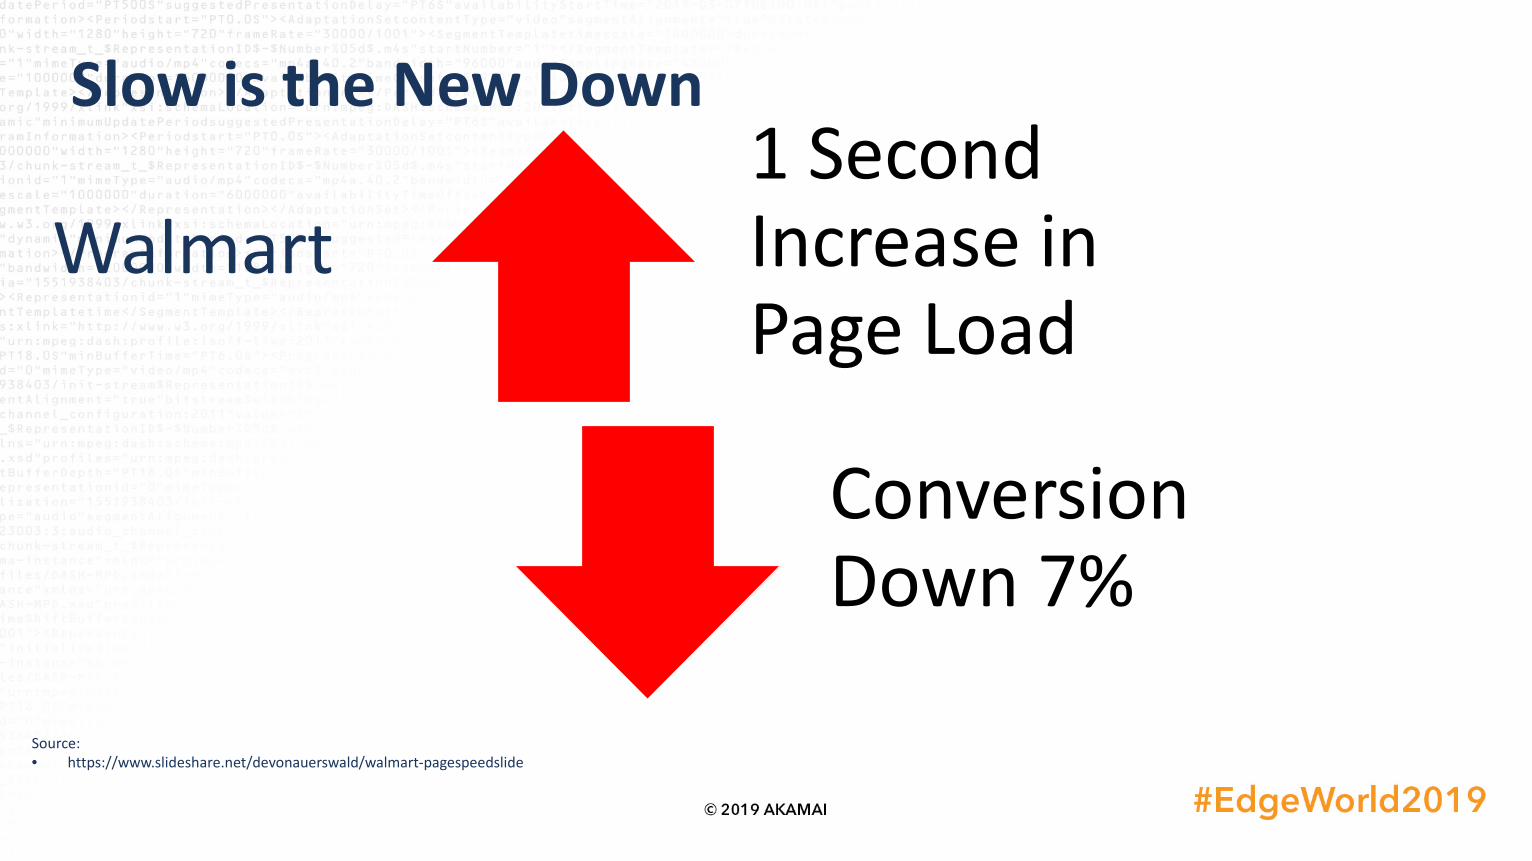
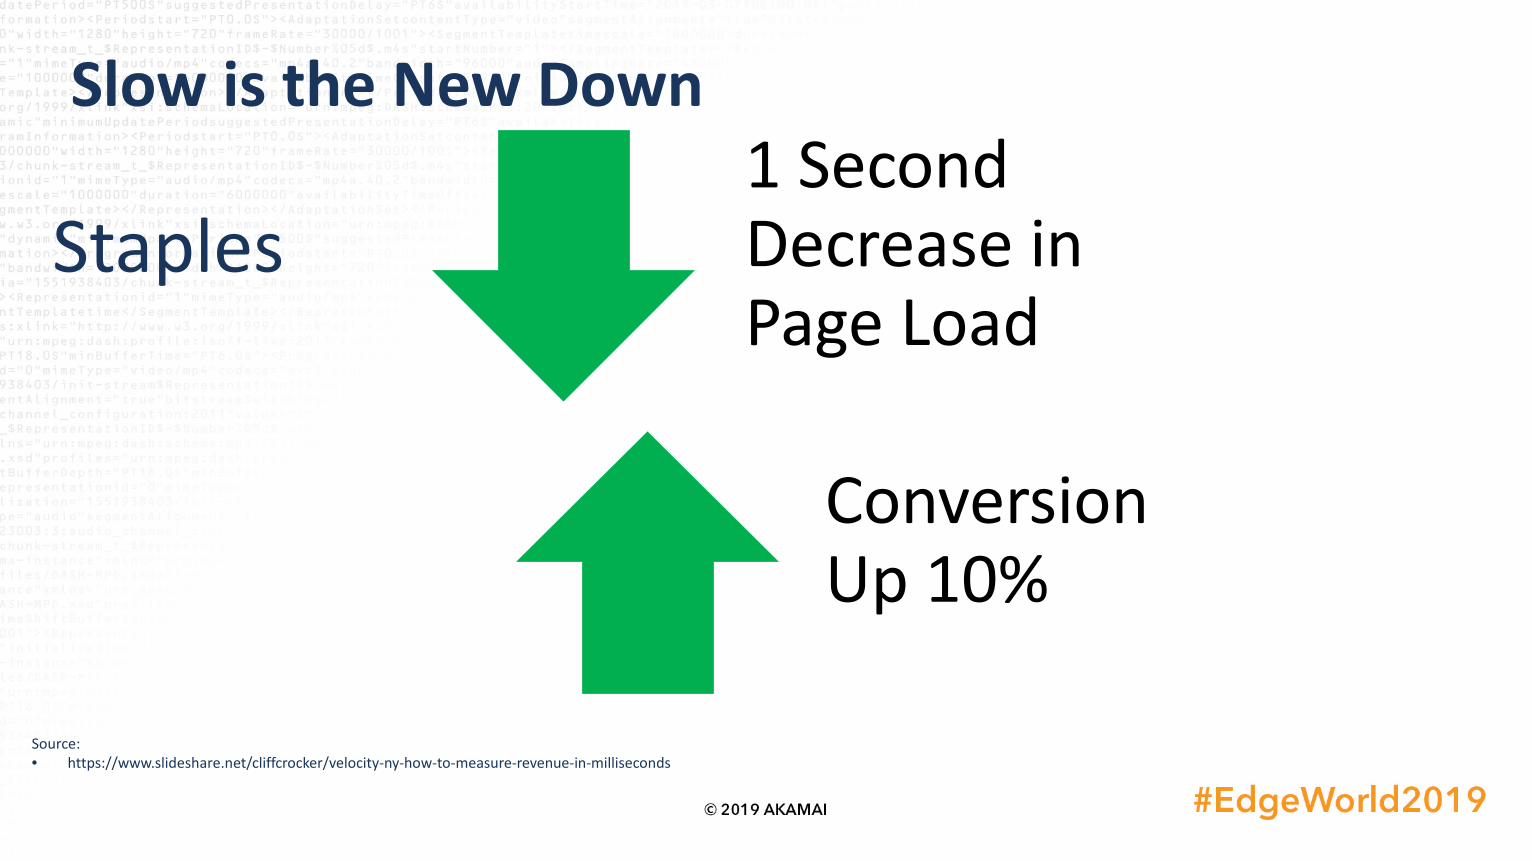
Slow is the New Down
Walmart
Source:• https://www.slideshare.net/devonauerswald/walmart-pagespeedslide
1 Second Increase in Page Load
Conversion Down 7%
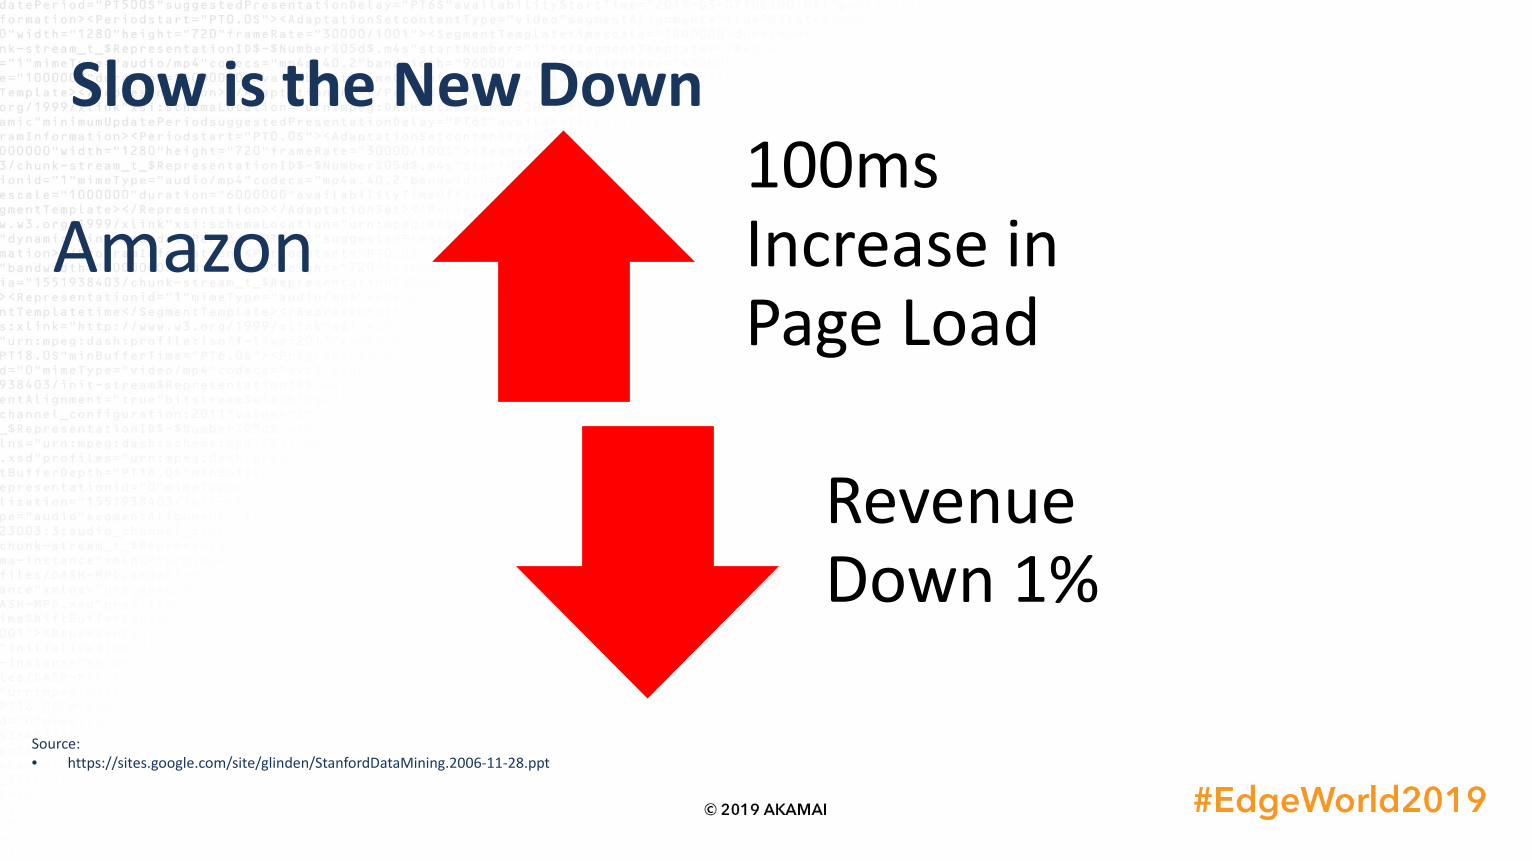
Slow is the New Down
Amazon
Source:• https://sites.google.com/site/glinden/StanfordDataMining.2006-11-28.ppt
100ms Increase in Page Load
Revenue Down 1%
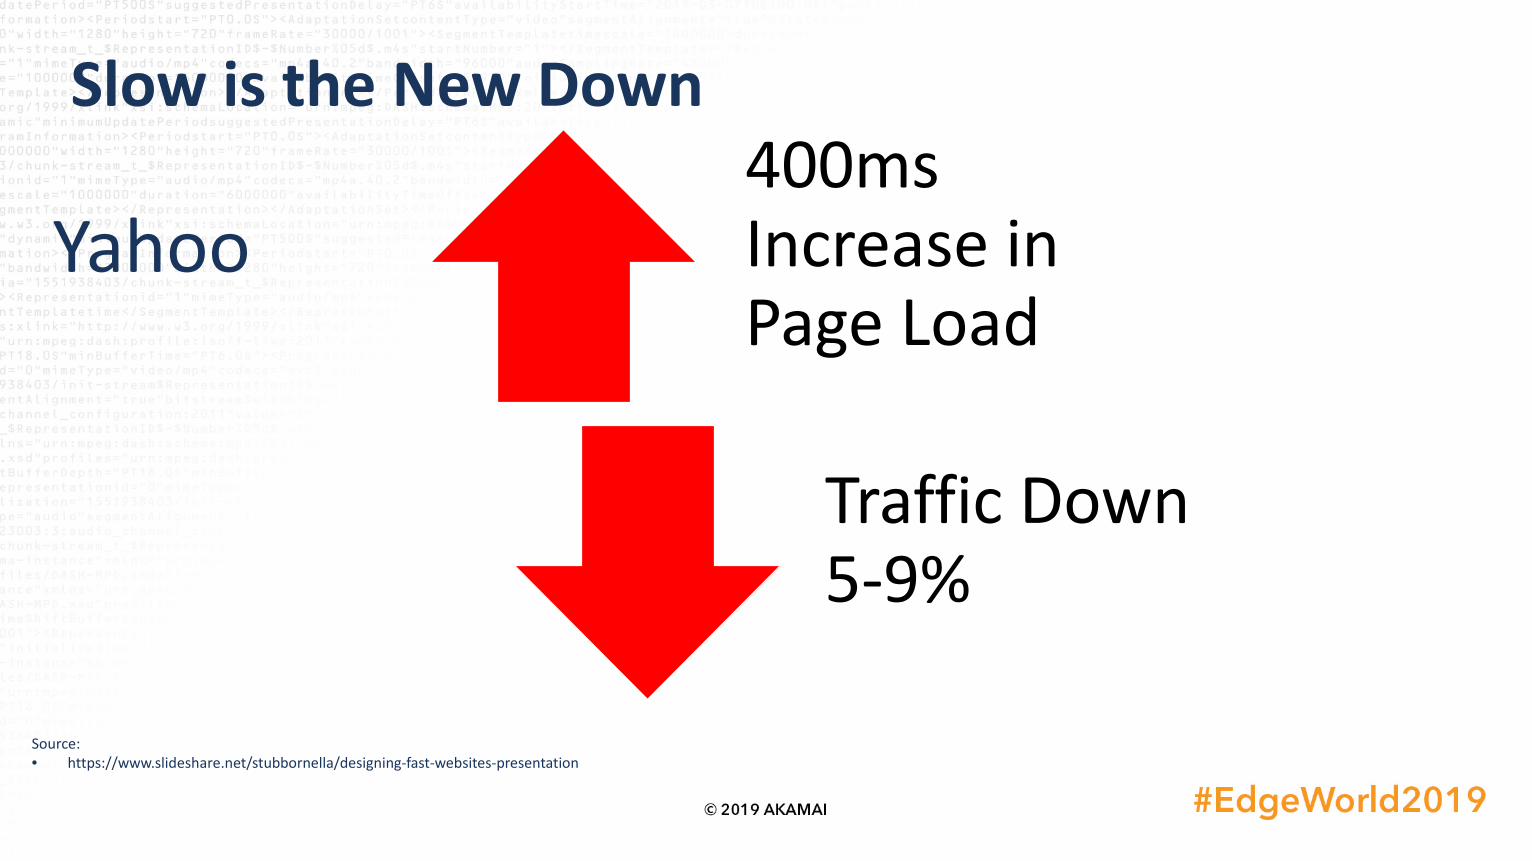
Slow is the New Down
Yahoo
Source:• https://www.slideshare.net/stubbornella/designing-fast-websites-presentation
400ms Increase in Page Load
Traffic Down 5-9%
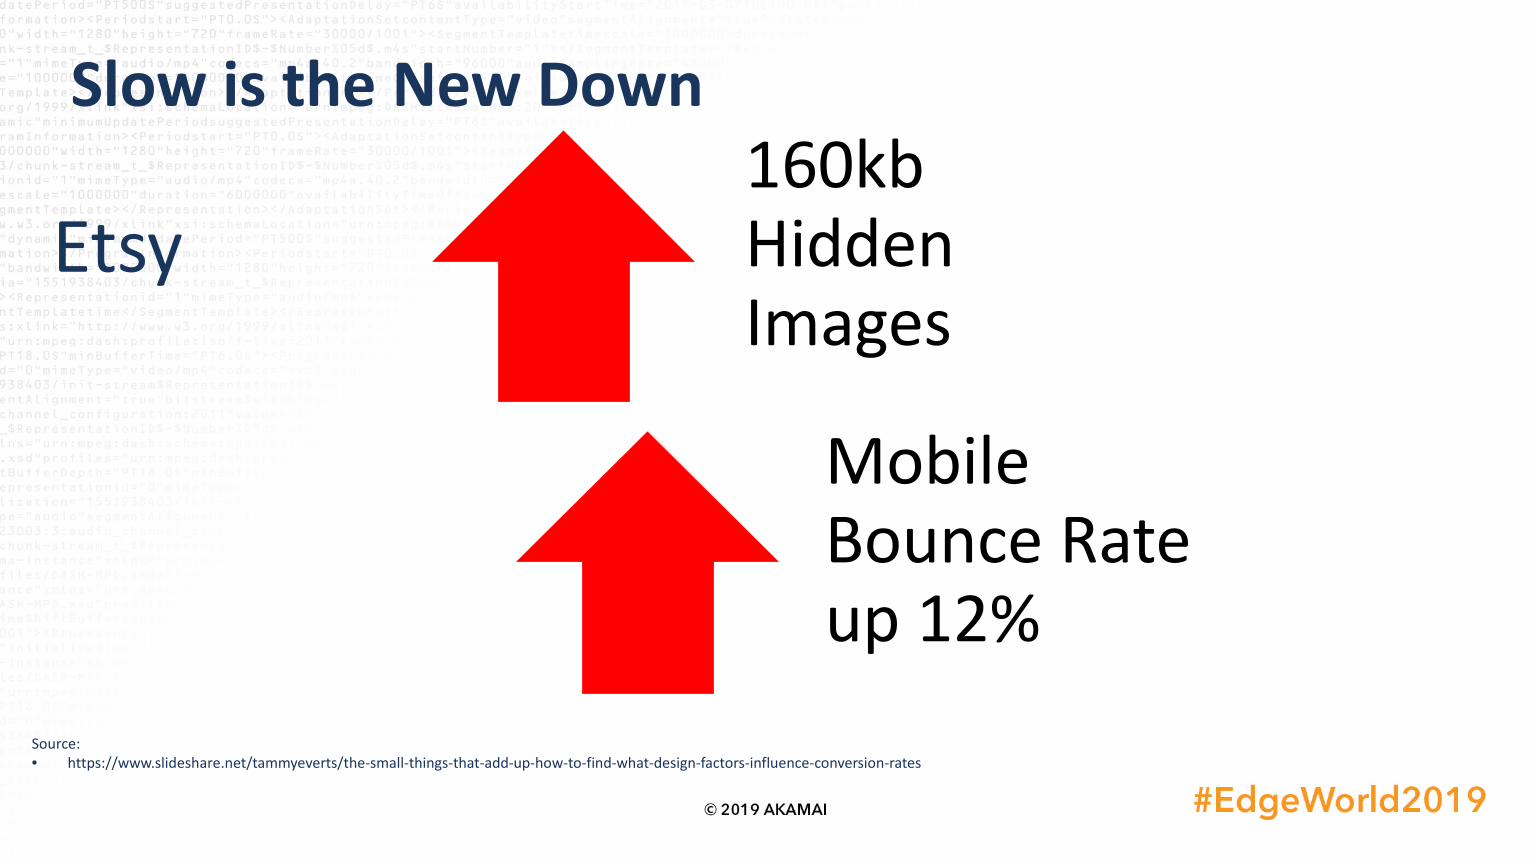
Slow is the New Down
Etsy
Source:• https://www.slideshare.net/tammyeverts/the-small-things-that-add-up-how-to-find-what-design-factors-influence-conversion-rates
160kb Hidden Images
Mobile Bounce Rate up 12%
Slow is the New Down
Staples
Source:• https://www.slideshare.net/cliffcrocker/velocity-ny-how-to-measure-revenue-in-milliseconds
1 Second Decrease in Page Load
Conversion Up 10%
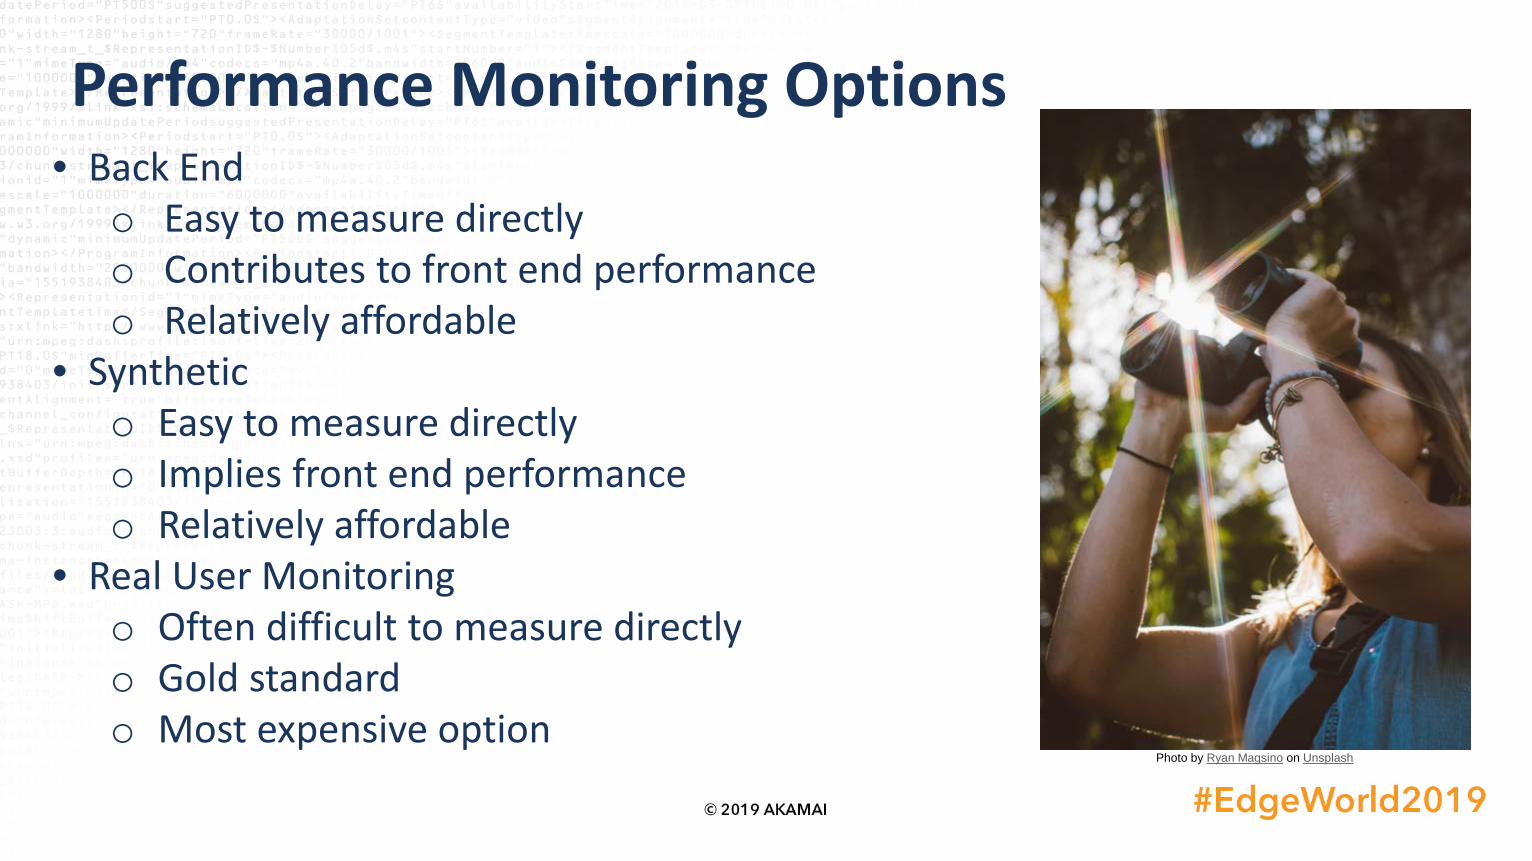
Performance Monitoring Options• Back End
o Easy to measure directlyo Contributes to front end performanceo Relatively affordable
• Synthetico Easy to measure directlyo Implies front end performanceo Relatively affordable
• Real User Monitoringo Often difficult to measure directlyo Gold standardo Most expensive option
Photo by Ryan Magsino on Unsplash
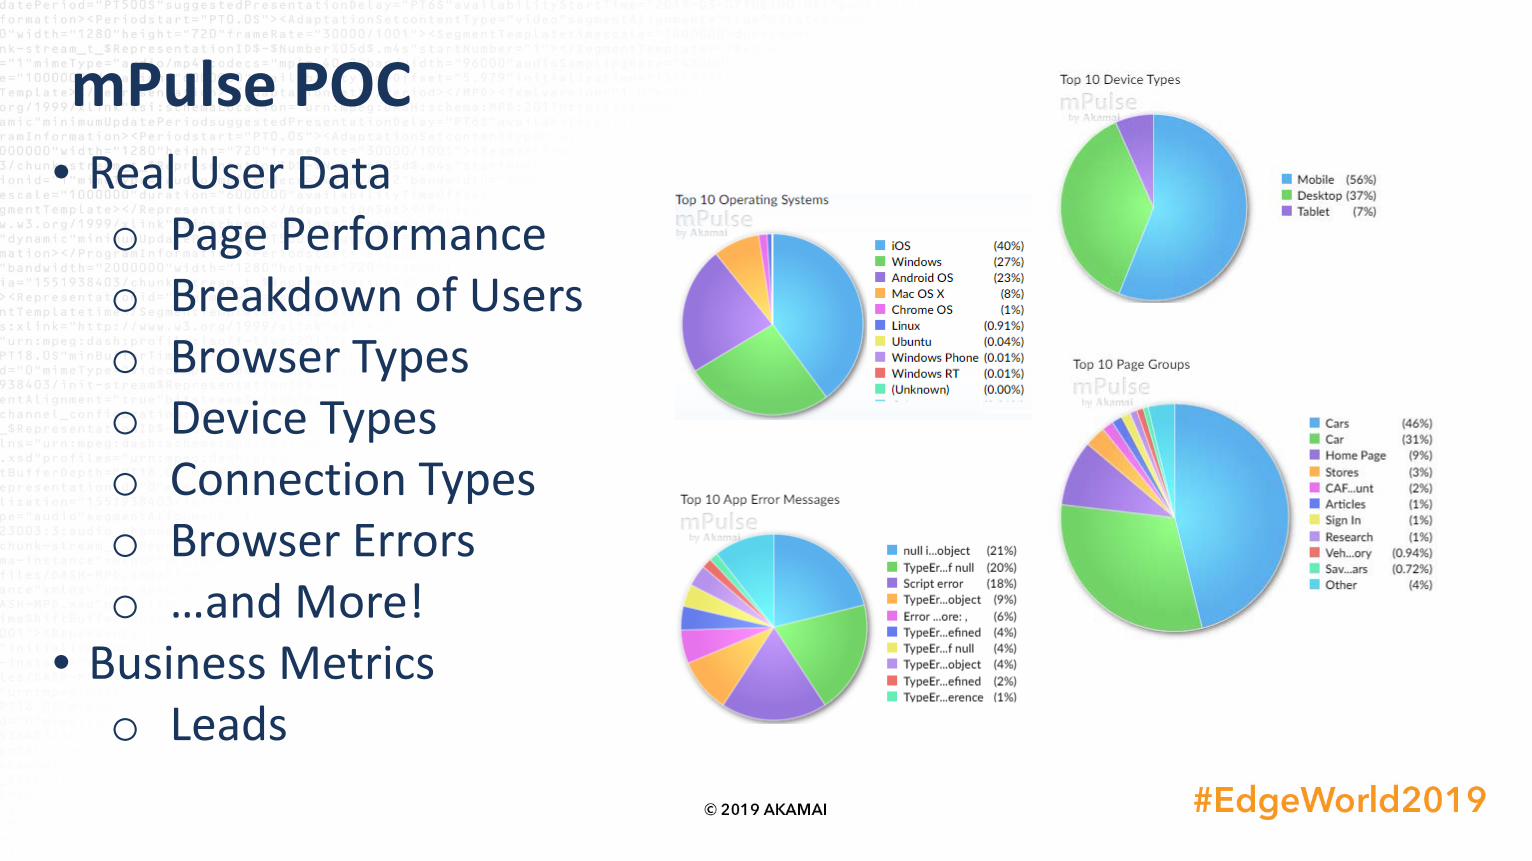
mPulse POC• Real User Datao Page Performanceo Breakdown of Userso Browser Typeso Device Typeso Connection Typeso Browser Errorso …and More!
• Business Metricso Leads
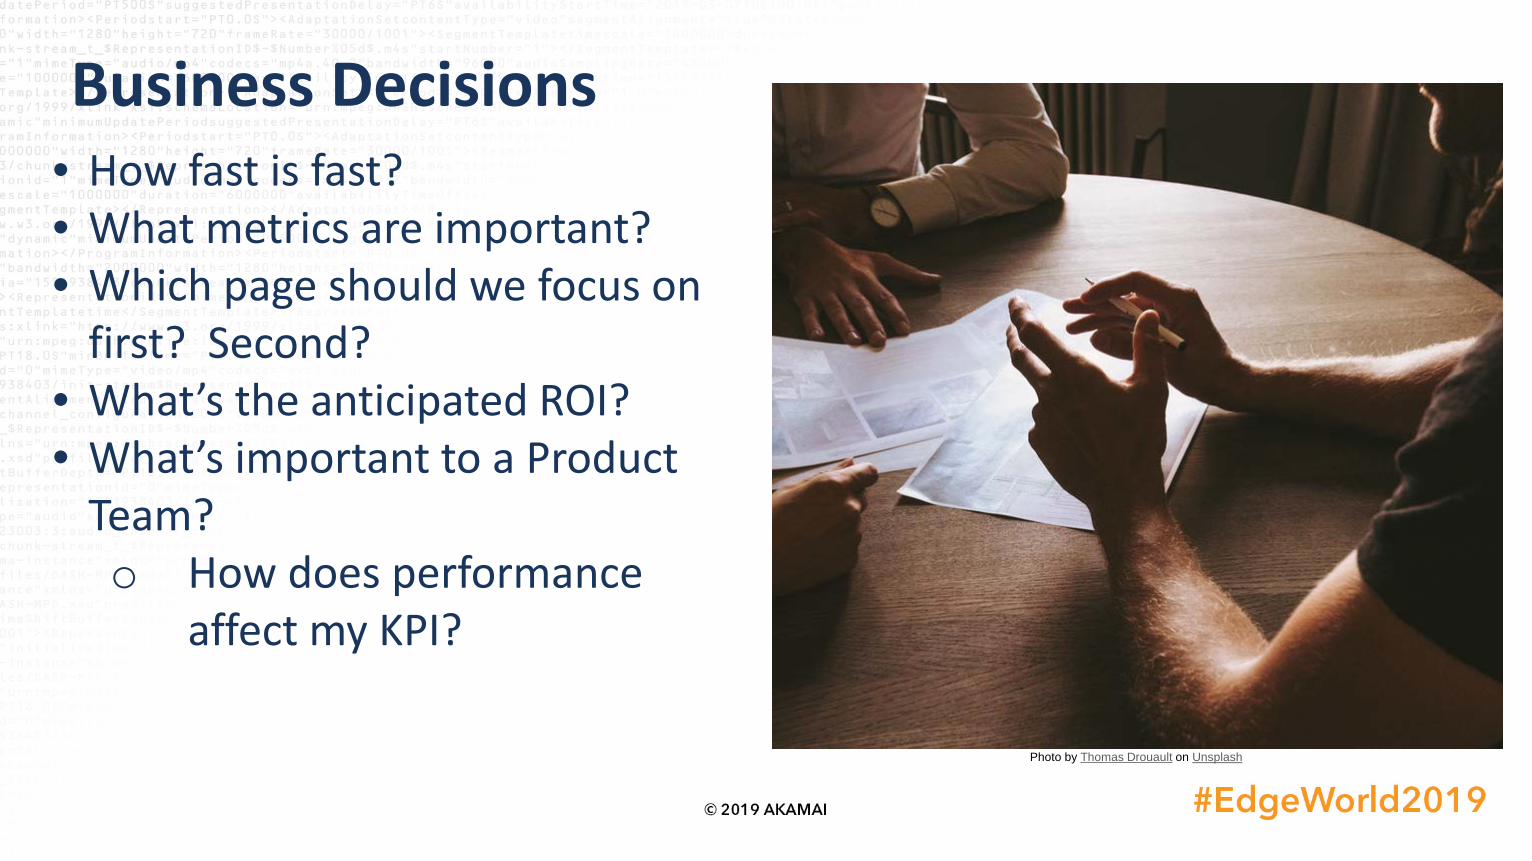
Business Decisions• How fast is fast?• What metrics are important?• Which page should we focus on
first? Second?• What’s the anticipated ROI?• What’s important to a Product
Team?o How does performance
affect my KPI?
Photo by Thomas Drouault on Unsplash
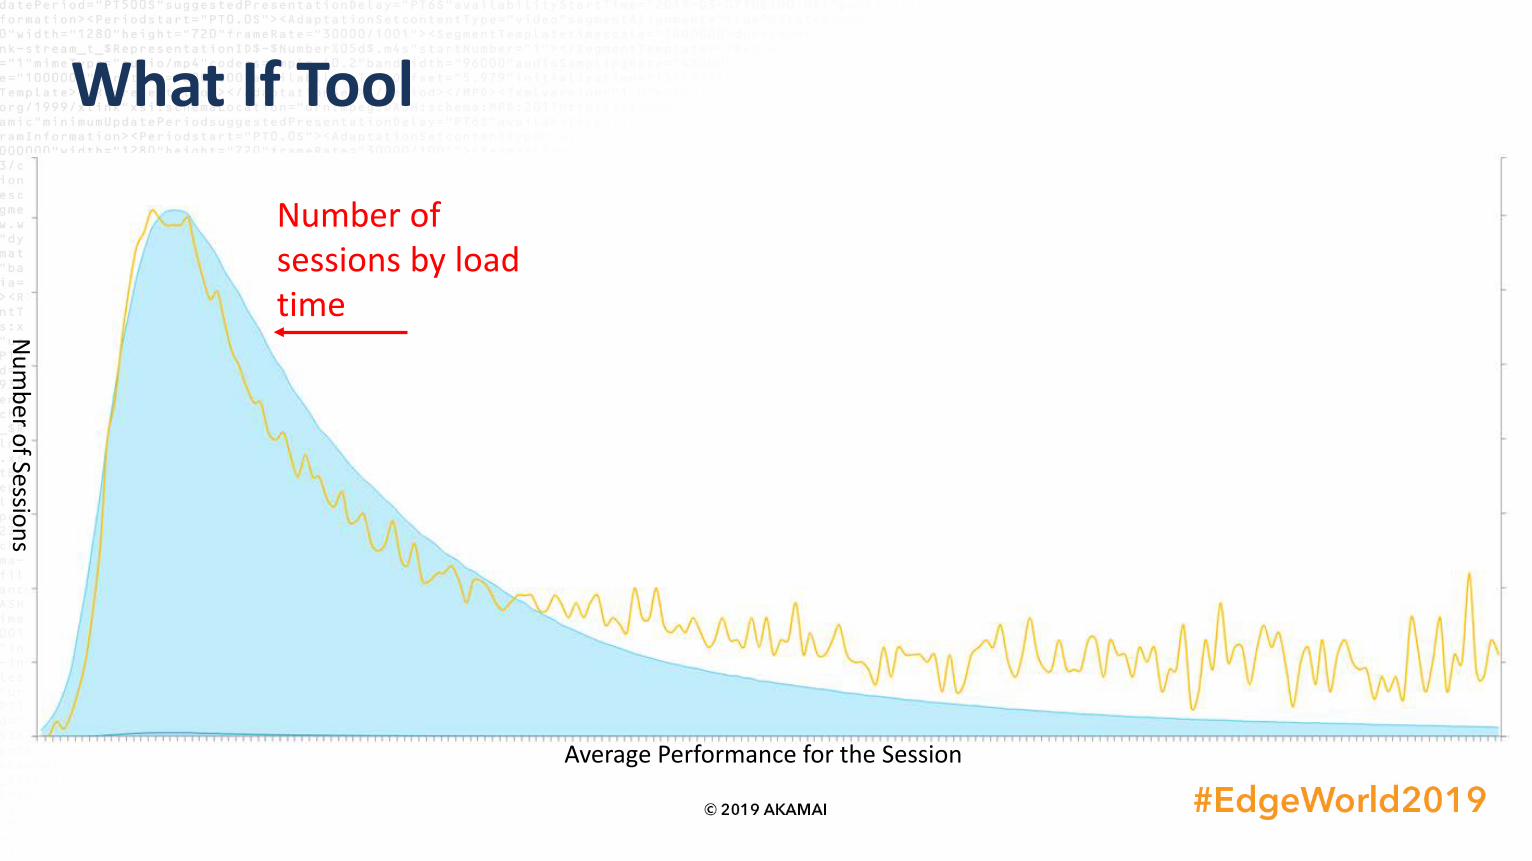
What If Tool
Number of sessions by load time
Num
ber of Sessions
Average Performance for the Session
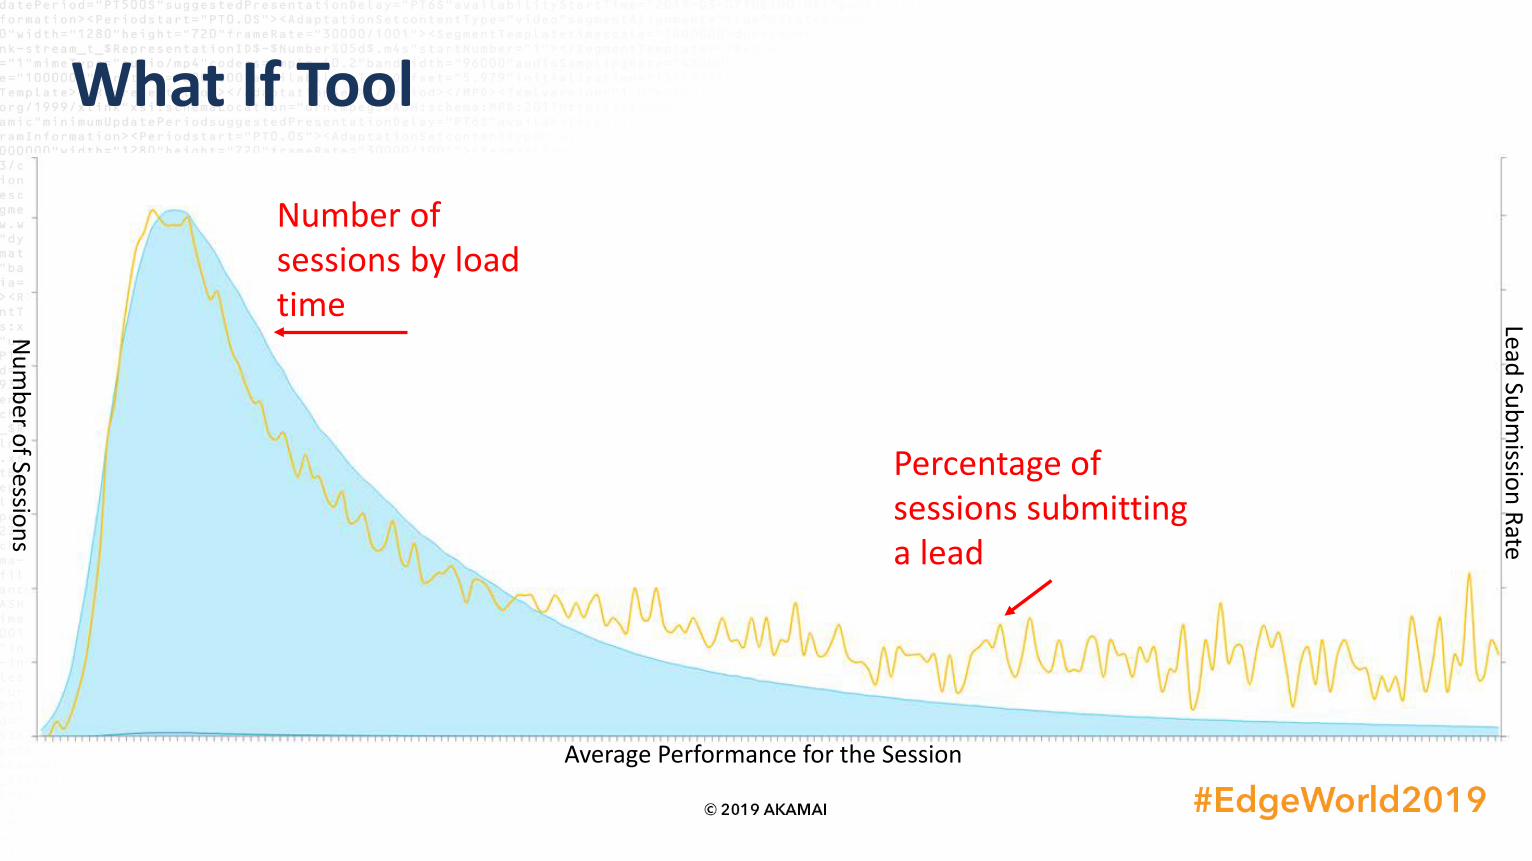
What If Tool
Percentage of sessions submitting a lead
Lead Submission Rate
Num
ber of Sessions
Average Performance for the Session
Number of sessions by load time

What If Tool
Push more sessions into the higher submission range
Num
ber of Sessions
Average Performance for the Session
Lead Submission Rate
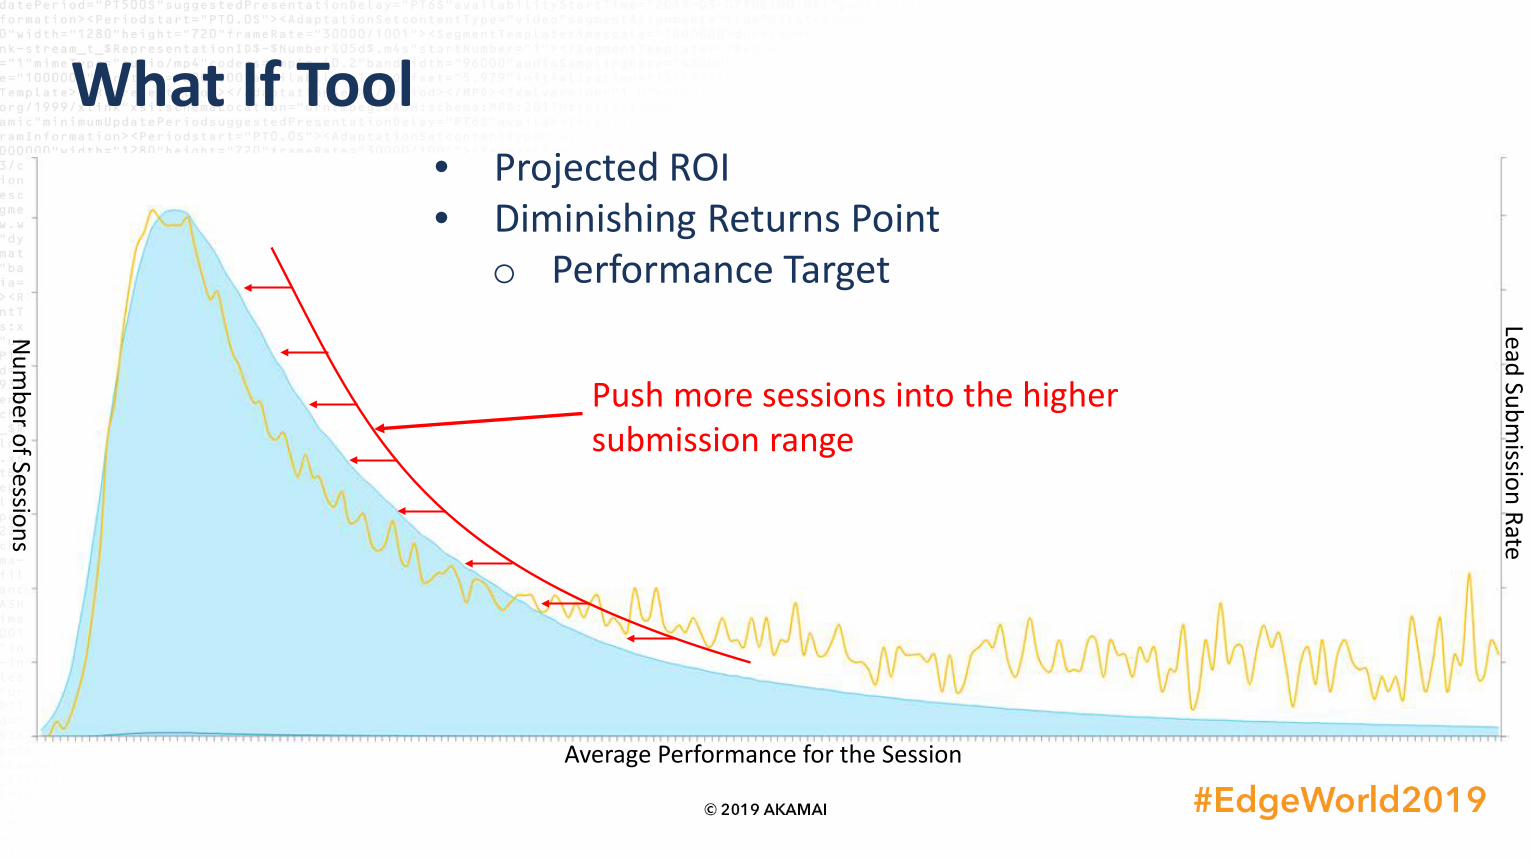
What If Tool• Projected ROI• Diminishing Returns Point
o Performance Target
Num
ber of Sessions
Average Performance for the Session
Lead Submission Rate
Push more sessions into the higher submission range
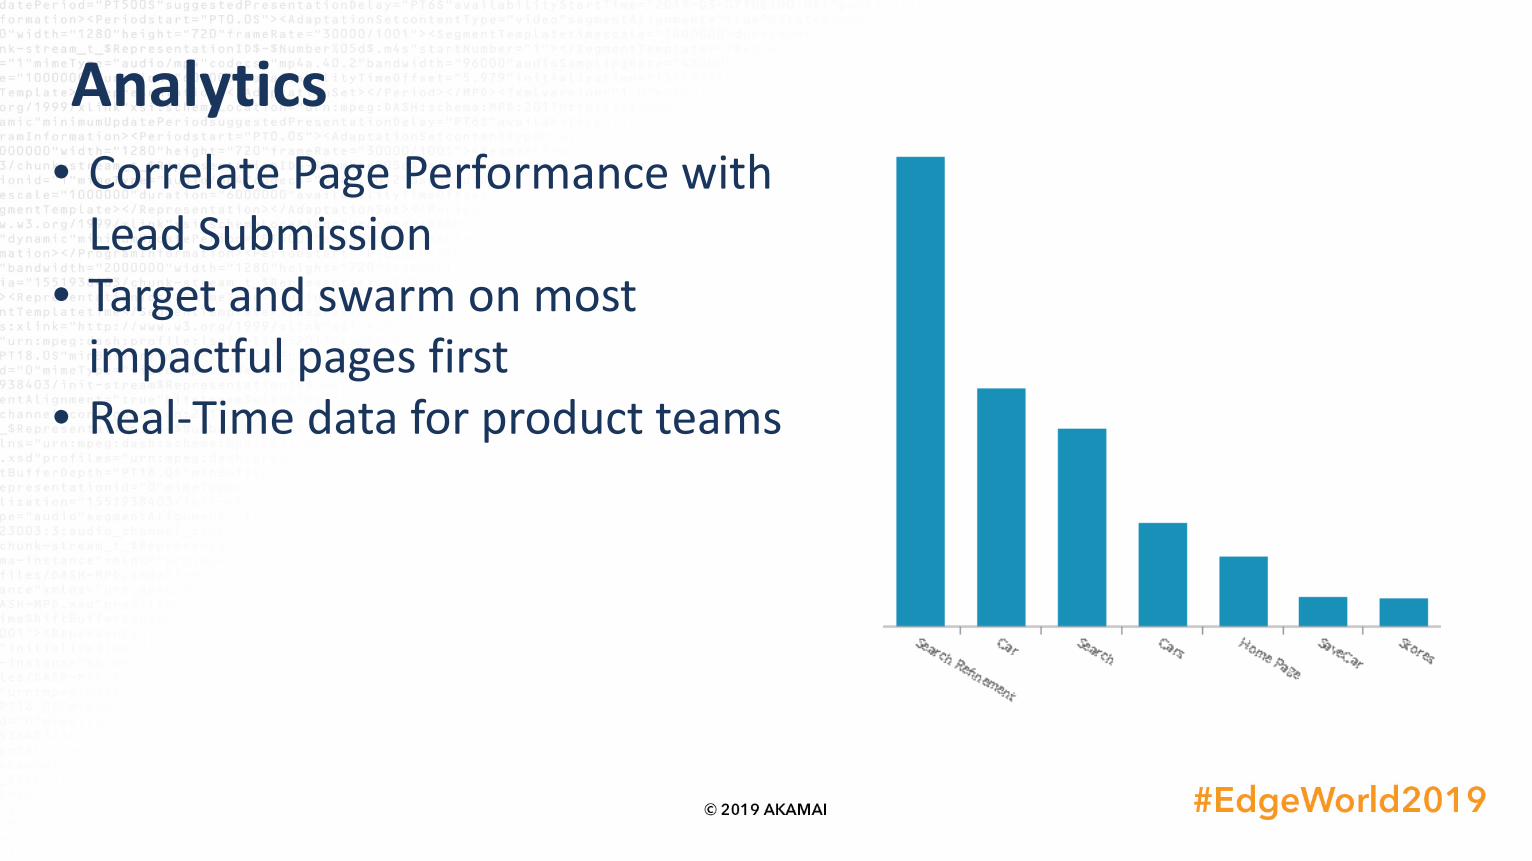
Analytics• Correlate Page Performance with
Lead Submission• Target and swarm on most
impactful pages first• Real-Time data for product teams
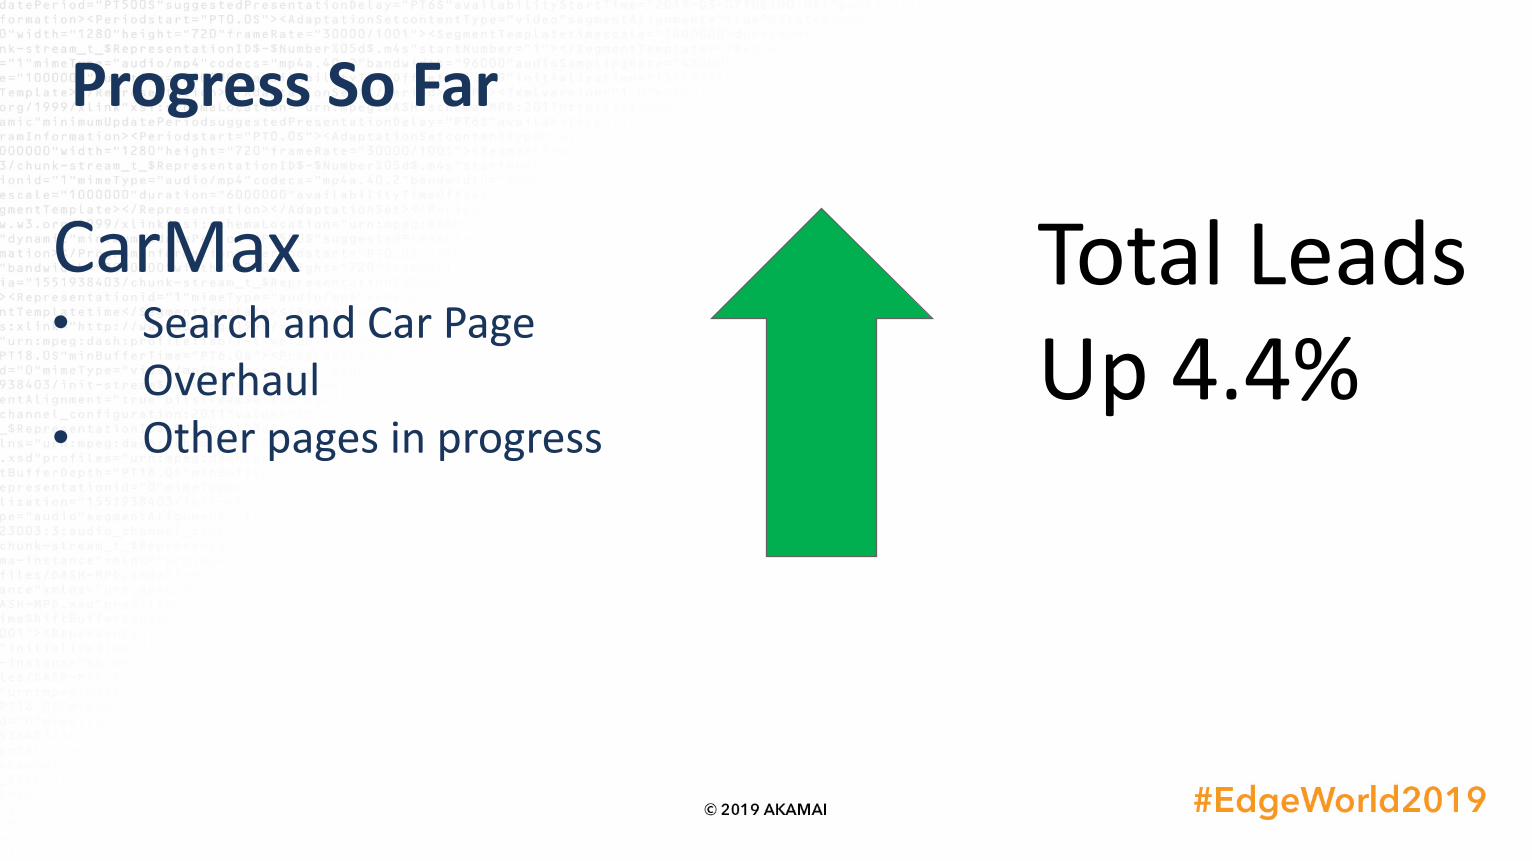
Progress So Far
CarMax• Search and Car Page
Overhaul• Other pages in progress
Total Leads Up 4.4%

But Wait….There’s More
Photo by Ben White on Unsplash
Product Team Quotes“Since it represents our actual customer experience, mPulse has become our main dashboard view. We use it as the primary source for our key performance metrics.”
- Chris F.
“My product team was able to confidently execute a phased release of a new microsite. mPulse was critical in allowing us to compare performance between the new and old pages to ensure a seamless customer experience during the transition.”
- Max H.
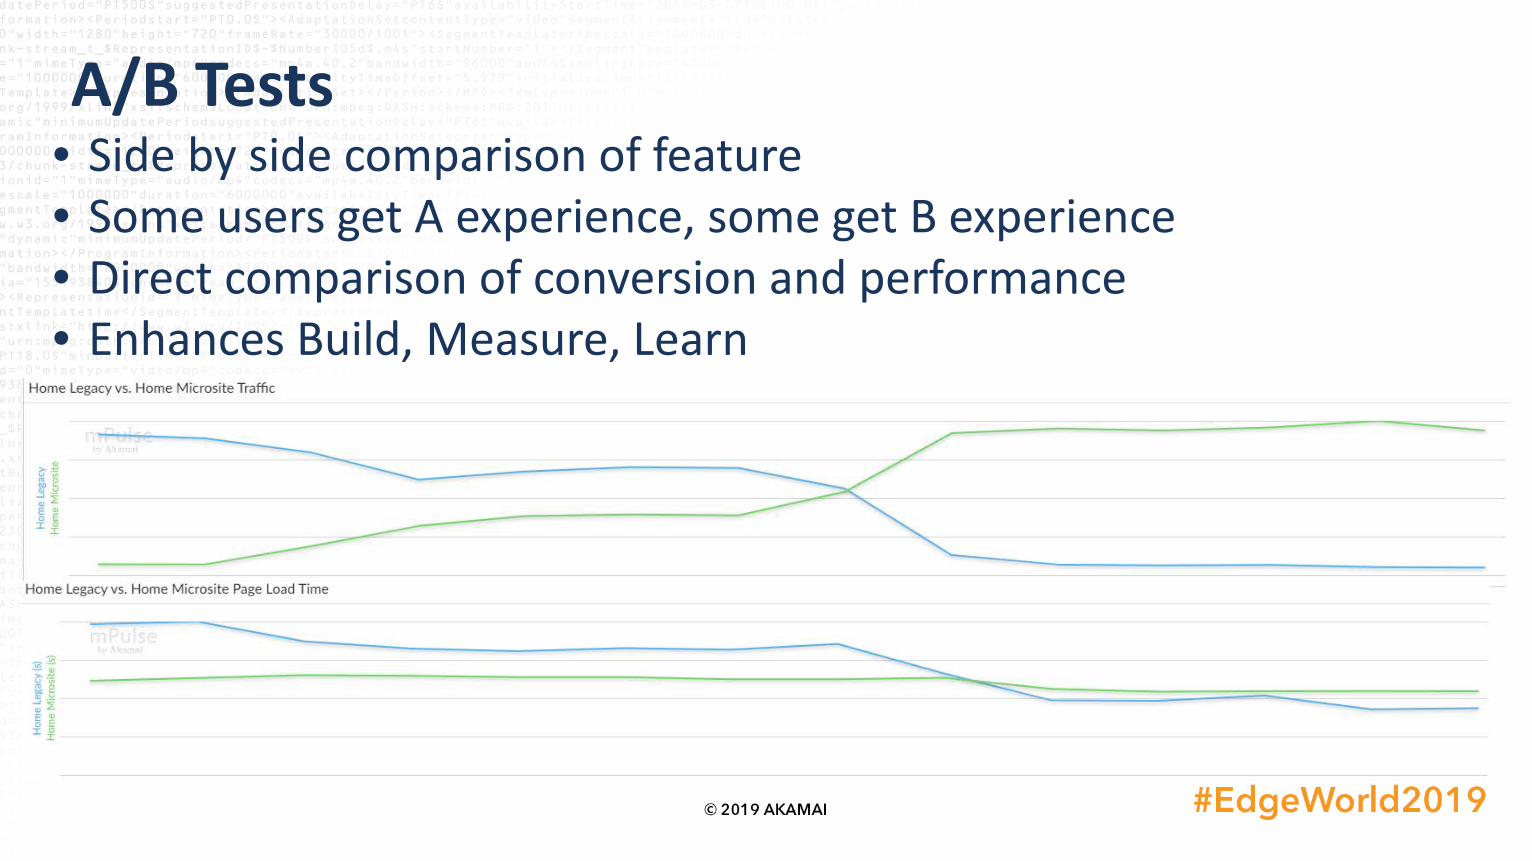
A/B Tests• Side by side comparison of feature• Some users get A experience, some get B experience• Direct comparison of conversion and performance• Enhances Build, Measure, Learn
Additional Customization• Store User• Store Number• Logged In User• % Sessions Viewing Search Page• % Sessions Viewing Car Page

Ongoing Monitoring• Post Deploy Verificationo Key Metric Reviewo Proactively Catch Issues
• Weekly Dashboardo Changes in performance
• Open Houseso Executive Viewo Performance to Goal
• Dashboards in Team Areaso KPIso Important Metrics
Photo by Mimi Thian on Unsplash

Takeaways• CarMax sought out to Innovate• Transitioned to Product Teamso Empowered Teamso KPIs not Projects
• Adopted mPulse (and other things too)• Aligned KPIs on Performance Metrics• Achieved 4.4% Increase in Leads• Reproducible Results

Recognized as an employer of choicelocally & nationally
Recognized as one of the
FORTUNE100 Best
Companies to Work For® 15 years in a
row