how can young roma achieve success in hungary? roma in
TRANSCRIPT

How can young Roma achieve success in Hungary? Roma in Secondary Schools
and in the Labor Market
Budapest, January 2015
This study has been prepared by the TÁRKI Social Research Institute (Budapest, Hungary) and was supported by the Roma
Education Fund (www.romaeducationfund.org)
Written by TAMÁS HAJDU
TÁRKI Social Research Institute H-1112 Budapest, Budaörsi út 45.
Tel.: +36 1 309 7676, Fax: +36 1 309 7666 E-mail: [email protected] Internet: www.tarki.hu
3
TABLE OF CONTENTS
Table of Contents .................................................................................................................................................... 3
List of Tables............................................................................................................................................................ 4
List of Figures .......................................................................................................................................................... 7
Executive summary ................................................................................................................................................. 8
1. Introduction ...................................................................................................................................................... 10
2. The Hungarian education system ...................................................................................................................... 11
3. Data ................................................................................................................................................................... 12
3.1. The Hungarian Life Course Survey ............................................................................................................. 12
3.2. Measuring ethnicity ................................................................................................................................... 13
3.3. Educational outcomes ............................................................................................................................... 15
3.4. Labor market outcomes ............................................................................................................................ 16
3.5. Explanatory mechanism ............................................................................................................................ 17
3.5.1. Explanatory mechanism of the educational outcomes ..................................................................... 17
3.5.2. Explanatory mechanism of the labor market outcomes ................................................................... 20
4. Empirical methodology ..................................................................................................................................... 22
5. Educational outcomes ....................................................................................................................................... 23
5.1. The raw ethnic gaps .................................................................................................................................. 23
5.2. The effect of the geographical location..................................................................................................... 24
5.3. Secondary school dropout rates................................................................................................................ 29
5.4. Secondary school type............................................................................................................................... 31
5.5. Result of the Matura exam ........................................................................................................................ 35
5.6. College attendance .................................................................................................................................... 36
6. Labor market outcomes .................................................................................................................................... 38
6.1. The raw ethnic gaps .................................................................................................................................. 38
6.2. Employment .............................................................................................................................................. 41
6.3. Wage ......................................................................................................................................................... 46
7. Conclusion ......................................................................................................................................................... 50
Appendix ............................................................................................................................................................... 52
Tables ............................................................................................................................................................... 52
Figures .............................................................................................................................................................. 89
References ............................................................................................................................................................ 95

4
LIST OF TABLES
Table 1: Participation in the Hungarian Life Course Survey .................................................................................. 13
Table 2: Selected indicators in the first and seventh wave ................................................................................... 13
Table 3: Information on ethnicity in the Hungarian Life Course Survey ............................................................... 14
Table 4: Roma ethnicity in the Hungarian Life Course Survey .............................................................................. 14
Table 5: Explanatory variables of educational outcomes ..................................................................................... 19
Table 6: Explanatory variables of labor market outcomes ................................................................................... 21
Table 7: The raw ethnic gaps in the educational outcomes .................................................................................. 24
Table 8: The effect of geography on ethnic gap in educational attainment ......................................................... 27
Table 9: Geographical availability of secondary schools in Hungary (2006) ......................................................... 29
Table 10: Ethnic gap in dropping out of secondary school ................................................................................... 30
Table 11: Estimated residual ethnic gap in dropping out of secondary school by number of close contacts with
highly educated peers ........................................................................................................................................... 31
Table 12: Ethnic gap in graduation from vocational training school..................................................................... 32
Table 13: Ethnic gap in graduation from vocational secondary school ................................................................ 33
Table 14: Ethnic gap in graduation from general secondary school ..................................................................... 34
Table 15: Ethnic gap in graduation from a secondary school that prepares students for the Matura exam
(general or vocational secondary school) ............................................................................................................. 35
Table 16: Ethnic gap in the result of the Matura exam ......................................................................................... 36
Table 17: Ethnic gap in college attendance........................................................................................................... 37
Table 18: The raw ethnic gaps in the labor market outcomes .............................................................................. 39
Table 19: Ethnic differences in labor market status.............................................................................................. 39
Table 20: Ethnic differences in labor market status by highest education level, MEN ......................................... 40
Table 21: Ethnic differences in labor market status by highest education level, WOMEN ................................... 41
Table 22: Ethnic gap in permanent employment, MEN ........................................................................................ 42
Table 23: Ethnic gap in permanent employment, WOMEN .................................................................................. 43
Table 24: Ethnic gap in “ILO” employment, WOMEN ........................................................................................... 44
Table 25: Ethnic gap in employment in public work programs, MEN ................................................................... 45
Table 26: Ethnic gap in employment in public work programs, WOMEN ............................................................. 46
Table 27: Ethnic gap in log wage for “ILO” employed, MEN ................................................................................. 47
Table 28: Ethnic gap in log wage for “ILO” employed, WOMEN ........................................................................... 48
Table 29: Ethnic gap in log wage for permanently employed, WOMEN ............................................................... 49
Table A1: Distribution of the participants by region ............................................................................................. 52
Table A2: Distribution of the participants by type of the settlement ................................................................... 52
Table A3: Distribution of the participants by mother’s education level ............................................................... 53
5
Table A4: Distribution of the participants by father’s education level ................................................................. 53
Table A5: Distribution of the participants by gender ............................................................................................ 53
Table A6: Distribution of the participants by birth year ....................................................................................... 54
Table A7: Distribution of the participants by behavior grade (school year 2005/2006) ....................................... 54
Table A8: Distribution of the participants by educational aspiration (school year 2005/2006) ........................... 55
Table A9: Ethnic differences in the measures of cognitive and non-cognitive skills, material welfare and home
environment.......................................................................................................................................................... 55
Table A10: HOME cognitive subscale items .......................................................................................................... 56
Table A11: HOME emotional subscale items ........................................................................................................ 57
Table A12: The raw ethnic gaps in the educational outcomes by gender ............................................................ 58
Table A13: Estimated residual ethnic gap in dropping out of secondary school by number of close contacts with
highly educated peers (included only those who were in school in the third survey wave) ................................ 59
Table A14: Ethnic gap in dropping out of secondary school (Ethnic classification based on adolescents’ self-
identification) ........................................................................................................................................................ 60
Table A15: Ethnic gap in dropping out of secondary school (Ethnic classification based on parents’ self-
identification) ........................................................................................................................................................ 60
Table A16: Ethnic gap in dropping out of secondary school (Ethnic classification based on classification by
interviewers) ......................................................................................................................................................... 61
Table A17: Ethnic gap in graduation from vocational training school (Ethnic classification based on adolescents’
self-identification) ................................................................................................................................................. 61
Table A18: Ethnic gap in graduation from vocational training school (Ethnic classification based on parents’ self-
identification) ........................................................................................................................................................ 62
Table A19: Ethnic gap in graduation from vocational training school (Ethnic classification based on classification
by interviewers) .................................................................................................................................................... 62
Table A20: Ethnic gap in graduation from vocational secondary school (Ethnic classification based on
adolescents’ self-identification) ............................................................................................................................ 63
Table A21: Ethnic gap in graduation from vocational secondary school (Ethnic classification based on parents’
self-identification) ................................................................................................................................................. 63
Table A22: Ethnic gap in graduation from vocational secondary school (Ethnic classification based on
classification by interviewers) ............................................................................................................................... 64
Table A23: Ethnic gap in graduation from general secondary school (Ethnic classification based on adolescents’
self-identification) ................................................................................................................................................. 64
Table A24: Ethnic gap in graduation from general secondary school (Ethnic classification based on parents’ self-
identification) ........................................................................................................................................................ 65
Table A25: Ethnic gap in graduation from general secondary school (Ethnic classification based on classification
by interviewers) .................................................................................................................................................... 65
Table A26: Ethnic gap in graduation from a secondary school that prepares students for the Matura exam
(Ethnic classification based on adolescents’ self-identification) ........................................................................... 66
Table A27: Ethnic gap in graduation from a secondary school that prepares students for the Matura exam
(Ethnic classification based on parents’ self-identification).................................................................................. 66

6
Table A28: Ethnic gap in graduation from a secondary school that prepares students for the Matura exam
(Ethnic classification based on classification by interviewers) .............................................................................. 67
Table A29: Ethnic gap in the result of the Matura exam (Ethnic classification based on adolescents’ self-
identification) ........................................................................................................................................................ 67
Table A30: Ethnic gap in the result of the Matura exam (Ethnic classification based on parents’ self-
identification) ........................................................................................................................................................ 68
Table A31: Ethnic gap in the result of the Matura exam (Ethnic classification based on classification by
interviewers) ......................................................................................................................................................... 68
Table A32: Ethnic gap in college attendance (Ethnic classification based on adolescents’ self-identification) .... 69
Table A33: Ethnic gap in college attendance (Ethnic classification based on parents’ self-identification) .......... 69
Table A34: Ethnic gap in college attendance (Ethnic classification based on classification by interviewers)....... 70
Table A35: Ethnic gap in permanent employment, MEN (Ethnic classification based on adolescents’ self-
identification) ........................................................................................................................................................ 71
Table A36: Ethnic gap in permanent employment, MEN (Ethnic classification based on parents’ self-
identification) ........................................................................................................................................................ 72
Table A37: Ethnic gap in permanent employment, MEN (Ethnic classification based on classification by
interviewers) ......................................................................................................................................................... 73
Table A38: Ethnic gap in permanent employment, WOMEN (Ethnic classification based on adolescents’ self-
identification) ........................................................................................................................................................ 74
Table A39: Ethnic gap in permanent employment, WOMEN (Ethnic classification based on parents’ self-
identification) ........................................................................................................................................................ 75
Table A40: Ethnic gap in permanent employment, WOMEN (Ethnic classification based on classification by
interviewers) ......................................................................................................................................................... 76
Table A41: Ethnic gap in “ILO” employment, WOMEN (Ethnic classification based on adolescents’ self-
identification) ........................................................................................................................................................ 77
Table A42: Ethnic gap in “ILO” employment, WOMEN (Ethnic classification based on parents’ self-identification)
.............................................................................................................................................................................. 78
Table A43: Ethnic gap in “ILO” employment, WOMEN (Ethnic classification based on classification by
interviewers) ......................................................................................................................................................... 79
Table A44: Ethnic gap in log wage for “ILO” employed, MEN (Ethnic classification based on adolescents’ self-
identification) ........................................................................................................................................................ 80
Table A45: Ethnic gap in log wage for “ILO” employed, MEN (Ethnic classification based on parents’ self-
identification) ........................................................................................................................................................ 81
Table A46: Ethnic gap in log wage for “ILO” employed, MEN (Ethnic classification based on classification by
interviewers) ......................................................................................................................................................... 82
Table A47: Ethnic gap in log wage for “ILO” employed, WOMEN (Ethnic classification based on adolescents’ self-
identification) ........................................................................................................................................................ 83
Table A48: Ethnic gap in log wage for “ILO” employed, WOMEN (Ethnic classification based on parents’ self-
identification) ........................................................................................................................................................ 84
Table A49: Ethnic gap in log wage for “ILO” employed, WOMEN (Ethnic classification based on classification by
interviewers) ......................................................................................................................................................... 85
7
Table A50: Ethnic gap in log wage for permanently employed, WOMEN (Ethnic classification based on
adolescents’ self-identification) ............................................................................................................................ 86
Table A51: Ethnic gap in log wage for permanently employed, WOMEN (Ethnic classification based on parents’
self-identification) ................................................................................................................................................. 87
Table A52: Ethnic gap in log wage for permanently employed, WOMEN (Ethnic classification based on
classification by interviewers) ............................................................................................................................... 88
LIST OF FIGURES
Figure 1: Ethnic inequality indices (for individuals who started secondary school) ............................................. 24
Figure 2: The geographical location of secondary schools in Hungary (2006) ...................................................... 28
Figure A1: Distribution of the standardized reading test scores (grade 8) ........................................................... 89
Figure A2: Distribution of the standardized math test scores (grade 8) ............................................................... 90
Figure A3: Distribution of GPA at the end of grade 8 ........................................................................................... 91
Figure A4: Distribution of equivalent household expenditures in the first wave ................................................. 92
Figure A5: Employment rate by educational achievement (age 18-35, averaged over 2006-2012) .................... 93
Figure A6: Gross monthly earnings by educational achievement (age 25-35)...................................................... 94

8
EXECUTIVE SUMMARY
1. This report contains analysis of the gap in educational and labor market outcomes between Roma
and non-Roma at age 22-23 in Hungary. The goal of the analysis is to measure the ethnic gaps and
to shed light on the potential causes of the achievement gaps.
2. The report is based on the seventh wave of the Hungarian Life Course Survey (HLCS). The HLCS is
a panel survey that follows youths, who were in the eighth grade in the spring of 2006. The
seventh survey wave was launched in September 2014, and 4803 persons participated.
3. The ethnic classification is based on three information sources: (i) self-identification by the
adolescents, (ii) self-identification by the parents, and (iii) classification by the interviewers.
Throughout the report we consider a young person to be Roma if at least one source classifies
him or her as Roma. In this way, Roma youth comprise 11 percent of the sample. We carry out
detailed robustness checks using the alternative definitions of ethnic identity and find that all of
our results are very similar regardless of the definition we use.
4. We analyze the Roma – non-Roma educational achievement gap in terms of four different
outcomes: (i) dropping out of secondary school, (ii) type of the completed secondary school, (iii)
result of the Matura exam, and (iv) college attendance. The ethnic gap in labor market success is
measured with two indicators: (i) employment and (ii) wage.
5. Completed secondary education is very important in the Hungarian labor market, since individuals
without completed secondary school face with higher unemployment rate and receive lower
wages than secondary school graduates. College attendance and graduation adds more value: in
the recent years college wage premium (the ratio of wage rates between college and high school
graduates without college degree) is 80-90 percent.
6. The ethnic gap in secondary school dropout rates is very large: the dropout rate is 32 percent for
Roma secondary school students compared to 5 percent for non-Roma secondary school
students. We show that one quarter of this gap can be explained by the gap in educational
achievement emerged at an early age, before enrollment in secondary school, due to differences
in cognitive skills and abilities at age 14-15. Another quarter is explained by ethnic differences in
material welfare, home environment and parenting during the secondary school years.
Geographic differences, the particular secondary schools and non-cognitive skills seem to play
little role. Half of the gap remains after accounting for all of these mechanisms. This residual gap
in dropout rates is related to the prevalence of high-status peer contacts. Roma adolescents with
such contacts are significantly less likely to drop out of school than Roma adolescents with the
same test scores and family background but without such contacts. While the average residual
gap in dropout rates is 13 percentage points, it shrinks to 7 percent for those who had at least one
high-status peer contact and to zero for those who had at least two high-status contacts. These
results suggest that contacts that link Roma students to the educated part of the society are
important.
7. Less than one-third of the Roma graduate from secondary school with Matura exam, compared to
more than three-fourths of the non-Roma (32 percent vs. 78 percent). The Matura exam is an
important milestone as it qualifies for higher education. The gap in terms of standardized Matura
score is 50 percent of the standard deviation between Roma and non-Roma. Finally, among
secondary school graduates with Matura exam, 51 percent of the non-Roma attend college,
9
compared to 19 percent of the Roma. These differences are explained almost entirely by cognitive
skills at age 14-15 and poverty and home environment during the secondary school years.
8. Roma men of age 22 to 23 are 13 percentage points less likely to be permanently employed and 8
percentage points more likely to be employed in public works programs than non-Roma. Other
forms of temporary employment and unemployment are also slightly higher among the Roma.
The permanent employment rate for Roma women is 33 percentage points lower than for non-
Roma. This is primarily due to that Roma women are 30 percentage points more likely to be at
home with children and 6 percentage points more likely to be employed in public works programs.
If we account for differences in education and cognitive skills, 30-50 percent of the employment
gap between Roma and non-Roma disappears. If we control for children besides these factors, we
can explain almost completely the ethnic employment gap for women.
9. The wage gap is measured as the difference between the log monthly wages. The raw log wage
gap between employed Roma and non-Roma is −0.23 and −0.18 for men and women, implying an
approximate 23 and 18 percent disadvantage, respectively. The ethnic wage gap for permanently
employed is somewhat lower. Differences in completed education, cognitive skills and temporary
worker status explain 60 percent of the wage gap for young men, and the entire wage gap for
women. Non-cognitive skills, health, social network, and geography appear to play a less
important role in the ethnic differences in wages.
10
1. INTRODUCTION1
This report based on the seventh wave of the Hungarian Life Course Survey (HLCS) of the TÁRKI
Research Institute of Hungary, which follows a cohort of eighth graders since 2006. We quantify the
educational and labor market achievement gap between young Roma and non-Roma (at age 22-23) in
Hungary and aim to assess the potential causes of the gaps. We focus on secondary education, college
attendance, and early stage of the labor market career. Analyzing various mechanisms that might lead
to low achievement, we try to measure the strength of these factors: how much these factors explain
the educational and labor market achievement gap between Roma and non-Roma.
We show that a large part of the ethnic gap in educational success emerges at an early age, before
enrollment in secondary school. Cognitive skills and abilities (at age 14-15) account for a large part of
the Roma – non-Roma educational gaps. Poverty and home environment during the secondary school
years also play a non-negligible role in the educational achievement gap between Roma ad non-Roma.
Secondary schools and geographical location seem to play a less important role. An additional
conclusion of this report is that the ethnic gap in dropout rate is related to the prevalence of high-
status peer contacts. Roma adolescents with such contacts are significantly less likely to drop out of
school than Roma adolescents with the same test scores and family background but without such
contacts.
Regarding the labor market outcomes, we show that Roma men and women are considerably less likely
to be permanently employed than non-Roma men and women, and they are about 6-8 percentage
points more likely to be employed in public works programs. In addition, Roma women are 30 points
more likely to be at home with children. The raw log wage gap between employed Roma and non-
Roma is around −0.2, which corresponds to an approximately 20 percent disadvantage. Differences in
education and cognitive skills account for 30 to 50 percent of the employment gap between Roma and
non-Roma, and children account for the remaining gap for women. Differences in completed
education, cognitive skills and temporary worker status explain 60 percent of the wage gap for young
men, and the entire wage gap for women.
The report is organized as follows. In the next section we describe very briefly the Hungarian education
system. In section 3, we present the data; we introduce the measurement of ethnicity, and the
educational and labor market outcomes. In section 4, we present the empirical method we use in this
report. In section 5, we present our regression results regarding educational outcomes. Section 6
analyzes the ethnic gap in labor marker success. Section 7 concludes.
1 Some parts of the Kertesi – Kézdi [2014] working paper (http://www.econ.core.hu/file/download/bwp/bwp1401.pdf) were included into the text with the written consent of the authors.

11
2. THE HUNGARIAN EDUCATION SYSTEM
In Hungary, primary education lasts 8 years, and it is followed with three types of secondary track:
vocational training schools, vocational secondary schools, and general secondary schools.2 After
primary school, around 40 percent of students continue their education in general secondary school,
35 percent in vocational secondary school, and 25 percent in vocational training school.
Vocational secondary school and general secondary school prepare student for a school leaving exam
(Matura exam), which serves as an entry exam into tertiary education of any kind. The main difference
between them is that general secondary schools are completely academically oriented, whereas
vocational secondary schools could have vocational elements. After passing the Matura exam,
students of vocational secondary schools can continue their studies in higher education, or they can
stay in vocational training (vocational post-secondary programs) to receive a vocational qualification.
In contrast to the academically oriented tracks, vocational training schools do not prepare their
student for higher education, but a certificate of vocational qualifications can be obtained. Until the
school year 2012/2013 schooling was compulsory until the age of 18, from then compulsory age of
schooling is 16.3
2 General secondary school can start earlier as a part of the primary education (from grade 5 or 7). Around 3–4 percent of the whole cohort start general secondary school in grade 5, and an additional 4–5 percent in grade 7 [Horn, 2013].
3 This new rule is applied to students who start secondary education in the 2012/13 school year.
12
3. DATA
3.1. THE HUNGARIAN LIFE COURSE SURVEY
This report based on the seventh wave of the Hungarian Life Course Survey (HLCS) of the TÁRKI
Research Institute of Hungary. The HLCS is a panel survey that follows 10,000 youths, who were in the
eighth grade in the spring of 2006. The survey sampled regular students who participated in the
Hungarian National Assessment of Basic Competences (NABC) and special needs students who did not
participate in the NABC but who completed a simplified version of the reading comprehension test.
Students with lower test scores and special needs students are overrepresented in the sample, and we
use sampling weights throughout the analysis to restore national representativeness. The first wave of
the HLCS was conducted in the fall of 2006, and the seventh wave was launched in September 2014.
In this report we restrict the sample to individuals who participated in the seventh wave of the survey
(4803 persons). In addition, we exclude from the analysis of educational outcomes those individuals
who did not enter secondary education after the completion of primary school (16 individuals).
Sample attrition cannot be avoided, participation in the HLCS declines over time (see Table 1). In the
first survey wave 10022 persons answered the questionnaire, whereas in the seventh survey wave
4803 persons were participated. If attrition of the sample were completely random, it would be
ignorable. However, this is not the case, which distorts the original distribution and might lead to
biased estimates. In order to illustrate the effect of sample attrition, the first and second column of
Table 2 compare the unweighted distribution of participant of the first and seventh wave by some
important indicators (mother’s and father’s education level, reading and math test score, GPA, overage
students), whereas Table A1 – Table A8 and Figure A1 – Figure A4 Figure A4 in the Appendix provide
a more detailed comparison. We can see that the distributions of population characteristics change
considerably between the first wave and the last wave. Children of disadvantaged families and low
achieving students are less likely to participate in the seventh survey wave.
To correct for sample attrition, we create attrition-adjusted weights. We assume that attrition depends
on observable characteristics of children and families, and we use a series of variables from the first
wave4 to predict the probability of participation in the seventh survey wave with a probit model. Then,
using these predicted probabilities we create weights to adjust for attrition. The third column of Table
2Table 2 shows that the adjusted distribution of individuals interviewed in the seventh wave is very
similar to the unweighted distributions of the first wave participants (for more details, see also Table
A1 – Table A8 and Figure A1 – Figure A4Table A1 in the Appendix). Finally, we use the combination of
the original sampling weights and the attrition weights to restore national representativeness of the
seventh survey wave.
4 These variables, among others, include education level of the parents and grandparents, household size, health status, poverty indicators, cognitive and non-cognitive test scores, indicators for early childhood home environment, geographical location, and educational aspiration in eighth grade.

13
Table 1: Participation in the Hungarian Life Course Survey
Wave
1. 2. 3. 4. 5. 6. 7.
Participated 10022 9000 8648 8110 7662 7092 4803
Non-Participated 0 1022 1374 1912 2360 2930 5219
Total 10022 10022 10022 10022 10022 10022 10022
Table 2: Selected indicators in the first and seventh wave
Wave 1 (unweighted) Wave 7 (unweighted) Wave 7 (adjusted for
attrition)
Low educated mother 25.2% 16.3% 25.4%
Low educated father 17.8% 10.9% 17.8%
Low reading test score 63.5% 54.4% 63.4%
Low math test score 55.2% 47.4% 54.8%
Low GPA (grade 8) 35.4% 27.2% 35.7%
OVERAGE STUDENT 12.7% 8.5% 12.6%
Notes: Low educated mother/father = highest education level is primary or less. Low test score = Below average test scores. Low GPA = GPA below 3.5 Overage student: born in 1990 or before.
3.2. MEASURING ETHNICITY
To identify Roma ethnicity we use information collected from biological parents, adolescents and
interviewers. In the first and second waves of the survey the parents were asked what nationality or
ethnicity they identified with primarily or secondarily. It was measured by the following two questions:
“In our country people belong to different nationalities and ethnic groups. What ethnic group do you
belong to primarily? And what ethnic group do you belong to secondarily?”. The adolescents also were
allowed to choose a dual identity (primary and secondary ethnicity) in the second, fourth, fifth and
sixth waves. The third source of information on children’s Roma ethnicity was the classification by the
interviewers in the first wave of the HLCS: they were simply asked to classify children as Roma or non-
Roma. Table 3 summarizes whether each survey wave contains information on ethnic identity and who
provided the information.

14
Table 3: Information on ethnicity in the Hungarian Life Course Survey
Wave
1. 2. 3. 4. 5. 6. 7.
Adolescents (self-identification)
x x x x
Parents (self-identification)
x x
Interviewers (classification of adolescents)
x
To identify a young person as Roma we can use any of these three sources of information. Based on
the ethnic identity of the parents we can consider a young person to be Roma if he or she had at least
one biological parent who identified – primarily or secondarily – as Roma in either the first or second
wave of the survey. When using this definition, 8 percent of the sample is Roma (see Table 4). Using
the questions to the adolescents we can consider a young person to be Roma if he or she chose Roma
as primary or secondary ethnic identity at least once in the survey waves. In this way, Roma youth
comprise 8 percent of the sample. Based on the assessment of the interviewers 9 percent of the sample
can be classified as Roma. For the purposes of this report, we combine all of these different information
sources, and throughout the paper we consider a young person to be Roma if at least one source
classifies him or her as Roma. This definition means that the fraction of Roma adolescent is 11 percent
in the final sample.
Many scholars argue that ethnic groups (including the Roma) are social constructions [e.g. Ladányi &
Szelényi, 2001], and different classification systems might produce very inconsistent results. Our four
different Roma classifications provide the opportunity to check whether our results are robust to
change in ethnic classification. In main text of this report we use the combined classification, but we
could use a Roma classification that based on (i) self-identification by the adolescents, (ii) self-
identification by the parents, or (iii) classification by the interviewers. Table A14 – Table A52 in the
Appendix show the results of this exercise. The estimates with the alternative Roma classification are
very similar to the regressions presented in Section 6 and 7.
Table 4: Roma ethnicity in the Hungarian Life Course Survey
Source of information
Adolescents Parents Interviewers Combined
non-Roma 92% 92% 91% 89%
Roma 8% 8% 9% 11%
Total 100% 100% 100% 100%
unweighted N 4660 4721 4712 4803
Notes: weighted %
15
3.3. EDUCATIONAL OUTCOMES
In this report we analyze the Roma – non-Roma educational achievement gap using four different
outcomes: (i) dropping out of secondary school, (ii) type of the completed secondary school, (iii) result
of the Matura exam, and (iv) college attendance. We exclude those individuals who did not start
secondary education after finishing primary school (16 persons).
Secondary school completion plays a crucial role in later life in Hungary. Individuals without completed
secondary school face with higher unemployment rate and receive lower earnings than secondary
school graduates. The employment rate of secondary school dropouts is less than 50 percent,
compared with an employment rate of 80 percent for individuals with completed secondary school
(see Figure A5 in the Appendix). Moreover, employed high school dropouts earn 25-75 percent less
money than employed vocational training school graduates or secondary school graduates without
college degree (see Figure A6 in the Appendix). This means that secondary school dropouts are more
likely to become dependent on welfare programs.
The type of the completed secondary school (vocational training school, vocational secondary school,
general secondary school) affect not only the labor market success but together with the result of the
maturity exam determine the chance of college attendance. Being a vocational or general secondary
school graduate is more valuable in the labor market than being a vocational training school graduate.
As recent research has shown [Kézdi et al., 2009], over half of those who complete vocational training
school and find employment do not work in their own field, and many of them hold unskilled jobs that
do not require vocational training. On average, completing vocational training school increases
earnings by no more than 25 percent compared to completing 8 years of primary school, even after
several years of work experience (see
Figure A6 in the Appendix). Students of vocational secondary schools and general secondary schools
take the Matura exam at the end of their secondary education, which serves as an entry exam to
college and university. By contrast, vocational training schools do not prepare their students for the
maturity exam, so they cannot enter higher education without taking the maturity exam on their own.
Matura exam is a school leaving exam, which is taken by student of vocational secondary school and
general secondary schools. Students have to take exam in (at least) five subjects (Hungarian Language
and Literature, History, Mathematics, foreign language, and one optional subject). Results are
expressed as percentages, and before the school year 2012/20135, to pass the exams at least 20
percent had to be reached. Students who take an advanced level exam (and pass with at least a score
of 30 percent) receive 40 extra points on their college application. We calculate the average result of
the Matura exam as the average points of the successfully passed subjects (with the extra
“percentages” for the advanced level exams). Students with less than four successfully passed subjects
are excluded. Finally, the results of the Matura exam are standardized (sample average 0, standard
distribution 1).
Our fourth educational success indicator is college attendance. Individuals are classified as enrolled in
college if they reported to attend college either in the sixth or seventh survey wave or they are college
graduates. College attendance and graduation is extremely valuable in the Hungarian labor market. In
5 Most of the HLCS children graduated from secondary school in this period.

16
the recent years college wage premium (the ratio of wage rates between college and high school
graduates without college degree) is 80-90 percent in Hungary in the age group 25-35 (see Figure A6),
whereas is only 30-40 percent in Western Europe [Crivellaro, 2012].6
3.4. LABOR MARKET OUTCOMES
Labor market outcomes are measured in the seventh survey wave. We analyze the Roma – non-Roma
gap in labor market success using two indicators: employment and wage. Since many of the HLCS
sample have not completed their schooling, and have not entered the labor market, analysis of the
ethnic gap is restricted to individuals who are not full-time students in the seventh survey wave.
Individuals in the HLCS sample are typically 22-23 years old in 2014, which means that non-student
participants have entered the labor market at most 4-5 years ago. They are in an early stage of their
labor market career, but they have had enough time to find employment, thus, differences in
employment and wages between young Roma and non-Roma can be analyzed in a reliable manner.
In this report we use two definitions of employment. First, employment is defined using the
International Labour Organization (ILO) definition. According to the ILO’s definition employed persons
are all persons who during the reference week performed some work (for at least one hour) or were
in temporary absence from work (e.g. because of illness or holiday). Second, we analyze the ethnic gap
in permanent employment. Participants of the seventh survey wave were asked about their labor
market status, i.e. whether they were permanently employed or not. If they were not permanently
employed, they could choose various groups they belong to (e.g. unemployed, full-time student, part-
time student, being on maternity leave, child-care benefit recipient, etc.). These two indicators of
employment differ primarily due to temporary employment (e.g. irregular or seasonal job,
employment in public works programs). In both cases full-time students are excluded from the
analysis, and unemployed and inactive persons are pooled into a single group and are considered as
non-employed.
In the HLCS wages are measured as net monthly labor earnings (in the last month), and we use the log
transformed wages as dependent variable. We analyze the Roma – non-Roma log wage gap both for
“ILO” employed and for “permanent employed”.
Since we are interested in the ethnic gap in the Hungarian labor market, individuals who live outside
of Hungary are excluded from the analysis (331 persons).
6 In addition, cross-country comparison of return of education in Eastern Europe shows that return to schooling is the highest in Hungary [Flabbi et al., 2008].
17
3.5. EXPLANATORY MECHANISM
3.5.1. EXPLANATORY MECHANISM OF THE EDUCATIONAL OUTCOMES
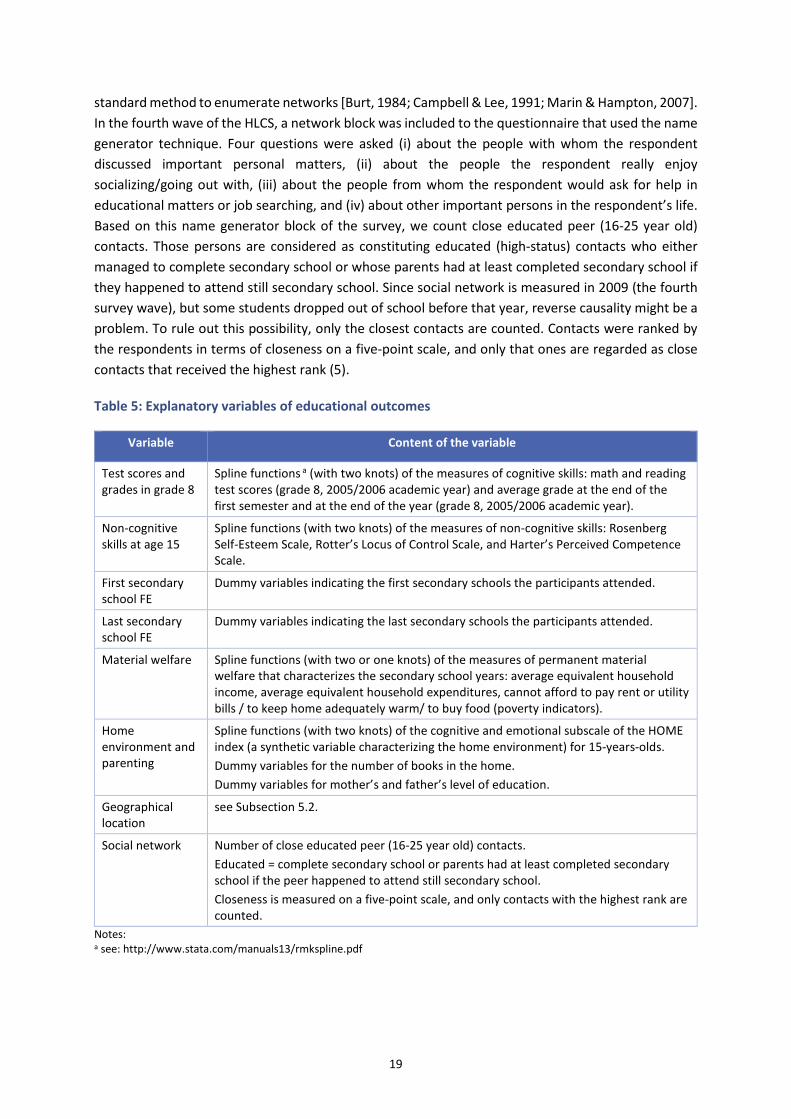
The main focus of this report is on the factors that explain the ethnic differences in educational success.
These mechanisms are summarized in Table 5. The ethnic differences for these variables are shown in
Table A9 in the Appendix.
We assume that the first phase of human capital formation, which ends at the end of the primary
school, can be described by test scores and average grades (GPA) in the eighth grade (at age 14-15).
These variables show the cognitive skills and abilities that children acquired in the early childhood and
elementary school years. Mathematics and reading test scores of eighth grade students measured by
the Hungarian National Assessment of Basic Competences (NABC) in May 2006, which is linked to the
sample of the Hungarian Life Course Survey. Average grade at the end of the first semester comes from
the supplementary student questionnaire of the NABC. Average grade at the end of the eighth year of
the primary school was measured in the first wave of the HLCS. These four variables are included into
the analysis as a spline function to allow for nonlinear effects.
Recent studies show that not only cognitive, but non-cognitive abilities affect various social and
economic outcomes, e.g. educational and labor market outcomes [Borghans et al., 2008; Heckman et
al., 2006, 2013; Heckman & Kautz, 2012; Heckman & Rubinstein, 2001; Roberts et al., 2007]. The first
wave of the HLCS contains information about three psychological measures of non-cognitive skills. The
Rosenberg Self-Esteem Scale is a widely used one-dimensional measuring of the self-esteem
[Rosenberg, 1965]. Julian Rotter’s Locus of Control Scale measure the individuals’ belief in internal-
external control of their life [Rotter, 1966]. Internal control means that life events are determined by
own actions and behavior. HLCS measure locus of control with the four-item version of the Rotter scale
(the same version was used in the 1979 round of the National Longitudinal Study of Youth). A seven-
item version of Susan Harter’s Perceived Competence Scale for Children measure participants social
desirability, social competence in the HLCS [Harter, 1982]. Measures of non-cognitive abilities are
included into the analysis as a spline function to allow for nonlinear effects.
The effect of factors related to the quality of secondary schools is captured by first and last secondary
school fixed effects. Including secondary school fixed effects in the regression controls for all of the
unmeasured factors that are correlated with secondary schools and affect the educational outcomes.
Effective teachers and mutually motivating classmates/schoolmates can make a school a "high-quality"
institution. Previous studies have convincingly demonstrated that high-quality teaching is one of the
main catalysts for good student performance. Although these studies assess teaching quality through
the use of a variety of methods, their results are clear: high-quality teaching is one of the main catalysts
for good student performance [Chetty et al., 2011; Ferguson, 1998; Rivkin et al., 2005; Schacter &
Thum, 2004, 2004; Wenglinsky, 2001]. Peer group composition is positively related to student
performance. If any type of social mechanism causes children with learning problems to cluster in one
school, a subculture may develop that is not conducive to learning. Several studies show that high-
performance peer groups enhance while low-performance peer groups inhibit individual learning
performance [Ammermueller & Pischke, 2009; Hanushek et al., 2003, 2009]. Controlling for secondary
18
school quality might be important in the analysis of dropping out/result of maturity exam/college
attendance.
When interpreting the results, we can interpret the regression estimates of the Roma coefficient in
the equations without secondary school fixed effects to measure the differences between randomly
selected Roma and non-Roma students. The Roma coefficient in the equations that include secondary
school fixed effects measures the gap between randomly selected Roma and non-Roma schoolmates.
The difference between the two estimates shows the consequences of the selection of Roma students
into secondary schools that differ from the secondary schools of non-Roma students. The difference
between the coefficients without and with the secondary school fixed-effects thus captures all the
effects of selection and differences in the educational quality of typical Roma and non-Roma students.
Another group of explanatory mechanism consists of material and human resources that characterize
the secondary school years. Adolescents whose family has higher income might have access to better
secondary schools and after-school programs. High-income families are also more likely able to finance
post-secondary education [Belley & Lochner, 2007; Coelli, 2011; Kinsler & Pavan, 2011; Lochner &
Monge-Naranjo, 2011]. In order to capture these effects, we measure permanent material welfare
with five indicators: average equivalent household income, average equivalent household
expenditures, not having enough money for food / heating / utility bills (poverty indicators). We use
information only for those years when participants attended secondary schools. In the regression
analysis these variables are included as spline functions to allow for nonlinear effects of material
resources.
The numerous activities, aspects of the home environment and behavioral patterns combine to form
the learning environment at home. Since in this report we focus on secondary school, we use measures
of parenting practices and home environment during the secondary school years. We use four
indicators to measure human resources, emotional and learning environment at home. The students’
home environment (at age 14-15) and parenting practices are measured with the use of the HOME
(Home Observation for Measurement of the Environment) scale. The HOME index is an instrument
that is used to assess the developmentally relevant features of a child's home environment, and our
data contain the battery developed for adolescents [Bradley et al., 2000; Mott, 2004]. Recent
researches show that the home environment and parenting, as measured by the HOME scale, are
strongly related to children's school performance [Crane, 1996; Guo & Harris, 2000; Linver et al., 2002;
Todd & Wolpin, 2007]. The first wave of the HLCS included a short version of the adolescent HOME
scale (HOME-SF) that was used in the National Longitudinal Study of Youth (NLSY). The short version is
composed of 27 items and assesses two subscales: cognitive stimulation and emotional support.7 Both
subscales are included in the analysis as spline functions. As supplemental measures of the home
environment, we also included the number of books in the home and mother’s and father’s education
level.
Previous studies provide evidence that contacts to the higher status part of the community may serve
as an important social resource for the poor in many important life events: school continuation,
dropping out, job search, etc. [Cherng et al., 2012; Conti et al., 2013; Crosnoe et al., 2003; Jackson,
2009, 2011; Stearns, 2010]. In order to confirm these results we used the name generator which is a
7 See Table A10 and Table A11 in the Appendix.
19
standard method to enumerate networks [Burt, 1984; Campbell & Lee, 1991; Marin & Hampton, 2007].
In the fourth wave of the HLCS, a network block was included to the questionnaire that used the name
generator technique. Four questions were asked (i) about the people with whom the respondent
discussed important personal matters, (ii) about the people the respondent really enjoy
socializing/going out with, (iii) about the people from whom the respondent would ask for help in
educational matters or job searching, and (iv) about other important persons in the respondent’s life.
Based on this name generator block of the survey, we count close educated peer (16-25 year old)
contacts. Those persons are considered as constituting educated (high-status) contacts who either
managed to complete secondary school or whose parents had at least completed secondary school if
they happened to attend still secondary school. Since social network is measured in 2009 (the fourth
survey wave), but some students dropped out of school before that year, reverse causality might be a
problem. To rule out this possibility, only the closest contacts are counted. Contacts were ranked by
the respondents in terms of closeness on a five-point scale, and only that ones are regarded as close
contacts that received the highest rank (5).
Table 5: Explanatory variables of educational outcomes
Variable Content of the variable
Test scores and grades in grade 8
Spline functions a (with two knots) of the measures of cognitive skills: math and reading test scores (grade 8, 2005/2006 academic year) and average grade at the end of the first semester and at the end of the year (grade 8, 2005/2006 academic year).
Non-cognitive skills at age 15
Spline functions (with two knots) of the measures of non-cognitive skills: Rosenberg Self-Esteem Scale, Rotter’s Locus of Control Scale, and Harter’s Perceived Competence Scale.
First secondary school FE
Dummy variables indicating the first secondary schools the participants attended.
Last secondary school FE
Dummy variables indicating the last secondary schools the participants attended.
Material welfare Spline functions (with two or one knots) of the measures of permanent material welfare that characterizes the secondary school years: average equivalent household income, average equivalent household expenditures, cannot afford to pay rent or utility bills / to keep home adequately warm/ to buy food (poverty indicators).
Home environment and parenting
Spline functions (with two knots) of the cognitive and emotional subscale of the HOME index (a synthetic variable characterizing the home environment) for 15-years-olds.
Dummy variables for the number of books in the home.
Dummy variables for mother’s and father’s level of education.
Geographical location
see Subsection 5.2.
Social network Number of close educated peer (16-25 year old) contacts.
Educated = complete secondary school or parents had at least completed secondary school if the peer happened to attend still secondary school.
Closeness is measured on a five-point scale, and only contacts with the highest rank are counted.
Notes: a see: http://www.stata.com/manuals13/rmkspline.pdf

20
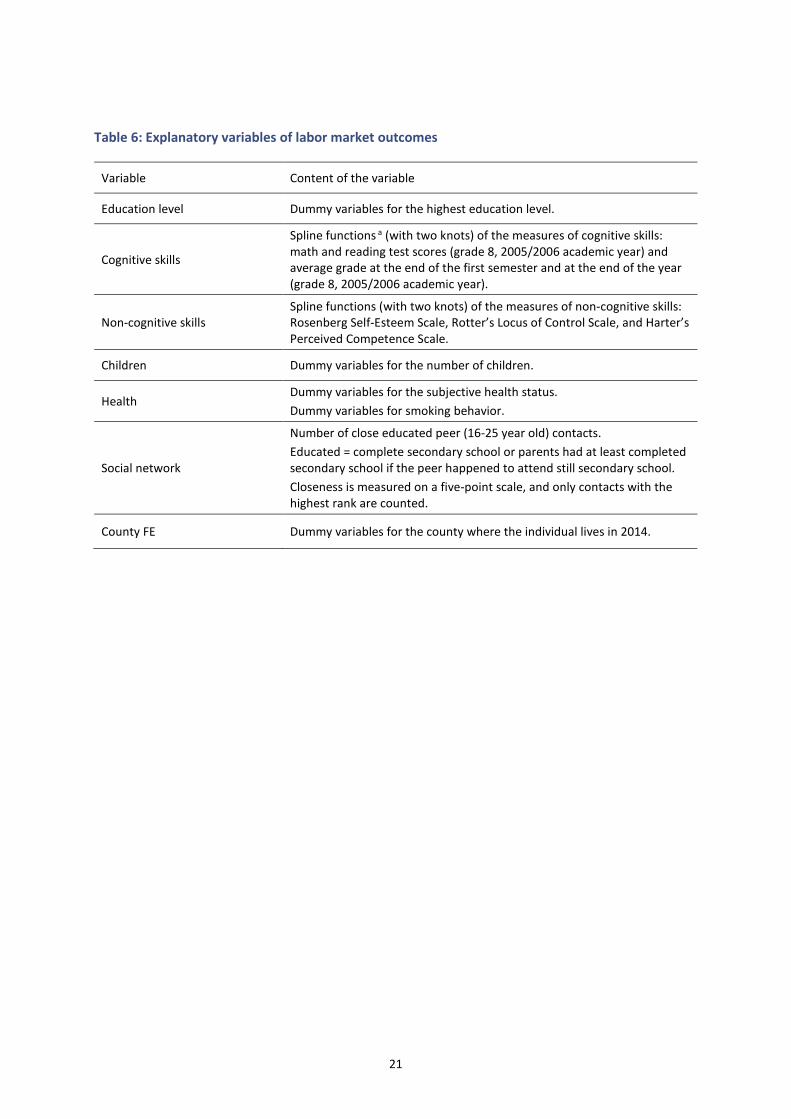
3.5.2. EXPLANATORY MECHANISM OF THE LABOR MARKET OUTCOMES
Besides the measures of cognitive and non-cognitive skills and abilities, and social network (introduced
in Subsection 3.5.1.), we take into account other important mechanism that might explain the ethnic
differences in the labor market achievement. Table 6 describes these factors.
Several studies show that education is one of the most important predictors of success in the labor
market [Card, 1999]. For example, using Hungarian datasets, Kertesi and Kézdi [2011a] decompose the
employment gap between Roma and non-Roma and find that one-third of the employment gap is
explained by ethnic differences in education, and the role of education in the ethnic gap is increasing
between 1993 and 2007. To control for the differences in the educational attainment between Roma
and non-Roma, we include dummy variables that indicate the highest education level of the
respondent in the seventh survey wave (at age 22-23).
Roma and non-Roma enter the labor market with different level of skills and abilities, and although
education level proxies skills, but it is a noisy measure of workers’ skills, therefore we also include the
direct measures of cognitive and non-cognitive skills into the regressions.
Features of the local labor market might be important determinants of the employment probability
and wage level. Hungary is divided into 20 counties (including Budapest), and in this report these
counties are considered as the local labor markets. Local labor market conditions vary considerably
between geographical areas: demand for low- and high-skill workers, unemployment rate, wage level,
and ethnic preferences of employees can be substantially different in various areas of the country. For
example, in 2013 the unemployment rate (for the 20-24 age group) varied between 5.4 percent and
15.7 percent across the counties. In order to control for unobserved spatial factors that might influence
labor market success, we include county fixed effects into the analysis.
Health and social contacts might also play an important role in labor market success. Social networks
are significant resources: social networks can provide information about job openings and
opportunities, contacts might reduce unemployment duration, many people apply for a job through
social contacts [Conti et al., 2013; Jackson, 2009, 2011]. The classic study of Granovetter [1973] shows
that even weak ties (with whom individuals interact less than once per year) play an important role in
finding a job. In this report we measure social network with the name generator block in the fourth
wave of the HLCS, and the number of close educated peer (16-25 year old) contacts are included into
the labor market regressions as a right-hand-side variable (for more details of the measurement see
Subsection 3.5.1.).
Health status is measured with two indicators. In the sixth survey wave respondents answered a
subjective health question on a five-point scale.8 Another question was asked about smoking
behavior.9 Using these questions we created dummy variables that represent individuals’ health status.
8 How is your health in general? 1=very bad, 2=bad, 3=fair, 4=good, 5=very good.
9 How often do you smoke cigarettes? 1=never, 2=less than once a week, 3=more than once a week, but less than every day, 4=every day.
21
Table 6: Explanatory variables of labor market outcomes
Variable Content of the variable
Education level Dummy variables for the highest education level.
Cognitive skills
Spline functions a (with two knots) of the measures of cognitive skills: math and reading test scores (grade 8, 2005/2006 academic year) and average grade at the end of the first semester and at the end of the year (grade 8, 2005/2006 academic year).
Non-cognitive skills Spline functions (with two knots) of the measures of non-cognitive skills: Rosenberg Self-Esteem Scale, Rotter’s Locus of Control Scale, and Harter’s Perceived Competence Scale.
Children Dummy variables for the number of children.
Health Dummy variables for the subjective health status.
Dummy variables for smoking behavior.
Social network
Number of close educated peer (16-25 year old) contacts.
Educated = complete secondary school or parents had at least completed secondary school if the peer happened to attend still secondary school.
Closeness is measured on a five-point scale, and only contacts with the highest rank are counted.
County FE Dummy variables for the county where the individual lives in 2014.
22
4. EMPIRICAL METHODOLOGY
For each educational and labor market outcome we estimate OLS regressions with a Roma dummy,
which shows the ethnic gap, and additional right-hand-side variables that represent the mechanism
introduced in Subsection 3.5. We start without controls: this regression measure the raw ethnic gap.
Then, we successively add variables representing the explanatory mechanisms. The main question is
the extent to which the Roma coefficient changes with the inclusion of the right-hand-side variables.
We estimate reduced form regressions, but the content of the control variables and the sequence of
their inclusion suggest causal mechanisms. The order of inclusion of the right-hand-side variables is
determined primarily by chronology. In the first steps we include variables that capture the product of
human capital formation at the end of the primary school (at age 14-15). Then we include variables
that might affect educational success during the secondary school years. Accordingly, we enter the
right-hand-side variables of the educational equations in the following order: (1) measures of cognitive
skills, (2) measures of non-cognitive skills (3) first/last secondary school fixed effects, (4) material
welfare and home environment. Analyzing the ethnic gap in college attendance, the result of the
Matura exam is included instead of measures of cognitive and non-cognitive skills.
Although family's human and material resources are strongly correlated over the children’s life cycle,
the inclusion of the measures of material welfare, home environment and parenting during the
secondary school years captures only the effects of family's human and material resources in the
secondary school years, since the effects of family's resources in the primary school years and in early
childhood are crystallized in the measures of cognitive and non-cognitive skills at age 14-15 (grade 8).
In other words, we interpret the measures of cognitive and non-cognitive skills at age 14-15 as the
outcome of family's human and material resources in the first 14-15 years of the children’s lives.
The order of inclusion of the right-hand-side variables in the labor market analysis is the following: (1)
education level/measures of cognitive skills, (2) measures of non-cognitive skills, (3) children (in the
analysis of women's employment), (4) health and social network, (5) county fixed effects.
The models are estimated by ordinary least squares (OLS) with the robust standard error estimates
clustered at residence level (place of residence in the first survey wave for the educational outcomes,
and place of residence in the seventh survey wave for the labor market outcomes). Missing right-hand-
side variables are addressed by including dummies for missing status. Weights are used to restore
national representativeness and to adjust for sample attrition.
23
5. EDUCATIONAL OUTCOMES
5.1. THE RAW ETHNIC GAPS
Table 7 summarizes the raw ethnic gaps in the educational achievement. The first two columns show
the Roma and the non-Roma figures, whereas the third column shows the ethnic differences.
The figures show that substantial ethnic differences exist in all educational outcomes. Secondary
school dropout rate is 32 percent for Roma students compared with a dropout rate of 5 percent for
non-Roma students. This ethnic gap in dropout rate is extremely large: Roma students are 27
percentage points more likely to drop out of secondary schools than non-Roma students. The ratio of
vocational training school graduates among the Roma is 19 percentage points higher than among the
non-Roma. In contrast, graduation rate from general or vocational secondary school for non-Roma is
much higher than for Roma. 34 percent of non-Roma graduate from vocational secondary school, and
44 percent from general secondary school. The corresponding rates for Roma are 21 percent and 12
percent, respectively. These figures mean that less than one-third of the Roma and more than three-
fourths of the non-Roma take the Matura exam (32 percent vs. 78 percent), which qualifies for higher
education. In other words, more than two-thirds of the Roma are not able enter higher education after
secondary school. The Roma not only take the Matura exam with much lower probability, but the
average result of their Matura exam is also far below the average. The gap in terms of standardized
Matura score is 50 percent of the standard deviation between Roma and non-Roma (−0.50 vs 0.00
measured in standard deviation). Finally, among general or vocational secondary school graduates the
college attendance rate is 51 percent for non-Roma and 19 percent for Roma.10
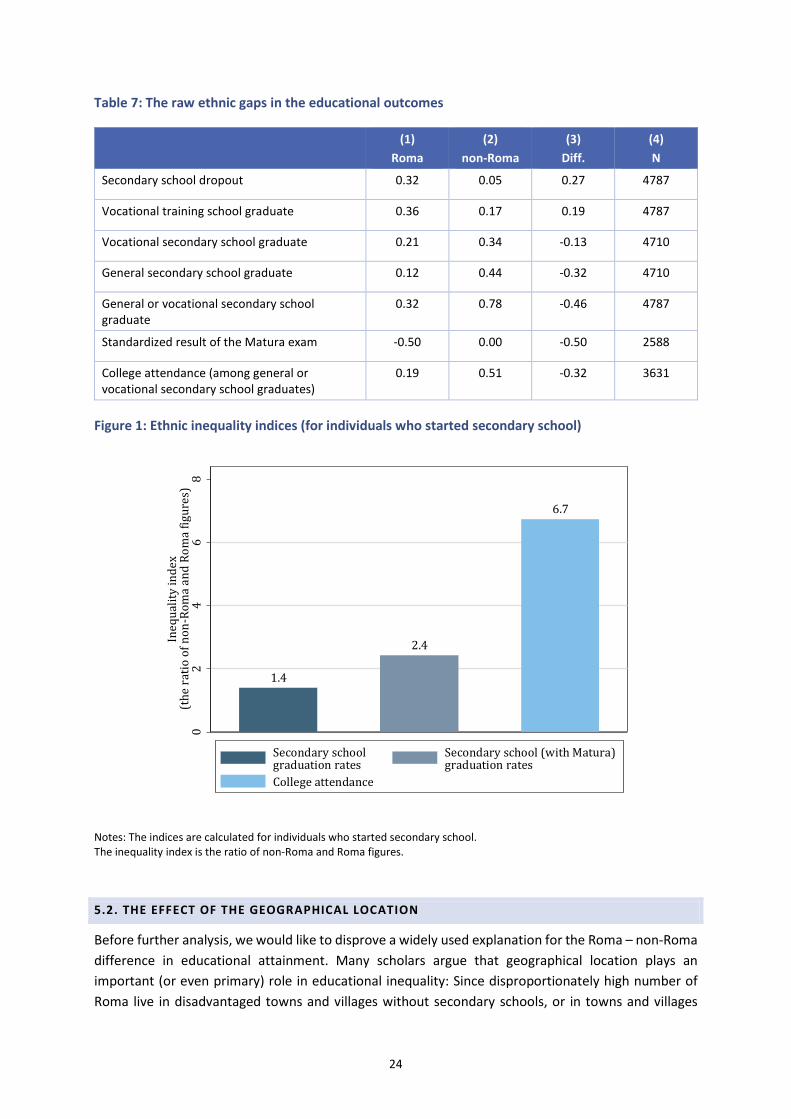
Figure 1 depicts three ethnic inequality indices in terms of (i) graduation from secondary school, (ii)
graduation from secondary school with Matura exam, and (iii) college attendance. Inequality indices
are calculated as the ratio of non-Roma and Roma figures. The first index shows that non-Roma at age
22-23 are 1.4 times more likely to be secondary school graduates than Roma (95 percent vs. 68
percent). In terms of graduation from secondary school with Matura exam, we see an even larger
difference: non-Roma are 2.4 times more likely to have passed the Matura exam. Finally, non-Roma
are 6.7 times more likely to be enrolled in college. This inequality in college attendance is immense:
among Roma only 6 out of 100 ninth graders will be university student, compared with 40 out of 100
non-Roma ninth graders.
We have to emphasize that the inequality indices are calculated for those students who do start
secondary school. The differences between Roma and non-Roma would be even higher if indices were
calculated for the whole birth cohort.
10 These ethnic differences are very similar for women and men (see
Table A12 in the Appendix).
24
Table 7: The raw ethnic gaps in the educational outcomes
(1)
Roma
(2)
non-Roma
(3)
Diff.
(4)
N
Secondary school dropout 0.32 0.05 0.27 4787
Vocational training school graduate 0.36 0.17 0.19 4787
Vocational secondary school graduate 0.21 0.34 -0.13 4710
General secondary school graduate 0.12 0.44 -0.32 4710
General or vocational secondary school graduate
0.32 0.78 -0.46 4787
Standardized result of the Matura exam -0.50 0.00 -0.50 2588
College attendance (among general or vocational secondary school graduates)
0.19 0.51 -0.32 3631
Figure 1: Ethnic inequality indices (for individuals who started secondary school)
Notes: The indices are calculated for individuals who started secondary school. The inequality index is the ratio of non-Roma and Roma figures.
5.2. THE EFFECT OF THE GEOGRAPHICAL LOCATION
Before further analysis, we would like to disprove a widely used explanation for the Roma – non-Roma
difference in educational attainment. Many scholars argue that geographical location plays an
important (or even primary) role in educational inequality: Since disproportionately high number of
Roma live in disadvantaged towns and villages without secondary schools, or in towns and villages
1.4
2.4
6.7
02
46
8
Ine
qu
ali
ty i
nd
ex
(th
e r
ati
o o
f n
on
-Ro
ma
an
d R
om
a f
igu
res)
Secondary schoolgraduation rates
Secondary school (with Matura)graduation rates
College attendance
25
where the number of high quality secondary schools and teachers is limited, they inevitably end up
with low skills, abilities, and educational level.
Indeed, the spatial distributions of the Roma and non-Roma show significant differences. According to
the first wave of the HLCS, 52 percent of Roma youth live in villages and only 17 percent live in bigger
cities (including Budapest). The corresponding numbers for non-Roma are 33 percent and 35 percent,
respectively. Furthermore, the Roma are overrepresented in the least developed regions of Hungary:
50 percent of young Roma live in Southern Transdanubia and Northern Hungary, compared with only
22 percent of non-Roma youth. However, despite these large differences, place of residence explain
only a small part of the ethnic gap in educational attainment.
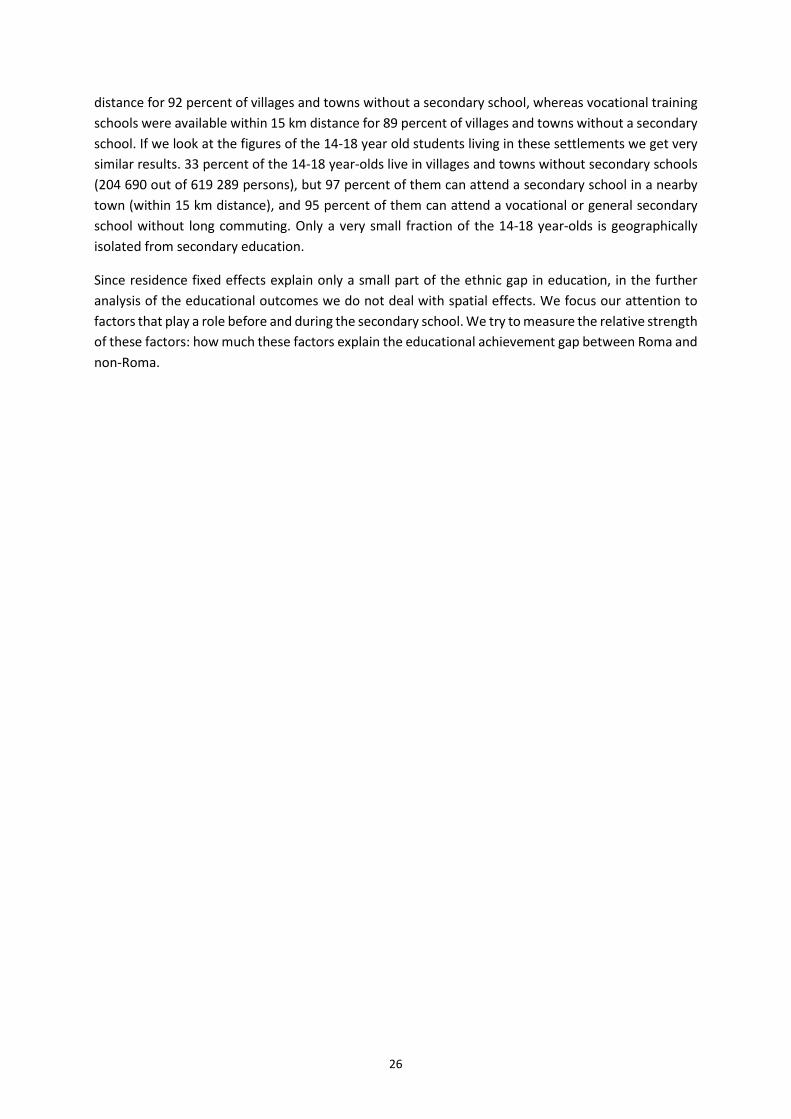
Table 8 provides evidence that the raw ethnic gaps decrease only slightly when place of residence fixed
effects are included in the regressions. We examine four educational outcomes: (i) stopping education
after primary school; (ii) dropping out of secondary school; (iii) graduating from a secondary school
with Matura exam; (iv) college attendance. In the first step we estimate the raw ethnic gap, then we
add place of residence fixed effects to control for unobserved environmental influences specific to the
locality (place of residence). Residence fixed effects capture all the residence-specific determinants of
educational outcomes, such as availability and quality of secondary schools, local educational policies,
environmental quality (e.g. pollution), cost of after-school programs, social organizations, etc. In other
words, the equations without place of residence fixed effects measure the differences between
randomly selected Roma and non-Roma youth. The equations that include place of residence fixed
effects measure the gap between randomly selected Roma and non-Roma youth living in the same
village, town, or city. The main conclusion of this exercise is that the residual ethnic gaps (after the
inclusion of the residence fixed effects) are at most 3 percentage points lower than the raw gaps.
Differences in geographical location explain only a small part of the ethnic gaps in educational
attainment.
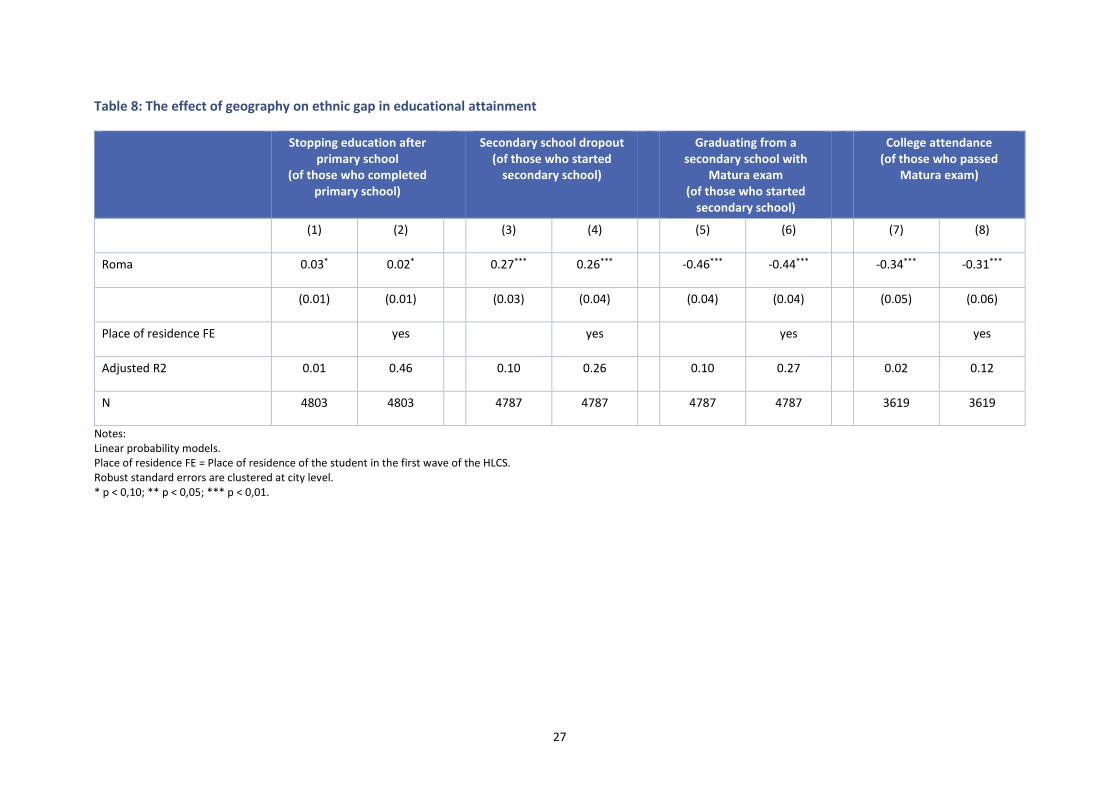
Why do not we see larger effects? One reason of this result is that the physical availability of secondary
school is not limited in Hungary.
Figure 2 depicts Hungarian villages, towns and cities regarding the availability of secondary schools in
2006. White areas represent villages, towns and cities without any secondary school. Black areas
represent villages, towns and cities with only vocational training schools, whereas dark gray areas
represent villages, towns and cities with only secondary schools that prepare students for the Matura
exam. Light gray areas show locations with both vocational training schools and secondary schools that
prepare students for the Matura exam. Looking at Figure 2, we can see that the geographical
distribution of secondary schools is quite even in Hungary, there are only very few villages, towns or
cities without any secondary school within close distance.
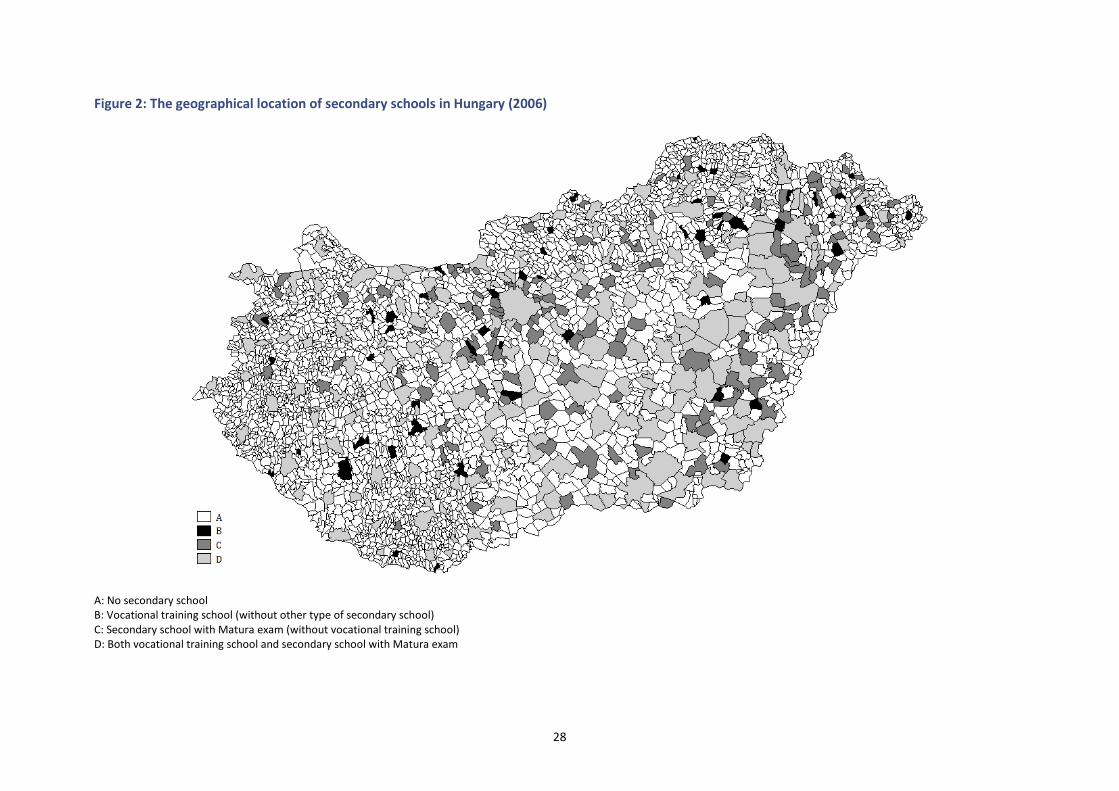
Table 9 summarizes some more exact measures of availability of secondary schools in Hungary. In
2006, 87 percent of the villages and towns were without any secondary school (2740 out of 3137);
however, secondary education was available within a close distance range (15 km in a straight line)11
for 95 percent of these villages and towns. Secondary schools that prepare students for the Matura
exam and higher education (i.e. vocational or general secondary schools) were available within 15 km
11 Geographical proximity is measured as distance between the centers of villages, towns, and cities.
26
distance for 92 percent of villages and towns without a secondary school, whereas vocational training
schools were available within 15 km distance for 89 percent of villages and towns without a secondary
school. If we look at the figures of the 14-18 year old students living in these settlements we get very
similar results. 33 percent of the 14-18 year-olds live in villages and towns without secondary schools
(204 690 out of 619 289 persons), but 97 percent of them can attend a secondary school in a nearby
town (within 15 km distance), and 95 percent of them can attend a vocational or general secondary
school without long commuting. Only a very small fraction of the 14-18 year-olds is geographically
isolated from secondary education.
Since residence fixed effects explain only a small part of the ethnic gap in education, in the further
analysis of the educational outcomes we do not deal with spatial effects. We focus our attention to
factors that play a role before and during the secondary school. We try to measure the relative strength
of these factors: how much these factors explain the educational achievement gap between Roma and
non-Roma.
27
Table 8: The effect of geography on ethnic gap in educational attainment
Stopping education after primary school
(of those who completed primary school)
Secondary school dropout (of those who started
secondary school)
Graduating from a secondary school with
Matura exam (of those who started
secondary school)
College attendance (of those who passed
Matura exam)
(1) (2) (3) (4) (5) (6) (7) (8)
Roma 0.03* 0.02* 0.27*** 0.26*** -0.46*** -0.44*** -0.34*** -0.31***
(0.01) (0.01) (0.03) (0.04) (0.04) (0.04) (0.05) (0.06)
Place of residence FE yes yes yes yes
Adjusted R2 0.01 0.46 0.10 0.26 0.10 0.27 0.02 0.12
N 4803 4803 4787 4787 4787 4787 3619 3619
Notes: Linear probability models. Place of residence FE = Place of residence of the student in the first wave of the HLCS. Robust standard errors are clustered at city level. * p < 0,10; ** p < 0,05; *** p < 0,01.
28
Figure 2: The geographical location of secondary schools in Hungary (2006)
A: No secondary school B: Vocational training school (without other type of secondary school) C: Secondary school with Matura exam (without vocational training school) D: Both vocational training school and secondary school with Matura exam
29
Table 9: Geographical availability of secondary schools in Hungary (2006)
Within 15 km distance: Villages, towns and cities without any secondary schoola
% of these villages, towns and cities
% of 14-18 year-olds who live in these villages, towns and cities
Any type of secondary school 95 97
General or vocational secondary school
92 95
Vocational training school 89 90
Within 15 km distance: Villages, towns and cities with only vocational training schoolb
% of these villages, towns and cities
% of 14-18 year-olds who live in these villages, towns and cities
General or vocational secondary school
89 93
Source: TSTAR (2006) and KIRSTAT (2006). Notes: a Hungary had 3137 localities in 2006, 2740 of them were without secondary school. 204 690 14-18-year-olds (out of 619 289) lived in these localities. b In 2006, 54 localities out of 3137 were without general or vocational secondary school (in other words, had only vocational training school). 9628 14-18-year-olds (out of 619 289) lived in these localities.
5.3. SECONDARY SCHOOL DROPOUT RATES
In the subsequent analyses we run multiple linear regression models that include a Roma dummy,
which shows the ethnic gap, and other right-hand-side variables that were introduced in Section 3.5.
We start without controls and successively add variables representing the explanatory mechanisms.
The main question is the extent to which the ethnic gap decreases with the inclusion of the additional
control variables.
The Roma versus non-Roma dropout gap estimates from six specifications are presented in Table 10.
The first column shows that Roma students are 27 percentage points more likely to drop out of
secondary schools than non-Roma students. The main result of the analysis is that 52 percent of the
ethnic gap can be explained by skills and abilities at age 14-15, disadvantages at secondary schools,
and poverty and home environment during the secondary school years. Column 2 shows that 26
percent of the raw gap disappears after controlling for the cognitive skills at age 14-15. Entering the
non-cognitive skills variables does not significantly reduce the Roma coefficient. These results suggest
that one-fourth of the gap in secondary school dropout rate between young Roma and non-Roma can
be explained by factors that influence human capital formation in early childhood and primary school.
Inclusion of the first secondary school fixed effects does not affect significantly the ethnic gap.
However, ethnic differences in material welfare, home environment and parenting during the
secondary school years account for an additional 26 percent of the ethnic gap. After inclusion of all
right-hand-side variables, the ethnic gap becomes 13 percentage points. This means that the gap in
dropout rate between Roma and non-Roma schoolmates in secondary school with similar cognitive
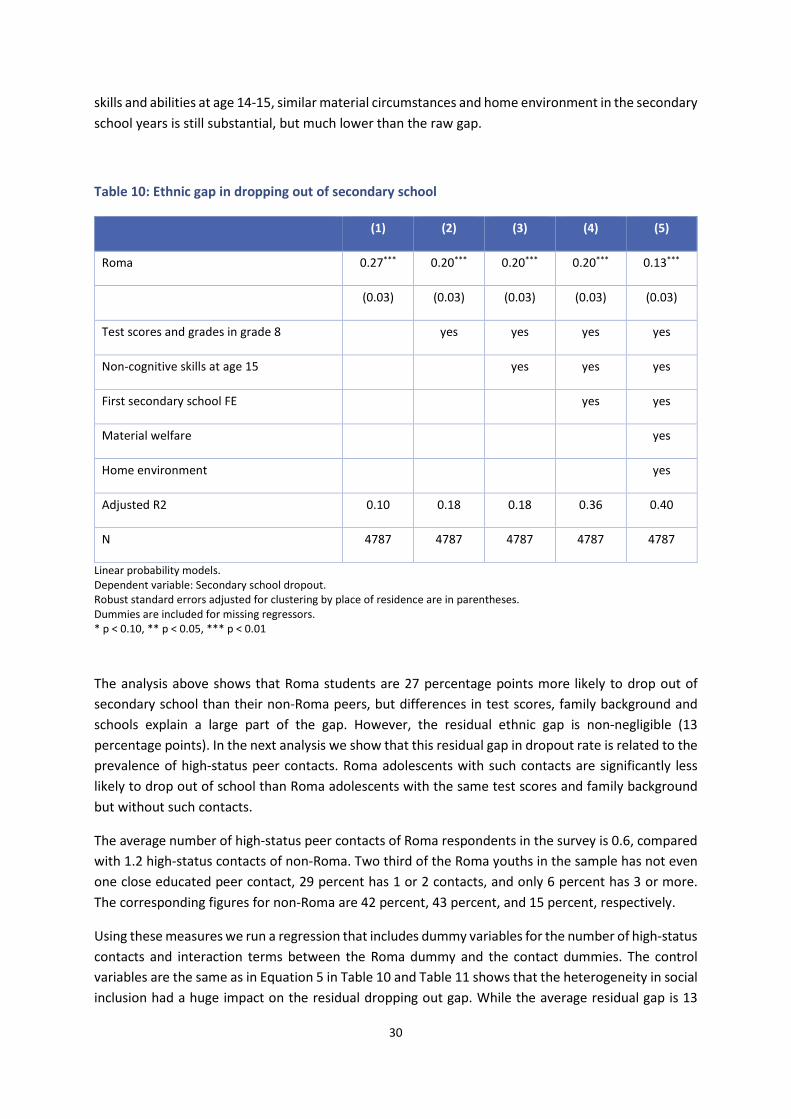
30
skills and abilities at age 14-15, similar material circumstances and home environment in the secondary
school years is still substantial, but much lower than the raw gap.
Table 10: Ethnic gap in dropping out of secondary school
(1) (2) (3) (4) (5)
Roma 0.27*** 0.20*** 0.20*** 0.20*** 0.13***
(0.03) (0.03) (0.03) (0.03) (0.03)
Test scores and grades in grade 8 yes yes yes yes
Non-cognitive skills at age 15 yes yes yes
First secondary school FE yes yes
Material welfare yes
Home environment yes
Adjusted R2 0.10 0.18 0.18 0.36 0.40
N 4787 4787 4787 4787 4787
Linear probability models. Dependent variable: Secondary school dropout. Robust standard errors adjusted for clustering by place of residence are in parentheses. Dummies are included for missing regressors. * p < 0.10, ** p < 0.05, *** p < 0.01
The analysis above shows that Roma students are 27 percentage points more likely to drop out of
secondary school than their non-Roma peers, but differences in test scores, family background and
schools explain a large part of the gap. However, the residual ethnic gap is non-negligible (13
percentage points). In the next analysis we show that this residual gap in dropout rate is related to the
prevalence of high-status peer contacts. Roma adolescents with such contacts are significantly less
likely to drop out of school than Roma adolescents with the same test scores and family background
but without such contacts.
The average number of high-status peer contacts of Roma respondents in the survey is 0.6, compared
with 1.2 high-status contacts of non-Roma. Two third of the Roma youths in the sample has not even
one close educated peer contact, 29 percent has 1 or 2 contacts, and only 6 percent has 3 or more.
The corresponding figures for non-Roma are 42 percent, 43 percent, and 15 percent, respectively.
Using these measures we run a regression that includes dummy variables for the number of high-status
contacts and interaction terms between the Roma dummy and the contact dummies. The control
variables are the same as in Equation 5 in Table 10 and Table 11 shows that the heterogeneity in social
inclusion had a huge impact on the residual dropping out gap. While the average residual gap is 13

31
percentage points, the gap shrinks to 7 percent for those who had at least one high-status contact, and
the gap for those who had no such a contact at all increases to 16 percent. For those who had at least
two high-status peer contacts the residual ethnic gap disappears. These results mean that contacts
that link Roma students to the educated part of the society are important. This result is in line with the
standard network literature.
For a robustness test, we re-estimated these regressions on the subsample of individuals who were in
school in the third survey wave (see in Table A13 the Appendix). This selection rules out reverse
causality in a more convincing way. The results of the re-estimated regressions are very similar to those
presented here.
Table 11: Estimated residual ethnic gap in dropping out of secondary school by number of close
contacts with highly educated peers
Number of close educated peer contacts
Distribution of the students
Residual ethnic gap in dropping out of secondary school
Roma non-Roma ethnic gap s.e. p
0 0,65 0,42 0,16 0,04 0,00
1 0,21 0,28 0,11 0,07 0,09
2 0,08 0,15 0,03 0,09 0,71
3 or more 0,06 0,15 0,00 0,09 0,99
Total 1,00 1,00 0,13 0,04 0,00
1 or more 0,35 0,58 0,07 0,05 0,16
Notes: Number of close educated peer contacts = Number of close relationships with peers (16-25-year-olds) with completed secondary school (if the peer is still in secondary school, then the education of her/his parents is considered). Closeness of the relationship is indicated on a five-point scale. Only the closest (closeness = 5) contacts are counted. N=4787 All of the right-hand-side variables of Equation 5 in Table 10 are included. Linear probability models. Dependent variable: Secondary school dropout. Robust standard errors adjusted for clustering by place of residence are in parentheses.
5.4. SECONDARY SCHOOL TYPE
Table 12 and Table 15 show the ethnic gaps in graduation from vocational training school, vocational
secondary school, general secondary school, and secondary school with Matura exam, respectively.
The first columns of the tables show the raw ethnic gap. The second and third columns show the effect
of ethnic differences in the cognitive and non-cognitive skills. Finally, in the fourth column material
welfare and home environment during the secondary school years are included.

32
The main conclusion of these analyses is that the enormous ethnic differences in the cognitive skills at
the end of the primary school explain a large part of the gap in gradation from the three types of
secondary schools. Material welfare and home environment also play a non-negligible role. For
example, looking at the ethnic gap in graduation from secondary school with Matura exam (Table 15),
we can see that cognitive skills account for 61 percent of the overall gap. Entering the non-cognitive
skills variables does not significantly reduce the Roma coefficient, but material welfare and home
environment explain another 24 percent of the raw gap. When comparing people with the same
cognitive and non-cognitive skills as well as the same material welfare and home environment, the
secondary school (with Matura exam) graduation gap between Roma and non-Roma respondents is
only 7 percentage points.
We can see similar results for the graduation from all types of secondary school: ethnic differences in
cognitive skills, material welfare and home environment explain almost the entire Roma – non-Roma
gaps. Non-cognitive skills do not affect significantly the ethnic gap.
Table 12: Ethnic gap in graduation from vocational training school
(1) (2) (3) (4)
Roma 0.19*** -0.02 -0.02 -0.04
(0.04) (0.04) (0.04) (0.04)
Test scores and grades in grade 8 yes yes yes
Non-cognitive skills at age 15 yes yes
Material welfare yes
Home environment yes
Adjusted R2 0.02 0.26 0.26 0.28
N 4787 4787 4787 4787
Linear probability models. Dependent variable: Vocational training school graduate. Robust standard errors adjusted for clustering by place of residence are in parentheses. Dummies are included for missing regressors. * p < 0.10, ** p < 0.05, *** p < 0.01
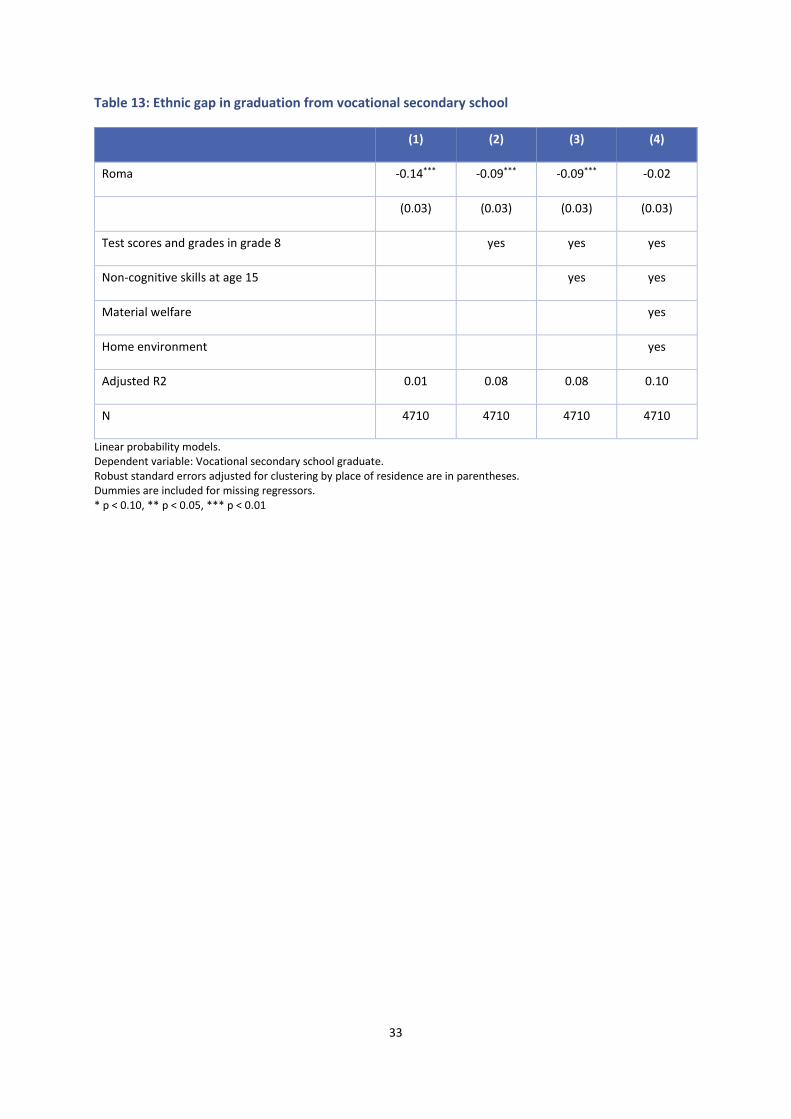
33
Table 13: Ethnic gap in graduation from vocational secondary school
(1) (2) (3) (4)
Roma -0.14*** -0.09*** -0.09*** -0.02
(0.03) (0.03) (0.03) (0.03)
Test scores and grades in grade 8 yes yes yes
Non-cognitive skills at age 15 yes yes
Material welfare yes
Home environment yes
Adjusted R2 0.01 0.08 0.08 0.10
N 4710 4710 4710 4710
Linear probability models. Dependent variable: Vocational secondary school graduate. Robust standard errors adjusted for clustering by place of residence are in parentheses. Dummies are included for missing regressors. * p < 0.10, ** p < 0.05, *** p < 0.01

34
Table 14: Ethnic gap in graduation from general secondary school
(1) (2) (3) (4)
Roma -0.32*** -0.09*** -0.09*** -0.05*
(0.03) (0.02) (0.02) (0.03)
Test scores and grades in grade 8 yes yes yes
Non-cognitive skills at age 15 yes yes
Material welfare yes
Home environment yes
Adjusted R2 0.04 0.32 0.32 0.35
N 4710 4710 4710 4710
Linear probability models. Dependent variable: General secondary school graduate. Robust standard errors adjusted for clustering by place of residence are in parentheses. Dummies are included for missing regressors. * p < 0.10, ** p < 0.05, *** p < 0.01
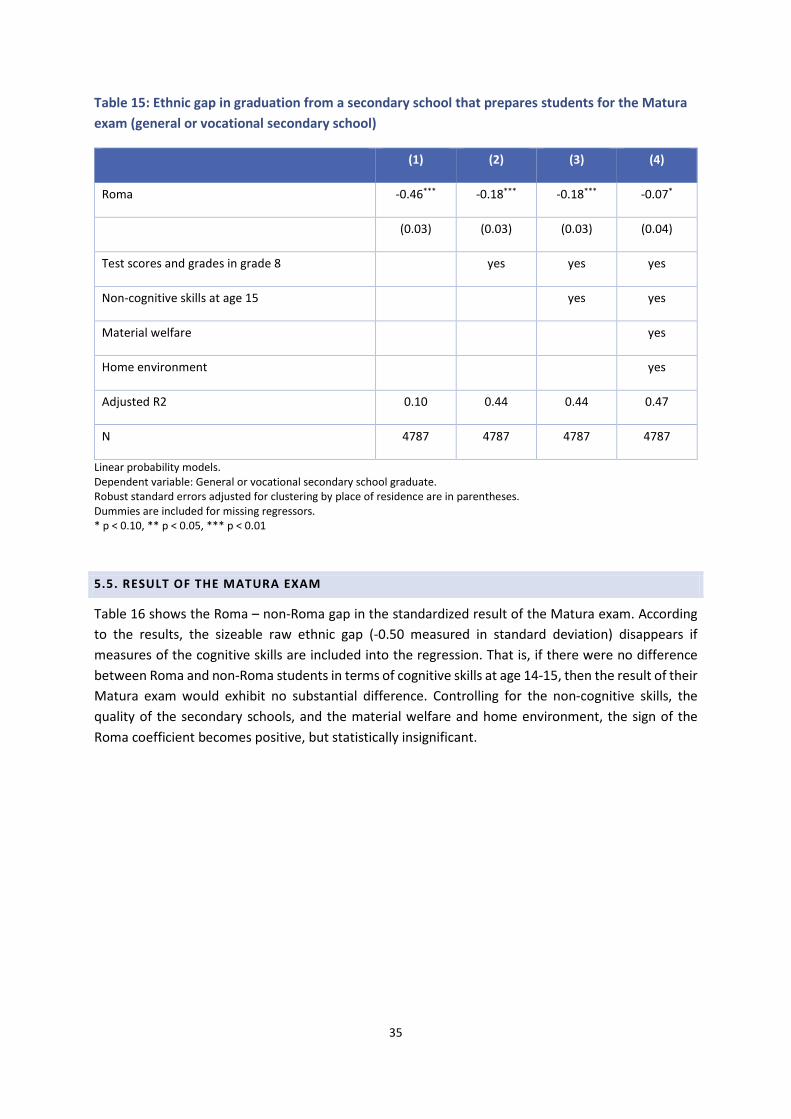
35
Table 15: Ethnic gap in graduation from a secondary school that prepares students for the Matura
exam (general or vocational secondary school)
(1) (2) (3) (4)
Roma -0.46*** -0.18*** -0.18*** -0.07*
(0.03) (0.03) (0.03) (0.04)
Test scores and grades in grade 8 yes yes yes
Non-cognitive skills at age 15 yes yes
Material welfare yes
Home environment yes
Adjusted R2 0.10 0.44 0.44 0.47
N 4787 4787 4787 4787
Linear probability models. Dependent variable: General or vocational secondary school graduate. Robust standard errors adjusted for clustering by place of residence are in parentheses. Dummies are included for missing regressors. * p < 0.10, ** p < 0.05, *** p < 0.01
5.5. RESULT OF THE MATURA EXAM
Table 16 shows the Roma – non-Roma gap in the standardized result of the Matura exam. According
to the results, the sizeable raw ethnic gap (-0.50 measured in standard deviation) disappears if
measures of the cognitive skills are included into the regression. That is, if there were no difference
between Roma and non-Roma students in terms of cognitive skills at age 14-15, then the result of their
Matura exam would exhibit no substantial difference. Controlling for the non-cognitive skills, the
quality of the secondary schools, and the material welfare and home environment, the sign of the
Roma coefficient becomes positive, but statistically insignificant.
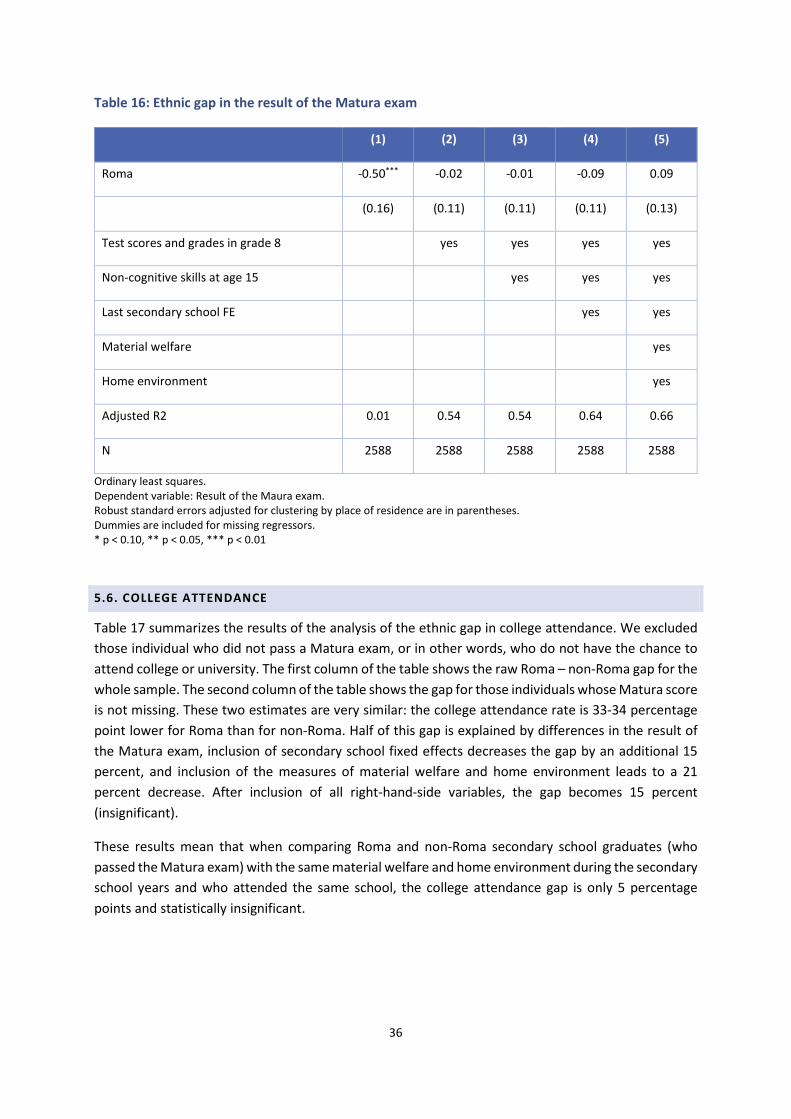
36
Table 16: Ethnic gap in the result of the Matura exam
(1) (2) (3) (4) (5)
Roma -0.50*** -0.02 -0.01 -0.09 0.09
(0.16) (0.11) (0.11) (0.11) (0.13)
Test scores and grades in grade 8 yes yes yes yes
Non-cognitive skills at age 15 yes yes yes
Last secondary school FE yes yes
Material welfare yes
Home environment yes
Adjusted R2 0.01 0.54 0.54 0.64 0.66
N 2588 2588 2588 2588 2588
Ordinary least squares. Dependent variable: Result of the Maura exam. Robust standard errors adjusted for clustering by place of residence are in parentheses. Dummies are included for missing regressors. * p < 0.10, ** p < 0.05, *** p < 0.01
5.6. COLLEGE ATTENDANCE
Table 17 summarizes the results of the analysis of the ethnic gap in college attendance. We excluded
those individual who did not pass a Matura exam, or in other words, who do not have the chance to
attend college or university. The first column of the table shows the raw Roma – non-Roma gap for the
whole sample. The second column of the table shows the gap for those individuals whose Matura score
is not missing. These two estimates are very similar: the college attendance rate is 33-34 percentage
point lower for Roma than for non-Roma. Half of this gap is explained by differences in the result of
the Matura exam, inclusion of secondary school fixed effects decreases the gap by an additional 15
percent, and inclusion of the measures of material welfare and home environment leads to a 21
percent decrease. After inclusion of all right-hand-side variables, the gap becomes 15 percent
(insignificant).
These results mean that when comparing Roma and non-Roma secondary school graduates (who
passed the Matura exam) with the same material welfare and home environment during the secondary
school years and who attended the same school, the college attendance gap is only 5 percentage
points and statistically insignificant.
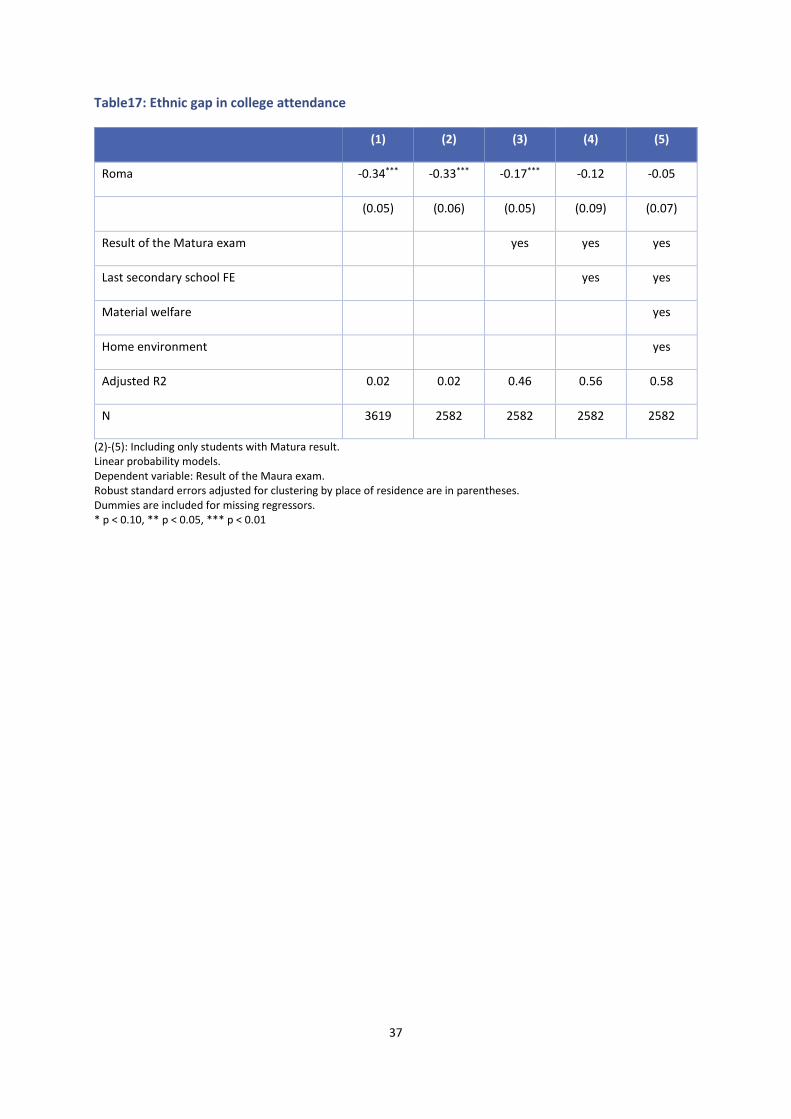
37
Table17: Ethnic gap in college attendance
(1) (2) (3) (4) (5)
Roma -0.34*** -0.33*** -0.17*** -0.12 -0.05
(0.05) (0.06) (0.05) (0.09) (0.07)
Result of the Matura exam yes yes yes
Last secondary school FE yes yes
Material welfare yes
Home environment yes
Adjusted R2 0.02 0.02 0.46 0.56 0.58
N 3619 2582 2582 2582 2582
(2)-(5): Including only students with Matura result. Linear probability models. Dependent variable: Result of the Maura exam. Robust standard errors adjusted for clustering by place of residence are in parentheses. Dummies are included for missing regressors. * p < 0.10, ** p < 0.05, *** p < 0.01

38
6. LABOR MARKET OUTCOMES
6.1. THE RAW ETHNIC GAPS
Table 18 summarizes the raw ethnic gaps in the labor market achievement. Throughout the report
labor market outcomes are analyzed separately for men and women. The first two columns show the
Roma and the non-Roma figures, whereas the third column shows the ethnic differences. Since we are
interested in the ethnic gap in the Hungarian labor market, only individuals who live in Hungary are
included.
Using the ILO definition, there is no employment gap between Roma and non-Roma men, but the gap
between Roma and non-Roma women is 33 percentage points. 41 percent of Roma women worked at
least one hour during the reference week (or were in temporary absence from work), compared with
a rate of 74 percent for non-Roma women. The permanent employment gap is higher both for men
and women. Only 68 percent of Roma men and 32 percent of Roma women are permanently
employed. The ethnic gap in permanent employment is 13 percentage points for men and 36
percentage points for women.
The wage gap is measured as the difference between log monthly wages, that is, the average log
monthly wage of Roma minus that of the non-Roma. The raw log wage gap between “ILO” employed
Roma and non-Roma is −0.23 and −0.18 for men and women, respectively. The ethnic gaps in the log
wage of permanently employed are lower: −0.05 and −0.13 for men and women, respectively.
We can see in Table 18 that there is a substantial difference in the ethnic gap regarding the two
employment variables (at least for the men). Table 19 allows us to take a closer look at the
characteristics of the current labor market participation of the Roma and non-Roma. It shows not only
the permanent employment rates, but the distribution of other types of labor market activities as well.
We can clearly see that irregular employment is more widespread among the Roma. Roma men and
women are about 6-8 percentage points more likely to be employed in public works programs than
non-Roma. It means that almost 10 percent of the Roma (at their early twenties) work in public works.
The unemployment rate is at 15-16 percent for Roma and at 12-13 percent for non-Roma. A significant
part of the non-employed women are at home with children, but more so among the Roma: 41 percent
of Roma women are on maternity leave, compared with the figure of 11 percent for non-Roma women.
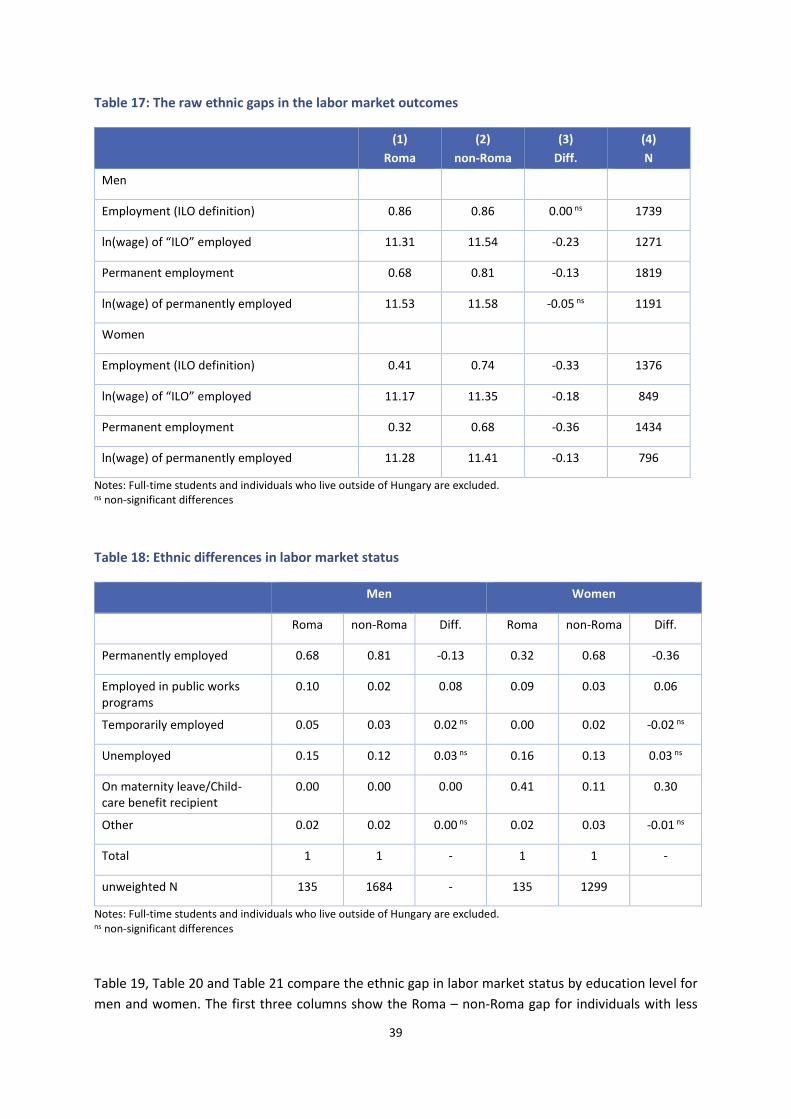
39
Table 17: The raw ethnic gaps in the labor market outcomes
(1)
Roma
(2)
non-Roma
(3)
Diff.
(4)
N
Men
Employment (ILO definition) 0.86 0.86 0.00 ns 1739
ln(wage) of “ILO” employed 11.31 11.54 -0.23 1271
Permanent employment 0.68 0.81 -0.13 1819
ln(wage) of permanently employed 11.53 11.58 -0.05 ns 1191
Women
Employment (ILO definition) 0.41 0.74 -0.33 1376
ln(wage) of “ILO” employed 11.17 11.35 -0.18 849
Permanent employment 0.32 0.68 -0.36 1434
ln(wage) of permanently employed 11.28 11.41 -0.13 796
Notes: Full-time students and individuals who live outside of Hungary are excluded. ns non-significant differences
Table 18: Ethnic differences in labor market status
Men Women
Roma non-Roma Diff. Roma non-Roma Diff.
Permanently employed 0.68 0.81 -0.13 0.32 0.68 -0.36
Employed in public works programs
0.10 0.02 0.08 0.09 0.03 0.06
Temporarily employed 0.05 0.03 0.02 ns 0.00 0.02 -0.02 ns
Unemployed 0.15 0.12 0.03 ns 0.16 0.13 0.03 ns
On maternity leave/Child-care benefit recipient
0.00 0.00 0.00 0.41 0.11 0.30
Other 0.02 0.02 0.00 ns 0.02 0.03 -0.01 ns
Total 1 1 - 1 1 -
unweighted N 135 1684 - 135 1299
Notes: Full-time students and individuals who live outside of Hungary are excluded. ns non-significant differences
Table 19, Table 20 and Table 21 compare the ethnic gap in labor market status by education level for
men and women. The first three columns show the Roma – non-Roma gap for individuals with less
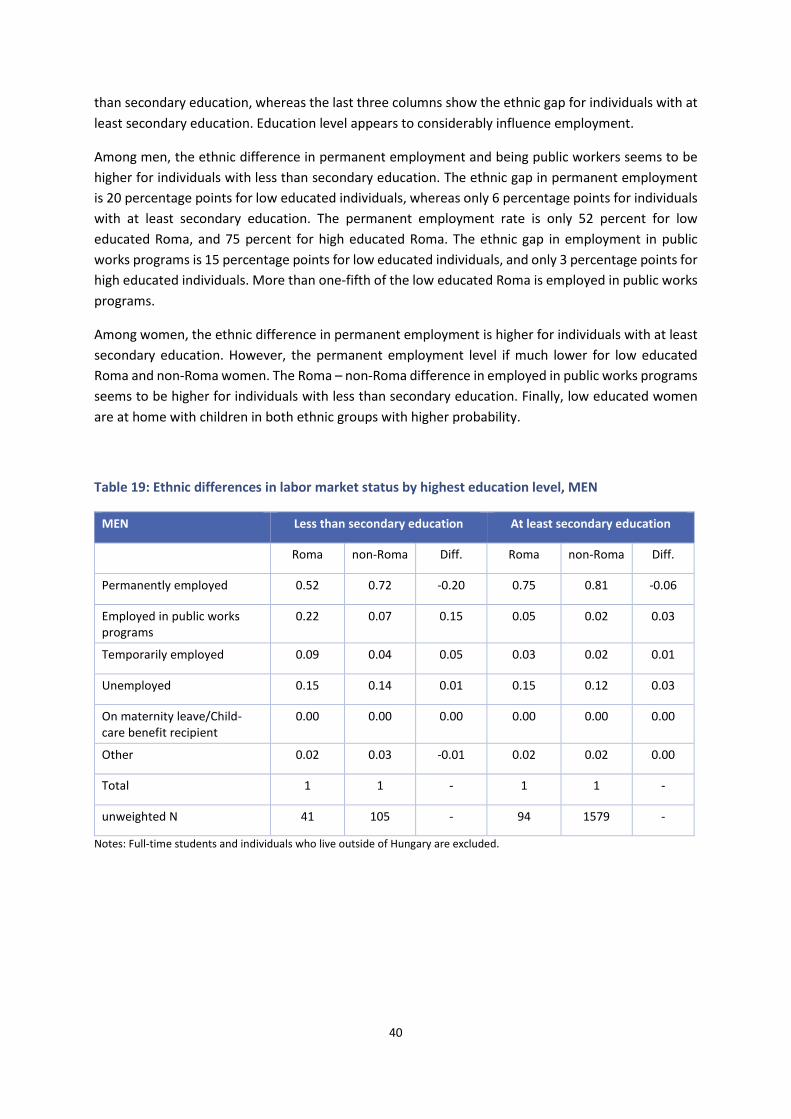
40
than secondary education, whereas the last three columns show the ethnic gap for individuals with at
least secondary education. Education level appears to considerably influence employment.
Among men, the ethnic difference in permanent employment and being public workers seems to be
higher for individuals with less than secondary education. The ethnic gap in permanent employment
is 20 percentage points for low educated individuals, whereas only 6 percentage points for individuals
with at least secondary education. The permanent employment rate is only 52 percent for low
educated Roma, and 75 percent for high educated Roma. The ethnic gap in employment in public
works programs is 15 percentage points for low educated individuals, and only 3 percentage points for
high educated individuals. More than one-fifth of the low educated Roma is employed in public works
programs.
Among women, the ethnic difference in permanent employment is higher for individuals with at least
secondary education. However, the permanent employment level if much lower for low educated
Roma and non-Roma women. The Roma – non-Roma difference in employed in public works programs
seems to be higher for individuals with less than secondary education. Finally, low educated women
are at home with children in both ethnic groups with higher probability.
Table 19: Ethnic differences in labor market status by highest education level, MEN
MEN Less than secondary education At least secondary education
Roma non-Roma Diff. Roma non-Roma Diff.
Permanently employed 0.52 0.72 -0.20 0.75 0.81 -0.06
Employed in public works programs
0.22 0.07 0.15 0.05 0.02 0.03
Temporarily employed 0.09 0.04 0.05 0.03 0.02 0.01
Unemployed 0.15 0.14 0.01 0.15 0.12 0.03
On maternity leave/Child-care benefit recipient
0.00 0.00 0.00 0.00 0.00 0.00
Other 0.02 0.03 -0.01 0.02 0.02 0.00
Total 1 1 - 1 1 -
unweighted N 41 105 - 94 1579 -
Notes: Full-time students and individuals who live outside of Hungary are excluded.
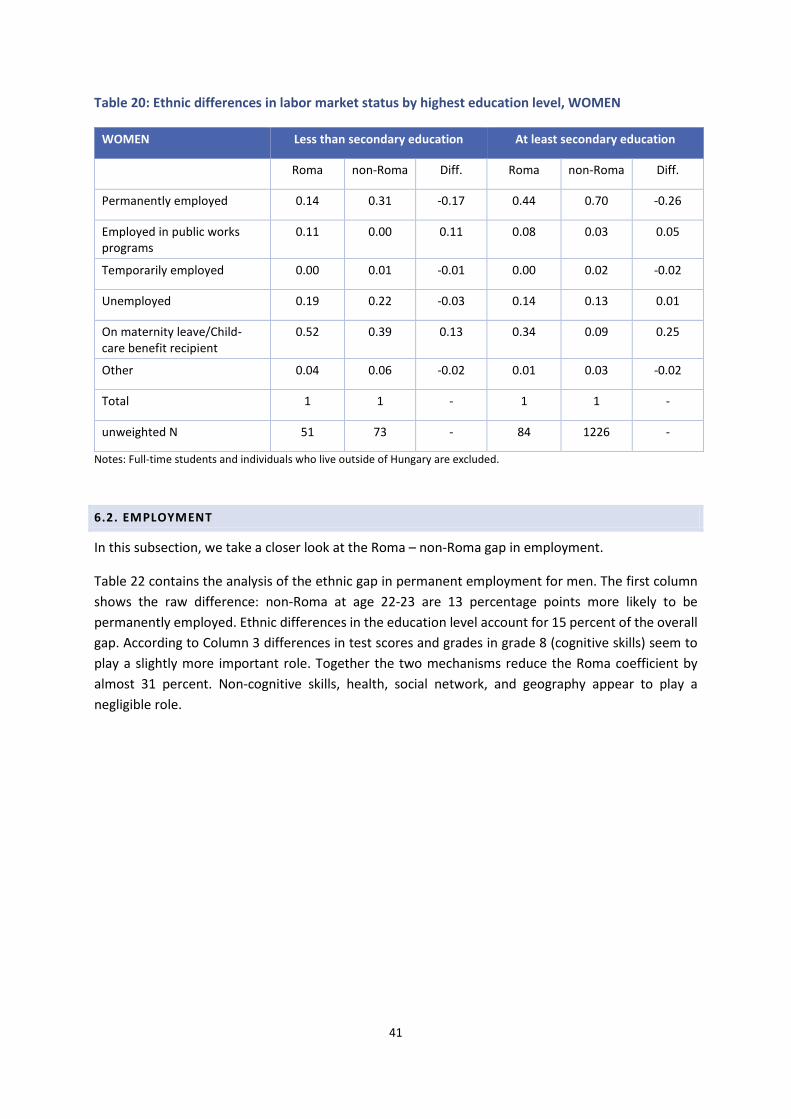
41
Table 20: Ethnic differences in labor market status by highest education level, WOMEN
WOMEN Less than secondary education At least secondary education
Roma non-Roma Diff. Roma non-Roma Diff.
Permanently employed 0.14 0.31 -0.17 0.44 0.70 -0.26
Employed in public works programs
0.11 0.00 0.11 0.08 0.03 0.05
Temporarily employed 0.00 0.01 -0.01 0.00 0.02 -0.02
Unemployed 0.19 0.22 -0.03 0.14 0.13 0.01
On maternity leave/Child-care benefit recipient
0.52 0.39 0.13 0.34 0.09 0.25
Other 0.04 0.06 -0.02 0.01 0.03 -0.02
Total 1 1 - 1 1 -
unweighted N 51 73 - 84 1226 -
Notes: Full-time students and individuals who live outside of Hungary are excluded.
6.2. EMPLOYMENT
In this subsection, we take a closer look at the Roma – non-Roma gap in employment.
Table 22 contains the analysis of the ethnic gap in permanent employment for men. The first column
shows the raw difference: non-Roma at age 22-23 are 13 percentage points more likely to be
permanently employed. Ethnic differences in the education level account for 15 percent of the overall
gap. According to Column 3 differences in test scores and grades in grade 8 (cognitive skills) seem to
play a slightly more important role. Together the two mechanisms reduce the Roma coefficient by
almost 31 percent. Non-cognitive skills, health, social network, and geography appear to play a
negligible role.
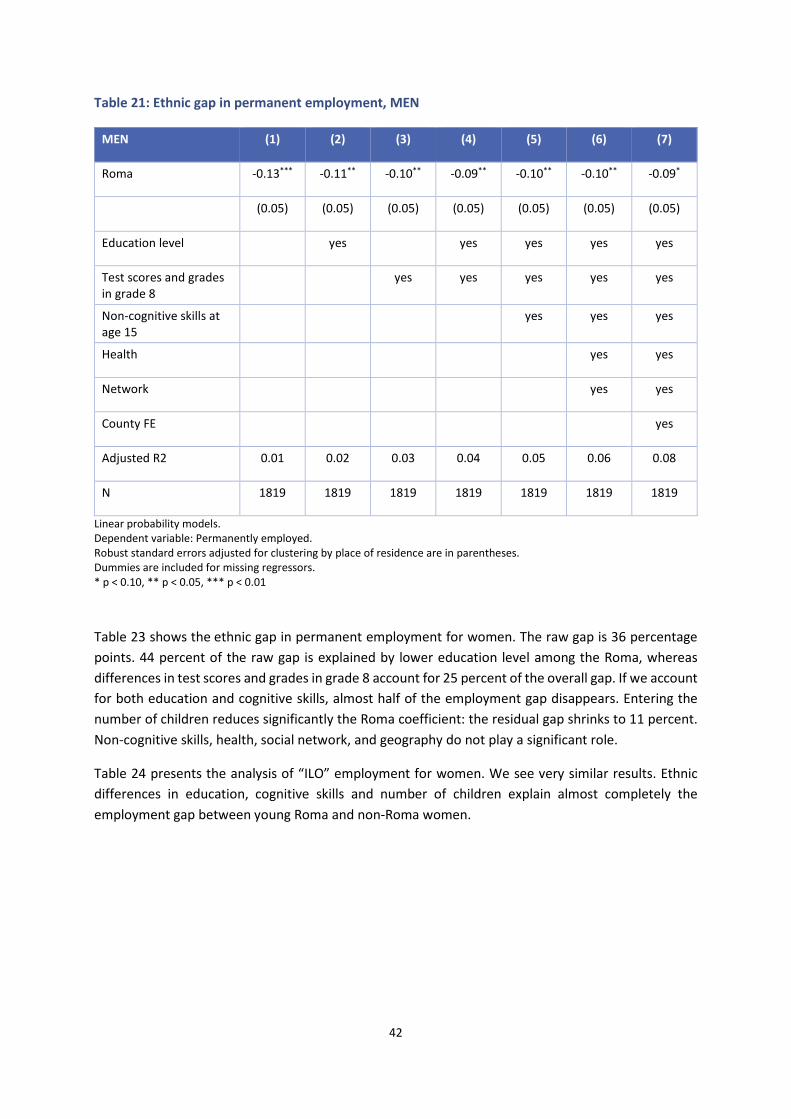
42
Table 21: Ethnic gap in permanent employment, MEN
MEN (1) (2) (3) (4) (5) (6) (7)
Roma -0.13*** -0.11** -0.10** -0.09** -0.10** -0.10** -0.09*
(0.05) (0.05) (0.05) (0.05) (0.05) (0.05) (0.05)
Education level yes yes yes yes yes
Test scores and grades in grade 8
yes yes yes yes yes
Non-cognitive skills at age 15
yes yes yes
Health yes yes
Network yes yes
County FE yes
Adjusted R2 0.01 0.02 0.03 0.04 0.05 0.06 0.08
N 1819 1819 1819 1819 1819 1819 1819
Linear probability models. Dependent variable: Permanently employed. Robust standard errors adjusted for clustering by place of residence are in parentheses. Dummies are included for missing regressors. * p < 0.10, ** p < 0.05, *** p < 0.01
Table 23 shows the ethnic gap in permanent employment for women. The raw gap is 36 percentage
points. 44 percent of the raw gap is explained by lower education level among the Roma, whereas
differences in test scores and grades in grade 8 account for 25 percent of the overall gap. If we account
for both education and cognitive skills, almost half of the employment gap disappears. Entering the
number of children reduces significantly the Roma coefficient: the residual gap shrinks to 11 percent.
Non-cognitive skills, health, social network, and geography do not play a significant role.
Table 24 presents the analysis of “ILO” employment for women. We see very similar results. Ethnic
differences in education, cognitive skills and number of children explain almost completely the
employment gap between young Roma and non-Roma women.
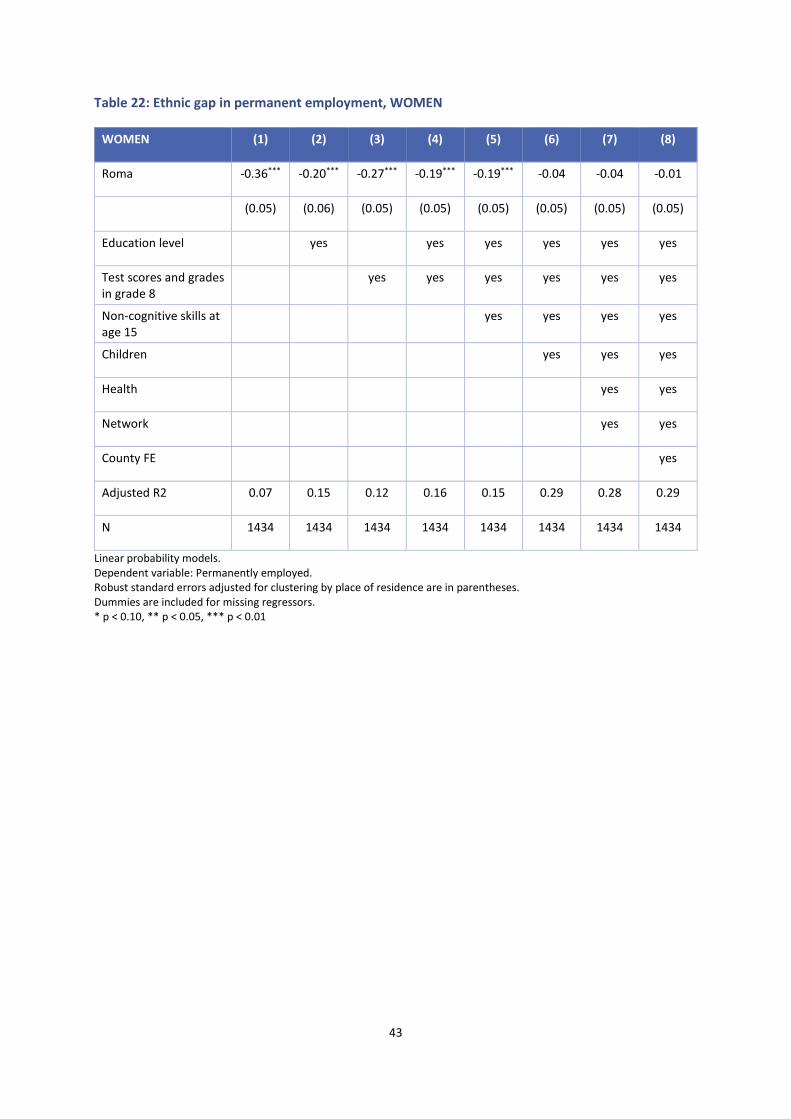
43
Table 22: Ethnic gap in permanent employment, WOMEN
WOMEN (1) (2) (3) (4) (5) (6) (7) (8)
Roma -0.36*** -0.20*** -0.27*** -0.19*** -0.19*** -0.04 -0.04 -0.01
(0.05) (0.06) (0.05) (0.05) (0.05) (0.05) (0.05) (0.05)
Education level yes yes yes yes yes yes
Test scores and grades in grade 8
yes yes yes yes yes yes
Non-cognitive skills at age 15
yes yes yes yes
Children yes yes yes
Health yes yes
Network yes yes
County FE yes
Adjusted R2 0.07 0.15 0.12 0.16 0.15 0.29 0.28 0.29
N 1434 1434 1434 1434 1434 1434 1434 1434
Linear probability models. Dependent variable: Permanently employed. Robust standard errors adjusted for clustering by place of residence are in parentheses. Dummies are included for missing regressors. * p < 0.10, ** p < 0.05, *** p < 0.01
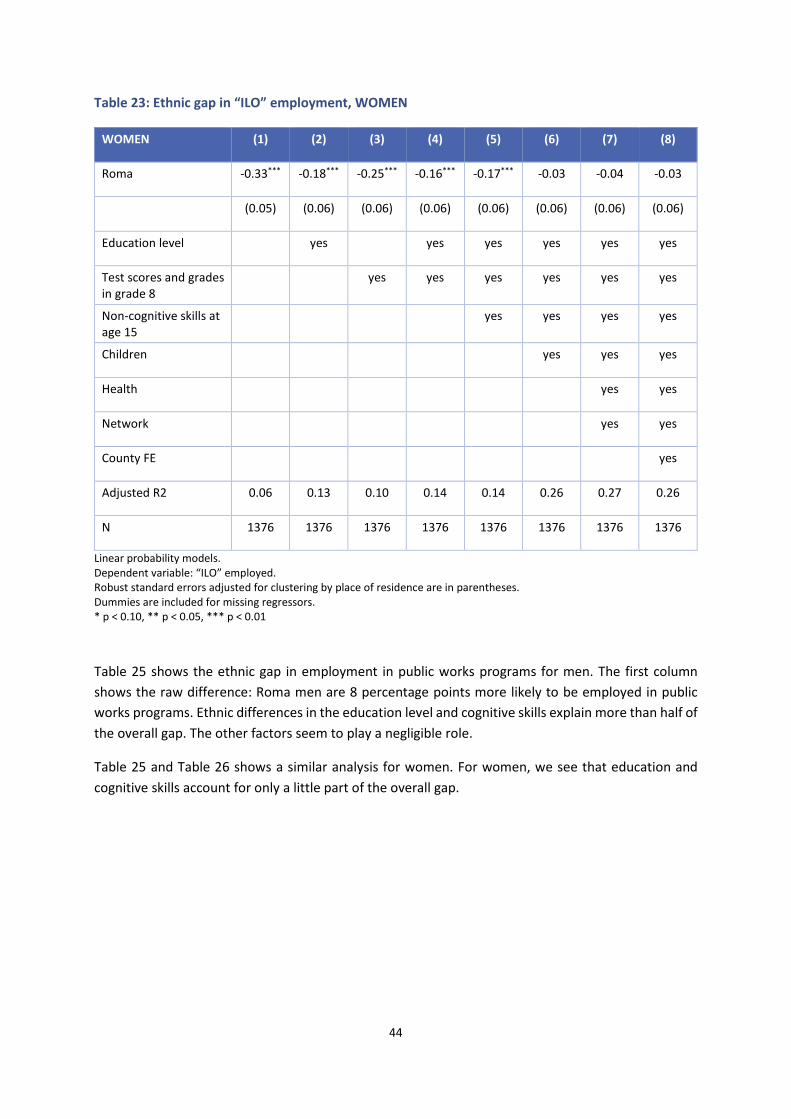
44
Table 23: Ethnic gap in “ILO” employment, WOMEN
WOMEN (1) (2) (3) (4) (5) (6) (7) (8)
Roma -0.33*** -0.18*** -0.25*** -0.16*** -0.17*** -0.03 -0.04 -0.03
(0.05) (0.06) (0.06) (0.06) (0.06) (0.06) (0.06) (0.06)
Education level yes yes yes yes yes yes
Test scores and grades in grade 8
yes yes yes yes yes yes
Non-cognitive skills at age 15
yes yes yes yes
Children yes yes yes
Health yes yes
Network yes yes
County FE yes
Adjusted R2 0.06 0.13 0.10 0.14 0.14 0.26 0.27 0.26
N 1376 1376 1376 1376 1376 1376 1376 1376
Linear probability models. Dependent variable: “ILO” employed. Robust standard errors adjusted for clustering by place of residence are in parentheses. Dummies are included for missing regressors. * p < 0.10, ** p < 0.05, *** p < 0.01
Table 25 shows the ethnic gap in employment in public works programs for men. The first column
shows the raw difference: Roma men are 8 percentage points more likely to be employed in public
works programs. Ethnic differences in the education level and cognitive skills explain more than half of
the overall gap. The other factors seem to play a negligible role.
Table 25 and Table 26 shows a similar analysis for women. For women, we see that education and
cognitive skills account for only a little part of the overall gap.
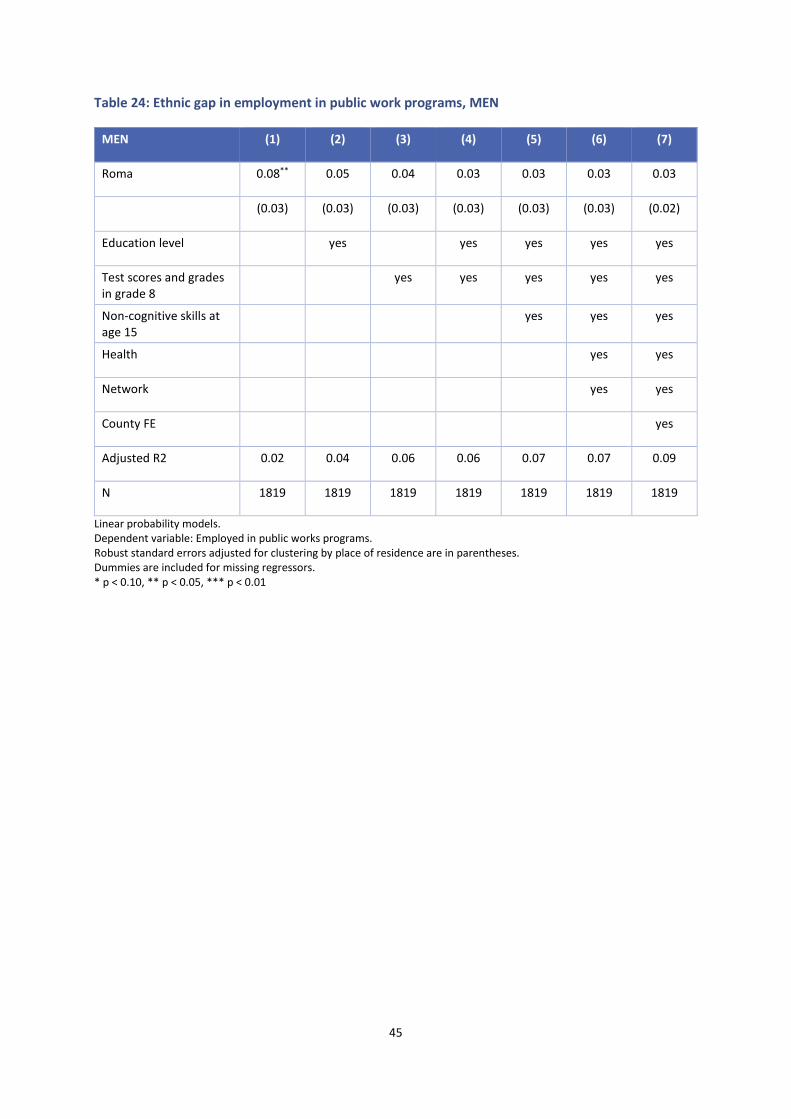
45
Table 24: Ethnic gap in employment in public work programs, MEN
MEN (1) (2) (3) (4) (5) (6) (7)
Roma 0.08** 0.05 0.04 0.03 0.03 0.03 0.03
(0.03) (0.03) (0.03) (0.03) (0.03) (0.03) (0.02)
Education level yes yes yes yes yes
Test scores and grades in grade 8
yes yes yes yes yes
Non-cognitive skills at age 15
yes yes yes
Health yes yes
Network yes yes
County FE yes
Adjusted R2 0.02 0.04 0.06 0.06 0.07 0.07 0.09
N 1819 1819 1819 1819 1819 1819 1819
Linear probability models. Dependent variable: Employed in public works programs. Robust standard errors adjusted for clustering by place of residence are in parentheses. Dummies are included for missing regressors. * p < 0.10, ** p < 0.05, *** p < 0.01

46
Table 25: Ethnic gap in employment in public work programs, WOMEN
WOMEN (1) (2) (3) (4) (5) (6) (7)
Roma 0.06* 0.06* 0.04 0.05* 0.05* 0.06** 0.05
(0.03) (0.03) (0.03) (0.03) (0.03) (0.03) (0.03)
Education level yes yes yes yes yes
Test scores and grades in grade 8
yes yes yes yes yes
Non-cognitive skills at age 15
yes yes yes
Health yes yes
Network yes yes
County FE yes
Adjusted R2 0.01 0.01 0.02 0.02 0.03 0.04 0.08
N 1434 1434 1434 1434 1434 1434 1434
Linear probability models. Dependent variable: Employed in public works programs. Robust standard errors adjusted for clustering by place of residence are in parentheses. Dummies are included for missing regressors. * p < 0.10, ** p < 0.05, *** p < 0.01
6.3. WAGE
Besides employment, there is a substantial ethnic difference in the wage of the employed Roma and
non-Roma.
Table 27 summarizes the decomposition of the wage gap for “ILO” employed men. Column 1 shows
that the unadjusted log wag gap between Roma and non-Roma is −0.23. When only education level or
cognitive skills are controlled for, the log wage gap is lower by 0.07-0.08 log points (by 30-35 percent).
Together education and cognitive skills reduce the Roma coefficient to −0.14, which means that they
explain four-tenth of the wage gap for young men. Being employed as an irregular worker appears to
account for another 20 percent of the raw gap. Non-cognitive skills, health, social network, and
geography have no effect on the wage gap. After inclusion of all right-hand-side variables, the ethnic
gap becomes −0.11 log points.
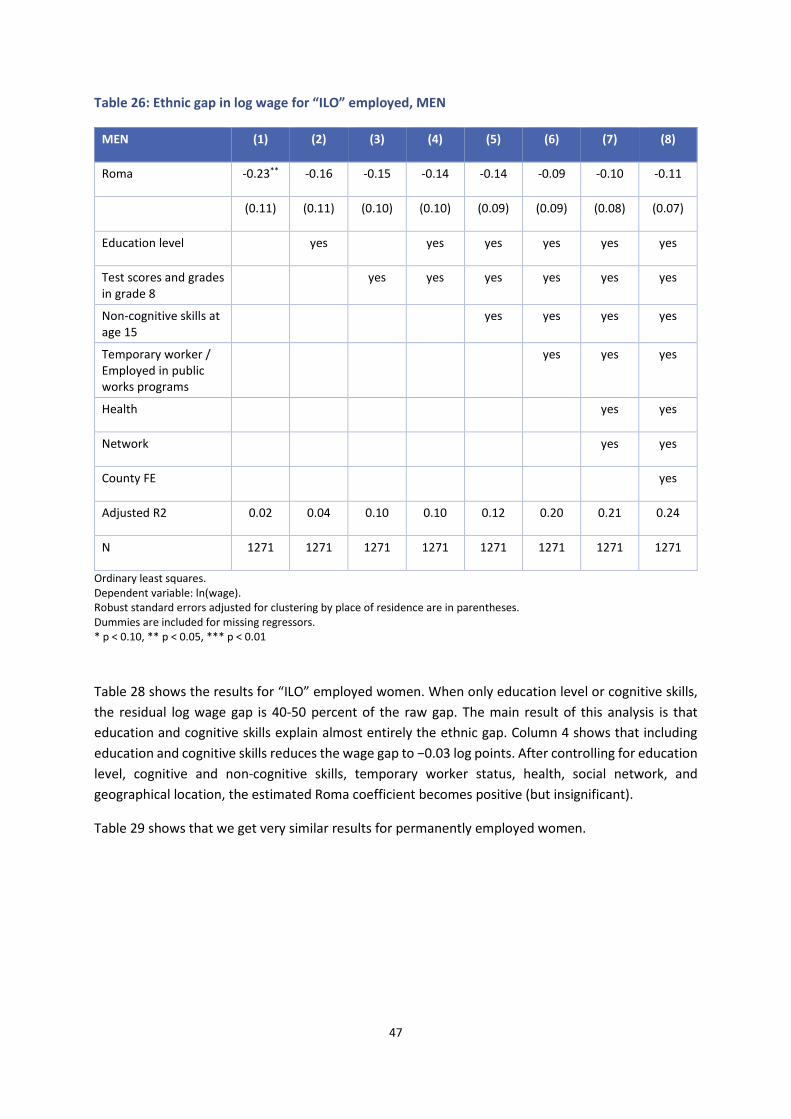
47
Table 26: Ethnic gap in log wage for “ILO” employed, MEN
MEN (1) (2) (3) (4) (5) (6) (7) (8)
Roma -0.23** -0.16 -0.15 -0.14 -0.14 -0.09 -0.10 -0.11
(0.11) (0.11) (0.10) (0.10) (0.09) (0.09) (0.08) (0.07)
Education level yes yes yes yes yes yes
Test scores and grades in grade 8
yes yes yes yes yes yes
Non-cognitive skills at age 15
yes yes yes yes
Temporary worker / Employed in public works programs
yes yes yes
Health yes yes
Network yes yes
County FE yes
Adjusted R2 0.02 0.04 0.10 0.10 0.12 0.20 0.21 0.24
N 1271 1271 1271 1271 1271 1271 1271 1271
Ordinary least squares. Dependent variable: ln(wage). Robust standard errors adjusted for clustering by place of residence are in parentheses. Dummies are included for missing regressors. * p < 0.10, ** p < 0.05, *** p < 0.01
Table 28 shows the results for “ILO” employed women. When only education level or cognitive skills,
the residual log wage gap is 40-50 percent of the raw gap. The main result of this analysis is that
education and cognitive skills explain almost entirely the ethnic gap. Column 4 shows that including
education and cognitive skills reduces the wage gap to −0.03 log points. After controlling for education
level, cognitive and non-cognitive skills, temporary worker status, health, social network, and
geographical location, the estimated Roma coefficient becomes positive (but insignificant).
Table 29 shows that we get very similar results for permanently employed women.

48
Table 27: Ethnic gap in log wage for “ILO” employed, WOMEN
WOMEN (1) (2) (3) (4) (5) (6) (7) (8)
Roma -0.18***
-0.09 -0.07 -0.03 -0.03 0.01 0.02 0.05
(0.05) (0.06) (0.05) (0.06) (0.06) (0.06) (0.07) (0.07)
Education level yes yes yes yes yes yes
Test scores and grades in grade 8
yes yes yes yes yes yes
Non-cognitive skills at age 15
yes yes yes yes
Temporary worker / Employed in public works programs
yes yes yes
Health yes yes
Network yes yes
County FE yes
Adjusted R2 0.01 0.04 0.06 0.07 0.09 0.14 0.14 0.16
N 849 849 849 849 849 849 849 849
Ordinary least squares. Dependent variable: ln(wage). Robust standard errors adjusted for clustering by place of residence are in parentheses. Dummies are included for missing regressors. * p < 0.10, ** p < 0.05, *** p < 0.01
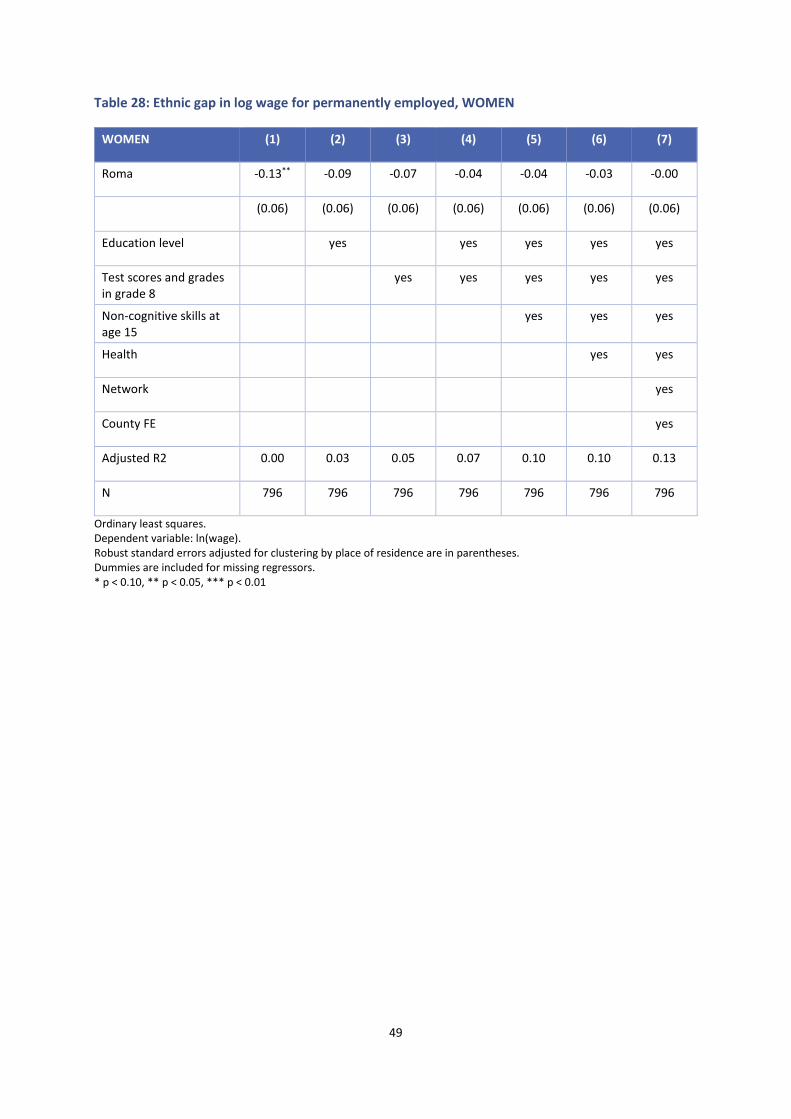
49
Table 28: Ethnic gap in log wage for permanently employed, WOMEN
WOMEN (1) (2) (3) (4) (5) (6) (7)
Roma -0.13** -0.09 -0.07 -0.04 -0.04 -0.03 -0.00
(0.06) (0.06) (0.06) (0.06) (0.06) (0.06) (0.06)
Education level yes yes yes yes yes
Test scores and grades in grade 8
yes yes yes yes yes
Non-cognitive skills at age 15
yes yes yes
Health yes yes
Network yes
County FE yes
Adjusted R2 0.00 0.03 0.05 0.07 0.10 0.10 0.13
N 796 796 796 796 796 796 796
Ordinary least squares. Dependent variable: ln(wage). Robust standard errors adjusted for clustering by place of residence are in parentheses. Dummies are included for missing regressors. * p < 0.10, ** p < 0.05, *** p < 0.01
50
7. CONCLUSION
In this report we have quantified the educational and labor market achievement gap between young
Roma and non-Roma in Hungary (at age 22-23) and have assessed the potential causes of the gaps. For
these analyses we used the Hungarian Life Course Survey that follows youths, who were in the eighth
grade in the spring of 2006. We have shown that the ethnic gap in secondary school dropout rate is
extremely large: among those who started secondary school Roma students are 27 percentage points
more likely to drop out of secondary schools than non-Roma students. Moreover, less than one-third
of the Roma and more than three-fourths of the non-Roma take the Matura exam, which qualifies for
higher education. Even among general or vocational secondary school graduates there is a large ethnic
gap in terms of college attendance rate: 51 percent of non-Roma and 19 percent of Roma have been
enrolled in college.
One of the main results of the analysis is that a large part of the ethnic gap in educational success can
be explained by skills and abilities at age 14-15 and poverty and home environment during the
secondary school years. Secondary schools and geographical location seem to play little role. We have
shown that differences in test scores, family background and schools explain a large part of the ethnic
gap in secondary school dropout; however, the residual ethnic gap is substantial (13 percentage
points). An important conclusion of this report is that this residual gap in dropout rate is related to the
prevalence of high-status peer contacts. Roma adolescents with such contacts are significantly less
likely to drop out of school than Roma adolescents with the same test scores and family background
but without such contacts. Our results mean that ethnic differences at age 22-23 are related to factors
that affect children in primary schools and in the early childhood. These results are consistent with
previous studies that show larger returns to human capital investments at earlier ages [Carneiro &
Heckman, 2003; Currie & Almond, 2011; Duncan & Murnane, 2011; Fryer, 2011; Heckman, 2000, 2006,
2008].
In this paper we do not deal with the causes of the skills gap between Roma and non-Roma students
at the end of the primary school, earlier studies have done that [Kertesi & Kézdi, 2011b, 2014]. These
studies showed that the gap in reading and mathematics test scores between Roma and non-Roma
eight graders is as large as the size of the Black-White test score gap in the United States in the 1980s.
Ethnic differences in income, parental education and home environment account for a large part of
the test score gap. If non-Roma students lived in socio-economic environment to those of Roma
students, only a fraction (20-25 percent) of the achievement gap would persist. Furthermore, these
studies showed that health, home environment and parenting and schools explain the entire gap in
reading and 90 percent of the gap in mathematics. These studies conclude that the test score gap
between Roma and non-Roma students is primarily due to material deprivation and disadvantages at
home and at school. They propose policies that improve the long-run life chances of children in
extreme poverty (e.g. providing children with an environment that facilitates their cognitive
development; promoting parenting methods; equal access to high-quality learning environments;
providing appropriate training and incentives for teachers that work in problematic educational
environments). These policies can result in substantial improvements in the children’s skill
development.
51
In this report we used two employment definitions: (i) the ILO employment definition, and (ii) a
measure of permanent employment. We have shown that only 68 percent of Roma men and 32
percent of Roma women are permanently employed at age 22-23. The ethnic gap in permanent
employment is 13 percentage points for men and 36 percentage points for women. In terms of ILO
employment there is no gap between Roma and non-Roma men, but the gap between Roma and non-
Roma women is 33 percentage points. Irregular employment is more widespread among the Roma.
Roma men and women are about 6-8 percentage points more likely to be employed in public works
programs than non-Roma. 41 percent of Roma women are at home with children, compared with the
figure of 11 percent for non-Roma women.
The wage gap is measured as the difference between log monthly wages. The raw log wage gap
between “ILO” employed Roma and non-Roma is −0.23 and −0.18 for men and women, respec\vely.
The ethnic gaps in the log wage of permanently employed are lower: −0.05 and −0.13 for men and
women, respectively.
If we account for education and cognitive skills, a significant part of the employment gap between
Roma and non-Roma disappears (30-50 percent). In addition, ethnic differences in education, cognitive
skills and number of children explain almost completely the ethnic employment gap for women.
Looking at the wage gap (for ILO employed persons) we have seen that education, cognitive skills and
temporary worker status explain 60 percent of the wage gap for young men, and all of the wage gap
for women. Non-cognitive skills, health, social network, and geography appear to play a less important
role in the ethnic gaps in wages.
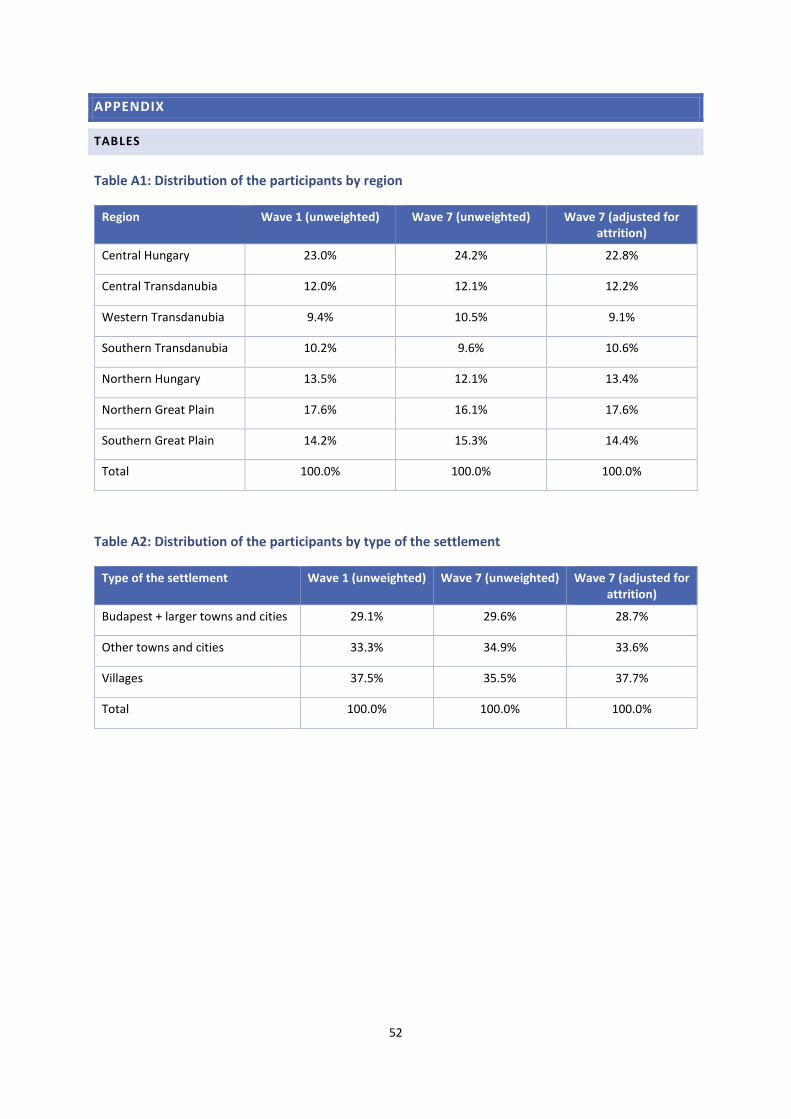
52
APPENDIX
TABLES
Table A1: Distribution of the participants by region
Region Wave 1 (unweighted) Wave 7 (unweighted) Wave 7 (adjusted for attrition)
Central Hungary 23.0% 24.2% 22.8%
Central Transdanubia 12.0% 12.1% 12.2%
Western Transdanubia 9.4% 10.5% 9.1%
Southern Transdanubia 10.2% 9.6% 10.6%
Northern Hungary 13.5% 12.1% 13.4%
Northern Great Plain 17.6% 16.1% 17.6%
Southern Great Plain 14.2% 15.3% 14.4%
Total 100.0% 100.0% 100.0%
Table A2: Distribution of the participants by type of the settlement
Type of the settlement Wave 1 (unweighted) Wave 7 (unweighted) Wave 7 (adjusted for attrition)
Budapest + larger towns and cities 29.1% 29.6% 28.7%
Other towns and cities 33.3% 34.9% 33.6%
Villages 37.5% 35.5% 37.7%
Total 100.0% 100.0% 100.0%
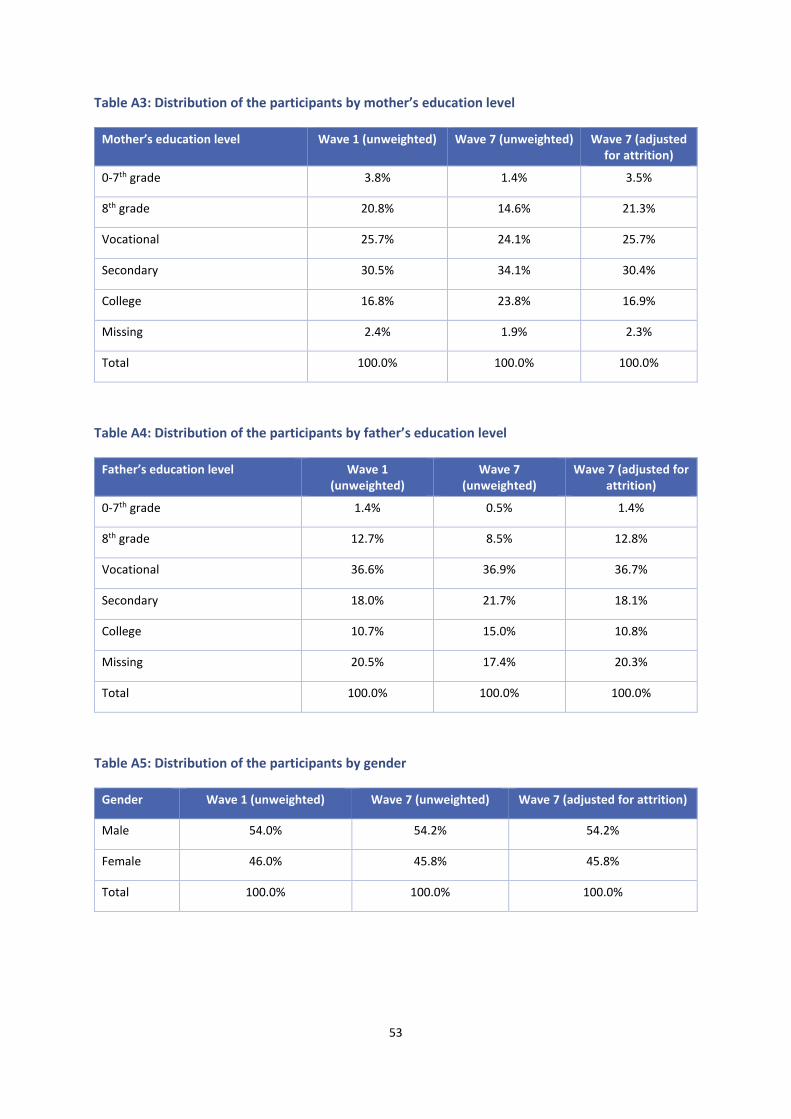
53
Table A3: Distribution of the participants by mother’s education level
Mother’s education level Wave 1 (unweighted) Wave 7 (unweighted) Wave 7 (adjusted for attrition)
0-7th grade 3.8% 1.4% 3.5%
8th grade 20.8% 14.6% 21.3%
Vocational 25.7% 24.1% 25.7%
Secondary 30.5% 34.1% 30.4%
College 16.8% 23.8% 16.9%
Missing 2.4% 1.9% 2.3%
Total 100.0% 100.0% 100.0%
Table A4: Distribution of the participants by father’s education level
Father’s education level Wave 1 (unweighted)
Wave 7 (unweighted)
Wave 7 (adjusted for attrition)
0-7th grade 1.4% 0.5% 1.4%
8th grade 12.7% 8.5% 12.8%
Vocational 36.6% 36.9% 36.7%
Secondary 18.0% 21.7% 18.1%
College 10.7% 15.0% 10.8%
Missing 20.5% 17.4% 20.3%
Total 100.0% 100.0% 100.0%
Table A5: Distribution of the participants by gender
Gender Wave 1 (unweighted) Wave 7 (unweighted) Wave 7 (adjusted for attrition)
Male 54.0% 54.2% 54.2%
Female 46.0% 45.8% 45.8%
Total 100.0% 100.0% 100.0%
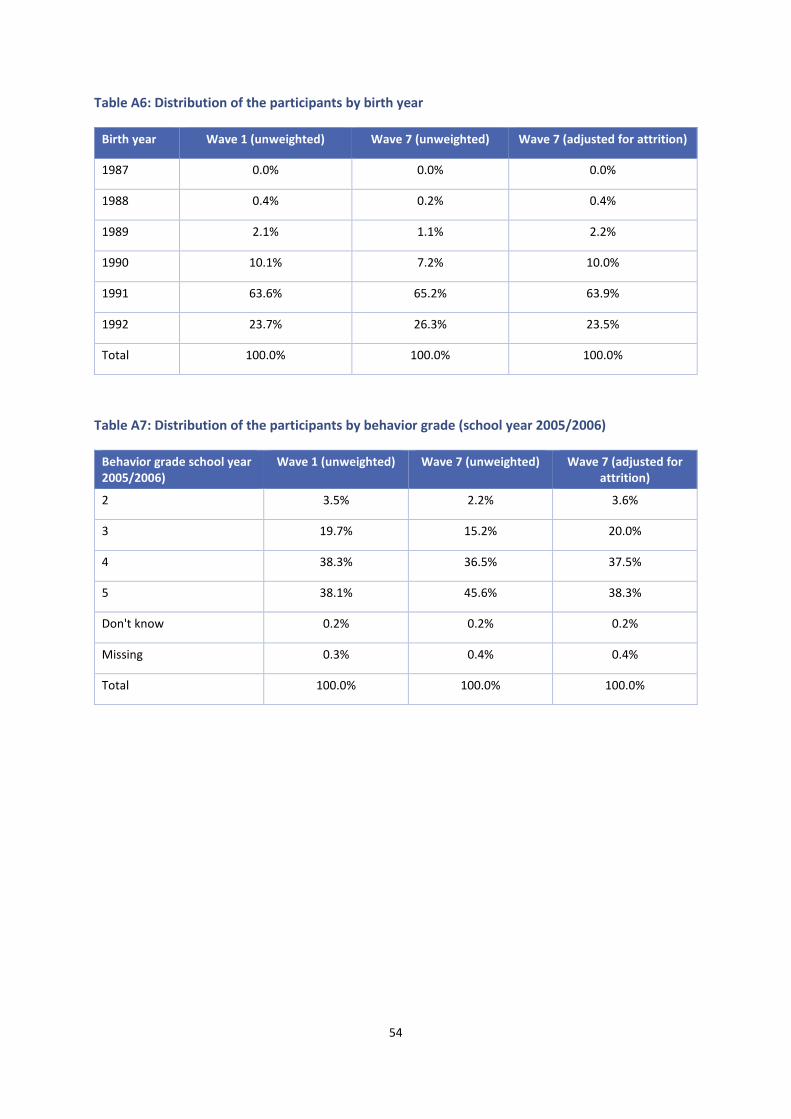
54
Table A6: Distribution of the participants by birth year
Birth year Wave 1 (unweighted) Wave 7 (unweighted) Wave 7 (adjusted for attrition)
1987 0.0% 0.0% 0.0%
1988 0.4% 0.2% 0.4%
1989 2.1% 1.1% 2.2%
1990 10.1% 7.2% 10.0%
1991 63.6% 65.2% 63.9%
1992 23.7% 26.3% 23.5%
Total 100.0% 100.0% 100.0%
Table A7: Distribution of the participants by behavior grade (school year 2005/2006)
Behavior grade school year 2005/2006)
Wave 1 (unweighted) Wave 7 (unweighted) Wave 7 (adjusted for attrition)
2 3.5% 2.2% 3.6%
3 19.7% 15.2% 20.0%
4 38.3% 36.5% 37.5%
5 38.1% 45.6% 38.3%
Don't know 0.2% 0.2% 0.2%
Missing 0.3% 0.4% 0.4%
Total 100.0% 100.0% 100.0%
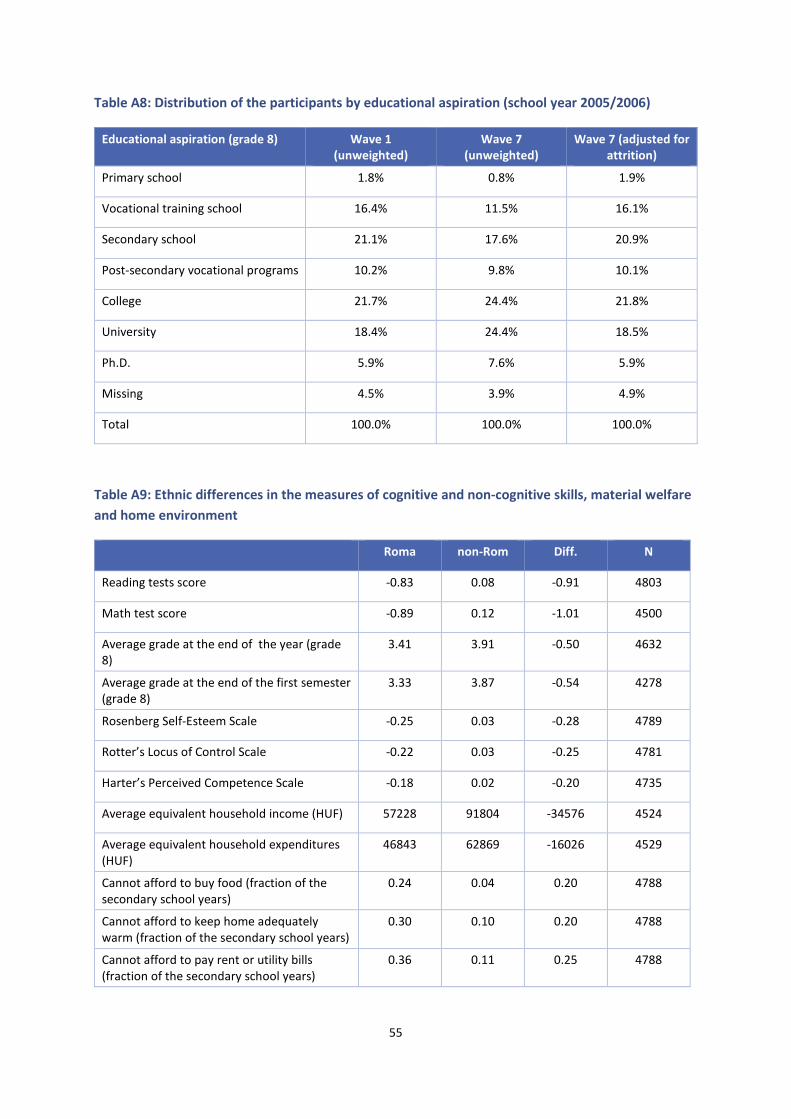
55
Table A8: Distribution of the participants by educational aspiration (school year 2005/2006)
Educational aspiration (grade 8) Wave 1 (unweighted)
Wave 7 (unweighted)
Wave 7 (adjusted for attrition)
Primary school 1.8% 0.8% 1.9%
Vocational training school 16.4% 11.5% 16.1%
Secondary school 21.1% 17.6% 20.9%
Post-secondary vocational programs 10.2% 9.8% 10.1%
College 21.7% 24.4% 21.8%
University 18.4% 24.4% 18.5%
Ph.D. 5.9% 7.6% 5.9%
Missing 4.5% 3.9% 4.9%
Total 100.0% 100.0% 100.0%
Table A9: Ethnic differences in the measures of cognitive and non-cognitive skills, material welfare
and home environment
Roma non-Rom Diff. N
Reading tests score -0.83 0.08 -0.91 4803
Math test score -0.89 0.12 -1.01 4500
Average grade at the end of the year (grade 8)
3.41 3.91 -0.50 4632
Average grade at the end of the first semester (grade 8)
3.33 3.87 -0.54 4278
Rosenberg Self-Esteem Scale -0.25 0.03 -0.28 4789
Rotter’s Locus of Control Scale -0.22 0.03 -0.25 4781
Harter’s Perceived Competence Scale -0.18 0.02 -0.20 4735
Average equivalent household income (HUF) 57228 91804 -34576 4524
Average equivalent household expenditures (HUF)
46843 62869 -16026 4529
Cannot afford to buy food (fraction of the secondary school years)
0.24 0.04 0.20 4788
Cannot afford to keep home adequately warm (fraction of the secondary school years)
0.30 0.10 0.20 4788
Cannot afford to pay rent or utility bills (fraction of the secondary school years)
0.36 0.11 0.25 4788

56
Roma non-Rom Diff. N
HOME index, cognitive subscale -0.82 0.11 -0.93 4751
HOME index, emotional subscale -0.18 0.02 -0.20 4690
Low educated mothera 0.77 0.17 0.60 4712
Low educated fathera 0.69 0.11 0.58 3969
At least 300 books at homea 0.08 0.37 -0.29 4772
Notes: a coded as a 0-1 variable
Table A10: HOME cognitive subscale items
Interview items Observational items
Does the child have more than 20 books? (yes/no) X
Is there a musical instrument that your child can use at home? (yes/no)
X
Does your family get a daily newspaper? (yes/no) X
Does your child read for enjoyment on a weekly basis? (yes/no) X
Does the family encourage your child to start and keep doing hobbies? (yes/no)
X
Does your child get special lessons or belong to any organization that encourages activities such as sports, music, art, dance, drama, etc.? (yes/no)
X
Has a family member taken your child to any type of museum in the past year? (yes/no)
X
Has a family member taken your child to any type of musical or theatrical performance within the past year? (yes/no)
X
When your family watches TV, do you discuss programs with the child? (yes/no)
X
Interior of the home is dark or perceptually monotonous (yes/no) X
All visible rooms of the house/apartment are reasonably clean (yes/no)
X
All visible rooms of the house/apartment minimally cluttered (yes/no)
X
Building has no dangerous structural or health hazards (yes/no) X
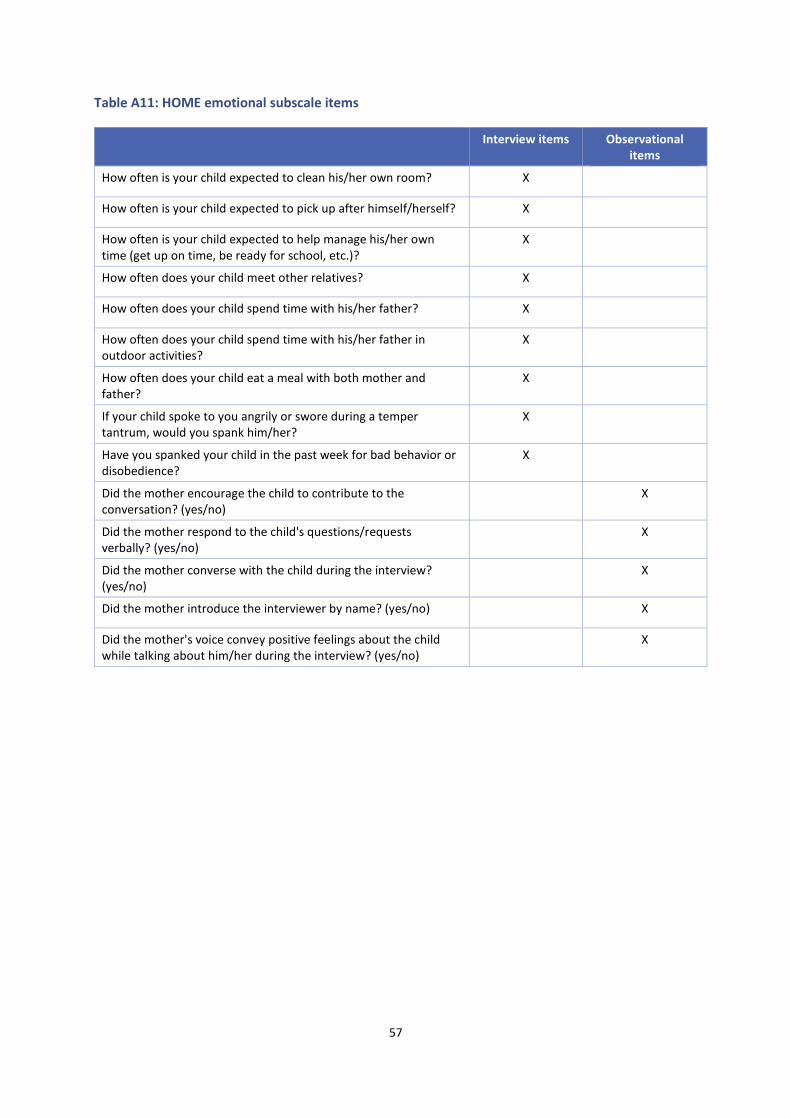
57
Table A11: HOME emotional subscale items
Interview items Observational items
How often is your child expected to clean his/her own room? X
How often is your child expected to pick up after himself/herself? X
How often is your child expected to help manage his/her own time (get up on time, be ready for school, etc.)?
X
How often does your child meet other relatives? X
How often does your child spend time with his/her father? X
How often does your child spend time with his/her father in outdoor activities?
X
How often does your child eat a meal with both mother and father?
X
If your child spoke to you angrily or swore during a temper tantrum, would you spank him/her?
X
Have you spanked your child in the past week for bad behavior or disobedience?
X
Did the mother encourage the child to contribute to the conversation? (yes/no)
X
Did the mother respond to the child's questions/requests verbally? (yes/no)
X
Did the mother converse with the child during the interview? (yes/no)
X
Did the mother introduce the interviewer by name? (yes/no) X
Did the mother's voice convey positive feelings about the child while talking about him/her during the interview? (yes/no)
X
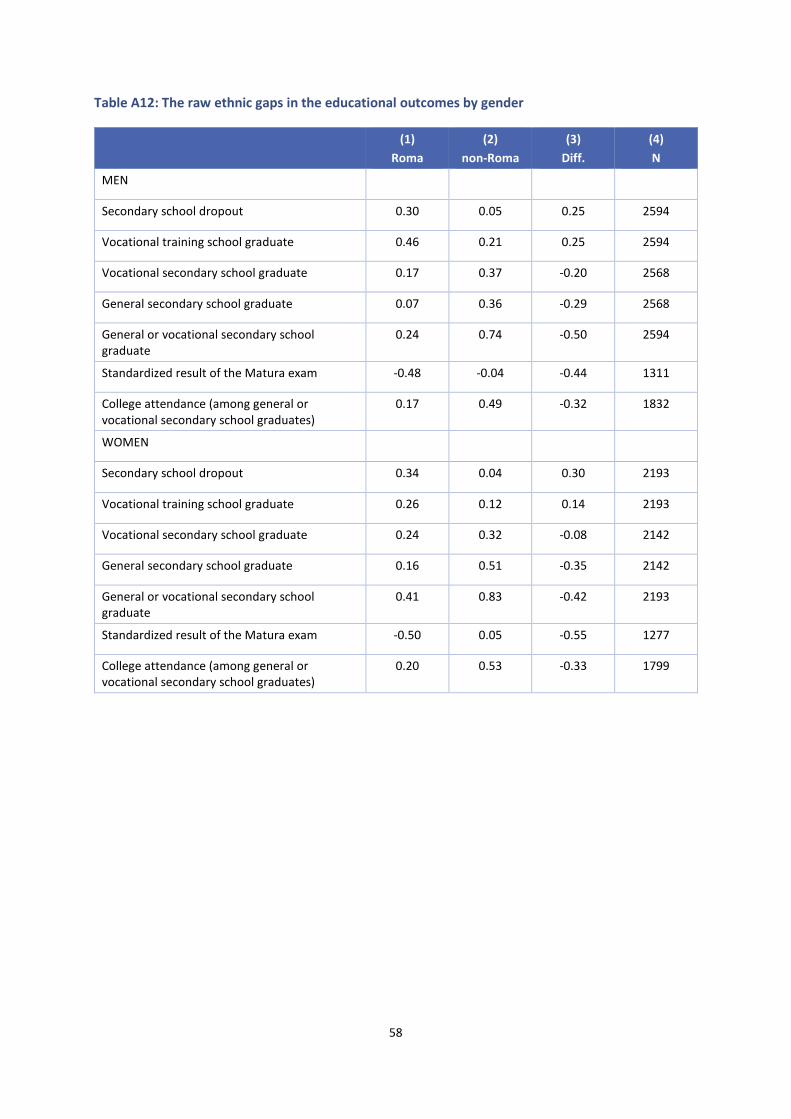
58
Table A12: The raw ethnic gaps in the educational outcomes by gender
(1)
Roma
(2)
non-Roma
(3)
Diff.
(4)
N
MEN
Secondary school dropout 0.30 0.05 0.25 2594
Vocational training school graduate 0.46 0.21 0.25 2594
Vocational secondary school graduate 0.17 0.37 -0.20 2568
General secondary school graduate 0.07 0.36 -0.29 2568
General or vocational secondary school graduate
0.24 0.74 -0.50 2594
Standardized result of the Matura exam -0.48 -0.04 -0.44 1311
College attendance (among general or vocational secondary school graduates)
0.17 0.49 -0.32 1832
WOMEN
Secondary school dropout 0.34 0.04 0.30 2193
Vocational training school graduate 0.26 0.12 0.14 2193
Vocational secondary school graduate 0.24 0.32 -0.08 2142
General secondary school graduate 0.16 0.51 -0.35 2142
General or vocational secondary school graduate
0.41 0.83 -0.42 2193
Standardized result of the Matura exam -0.50 0.05 -0.55 1277
College attendance (among general or vocational secondary school graduates)
0.20 0.53 -0.33 1799
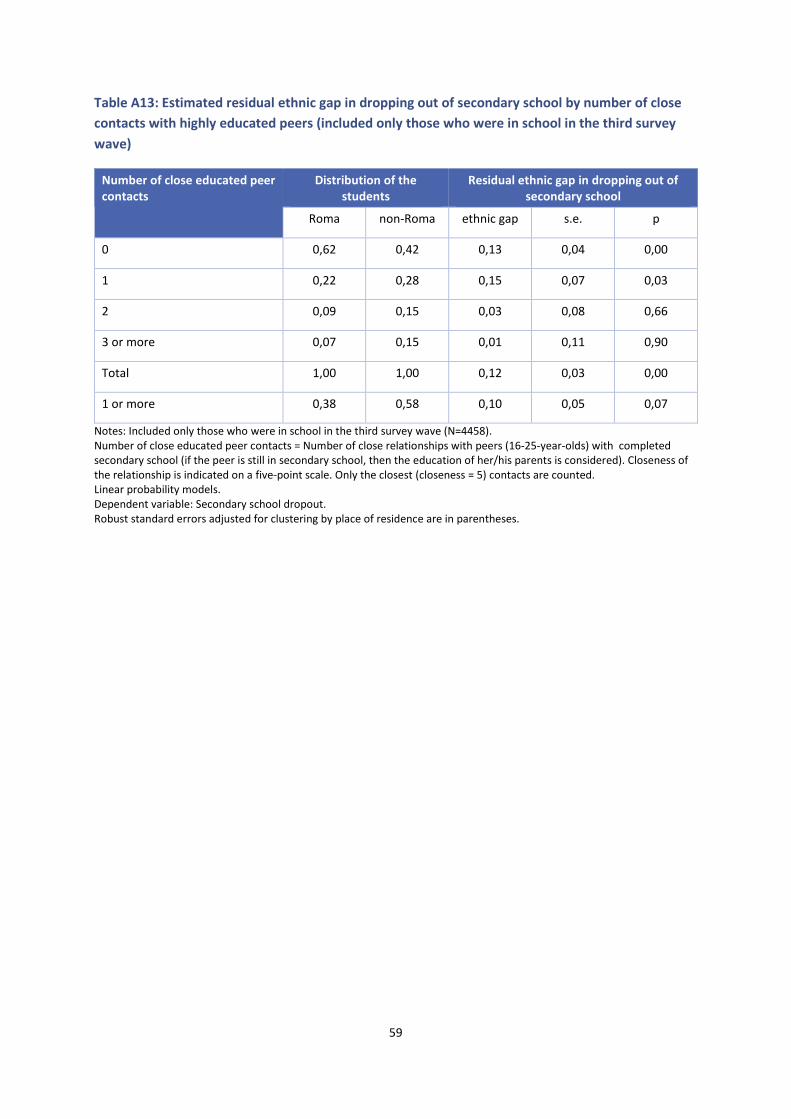
59
Table A13: Estimated residual ethnic gap in dropping out of secondary school by number of close
contacts with highly educated peers (included only those who were in school in the third survey
wave)
Number of close educated peer contacts
Distribution of the students
Residual ethnic gap in dropping out of secondary school
Roma non-Roma ethnic gap s.e. p
0 0,62 0,42 0,13 0,04 0,00
1 0,22 0,28 0,15 0,07 0,03
2 0,09 0,15 0,03 0,08 0,66
3 or more 0,07 0,15 0,01 0,11 0,90
Total 1,00 1,00 0,12 0,03 0,00
1 or more 0,38 0,58 0,10 0,05 0,07
Notes: Included only those who were in school in the third survey wave (N=4458). Number of close educated peer contacts = Number of close relationships with peers (16-25-year-olds) with completed secondary school (if the peer is still in secondary school, then the education of her/his parents is considered). Closeness of the relationship is indicated on a five-point scale. Only the closest (closeness = 5) contacts are counted. Linear probability models. Dependent variable: Secondary school dropout. Robust standard errors adjusted for clustering by place of residence are in parentheses.
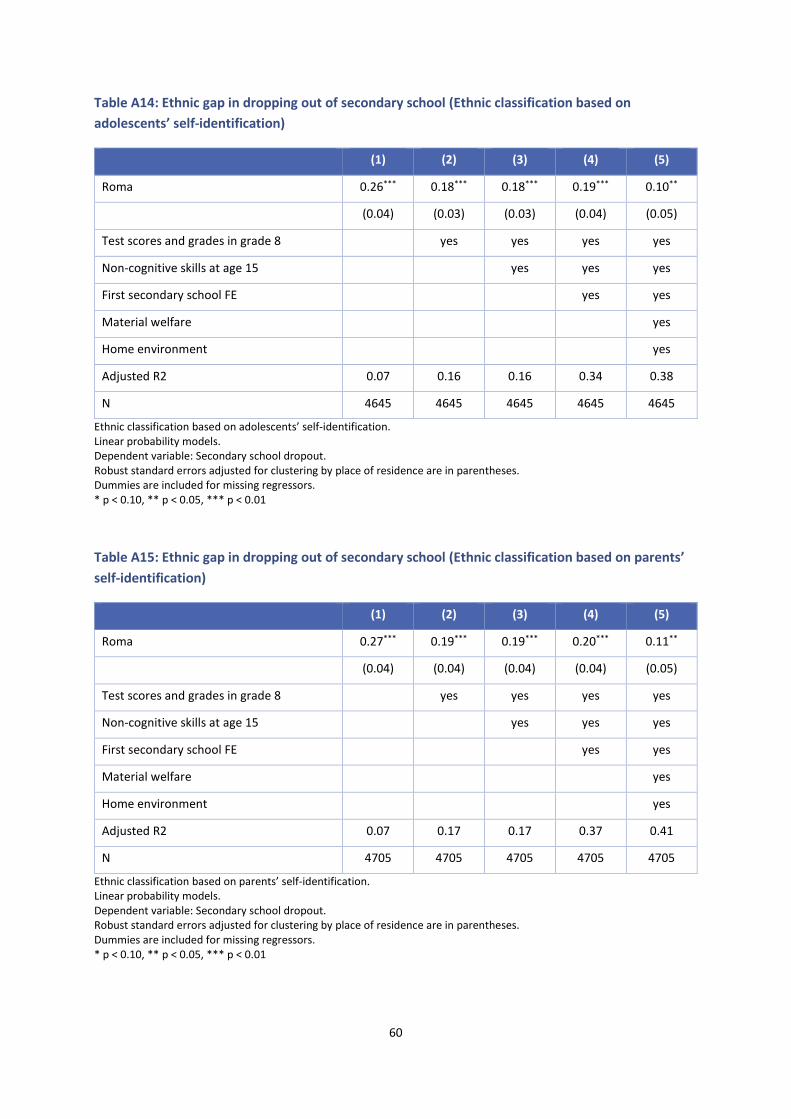
60
Table A14: Ethnic gap in dropping out of secondary school (Ethnic classification based on
adolescents’ self-identification)
(1) (2) (3) (4) (5)
Roma 0.26*** 0.18*** 0.18*** 0.19*** 0.10**
(0.04) (0.03) (0.03) (0.04) (0.05)
Test scores and grades in grade 8 yes yes yes yes
Non-cognitive skills at age 15 yes yes yes
First secondary school FE yes yes
Material welfare yes
Home environment yes
Adjusted R2 0.07 0.16 0.16 0.34 0.38
N 4645 4645 4645 4645 4645
Ethnic classification based on adolescents’ self-identification. Linear probability models. Dependent variable: Secondary school dropout. Robust standard errors adjusted for clustering by place of residence are in parentheses. Dummies are included for missing regressors. * p < 0.10, ** p < 0.05, *** p < 0.01
Table A15: Ethnic gap in dropping out of secondary school (Ethnic classification based on parents’
self-identification)
(1) (2) (3) (4) (5)
Roma 0.27*** 0.19*** 0.19*** 0.20*** 0.11**
(0.04) (0.04) (0.04) (0.04) (0.05)
Test scores and grades in grade 8 yes yes yes yes
Non-cognitive skills at age 15 yes yes yes
First secondary school FE yes yes
Material welfare yes
Home environment yes
Adjusted R2 0.07 0.17 0.17 0.37 0.41
N 4705 4705 4705 4705 4705
Ethnic classification based on parents’ self-identification. Linear probability models. Dependent variable: Secondary school dropout. Robust standard errors adjusted for clustering by place of residence are in parentheses. Dummies are included for missing regressors. * p < 0.10, ** p < 0.05, *** p < 0.01
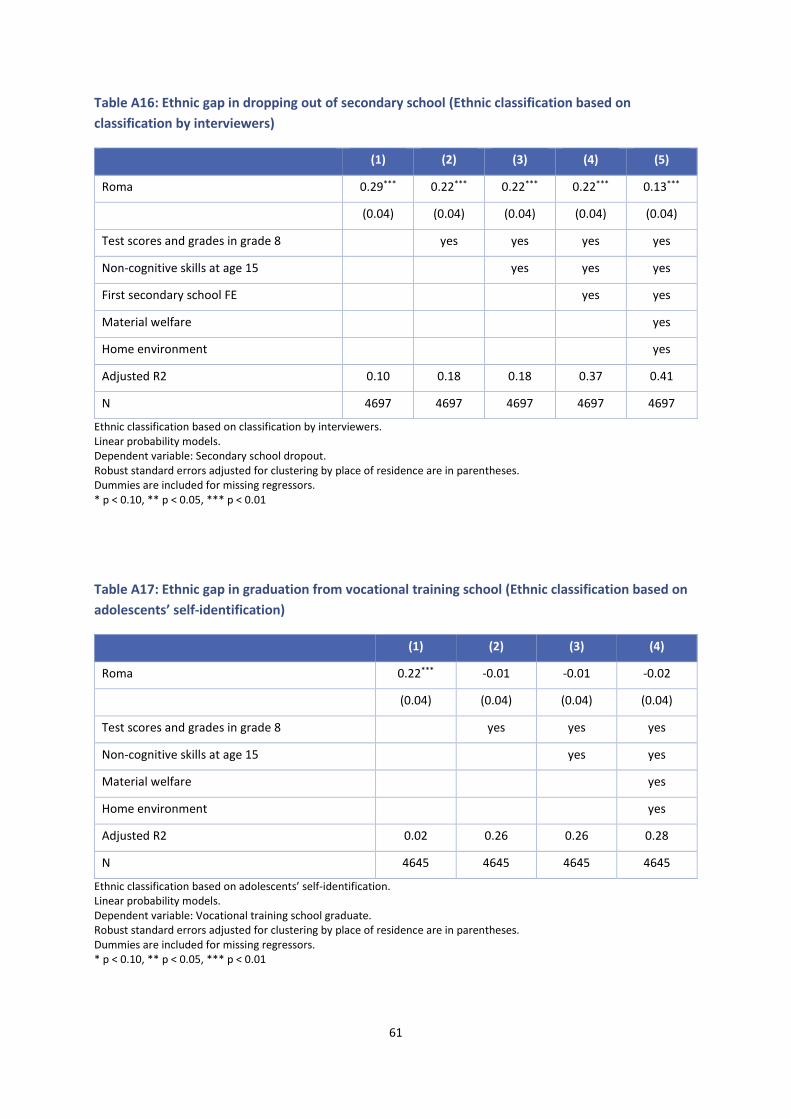
61
Table A16: Ethnic gap in dropping out of secondary school (Ethnic classification based on
classification by interviewers)
(1) (2) (3) (4) (5)
Roma 0.29*** 0.22*** 0.22*** 0.22*** 0.13***
(0.04) (0.04) (0.04) (0.04) (0.04)
Test scores and grades in grade 8 yes yes yes yes
Non-cognitive skills at age 15 yes yes yes
First secondary school FE yes yes
Material welfare yes
Home environment yes
Adjusted R2 0.10 0.18 0.18 0.37 0.41
N 4697 4697 4697 4697 4697
Ethnic classification based on classification by interviewers. Linear probability models. Dependent variable: Secondary school dropout. Robust standard errors adjusted for clustering by place of residence are in parentheses. Dummies are included for missing regressors. * p < 0.10, ** p < 0.05, *** p < 0.01
Table A17: Ethnic gap in graduation from vocational training school (Ethnic classification based on
adolescents’ self-identification)
(1) (2) (3) (4)
Roma 0.22*** -0.01 -0.01 -0.02
(0.04) (0.04) (0.04) (0.04)
Test scores and grades in grade 8 yes yes yes
Non-cognitive skills at age 15 yes yes
Material welfare yes
Home environment yes
Adjusted R2 0.02 0.26 0.26 0.28
N 4645 4645 4645 4645
Ethnic classification based on adolescents’ self-identification. Linear probability models. Dependent variable: Vocational training school graduate. Robust standard errors adjusted for clustering by place of residence are in parentheses. Dummies are included for missing regressors. * p < 0.10, ** p < 0.05, *** p < 0.01

62
Table A18: Ethnic gap in graduation from vocational training school (Ethnic classification based on
parents’ self-identification)
(1) (2) (3) (4)
Roma 0.21*** -0.00 -0.00 -0.02
(0.04) (0.04) (0.04) (0.05)
Test scores and grades in grade 8 yes yes yes
Non-cognitive skills at age 15 yes yes
Material welfare yes
Home environment yes
Adjusted R2 0.02 0.26 0.26 0.28
N 4705 4705 4705 4705
Ethnic classification based on parents’ self-identification. Linear probability models. Dependent variable: Vocational training school graduate. Robust standard errors adjusted for clustering by place of residence are in parentheses. Dummies are included for missing regressors. * p < 0.10, ** p < 0.05, *** p < 0.01
Table A19: Ethnic gap in graduation from vocational training school (Ethnic classification based on
classification by interviewers)
(1) (2) (3) (4)
Roma 0.20*** -0.03 -0.03 -0.05
(0.04) (0.04) (0.04) (0.05)
Test scores and grades in grade 8 yes yes yes
Non-cognitive skills at age 15 yes yes
Material welfare yes
Home environment yes
Adjusted R2 0.02 0.26 0.26 0.28
N 4697 4697 4697 4697
Ethnic classification based on classification by interviewers. Linear probability models. Dependent variable: Vocational training school graduate. Robust standard errors adjusted for clustering by place of residence are in parentheses. Dummies are included for missing regressors. * p < 0.10, ** p < 0.05, *** p < 0.01
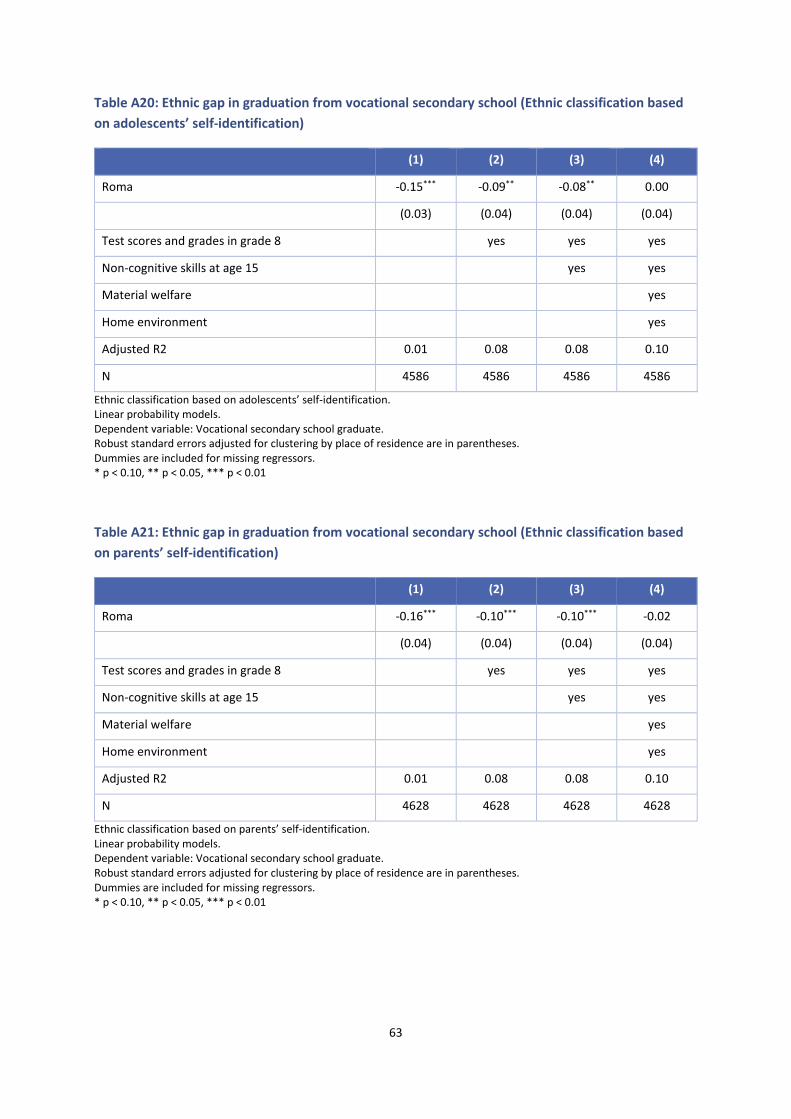
63
Table A20: Ethnic gap in graduation from vocational secondary school (Ethnic classification based
on adolescents’ self-identification)
(1) (2) (3) (4)
Roma -0.15*** -0.09** -0.08** 0.00
(0.03) (0.04) (0.04) (0.04)
Test scores and grades in grade 8 yes yes yes
Non-cognitive skills at age 15 yes yes
Material welfare yes
Home environment yes
Adjusted R2 0.01 0.08 0.08 0.10
N 4586 4586 4586 4586
Ethnic classification based on adolescents’ self-identification. Linear probability models. Dependent variable: Vocational secondary school graduate. Robust standard errors adjusted for clustering by place of residence are in parentheses. Dummies are included for missing regressors. * p < 0.10, ** p < 0.05, *** p < 0.01
Table A21: Ethnic gap in graduation from vocational secondary school (Ethnic classification based
on parents’ self-identification)
(1) (2) (3) (4)
Roma -0.16*** -0.10*** -0.10*** -0.02
(0.04) (0.04) (0.04) (0.04)
Test scores and grades in grade 8 yes yes yes
Non-cognitive skills at age 15 yes yes
Material welfare yes
Home environment yes
Adjusted R2 0.01 0.08 0.08 0.10
N 4628 4628 4628 4628
Ethnic classification based on parents’ self-identification. Linear probability models. Dependent variable: Vocational secondary school graduate. Robust standard errors adjusted for clustering by place of residence are in parentheses. Dummies are included for missing regressors. * p < 0.10, ** p < 0.05, *** p < 0.01

64
Table A22: Ethnic gap in graduation from vocational secondary school (Ethnic classification based
on classification by interviewers)
(1) (2) (3) (4)
Roma -0.16*** -0.10*** -0.10*** -0.02
(0.03) (0.04) (0.04) (0.04)
Test scores and grades in grade 8 yes yes yes
Non-cognitive skills at age 15 yes yes
Material welfare yes
Home environment yes
Adjusted R2 0.01 0.09 0.09 0.10
N 4620 4620 4620 4620
Ethnic classification based on classification by interviewers. Linear probability models. Dependent variable: Vocational secondary school graduate. Robust standard errors adjusted for clustering by place of residence are in parentheses. Dummies are included for missing regressors. * p < 0.10, ** p < 0.05, *** p < 0.01
Table A23: Ethnic gap in graduation from general secondary school (Ethnic classification based on
adolescents’ self-identification)
(1) (2) (3) (4)
Roma -0.34*** -0.09*** -0.09*** -0.05
(0.04) (0.03) (0.03) (0.03)
Test scores and grades in grade 8 yes yes yes
Non-cognitive skills at age 15 yes yes
Material welfare yes
Home environment yes
Adjusted R2 0.03 0.32 0.32 0.35
N 4586 4586 4586 4586
Ethnic classification based on adolescents’ self-identification. Linear probability models. Dependent variable: General secondary school graduate. Robust standard errors adjusted for clustering by place of residence are in parentheses. Dummies are included for missing regressors. * p < 0.10, ** p < 0.05, *** p < 0.01
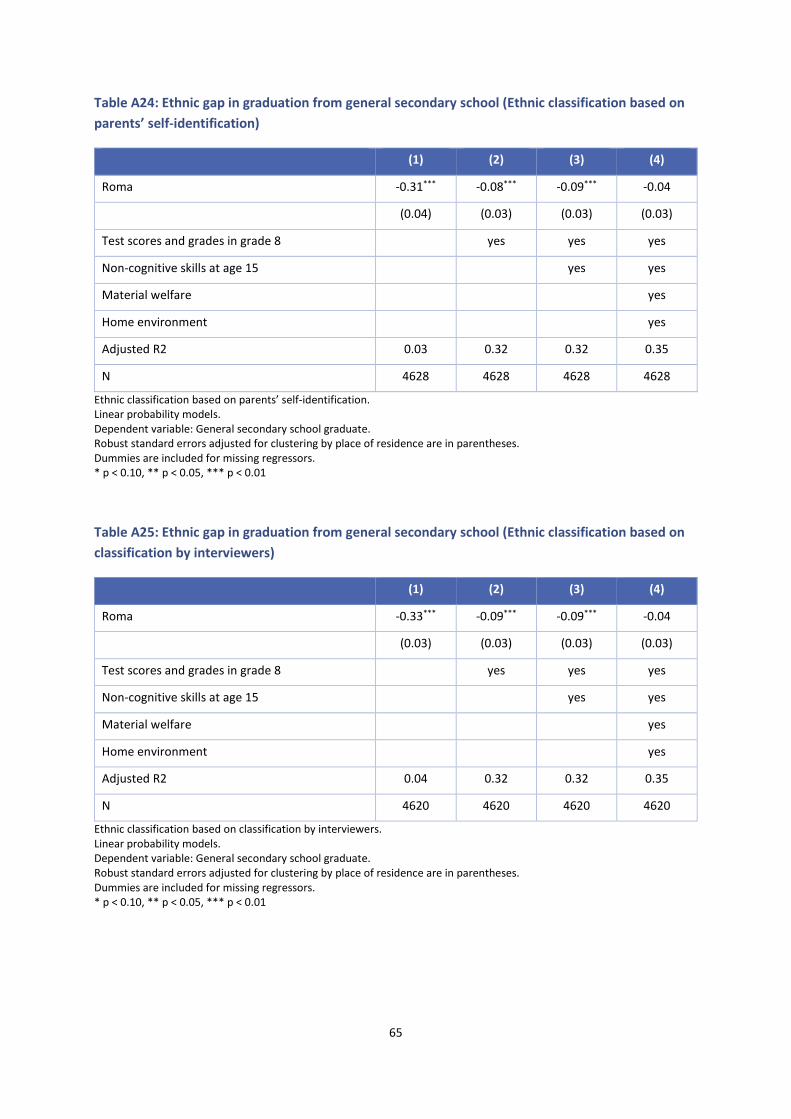
65
Table A24: Ethnic gap in graduation from general secondary school (Ethnic classification based on
parents’ self-identification)
(1) (2) (3) (4)
Roma -0.31*** -0.08*** -0.09*** -0.04
(0.04) (0.03) (0.03) (0.03)
Test scores and grades in grade 8 yes yes yes
Non-cognitive skills at age 15 yes yes
Material welfare yes
Home environment yes
Adjusted R2 0.03 0.32 0.32 0.35
N 4628 4628 4628 4628
Ethnic classification based on parents’ self-identification. Linear probability models. Dependent variable: General secondary school graduate. Robust standard errors adjusted for clustering by place of residence are in parentheses. Dummies are included for missing regressors. * p < 0.10, ** p < 0.05, *** p < 0.01
Table A25: Ethnic gap in graduation from general secondary school (Ethnic classification based on
classification by interviewers)
(1) (2) (3) (4)
Roma -0.33*** -0.09*** -0.09*** -0.04
(0.03) (0.03) (0.03) (0.03)
Test scores and grades in grade 8 yes yes yes
Non-cognitive skills at age 15 yes yes
Material welfare yes
Home environment yes
Adjusted R2 0.04 0.32 0.32 0.35
N 4620 4620 4620 4620
Ethnic classification based on classification by interviewers. Linear probability models. Dependent variable: General secondary school graduate. Robust standard errors adjusted for clustering by place of residence are in parentheses. Dummies are included for missing regressors. * p < 0.10, ** p < 0.05, *** p < 0.01
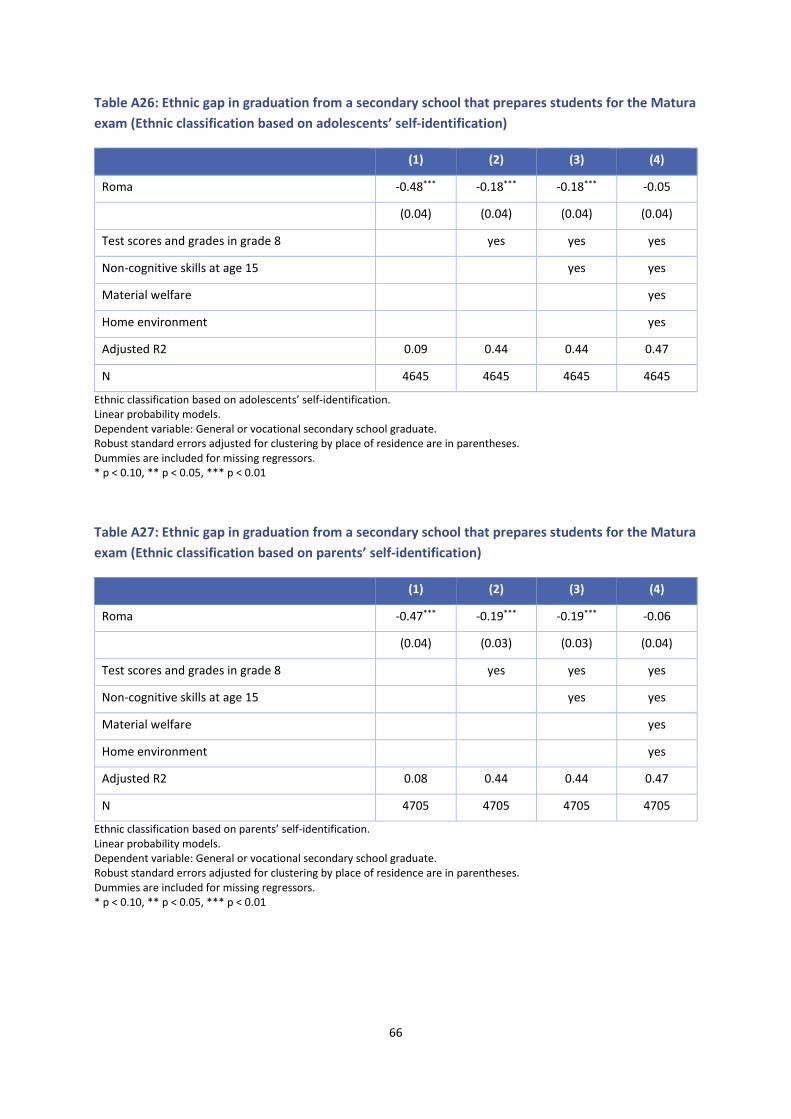
66
Table A26: Ethnic gap in graduation from a secondary school that prepares students for the Matura
exam (Ethnic classification based on adolescents’ self-identification)
(1) (2) (3) (4)
Roma -0.48*** -0.18*** -0.18*** -0.05
(0.04) (0.04) (0.04) (0.04)
Test scores and grades in grade 8 yes yes yes
Non-cognitive skills at age 15 yes yes
Material welfare yes
Home environment yes
Adjusted R2 0.09 0.44 0.44 0.47
N 4645 4645 4645 4645
Ethnic classification based on adolescents’ self-identification. Linear probability models. Dependent variable: General or vocational secondary school graduate. Robust standard errors adjusted for clustering by place of residence are in parentheses. Dummies are included for missing regressors. * p < 0.10, ** p < 0.05, *** p < 0.01
Table A27: Ethnic gap in graduation from a secondary school that prepares students for the Matura
exam (Ethnic classification based on parents’ self-identification)
(1) (2) (3) (4)
Roma -0.47*** -0.19*** -0.19*** -0.06
(0.04) (0.03) (0.03) (0.04)
Test scores and grades in grade 8 yes yes yes
Non-cognitive skills at age 15 yes yes
Material welfare yes
Home environment yes
Adjusted R2 0.08 0.44 0.44 0.47
N 4705 4705 4705 4705
Ethnic classification based on parents’ self-identification. Linear probability models. Dependent variable: General or vocational secondary school graduate. Robust standard errors adjusted for clustering by place of residence are in parentheses. Dummies are included for missing regressors. * p < 0.10, ** p < 0.05, *** p < 0.01

67
Table A28: Ethnic gap in graduation from a secondary school that prepares students for the Matura
exam (Ethnic classification based on classification by interviewers)
(1) (2) (3) (4)
Roma -0.49*** -0.19*** -0.19*** -0.06
(0.04) (0.03) (0.03) (0.04)
Test scores and grades in grade 8 yes yes yes
Non-cognitive skills at age 15 yes yes
Material welfare yes
Home environment yes
Adjusted R2 0.10 0.44 0.44 0.47
N 4697 4697 4697 4697
Ethnic classification based on classification by interviewers. Linear probability models. Dependent variable: General or vocational secondary school graduate. Robust standard errors adjusted for clustering by place of residence are in parentheses. Dummies are included for missing regressors. * p < 0.10, ** p < 0.05, *** p < 0.01
Table A29: Ethnic gap in the result of the Matura exam (Ethnic classification based on adolescents’
self-identification)
(1) (2) (3) (4) (5)
Roma -0.68*** -0.08 -0.08 -0.10 0.08
(0.19) (0.14) (0.14) (0.15) (0.18)
Test scores and grades in grade 8 yes yes yes yes
Non-cognitive skills at age 15 yes yes yes
Last secondary school FE yes yes
Material welfare yes
Home environment yes
Adjusted R2 0.01 0.54 0.54 0.64 0.66
N 2588 2588 2588 2588 2588
Ethnic classification based on adolescents’ self-identification. Ordinary least squares. Dependent variable: Result of the Maura exam. Robust standard errors adjusted for clustering by place of residence are in parentheses. Dummies are included for missing regressors. * p < 0.10, ** p < 0.05, *** p < 0.01
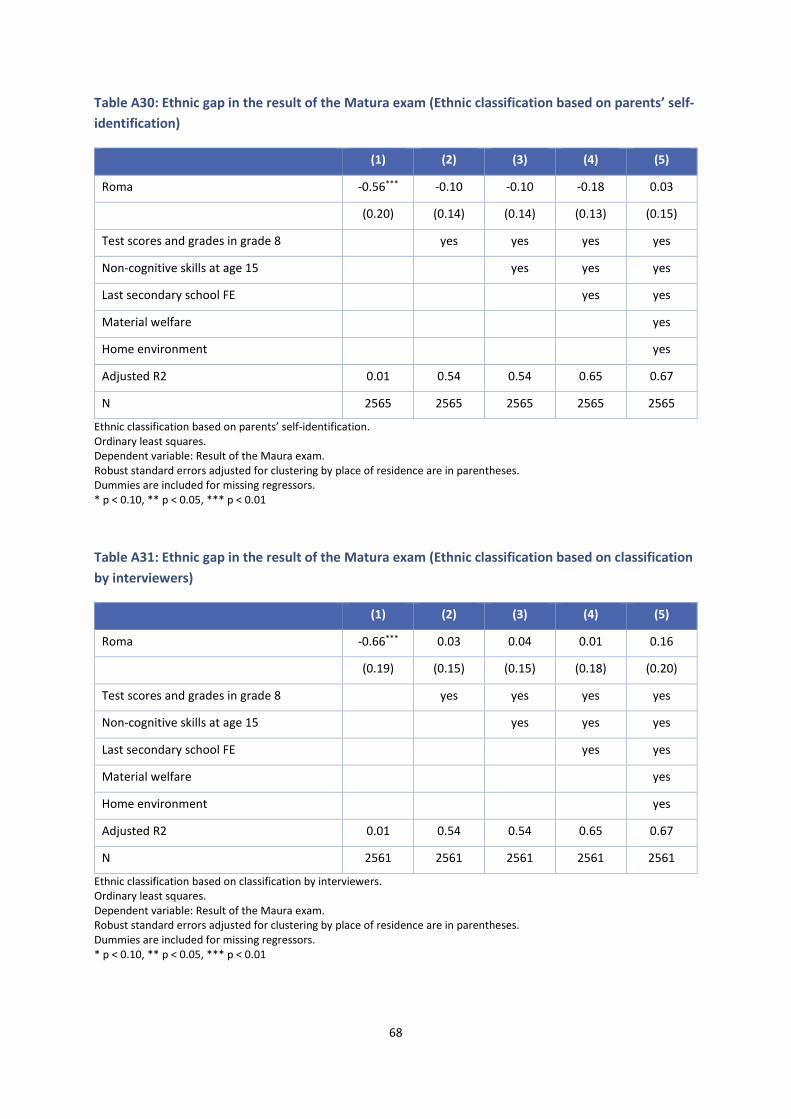
68
Table A30: Ethnic gap in the result of the Matura exam (Ethnic classification based on parents’ self-
identification)
(1) (2) (3) (4) (5)
Roma -0.56*** -0.10 -0.10 -0.18 0.03
(0.20) (0.14) (0.14) (0.13) (0.15)
Test scores and grades in grade 8 yes yes yes yes
Non-cognitive skills at age 15 yes yes yes
Last secondary school FE yes yes
Material welfare yes
Home environment yes
Adjusted R2 0.01 0.54 0.54 0.65 0.67
N 2565 2565 2565 2565 2565
Ethnic classification based on parents’ self-identification. Ordinary least squares. Dependent variable: Result of the Maura exam. Robust standard errors adjusted for clustering by place of residence are in parentheses. Dummies are included for missing regressors. * p < 0.10, ** p < 0.05, *** p < 0.01
Table A31: Ethnic gap in the result of the Matura exam (Ethnic classification based on classification
by interviewers)
(1) (2) (3) (4) (5)
Roma -0.66*** 0.03 0.04 0.01 0.16
(0.19) (0.15) (0.15) (0.18) (0.20)
Test scores and grades in grade 8 yes yes yes yes
Non-cognitive skills at age 15 yes yes yes
Last secondary school FE yes yes
Material welfare yes
Home environment yes
Adjusted R2 0.01 0.54 0.54 0.65 0.67
N 2561 2561 2561 2561 2561
Ethnic classification based on classification by interviewers. Ordinary least squares. Dependent variable: Result of the Maura exam. Robust standard errors adjusted for clustering by place of residence are in parentheses. Dummies are included for missing regressors. * p < 0.10, ** p < 0.05, *** p < 0.01
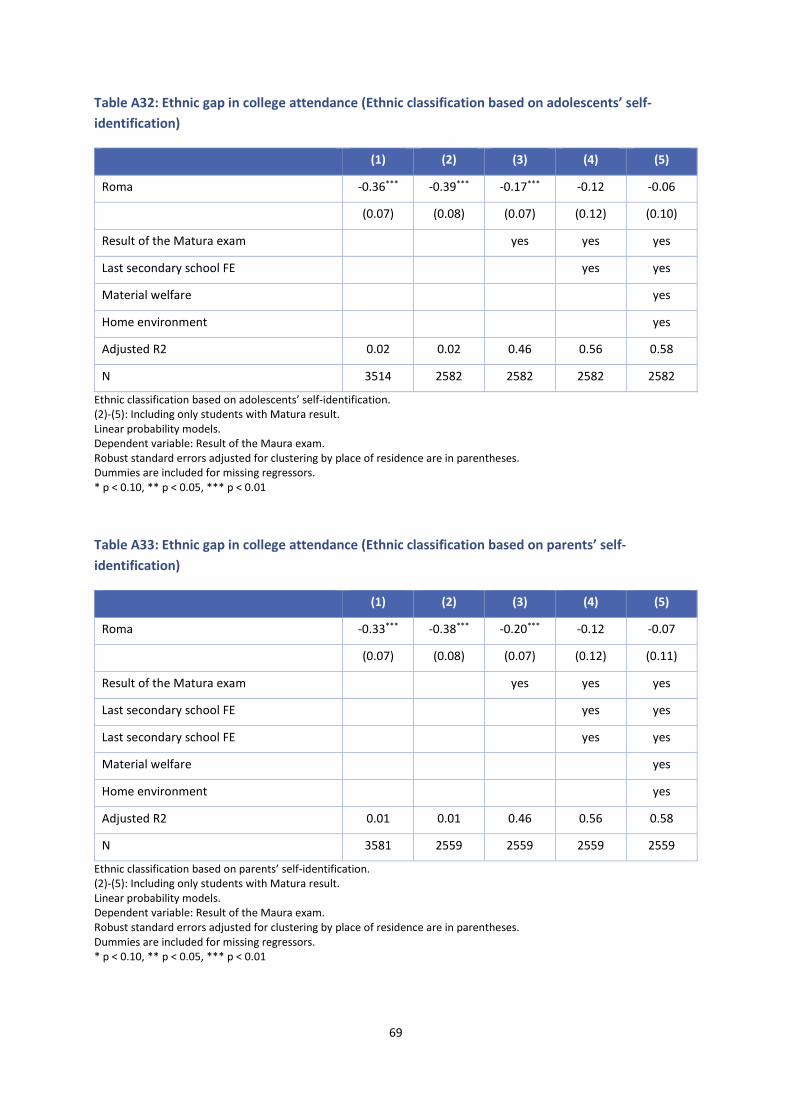
69
Table A32: Ethnic gap in college attendance (Ethnic classification based on adolescents’ self-
identification)
(1) (2) (3) (4) (5)
Roma -0.36*** -0.39*** -0.17*** -0.12 -0.06
(0.07) (0.08) (0.07) (0.12) (0.10)
Result of the Matura exam yes yes yes
Last secondary school FE yes yes
Material welfare yes
Home environment yes
Adjusted R2 0.02 0.02 0.46 0.56 0.58
N 3514 2582 2582 2582 2582
Ethnic classification based on adolescents’ self-identification. (2)-(5): Including only students with Matura result. Linear probability models. Dependent variable: Result of the Maura exam. Robust standard errors adjusted for clustering by place of residence are in parentheses. Dummies are included for missing regressors. * p < 0.10, ** p < 0.05, *** p < 0.01
Table A33: Ethnic gap in college attendance (Ethnic classification based on parents’ self-
identification)
(1) (2) (3) (4) (5)
Roma -0.33*** -0.38*** -0.20*** -0.12 -0.07
(0.07) (0.08) (0.07) (0.12) (0.11)
Result of the Matura exam yes yes yes
Last secondary school FE yes yes
Last secondary school FE yes yes
Material welfare yes
Home environment yes
Adjusted R2 0.01 0.01 0.46 0.56 0.58
N 3581 2559 2559 2559 2559
Ethnic classification based on parents’ self-identification. (2)-(5): Including only students with Matura result. Linear probability models. Dependent variable: Result of the Maura exam. Robust standard errors adjusted for clustering by place of residence are in parentheses. Dummies are included for missing regressors. * p < 0.10, ** p < 0.05, *** p < 0.01

70
Table A34: Ethnic gap in college attendance (Ethnic classification based on classification by
interviewers)
(1) (2) (3) (4) (5)
Roma -0.37*** -0.40*** -0.18*** -0.11 -0.06
(0.05) (0.06) (0.06) (0.10) (0.09)
Result of the Matura exam yes yes yes
Last secondary school FE yes yes
Last secondary school FE yes yes
Material welfare yes
Home environment yes
Adjusted R2 0.02 0.02 0.46 0.56 0.58
N 3619 2582 2582 2582 2582
Ethnic classification based on classification by interviewers. (2)-(5): Including only students with Matura result. Linear probability models. Dependent variable: Result of the Maura exam. Robust standard errors adjusted for clustering by place of residence are in parentheses. Dummies are included for missing regressors. * p < 0.10, ** p < 0.05, *** p < 0.01

71
Table A35: Ethnic gap in permanent employment, MEN (Ethnic classification based on adolescents’
self-identification)
MEN (1) (2) (3) (4) (5) (6) (7)
Roma -0.13** -0.09 -0.08 -0.07 -0.08 -0.08 -0.06
(0.06) (0.06) (0.06) (0.05) (0.06) (0.06) (0.05)
Education level yes yes yes yes yes
Test scores and grades in grade 8
yes yes yes yes yes
Non-cognitive skills at age 15
yes yes yes
Health yes yes
Network yes yes
County FE yes
Adjusted R2 0.01 0.02 0.03 0.04 0.05 0.06 0.08
N 1762 1762 1762 1762 1762 1762 1762
Ethnic classification based on adolescents’ self-identification. Linear probability models. Dependent variable: Permanently employed. Robust standard errors adjusted for clustering by place of residence are in parentheses. Dummies are included for missing regressors. * p < 0.10, ** p < 0.05, *** p < 0.01
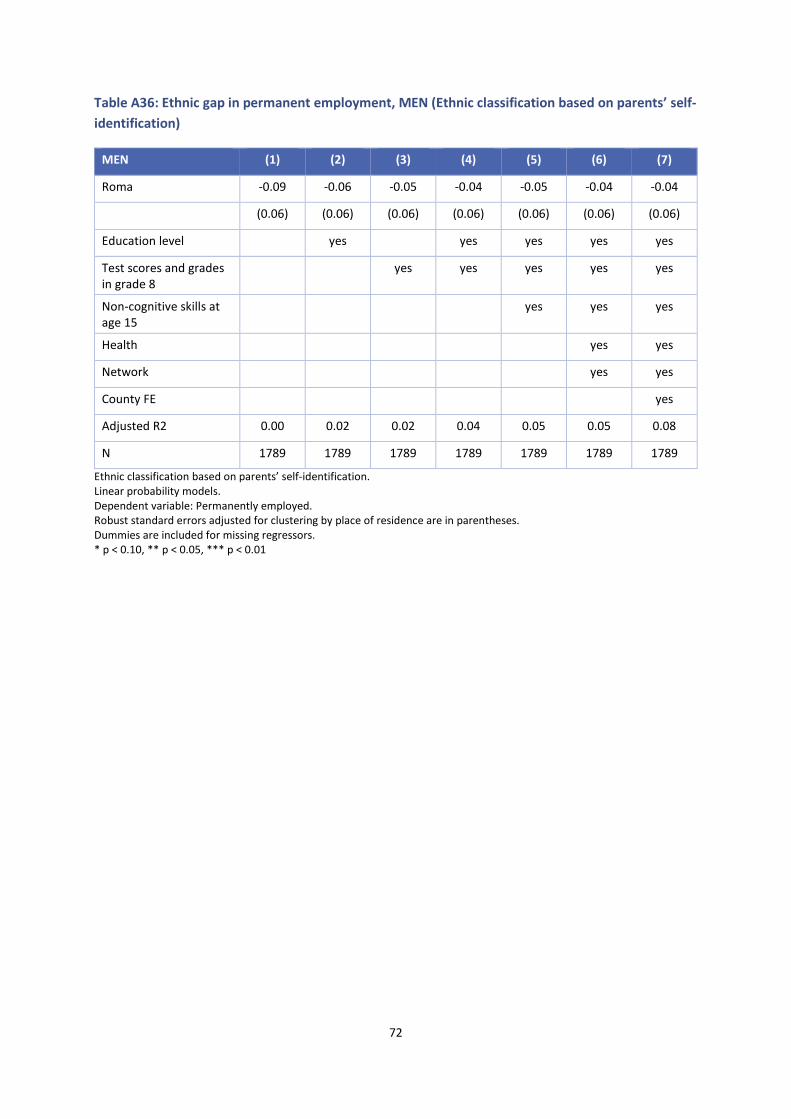
72
Table A36: Ethnic gap in permanent employment, MEN (Ethnic classification based on parents’ self-
identification)
MEN (1) (2) (3) (4) (5) (6) (7)
Roma -0.09 -0.06 -0.05 -0.04 -0.05 -0.04 -0.04
(0.06) (0.06) (0.06) (0.06) (0.06) (0.06) (0.06)
Education level yes yes yes yes yes
Test scores and grades in grade 8
yes yes yes yes yes
Non-cognitive skills at age 15
yes yes yes
Health yes yes
Network yes yes
County FE yes
Adjusted R2 0.00 0.02 0.02 0.04 0.05 0.05 0.08
N 1789 1789 1789 1789 1789 1789 1789
Ethnic classification based on parents’ self-identification. Linear probability models. Dependent variable: Permanently employed. Robust standard errors adjusted for clustering by place of residence are in parentheses. Dummies are included for missing regressors. * p < 0.10, ** p < 0.05, *** p < 0.01

73
Table A37: Ethnic gap in permanent employment, MEN (Ethnic classification based on classification
by interviewers)
MEN (1) (2) (3) (4) (5) (6) (7)
Roma -0.16*** -0.13** -0.13** -0.11** -0.12** -0.13** -0.11**
(0.06) (0.06) (0.05) (0.05) (0.05) (0.05) (0.05)
Education level yes yes yes yes yes
Test scores and grades in grade 8
yes yes yes yes yes
Non-cognitive skills at age 15
yes yes yes
Health yes yes
Network yes yes
County FE yes
Adjusted R2 0.01 0.03 0.03 0.04 0.06 0.06 0.09
N 1779 1779 1779 1779 1779 1779 1779
Ethnic classification based on classification by interviewers. Linear probability models. Dependent variable: Permanently employed. Robust standard errors adjusted for clustering by place of residence are in parentheses. Dummies are included for missing regressors. * p < 0.10, ** p < 0.05, *** p < 0.01
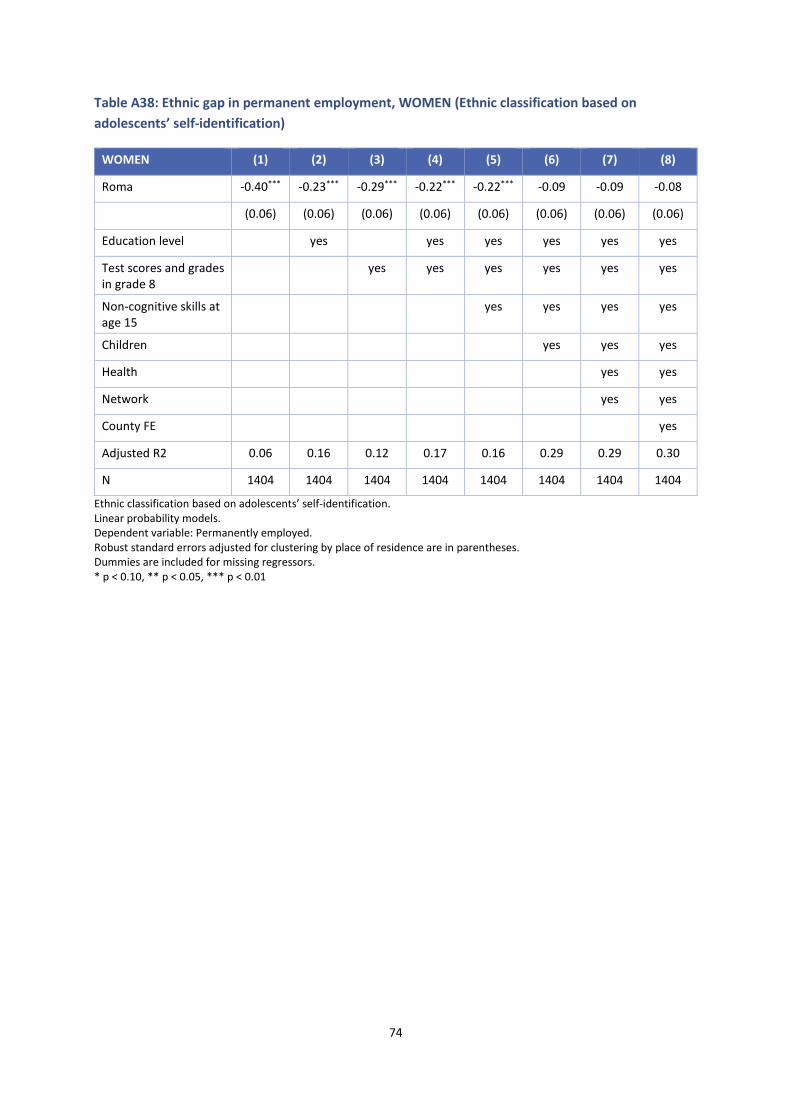
74
Table A38: Ethnic gap in permanent employment, WOMEN (Ethnic classification based on
adolescents’ self-identification)
WOMEN (1) (2) (3) (4) (5) (6) (7) (8)
Roma -0.40*** -0.23*** -0.29*** -0.22*** -0.22*** -0.09 -0.09 -0.08
(0.06) (0.06) (0.06) (0.06) (0.06) (0.06) (0.06) (0.06)
Education level yes yes yes yes yes yes
Test scores and grades in grade 8
yes yes yes yes yes yes
Non-cognitive skills at age 15
yes yes yes yes
Children yes yes yes
Health yes yes
Network yes yes
County FE yes
Adjusted R2 0.06 0.16 0.12 0.17 0.16 0.29 0.29 0.30
N 1404 1404 1404 1404 1404 1404 1404 1404
Ethnic classification based on adolescents’ self-identification. Linear probability models. Dependent variable: Permanently employed. Robust standard errors adjusted for clustering by place of residence are in parentheses. Dummies are included for missing regressors. * p < 0.10, ** p < 0.05, *** p < 0.01

75
Table A39: Ethnic gap in permanent employment, WOMEN (Ethnic classification based on parents’
self-identification)
WOMEN (1) (2) (3) (4) (5) (6) (7) (8)
Roma -0.38*** -0.23*** -0.30*** -0.23*** -0.23*** -0.09* -0.09 -0.05
(0.06) (0.06) (0.06) (0.06) (0.06) (0.05) (0.05) (0.06)
Education level yes yes yes yes yes yes
Test scores and grades in grade 8
yes yes yes yes yes yes
Non-cognitive skills at age 15
yes yes yes yes
Children yes yes yes
Health yes yes
Network yes yes
County FE yes
Adjusted R2 0.06 0.15 0.11 0.15 0.15 0.28 0.28 0.29
N 1401 1401 1401 1401 1401 1401 1401 1401
Ethnic classification based on parents’ self-identification. Linear probability models. Dependent variable: Permanently employed. Robust standard errors adjusted for clustering by place of residence are in parentheses. Dummies are included for missing regressors. * p < 0.10, ** p < 0.05, *** p < 0.01

76
Table A40: Ethnic gap in permanent employment, WOMEN (Ethnic classification based on
classification by interviewers)
WOMEN (1) (2) (3) (4) (5) (6) (7) (8)
Roma -0.36*** -0.21*** -0.28*** -0.20*** -0.20*** -0.04 -0.05 -0.04
(0.06) (0.06) (0.06) (0.06) (0.06) (0.06) (0.06) (0.06)
Education level yes yes yes yes yes yes
Test scores and grades in grade 8
yes yes yes yes yes yes
Non-cognitive skills at age 15
yes yes yes yes
Children yes yes yes
Health yes yes
Network yes yes
County FE yes
Adjusted R2 0.07 0.13 0.10 0.14 0.13 0.26 0.27 0.27
N 1343 1343 1343 1343 1343 1343 1343 1343
Ethnic classification based on classification by interviewers. Linear probability models. Dependent variable: Permanently employed. Robust standard errors adjusted for clustering by place of residence are in parentheses. Dummies are included for missing regressors. * p < 0.10, ** p < 0.05, *** p < 0.01
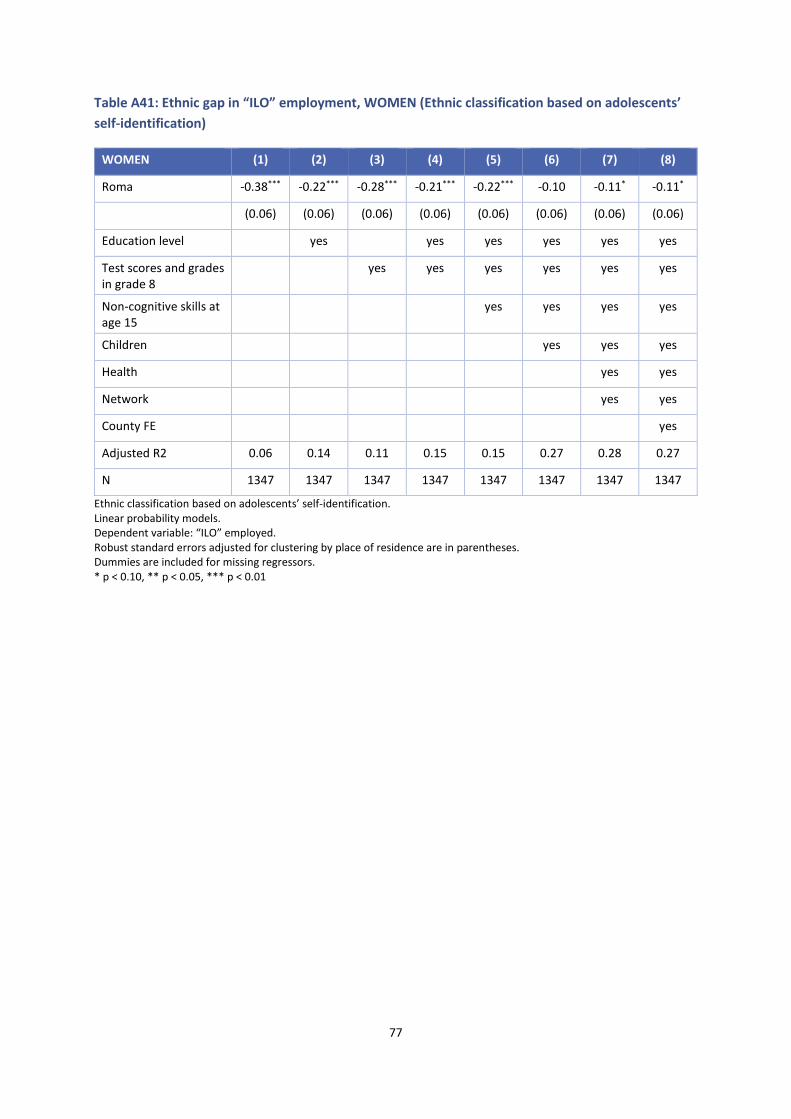
77
Table A41: Ethnic gap in “ILO” employment, WOMEN (Ethnic classification based on adolescents’
self-identification)
WOMEN (1) (2) (3) (4) (5) (6) (7) (8)
Roma -0.38*** -0.22*** -0.28*** -0.21*** -0.22*** -0.10 -0.11* -0.11*
(0.06) (0.06) (0.06) (0.06) (0.06) (0.06) (0.06) (0.06)
Education level yes yes yes yes yes yes
Test scores and grades in grade 8
yes yes yes yes yes yes
Non-cognitive skills at age 15
yes yes yes yes
Children yes yes yes
Health yes yes
Network yes yes
County FE yes
Adjusted R2 0.06 0.14 0.11 0.15 0.15 0.27 0.28 0.27
N 1347 1347 1347 1347 1347 1347 1347 1347
Ethnic classification based on adolescents’ self-identification. Linear probability models. Dependent variable: “ILO” employed. Robust standard errors adjusted for clustering by place of residence are in parentheses. Dummies are included for missing regressors. * p < 0.10, ** p < 0.05, *** p < 0.01
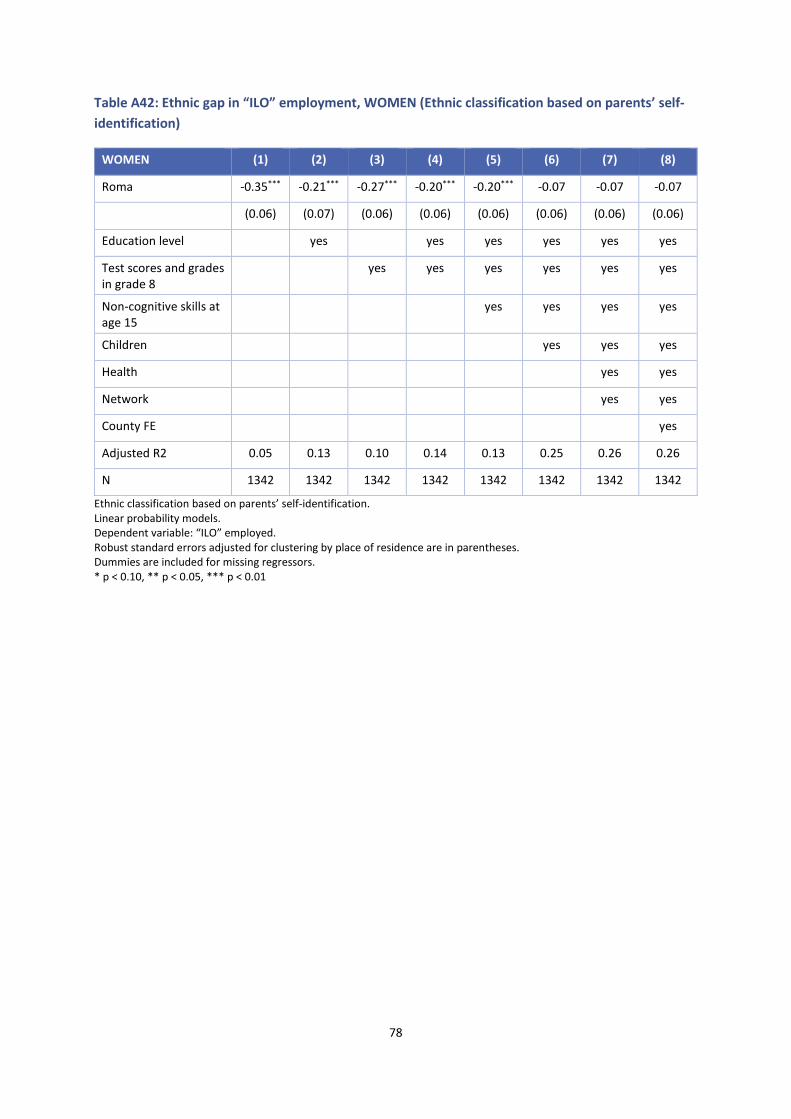
78
Table A42: Ethnic gap in “ILO” employment, WOMEN (Ethnic classification based on parents’ self-
identification)
WOMEN (1) (2) (3) (4) (5) (6) (7) (8)
Roma -0.35*** -0.21*** -0.27*** -0.20*** -0.20*** -0.07 -0.07 -0.07
(0.06) (0.07) (0.06) (0.06) (0.06) (0.06) (0.06) (0.06)
Education level yes yes yes yes yes yes
Test scores and grades in grade 8
yes yes yes yes yes yes
Non-cognitive skills at age 15
yes yes yes yes
Children yes yes yes
Health yes yes
Network yes yes
County FE yes
Adjusted R2 0.05 0.13 0.10 0.14 0.13 0.25 0.26 0.26
N 1342 1342 1342 1342 1342 1342 1342 1342
Ethnic classification based on parents’ self-identification. Linear probability models. Dependent variable: “ILO” employed. Robust standard errors adjusted for clustering by place of residence are in parentheses. Dummies are included for missing regressors. * p < 0.10, ** p < 0.05, *** p < 0.01
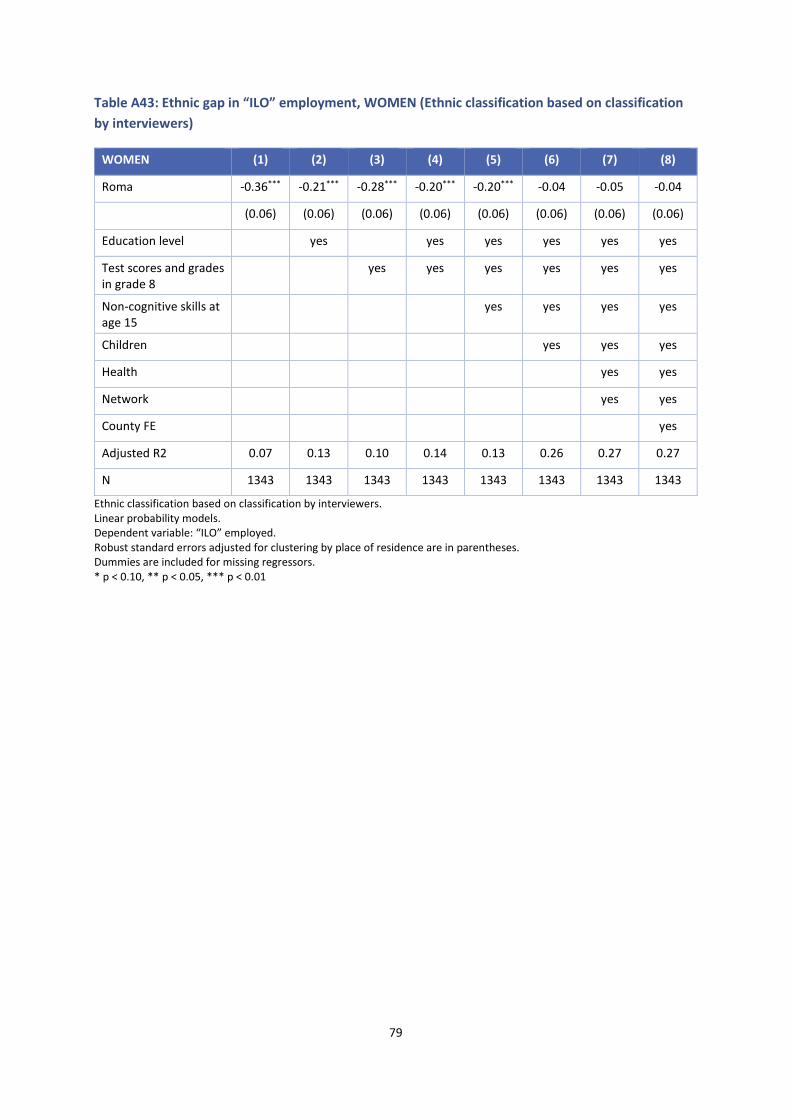
79
Table A43: Ethnic gap in “ILO” employment, WOMEN (Ethnic classification based on classification
by interviewers)
WOMEN (1) (2) (3) (4) (5) (6) (7) (8)
Roma -0.36*** -0.21*** -0.28*** -0.20*** -0.20*** -0.04 -0.05 -0.04
(0.06) (0.06) (0.06) (0.06) (0.06) (0.06) (0.06) (0.06)
Education level yes yes yes yes yes yes
Test scores and grades in grade 8
yes yes yes yes yes yes
Non-cognitive skills at age 15
yes yes yes yes
Children yes yes yes
Health yes yes
Network yes yes
County FE yes
Adjusted R2 0.07 0.13 0.10 0.14 0.13 0.26 0.27 0.27
N 1343 1343 1343 1343 1343 1343 1343 1343
Ethnic classification based on classification by interviewers. Linear probability models. Dependent variable: “ILO” employed. Robust standard errors adjusted for clustering by place of residence are in parentheses. Dummies are included for missing regressors. * p < 0.10, ** p < 0.05, *** p < 0.01

80
Table A44: Ethnic gap in log wage for “ILO” employed, MEN (Ethnic classification based on
adolescents’ self-identification)
MEN (1) (2) (3) (4) (5) (6) (7) (8)
Roma -0.27** -0.18 -0.18 -0.17 -0.18 -0.11 -0.14 -0.14
(0.13) (0.14) (0.13) (0.13) (0.11) (0.11) (0.09) (0.08)
Education level yes yes yes yes yes yes
Test scores and grades in grade 8
yes yes yes yes yes yes
Non-cognitive skills at age 15
yes yes yes yes
Temporary worker / Employed in public works programs
yes yes yes
Health yes yes
Network yes yes
County FE yes
Adjusted R2 0.03 0.04 0.10 0.10 0.12 0.19 0.21 0.24
N 1240 1240 1240 1240 1240 1240 1240 1240
Ethnic classification based on adolescents’ self-identification. Ordinary least squares. Dependent variable: ln(wage). Robust standard errors adjusted for clustering by place of residence are in parentheses. Dummies are included for missing regressors. * p < 0.10, ** p < 0.05, *** p < 0.01
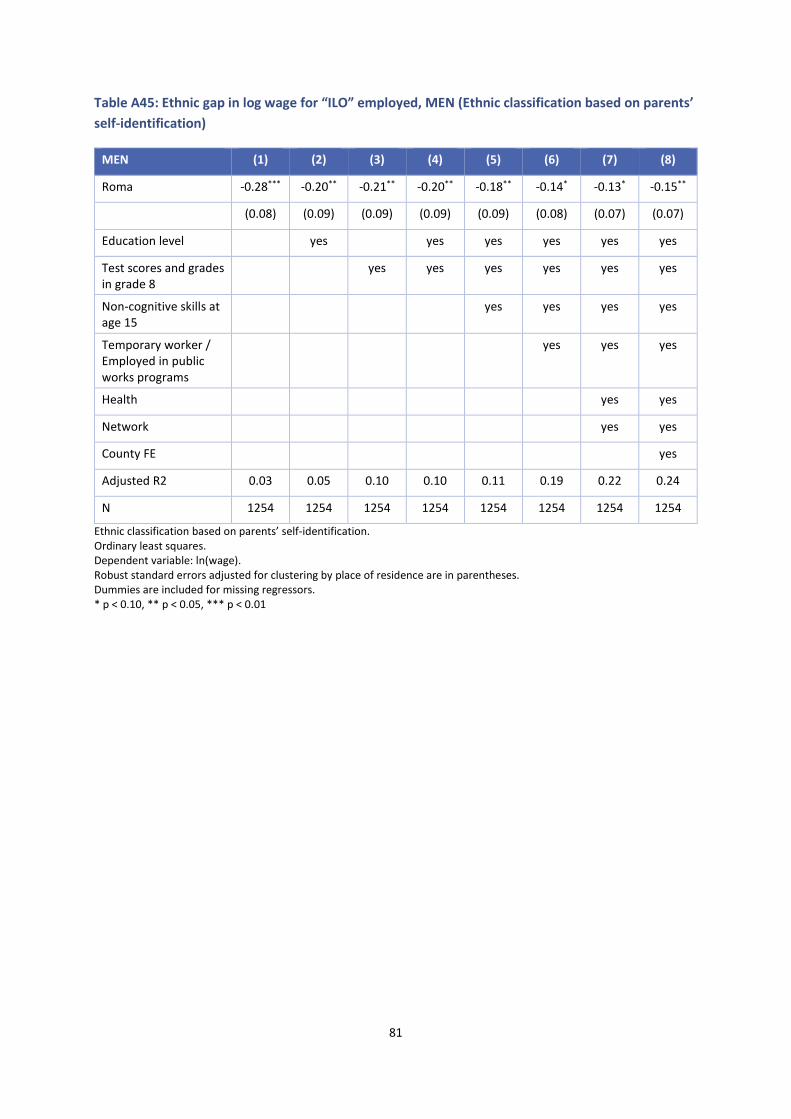
81
Table A45: Ethnic gap in log wage for “ILO” employed, MEN (Ethnic classification based on parents’
self-identification)
MEN (1) (2) (3) (4) (5) (6) (7) (8)
Roma -0.28*** -0.20** -0.21** -0.20** -0.18** -0.14* -0.13* -0.15**
(0.08) (0.09) (0.09) (0.09) (0.09) (0.08) (0.07) (0.07)
Education level yes yes yes yes yes yes
Test scores and grades in grade 8
yes yes yes yes yes yes
Non-cognitive skills at age 15
yes yes yes yes
Temporary worker / Employed in public works programs
yes yes yes
Health yes yes
Network yes yes
County FE yes
Adjusted R2 0.03 0.05 0.10 0.10 0.11 0.19 0.22 0.24
N 1254 1254 1254 1254 1254 1254 1254 1254
Ethnic classification based on parents’ self-identification. Ordinary least squares. Dependent variable: ln(wage). Robust standard errors adjusted for clustering by place of residence are in parentheses. Dummies are included for missing regressors. * p < 0.10, ** p < 0.05, *** p < 0.01

82
Table A46: Ethnic gap in log wage for “ILO” employed, MEN (Ethnic classification based on
classification by interviewers)
MEN (1) (2) (3) (4) (5) (6) (7) (8)
Roma -0.25** -0.17 -0.15 -0.14 -0.14 -0.08 -0.09 -0.09
(0.13) (0.13) (0.12) (0.12) (0.11) (0.10) (0.09) (0.08)
Education level yes yes yes yes yes yes
Test scores and grades in grade 8
yes yes yes yes yes yes
Non-cognitive skills at age 15
yes yes yes yes
Temporary worker / Employed in public works programs
yes yes yes
Health yes yes
Network yes yes
County FE yes
Adjusted R2 0.02 0.04 0.10 0.10 0.12 0.20 0.21 0.24
N 1243 1243 1243 1243 1243 1243 1243 1243
Ethnic classification based on classification by interviewers. Ordinary least squares. Dependent variable: ln(wage). Robust standard errors adjusted for clustering by place of residence are in parentheses. Dummies are included for missing regressors. * p < 0.10, ** p < 0.05, *** p < 0.01
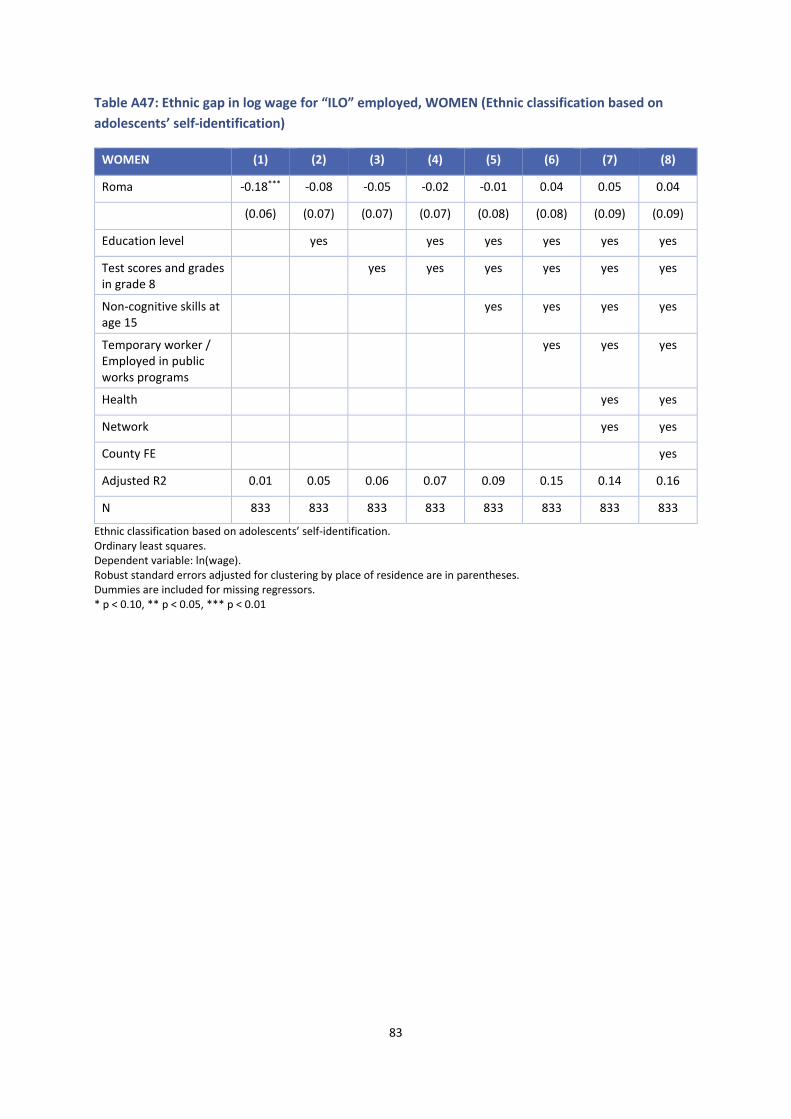
83
Table A47: Ethnic gap in log wage for “ILO” employed, WOMEN (Ethnic classification based on
adolescents’ self-identification)
WOMEN (1) (2) (3) (4) (5) (6) (7) (8)
Roma -0.18*** -0.08 -0.05 -0.02 -0.01 0.04 0.05 0.04
(0.06) (0.07) (0.07) (0.07) (0.08) (0.08) (0.09) (0.09)
Education level yes yes yes yes yes yes
Test scores and grades in grade 8
yes yes yes yes yes yes
Non-cognitive skills at age 15
yes yes yes yes
Temporary worker / Employed in public works programs
yes yes yes
Health yes yes
Network yes yes
County FE yes
Adjusted R2 0.01 0.05 0.06 0.07 0.09 0.15 0.14 0.16
N 833 833 833 833 833 833 833 833
Ethnic classification based on adolescents’ self-identification. Ordinary least squares. Dependent variable: ln(wage). Robust standard errors adjusted for clustering by place of residence are in parentheses. Dummies are included for missing regressors. * p < 0.10, ** p < 0.05, *** p < 0.01

84
Table A48: Ethnic gap in log wage for “ILO” employed, WOMEN (Ethnic classification based on
parents’ self-identification)
WOMEN (1) (2) (3) (4) (5) (6) (7) (8)
Roma -0.15** -0.06 -0.09 -0.04 -0.04 0.01 0.02 0.05
(0.07) (0.07) (0.08) (0.08) (0.08) (0.09) (0.09) (0.09)
Education level yes yes yes yes yes yes
Test scores and grades in grade 8
yes yes yes yes yes yes
Non-cognitive skills at age 15
yes yes yes yes
Temporary worker / Employed in public works programs
yes yes yes
Health yes yes
Network yes yes
County FE yes
Adjusted R2 0.00 0.04 0.06 0.06 0.08 0.13 0.14 0.16
N 834 834 834 834 834 834 834 834
Ethnic classification based on parents’ self-identification. Ordinary least squares. Dependent variable: ln(wage). Robust standard errors adjusted for clustering by place of residence are in parentheses. Dummies are included for missing regressors. * p < 0.10, ** p < 0.05, *** p < 0.01

85
Table A49: Ethnic gap in log wage for “ILO” employed, WOMEN (Ethnic classification based on
classification by interviewers)
WOMEN (1) (2) (3) (4) (5) (6) (7) (8)
Roma -0.18*** -0.09 -0.08 -0.04 -0.05 0.00 0.01 0.05
(0.05) (0.06) (0.06) (0.06) (0.07) (0.07) (0.07) (0.08)
Education level yes yes yes yes yes yes
Test scores and grades in grade 8
yes yes yes yes yes yes
Non-cognitive skills at age 15
yes yes yes yes
Temporary worker / Employed in public works programs
yes yes yes
Health yes yes
Network yes yes
County FE yes
Adjusted R2 0.01 0.04 0.06 0.06 0.09 0.13 0.14 0.16
N 832 832 832 832 832 832 832 832
Ethnic classification based on classification by interviewers. Ordinary least squares. Dependent variable: ln(wage). Robust standard errors adjusted for clustering by place of residence are in parentheses. Dummies are included for missing regressors. * p < 0.10, ** p < 0.05, *** p < 0.01

86
Table A50: Ethnic gap in log wage for permanently employed, WOMEN (Ethnic classification based
on adolescents’ self-identification)
WOMEN (1) (2) (3) (4) (5) (6) (7)
Roma -0.13* -0.09 -0.06 -0.04 -0.03 -0.02 -0.01
(0.08) (0.08) (0.08) (0.08) (0.09) (0.09) (0.09)
Education level yes yes yes yes yes
Test scores and grades in grade 8
yes yes yes yes yes
Non-cognitive skills at age 15
yes yes yes
Health yes yes
Network yes
County FE yes
Adjusted R2 0.00 0.04 0.04 0.05 0.08 0.08 0.11
N 779 779 779 779 779 779 779
Ethnic classification based on adolescents’ self-identification. Ordinary least squares. Dependent variable: ln(wage). Robust standard errors adjusted for clustering by place of residence are in parentheses. Dummies are included for missing regressors. * p < 0.10, ** p < 0.05, *** p < 0.01
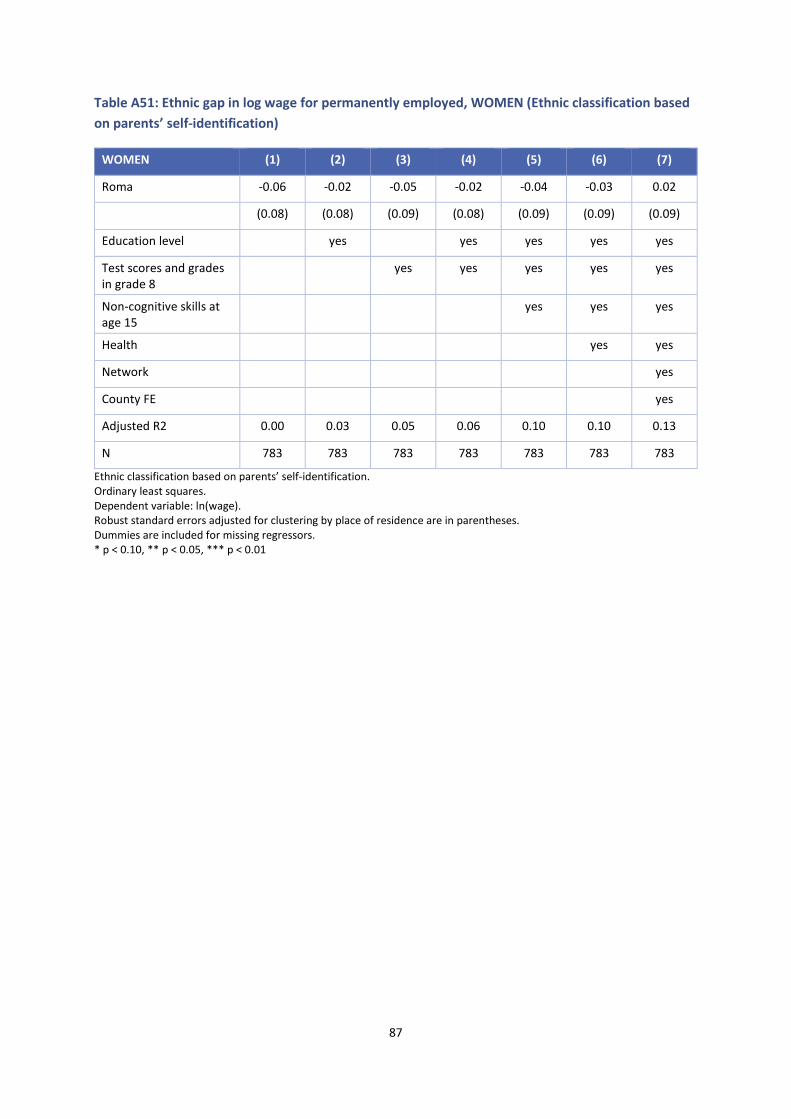
87
Table A51: Ethnic gap in log wage for permanently employed, WOMEN (Ethnic classification based
on parents’ self-identification)
WOMEN (1) (2) (3) (4) (5) (6) (7)
Roma -0.06 -0.02 -0.05 -0.02 -0.04 -0.03 0.02
(0.08) (0.08) (0.09) (0.08) (0.09) (0.09) (0.09)
Education level yes yes yes yes yes
Test scores and grades in grade 8
yes yes yes yes yes
Non-cognitive skills at age 15
yes yes yes
Health yes yes
Network yes
County FE yes
Adjusted R2 0.00 0.03 0.05 0.06 0.10 0.10 0.13
N 783 783 783 783 783 783 783
Ethnic classification based on parents’ self-identification. Ordinary least squares. Dependent variable: ln(wage). Robust standard errors adjusted for clustering by place of residence are in parentheses. Dummies are included for missing regressors. * p < 0.10, ** p < 0.05, *** p < 0.01

88
Table A52: Ethnic gap in log wage for permanently employed, WOMEN (Ethnic classification based
on classification by interviewers)
WOMEN (1) (2) (3) (4) (5) (6) (7)
Roma -0.12** -0.08 -0.08 -0.05 -0.07 -0.06 -0.02
(0.06) (0.06) (0.07) (0.06) (0.07) (0.07) (0.08)
Education level yes yes yes yes yes
Test scores and grades in grade 8
yes yes yes yes yes
Non-cognitive skills at age 15
yes yes yes
Health yes yes
Network yes
County FE yes
Adjusted R2 0.00 0.03 0.05 0.06 0.09 0.10 0.13
N 781 781 781 781 781 781 781
Ethnic classification based on classification by interviewers. Ordinary least squares. Dependent variable: ln(wage). Robust standard errors adjusted for clustering by place of residence are in parentheses. Dummies are included for missing regressors. * p < 0.10, ** p < 0.05, *** p < 0.01
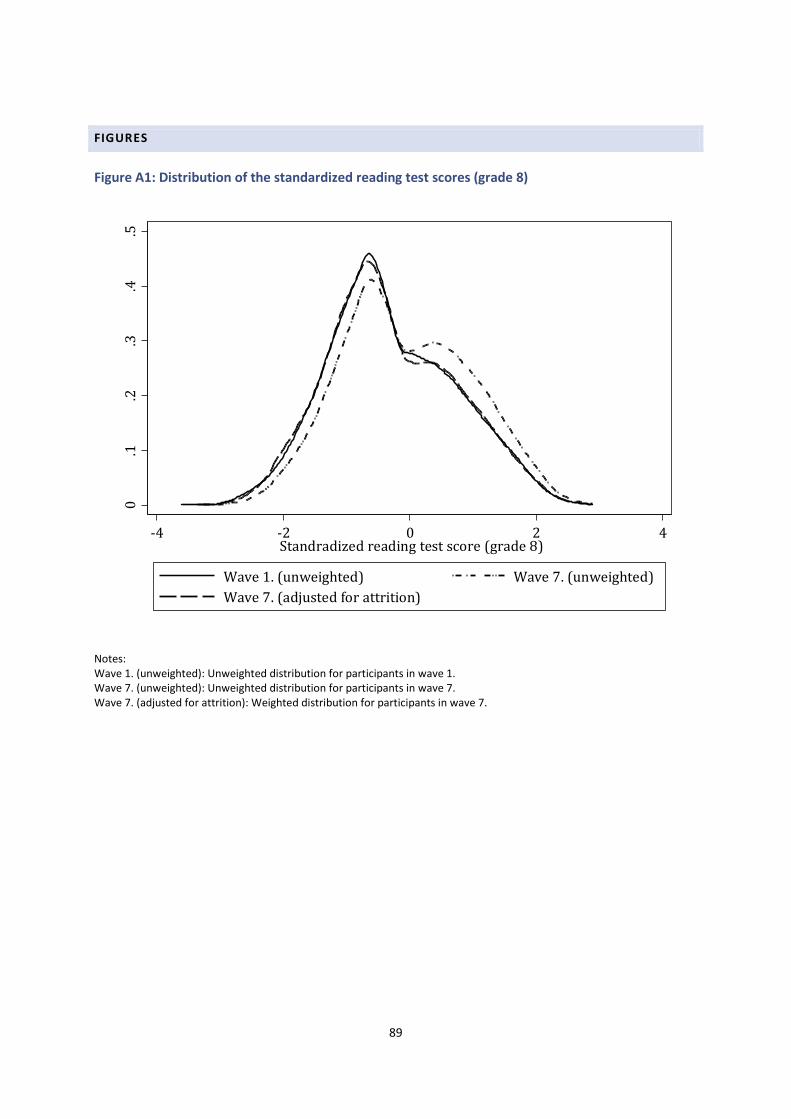
89
FIGURES
Figure A1: Distribution of the standardized reading test scores (grade 8)
Notes: Wave 1. (unweighted): Unweighted distribution for participants in wave 1. Wave 7. (unweighted): Unweighted distribution for participants in wave 7. Wave 7. (adjusted for attrition): Weighted distribution for participants in wave 7.
0.1
.2.3
.4.5
-4 -2 0 2 4Standradized reading test score (grade 8)
Wave 1. (unweighted) Wave 7. (unweighted)
Wave 7. (adjusted for attrition)
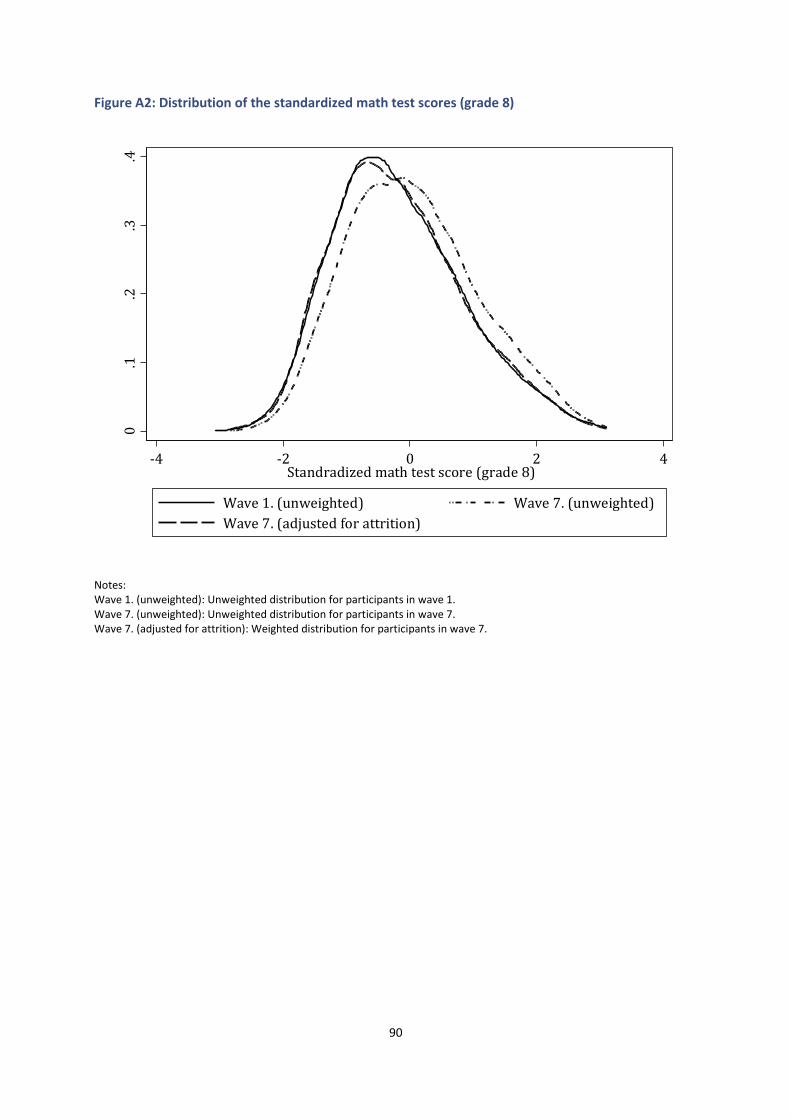
90
Figure A2: Distribution of the standardized math test scores (grade 8)
Notes: Wave 1. (unweighted): Unweighted distribution for participants in wave 1. Wave 7. (unweighted): Unweighted distribution for participants in wave 7. Wave 7. (adjusted for attrition): Weighted distribution for participants in wave 7.
0.1
.2.3
.4
-4 -2 0 2 4Standradized math test score (grade 8)
Wave 1. (unweighted) Wave 7. (unweighted)
Wave 7. (adjusted for attrition)

91
Figure A3: Distribution of GPA at the end of grade 8
Notes: Wave 1. (unweighted): Unweighted distribution for participants in wave 1. Wave 7. (unweighted): Unweighted distribution for participants in wave 7. Wave 7. (adjusted for attrition): Weighted distribution for participants in wave 7.
0.1
.2.3
.4.5
1 2 3 4 5GPA at the end of grade 8
Wave 1. (unweighted) Wave 7. (unweighted)
Wave 7. (adjusted for attrition)
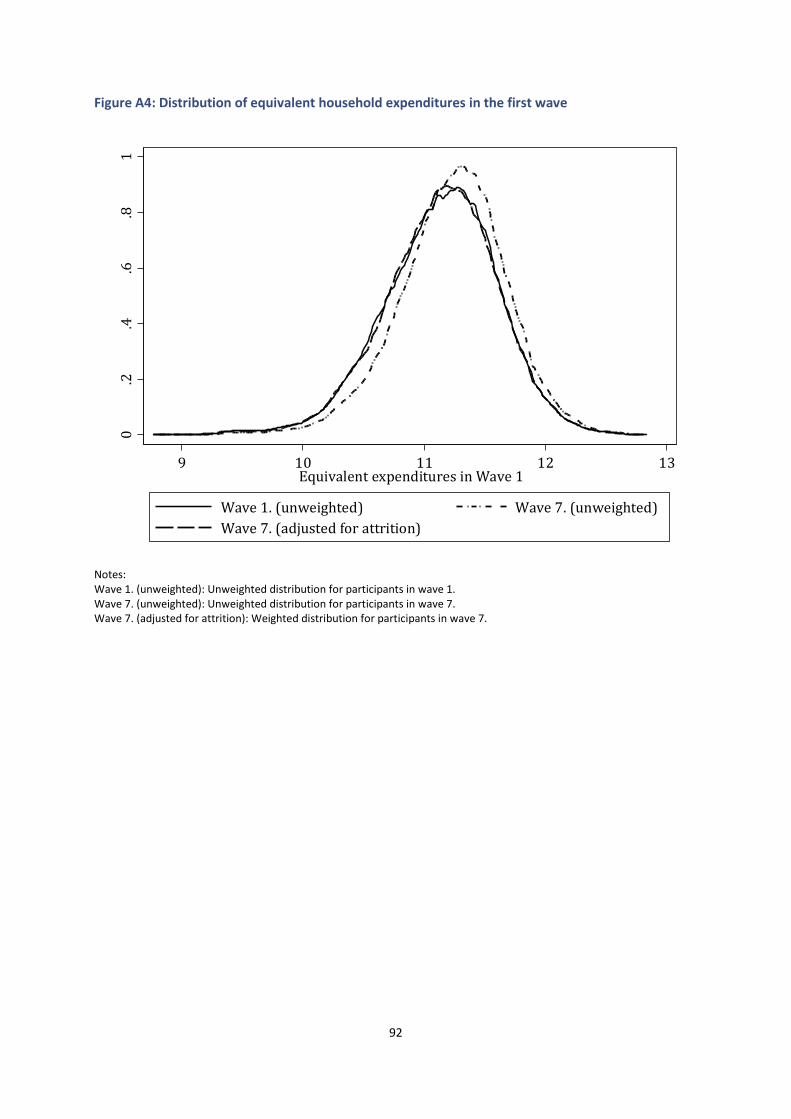
92
Figure A4: Distribution of equivalent household expenditures in the first wave
Notes: Wave 1. (unweighted): Unweighted distribution for participants in wave 1. Wave 7. (unweighted): Unweighted distribution for participants in wave 7. Wave 7. (adjusted for attrition): Weighted distribution for participants in wave 7.
0.2
.4.6
.81
9 10 11 12 13Equivalent expenditures in Wave 1
Wave 1. (unweighted) Wave 7. (unweighted)
Wave 7. (adjusted for attrition)

93
Figure A5: Employment rate by educational achievement (age 18-35, averaged over 2006-2012)
Source: CSO Labor Force Survey (2006-2012)
0
20
40
60
80
100
Em
plo
ym
en
t ra
te (
%)
18 20 23 26 29 32 35Age
0-7 years of primary school Primary school
Vocational training school Vocational secondary school
General secondary school College, university
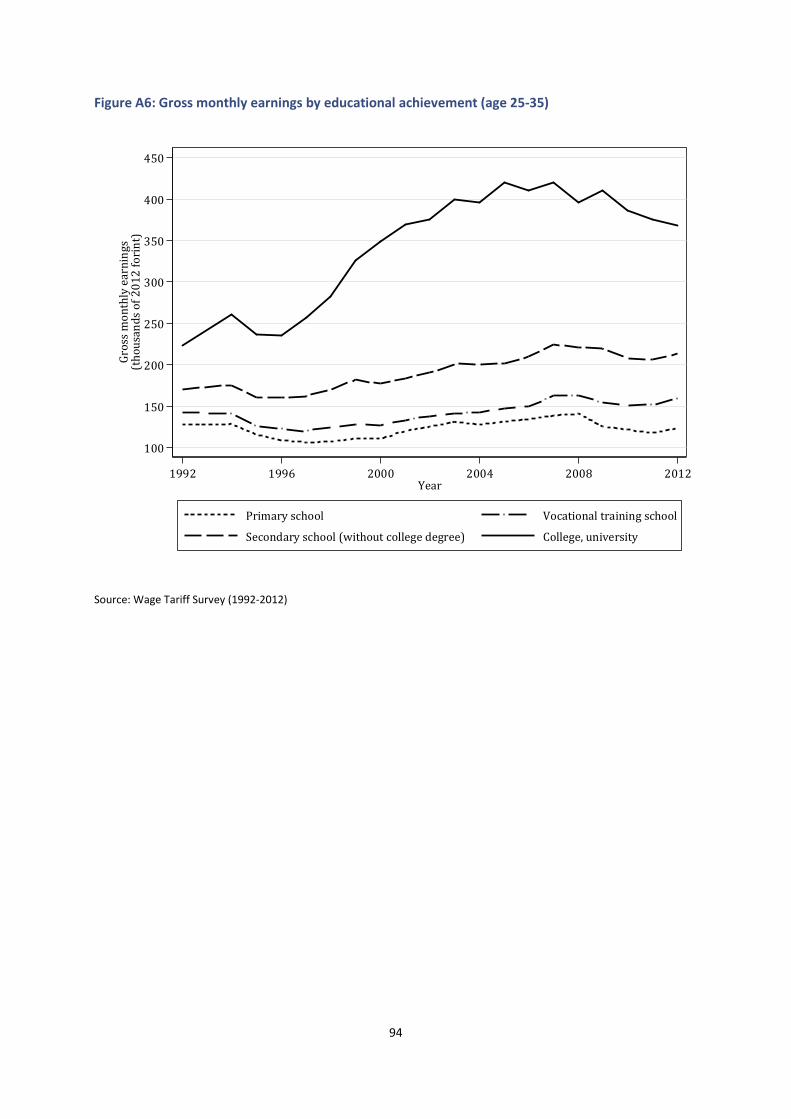
94
Figure A6: Gross monthly earnings by educational achievement (age 25-35)
Source: Wage Tariff Survey (1992-2012)
100
150
200
250
300
350
400
450
Gro
ss m
on
thly
ea
rnin
gs
(th
ou
san
ds
of
20
12
fo
rin
t)
1992 1996 2000 2004 2008 2012Year
Primary school Vocational training school
Secondary school (without college degree) College, university
95
REFERENCES
Ammermueller, A., & Pischke, J. [2009]. Peer Effects in European Primary Schools: Evidence from the Progress in International Reading Literacy Study. Journal of Labor Economics, 27(3), 315–348. doi:10.1086/603650
Belley, P., & Lochner, L. [2007]. The Changing Role of Family Income and Ability in Determining Educational Achievement. Journal of Human Capital, 1(1), 37–89. doi:10.1086/524674
Borghans, L., Duckworth, A. L., Heckman, J. J., & ter Weel, B. [2008]. The Economics and Psychology of Personality Traits. Journal of Human Resources, 43(4), 972–1059. doi:10.3368/jhr.43.4.972
Bradley, R. H., Corwyn, R. F., Caldwell, B. M., Whiteside-Mansell, L., Wasserman, G. A., & Mink, I. T. [2000]. Measuring the Home Environments of Children in Early Adolescence. Journal of
Research on Adolescence, 10(3), 247–288. doi:10.1207/SJRA1003_1
Burt, R. S. [1984]. Network items and the general social survey. Social Networks, 6(4), 293–339. doi:10.1016/0378-8733(84)90007-8
Campbell, K. E., & Lee, B. A. [1991]. Name generators in surveys of personal networks. Social
Networks, 13(3), 203–221. doi:10.1016/0378-8733(91)90006-F
Card, D. [1999]. The Causal Effect of Education on Earnings. In O. C. Ashenfelter & D. Card (Eds.), Handbook of Labor Economics (Vol. 3, Part A, pp. 1801–1863). Elsevier. Retrieved from http://www.sciencedirect.com/science/article/pii/S1573446399030114
Carneiro, P., & Heckman, J. J. [2003]. Human Capital Policy. In J. J. Heckman, A. B. Krueger, & B. M. Friedman (Eds.), Inequality in America: What Role for Human Capital Policies? (pp. 77–239). Cambridge: MIT Press.
Cherng, H.-Y. S., Calarco, J. M., & Kao, G. [2012]. Along for the Ride Best Friends’ Resources and Adolescents’ College Completion. American Educational Research Journal, 0002831212466689. doi:10.3102/0002831212466689
Chetty, R., Friedman, J. N., & Rockoff, J. E. [2011]. The Long-Term Impacts of Teachers: Teacher
Value-Added and Student Outcomes in Adulthood (NBER Working Paper No. 17699). National Bureau of Economic Research.
Coelli, M. B. [2011]. Parental job loss and the education enrollment of youth. Labour Economics, 18(1), 25–35. doi:10.1016/j.labeco.2010.04.015
Conti, G., Galeotti, A., Müller, G., & Pudney, S. [2013]. Popularity. Journal of Human Resources, 48(4), 1072–1094.
Crane, J. [1996]. Effects of Home Environment, SES, and Maternal Test Scores on Mathematics Achievement. The Journal of Educational Research, 89(5), 305–314. doi:10.1080/00220671.1996.9941332
Crivellaro, E. [2012]. Essays in Economics of Education (Ph.D. Thesis). Universitá Degli Studi Di Padova. Retrieved from http://paduaresearch.cab.unipd.it/5107/
Crosnoe, R., Cavanagh, S., & Elder, G. H. [2003]. Adolescent Friendships as Academic Resources: The Intersection of Friendship, Race, and School Disadvantage. Sociological Perspectives, 46(3), 331–352. doi:10.1525/sop.2003.46.3.331

96
Currie, J., & Almond, D. [2011]. Human capital development before age five. In O. Ashenfelter & D. Card (Eds.), Handbook of Labor Economics (Vol. 4, Part B, pp. 1315–1486). Elsevier. Retrieved from http://www.sciencedirect.com/science/article/pii/S0169721811024130
Duncan, G. J., & Murnane, R. J. [2011]. Whither Opportunity?: Rising Inequality, Schools, and
Children’s Life Chances. New York and Chicago: Russell Sage Foundation.
Ferguson, R. F. [1998]. Can schools narrow the Black–White test score gap? In C. Jencks & M. Phillips (Eds.), The Black–White test score gap (pp. 318–374). Washington, DC, US: Brookings Institution Press.
Flabbi, L., Paternostro, S., & Tiongson, E. R. [2008]. Returns to education in the economic transition: A systematic assessment using comparable data. Economics of Education Review, 27(6), 724–740. doi:10.1016/j.econedurev.2007.09.011
Fryer, R. G. [2011]. Racial inequality in the 21st century: the declining significance of discrimination. In O. Ashenfelter & D. Card (Eds.), Handbook of Labor Economics (Vol. 4, Part B, pp. 855–971). Elsevier. Retrieved from http://www.sciencedirect.com/science/article/pii/S0169721811024087
Granovetter, M. S. [1973]. The Strength of Weak Ties. American Journal of Sociology, 78(6), 1360–1380.
Guo, G., & Harris, K. M. [2000]. The mechanisms mediating the effects of poverty on children’s intellectual development. Demography, 37(4), 431–447. doi:10.1353/dem.2000.0005
Hanushek, E. A., Kain, J. F., Markman, J. M., & Rivkin, S. G. [2003]. Does peer ability affect student achievement? Journal of Applied Econometrics, 18(5), 527–544. doi:10.1002/jae.741
Hanushek, E. A., Kain, J. F., & Rivkin, S. G. [2009]. New Evidence about Brown v. Board of Education : The Complex Effects of School Racial Composition on Achievement. Journal of Labor
Economics, 27(3), 349–383. doi:10.1086/600386
Harter, S. [1982]. The Perceived Competence Scale for Children. Child Development, 53(1), 87–97. doi:10.2307/1129640
Heckman, J. J. [2000]. Policies to foster human capital. Research in Economics, 54(1), 3–56. doi:10.1006/reec.1999.0225
Heckman, J. J. [2006]. Skill Formation and the Economics of Investing in Disadvantaged Children. Science, 312(5782), 1900–1902. doi:10.1126/science.1128898
Heckman, J. J. [2008]. Schools, Skills, and Synapses. Economic Inquiry, 46(3), 289–324. doi:10.1111/j.1465-7295.2008.00163.x
Heckman, J. J., & Kautz, T. [2012]. Hard evidence on soft skills. Labour Economics, 19(4), 451–464. doi:10.1016/j.labeco.2012.05.014
Heckman, J. J., Pinto, R., & Savelyev, P. [2013]. Understanding the Mechanisms through Which an Influential Early Childhood Program Boosted Adult Outcomes. American Economic Review, 103(6), 2052–86. doi:10.1257/aer.103.6.2052
Heckman, J. J., & Rubinstein, Y. [2001]. The Importance of Noncognitive Skills: Lessons from the GED Testing Program. American Economic Review, 91(2), 145–149. doi:10.1257/aer.91.2.145
97
Heckman, J. J., Stixrud, J., & Urzua, S. [2006]. The Effects of Cognitive and Noncognitive Abilities on Labor Market Outcomes and Social Behavior. Journal of Labor Economics, 24, 411–482.
Horn, D. [2013]. Diverging performances: the detrimental effects of early educational selection on equality of opportunity in Hungary. Research in Social Stratification and Mobility, 32, 25–43. doi:10.1016/j.rssm.2013.01.002
Jackson, M. O. [2009]. Networks and Economic Behavior. Annual Review of Economics, 1(1), 489–511. doi:10.1146/annurev.economics.050708.143238
Jackson, M. O. [2011]. An Overview of Social Networks and Economic Applications. In J. Benhabib, A. Bisin, & M. O. Jackson (Eds.), Handbook of Social Economics (Vol. 1, pp. 511–585). North-Holland. Retrieved from http://www.sciencedirect.com/science/article/pii/B9780444531872000127
Kertesi, G., & Kézdi, G. [2011a]. Roma employment in Hungary after the post-communist transition. Economics of Transition, 19(3), 563–610. doi:10.1111/j.1468-0351.2011.00410.x
Kertesi, G., & Kézdi, G. [2011b]. The Roma/Non-Roma Test Score Gap in Hungary. The American
Economic Review, 101(3), 519–525. doi:10.1257/aer.101.3.519
Kertesi, G., & Kézdi, G. [2014]. On the test score gap between Roma and non-Roma students in
Hungary and its potential causes (Budapest Working Papers on the Labour Market No. 2014/1). Institute of Economics, CERSHAS - Department of Human Resources, Corvinus University of Budapest.
Kézdi, G., Köllő, J., & Varga, J. [2009]. The failures of “uncertified” vocational training. In K. Fazekas & J. Köllő (Eds.), The Hungarian Labour Market – Review and Analysis (pp. 95–143). Budapest: Institute of Economics, HAS and National Employment Foundation.
Kinsler, J., & Pavan, R. [2011]. Family Income and Higher Education Choices: The Importance of Accounting for College Quality. Journal of Human Capital, 5(4), 453–477. doi:10.1086/663649
Ladányi, J., & Szelényi, I. [2001]. The social construction of roma ethnicity in Bulgaria, Romania and Hungary during market transition. Review of Sociology, 7(2), 79–89. doi:10.1556/RevSoc.7.2001.2.5
Linver, M. R., Brooks-Gunn, J., & Kohen, D. E. [2002]. Family processes as pathways from income to young children’s development. Developmental Psychology, 38(5), 719–734. doi:10.1037/0012-1649.38.5.719
Lochner, L., & Monge-Naranjo, A. [2011]. Credit Constraints in Education (NBER Working Paper No. 17435). National Bureau of Economic Research.
Marin, A., & Hampton, K. N. [2007]. Simplifying the Personal Network Name Generator Alternatives to Traditional Multiple and Single Name Generators. Field Methods, 19(2), 163–193. doi:10.1177/1525822X06298588
Mott, F. L. [2004]. The Utility of the HOME-SF Scale for Child Development Research in a Large National Longitudinal Survey: The National Longitudinal Survey of Youth 1979 Cohort. Parenting, 4(2-3), 259–270. doi:10.1080/15295192.2004.9681273
Rivkin, S. G., Hanushek, E. A., & Kain, J. F. [2005]. Teachers, Schools, and Academic Achievement. Econometrica, 73(2), 417–458. doi:10.1111/j.1468-0262.2005.00584.x

98
Roberts, B. W., Kuncel, N. R., Shiner, R., Caspi, A., & Goldberg, L. R. [2007]. The Power of Personality: The Comparative Validity of Personality Traits, Socioeconomic Status, and Cognitive Ability for Predicting Important Life Outcomes. Perspectives on Psychological Science, 2(4), 313–345. doi:10.1111/j.1745-6916.2007.00047.x
Rosenberg, M. [1965]. Society and the adolescent self-image. Princeton: Princeton University Press.
Rotter, J. B. [1966]. Generalized expectancies for internal versus external control of reinforcement. Psychological Monographs: General and Applied, 80(1), 1–28. doi:10.1037/h0092976
Schacter, J., & Thum, Y. M. [2004]. Paying for high- and low-quality teaching. Economics of Education
Review, 23(4), 411–430. doi:10.1016/j.econedurev.2003.08.002
Stearns, E. [2010]. Long-Term Correlates of High School Racial Composition: Perpetuation Theory Reexamined. Teachers College Record, 112(6), 1654–1678.
Todd, P. E., & Wolpin, K. I. [2007]. The Production of Cognitive Achievement in Children: Home, School, and Racial Test Score Gaps. Journal of Human Capital, 1(1), 91–136. doi:10.1086/526401
Wenglinsky, H. [2001]. Teacher classroom practices and student performance. How schools can make
a difference (Research Report No. RR-01-19). Princeton: Educational Testing Service, Statistics & Research Division.