how can we reframe the future during the uncertainty of today?
TRANSCRIPT

How can we reframe the future during the uncertainty of today?EY Attractiveness Survey
Malta
October 2020

EY Attractiveness Survey Malta October 2020
The world has changed. Some of the changes that we have witnessed this year appear to have taken place in the blink of an eye. Other shifts that we are witnessing may have actually been in the making for years.
The annual Malta Attractiveness Survey, launched way back in 2005, has over the years captured some of these changes through the lenses of foreign direct investors in Malta. It is my pleasure to present yet again these crucial findings this year as we overcome the short-term COVID-19 challenges and begin our strategic quest to look beyond.
As most of the world’s economies are officially in a recession, what happens next is far from certain. In an increasingly connected and global world, Malta has not been spared the impact of the pandemic. Concurrently, we have experienced a number of changes within our landscape. The country is also undergoing a Moneyval evaluation.
This year’s survey has therefore been undertaken in an unprecedented context. As in prior years, we have asked foreign investors whether Malta is attractive, and what they like and dislike about the country.
The majority of respondents have stated that they find Malta to be an attractive destination for FDI. Yet, at 62%, this figure is the lowest our survey has ever registered. Additionally, one out of every four investors now states that Malta is not attractive. Surely this warning needs heeding.
They say beauty lies in the eye of the beholder, and what makes us attractive from the point of view of investors is also changing. Investors still appreciate our social fabric. Human resource-related criteria also score relatively well.
Yet the stability of our political, legal and regulatory environment has been dealt another blow and is now considered one of our weakest points. It is difficult to grasp that it was in second place just five years ago.
Equally, although we may pride ourselves on our corporate tax regime, in a post-COVID-19 world, this cannot be our only trump card. The varying national stimulus programs will certainly create divergent paths of recovery and consequences in different countries for years to come.
Reframing the futureForeword
Concluding messages
Methodology
1 FDI facts at aglance
New economic reality
EY’s bolt-on surveys:sectors in depth
Perception
Contents
Executive summary
32
4
10
3
43
46
4
15
36
18
EY’s Attractiveness surveys are widely recognized by the clients, the media and major public stakeholders as key sources of insight into foreign direct investment (FDI).
Examining the attractiveness of a particular region or country as an investment destination, the surveys are designed to help businesses make sound financial decisions, and governments to remove barriers to future growth. A two-step methodology analyzes both the reality and perception of FDI in the respective country or region. Findings are based on the views of representative panels of international and local opinion leaders and decision-makers.
For more information, please visit ey.com/attractiveness.

EY Attractiveness Survey Malta October 2020 3
Foreword
Once again, our innovation capacity is also perceived to be weak. Should this be the case after so much effort in the field of technology? At a time when the island has seen continual investment in the digital and gaming sectors?
Our weaknesses are not set in stone. If reputation and governance deficiencies are robustly addressed, can the stability of our political, legal and regulatory environment not once again move up on our attractiveness scoreboard?
There are still positive signals. Four out of every five investors believe they will still be here in 10 years’ time. Could this be an indicator that, despite our shortcomings, a number of investors are still fond of Malta and want to be a part of our success going forward?
Our experience in the regulation of the telecommunications sector surely is something to emulate in other sectors. Despite the many challenges COVID-19 has brought with it, the island may be more connected – digitally – than ever before. And the telecoms sector may have played a role here. Survey respondents have demonstrated a clear appreciation.
The pandemic has also shown us the importance of not only investing in physical infrastructure but also in health and education.
Is this the time to pause and reflect? If we reflect with a new mindset that we are indeed as connected and able as any other country on the continent, should we take the opportunity to reframe our future?
Potentially, a new economic model that is less based on numbers – be it number of cars, tourists, permits, or property sales – may be needed. One that focuses more on well-being and the quality of life of our residents. An economic model where the benefits of an attractive tax system are eclipsed by the strength of our talent pool, digital infrastructure, innovation environment, quality of life and social fabric.
Should we exploit our environmental landscapes for what they truly are — natural untouched beauty? Protecting them for the next generation and generations after. These, along with our rich heritage, climate and geographical position, remain strong selling points, but only if we safeguard them.
Ronald Attard Country Managing Partner,EY Malta
Should we exploit the presence of a strong gaming hub to nurture an innovative and entrepreneurial spirit in other industries? Those industries that revolve around areas that COVID-19 has reminded us are so important – health including MedTech, education and logistics – perhaps delivered digitally. Is there an opportunity to develop a plan for Gozo that is centered around sustainability and eco-tourism? Could the blue economy be a focal point for research activities, given that we are an island nation?
We also need to be clear on how to measure the extent of our success. Globally, the combined impacts of COVID-19, climate change and economic inequality have created an urgency for nations and businesses to embrace long-term, sustainable value creation that prioritizes the needs of the people and the planet through broad-based economic prosperity. It is great to see these global efforts at a corporate level and it is time for us to follow suit.
It is not just us suggesting this. A look at our 2020 Generate Survey shows that young people in Malta – millennials and Gen Z – consider overdevelopment and the environment to be two of the three greatest challenges we face as a nation, right up there with tackling COVID-19. We must safeguard what these generations believe is most important and ensure Malta is indeed an attractive home for them.
Our FDI respondents delivered a strong message on what must be done, and most really want to be here. Now is the time to embrace the message and revisit our future. It is up to us whether to maintain the current course, adjust it or reframe it altogether.
ey.com/attractiveness

EY Attractiveness Survey Malta October 20204
1 FDI facts at a glance
2 Perception
Executive summary
32foreign greenfield projects
17expansion by foreign companies
€187boutward FDI investments
€3bFDI flows in Malta
Investors sound a note of caution on Malta’s overall FDI attractiveness index with a 15% decline …
The largest decrease ever recorded, and the number of investors who said Malta is not attractive has also increased and now comprises a quarter of total respondents.
Attractiveness index
77% 62%
20202019
15% 25%
Yes
No20202019
… while, yet again, corporate taxation comes out on top of the FDI attractiveness scoreboard …
While still favorable, the attractiveness of Malta’s stability of social climate has decreased by 11% and is now in third place, and the telecommunications infrastructure is in second place for the first time.
82%
68%
64%
Attractiveness scoreboard — top parameters
Corporate taxation
Telecommunications infrastructure
Stability of social climate
… and the stability and transparency of the political, legal and regulatory environment is now viewed as Malta’s least attractive parameter.
This result reflects the sentiments shared by many FDI investors on the need to improve governance and tackle reputational issues. Transport and logistics and R&D and innovation environment scored low in previous years and more must be done to improve these parameters.
Attractiveness scoreboard — areas for improvement
25%
24%
19%
Transport and logistics
R&D and innovation environment
Stability and transparency of political, legal and regulatory
environment

EY Attractiveness Survey Malta October 2020
ey.com/attractiveness
The environment should be a priority in order to attract FDI …
Almost all FDI investors have indicated that, as part of its COVID-19 reboot strategy, the Maltese Government should prioritize environmentally sustainable practices (94%).
Investors believe funds and incentives for environmentally sustainable practices will encourage companies to increase their sustainable actions.
Taxes and disincentive measures for environmentally unsustainable practices, and stricter environmental laws and enforcement, are joint second in foreign investors’ priorities.
… Despite all the challenges, a large majority still see their company present in Malta in 10 years’ time …
5
believe they will be operating in Malta in 10 years’ time.80%
While the future may be even harder to predict as a result of COVID-19 and the global economic fallout, it is positive that 80% of investors, the same as in 2019, believe they will be present in Malta in 10 years’ time.
believe environmentally sustainable practices should be prioritized.
94%
… Telecommunications services scored high levels of satisfaction throughout COVID-19.
Satisfaction levels were consistently high across the three surveyed telecommunications services.
Satisfaction levels
Fixed broadband 85%
Mobile voice telephony 88%
Mobile data 82%
… but there is a strong message to prioritize Malta’s reputation to remain globally competitive.
1 Reputation and brand
2 Education and skills
3 Strengthen institutions, enforcement and monitoring
Priorities to remain globally competitive
FDI investors ranked a new inclusion, reputation and brand, as the number one priority for Malta to remain globally competitive.
EY Attractiveness Survey Malta October 2020
Executive summary
6
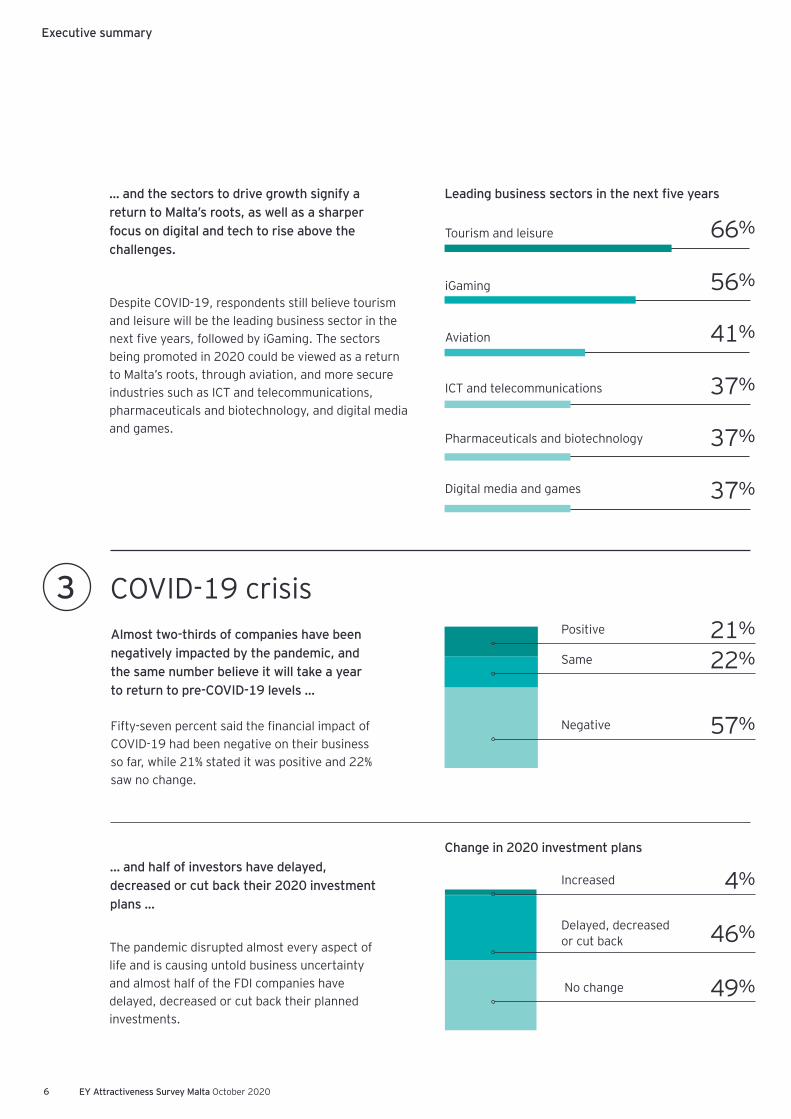
… and the sectors to drive growth signify a return to Malta’s roots, as well as a sharper focus on digital and tech to rise above the challenges.
Despite COVID-19, respondents still believe tourism and leisure will be the leading business sector in the next five years, followed by iGaming. The sectors being promoted in 2020 could be viewed as a return to Malta’s roots, through aviation, and more secure industries such as ICT and telecommunications, pharmaceuticals and biotechnology, and digital media and games.
Leading business sectors in the next five years
Tourism and leisure 66%
iGaming 56%
Aviation 41%
ICT and telecommunications 37%
Pharmaceuticals and biotechnology 37%
Digital media and games 37%
3 COVID-19 crisisAlmost two-thirds of companies have been negatively impacted by the pandemic, and the same number believe it will take a year to return to pre-COVID-19 levels …
Fifty-seven percent said the financial impact of COVID-19 had been negative on their business so far, while 21% stated it was positive and 22% saw no change.
Positive 21%
Same 22%
Negative 57%
… and half of investors have delayed, decreased or cut back their 2020 investment plans …
The pandemic disrupted almost every aspect of life and is causing untold business uncertainty and almost half of the FDI companies have delayed, decreased or cut back their planned investments.
Increased 4%
Delayed, decreased or cut back 46%
No change 49%
Change in 2020 investment plans
EY Attractiveness Survey Malta October 2020
ey.com/attractivenessExecutive summary
7
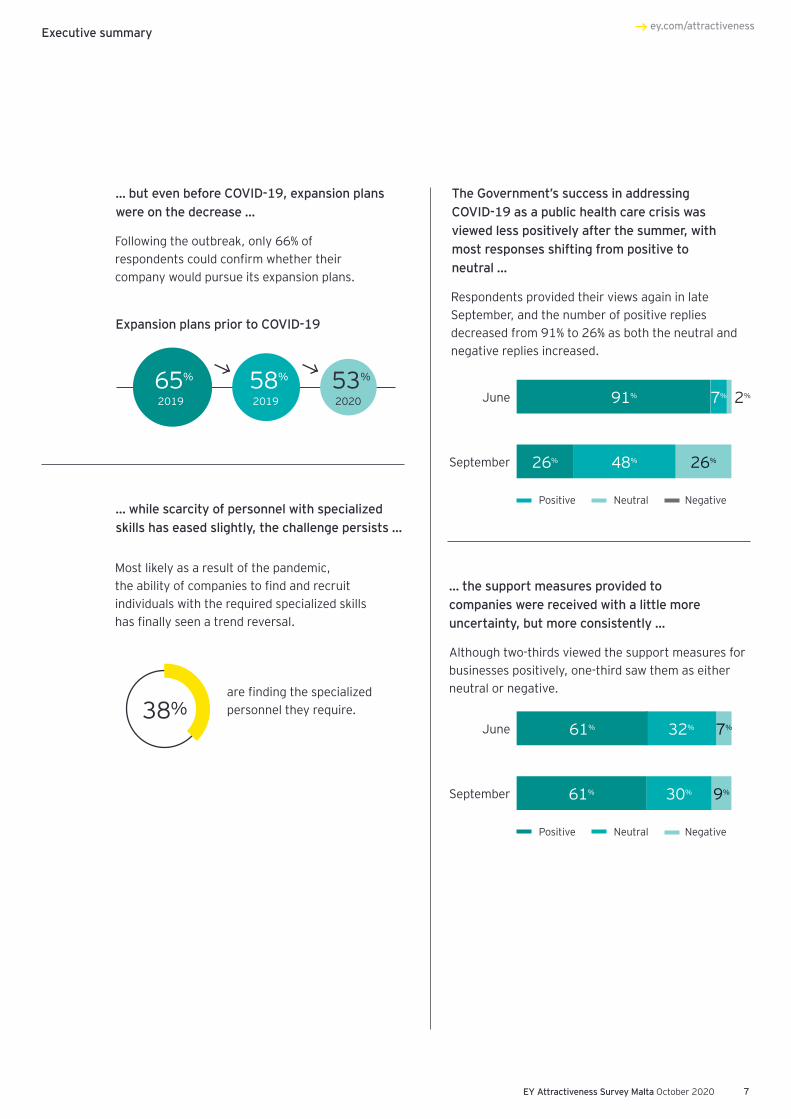
… while scarcity of personnel with specialized skills has eased slightly, the challenge persists …
Most likely as a result of the pandemic, the ability of companies to find and recruit individuals with the required specialized skills has finally seen a trend reversal.
are finding the specialized personnel they require.38%
… but even before COVID-19, expansion plans were on the decrease …
Following the outbreak, only 66% of respondents could confirm whether their company would pursue its expansion plans.
Expansion plans prior to COVID-19
53%
202065%
201958%
2019
The Government’s success in addressing COVID-19 as a public health care crisis was viewed less positively after the summer, with most responses shifting from positive to neutral …
Respondents provided their views again in late September, and the number of positive replies decreased from 91% to 26% as both the neutral and negative replies increased.
Positive Neutral Negative
June 91% 7% 2%
September 26% 48% 26%
… the support measures provided to companies were received with a little more uncertainty, but more consistently …
Although two-thirds viewed the support measures for businesses positively, one-third saw them as either neutral or negative.
Positive Neutral Negative
June 61% 32% 7%
September 61% 30% 9%

EY Attractiveness Survey Malta October 2020
Official languages
Maltese English
VAT rate
18%
Biggest imports
Machinery and transport equipment
€3,054.4mMineral fuels, lubricants and related materials
€1,865.1m
Imports
€7,415.6m5
Biggest exports
Mineral fuels, lubricants and related materials
€1,109.0m
Exports
€3,749.1m
Malta — facts
1 Eurostat, 2010.2 NSO, 2020.
3 Eurostat, 2020.4 NSO, 2020.
5 NSO, 2020.
1964
Commonwealth membership
2004
EU membership
2008
Euro currency
Milestones
Machinery and transport equipment
€1,025.5m
Unemployment rate3
May 20204.2%
Gross domestic product (GDP) 2019
€13.2b6.8%2
Inbound tourism
Inbound tourist trips from January to December 2019 reached a total of 2.8 million, an increase of 5.9% compared with the same period in 2018.4
2.8m5.9%
Area
316km2Population
493,5591
8

EY Attractiveness Survey Malta October 2020
ey.com/attractivenessMain features of country forecast: Malta
Figure 2: GDP identity from production (output) side by period2014 2015 2016 2017 2018 2019
Gross value added (GVA) (€000) 7,472,365 8,520,153 9,153,545 9,976,762 10,897,252 11,715,404
Agriculture, forestry and fishing 97,082 104,335 126,194 88,793 107,805 105,677
Mining and quarrying; manufacturing; electricity, gas, steam and air conditioning supply; water supply; sewerage, waste management and remediation activities
858,029 862,347 924,448 995,894 1,109,922 1,151,322
Construction 739,209 722,233 742,501 823,987 914,664 948,181Wholesale and retail trade; transportation and storage; accommodation and food service activities 300,848 327,506 325,616 364,315 393,109 447,846
Information and communication 1,632,258 1,915,574 1,985,423 2,131,751 2,309,611 2,445,413Financial and insurance activities 466,031 559,604 621,911 687,117 733,352 786,659Real estate activities 516,335 546,391 586,803 617,233 642,821 657,413Professional, scientific and technical activities; administrative and support service activities 383,067 442,172 475,139 466,197 514,708 551,619
Public administration and defense; compulsory social security; education; human health and social work activities 858,738 1,089,126 1,217,418 1,487,472 1,646,095 1,813,618
Arts, entertainment and recreation, repair of household goods and other services 1,362,429 1,462,708 1,555,946 1,674,096 1,808,487 1,968,424
GDP 8,507,274 9,628,043 10,338,946 11,284,404 12,366,313 13,208,474Rate of growth (%) 11.3% 13.2% 7.4% 9.1% 9.6% 6.8%
Source: NSO, 2020.
Figure 1: Main features of country forecast: Malta2018 Annual percentage change
Current prices (¤m)
% GDP 2000-15 2016 2017 2018 2019 2020 2021
GDP 12,323.8 100 3.4 5.7 6.7 6.8 5.0 4.2 3.8Private consumption 5,392.6 43.8 2.2 2.4 3.3 7.3 4.2 3.8 3.7Public consumption 2,005.6 16.3 2.8 – 3.0 2.5 12.6 12.7 3.6 3.6
Gross fixed capital formation 2,338.6 19.0 5.0 – 0.3 – 7.2 –1.8 10.0 9.5 5.5
Of which: equipment 768.9 6.2 – 13.0 – 35.1 –11.0 – – –Exports (goods and services) 17,853.0 144.9 5.6 4.5 4.8 2.6 1.7 1.8 1.8Imports (goods and services) 15,279.5 124.0 5.3 1.6 – 0.4 2.6 2.6 2.1 1.8Gross national income (GNI) (GDP deflator) 11,354.9 92.1 3.0 2.3 6.9 7.1 3.7 4.7 3.8
Contribution to GDP growth: Domestic demand 2.9 0.6 0.2 4.8 5.8 4.2 3.4Inventories – 0.2 0.4 –1.3 1.5 – 0.1 0.0 0.0Net exports 0.7 4.7 7.8 0.5 –0.7 0.0 0.4
Employment 1.8 4.3 8.1 5.4 4.0 3.0 2.5Unemployment rate (a) 6.6 4.7 4.0 3.7 3.6 3.5 3.6Compensation of employees per head 3.6 2.9 – 0.7 2.3 2.4 3.4 3.0Unit labor cost, whole economy 2.0 1.6 0.6 1.0 1.4 2.4 1.7Real unit labor cost –0.4 0.2 – 1.7 –1.1 –0.7 0.3 –0.3Saving rate of households (b) – – – – – – –GDP deflator 2.5 1.4 2.4 2.1 2.1 2.0 2.1Harmonized index of consumer prices 2.2 0.9 1.3 1.7 1.6 1.7 1.7Terms of trade of goods 0.8 – 4.2 –4.9 3.7 1.8 1.4 1.3Trade balance (goods) (c) –15.8 –18.3 –12.6 –12.0 –11.9 –11.7 –11.3Current account balance (c) –3.2 3.8 10.5 9.8 9.0 8.5 8.2Net lending (+) or borrowing (–) compared with rest of world (ROW) (c) –1.8 4.1 11.0 10.8 10.0 9.5 9.2
General government balance (c) –3.7 0.9 3.4 1.9 1.2 1.0 1.0Cyclically adjusted budget balance (d) –3.6 0.0 2.6 0.8 0.5 0.8 1.3Structural budget balance (d) – 0.1 2.8 0.8 0.5 0.8 1.3General government gross debt (c) 65.8 55.5 50.3 45.8 43.3 41.0 38.7
(a) As % of total labor force; (b) gross saving divided by adjusted gross disposable income; (c) as a % of GDP; (d) as a % of potential GDP. Source: Eurostat Autumn Forecast 2020.
9

10 EY Attractiveness Survey Europe May 2020
1The following chapter presents FDI facts and information from 2019 and therefore before the COVID-19 crisis. This information remains relevant as a snapshot of where the country found itself from an FDI standpoint before March 2020. The economic realities since COVID-19 are outlined in the next chapter.
FDI facts at a glance

EY Attractiveness Survey Malta October 2020
ey.com/attractivenessFDI facts at a glance
Taking stock
During 2019, the efforts of Malta Enterprise (ME) continued with the approval of 32 foreign greenfield projects and 17 expansions by foreign companies. ME also approved 114 projects piloted by Maltese investors.
ME has consolidated the present base of FDIs, simultaneously attracting new greenfield investments in logistics, life sciences (including medical cannabis), advanced manufacturing and tech projects, which include activities related to AI-powered digital identity verification, natural language processing (NLP) and digital games. These projects originated from around the globe, including the UK, Australia, Israel, Italy, Canada, India, the US, Turkey and Switzerland.
Expansions continued to materialize across all major high value-added sectors, such as aviation, electronics, advanced manufacturing, life sciences, MedTech, ICT and digital media, further consolidating Malta’s productive sectors.
The Safi Aviation Park, Malta Life Sciences Park and Malta Digital Hub continue to grow and are nearing full capacity. ME continues to explore the development of additional space to match the increase in demand that is forecast.
Figure 3: FDI project applications approved by ME
New FDI Foreign expansions
Year Projects approved
Average investment
per application
(€m)
Average employment
per application
Average investment
per employee (€)
Projects approved
Average investment
per application
(€m)
Average employment
per application
Average investment
per employee (€)
2007 25 1.84 39 46,843 11 1.00 31 32,544
2008 13 1.67 40 41,892 9 0.83 16 53,571
2009 12 4.79 54 88,598 6 4.48 50 90,572
2010 2 0.16 58 2,783 2 4.10 73 56,552
2011 9 14.43 44 325,564 6 3.48 43 81,323
2012 2 1.05 19 55,263 10 2.37 22 106,757
2013 36 1.78 33 53,461 15 2.83 22 127,246
2014 28 1.33 37 35,369 15 3.66 39 92,749
2015 20 0.78 29 26,587 10 2.04 24 84,651
2016 11 12.7 48 261,910 15 3.82 41 94,243
2017 19 2.3 24 96,872 12 8.50 62 136,682
2018 26 2.6 37 69,175 18 3.0 9 328,577
2019 32 3.2 25 129,488 17 0.9 14 67,175
Source: ME, 2019.
11

EY Attractiveness Survey Malta October 2020
Figure 4: FDI in Malta — stock position: economic activities
The National Statistics Office (NSO) reports that the stock position of FDI in Malta at the end of 2019 amounted to €187.9 billion, an increase of €8.5 billion compared with the corresponding month in 2018. A total of €183.3 billion was
attributable to financial and insurance activities, which is an increase from previous years and makes up 97.6% of the total figure. This amounts to an increase of around €8 billion compared with the corresponding period in the previous year.
Malta’s stock position
Jun 2016 Dec 2016 Jun 2017 Dec 2017 Jun 2018 Dec 2018 Jun 2019 Dec 2019
€m €m €m €m €m €m €m €m
Manufacturing 850 860 858 918 944 1,070 1,064 1,100
Transportation, accommodation and real estate activities
1,775 1,810 1,891 1,898 1,954 2,028 2,231 2,298
Financial and insurance activities 154,344 158,965 163,000 167,273 171,036 175,318 179,098 183,318
Information and communication; professional, scientific and technical activities; arts, entertainment and recreation
497 317 926 436 1,347 504 1,798 674
Other activities 481 398 415 415 453 454 476 468
Total 157,948 162,352 167,092 170,942 175,735 179,375 184,669 187,861
Source: NSO news release 022/2020 and 158/2020.
2015 2016 2017 2018 2019
€m €m €m €m €m
Manufacturing 53 1 51 185 65
Transportation, accommodation and real estate activities 133 136 117 130 186
Financial and insurance activities 4,328 3,235 2,734 2,929 2,865
Information and communication; professional, scientific and technical activities; arts, entertainment and recreation
−28 195 107 81 123
Other activities 44 104 24 35 34
Total 4,531 3,673 3,035 3,362 3,275
Source: NSO news release 158/2020.
Figure 5: FDI flows in Malta
FDI facts at a glance
12

EY Attractiveness Survey Malta October 2020
ey.com/attractiveness
Malta was the first EU Member State to regulate the remote gaming market in 2004, and has since established itself as a significant gaming hub with global relevance. The gaming industry is estimated to have generated €1.6 billion in terms of gross value added (GVA) in 2019, a 9.6% growth compared with 2018. The gaming industry’s share in economic activity has increased to 13.3% in 2019, and according to the Malta Gaming Authority (MGA), it directly accounted for 7,417 jobs in full-time equivalent terms.
Excluding public administration, the gaming industry has consolidated its position as the third-largest sector in the economy, exceeding other sectors that were traditionally major economic pillars in terms of size of value added. Gaming contributes to the generation of value added through input-output linkages to other major sectors, including professional services, financial and ICT activities, hospitality and catering services, distributive trades and real estate.
iGaming
2017 2018 2019
B2C – Gaming Service License 554 207 195
Of which are B2C – Corporate Licenses
N/A 6 14
B2B – Critical Supply License 71 68 92
Of which are B2B – Corporate Licenses
N/A 68 92
Source: MGA Annual Report 2019.
Figure 6: Online gaming — distribution of licenses by category
FDI facts at a glance
13
Figure 7: Online gaming — applications and issuing of licenses
Source: MGA Annual Report 2019.
New license applications
209
2018
220
2017
89
2019
Licenses issued
93
2018
165
2017
53
2019

EY Attractiveness Survey Malta October 2020
Figure 8: Annual company registrations
The financial services sector and its importance to Malta’s economy has continued to grow in 2019. The continued increase in its GVA (by 2.3% in 2019) means that the sector contributed around 6% of the total Maltese economy, and 9.1% when other multiplier effects are taken into consideration. The financial services sector also accounted for 4.9% of total employment in Malta. Growth of this sector was an essential contributor to the country’s increased general employment rates in 2019.6
At the end of 2019, a total of 25 credit institutions and 52 financial institutions were licensed by the Malta Financial Services Authority (MFSA). These compare with 24 and 49 respectively as at the end of 2018. With regard to the local insurance sector, 2019 registered a total of 70 insurance, up from 66 undertakings in 2018. Mainly fueled by the changes in the global regulatory environment, the securities and investment services sector also expanded during 2019, closing the year with 153 licensed companies, an addition of 10.7
In 2019, the MFSA put in place a three-year Strategic Plan seeking to upgrade and extend its capabilities and operational effectiveness.8
In July 2019, The Council of Europe’s anti-money laundering body, Moneyval, called on the Maltese authorities to strengthen the practical application of their measures to combat money laundering and financing of terrorism. In line with these recommendations, the MFSA has made addressing financial crime, money laundering and the financing of terrorism a key strategic priority and articulated a Corporate Governance Framework in 2019 to define and distinguish between the roles and duties of its Board of Governors and those of the Executive Committee. The MFSA also set up a separate function within the authority for risk management, responsible for internal risk analysis and mitigation. Additional verification mechanisms have been introduced to further reduce risks of money laundering and financing terrorism, and the MFSA has enhanced its training and awareness efforts, including through cooperation with other local and international bodies.9
Financial services in Malta
2017 2018 2019
Limited companies 5,274 5,723 4,245
European Economic Interest Grouping
2 1 3
Overseas companies 50 89 87
Partnership en nom collectif 72 82 75
Partnership en commandite 32 27 23
Statute for European companies 2 1 2
Investment company with variable share capital
26 35 37
Total 5,458 5,958 4,472
Source: MBR Annual Report 2019.
6 Source: MFSA, Annual Report, 2019.7 Source: MFSA, Annual Report, 2019.8 Source: MFSA, Annual Report, 2019.9 Source: MFSA, Annual Report, 2019.
FDI facts at a glance
14
Figure 9: Redomiciliation of companies
Source: MBR Annual Report 2019.
2015 2016 2017 2018 2019
101
146
10910197
Redomiciliation of companies Total inward redomiciled companies

EY Attractiveness Survey Malta October 2020
ey.com/attractiveness
2real GDP growth rate before COVID-19 pandemic reached Malta in March 2020.
reduction in growth in real terms for 2020.
4.4% 5.4%
New economic reality
15

EY Attractiveness Survey Malta October 2020
Before the COVID-19 pandemic reached Malta in March 2020, the island experienced six years of consecutive GDP growth, including a peak of 10.8% growth in real terms.10 In 2019, Malta was one of the fastest-growing EU economies, with a 4.4% real GDP growth rate, mainly driven by domestic demand and a current account surplus that reached 9.8% of GDP.11 Important export sectors included personal and recreational services, financial and insurance services, and travel.
Travel and tourism is one of the major pillars and contributors to GDP, with 2019 reaching a new record of nearly 2.8 million inbound tourists, an increase of 5.9% compared with 2018.12 2019 also saw record active employment, with an increase of 5.8% compared with the previous year.13 This reflected the combined effect of a high influx of foreign workers and the implementation of other active labor market policies mostly targeted toward women and active aging. Inflation was also kept in line with the EU’s 2% threshold. In such a thriving economic environment, the Government recorded a surplus over four years and reduced its debt-to-GDP ratio significantly.14 Against this background, the Government initiated an infrastructure upgrade program, including roads, schools and waste management.
However, the economic growth could not be achieved without some unintended consequences. The flipside of such rapid growth meant that businesses were increasingly unable to find the required specialized skills in the labor market, a fact often exhibited by the Malta Attractiveness Surveys. Moreover, an increasing population and record numbers of tourists created huge infrastructural demands that put pressure on Malta’s already limited natural resources. A booming housing market saw property prices increase sharply, leading to affordability challenges in both the buying and rental markets.
Where we came from
Once the COVID-19 pandemic hit, government surplus funds served to partly cushion the immediate negative impacts. This was achieved through increased health expenditure and support to the business community, which saw their employees benefitting from several measures, including loan guarantee schemes, wage subsidies and a voucher scheme.
From January to August 2020, the Government spent an additional €510 million in capital and recurrent expenditure compared with the previous period.15 At the same time, government recurrent revenues decreased by €665.4 million, 20.9% lower than 2019, as lower economic activity translated into lower income taxes, VAT and other income, leading to a deficit of around €1 billion by the end of August 2020.16 In addition, the number of registered unemployed increased by around 2,000,17 reaching 3,672 registered individuals, while the labor force survey indicates 12,031 unemployed individuals in Q2 of 2020. The fall in demand also reduced prices, with The Harmonised Index of Consumer Prices (HICP) inflation falling from 1.4% to 1% between January and June of 2020.
Malta’s high dependency on tourism and foreign trade puts it at a higher risk of further economic contraction, especially given the current stagnation in world travel and trade. Considering such external effects, the Government is forecasting a reduction in growth of 5.4% in real terms for 2020.18 However, given the economic performance and buffers in place pre-COVID-19, authorities remain confident that recovery can be partly achieved next year.
Where we might be heading
10 Source: The World Bank, 2020. 11 Source: Ministry for Finance and Financial Services (MFIN), Pre-Budget Document, 202012 Source: Malta Tourism Authority (MTA), Tourism in Malta, 2019.
16 Source: NSO, 2020.17 Source: NSO, 2020. 18 Source: MFIN, 2020.
13 Source: MFIN, 2020. 14 Source: MFIN, 2020.15 Source: NSO, 2020.
New economic reality
16

EY Attractiveness Survey Malta October 2020
ey.com/attractiveness
GDP
GDP Q1 2020 GDP Q2 2020€2,825.2m€3,192.8m
increase in one year
Registered unemployed
August 20191,645
Government deficit
January and August 2020€1,086.2m
19 Source: NSO, 2020.20 Source: NSO, 2020. 21 Source: MFIN, 2020.
New economic reality
Wage supplement
By July 2020
16,612businesses benefited from these schemes
79,576employees were supported
€154mCost21
17
1.9%
decrease in one year19
14.9%
Inbound tourists
February 2020145,821
increase in one year
16.5% July 202048,743
decrease in one year20
84%
August 20203,672

EY Attractiveness Survey Europe May 202018
Perception
3The following chapter presents the sentiments of 116 existing FDI investors in Malta interviewed in June 2020. The respondent cohort profile is similar to previous EY Malta Attractiveness Surveys, reflecting a range of sectors and sizes, providing the opportunity to compare results over time. This year’s survey responses were captured through virtual one-to-one interviews between representatives of EY Malta’s management and top executives from FDI companies in Malta. The survey content was also updated as a result of the COVID-19 pandemic. The survey outlines the respondents’ views during a moment in time, and the nature of the pandemic and ongoing crisis require the results to be interpreted while keeping the events up until end-June 2020 in mind.

EY Attractiveness Survey Malta October 2020
ey.com/attractivenessPerception
Attractiveness
Investors sound a note of caution on Malta’s overall FDI attractiveness index with a 15% decline
After a 9% decline in the overall FDI attractiveness index in 2017, the following two years were relatively stable. This year, Malta’s overall index has dropped by 15%, the largest decrease ever registered. The number of investors who said Malta is not attractive has also increased and now comprises a quarter of total respondents. Respondents emphasized the country’s waning international reputation and the need to
Overall attractiveness
Source: all 2014−20 respondents.
2014 2015 2016 2017 2018 2019 2020
79%84% 87%
78%74%
62%
6% 5%
7%11%
16%
25%
15%11%
6%11% 10%
13%
77%
15%
8%
Don't knowYes No
improve on governance as crucial aspects for this decline. The positive factors mentioned include its access to the EU market, taxation, English-speaking workforce, good climate and a strong telecommunications infrastructure. Analyzing the results by sector, manufacturing (83%) and insurance (57%) respondents are the most optimistic about Malta’s FDI attractiveness. Hospitality (50%) and banking (44%) respondents are the most negative on Malta’s overall FDI attractiveness.
Figure 10: Attractiveness index
19

EY Attractiveness Survey Malta October 2020
Perception
Attractiveness scoreboard — Malta's FDI attractiveness
Source: all 2020 respondents.Note: numbers may not total 100% due to rounding.
Corporate taxation
Telecommunications infrastructure
Stability of social climate
Potential productivity increase for your company
Local labor skills level
Very attractive and attractive
Neither attractivenor unattractive
Not attractive and not attractive at all
Not relevant
82% 11% 5%
48% 27% 25%
68% 23% 4% 6%
1%
64% 27% 6% 3%
56% 35% 4% 5%
Flexibility of labor legislation
Labor costs
Level of protection of intellectual property rights
Domestic or regional market
Transport and logistics
44% 40% 16%
39% 28% 4%
46% 43% 10% 1%
30%
28% 21% 25% 26%
25% 25% 36% 13%
R&D and innovation environment
Stability and transparency of political, legal and regulatory environment
24% 34% 18% 25%
19% 31% 49% 1%
Figure 11: Attractiveness scoreboard — Malta’s FDI attractiveness
The stability and transparency of the political, legal and regulatory environment is now viewed as Malta’s least attractive parameter
As in previous years, corporate taxation remained top of the attractiveness scoreboard. The attractiveness of Malta’s stability of social climate has decreased by 11% and is now
in third place, while the telecommunications infrastructure is now in second place for the first time.
The stability and transparency of Malta’s political, legal and regulatory environment, which, until 2015, ranked in second place with 85%, has seen a sharp decrease of 27% in a single year and now occupies last place on the FDI attractiveness scoreboard with 19%.
20

EY Attractiveness Survey Malta October 2020
ey.com/attractiveness
Action needs to be taken to restore the island’s reputation and ensure it remains attractive in a post-COVID-19 world …
This result reflects the sentiments shared by many of the FDI investors on the need to improve governance and tackle reputational issues. The Council of Europe’s MoneyVal assessment was frequently mentioned by respondents as a cause for concern. Although respondents from all sectors mentioned such challenges, investors from banking, insurance, other financial services and iGaming were the most forthright.
Although still relatively low, with only 25% considering Malta’s transport and logistics infrastructure attractive, this has improved by 6% and is no longer considered Malta’s least attractive FDI parameter.
Malta’s R&D and innovation environment has remained at the bottom end of the table, with its attractiveness decreasing by 12%, signaling that more must be done to improve this parameter.
… but investors remain confident Malta can be equally attractive in a post-COVID-19 world
With COVID-19 dominating the business landscape, respondents were asked how attractive Malta would be in a post-COVID-19 world. Almost two-thirds expect the island to be equally attractive, 20% believe it will be less attractive and 15% said more attractive. When comparing these results with the EY Europe Attractiveness Survey 2020, it seems FDI investors in Malta are more positive than their continental counterparts with half stating Europe would be less attractive post-COVID-19.
Attractiveness scoreboard — Malta's FDI attractiveness
Source: all Malta Attractiveness Survey 2020 and Europe Attractiveness Survey 2020 respondents.
Maltarespondents
Europe respondents
More attractive Equally attractive Less attractive
15% 65% 20%
8% 43% 49%
Figure 12: Attractiveness in a post-COVID-19 world
expect Malta to be equally attractive in a post-COVID-19 world.
65%
Perception
21

EY Attractiveness Survey Malta October 2020
Almost two-thirds of companies have been negatively impacted due to the pandemic, and the same number believe it will take a year to return to pre-COVID-19 levels …
Fifty-seven percent said the financial impact of COVID-19 had been negative on their business so far, while 21% stated it was positive and 22% saw no change. The sectors worst hit include hospitality (100%) and manufacturing (79%). Insurance (57%) and other financial services (33%) are the sectors that provided the highest amount of positive replies, while iGaming companies have the highest combined positive and same replies (73%).
Fifty-six percent of companies estimate they will return to 2019 levels in one year or less. Forty percent believe the recovery process will take more than one, two or three years. Sector responses vary, but hospitality respondents are the least confident sector and believe it will take longer to recover and return to pre-COVID-19 levels.
Figure 13: Financial impact of COVID-19 on Malta-based companiesFinancial impact of COVID-19 on Malta based company
Positive
21%
57%
Negative
22%
Same
Source: all 2020 respondents.
Crisis
Figure 14: Estimate when company will recover and return to 2019 levelsEstimate when company will recover and return to 2019 levels
56%6% 5%
20% 14%
More than one year
More than three years
Less than one year
More than two years
Don't know
Source: all 2020 respondents.
Perception
22

EY Attractiveness Survey Malta October 2020
ey.com/attractiveness
… and half of investors have delayed, decreased or cut back their 2020 investment plans
The pandemic disrupted almost every aspect of life and is causing untold business uncertainty. Half of the FDI companies have delayed, decreased or cut back their planned investments. Complete cutback was only registered by 7% of respondents, in hospitality, manufacturing, and ICT and telecommunications. A substantial decrease in investment plans can also be seen in banking, while minor decreases were registered for all sectors. The largest delays are within ICT and telecommunications, and banking.
Almost half of FDI investors investment plans for 2020 have been unaffected. These respondents originate from the insurance and iGaming sectors, which, as previously mentioned, seem to have been the least financially hit by the pandemic.
Change in 2020 investment plans
Source: all 2020 respondents.
Increase
Complete cutback
Minor decrease (<20%)
Delay until 2021 or after
Substantial decrease (> 20%)
49%7%
17%13%
10%
4%
No change
Figure 15: Change in 2020 investment plans
“Half of the FDI companies have delayed, decreased or cut back their planned
investments.
Perception
23

EY Attractiveness Survey Malta October 2020
Three-quarters have adopted remote working as a result of the pandemic
A remarkable side effect of the pandemic worldwide is the shift toward remote working, with 77% implementing it for their staff. Certainly, different companies may find themselves in a better position to make the shift than others due to the sector they operate in. However, this operational change
has positive implications, including the need to travel less, which reduces traffic, decreases infrastructural demands and benefits the environment.
As a result of the pandemic, several companies have also increased their marketing efforts (22%) and customized new products (17%). Four percent indicated relocation outside of Malta and 3% have moved additional functions to Malta.
Figure 16: Impact of COVID-19 on Malta operationsImpact on Malta operations
Source: all 2020 respondents.
Implemented remote working
Increased marketing efforts
Customized new products
Moved sales online
Started sourcing from new suppliers
Increased operations
Relocated outside of Malta
77%
17%
10%
9%
8%
4%
Moved additional functions to Malta 3%
22%
Source: all 2020 respondents.
Perception
24

EY Attractiveness Survey Malta October 2020
ey.com/attractiveness
Society
The Government’s success in addressing COVID-19 as a public health care crisis was viewed less positively after the summer, with most responses shifting from positive to neutral
When the interviews were carried out in June 2020, almost all respondents had a positive (91%) assessment of the Maltese Government’s health care crisis response. Only 2% viewed it negatively and 7% were neutral in their assessment of the response. Respondents provided their views again in late September, and the number of positive replies decreased to 26% as both the neutral and negative replies increased.
Figure 17: Government response to the public health care crisis
The support measures provided to companies were received with a little bit more uncertainty …
Although two-thirds viewed the support measures for businesses positively, one-third saw them as either neutral (32%) or negative (7%). This result remained constant when asked again in late September. The sectors that provided the most positive replies included manufacturing (77%) and hospitality (75%). The negative replies originated from other financial services (13%) and iGaming (13%). ICT and telecommunications (56%) recorded the highest amount of neutral replies, followed by iGaming (40%). Respondents indicated delays as one of the challenges for these support measures.
Figure 18: COVID-19 support measures announced by the Government
Perception
25
2%
91%7%
June
26%26% 48%September
Positive Neutral Negative
Source: all 2020 respondents in June and 73 respondents in September.
7%
61% 32%June
9%
61% 30%September

EY Attractiveness Survey Malta October 2020
Figure 19: Priorities to remain globally competitive
… and a strong message to prioritize Malta’s reputation to remain globally competitive …
Supporting what many highlighted as one of the main reasons for a decrease in Malta’s overall attractiveness index in 2020, FDI investors ranked a new inclusion, reputation and brand, as the number one priority for Malta to remain globally competitive. Malta’s long-standing priority,
education and skills, is now in second place after several years ranking first. Another new inclusion, strengthening institutions, enforcement and monitoring, is in third place. This result further underlines the country’s need to prioritize tangible reforms that lead to increased trust based on good governance. Other priorities include infrastructure, transportation and planning, developing new economic sectors, and environmental, social and governance matters.
Source: all 2020 respondents.
Priorities to remain globally competitive
Reputation and brand
Ease of doing business
Strengthen institutions,enforcement and monitoring
Changing existing tax framework
Develop new economic sectors
Education and skills
Infrastructure, transportationand planning
Environmental, social andgovernance matters
Long-term economic planning
Shift to low-carbon economy
Stimuli to boost R&D and innovation Support for established sectors
1st2nd
3rd 4th
5th 6th
7th 8th
9th 10th
11th 12th
Perception
26

EY Attractiveness Survey Malta October 2020
ey.com/attractiveness
… while adopting environmentally sustainable practices as part of its post-COVID-19 reboot strategy
Almost all FDI investors have indicated that, as part of its COVID-19 reboot strategy, the Maltese Government should prioritize environmentally sustainable practices (94%).
Figure 20: Prioritize environmentally sustainable practices as part of COVID-19 reboot strategyPrioritize environmentally sustainable practices as part of COVID-19 reboot strategy
Yes
94%
2%
No
4%
Don’t know
Source: all 2020 respondents.
Perception
27

EY Attractiveness Survey Malta October 2020
Figure 21: Societal issues being tackled by FDI companies
Source: all 2020 respondents.
Education, skills and training
Diversity and inclusiveness
Environmental sustainability
Reducing carbon footprint
Health care
Income inequality
Infrastructure and mobility
74%
52%
39%
30%
28%
25%
Rising cost of living 24%
Overdevelopment 9%
None of the above 3%
60%
Societal issues being tackled by FDI companies
Companies were also asked which societal issues are being tackled through their own initiatives.
Education, skills and training (74%) came out on top, followed by diversity and inclusiveness (60%), and environmental sustainability (52%).
Transformation of business, society and governments has accelerated over the last decade. In this environment, a growing group of market participants are supporting greater focus on creating long-term value for multiple stakeholders. This must be undertaken through nonfinancial metrics, which consider how a longer-term approach can lead to investment and innovation that promotes growth and value creation.
Source: all 2020 respondents.
Perception
28

EY Attractiveness Survey Malta October 2020
ey.com/attractiveness
People
In response to the pandemic, half of businesses completely froze recruitment …
As the crisis unfolded, many companies put their people at the center by prioritizing their health, either through remote working or the introduction of effective safety procedures.
For many, it also meant working hard to ensure no workers would be laid off in the interests of corporate survival. So far, only 4% of foreign-owned companies have laid off staff as a result of the pandemic, but half have completely frozen recruitment. Twenty-three percent have started upskilling and re-skilling, while around one-fifth have placed staff on leave.
Figure 22: Recruitment actions
Source: all 2020 respondents.
Recruitment actions
Frozen recruitment
Reduced or canceled training budgets
Reduced recruitment
Laid off employees
Placed staff on leave
Upskilling and re-skilling
50%
5%
Loaned employees to other enterprises 3%
9%
4%
19%
23%
Increased recruitment
9%
Perception
29

EY Attractiveness Survey Malta October 2020
… and the ability to retain specialized staff has increased substantially …
The ability to retain specialized staff (96%) has increased by 23% in one year, most probably due to employees prioritizing job security over job mobility during these uncertain times.
Figure 23: Retain specialized personnel
Source: all 2015–20 respondents.
2015 2016 2017 2018 2019 2020
85% 87%82% 81%
73%
96%
Retain specialized personnel
Yes
… while scarcity of personnel with specialized skills has eased slightly, the challenge persists …
Most likely as a result of the pandemic, the ability of companies to find and recruit individuals with the required specialized skills has finally seen a trend reversal. Malta’s skill shortage has been a perennial issue, with the country’s economic expansion seemingly unable to keep up with increasing demand for specialized skills. This is nonetheless a continuing problem for the country as, although lower than in previous years, 62% still are unable to find the right skills locally. Skill shortages may become a lesser challenge for employers if the pandemic and economic hardship persists, which would result in further job losses and lower employment opportunities.
Source: all 2015–19 respondents and those respondents still recruiting in 2020.
2015 2016 2017 2018 2019 2020
38%
27%
36%38%
45%47%
Find and recruit the required specialized skills in the local labor market
Yes
Figure 24: Find and recruit the required specialized skills in the local labor market
Perception
30

EY Attractiveness Survey Malta October 2020
ey.com/attractiveness
As previously cited, 77% of companies implemented remote work. While 99% of these companies adapted quickly to these new practices, the majority (53%) have not seen an increase in productivity, while 31% did. Sixty-eight percent plan to adopt remote working for the long term, while 18% will reduce office space as a result of this new way of working.
Figure 25: Remote workRemote work
Source: all 2020 respondents.
Yes No Don't know
Our company quickly adapted to remote working
Productivity has increased
Communicate and collaborate remotely more efficiently
than before
Adopt remote working for the long term
Reduce office space as a result of remote working
99% 1%
18% 70% 11%
31% 53% 16%
36% 49% 15%
68% 18% 14%
of the companies that implemented remote work adapted quickly to the new practices.
99%
Perception
31

EY Attractiveness Survey Malta October 2020
Future
Despite all the challenges, a large majority still see their company present in Malta in 10 years’ time …
While the future may be even more difficult to predict as a result of COVID-19 and the global economic fallout, it is positive that 80% of investors, the same as 2019, believe they will be present in Malta in 10 years’ time. However, those who don’t have increased by 6% compared with the 2019 survey results, which should not be viewed lightly.
Presence in Malta in 10 years' time
Source: all 2020 respondents. Note: numbers may not total 100% due to rounding.
Yes
80%
8%
No
12%
Don’t know
Figure 26: Presence in Malta in 10 years’ time
… but even before COVID-19, expansion plans were on the decrease …
Investors indicated that even before the pandemic, expansion appetite was already decreasing, with 53% planning some form of expansion, a 5% decrease compared with 2019 plans and a 12% decrease since the 2018 result. Hospitality (88%), other financial services (58%) and ICT and telecommunications (56%) were the sectors most prepared to expand their operations. Insurance (71%) and banking (56%) were the most unlikely to do so.
Expansion plans prior to COVID-19
Source: all 2016–20 respondents. *Expansion plans prior to COVID-19 for 2020 and expansion plans for the remaining years.
Yes No Can't say
17% 20% 17% 19% 10%
30% 20% 17%23% 36%
53% 61% 65% 58% 53%
2016 2017 2018 2019 2020*
Figure 18: Expansion plans in 2020 prior to COVID-19
Perception
32
EY Attractiveness Survey Malta October 2020
ey.com/attractiveness
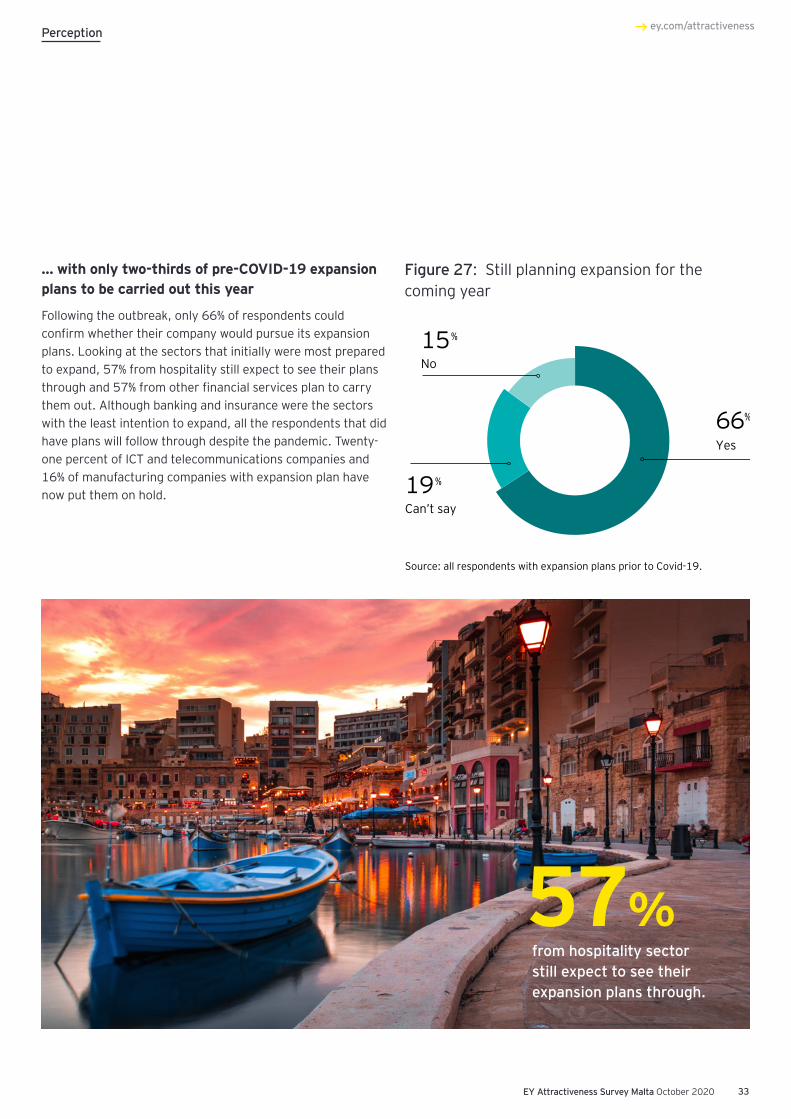
Figure 27: Still planning expansion for the coming year
… with only two-thirds of pre-COVID-19 expansion plans to be carried out this year
Following the outbreak, only 66% of respondents could confirm whether their company would pursue its expansion plans. Looking at the sectors that initially were most prepared to expand, 57% from hospitality still expect to see their plans through and 57% from other financial services plan to carry them out. Although banking and insurance were the sectors with the least intention to expand, all the respondents that did have plans will follow through despite the pandemic. Twenty-one percent of ICT and telecommunications companies and 16% of manufacturing companies with expansion plan have now put them on hold.
Still planning expansions for the coming year after COVID-19
Yes
66%
15%
No
19%
Can’t say
Source: all respondents with expansion plans prior to Covid-19.
Perception
from hospitality sector still expect to see their expansion plans through.
57%
33

EY Attractiveness Survey Malta October 2020
The sectors to drive growth signify a return to Malta’s roots …
Notwithstanding the tourism-related crisis, respondents still believe tourism and leisure (66%) will be the leading business sector in the next five years. iGaming (56%), formerly first, is now in second place with a slight decline from the 2019 result.
The sectors being promoted in 2020 could be viewed as a return to Malta’s roots, through aviation (41%) and more secure industries such as ICT and telecommunications (37%), pharmaceuticals and biotechnology (37%) and digital media and games (37%). Interestingly, blockchain (25%), which was in third place in 2019, has seen a sharp 25% decline. Real estate, infrastructure and construction (28%) has declined by 13%.
Figure 28: Leading business sectors in the next five years
Source: all 2019–20 respondents.
Leading business sectors in the next 5 years
Tourism and leisure
iGaming
Aviation
ICT and telecommunications
Pharmaceuticals and biotechnology
Digital media and games
Payments and FinTech
Artificial intelligence (AI)
Maritime
Professional services
Real estate, infrastructure and construction
Blockchain
% change
Other financial services
High technology manufacturing
Logistics
Insurance
B2B services excluding financial services
Asset management
Fund administration
Banking
Energy and environment (water, electricity, waste, renewables)
10%
−2%
9%
14%
21%
−2%
−2%
5%
11%
−5%
−13%
−25%
0%
13%
11%
4%
9%
4%
4%
7%
2%
66%
56%
41%
37%
37%
37%
36%
36%
32%
29%
28%
25%
24%
23%
22%
21%
19%
18%
18%
17%
16%
Business sector 2020
Perception
34

EY Attractiveness Survey Malta October 2020
ey.com/attractiveness
Figure 29: Trends expected to accelerate most in the next three years as a result of COVID-19
… and a sharper focus on digital and tech to rise above the challenges
The organizations that were furthest down the digital transformation journey before COVID-19 struck are tending to adapt to the crisis better than their peers. They were able to pivot more rapidly or speed up changes already underway. The top three trends that companies believe will accelerate over the next three years as a result of COVID-19 are digital
customer access to services (78%), adoption of technology that automates manual human processes (61%), and a focus on sustainability and climate change (57%). A comparison between the Malta and EY Europe Attractiveness Survey 2020 results show that the top three trends proved to be similar. However, differences can be seen between Malta-based FDI investors, who place greater emphasis on geopolitical tensions (28%), and investors in Europe who expect the reversal of globalization (56%) to accelerate more.
Source: all Malta Attractiveness Survey 2020 and Europe Attractiveness Survey 2020 respondents.
Trends expected to accelerate most in the next three years as a result of COVID-19
Digital customer access to services
Adoption of technology that automates manual human processes
Focus on sustainability and climate change
Government intervention in and regulation of business and the wider economy
Geopolitical tension
“Reshored” or “nearshored” supply chains in Europe
Reversal of globalization
Europe-based companies
55%
82%
57%
25%
3%
21%
56%
78%
61%
53%
32%
28%
24%
17%
TrendsMalta-based companies
“Malta-based FDI investors place greater emphasis on geopolitical tensions, while investors in Europe expect the reversal of
globalization to accelerate more.
Perception
35
EY Attractiveness Survey Malta October 2020
Perception: Otas doluptat escium in exerci quia natectibusda que mi, sed?
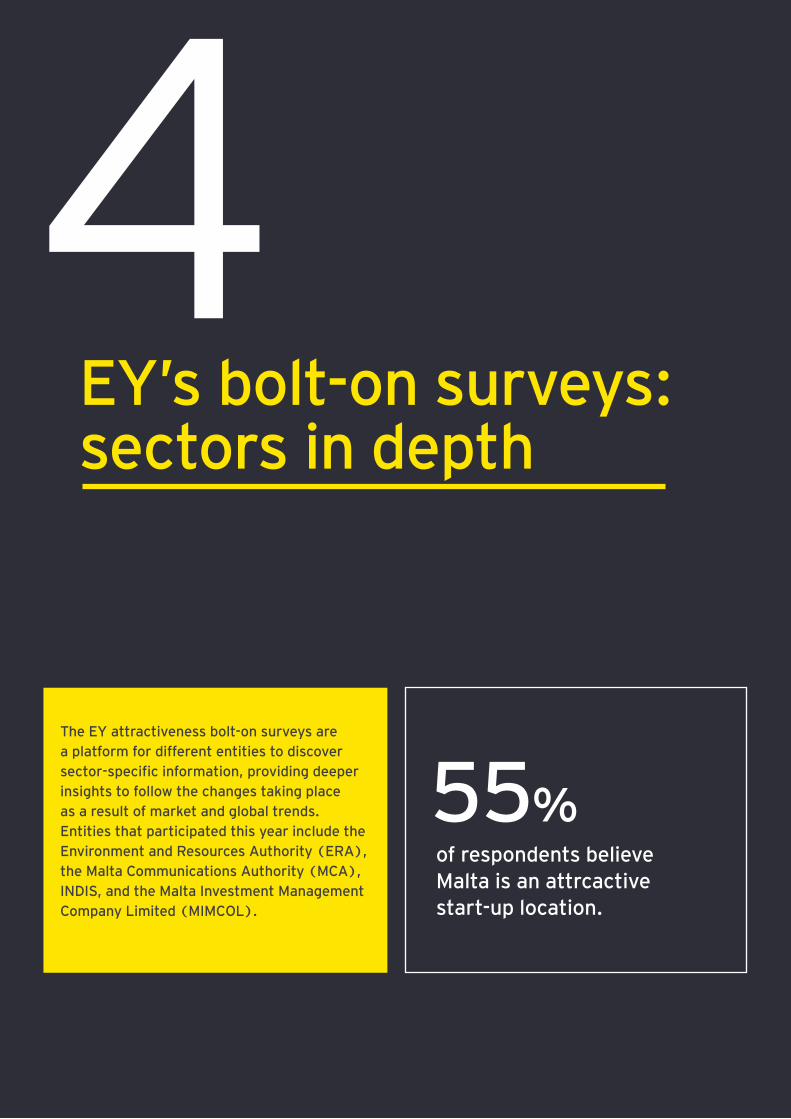
4EY’s bolt-on surveys: sectors in depth
of respondents believe Malta is an attrcactive start-up location.
55%
The EY attractiveness bolt-on surveys are a platform for different entities to discover sector-specific information, providing deeper insights to follow the changes taking place as a result of market and global trends. Entities that participated this year include the Environment and Resources Authority (ERA), the Malta Communications Authority (MCA), INDIS, and the Malta Investment Management Company Limited (MIMCOL).
36

EY Attractiveness Survey Malta October 2020
ey.com/attractivenessEY’s bolt-on surveys: sectors in depth
Start-ups
Focus on start-ups
Down by 4% in a single year and down by 7% since 2018, Malta as a start-up location could use a little bit more attention according to investors. When asked which start-up sectors Malta should prioritize, investors sent a strong message to focus on technological sectors with FinTech (30%), AI and big data (28%), digital business (25%), and biotech and pharma (20%) topping the list.
Malta’s attractiveness as a start-up location
Yes
55%
18%
No
27%
Don’t know
Source: all 2019-20 respondents.
+7%
−4%
−3%
Figure 30: Malta’s attractiveness as a start-up location
Figure 31: Priority start-up sectors
Source: all 2020 respondents.Note: respondents could select no more than three answers.
Priority start-up sectors
FinTech 30%
AI and big data
28%
Digital business 25%
Biotech and pharma 20%
Aviation 19%
Software 17%
Digital media and games 16%
Renewable energy 16%
E-tourism and travel tech 15%
iGaming 13%
E-learning 11%
High-tech manufacturing 11%
Robotics 10%Maritime 9%
AdTech 7%Logistics 5%
E-government 4%Avionics 2%
Telecommunications 1%
37

EY Attractiveness Survey Malta October 2020
EY’s bolt-on surveys: sectors in depth
Figure 32: FDI companies’ relationship with start-up organizations
Further measures are needed to create a sustainable start-up ecosystem
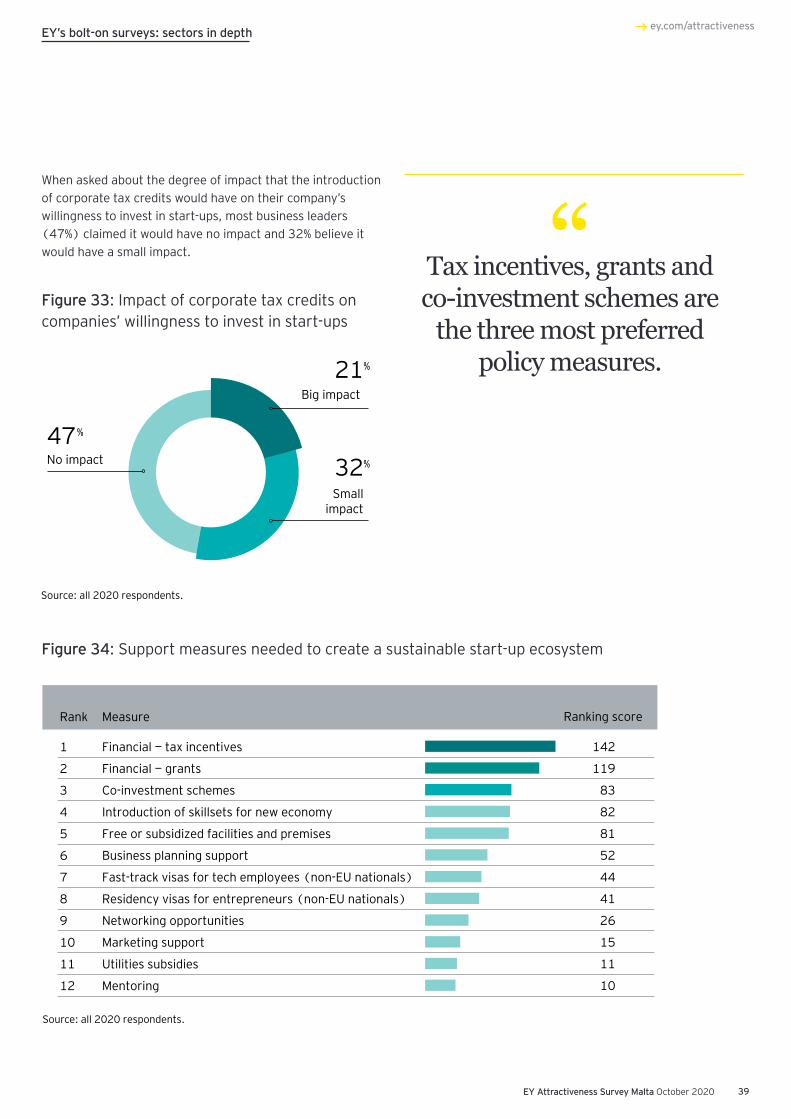
Tax incentives, grants and co-investment schemes are the three most preferred policy measures to help to enhance Malta’s appeal as a location for international start-ups. Respondents also highlighted the need to introduce skillsets for the new economy.
Interestingly, around one-third of investors do not have any type of relationship with start-ups. The most common types of relationship are strategic alliances (23%), procurement (20%) and mentoring (19%). The ecosystem requires established player support to be able to thrive and provide security to those start-ups that have potential.
Source: all 2020 respondents.Note: respondents could choose more than one answer.
FDI companies’ relationship with start-up organizations
Currently have, or plan to have, strategic alliances with start-up organizations
Sponsor, or would be willing to sponsor, start-up accelerator programs
Invest, or interested in investing, inprofessional managed collective
investment schemethat invests in those aligned to
company’s area of business
None of the above
Invest, or interested in investing, in
individual start-up organizations
Encourage procurement teams to work with start-ups as well as
established suppliers 23%
28%
Mentor, or plan to mentor, start-up organizations
19%
5%
9%
17%
20%
Involve, or plan to involve, start-ups in our internal
corporate innovation programs11%
38
EY Attractiveness Survey Malta October 2020
ey.com/attractiveness
Impact of the introduction of corporate tax credits on companies’ appetite to invest in start-ups
Big impact
21%
Smallimpact
32%
47%
No impact
Source: all 2020 respondents.
Figure 33: Impact of corporate tax credits on companies’ willingness to invest in start-ups
Figure 34: Support measures needed to create a sustainable start-up ecosystem
Source: all 2020 respondents.
Support measures needed to create a sustainable start-up ecosystem
1
2
3
4
5
6
7
8
9
10
11
12
Financial — tax incentives
Financial — grants
Co-investment schemes
Introduction of skillsets for new economy
Free or subsidized facilities and premises
Business planning support
Fast-track visas for tech employees (non-EU nationals)
Residency visas for entrepreneurs (non-EU nationals)
Networking opportunities
Marketing support
Utilities subsidies
Mentoring
142
119
83
82
81
52
44
41
26
15
11
10
Ranking scoreMeasureRank
“Tax incentives, grants and co-investment schemes are
the three most preferred policy measures.
EY’s bolt-on surveys: sectors in depth
When asked about the degree of impact that the introduction of corporate tax credits would have on their company’s willingness to invest in start-ups, most business leaders (47%) claimed it would have no impact and 32% believe it would have a small impact.
39

EY Attractiveness Survey Malta October 2020
iGaming
External factors driving mixed sentiment on outlook
While the outlook is still by and large positive, leaders highlight reputational issues and the forthcoming Moneyval evaluation as two critical areas impacting Malta’s attractiveness. On the plus side, Malta’s iGaming ecosystem of operators and suppliers, coupled with its strong and reputable regulatory framework and its attractive fiscal regime, continue to make Malta the leading international location for iGaming activities. The ongoing drive of EU countries to regulate the sector at a national level is, however, eroding some of Malta’s competitive advantages from a licensing perspective. Clear articulation of the 5-10-year vision for the sector may support new investment and the further build-out of enabling infrastructure.
Operators within industrial parks Most manufacturing companies would be willing to increase their investment in circular economy initiatives
Currently, 90% of manufacturing companies use less than 5% of their capital employed within the manufacturing process for waste disposal purposes. The remaining companies use less than 10% of their capital for this activity.
Industry outlook
Source: all 2019-20 iGaming respondents.
−36%
Yes
64%
36%
No
Figure 35: Industry outlook
Figure 36: Percentage of the capital employed within the manufacturing process used on waste disposal
Percentage of the capital employed within the manufacturing process used on waste disposal
Source: 2020 manufacturing respondents.
< 5%
90%
10%
< 10%
Figure 37: The extent to which companies would support circular economy initiatives
The most popular initiatives to help manufacturing companies contribute toward the circular economy are streaming of the organization’s waste collection (62%) and investing in a specific circular economy project (45%).
EY’s bolt-on surveys: sectors in depth
40
The extent to which companies would support circular economy initiatives
Source: 2020 manufacturing respondents.
Streaming organization’swaste collection 62%
Investing in a circulareconomy project 45%
Not interested in howwaste is disposed 14%
Paying a monetary contribution(polluter pays principle) 10%

EY Attractiveness Survey Malta October 2020
ey.com/attractiveness
Environment
The environment should be a priority in order to attract FDI
A strong message from this year’s survey and investors is the need to view the environment as a pull factor for FDI and not a hindrance. Companies believe funds and incentives for environmentally sustainable practices would help to shift their actions toward sustainability. In joint second place, taxes and disincentives for environmentally unsustainable practices and stricter environmental laws and enforcement, scored similarly as measures to support companies in increasing sustainable actions.
Figure 38: Measures to help companies increase sustainable actions
When asked how their companies could contribute to post-COVID-19 sustainability practices, respondents from all sectors listed a few environmentally friendly initiatives that they had already started to implement before the pandemic. Others indicated that their companies’ inevitable need to change due to COVID-19, such as the rapid shift to remote working and digitization, presented an optimal opportunity to switch to more sustainable practices for the long term. Several respondents plan to continue implementing these practices after the pandemic, as these are now considered the “new normal.” Mainly, the sustainable practices mentioned by companies revolve around the issues illustrated below.
Better waste management
practices
Willingness to support legislative proposals, policies
and incentives
Creating more environmental
awareness
External initiatives such as
cleanups
Installing renewable
energy technologies
Offering and promoting
remote working
Turning paperless through
digitization
Switching to greener and
energy-efficient offices
Promoting car pooling and
alternative means of transport
Promoting shift to online sales
Introducing ESG standards internally and
for clients
Incentivizing switch to
less polluting materials and
activities
Source: all 2020 respondents.
Measures to assist companies increase sustainable actions
Funds and incentives for environmentally sustainable practices
349
Taxes and disincentives for environmentally unsustainable practices
269
Stricter environmentallaws and enforcement 264Voluntary schemesand partnerships 183
Figure 39: Post-COVID-19 sustainability practices
EY’s bolt-on surveys: sectors in depth
41

EY Attractiveness Survey Malta October 2020
Communications
High levels of satisfaction for telecommunications services that were considered efficient throughout COVID-19
Satisfaction levels were consistently high across the three surveyed telecommunications services, with the highest satisfaction level registered among Malta’s FDI community for mobile voice telephony services (88%), followed by fixed broadband (85%). The number of dissatisfied respondents is very low across all telecommunications services, while around 1 in 10 were neutral.
The vast majority of respondents (84%) believe that the telecommunications sector performed in an efficient manner throughout the COVID-19 pandemic, with only a few respondents expressing a certain degree of caution in relation to the initial period of the pandemic due to the sudden increase in demand.
Level of satisfaction with telecommunicationservices
Source: all 2020 respondents.
Satisfied Neutral Dissatisfied
Fixedbroadband
Mobile voice telephony
Mobiledata
88% 9% 3%
12%82% 6%
11%85% 3%
Figure 40: Level of satisfaction with telecommunication services
Figure 41: Efficiency of Malta’s telecommunications sector throughout the COVID-19 pandemicEfficiency of Malta’s telecommunications sector throughout the Covid-19 pandemic
Source: all 2020 respondents.
Efficient
84%
7%
Not efficient
9%
Don’t know
“The vast majority of respondents believe that the telecommunications
sector performed in an efficient manner
throughout the COVID-19 pandemic.
EY’s bolt-on surveys: sectors in depth
42

EY Attractiveness Survey Malta October 2020
ey.com/attractiveness
Concluding messages
An opportunity to reframe the future
Malta possesses vital qualities that must be utilized in a post-COVID-19 world …Now in its 16th year, the Malta Attractiveness Survey has outlined Malta’s top qualities as seen through the eyes of foreign investors. Repeatedly, investors have highlighted the island’s social fabric and lifestyle, climate and location, as well as a strong English-speaking workforce, as key attractive attributes.
The country boasts natural beauty and historical charm, and its inhabitants are accustomed to welcoming significant tourist numbers, year after year. Malta’s intrinsic attractive qualities must continually be nurtured and protected. They are fundamental to driving quality and way of life of the people living and working in the country.
Malta’s experience in telecommunications is another positive. Following EU membership, this crucial sector thrived and provided the bedrock for other sectors – such as financial services, ICT, iGaming and manufacturing – to flourish. From the outset, the sector was well regulated and receptive to both innovation and competition. These factors generated significant amounts of investment and employment, dovetailing with Malta’s more recent drive to make digital industries a critical part of its industrial fabric. Today, Malta’s telecommunications infrastructure is one of its major strengths, according to foreign investors, and provides a reference point for developing and emerging sectors, together with the foundations to service global businesses and customers in an increasingly borderless, digital world.
1
43

EY Attractiveness Survey Malta October 2020
… but certain challenges need to be overcome … COVID-19 has pushed many of the world’s most developed economies into a recession, and exactly how long the ripples of this crisis will negatively affect Malta’s economy remains uncertain. Business continuity is crucial for the livelihoods of many, but measures must also be taken to prevent the health care system from being overwhelmed. With each passing day, more is known globally about the virus and its effects on the population, and by investigating other countries’ responses and support measures, we increase our likelihood of finding the right formula.
The attractiveness of the stability of Malta’s legal, political and regulatory environment has decreased sharply in recent years and should be a key priority moving forward. Corporate taxation, while viewed as very attractive, may be less relevant in a post-COVID-19 world.
Through the years, investors have also highlighted Malta’s weak innovation capacity, despite well-developed digital, telecommunications and hi-tech manufacturing clusters. The technology sector’s growth through the pandemic proves its resilience and shines a light on where Malta should focus in the years ahead. Certainly, skills must be prioritized and, although the challenge in sourcing specialized skills saw a small trend reversal, this challenge persists. This is an opportunity to recalibrate the economy, through upskilling and re-skilling certain segments of the workforce, and reforming our educational curricula to better align to the jobs of the future.
2
… and a long-term sustainable vision must be developed and implementedSustainability may be a buzzword for 2020 but it is not a fad. The pandemic has amplified its relevance as a solution to many of the challenges at hand, and the need for corporates and the Government to give it the due focus it deserves, with the European Green Deal central to the EU’s vision for the coming decades. The country might need to adopt a back-to-basics approach as it reboots following the pandemic. Investors would also like to see more environmentally sustainable practices in place, and highlight that cleanliness, upkeep, green spaces and respect for the natural environment need to be given more focus.
The challenges brought about by COVID-19 have underscored the importance of stakeholder capitalism – the notion that a company focuses on meeting the needs of all its stakeholders: customers, employees, partners, the community, and society as a whole – and the long-term value it can create for its shareholders by doing so. It has also highlighted the need for nations to move beyond GDP toward a broader set of KPIs when measuring economic success. Environmental, social and governance (ESG) programs may have failed to gain much attention in the past, but they are now a top priority on investors’ agendas.
3
Concluding messages: An opportunity to reframe the future
44

EY Attractiveness Survey Malta October 2020
ey.com/attractivenessConcluding messages: An opportunity to reframe the future
Finally, COVID-19 has turbo-charged the digital revolution. It has quite stunningly amplified the fact that we are actually less insular than previously thought. In an increasingly interconnected world, we should think less of ourselves as some remote island that looks inward and more about how easily we can connect with countries, companies and people in continents on the other side of the world. Malta’s geographic location can also be exploited by positively supporting neighboring countries, and reframed global economic dynamics present an opportunity for the island to tap into nearshoring, remote support functions and logistics opportunities.
A new mindset is needed in a new world. It is time to reframe the future.
Reframing Malta’s priorities
Qualityof life
Inclusive growth
Gov
er
nance Skills Im
age Innova
tion
Econom
ic development Ecologica
l dev
elop
men
t
S
ocial development
Social development
• Happiness
• Social cohesion
• Poverty reduction
• Quality of work
• Health and safety
• Digital transformation
Economic development
• Resilience and recovery
• Digital and technology
• Cluster-based niches
• IP and value creation
• Nearshoring
• Remote workers
Ecological development
• Climate change
• Environmental protection
• Urban and spatial planning
• Green spaces and transport
• Aesthetics and design
• Regeneration and restoration
Figure 42: Reframing Malta’s priorities
45

EY Attractiveness Survey Malta October 2020
Methodology
A total of 116 current FDI companies of investors responded to EY’s survey, conducted through virtual interviews in June 2020. Some questions were asked again in September, 2020.
Asia
Worldwide
Middle East
North America
South America
Europe
79%16%
7%
11%
Africa7%
12%
27%
Figure 43: Key target markets
Source: all 2020 respondents.
46
0%
3%6%
Figure 44: Percentage of revenue exported
76%–100%
11%–25%
51%–75%
1%–10%
26%–50%
52%
7%5%
27%

EY Attractiveness Survey Malta October 2020
ey.com/attractiveness
EY contactSimon L. Barberi
Director, EY Malta
Tel: +356 2134 2134
47
About EYEY is a global leader in assurance, tax, strategy, transaction and consulting services. The insights and quality services we deliver help build trust and confidence in the capital markets and in economies the world over. We develop outstanding leaders who team to deliver on our promises to all of our stakeholders. In so doing, we play a critical role in building a better working world for our people, for our clients and for our communities.
EY refers to the global organization, and may refer to one or more, of themember firms of Ernst & Young Global Limited, each of which is a separatelegal entity. Ernst & Young Global Limited, a UK company limited byguarantee, does not provide services to clients. Information about how EYcollects and uses personal data and a description of the rights individualshave under data protection legislation are available via ey.com/privacy. Formore information about our organization, please visit ey.com.
© 2020 EYGM Limited. All Rights Reserved.
EYG no. 007098-20Gbl
ED None
This material has been prepared for general informational purposes only and is not intended to be relied upon as accounting, tax or other professional advice. Please refer to your advisors for specific advice.
ey.com
EY | Assurance | Tax | Strategy and Transactions | Consulting