how business is done and the ‘doing business’ … docs, ppts...preliminary draft: comments...
TRANSCRIPT
Preliminary Draft: Comments Welcome 12/8/2010
How Business is Done and the ‘Doing Business’ Indicators: The Investment Climate when Firms have
Climate Control
Mary Hallward-DriemeierWorld Bank
Lant PritchettHarvard Kennedy School*
November 2010
Abstract: “Doing Business” (DB) provides measures of the time and costs associated with fully complying with an array of business regulations. Enterprise Surveys (ES) ask a wide range of firms about their actual experiences in doing business. We use three comparable indicators in both: time to get an operating permit, time to get a construction permit, and time to import goods, to compare these distinct de jure (DB) and de facto (ES) approachesto assessing the “investment climate” in over 100 countries. Four patterns emerge in each of the three indicators. First, while the DB, of necessity, reports a single estimate of the days for compliance for each indicator, firms in the same country report wildly different times to complete the same transaction. For instance, the DB indicators says it takes 65 days to start a business in Ecuador, whereas the distribution of the 265 firms who reported getting an operating license was between a 10th percentile reporting 1 day while the 90th
percentile reporting 60 days. Second, regulatory compliance appears to be “under water” as firms report actual times much less than the DB reported days. For instance, the median DB time to obtain a construction permit across all countries is 210 days, while the mean of the days firms reported was 59, the median DB-ES “under water” gap was 145 days. Third, cross-nationally there is very little association between the ES distributions and DB numbers. A naïve view of “full compliance” might suggest that actually reported days would rise one for one with DB days, but the patterns are much more complex. The de jure environment appears to only affect some firms. For instance, as the de jure DB time to get a construction permit rose across countries by 524 days (from 77 to 601) the predicted time reported by the 25th percentile “favored” firm rose by just 2.7 days. In contrast, the time reported by the “disfavored” 90th percentile firm rose by 130 days, but all of this rise comesin the lower range of the DB. Fourth, for those countries with multiple ES surveys we find little association over time, with reductions in DB days as likely to be accompanied by increases in ES days. Comparing these two measures suggests very different ways of thinking about policy versus policy implementation, about what “climate” means, and what the options for “policy reform” really are. * We would like to thank Bill Battaile, Asli Demirguc-Kunt, Ahmed Galal, Ricardo Hausmann, Stephen O’Connell, Rita Ramalho, James Robinson, Dani Rodrik, Luis Serven, Andrei Shleifer, Sylvia Solf and David Weil for conversations that were, perhaps unbeknownst to them, helpful and to Dan Willey for motivation on this topic. The views expressed here do not necessarily represent the views of the World Bank or its Executive Directors.
2
For my friends, anything;for my enemies, the law
Oscar Benavides, Former President of Peru
Introduction
Over the last decade there have been two major initiatives to measure the “investment climate” that private sector firms face in developing countries, both with the goal of discovering and promoting those government policies and actions that could accelerate (broad based) economic growth.
Far and away the most famous of these has been the Doing Business (DB) indicators supported by the World Bank. DB assesses 10 elements of a country’s policies that relateto private firms (e.g. starting a business, hiring workers, trading across borders, dealing with construction permits). DB provides ‘league tables’ on each of these 10 regulatory areas separately, as well as providing a widely cited overall “Ease of Doing Business” ranking (e.g. in the 2010 ranking, Singapore as ranked number one and Central African Republic at 183).1 The DB exercise assesses the country’s “investment climate” with experts that examine the relevant laws and procedures to assess the time and cost of compliance with the variety of governmental regulations, as well as the ease with which a variety of contracts between private parties can be entered into and enforced.2
A parallel effort, also carried out by the World Bank, has surveyed firms in developing countries. This questionnaire includes modules that ask about the firm and its operations, what the firms perceive as obstacles to their own business and about their interactions with government in policy compliance. These Enterprise Surveys (ES)3 have now covered over 100,000 firms in 117 countries, some with repeat surveys.4
1 A Google search on “ease of doing business” and “world bank” produces half a million hits. 2
The Doing Business indicators were developed from collaborations with academics (e.g. Djankov, La Porta, Lopez-De-Silanes and Shleifer, 2002; Djankov, La Porta, Lopez-de-Silanes and Shleifer, 2003; Botero, Djankov, La Porta, Lopez de Silanes and Shleifer 2004; Djankov, Simeon, Caralee McLiesh, and Andrei Shleifer 2007.). The DB data, once developed, has then been used to examine the effect of labor regulations (Micco and Pages 2006;), regulation of entry (Bruhn, forthcoming; Klapper, Laeven and Rajan. 2006), or a wide set of regulations (Loayza, Oviedo and Servén, 2006; Bolaky and Freund 2008; Eifert 2009) on cross-country outcomes of interest.3 The Enterprise Surveys build on a number of prior efforts with different names, that since 2005 have been standardized and use the same questionnaire and methodology, while maintaining their brand name in their respective regions, e.g. Regional Program on Enterprise Development (RPED) in Africa; Business Environment and Enterprise Performance (BEEPS) in Eastern Europe and Central Asia. Investment Climate Surveys were conducted prior to 2005, using largely the same questionnaire but with sample generally restricted to manufacturing firms. 4
The Enterprise Surveys (including their precursors World Business Environment Survey, BEEPS, RPED) have been used to show the importance of finance, corruption and property rights (Beck et al. 2005; Ayyagari, Demirgüç-Kunt and Maksimovic 2008; Gatti and Fisman 2006; Cai et al 2006; Fisman and Svensson, 2007), the relationship between business environment and firm growth, (Dollar, Hallward-Driemeier and Mengistae, 2005; Haltiwanger and Schweiger 2005; Dollar et al, 2006; Hallward-Driemeier
3
The metaphor of a “climate” for these measures is instructive. Every day newspapers report the temperature in cities around the world. Suppose in each city there was both an official thermometer and thousands of outdoor thermometers in houses around the city. What do we expect from these measurements if we are capturing places with meaningful difference climates? 5 First, the variance of the outdoor temperatures around a given city (at a specified time of day, etc.) should be small compared to the inter-city variability: if it is hot in Phoenix and cool in Boston, it is hotter everywhere in Phoenix than anywhere in Boston. Second, regressing household temperature in city X on official temperature in city X would produce a coefficient near one. Third, one would expect the variance across household reported temperatures to be invariant to the official temperature. Fourth, changes in the official temperature would be highly associated with changes in outdoor household temperatures.
Imagine the same thought experiment with experienced temperature for a given individual in a rich country. None of the above is true. First, the main variance in experienced temperature is person specific. If it is July and you are indoors in Phoenix you are probably experiencing the same temperature as a person indoors in Boston, but a wildly different experienced temperature than anyone outdoors in Phoenix. Second, experienced indoor temperature may have no association with outdoor temperature. Third, variance in experienced temperature gets larger the further the outdoor temperature is from the ideal—towards either hot or cold as the temperature difference between people experiencing outdoor temperature and indoor, climate controlled, temperature is wider. Fourth, experienced indoor temperature stays pretty constant throughout the year, even as outdoor temperature varies widely. When people have climate control experienced temperature is a characteristic of people, not places.
An ES in the same country in the same year as a DB rating allows examination of the areas in which the two overlap to ask: How much of what it is like for a given firm to do business in country X does “Doing Business” in country X capture? We use three areas that have similar, though unfortunately not identical, questions: importing goods, starting a business/getting an operating license, getting a construction permit, to examine the relationship between firm specific ES reports and the country reported DB. The strong conclusion emerging from the four empirical findings in out paper is that experienced policy implementation is about firms, not countries.
First, there is massive variance across firms in their reported experiences, but little of this is associated with variation in the comparable DB Indicator. The typical variation
Wallsten and Xu 2006; Aterido, Hallward-Driemeier and Pages, forthcoming; Eifert et al 2008; Fernandes and Pakes 2008;); firm innovation(Almeida and Fernandes 2008; Ayyagari , Demirgüç-Kunt and Maksimovic 2010); informality (La Porta and Shleifer, 2008); labor protections (Pierre and Scarpetta 2006; Almeida and Carneiro 2009). Two survey articles provide reviews of the literature drawing primarily on Enterprise Survey like data: Bigsten and Soderbom, 2006 and Xu 2010. 5 Which imply that a “country” may or may not be a meaningful definition of “place” for describing climates. Certainly, one cannot imagine asserting that the USA, which ranges from Maine to Florida and Alaska to Hawaii, has a meaningful “climate” in the way that a small country like Jamaica might.
4
across firms in the same country in experienced policy is of roughly similar magnitude to the entire cross-national variation in average policy experience.
Second, the relationship between the central tendency (average, median) of the ES firm responses and DB is not one for one, not linear, and not statistically strong. For all three indicators the linear slope of the regression of country average of ES and DB is well less than, and statistically different from, one (for two of the three the slope is not statistically different from zero). When we relax the assumption of linearity (either by allowing one or two splines or a quartic in DB) we find that over the lower ranges of DB there is a weak relationship, but as the DB days rise to even modest levels the association disappears.
For firms in the ES samples there is typically “water in the regulations” (when countries had very high tariffs there was “water in the tariffs” when the tariff was so high demand would remain zero even if the tariff was reduced). The DB assessment of the regulations imply that there is massive “water in the regulations”—that is, the firmsreport that it takes then considerably less time to accomplish the tasks than the DB indicators suggest as the “official” climate. For instance, the DB indicators report it takes 411 days to get a construction permit in Brazil. The 262 sampled firms who reported getting a construction permit reported on average a time to get a construction permit of 85 days. For the 80 countries with both DB and ES results the average excess of the DB days to get a construction permit versus the ES average is 177 days, almost three times larger than the firm reported average time of 64 days.
Third, we examine the associated between DB and the firms who report very quick times (the “favored” firms) and those who report very slow times (the “disfavored” firms). Using the 10th or 25th percentile of firm reported times we find that for these firms the DB numbers mean nothing at all. In every country the “favored” firms report very little delay in any of the three indicators (clearing customs, getting construction permits, or operating licenses)—and hence are massively under-water. The median DB time to get a construction permit is 242 days, about eight months. The median 10th and 25th percentiles are one week and two weeks respectively. For time to import goods the results are, if anything, more dramatic, the median DB time is 23 days, the 10th percentile is 1 day, 25th percentile is 2 days. Moreover, there is almost no variation across countries in the ES “favored firm” responses. The standard deviation across countries in “favored firm” (25th percentile) time to get a permit was 12 days (compared to a standard deviation of 119 days in the DB indicator).
In contrast, there is a set of firms that do find regulations an obstacle, and the extent
of delay for those firms does vary widely across countries. The “disfavored” firms—those in the 90th percentile—show huge differences across countries, the standard deviation for getting a construction permit of the 90th percentile is 106 days. Even though there are large differences, these are not well explained by a simple linear association with DB. Rather, there is a sharply non-linear pattern in which increases in DB days from low levels are associated with a rapid increase in the time reported by “disfavored firms” (90th percentile), but for increases above the first tercile of the data
5
(and at least by the median) there is no association between the DB indicator and the ES 90th percentile responses.
Fourth, several countries have repeated ES surveys that span a change in the corresponding DB indicator. While these are many substantial reductions in the DB reported time, there were almost no instances in which this was associated with a fall inthe ES reported time for compliance. In fact, the change in average responses reported by firms often rose. This could reflect greater enforcement or compliance. But interestingly, the spread across firms also often rises.
This paper is just simple empirics and gives simple, but compelling, answers. If we ask “are people hotter in Phoenix?” we could plausibly answer “No, for the most part, people stay indoors with air conditioning” without positing complex behavioral theories and testing their causal assertions. We are just examining the data and use regressions as data summarizing techniques, not to assert causality or test theories. But we do find that the idea that a single country number summarizes completely, or even modestly well, the policy experiences of firms in those countries, even when limited to the same domain, is not tenable. We caution the reader from jumping from this to any particular conclusion about the implications of what this means, as we don’t know. We are unsure just what these empirical findings mean but they must imply something about how we should think about policy, policy implementation, and policy reform for promoting and accelerating broad based growth, and we are as anxious as they next guy and gal to find us just what it does mean.
II) Description of the data
The two large-scale, multiple year, multiple country data collection efforts undertaken by the World Bank, each of which uses a different approach to understanding the constraints facing the private sector. DB provides measures of compliance with regulatory requirements and ES provides firms’ reported experiences associated with regulations and other investment climate conditions. By using them together, this paper explores the relationship between de jure and de facto measures of regulations.
DB provides indicators in 10 regulatory areas of the number of procedures, the time and costs associated with complying with formal requirements. It uses a hypothetical “standard” firm (e.g. a privately and domestically owned, limited liability company with 10-50 employees operating in the country’s largest city) and standardized transactions that could apply to many different activities (e.g. building a warehouse; enforcing a contract worth twice the country’s income per capita). It explicitly assumes full compliance, that no third parties are used to facilitate completing procedures and that no payments or other activities are undertaken to influence policy outcomes. The measures are compiled by one to four lawyers or accountants in each country based on the typical times it would take to comply based on their assessment of the actual wording of the regulations as they exist on the books.
6
Despite its emphasis on measuring regulations on the books, there are a few instances where DB ends up including some steps that are not purely regulatory in nature. For example, the DB indicator for ‘trading across borders’ actually has 4 sub-components, one of which is “inland transportation.” Beyond the mixing of some regulatory and non-regulatory components, this also raises questions about how the indicator was measured. It is estimated by a single (or sometimes a couple of) lawyers in the capital city – based on their understanding of their clients’ experiences. As lawyers in large firms, their clients are unlikely to be representative of more typical firms’experiences, nor are these lawyers the business people with experience in this area. For this work, we thus remove the ‘inland transportation’ portion of the DB indicator. For the other two indicators, there could also be some steps in some countries that do not seem to be completely regulatory in nature. However, the number of steps and their categorization is not standardized across countries, and concerned of adding more measurement error by selectively deleting some in some countries, no changes have been made.
The ES does not try to measure what should happen, but rather what did happen in practice. It gathers responses from large, random samples of firms in the main urban centers in a country. The face to face interviews ask for quantitative information from the firm owners and senior managers about how long it takes to get various regulatory procedures done and how much they cost – including actions to influence policy implementation, like bribes or gifts or meeting with government officials.6 The full spectrum of firms by size are included, as well as foreign and state owned enterprises, so one can compare the experiences across types of firms.
In making comparisons across the two sources of data, there are three regulatory
areas covered by both DB and the ES instruments with sufficient numbers of firm responses7: time to get operating licenses, time to get construction permits and time to clear goods through customs. While the same regulatory areas are covered, it should be remembered that the questions are not asked exactly the same way. First, DB provides very precise instructions on what to include or not in the measure, while the ES simply asks ‘how long did it take to get a construction permit?’ Some of the variation within the ES is no doubt due to the fact that respondents may have different notions of which steps they did and did not include in their assessment. Second, ES respondents are also unlikely to have precise records as to the length of time procedures took, and so will report estimates. Both of these points are potential sources of measurement error, but are unlikely to drive the patterns we see, particularly across countries.
Third, DB has a precisely defined “standard” firm conducting the transaction, e.g. a 10-50 employee, domestically owned private company. The ES are a sample of firms –both larger and smaller than 10-50 employees – and different ownership types. It is possible that some of the variation within country in the ES is that the regulatory
6 The survey also asks about other topics (e.g. broader set of investment climate conditions), subjective as well as quantitative measures and about the firm’s performance.7 E.g. Use of courts was limited to only a few respondents in most countries. Regulatory procedures around closing a firm were not included as the sample was of continuing firms.
7
requirements themselves vary by firm size or ownership. However, only using those firms that match the characteristics of the ‘standard’ hypothetical DB firm, leads to the same basic empirical results as the ones we report—but does reduce sample sizes so we stick to the full samples.
The fourth difference between the DB and ES is the most interesting one: the assumption that firms fully comply – and with no direct or third-party facilitation (monetary or otherwise) involved. But firms do not necessarily comply in the ways anticipated in the DB instrument. The respondents in the ES themselves report that additional payments are frequently made to ‘help get things done.’ Moreover, as we show, if what firms report as their experiences mirrored the formal requirements, the data in the graphs comparing the two across countries would line up along a 45 degree line. The size of the gap between the two sources of data (i.e. how far below the 45 degree line most of the observations in the graphs are) illustrates how costly it would be not to try to strike a deal – and that assuming no deals are made does not, in fact, reflect what firms do.
III) Comparing Doing Business and Enterprise Surveys
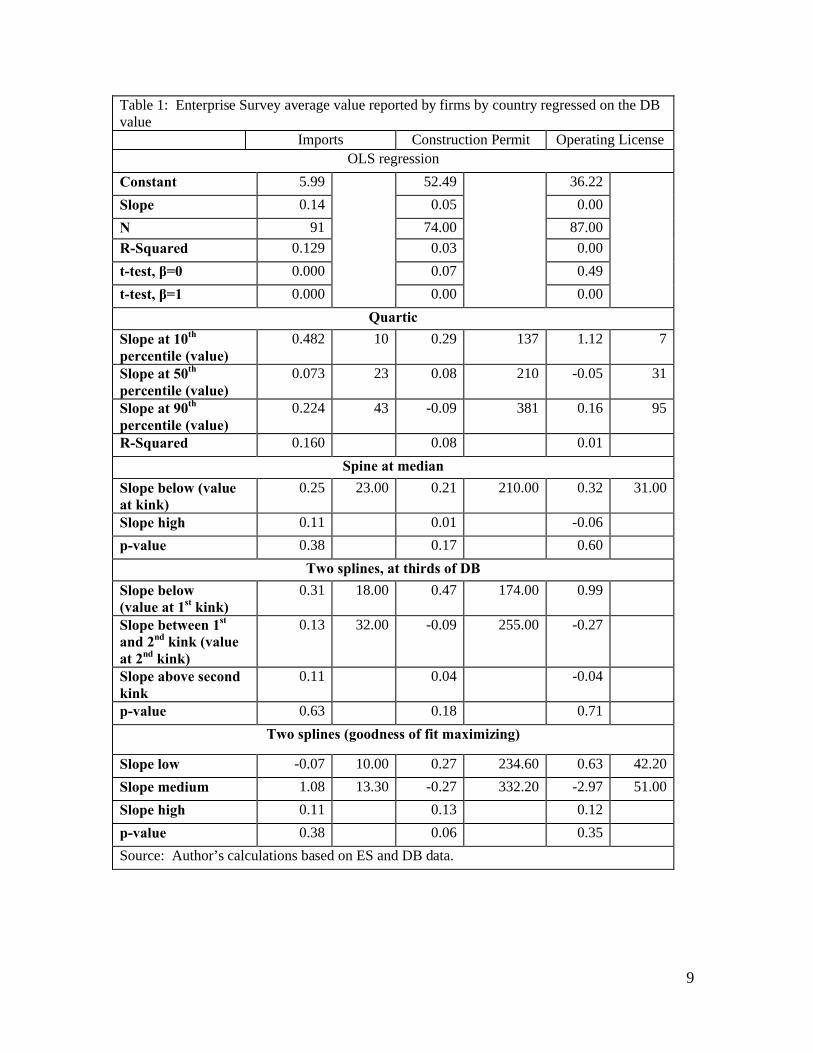
What is the connection between the DB indicators and the average value reported by the firms in the ES? For each of the three indicators (imports, operating license, and construction permit) we provide scatter plots (Figures 1a, 1b, 1c) and regression results using a variety of functional forms (Table 1). All three indicators have roughly similar patterns that:
(i) for most of the range of the data the average firm is far “under water” in that the time reported by firms is far less than the reported time in DB
(ii) the cross-national correlation between the two indicators, even at the country level, is very weak, with R-Squared coefficients well below .05 for operating licenses and construction permits.
(iii) there is an apparent non-linear pattern in which as the DB days increases from low levels the corresponding ES average value increases (though well less thhan one for one) but at higher values the slope becomes quite flat and increases in DB do little to increase the reported ES average.
Since we are using regressions merely as a data summary technique we did not want to impose any particular strong functional form or constraints on the non-linearity of the relationships that might emerge. Therefore, we estimated four different functional forms. We allowed splines (kinks but with continuity) of three different types: (a) a single spline at the median, (b) two even placed splines and (c) an “optimal” or goodness of fit maximizing choice of two splines8. In addition we just use a quartic specification.
8 The goodness of fit maximizing spline was chosen by a simple grid search procedure of dividing the data into deciles and then evaluating the R2 at each possible combination of deciles and choosing the pair of data values to allow the regression to kink as the R2 maximizing point.
8
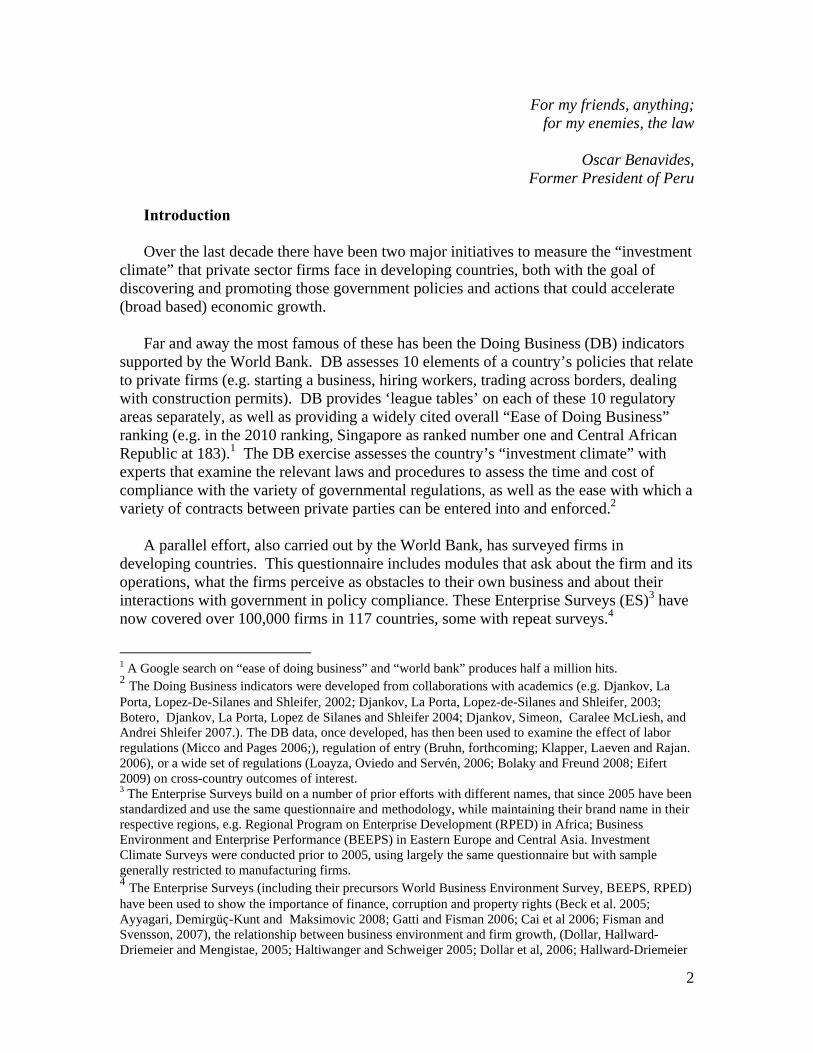
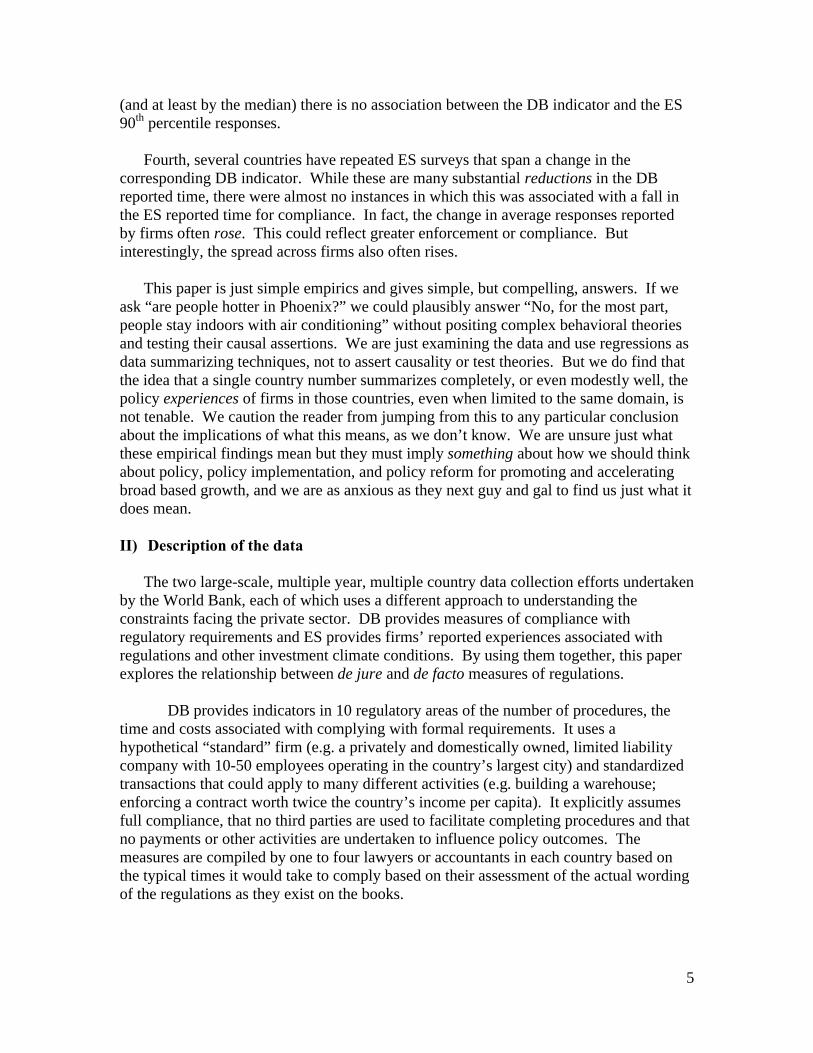
Imports. Figure 1a shows the relations between the DB indicator for time taken for imports (less inland transport time) compared to the days that firms reported it took them for imports. The figures show the predicted values for each of the four functional forms, which in this case are quite similar. As seen in table 1, the simple linear OLS regression produces a coefficient of .14, which is significantly different from either 0 or 1 and produces an R2 of .129—so only a small fraction of the cross-national variation in firm reported average time is associated with the variation in DB.
Moreover, all of the functional forms show sharply lower coefficients connecting the two variables as the value of the DB indicator is higher. For instance, the slope of the quartic at the 10th percentile (10 days) of the DB is .482 versus only .07 at the 50th
percentile (23 days). All of the splines show similar results, with sharply lower slopes when the DB values are above even modest values—the “optimal” two kink spline suggests the slope is only .11 above 13 days9. The predicted mean ES reported days is only 4 days higher for a country with a DB of 58 days versus a DB of 20 days. This leaves the countries with high DB values “under water” as the average time is well below the DB time—for Kazakhstan the DB time is 38 days higher than the ES average.
9 Given the overall weak relationships the F-tests show none of the splines for imports are statistically significant.
9
Table 1: Enterprise Survey average value reported by firms by country regressed on the DB value
Imports Construction Permit Operating LicenseOLS regression
Constant 5.99 52.49 36.22
Slope 0.14 0.05 0.00
N 91 74.00 87.00
R-Squared 0.129 0.03 0.00
t-test, β=0 0.000 0.07 0.49
t-test, β=1 0.000 0.00 0.00
Quartic
Slope at 10th
percentile (value)0.482 10 0.29 137 1.12 7
Slope at 50th
percentile (value)0.073 23 0.08 210 -0.05 31
Slope at 90th
percentile (value)0.224 43 -0.09 381 0.16 95
R-Squared 0.160 0.08 0.01
Spine at median
Slope below (value at kink)
0.25 23.00 0.21 210.00 0.32 31.00
Slope high 0.11 0.01 -0.06
p-value 0.38 0.17 0.60
Two splines, at thirds of DB
Slope below (value at 1st kink)
0.31 18.00 0.47 174.00 0.99
Slope between 1st
and 2nd kink (value at 2nd kink)
0.13 32.00 -0.09 255.00 -0.27
Slope above second kink
0.11 0.04 -0.04
p-value 0.63 0.18 0.71
Two splines (goodness of fit maximizing)
Slope low -0.07 10.00 0.27 234.60 0.63 42.20
Slope medium 1.08 13.30 -0.27 332.20 -2.97 51.00
Slope high 0.11 0.13 0.12
p-value 0.38 0.06 0.35
Source: Author’s calculations based on ES and DB data.
10
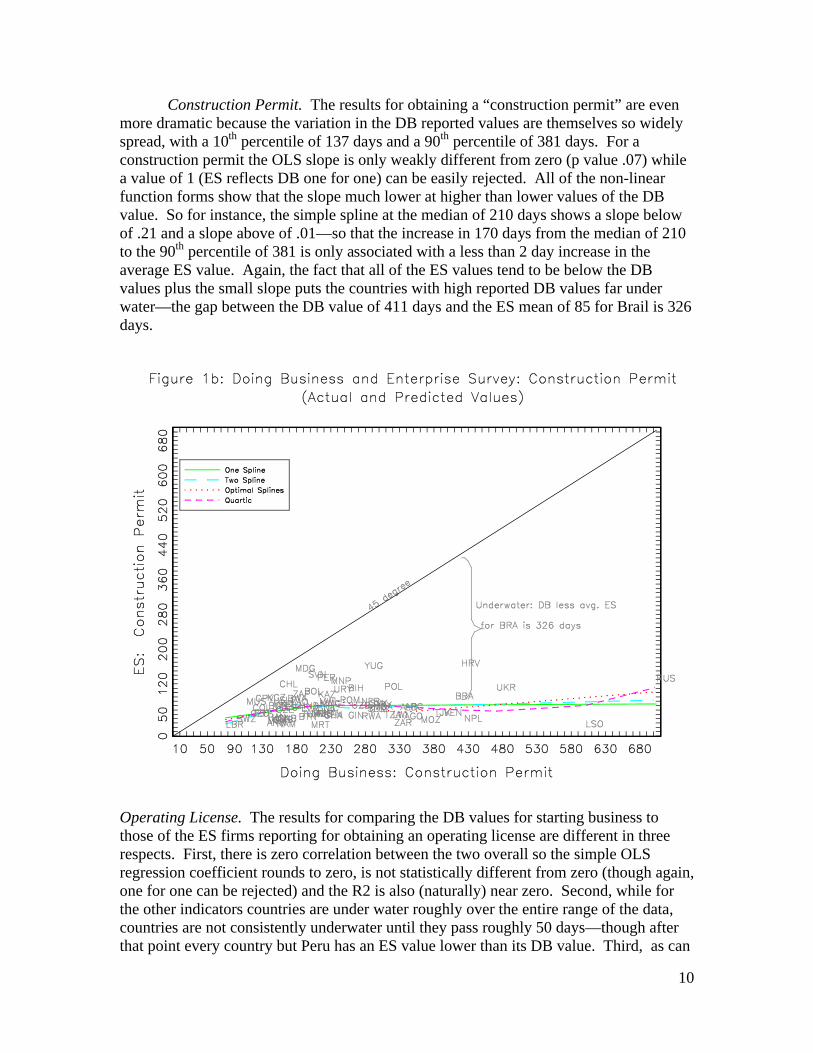
Construction Permit. The results for obtaining a “construction permit” are even more dramatic because the variation in the DB reported values are themselves so widely spread, with a 10th percentile of 137 days and a 90th percentile of 381 days. For a construction permit the OLS slope is only weakly different from zero (p value .07) while a value of 1 (ES reflects DB one for one) can be easily rejected. All of the non-linear function forms show that the slope much lower at higher than lower values of the DB value. So for instance, the simple spline at the median of 210 days shows a slope below of .21 and a slope above of .01—so that the increase in 170 days from the median of 210 to the 90th percentile of 381 is only associated with a less than 2 day increase in the average ES value. Again, the fact that all of the ES values tend to be below the DB values plus the small slope puts the countries with high reported DB values far under water—the gap between the DB value of 411 days and the ES mean of 85 for Brail is 326 days.
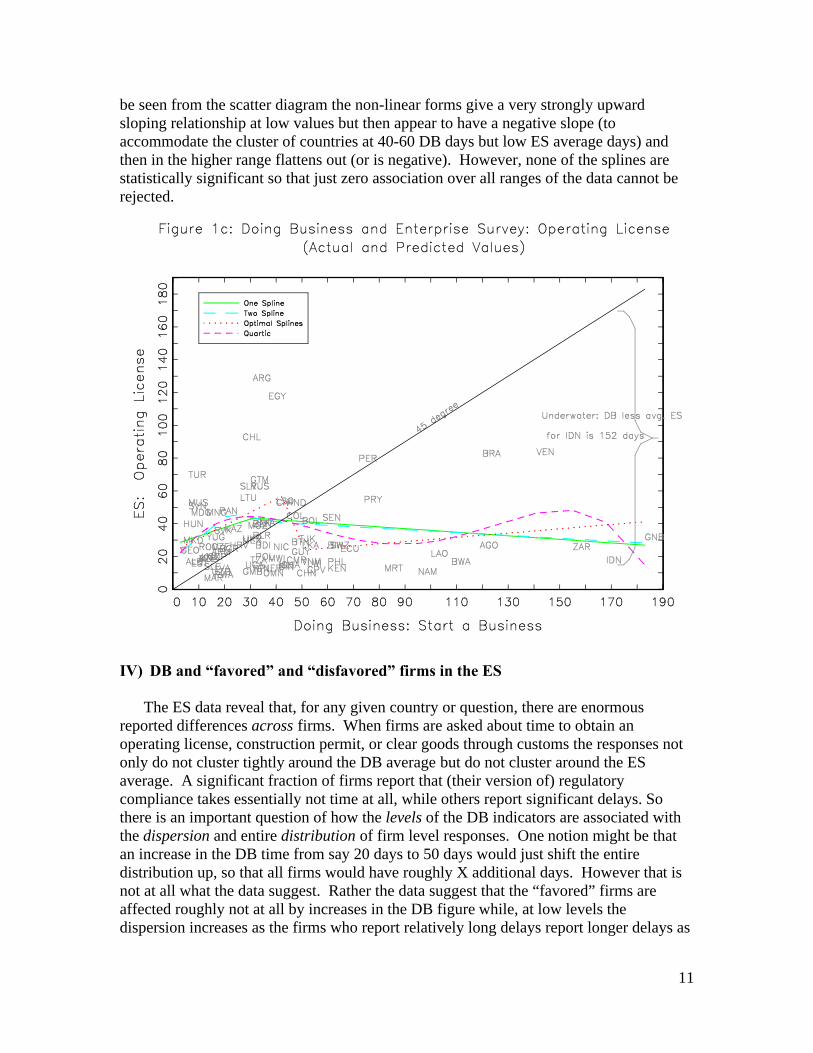
Operating License. The results for comparing the DB values for starting business to those of the ES firms reporting for obtaining an operating license are different in three respects. First, there is zero correlation between the two overall so the simple OLS regression coefficient rounds to zero, is not statistically different from zero (though again, one for one can be rejected) and the R2 is also (naturally) near zero. Second, while for the other indicators countries are under water roughly over the entire range of the data, countries are not consistently underwater until they pass roughly 50 days—though after that point every country but Peru has an ES value lower than its DB value. Third, as can
11
be seen from the scatter diagram the non-linear forms give a very strongly upward sloping relationship at low values but then appear to have a negative slope (to accommodate the cluster of countries at 40-60 DB days but low ES average days) and then in the higher range flattens out (or is negative). However, none of the splines are statistically significant so that just zero association over all ranges of the data cannot be rejected.
IV) DB and “favored” and “disfavored” firms in the ES
The ES data reveal that, for any given country or question, there are enormous reported differences across firms. When firms are asked about time to obtain an operating license, construction permit, or clear goods through customs the responses not only do not cluster tightly around the DB average but do not cluster around the ES average. A significant fraction of firms report that (their version of) regulatory compliance takes essentially not time at all, while others report significant delays. So there is an important question of how the levels of the DB indicators are associated with the dispersion and entire distribution of firm level responses. One notion might be that an increase in the DB time from say 20 days to 50 days would just shift the entire distribution up, so that all firms would have roughly X additional days. However that is not at all what the data suggest. Rather the data suggest that the “favored” firms are affected roughly not at all by increases in the DB figure while, at low levels the dispersion increases as the firms who report relatively long delays report longer delays as
12
the DB value goes up, but only to a point, after which there is roughly no effect on the distribution of responses at all.
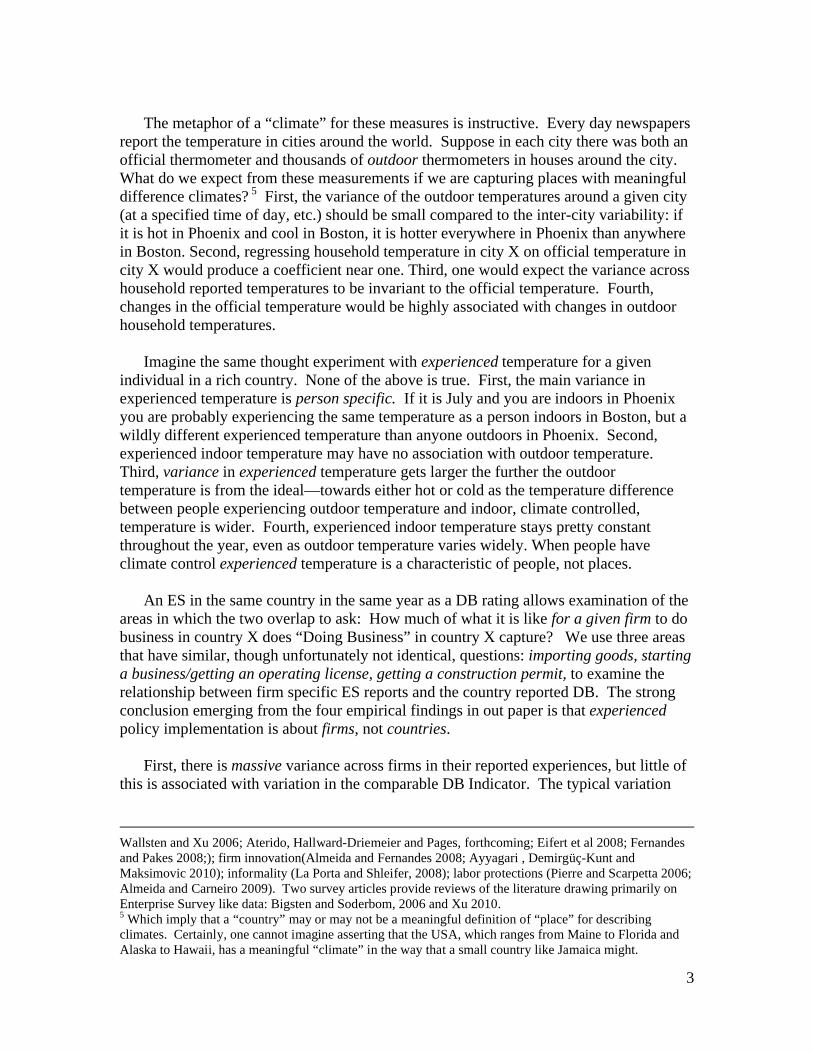
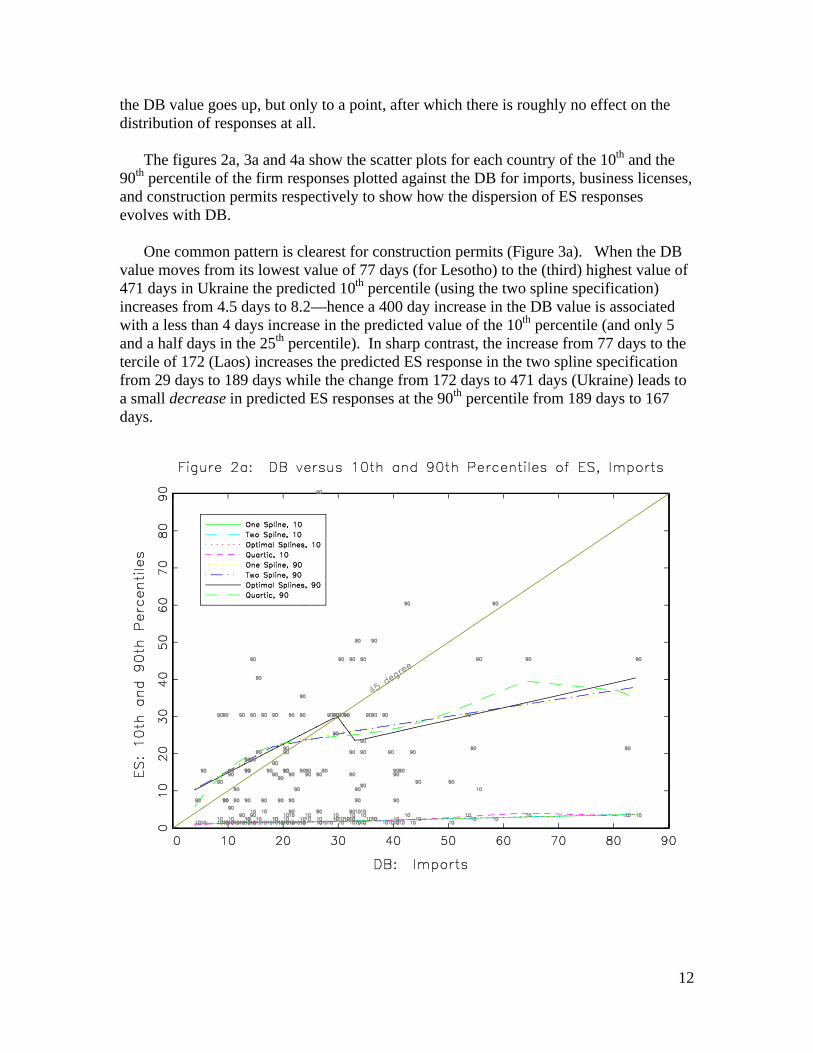
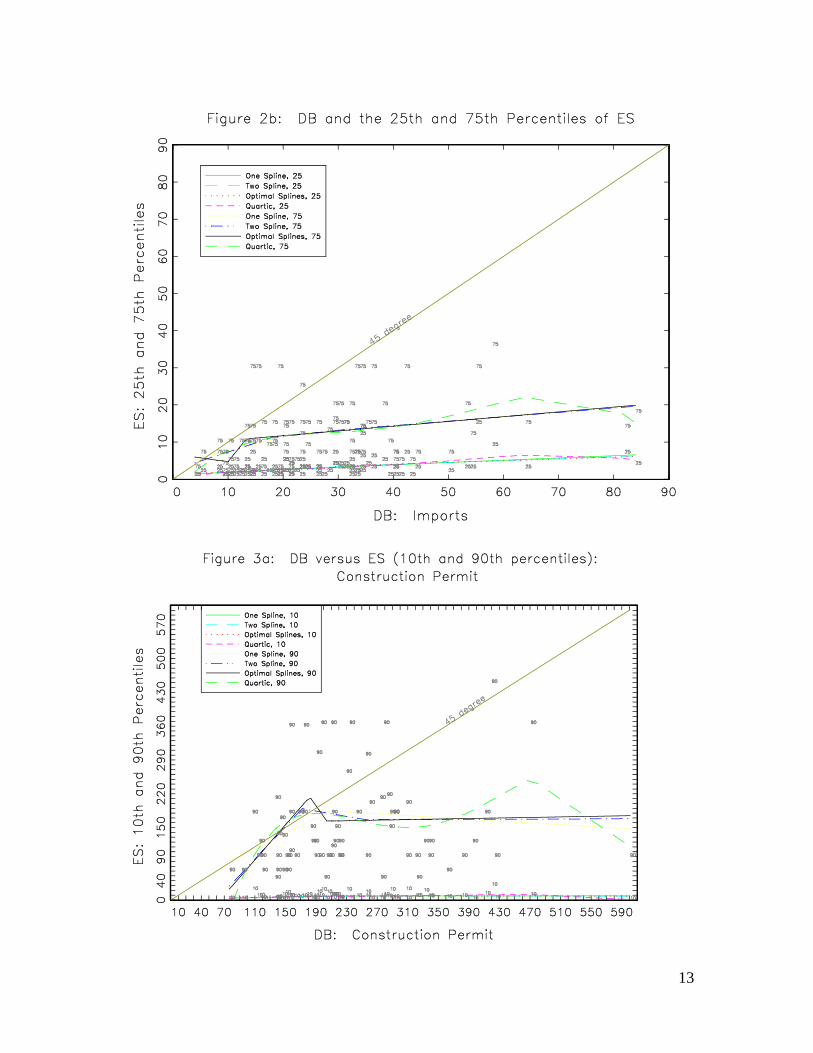
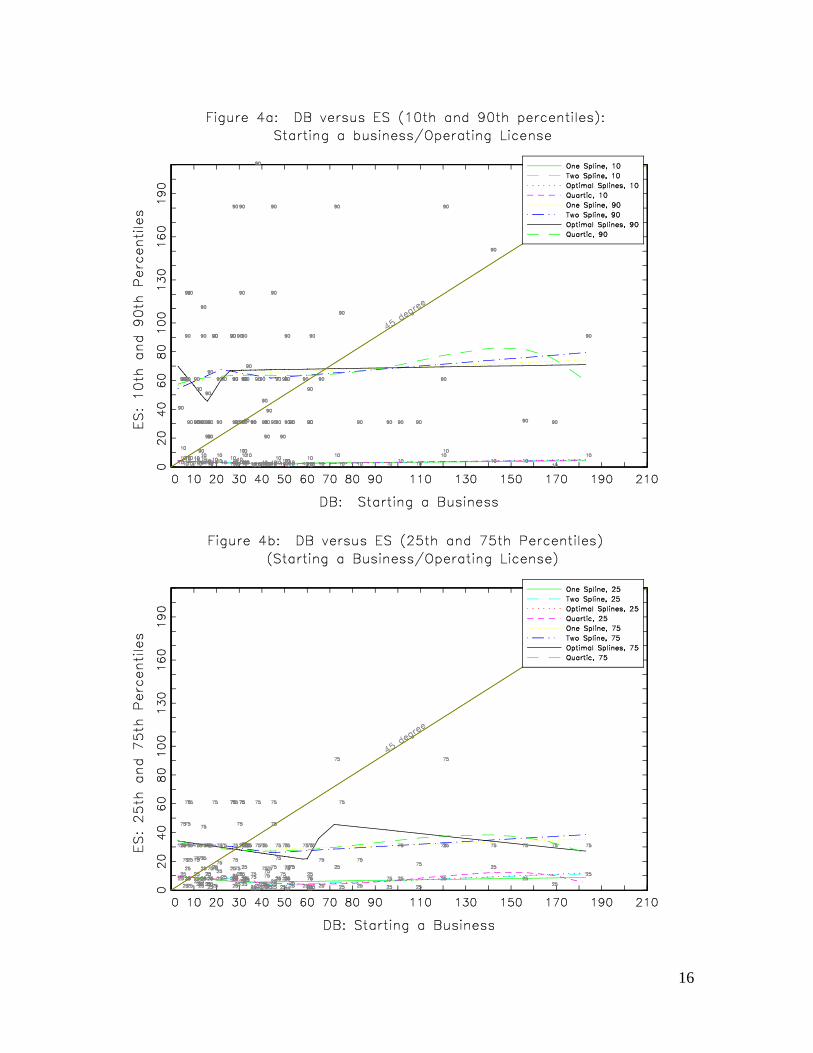
The figures 2a, 3a and 4a show the scatter plots for each country of the 10th and the 90th percentile of the firm responses plotted against the DB for imports, business licenses, and construction permits respectively to show how the dispersion of ES responses evolves with DB.
One common pattern is clearest for construction permits (Figure 3a). When the DB value moves from its lowest value of 77 days (for Lesotho) to the (third) highest value of 471 days in Ukraine the predicted 10th percentile (using the two spline specification) increases from 4.5 days to 8.2—hence a 400 day increase in the DB value is associated with a less than 4 days increase in the predicted value of the 10th percentile (and only 5 and a half days in the 25th percentile). In sharp contrast, the increase from 77 days to the tercile of 172 (Laos) increases the predicted ES response in the two spline specification from 29 days to 189 days while the change from 172 days to 471 days (Ukraine) leads to a small decrease in predicted ES responses at the 90th percentile from 189 days to 167 days.
13
14
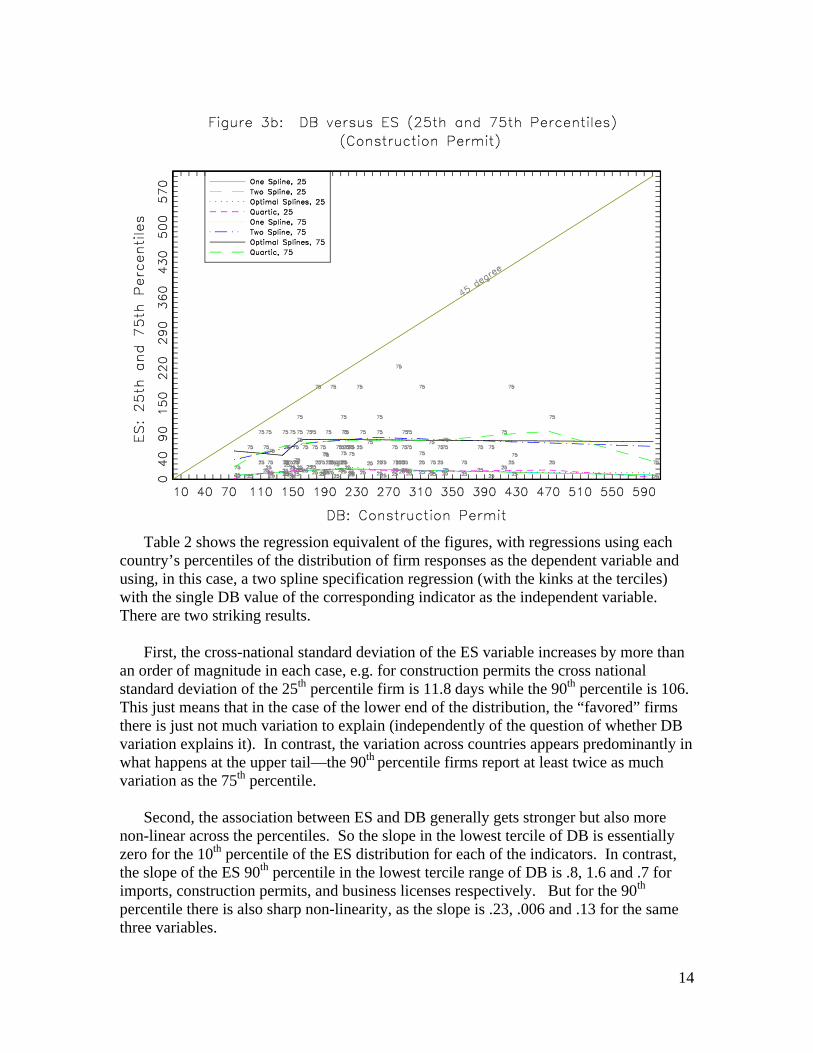
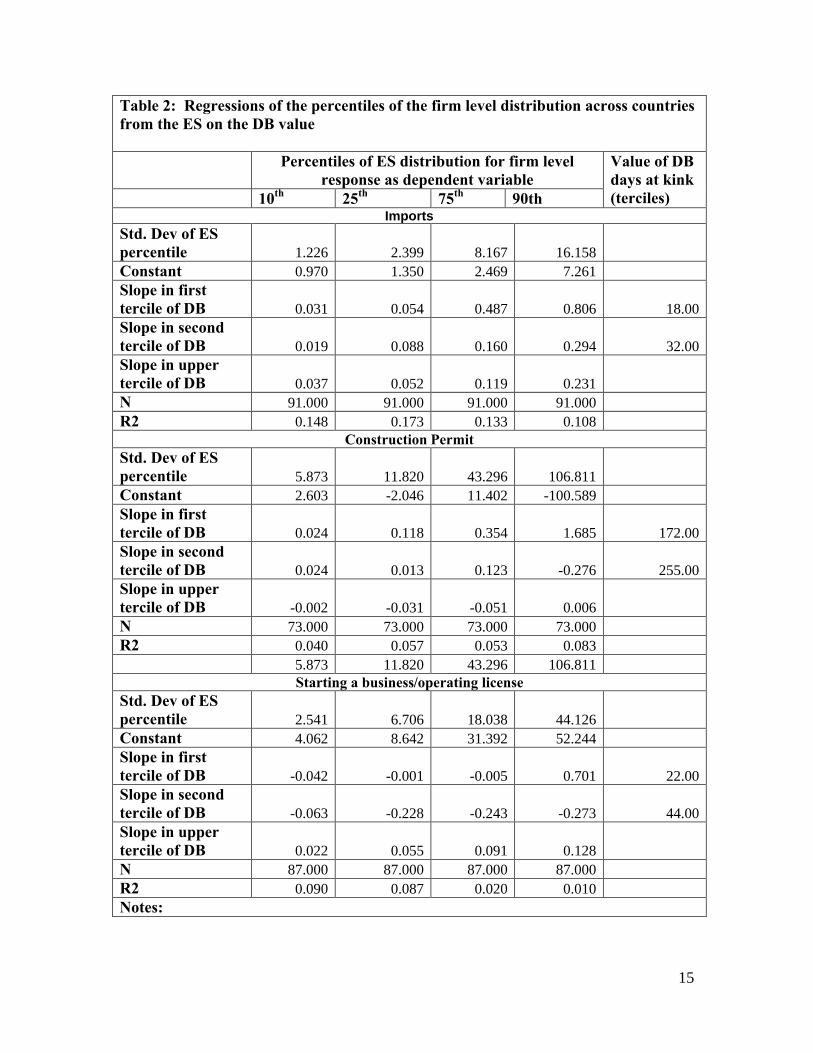
Table 2 shows the regression equivalent of the figures, with regressions using each country’s percentiles of the distribution of firm responses as the dependent variable and using, in this case, a two spline specification regression (with the kinks at the terciles) with the single DB value of the corresponding indicator as the independent variable. There are two striking results.
First, the cross-national standard deviation of the ES variable increases by more than an order of magnitude in each case, e.g. for construction permits the cross national standard deviation of the 25th percentile firm is 11.8 days while the 90th percentile is 106. This just means that in the case of the lower end of the distribution, the “favored” firms there is just not much variation to explain (independently of the question of whether DB variation explains it). In contrast, the variation across countries appears predominantly in what happens at the upper tail—the 90th percentile firms report at least twice as much variation as the 75th percentile.
Second, the association between ES and DB generally gets stronger but also more non-linear across the percentiles. So the slope in the lowest tercile of DB is essentially zero for the 10th percentile of the ES distribution for each of the indicators. In contrast, the slope of the ES 90th percentile in the lowest tercile range of DB is .8, 1.6 and .7 for imports, construction permits, and business licenses respectively. But for the 90th
percentile there is also sharp non-linearity, as the slope is .23, .006 and .13 for the same three variables.
15
Table 2: Regressions of the percentiles of the firm level distribution across countries from the ES on the DB value
Percentiles of ES distribution for firm level response as dependent variable
Value of DB days at kink (terciles)10th 25th 75th 90th
Imports
Std. Dev of ES percentile 1.226 2.399 8.167 16.158Constant 0.970 1.350 2.469 7.261Slope in first tercile of DB 0.031 0.054 0.487 0.806 18.00Slope in second tercile of DB 0.019 0.088 0.160 0.294 32.00Slope in upper tercile of DB 0.037 0.052 0.119 0.231N 91.000 91.000 91.000 91.000R2 0.148 0.173 0.133 0.108
Construction PermitStd. Dev of ES percentile 5.873 11.820 43.296 106.811Constant 2.603 -2.046 11.402 -100.589Slope in first tercile of DB 0.024 0.118 0.354 1.685 172.00Slope in second tercile of DB 0.024 0.013 0.123 -0.276 255.00Slope in upper tercile of DB -0.002 -0.031 -0.051 0.006N 73.000 73.000 73.000 73.000R2 0.040 0.057 0.053 0.083
5.873 11.820 43.296 106.811Starting a business/operating license
Std. Dev of ES percentile 2.541 6.706 18.038 44.126Constant 4.062 8.642 31.392 52.244Slope in first tercile of DB -0.042 -0.001 -0.005 0.701 22.00Slope in second tercile of DB -0.063 -0.228 -0.243 -0.273 44.00Slope in upper tercile of DB 0.022 0.055 0.091 0.128N 87.000 87.000 87.000 87.000R2 0.090 0.087 0.020 0.010Notes:
16
17
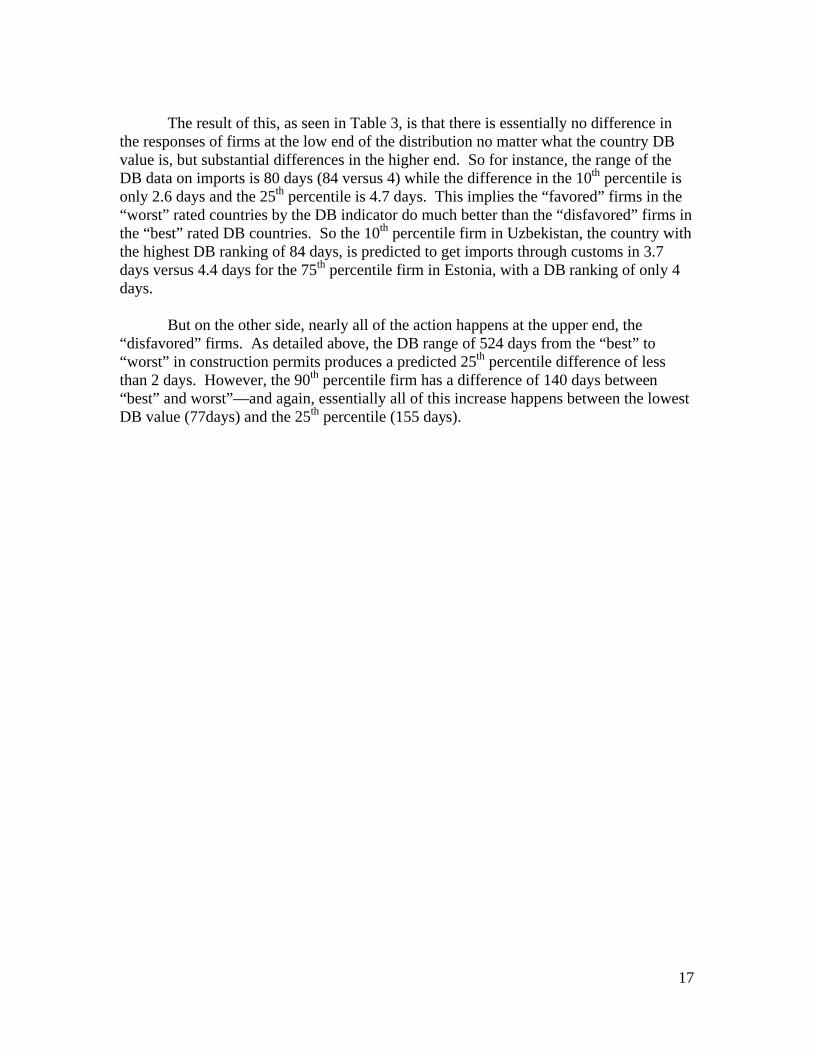
The result of this, as seen in Table 3, is that there is essentially no difference in the responses of firms at the low end of the distribution no matter what the country DB value is, but substantial differences in the higher end. So for instance, the range of the DB data on imports is 80 days (84 versus 4) while the difference in the 10th percentile isonly 2.6 days and the 25th percentile is 4.7 days. This implies the “favored” firms in the “worst” rated countries by the DB indicator do much better than the “disfavored” firms in the “best” rated DB countries. So the 10th percentile firm in Uzbekistan, the country with the highest DB ranking of 84 days, is predicted to get imports through customs in 3.7 days versus 4.4 days for the 75th percentile firm in Estonia, with a DB ranking of only 4 days.
But on the other side, nearly all of the action happens at the upper end, the “disfavored” firms. As detailed above, the DB range of 524 days from the “best” to “worst” in construction permits produces a predicted 25th percentile difference of less than 2 days. However, the 90th percentile firm has a difference of 140 days between “best” and worst”—and again, essentially all of this increase happens between the lowest DB value (77days) and the 25th percentile (155 days).
18
Table 3: Predicted values of various percentiles of the distribution across firms from the ES at various levels of the country DB value
Ranking in the DB distribution across countries
Country Actual DB value
Percentiles of the distribution across firms in the ES (predicted using two spline regression)10th 25th 75th 90th
Imports
Min EST 4 1.1 1.6 4.4 10.525th MEX 15 1.4 2.2 9.8 19.450th NPL 23 1.6 2.8 12.0 23.275th BDI 34 1.9 3.7 13.7 26.3Max UZB 84 3.7 6.3 19.6 37.9Difference Max-Min 80 2.6 4.7 15.2 27.4
Construction Permits
Min LBR 77 4.5 7.0 38.7 29.125th CHL 155 6.4 16.2 66.3 160.650th PER 210 7.7 18.7 77.0 178.775th GTM 286 8.7 18.3 81.0 166.5Max LSO 601 7.9 8.5 65.0 168.3Difference Max-Min 524 3.4 1.4 26.3 139.2
Business/Operating License
Min GEO 3 3.9 8.6 31.4 54.325th SVK 16 3.4 8.6 31.3 63.550th NPL 31 2.6 6.6 29.1 65.275th BOL 50 1.9 3.9 26.5 62.4Max GNB 183 4.9 11.3 38.5 79.4Difference Max-Min 180 0.9 2.6 7.2 25.1
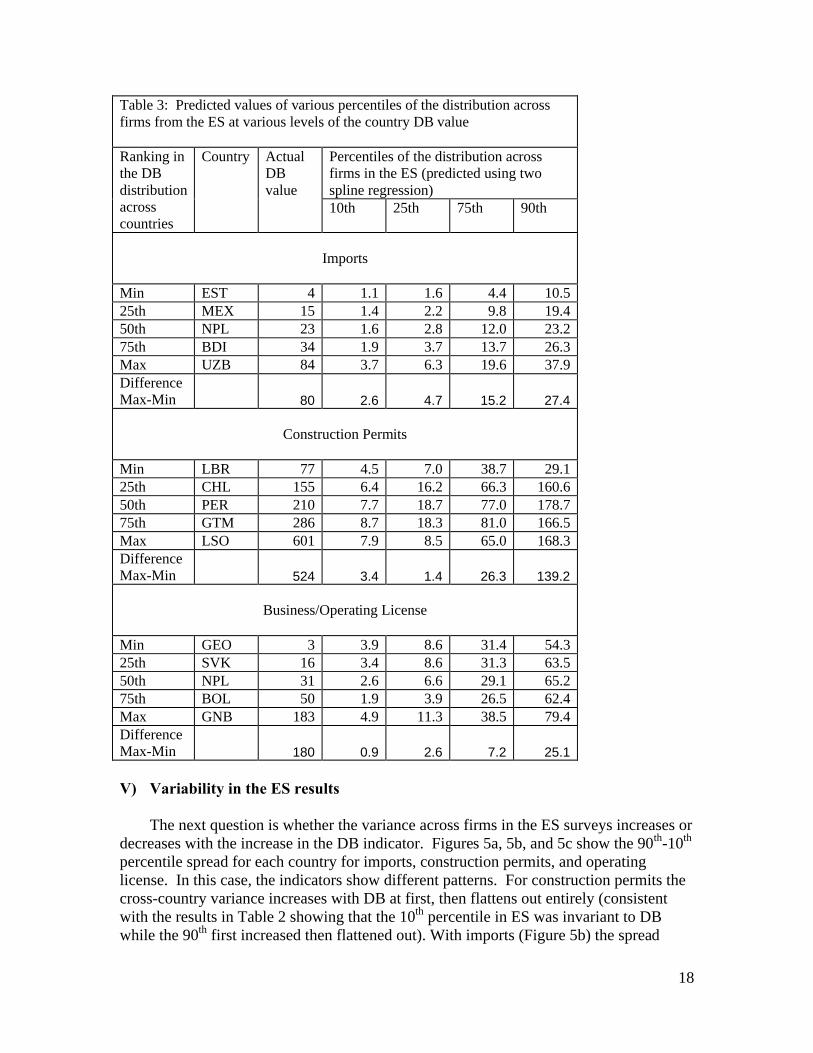
V) Variability in the ES results
The next question is whether the variance across firms in the ES surveys increases or decreases with the increase in the DB indicator. Figures 5a, 5b, and 5c show the 90th-10th
percentile spread for each country for imports, construction permits, and operating license. In this case, the indicators show different patterns. For construction permits the cross-country variance increases with DB at first, then flattens out entirely (consistent with the results in Table 2 showing that the 10th percentile in ES was invariant to DB while the 90th first increased then flattened out). With imports (Figure 5b) the spread
19
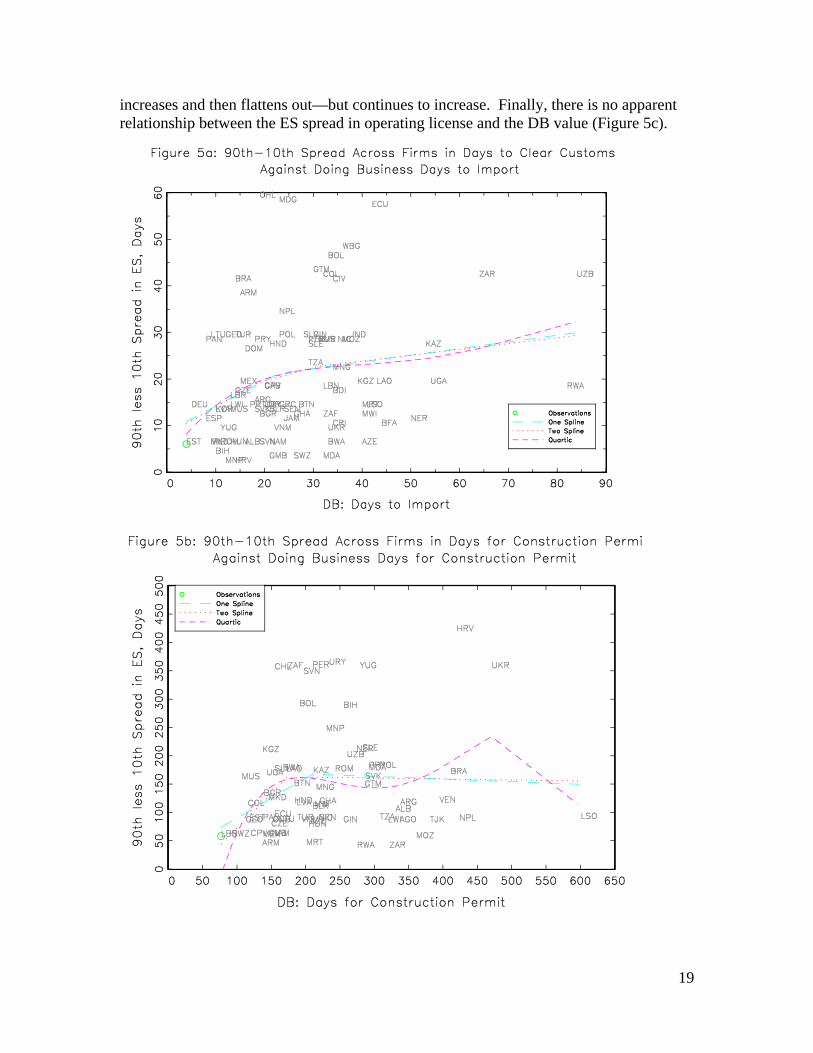
increases and then flattens out—but continues to increase. Finally, there is no apparent relationship between the ES spread in operating license and the DB value (Figure 5c).
20
Table 4 is the regression equivalent of the figures which shows that the tendencies in the graphs are typically not statistically significant. For construction permits for instance the lowest slope is 1.22 and falls to .010 and -.018 in the upper ranges of the DB data. However, the F-test on the spline terms fails to reject that 1.22 and .010 are different because the standard errors on each coefficient are so large—the data cannot reject that 1.22 is equal to zero (t-stat is only 1.84) so cannot reject it is equal to .01.
21
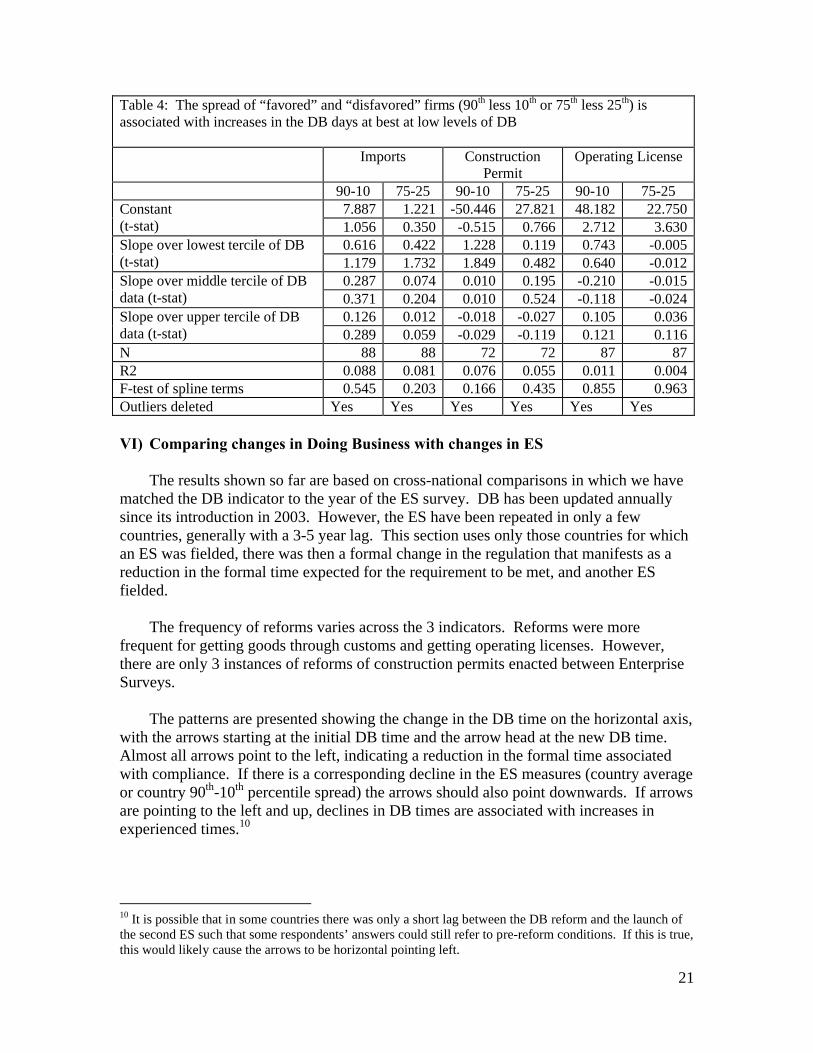
Table 4: The spread of “favored” and “disfavored” firms (90th less 10th or 75th less 25th) is associated with increases in the DB days at best at low levels of DB
Imports Construction Permit
Operating License
90-10 75-25 90-10 75-25 90-10 75-25Constant (t-stat)
7.887 1.221 -50.446 27.821 48.182 22.7501.056 0.350 -0.515 0.766 2.712 3.630
Slope over lowest tercile of DB(t-stat)
0.616 0.422 1.228 0.119 0.743 -0.0051.179 1.732 1.849 0.482 0.640 -0.012
Slope over middle tercile of DB data (t-stat)
0.287 0.074 0.010 0.195 -0.210 -0.0150.371 0.204 0.010 0.524 -0.118 -0.024
Slope over upper tercile of DB data (t-stat)
0.126 0.012 -0.018 -0.027 0.105 0.0360.289 0.059 -0.029 -0.119 0.121 0.116
N 88 88 72 72 87 87R2 0.088 0.081 0.076 0.055 0.011 0.004F-test of spline terms 0.545 0.203 0.166 0.435 0.855 0.963Outliers deleted Yes Yes Yes Yes Yes Yes
VI) Comparing changes in Doing Business with changes in ES
The results shown so far are based on cross-national comparisons in which we have matched the DB indicator to the year of the ES survey. DB has been updated annually since its introduction in 2003. However, the ES have been repeated in only a few countries, generally with a 3-5 year lag. This section uses only those countries for which an ES was fielded, there was then a formal change in the regulation that manifests as a reduction in the formal time expected for the requirement to be met, and another ES fielded.
The frequency of reforms varies across the 3 indicators. Reforms were more frequent for getting goods through customs and getting operating licenses. However, there are only 3 instances of reforms of construction permits enacted between Enterprise Surveys.
The patterns are presented showing the change in the DB time on the horizontal axis, with the arrows starting at the initial DB time and the arrow head at the new DB time. Almost all arrows point to the left, indicating a reduction in the formal time associated with compliance. If there is a corresponding decline in the ES measures (country average or country 90th-10th percentile spread) the arrows should also point downwards. If arrows are pointing to the left and up, declines in DB times are associated with increases in experienced times.10
10 It is possible that in some countries there was only a short lag between the DB reform and the launch of the second ES such that some respondents’ answers could still refer to pre-reform conditions. If this is true, this would likely cause the arrows to be horizontal pointing left.
22
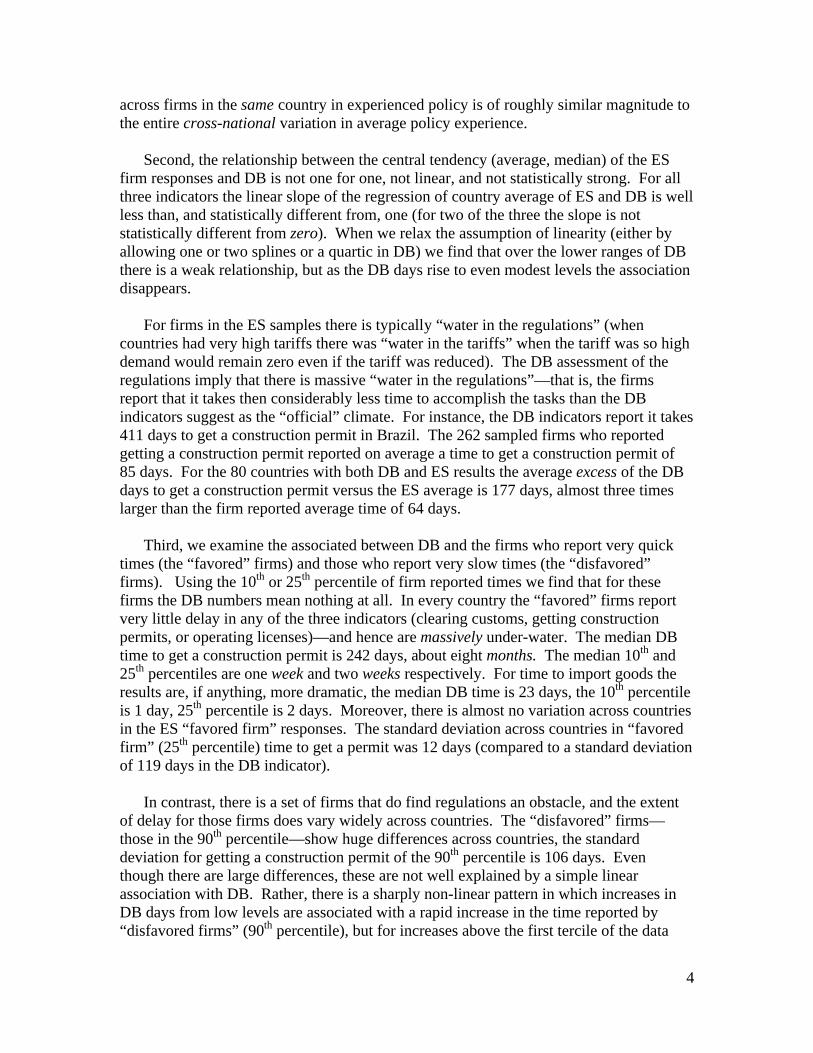
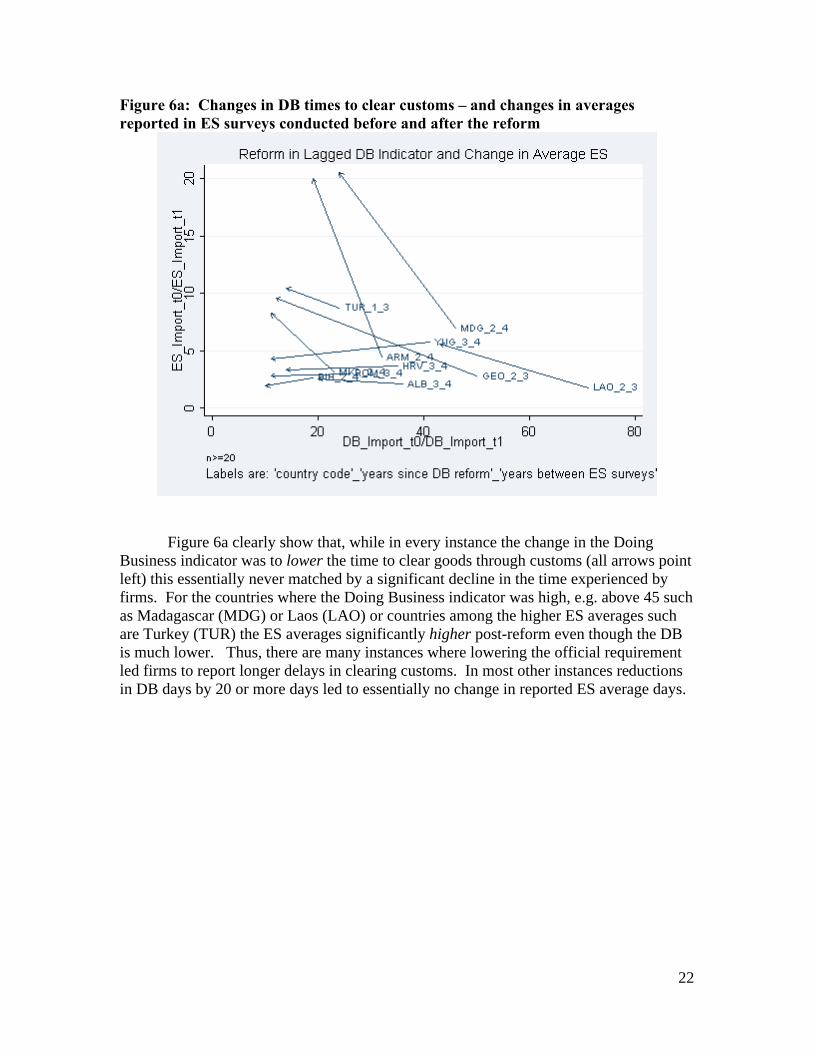
Figure 6a: Changes in DB times to clear customs – and changes in averages reported in ES surveys conducted before and after the reform
Figure 6a clearly show that, while in every instance the change in the Doing Business indicator was to lower the time to clear goods through customs (all arrows point left) this essentially never matched by a significant decline in the time experienced by firms. For the countries where the Doing Business indicator was high, e.g. above 45 such as Madagascar (MDG) or Laos (LAO) or countries among the higher ES averages such are Turkey (TUR) the ES averages significantly higher post-reform even though the DB is much lower. Thus, there are many instances where lowering the official requirement led firms to report longer delays in clearing customs. In most other instances reductions in DB days by 20 or more days led to essentially no change in reported ES average days.
23
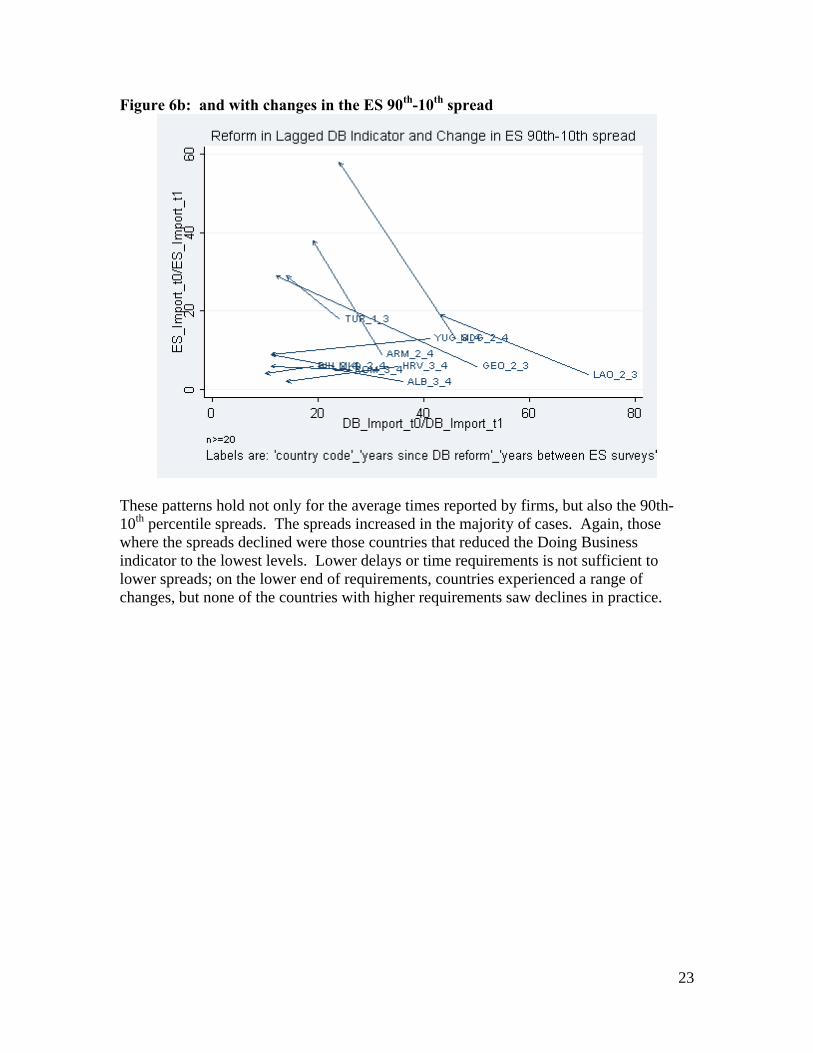
Figure 6b: and with changes in the ES 90th-10th spread
These patterns hold not only for the average times reported by firms, but also the 90th-10th percentile spreads. The spreads increased in the majority of cases. Again, those where the spreads declined were those countries that reduced the Doing Business indicator to the lowest levels. Lower delays or time requirements is not sufficient to lower spreads; on the lower end of requirements, countries experienced a range of changes, but none of the countries with higher requirements saw declines in practice.
24
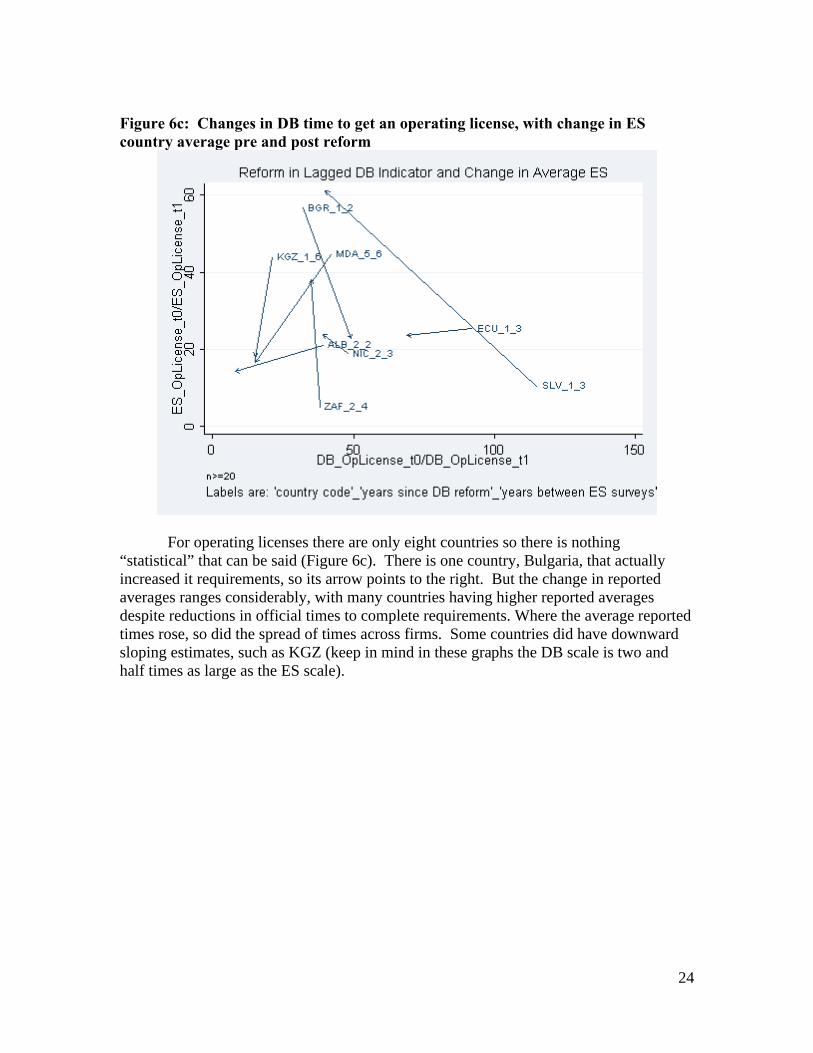
Figure 6c: Changes in DB time to get an operating license, with change in ES country average pre and post reform
For operating licenses there are only eight countries so there is nothing “statistical” that can be said (Figure 6c). There is one country, Bulgaria, that actually increased it requirements, so its arrow points to the right. But the change in reported averages ranges considerably, with many countries having higher reported averages despite reductions in official times to complete requirements. Where the average reported times rose, so did the spread of times across firms. Some countries did have downward sloping estimates, such as KGZ (keep in mind in these graphs the DB scale is two and half times as large as the ES scale).
25
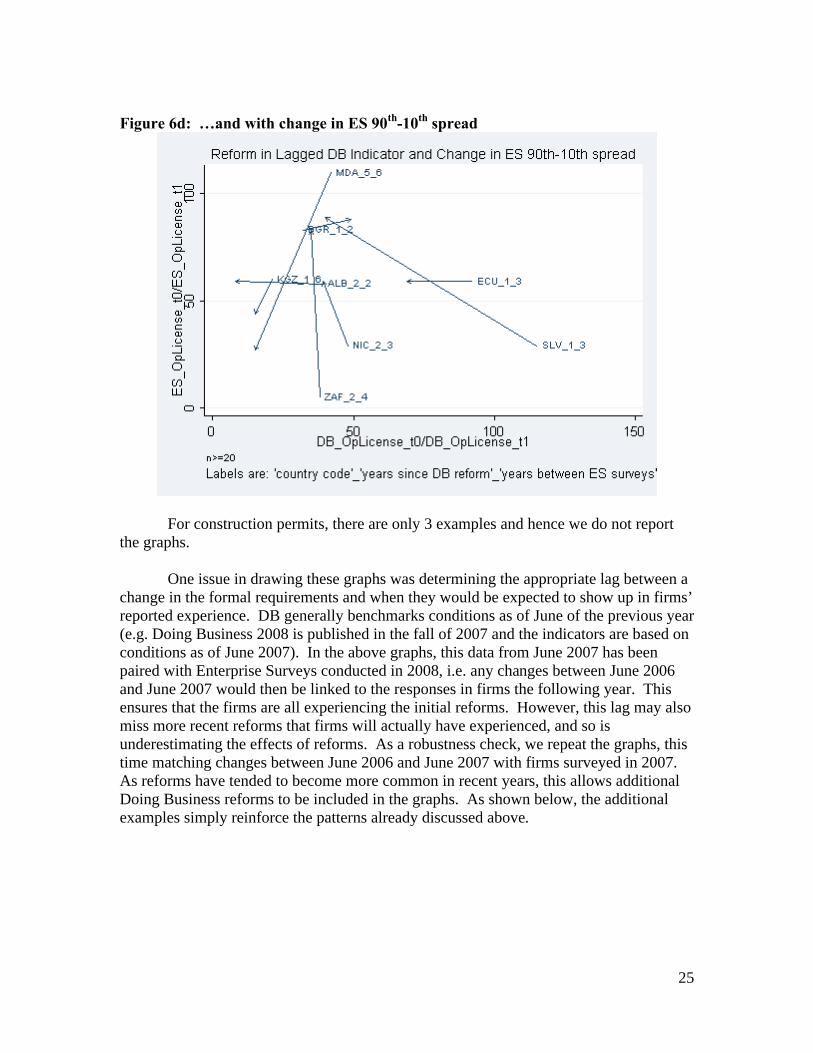
Figure 6d: …and with change in ES 90th-10th spread
For construction permits, there are only 3 examples and hence we do not report the graphs.
One issue in drawing these graphs was determining the appropriate lag between a change in the formal requirements and when they would be expected to show up in firms’ reported experience. DB generally benchmarks conditions as of June of the previous year (e.g. Doing Business 2008 is published in the fall of 2007 and the indicators are based on conditions as of June 2007). In the above graphs, this data from June 2007 has been paired with Enterprise Surveys conducted in 2008, i.e. any changes between June 2006 and June 2007 would then be linked to the responses in firms the following year. This ensures that the firms are all experiencing the initial reforms. However, this lag may also miss more recent reforms that firms will actually have experienced, and so is underestimating the effects of reforms. As a robustness check, we repeat the graphs, this time matching changes between June 2006 and June 2007 with firms surveyed in 2007. As reforms have tended to become more common in recent years, this allows additional Doing Business reforms to be included in the graphs. As shown below, the additional examples simply reinforce the patterns already discussed above.
26
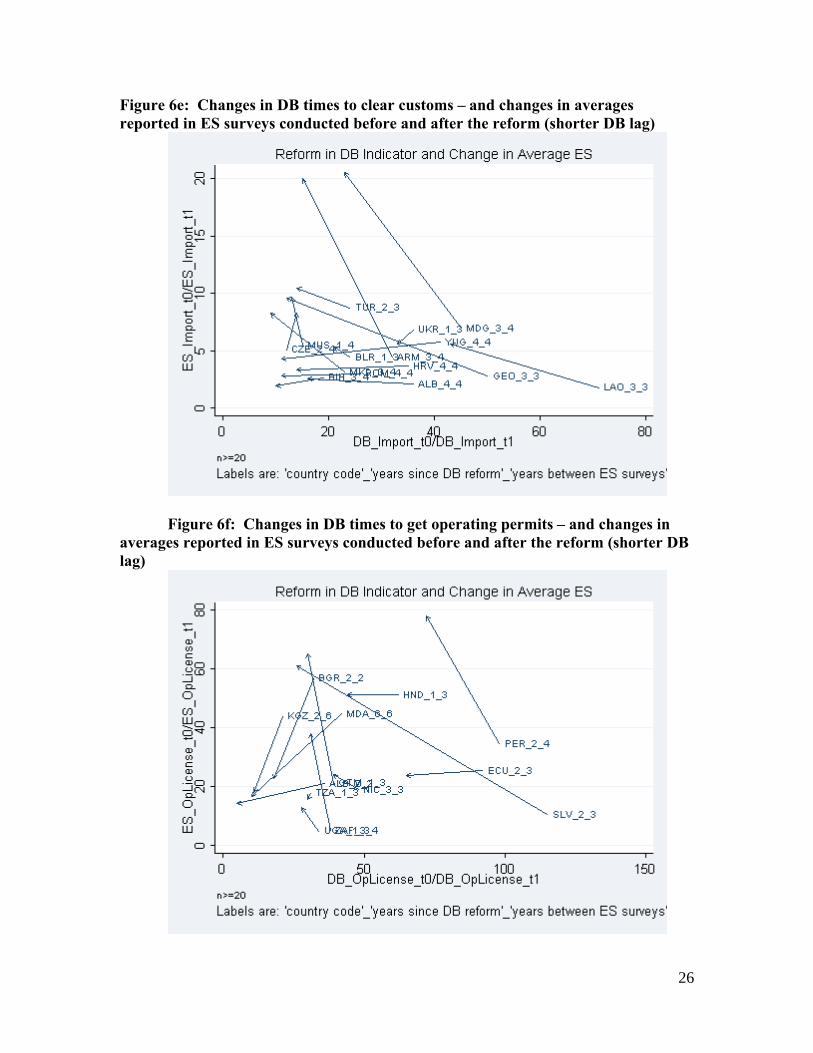
Figure 6e: Changes in DB times to clear customs – and changes in averages reported in ES surveys conducted before and after the reform (shorter DB lag)
Figure 6f: Changes in DB times to get operating permits – and changes in averages reported in ES surveys conducted before and after the reform (shorter DB lag)
27
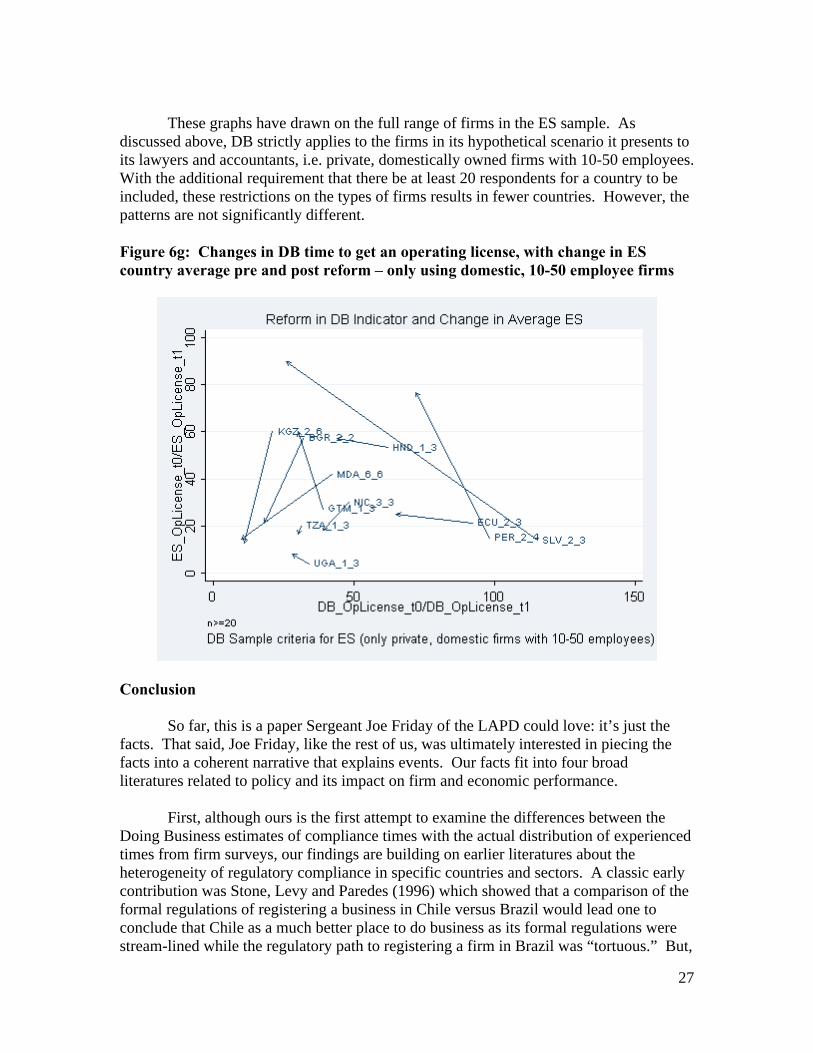
These graphs have drawn on the full range of firms in the ES sample. As discussed above, DB strictly applies to the firms in its hypothetical scenario it presents to its lawyers and accountants, i.e. private, domestically owned firms with 10-50 employees. With the additional requirement that there be at least 20 respondents for a country to be included, these restrictions on the types of firms results in fewer countries. However, the patterns are not significantly different.
Figure 6g: Changes in DB time to get an operating license, with change in ES country average pre and post reform – only using domestic, 10-50 employee firms
Conclusion
So far, this is a paper Sergeant Joe Friday of the LAPD could love: it’s just the facts. That said, Joe Friday, like the rest of us, was ultimately interested in piecing the facts into a coherent narrative that explains events. Our facts fit into four broad literatures related to policy and its impact on firm and economic performance.
First, although ours is the first attempt to examine the differences between the Doing Business estimates of compliance times with the actual distribution of experienced times from firm surveys, our findings are building on earlier literatures about the heterogeneity of regulatory compliance in specific countries and sectors. A classic early contribution was Stone, Levy and Paredes (1996) which showed that a comparison of the formal regulations of registering a business in Chile versus Brazil would lead one to conclude that Chile as a much better place to do business as its formal regulations were stream-lined while the regulatory path to registering a firm in Brazil was “tortuous.” But,
28
when they examined actual practice they found that in response to this difficulty of the formal regulations an industry of negotiating this on behalf of firms had emerged that made business registration “a fairly affordable one-stop process.” Pritchett and Sethi (1994) had many of the same findings for the collection of import tariffs. They showed that: (a) the collected ad valorem tariff rates were much lower than the legal ad valorem tariff; (b) that collected tariff rates increased much less than one for one with legal tariffs; and (c) huge heterogeneity in collected tariff rates across items with the exact same legal tariff. Similarly, Gauthier and Gersovitz (1997) use a survey of firms in Cameroon to show how tax exemptions and evasion at the firm specific level cause massive deviations between the hypothetical de jure tax revenues if the tax code were applied and the actual revenues collected. A recent application of randomization investigated the granting of driver’s licenses in Delhi India (Bertrand, Djankov, Hanna, Mullainathan 2007) and found that individuals who hired a tout were effectively exempted from one element of regulatory compliance (the driving exam) while those who did not hire a tout did have to take the exam (and often failed). Our findings confirm at a cross-national scale and for a number of indicators the commonly observed, but hard to document, fact that policy implementation often deviates from the stated policy, in firm (or individual) specific ways.
Second, our findings are also related to the large literature on corruption and its relationship to firm profitability, regulatory compliance, and regulations themselves and hence on economic performance (e.g. Shleifer and Vishny 1993). Fisman (2001) uses the connection between variations in the stock market value of firms in Indonesia, their connections to Suharto, and information about Suharto’s health to show that often a significant value of the firm’s value was due to their political connections, presumably because these connections allowed them greater profitability. Research on the transition in post-communist countries, in which “institutions” were in flux showed that firms used their profits to both block future reform (Hellmann 1998), create “crony bias” through an “inequality of influence” that deterred other firms from relying on or engaging with state institutions (Hellmann and Kaufmann 2002), and even “capture” the state to change the laws and regulations themselves to disadvantage rivals (Hellman, Jones and Kaufmann 2000). While our paper provides no direct evidence at all of corruption, the massive, firm specific deviations in reported compliance times and the deviation from the Doing Business estimated times to compliance are at least consistent with environments of policy implementation that are permeable.
Third, a massive current puzzle for economists is explaining the differential response of economic growth to the policy reforms of the 1980s and 1990s—which some countries booming after modest reforms while others stagnating even after massive reforms (World Bank 2005) and more broadly the pattern of growth accelerations and decelerations (Hausmann, Pritchett, Rodrik 2005, Jones and Olken, 2007). At least one hypothesis for explaining the differential responses to “policy reform” may be that when de jure and de facto policy have diverged the impact of de jure reform might have wildly different effects, depending on how it affects firm’s distribution of expectations (both mean and variance) about their future experienced policy (Pritchett 2005). To revert to the temperature analogy, the average daily high temperature in July is Phoenix is 105 but
29
most people are not hot, they are indoors. How much would the experienced temperature change if the daily high were reduced to 100? To 95? Actually it might be somewhat higher as more people would be outdoors while those indoors would be the same temperature. On the other hand, if air conditioning were banned, experienced temperature would sky-rocket with no change in the climate. Given our evidence, it is a completely open question how DB indicators (as proxies for costs of compliance) would have to be before the experienced investment climate of most firms was affected—or became attractive to compliance constrained investors. In our previous paper “Deals versus Rules” (Hallward-Driemeier, Khun-Jush, and Pritchett 2010) we showed the firm performance was affected by measures of the variability of the policy implementation they faced, more so than the level. By the reverse of the same token, initiatives that have minimal impact on de jure policy but which signal a decisive shift in policy implementation might have substantial and immediate impacts on investor expectations and initiate an acceleration of growth11.
Finally, our evidence speaks to the emerging debates about “industrial policy” and its role in spurring “structural transformation” (Lin 2009) or moves through the “product space” (Hidalgo, Klinger, Barabasi, and Hausmann 2007) by acquiring “capabilities” (Hausmann and Hidalgo 2009). However, our data speak to this debate in two very different ways.
On the one hand, there is a notion that “industrial policy” is a danger because governments should only maintain a “level playing field” that treats all firms, activities, and sectors exactly alike and just make and neutrally enforce a set of rules. Whatever merits that might have where something like a level playing field could, in principle, be played on, our evidence strongly suggests that almost no firm is actually playing on a level playing field now—both in that there appear to be massive deviations from compliance on average, and in the sense that those deviations vary widely across firms. Whether or not there optimally “should” be a level playing field there isn’t one now, so industrial policy would be another form of “unlevel” not an “unleveling.”
Very much on the other hand, our evidence could be easily taken as evidence of just how hard it is for governments to pursue discretionary industrial policy. With weak institutions the risks of available discretion being abused for “rent seeking” and “directly unproductive” activities along the lines of the classic critiques of Krueger (1974) are very real. There is nothing inherently contradictory about the notion that industrial policy, if one could implement it well, would accelerate growth but that most countries, and especially those that need growth the most, lack the wherewithal for policy implementation. This then raises as an important question whether or not one can square this circle and devise “institutionally robust” industrial policies capable of implementation even when overall institutions are weak (Hausmann and Rodrik 2006, Rodrik 2008, 2009).
11 As many argue happened in China after 1978 after Deng’s announcements or India with a shift to “pro-business” attitudes in the 1980s (Rodrik and Subramanian 2004) or in the 1990s with decisively announced but gradualist implementation.

30
31
References
Almeida, Rita and Pedro Carneiro, 2009. Enforcement of Labor Regulation and Firm Size. Journal of Comparative Economics Vol. 37, Issue 1 (March) pp. 28-46.
Almeida, Rita and Ana Margarida Fernandes, 2008. "Openness and Technological Innovations in Developing Countries: Evidence from Firm-Level Surveys," The Journal of Development Studies, 44(5) pp. 701-727.
Aterido, Reyes, Mary Hallward-Driemeier and Carmen Pages. Forthcoming. “Big Constraints to Small Firms’ Growth?” Economic Development and Cultural Change.
Ayyagari, Meghana , Asli Demirgüç-Kunt and Vojislav Maksimovic. 2008. “How Important are Financing Constraints? The Role of Finance in the Business Environment.” World Bank Economic Review, 22(3), pp. 483-516.
Ayyagari, Meghana , Asli Demirgüç-Kunt and Vojislav Maksimovic. 2010. "Are innovating firms victims or perpetrators ? tax evasion, bribe payments, and the role of external finance in developing countries," Policy Research Working Paper Series 5389, The World Bank.
Beck, Thorsten, Asli Demirguc-Kunt, Luc Laeven, and Ross Levine. 2008. “Finance, Firm Size and Growth.” Journal of Money, Credit and Banking, 40(7), pp. 1379-1405.
Beck, Thorsten, Asli Demirgüç-Kunt and Vojislav Maksimovic. 2005. “Financial and Legal Constraints to Growth: Does Firm Size Matter?” Journal of Finance 60(1): 131-177.
Bertrand, Marianne, Simeon Djankov, Rema Hanna and Sendhi Mullainathan, 2007, “Does Corruption Produce Unsafe Drivers?” Quarterly Journal of Economics.
Bolaky, Bineswaree and Caroline Freund. 2008. "Trade, regulations, and income," Journal of Development Economics, 87(2), pages 309-321.
Botero, Juan, Simeon Djankov, Rafael La Porta, Florencio Lopez de Silanes, and Andrei Shleifer. 2004. “The Regulation of Labor.” Quarterly Journal of Economics, 119 (4), pp1339-1382.
Bruhn, Miriam. Forthcoming. "License to Sell: The Effect of Business Registration Reform on Entrepreneurial Activity in Mexico," Review of Economics and Statistics.
Cai, Hongbin, Hanming Fang, and Lixin Colin Xu. 2011. “Eat, Drink, Firms, Government: An Investigation of Corruption”
Djankov, S., R. La Porta, F. Lopez-De-Silanes, A. Shleifer. 2002. “The Regulation of Entry.” Quarterly Journal of Economics 117(1): 1-37.
32
Djankov, Simeion, R. La Porta, F. Lopez-de-Silanes, and A. Shleifer. 2003. “Courts”, Quarterly Journal of Economics.
Djankov, Simeon, Caralee McLiesh, and Andrei Shleifer. 2007. “ Private Credit in 129 Countries.” Journal of Financial Economics, 84: 299-329.
Dollar, David, Mary Hallward-Driemeier and Taye Mengistae. 2005. “Investment Climate and Firm Performance in Developing Countries.” Economic Development and Cultural Change 54(1): 1-31.
Dollar, David, Mary Hallward-Driemeier, and Taye Mengistae. 2006. “Investment Climate and International Integration.” World Development 34(9), 1498-1516.
Eiffert, Benn, Alan Gelb and Vijaya Ramachandran. 2008. ”The Cost of Doing Business in Africa: Evidence from Enterprise Survey Data” World Development, 36(9), pp. 1531-1546.
Benn Eifert. 2009. “Do Regulatory Reforms Stimulate Investment and Growth?” Center for Global Development, Working Paper Number 159
Fernandes, A. and A. Pakes 2008 “Factor Utilization in Indian Manufacturing: A Look at the World Bank Investment Climate Surveys Data,” NBER Working Paper 14178.
Fisman, Raymond, 2001. “Estimating the Value of Political Connections,” American Economic Review, 91(4).
Fisman, Raymond, and Jakob Svensson. 2007. “Are Corruption and Taxation Really Harmful to Growth? Firm Level Evidence.” Journal of Development Economics 83(1): 63-75.
Gatti, Roberta and Raymond Fisman. 2006. “Bargaining for Bribes: The Role of Institutions”. CEPR Working Paper 5712.
Gauthier, Bernard and Mark Gersovitz, 1997, “Revenue erosion through exemption and evasion in Cameroon, 1993,” Journal of Public Economics, Volume 64, Issue 3, June 1997, Pages 407-424.
Hallward-Driemeier, Mary, and Reyes Aterido. 2007. “Comparing Apples with…Apples: How to Make (More) Sense of Subjective Rankings of Constraints to Business.” World Bank mimeo.
Hallward-Driemeier, Mary, Gita Khun-Jush, and Lant Pritchett, 2010. “Deals versus Rules: What is Policy Uncertainty and Why do Firms Hate it?” NBER Working Paper 16001.
33
Hallward-Driemeier, Mary, Scott Wallsten and Lixin Colin Xu. 2006. “Ownership, investment climate and firm performance: Evidence from Chinese firms.” Economics of Transition 14(4) pp. 629–647.
Haltiwanger, John, and Helena Schweiger. 2005. “Allocative Efficiency and the Business Climate.” University of Maryland. Mimeographed document.
Hausmann, Ricardo and Cesar Hidalgo. 2009. “The Building Blocks of Economic Complexity,” Quantitative Finance Papers 0909.3890, arXiv.org
Hausmann, Ricardo, Lant Pritchett, and Dani Rodrik, 2005. "Growth Accelerations," Journal of Economic Growth, Springer, vol. 10(4), pages 303-329, December.Hausmann, Ricardo and Dani Rodrik, “Doomed to Choose: Industrial Policy as Predicament.”
Hellman, Joel. 1998. “The politics of winner take all reform”. World Politics.
Hellman, Joel and Daniel Kaufmann. 2002. “The Inequality of Influence.”
Hellman, Joel, Geraint Jones and Daniel Kaufmann, 2000. “Seize the State, Seize the Day: State Capture, Corruption, and Influence in Transition.” World Bank.
Hidalgo, Cesar, Blailey Klinger, A. Barabasi and Ricardo Hausmann. 2007. “The Product Space Conditions the Development of Nations.” Science 27 July 2007: Vol. 317 no. 5837 pp. 482-487
Jones, Benjamin and Ben Olken, 2007, “The Anatomy of Stop-Start Growth,” forthcoming Review of Economics and Statistics.
Klapper, Leora F., Luc Laeven and Raghuram G. Rajan. 2004. “Business Regulations as a Barrier to Entrepreneurship.” Journal of Financial Economics. 82(3), pp. 591-629.
La Porta, Rafael and Andrei Shleifer. 2008. “The Unofficial Economy and Economic Development.” Brookings Papers on Economic Activity, pp. 275-352.
Lin, Justin. 2009. Economic Development and Transition: Thought, Strategy and Viability. Cambridge University Press: Cambridge.
Loayza, Norman, Ana Maria Oviedo and Luis Servén. 2006. “The Impact of Regulation on Growth and Informality: Cross-Country Evidence.” In: Guha-Khasnobis, Basuded, Ravi Kanbur and Elinor Ostrom. “Linking the Formal and Informal Economy: Concepts and Policies.” Oxford: Oxford University Press.
34
Micco, Alejandro, and Carmen Pagés. 2006. “The Economic Effects of Employment Protection: Evidence from International Industry-Level Data.” Discussion Paper 2433. Bonn, Germany: Institute for the Study of Labor (IGA).
Pierre, Gaelle, and Stefano Scarpetta. 2006. “Employment protection: Do firms' perceptions match with legislation?” Economics Letters, 90 (3) pp 328-334.
Pritchett, Lant. 2005. “Reform is like a box of chocolates: An interpretive essay on the pleasant and unpleasant surprises from policy reform.” www.hks.harvard.edu/fs/lpritch/
Pritchett, Lant and Geeta Sethi, 1994, “Tariff Rates, Tariff Revenue, and Tariff Reform: Some New Facts.” World Bank Econ Rev (1994) 8 (1): 1-16.
Rodrik, Dani. 2008. “Second-Best Institutions.” NBER Working Paper 14050.
Rodrik, Dani. 2009. “The New Development Economics: We Shall Experiment, But how shall we learn?” in Easterly and Cohen, Thinking Big and Thinking Small. Brookings.
Rodrik, Dani and Arvind Subramanian. 2004. “From ‘Hindu Growth’ to productivity surge: The Mystery of India’s Growth Acceleration.” NBER Working Paper 10376.
Stone, Andrew, Brian Levy and Ricardo Paredes. 1996. "Public Institutions and Private Transactions: a comparative analysis of the legal and regulatory environment for business transactions in Brazil and Chile." In Lee Alston, Thrainn Eggertsson and Douglass North, eds., Empirical Studies in Institutional Change. New York: Cambridge University Press, 95-128.
World Bank. 2005. Economic Growth in the 1990s: Learning from a Decade of Reform. World Bank: Washington DC.
World Bank. The World Bank Enterprise Survey Database. www.enterprisesurveys.org. Washington, D.C. United States.
------ Doing Business. www.doingbusiness.org
Xu, Lixin Colin. 2010. “The effects of business environments on development: surveying new firm-level evidence”. World Bank Policy Research Working Paper No. 5402.