how atlassian broke down the walls between support & development
TRANSCRIPT
How Atlassian Broke Down the Walls Between Support & Development
MATT SAXBY | SERVICE ENABLEMENT TEAM LEAD | ATLASSIAN
MATT HUNTER | SERVICE ENABLEMENT TEAM LEAD | ATLASSIAN
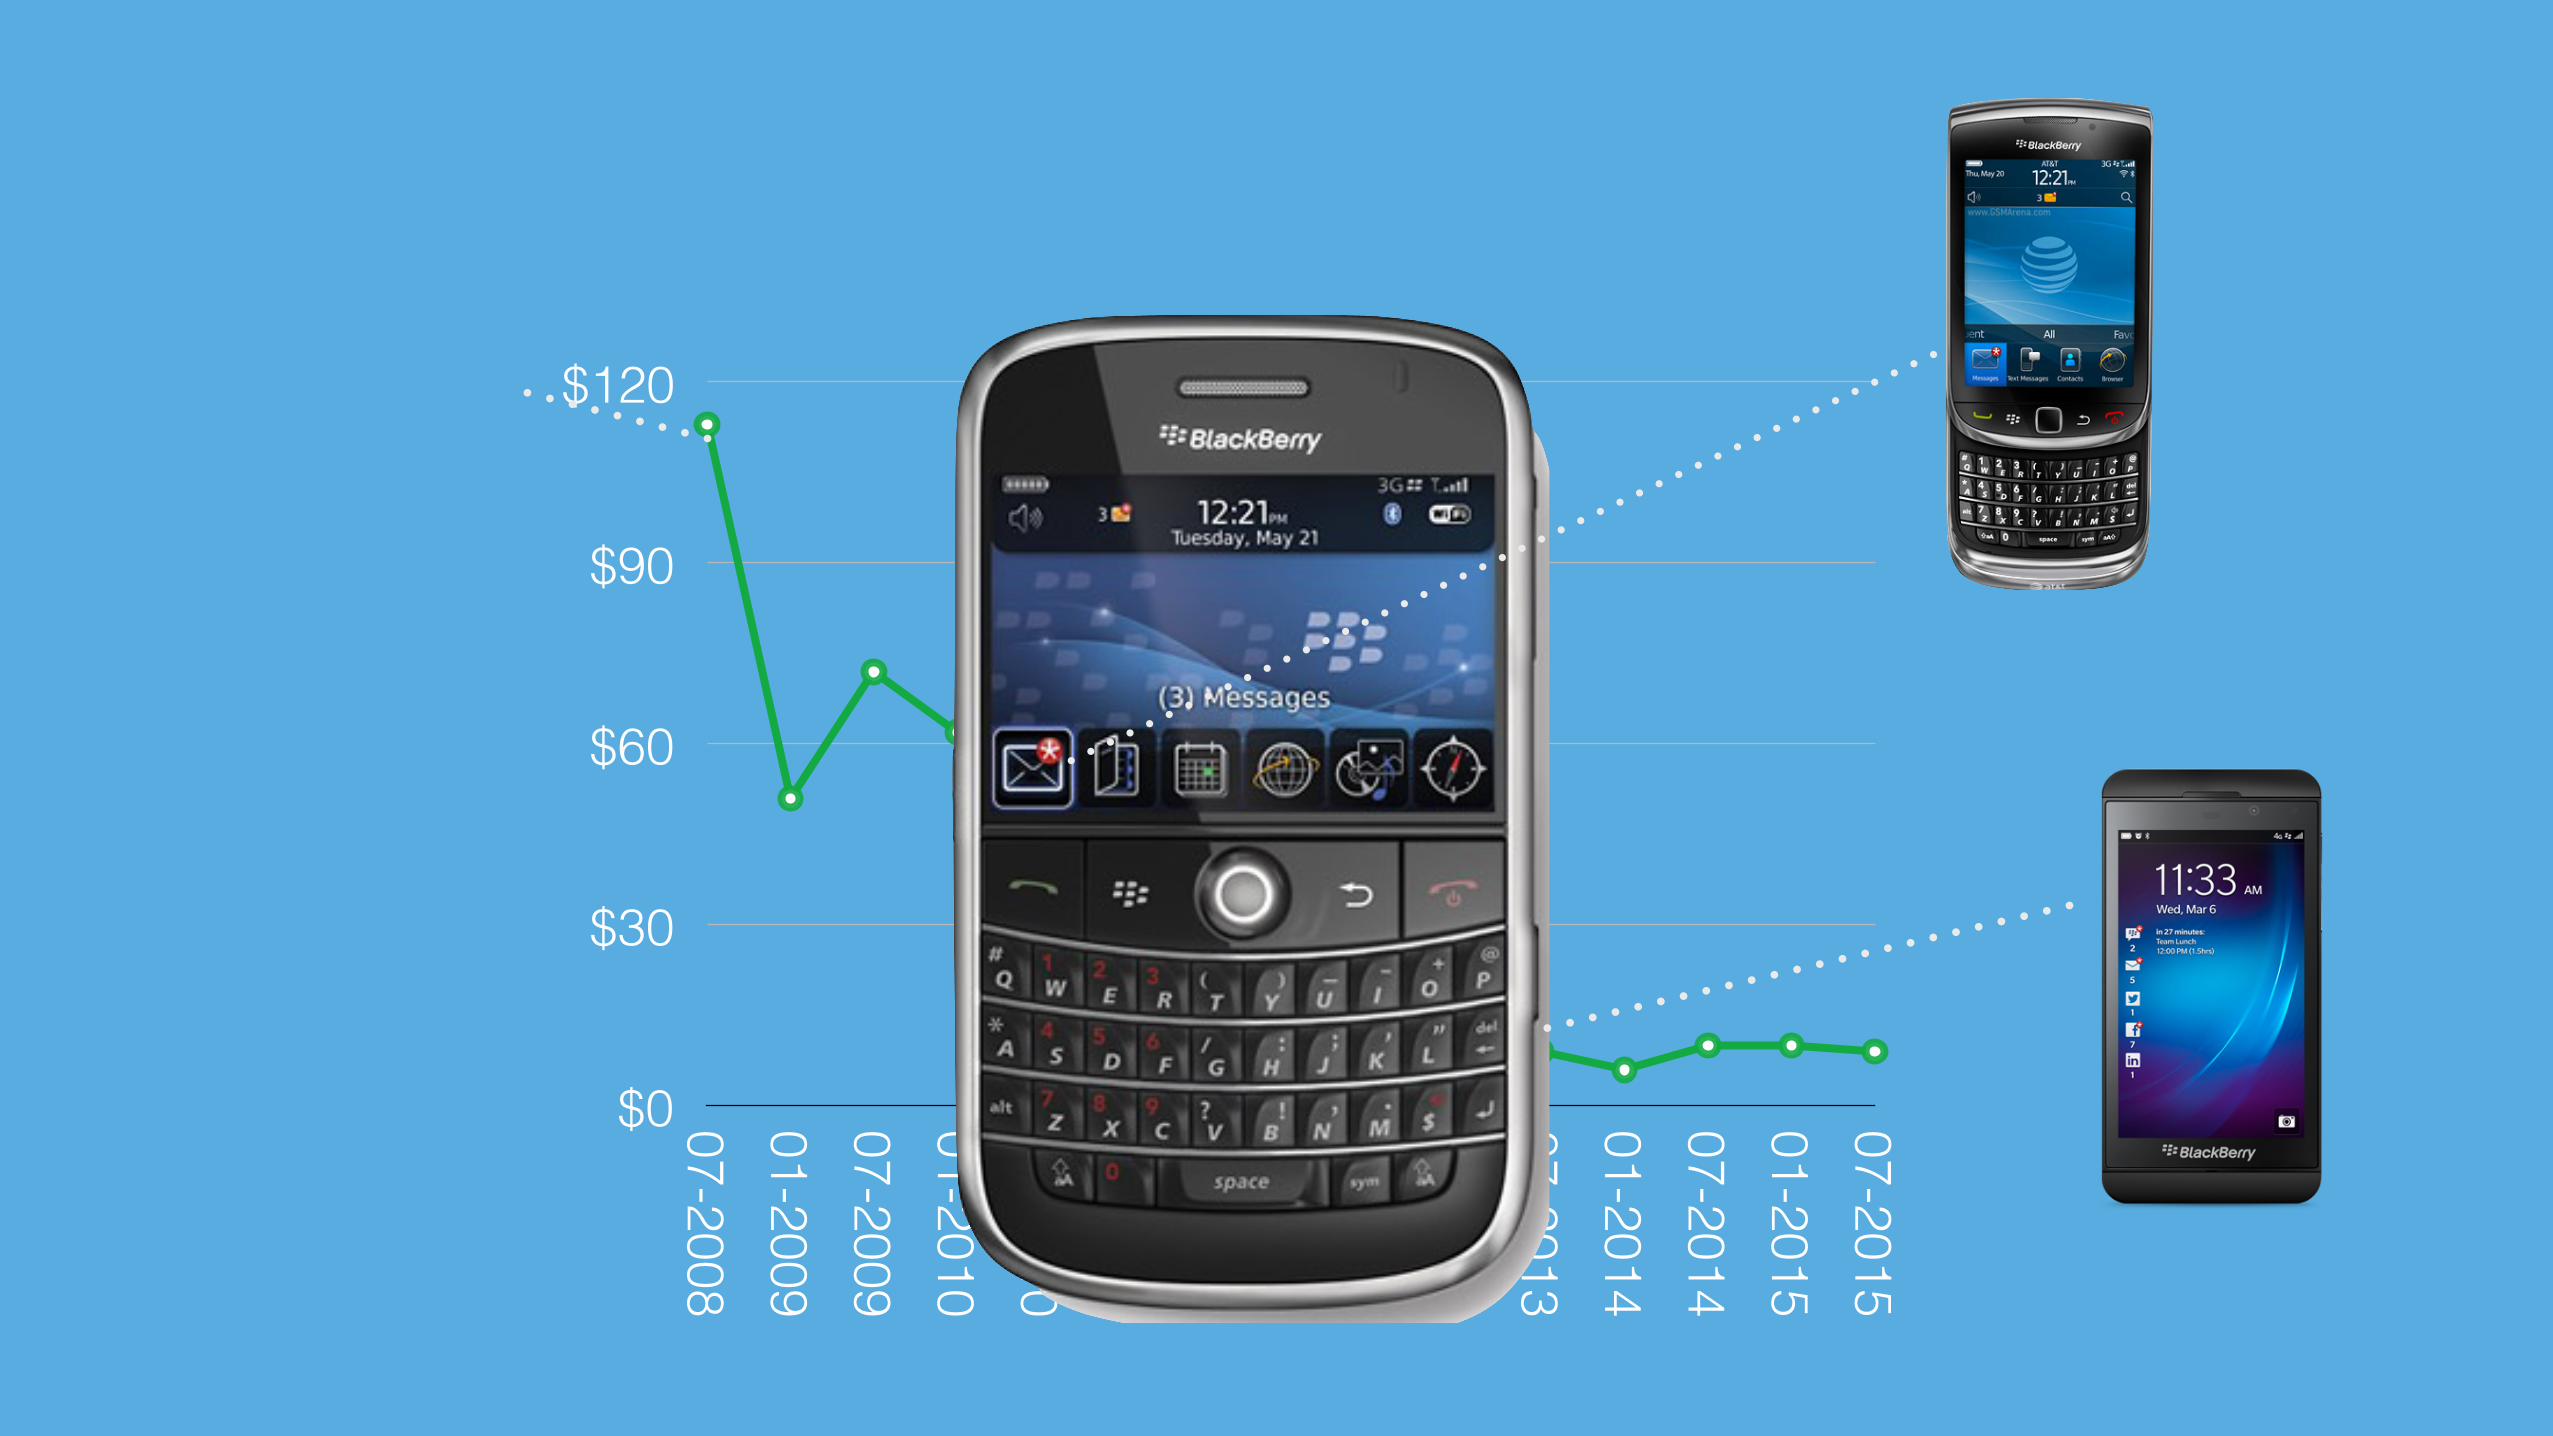
$0
$30
$60
$90
$120
07-200801-200907-200901-201007-201001-201107-201101-201207-201201-201307-201301-201407-201401-201507-2015
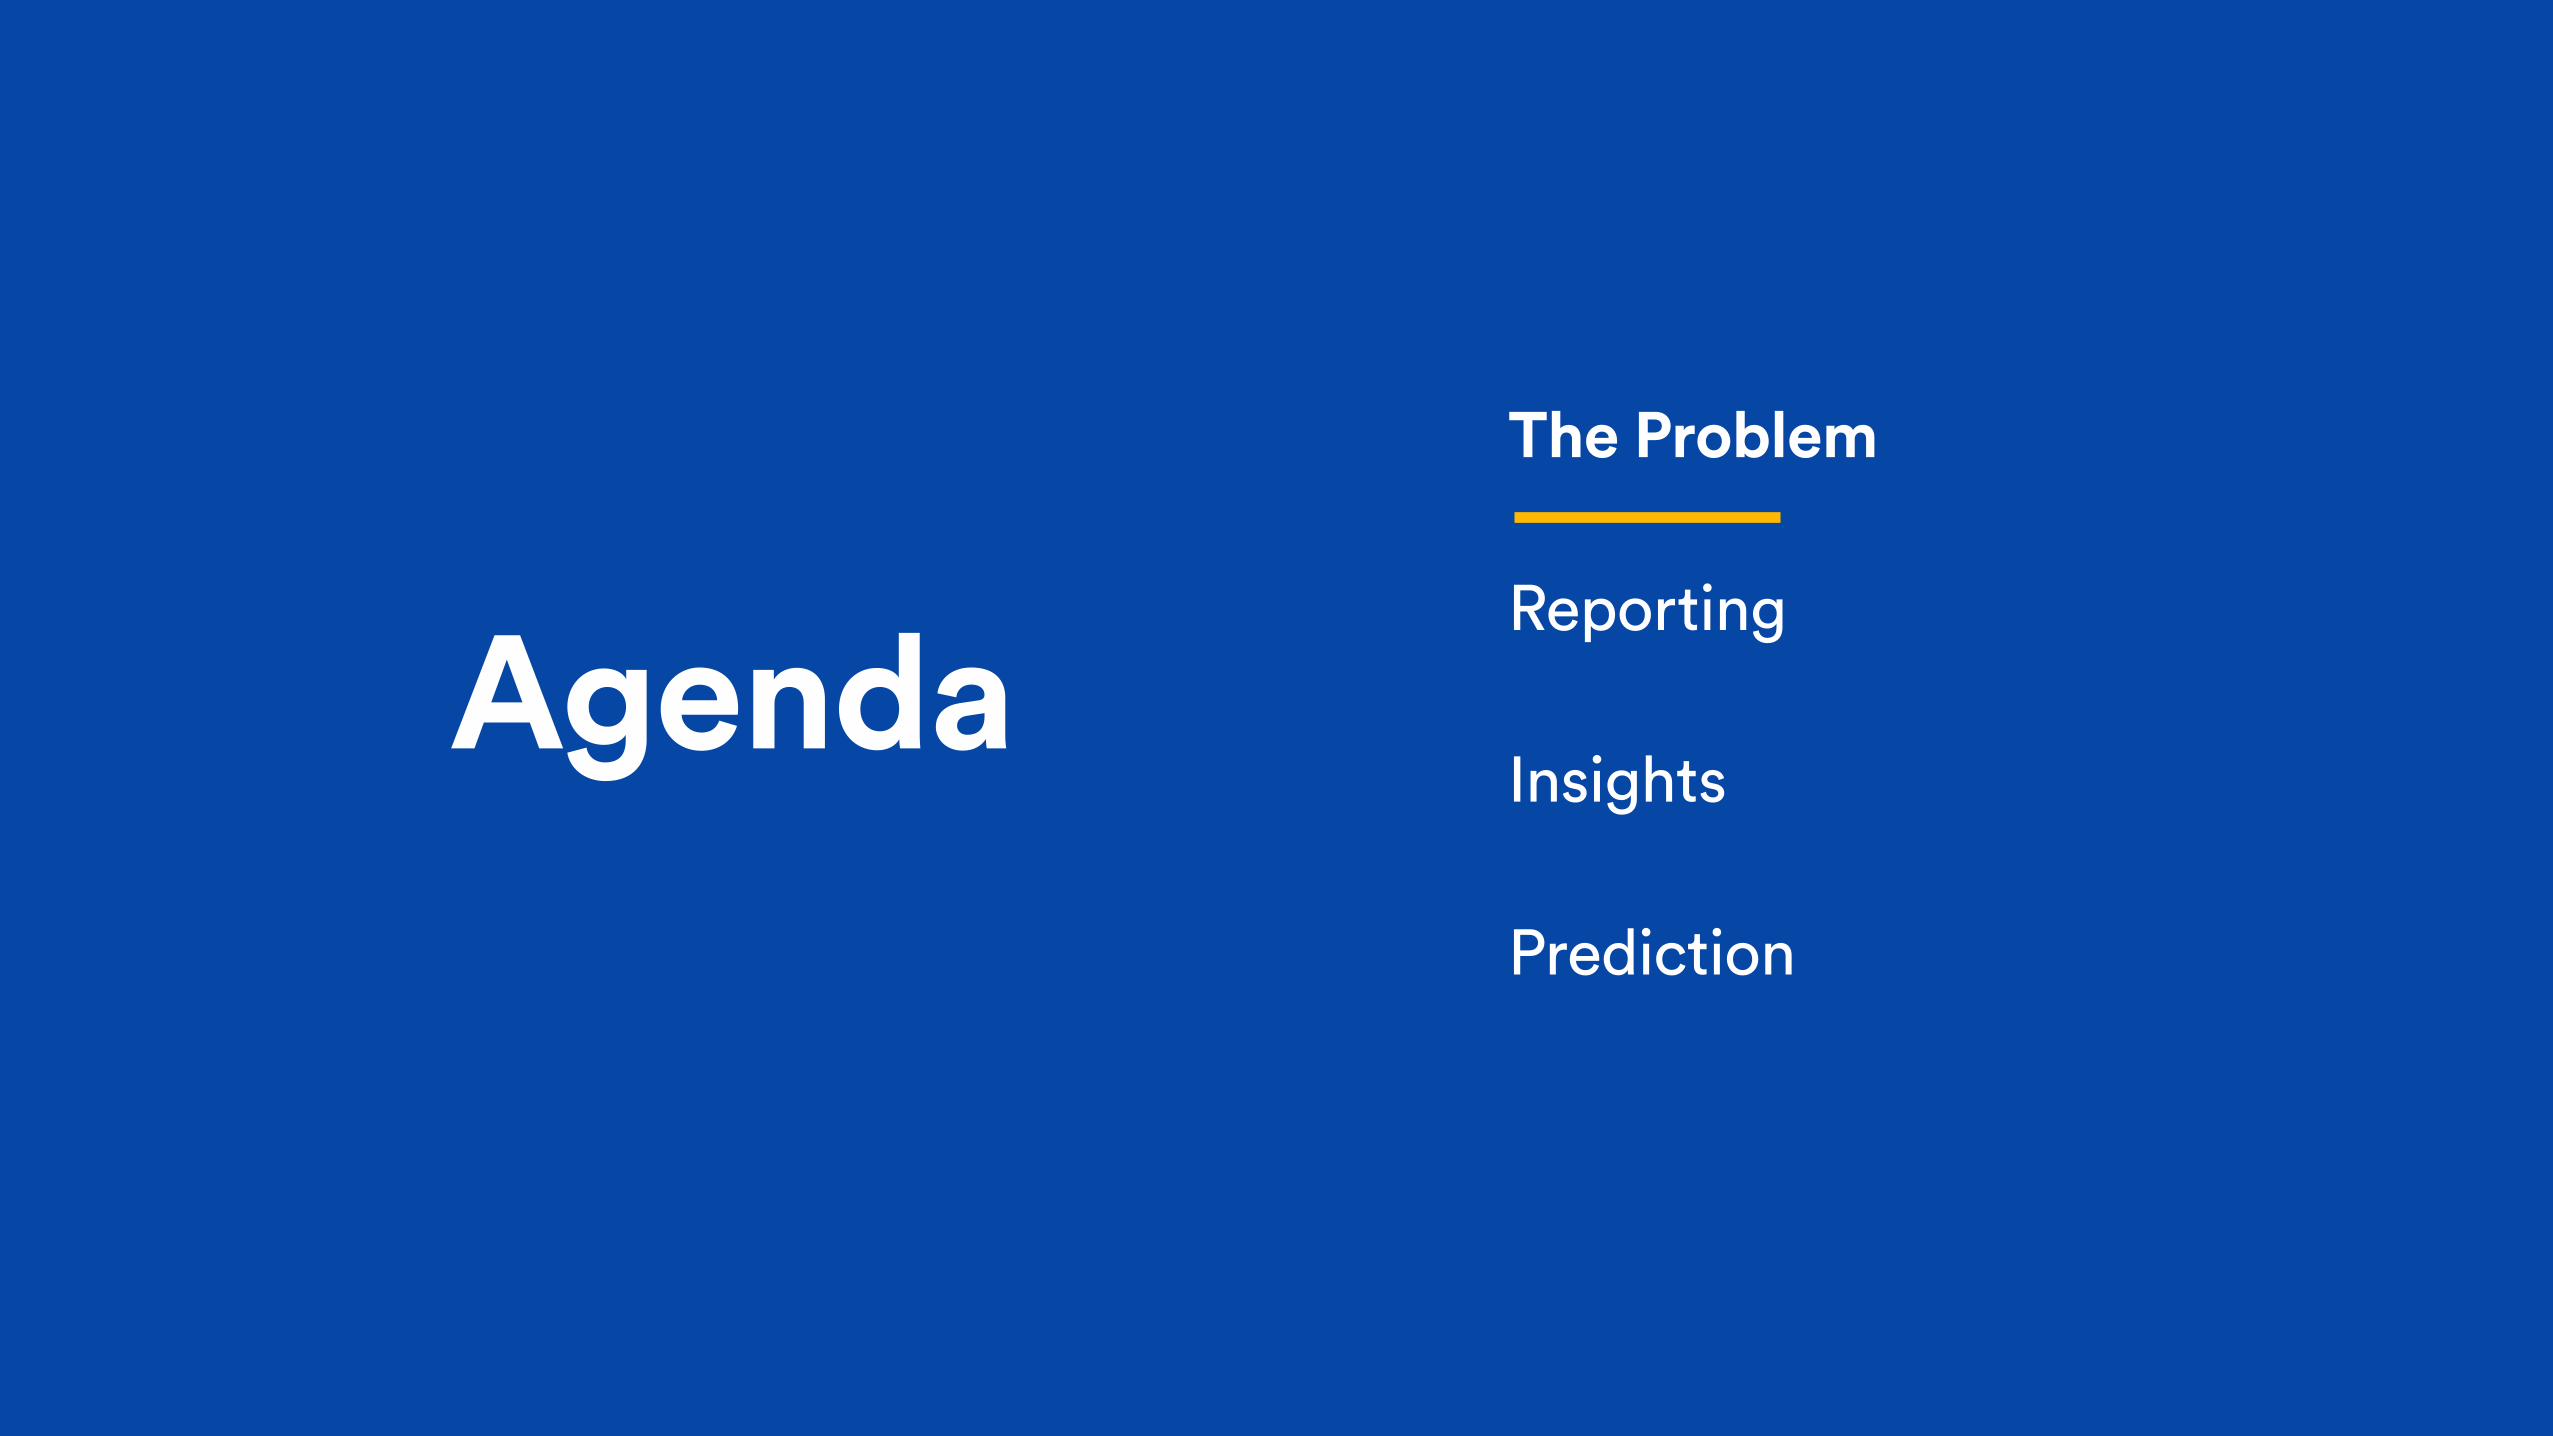
AgendaReporting
Insights
Prediction
The Problem
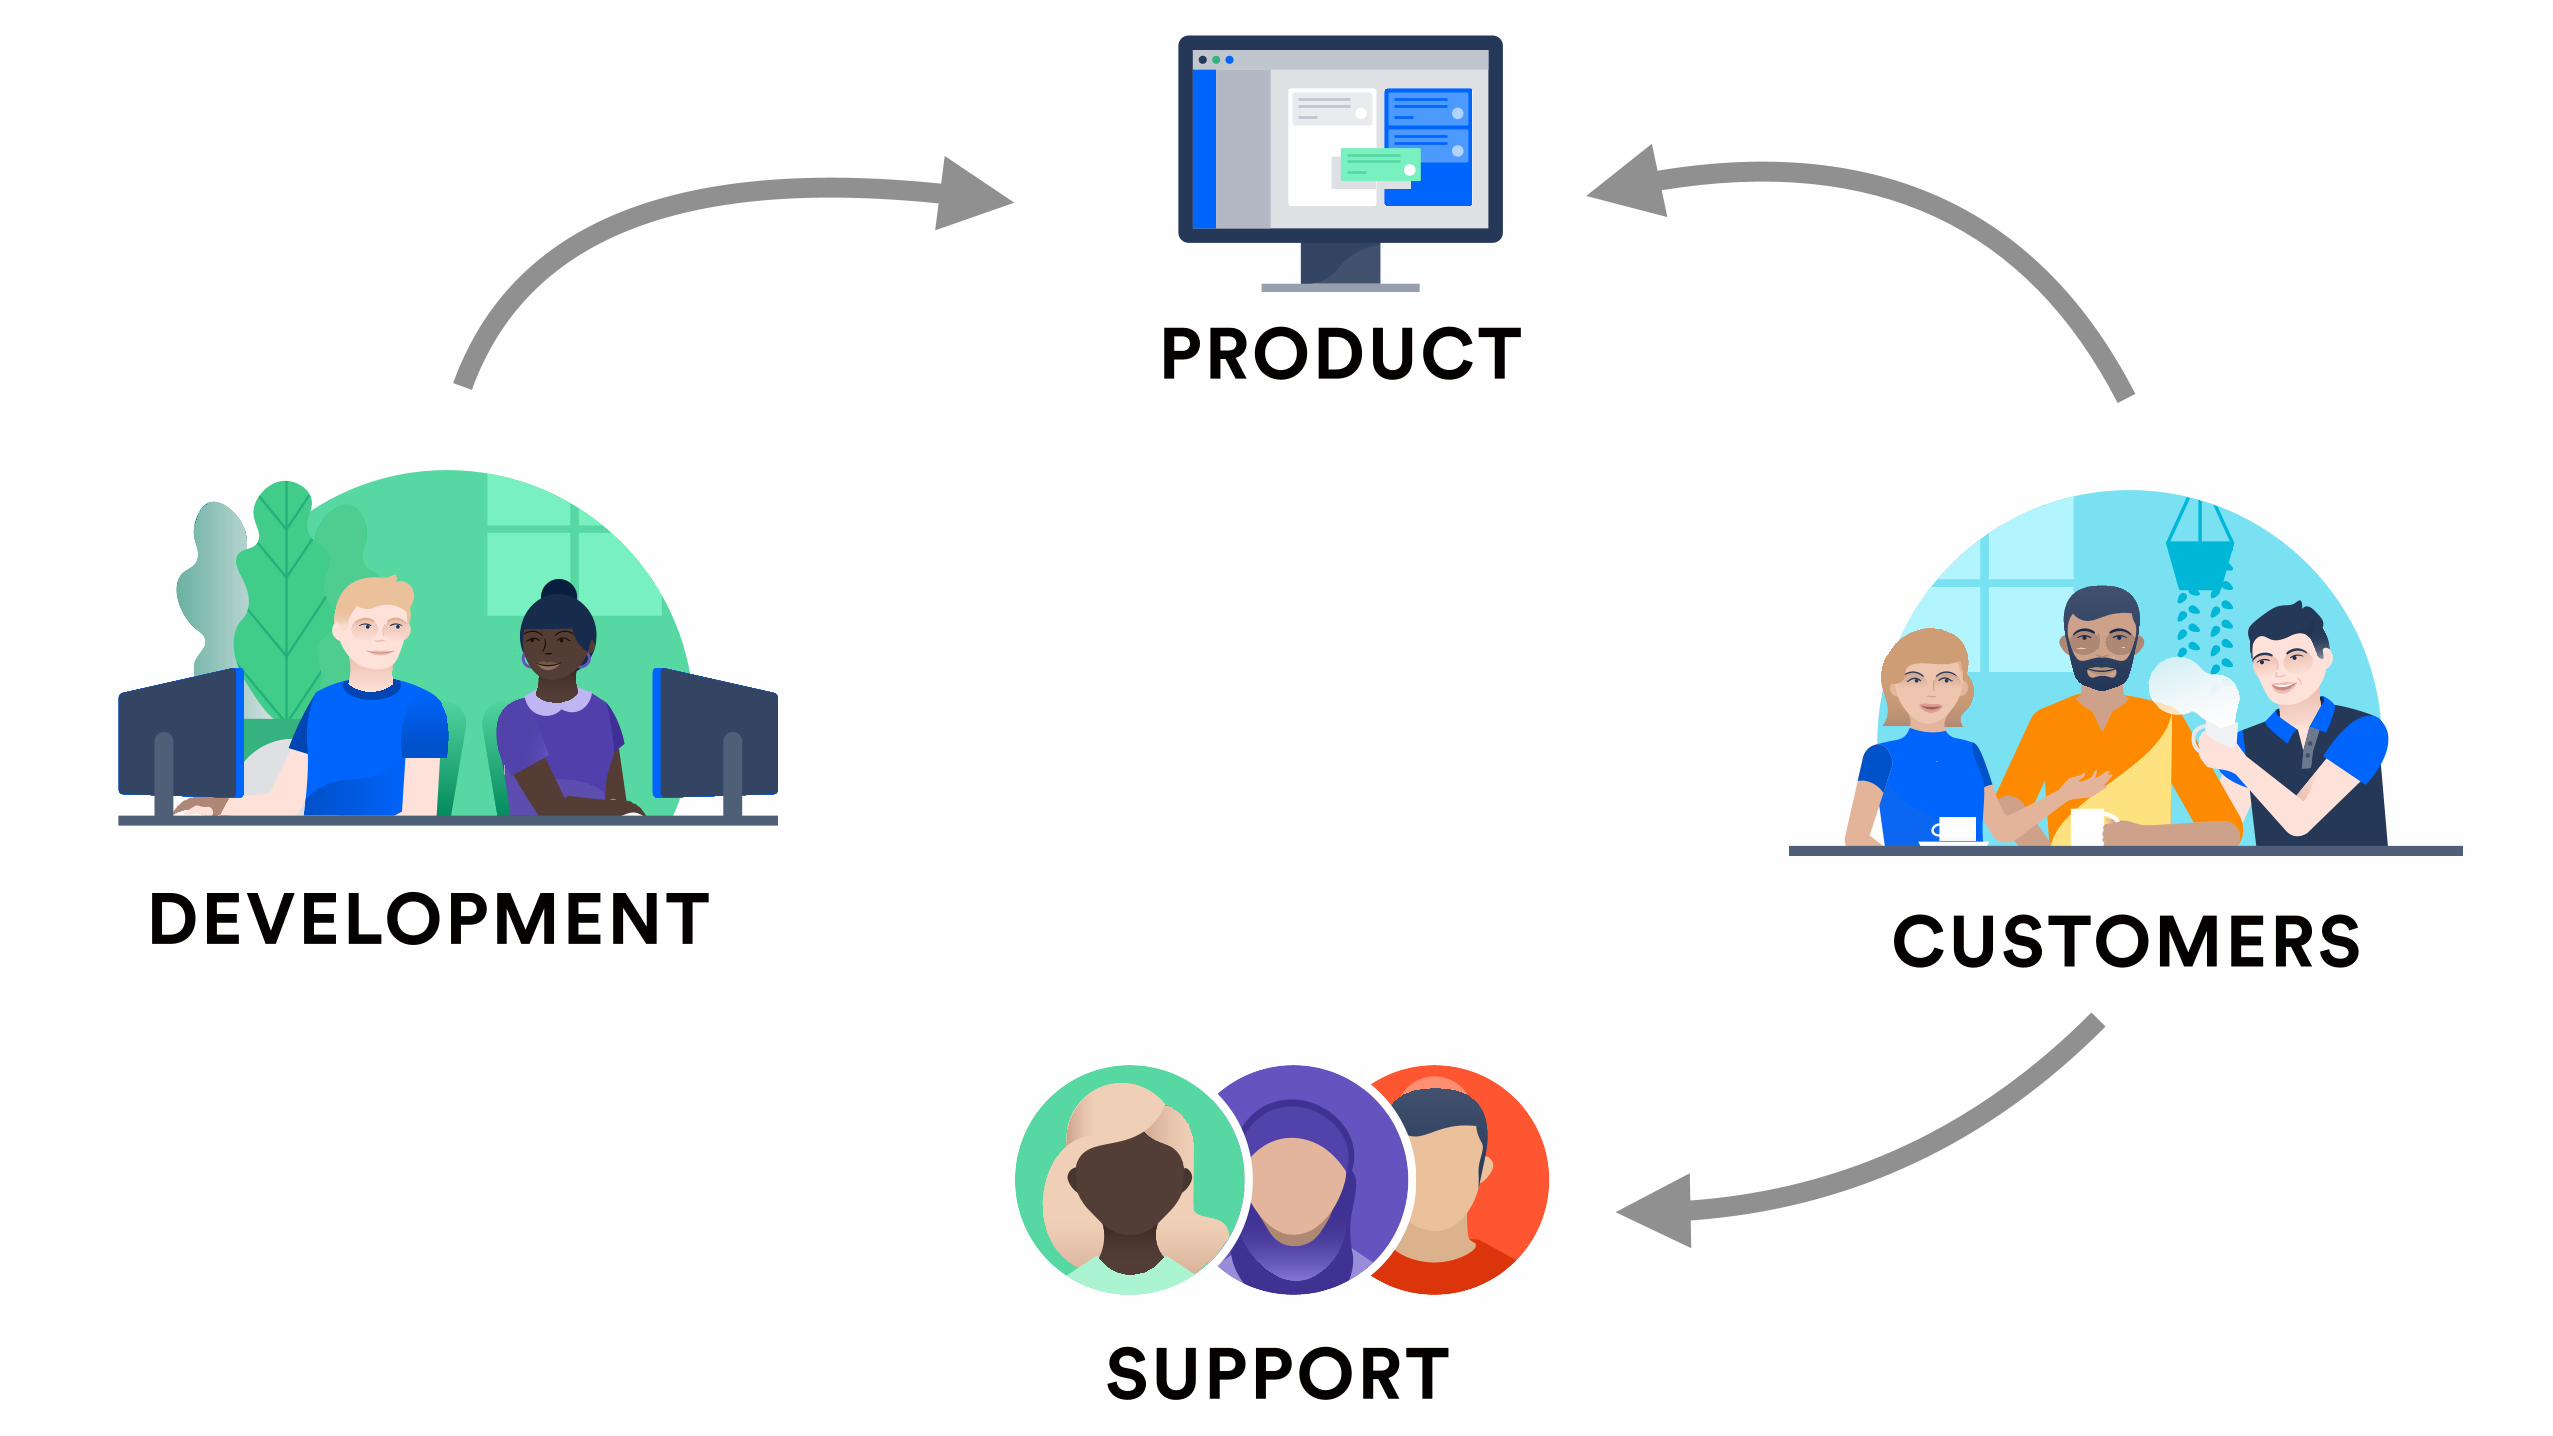
DEVELOPMENT CUSTOMERS
SUPPORT
PRODUCT

9SUPPORT CENTERS
350+CUSTOMER SUCCESS STAFF
89,200+CUSTOMERS
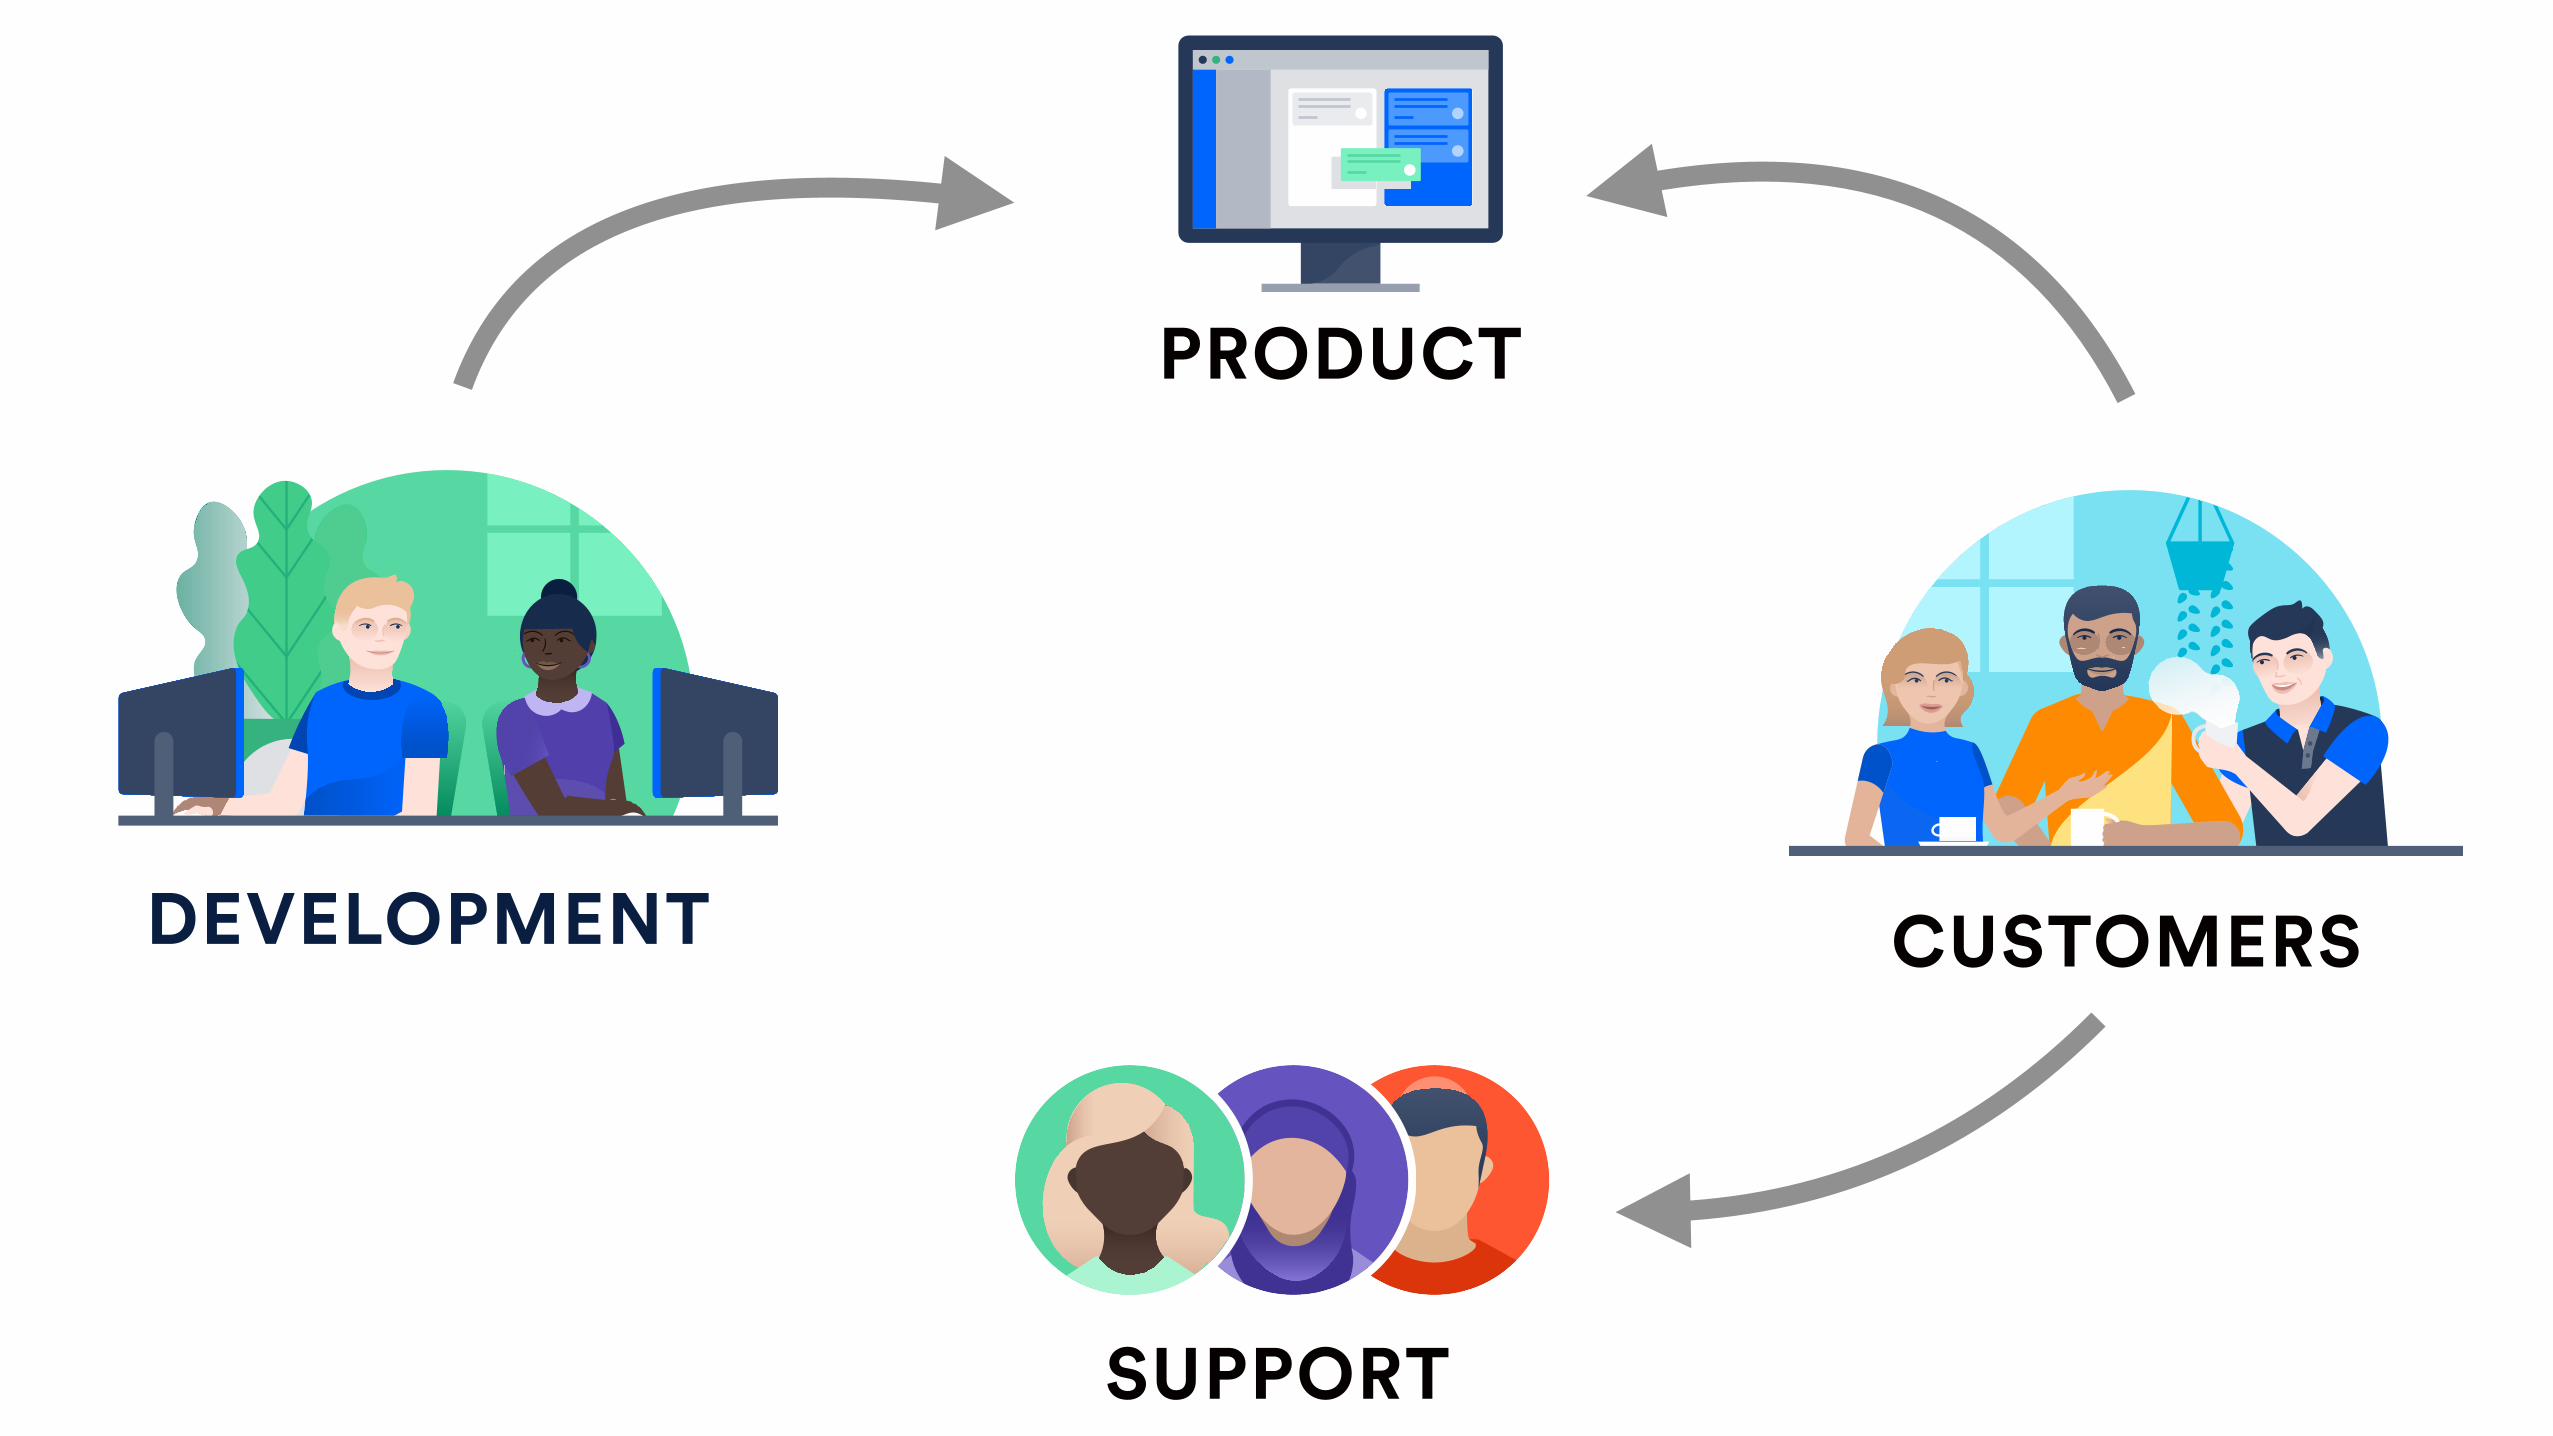
CUSTOMERS
SUPPORT
PRODUCT
DEVELOPMENT
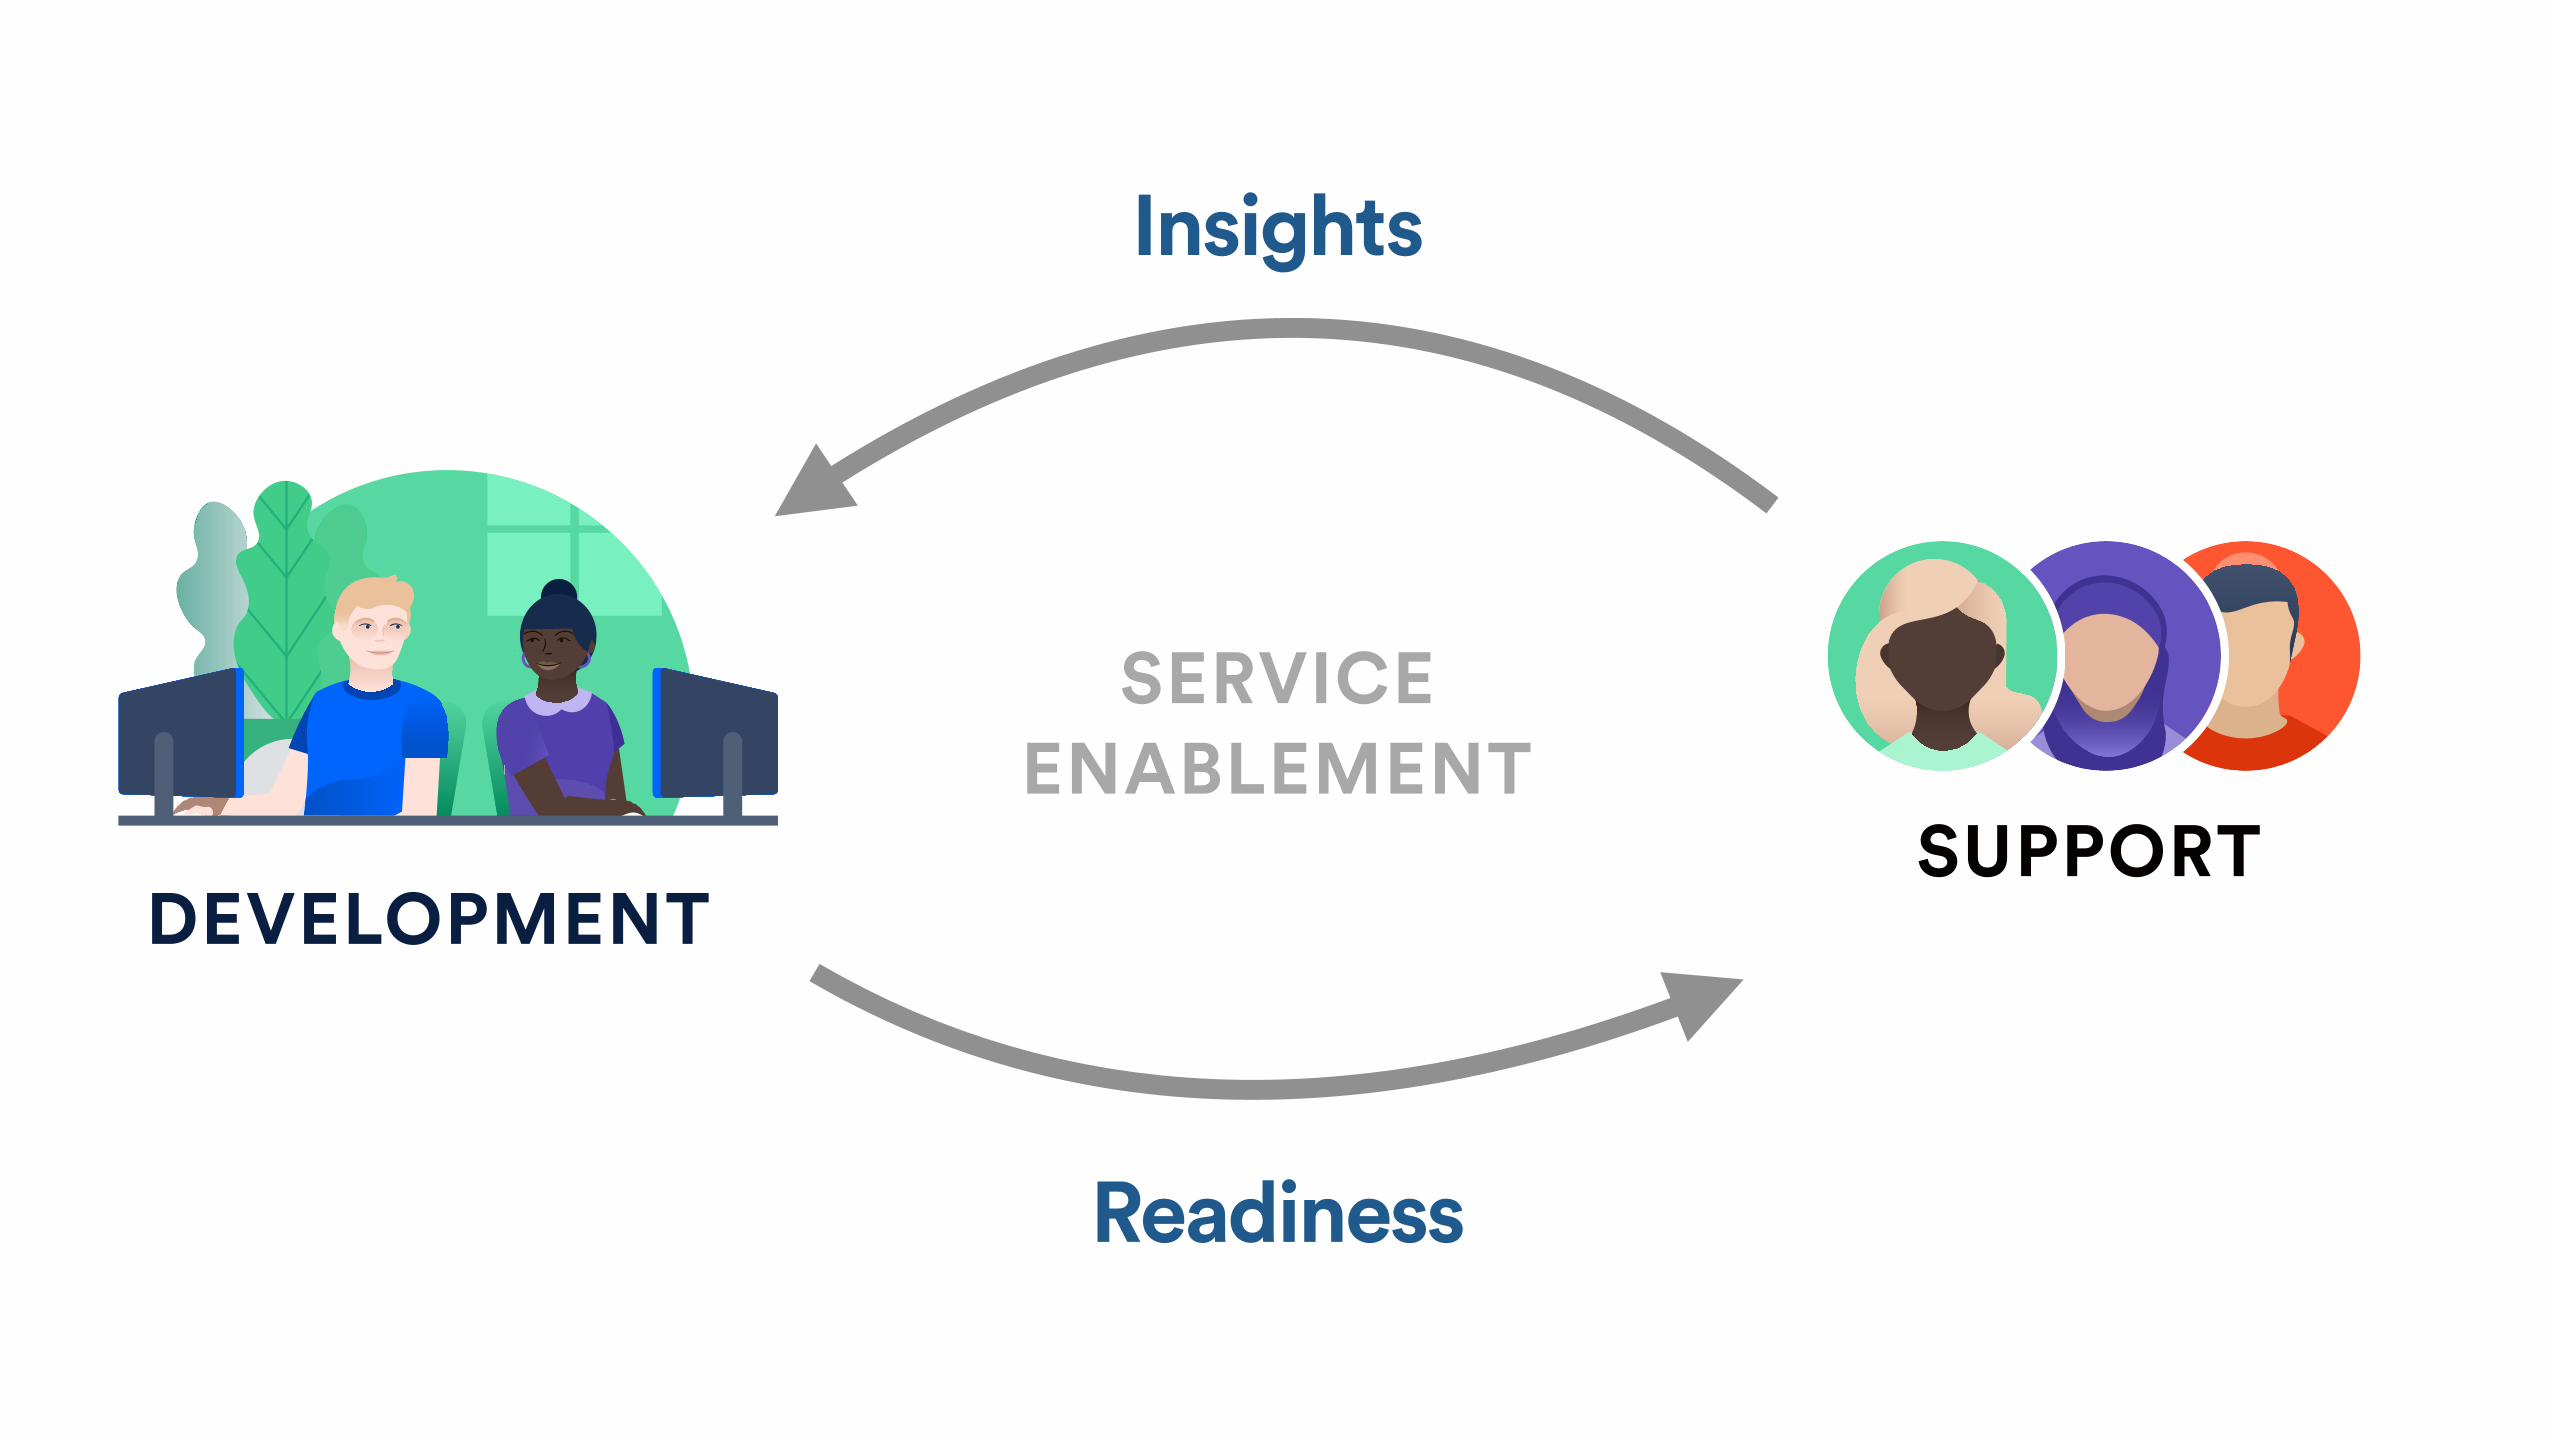
Insights
Readiness
SERVICE ENABLEMENT
SUPPORTDEVELOPMENT

88
SERVICE ENABLEMENT EXISTS TO
Create a frictionless product experience for our customers

ShirtVoteTMINTRODUCING

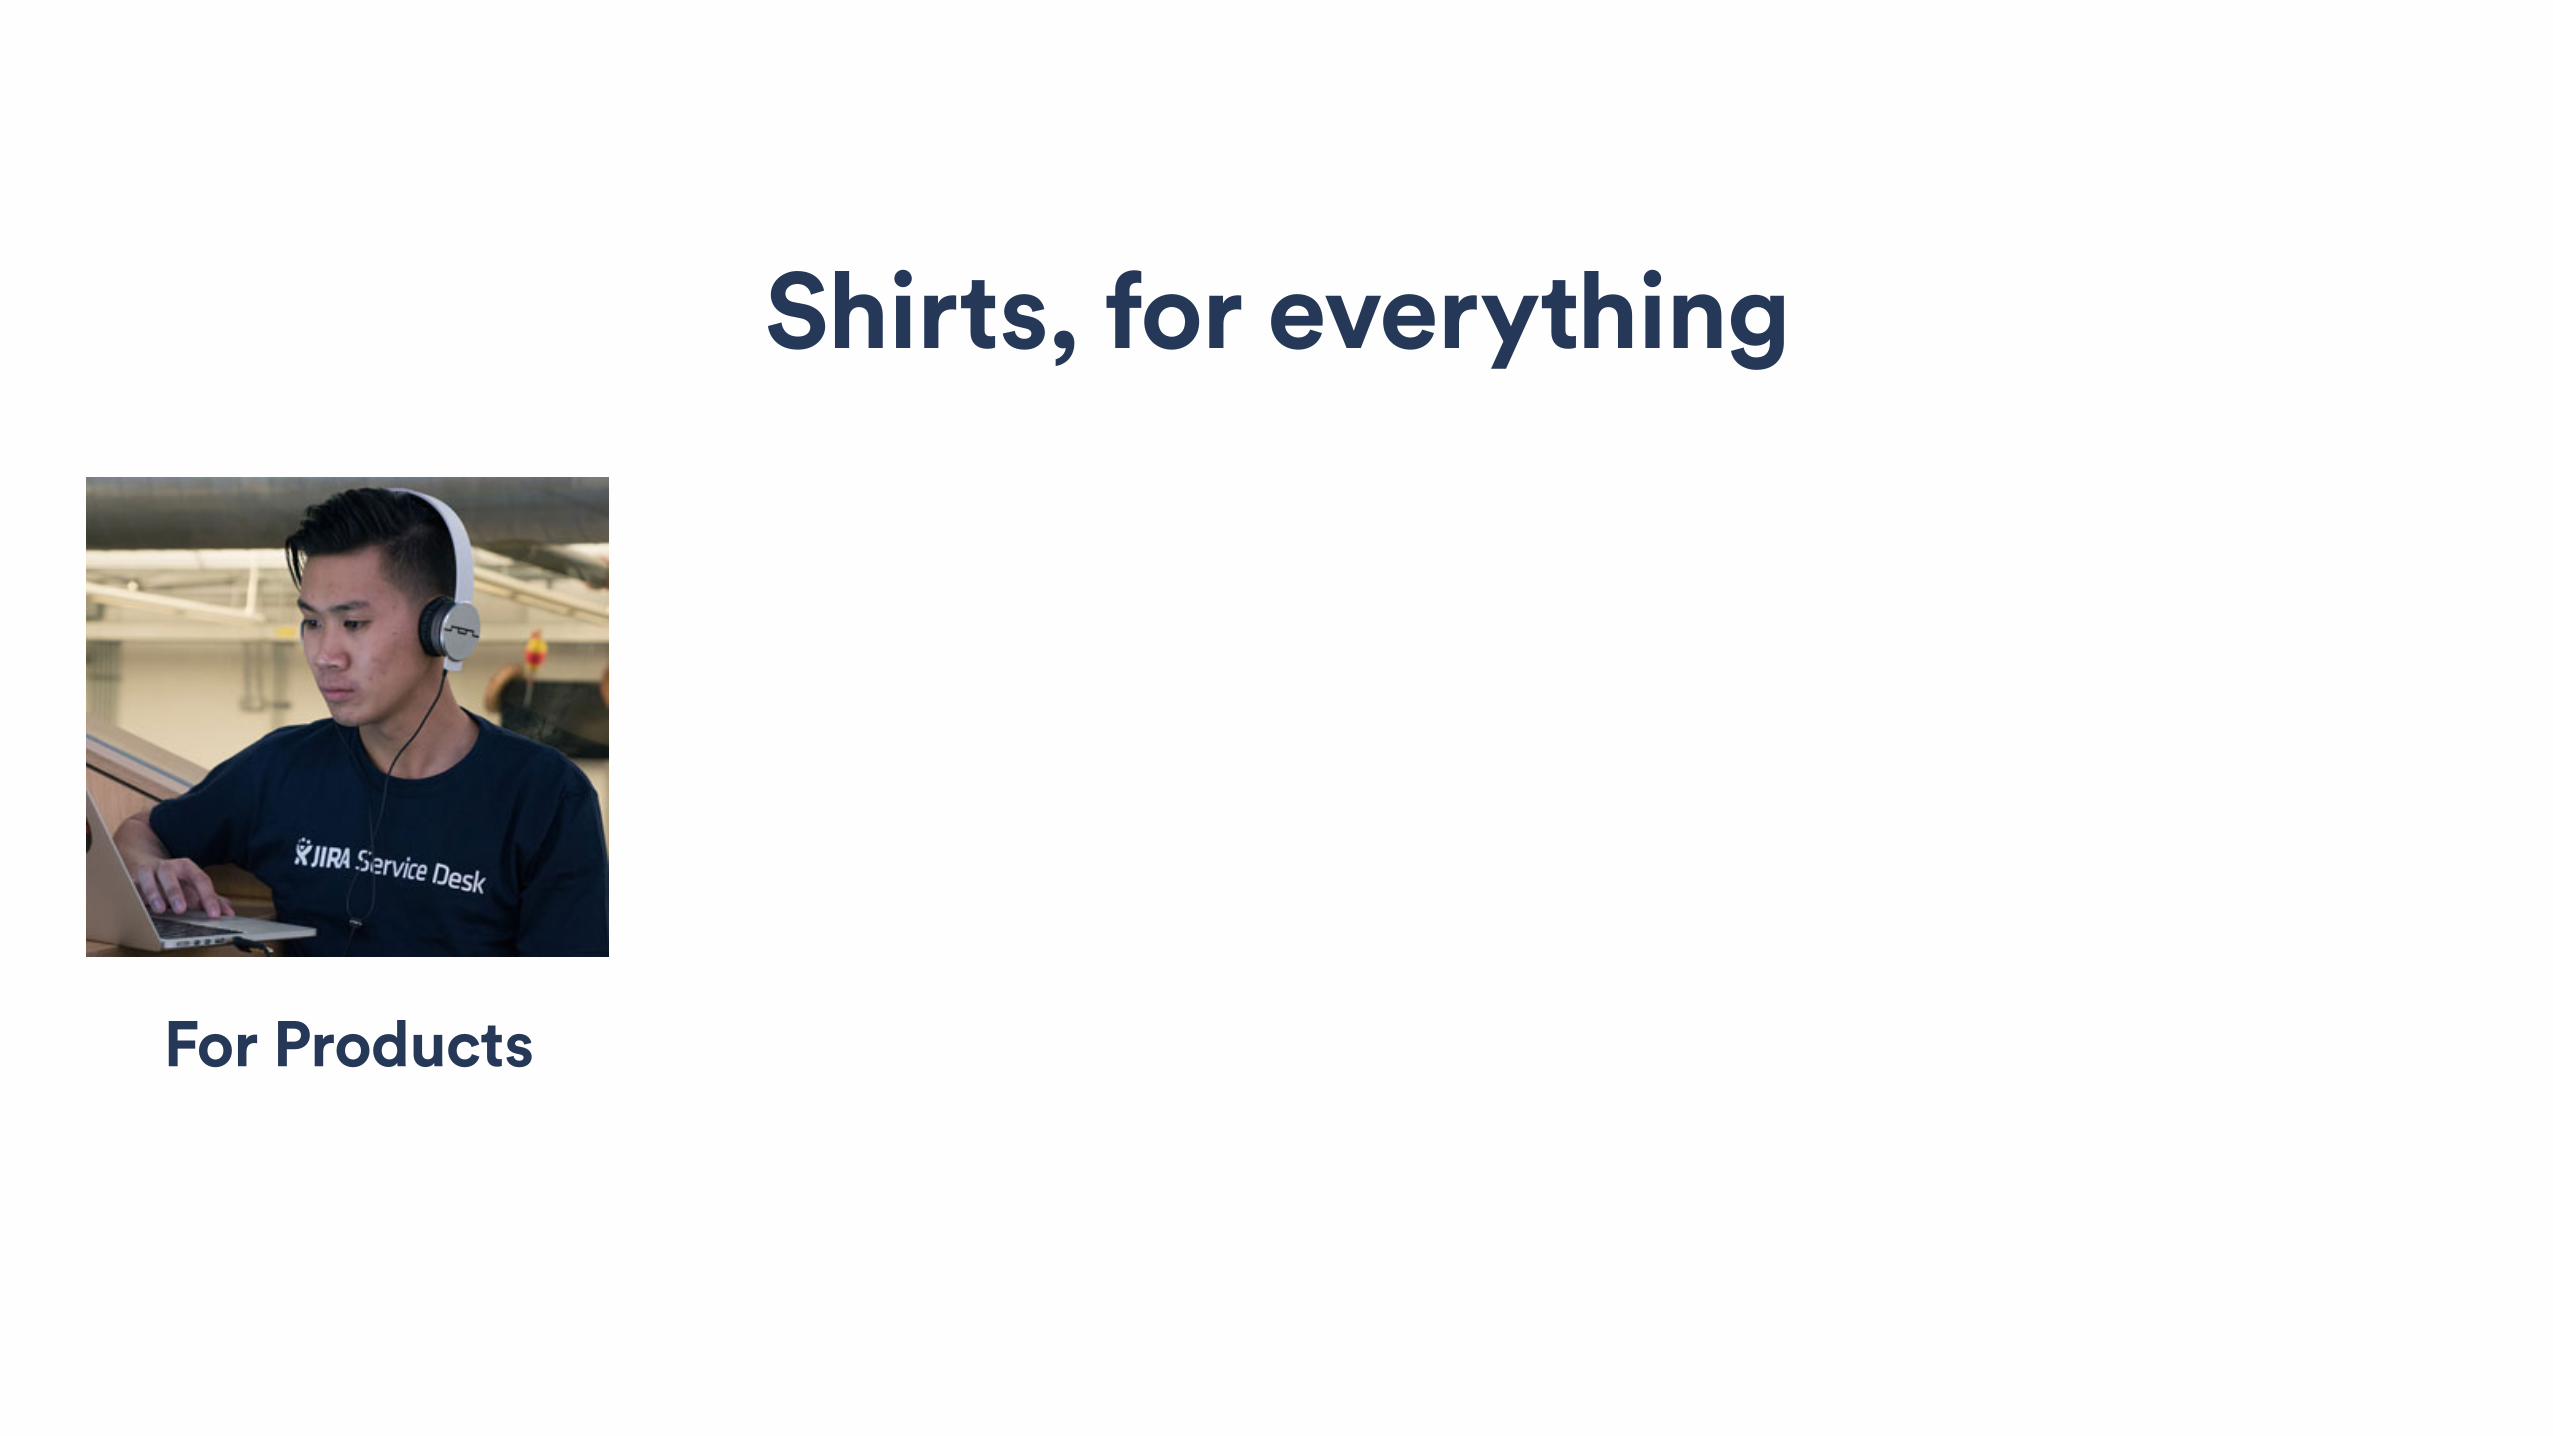
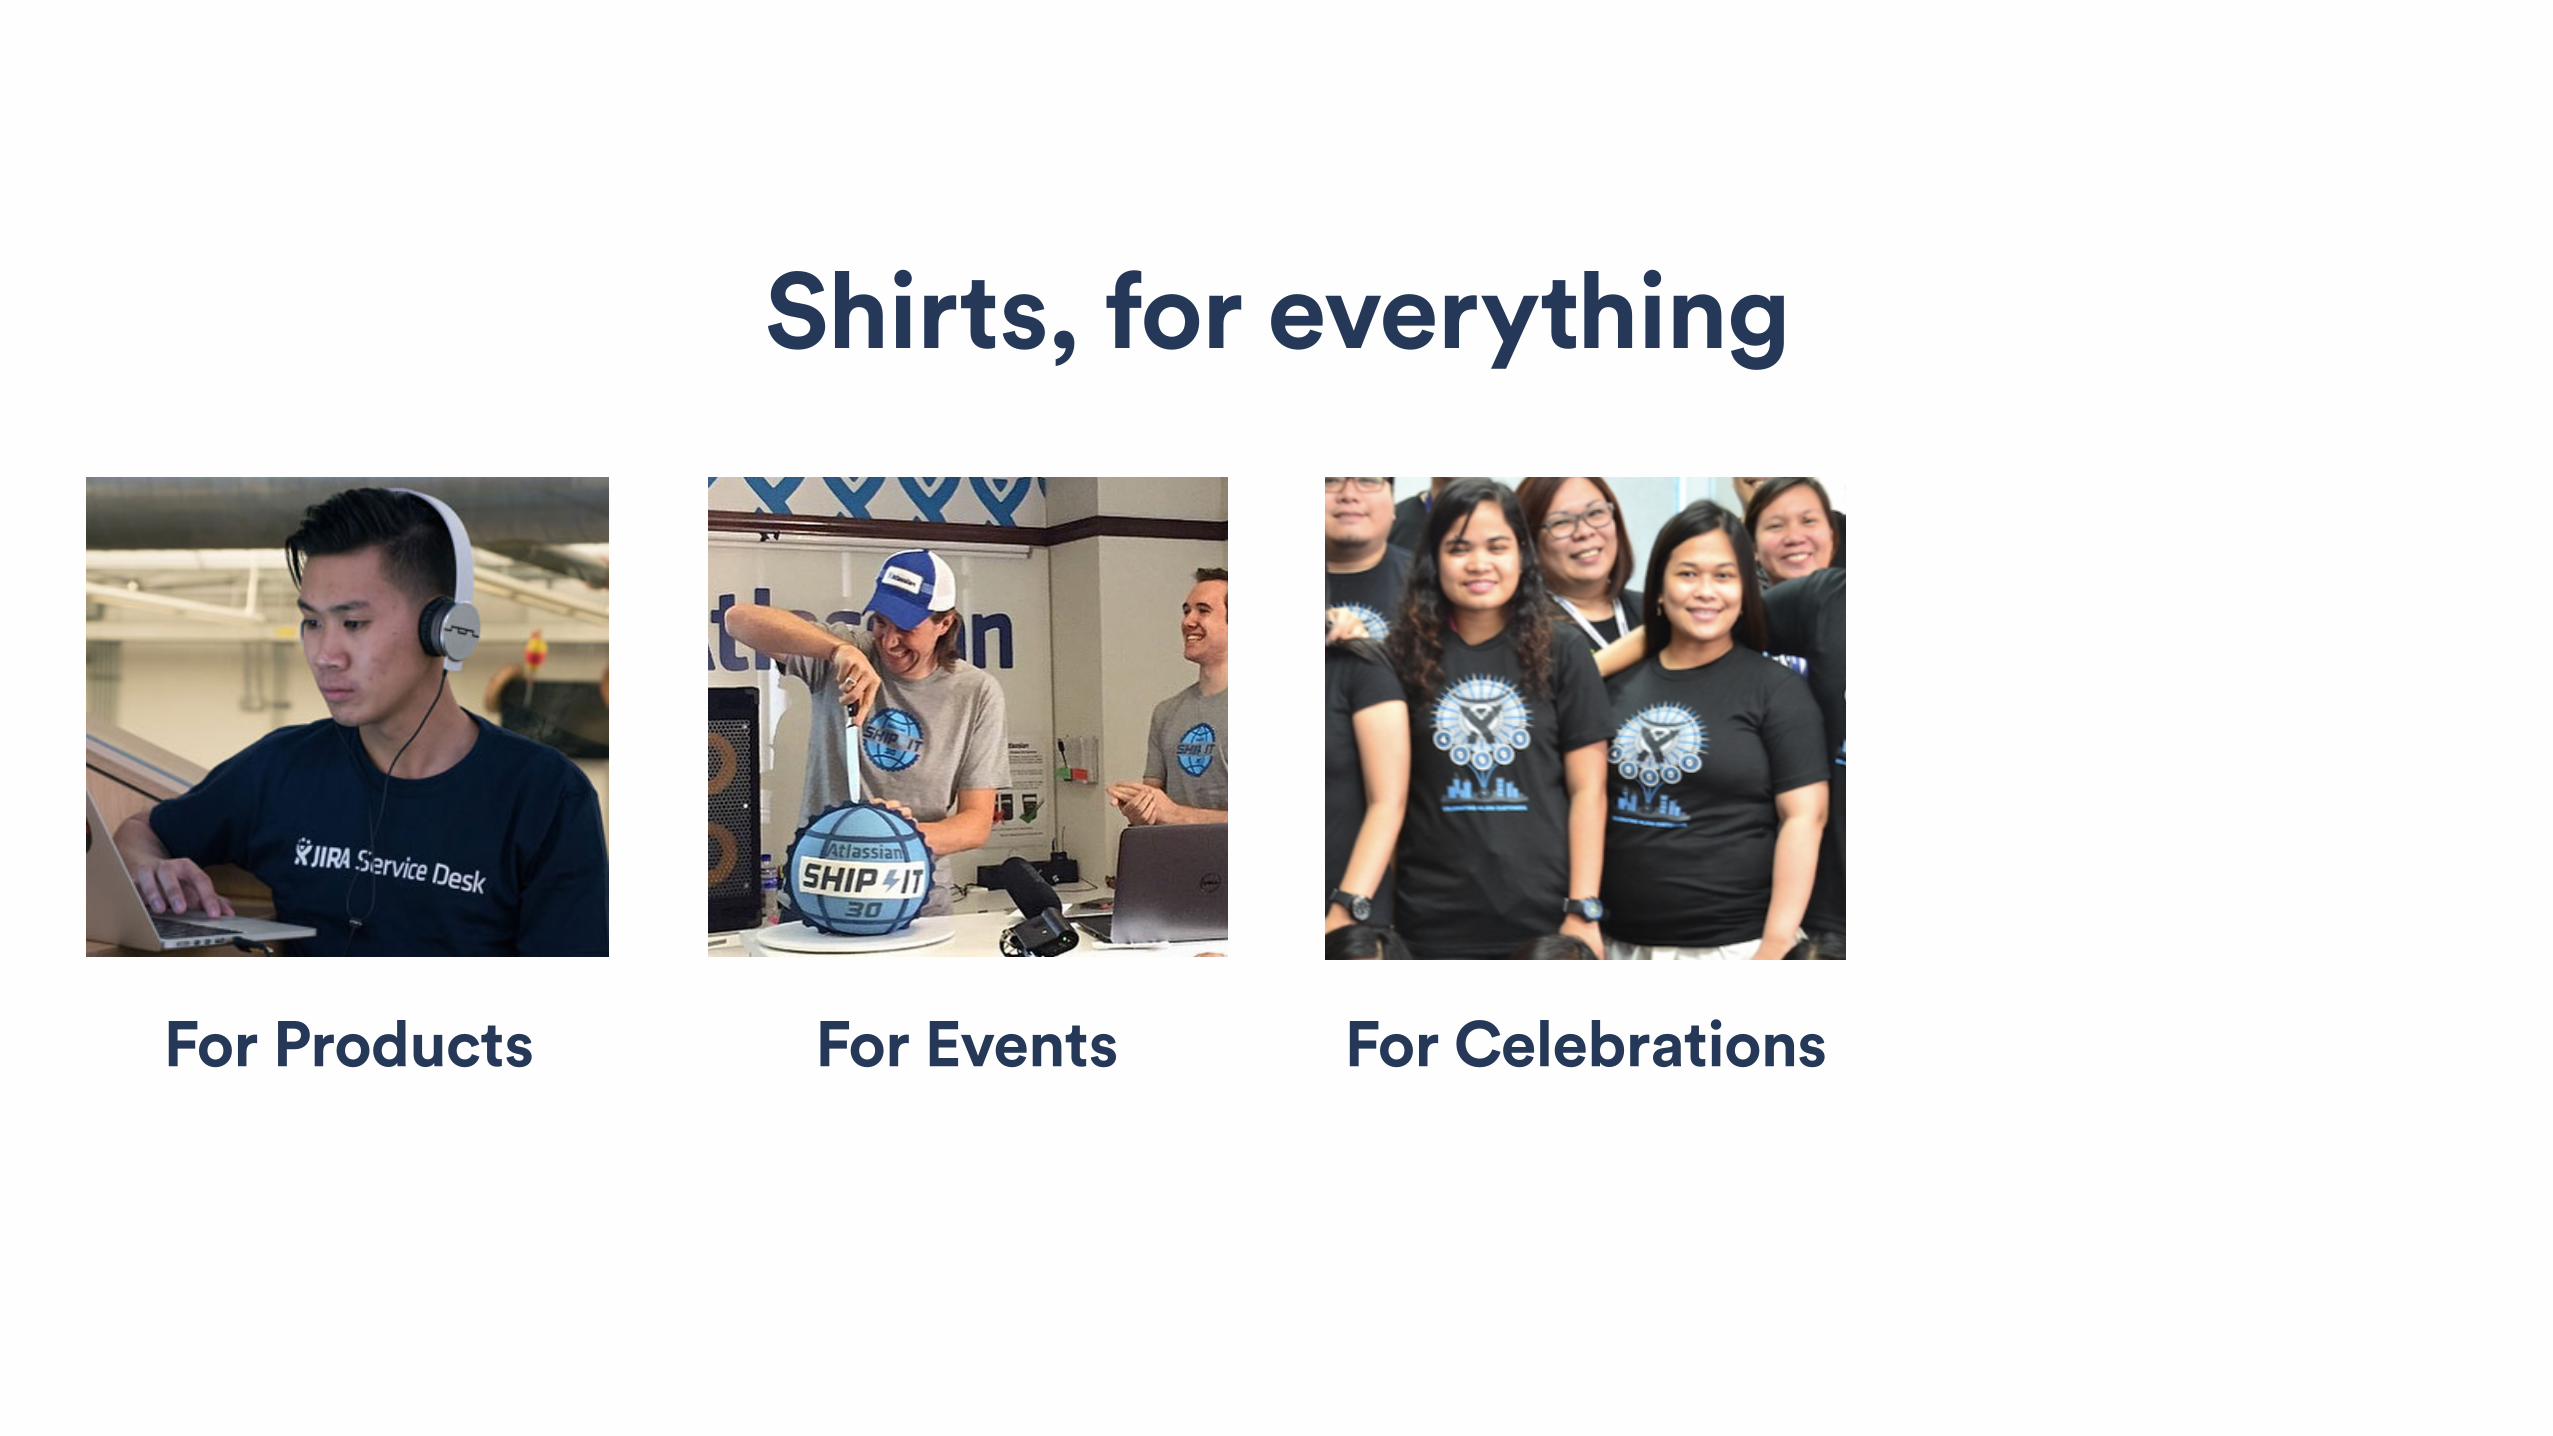
Shirts, for everything
For Products

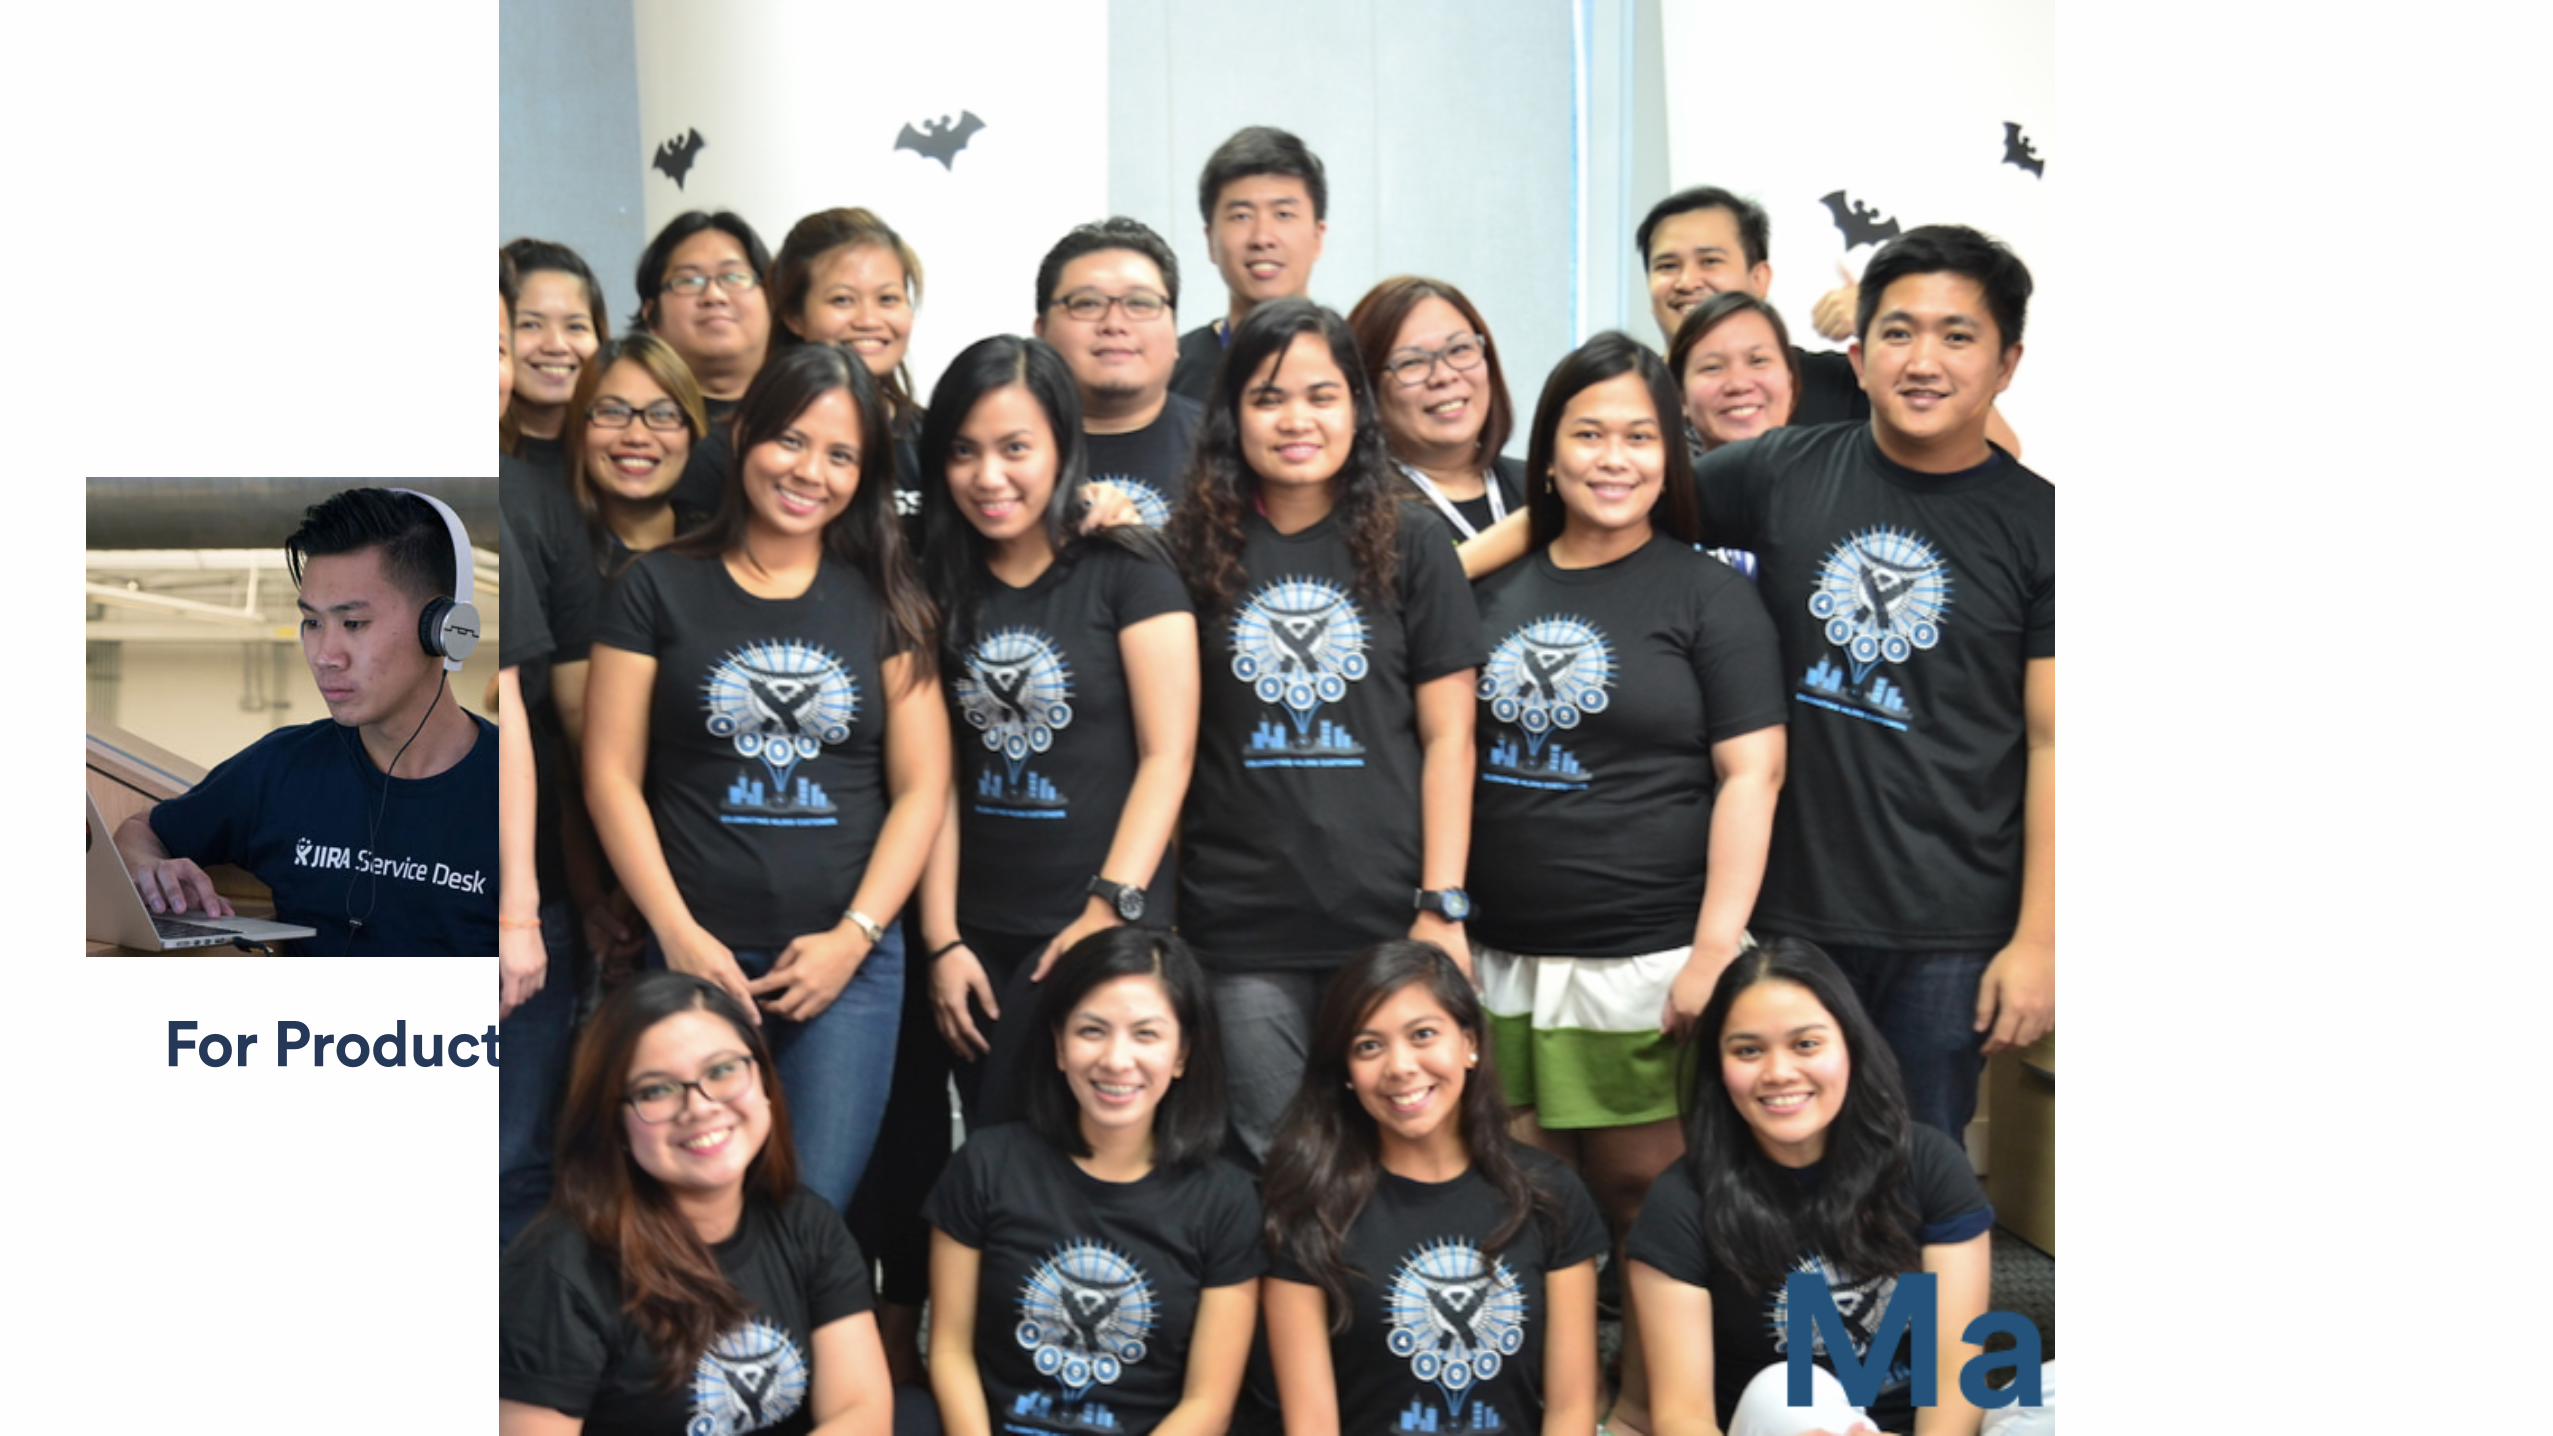
Shirts, for everything
For Products

Shirts, for everything
For Products For Events
Shirts, for everything
For Products For Events
Shirts, for everything
For Products For Events For Celebrations

Shirts, for everything
For Products For Events For Celebrations
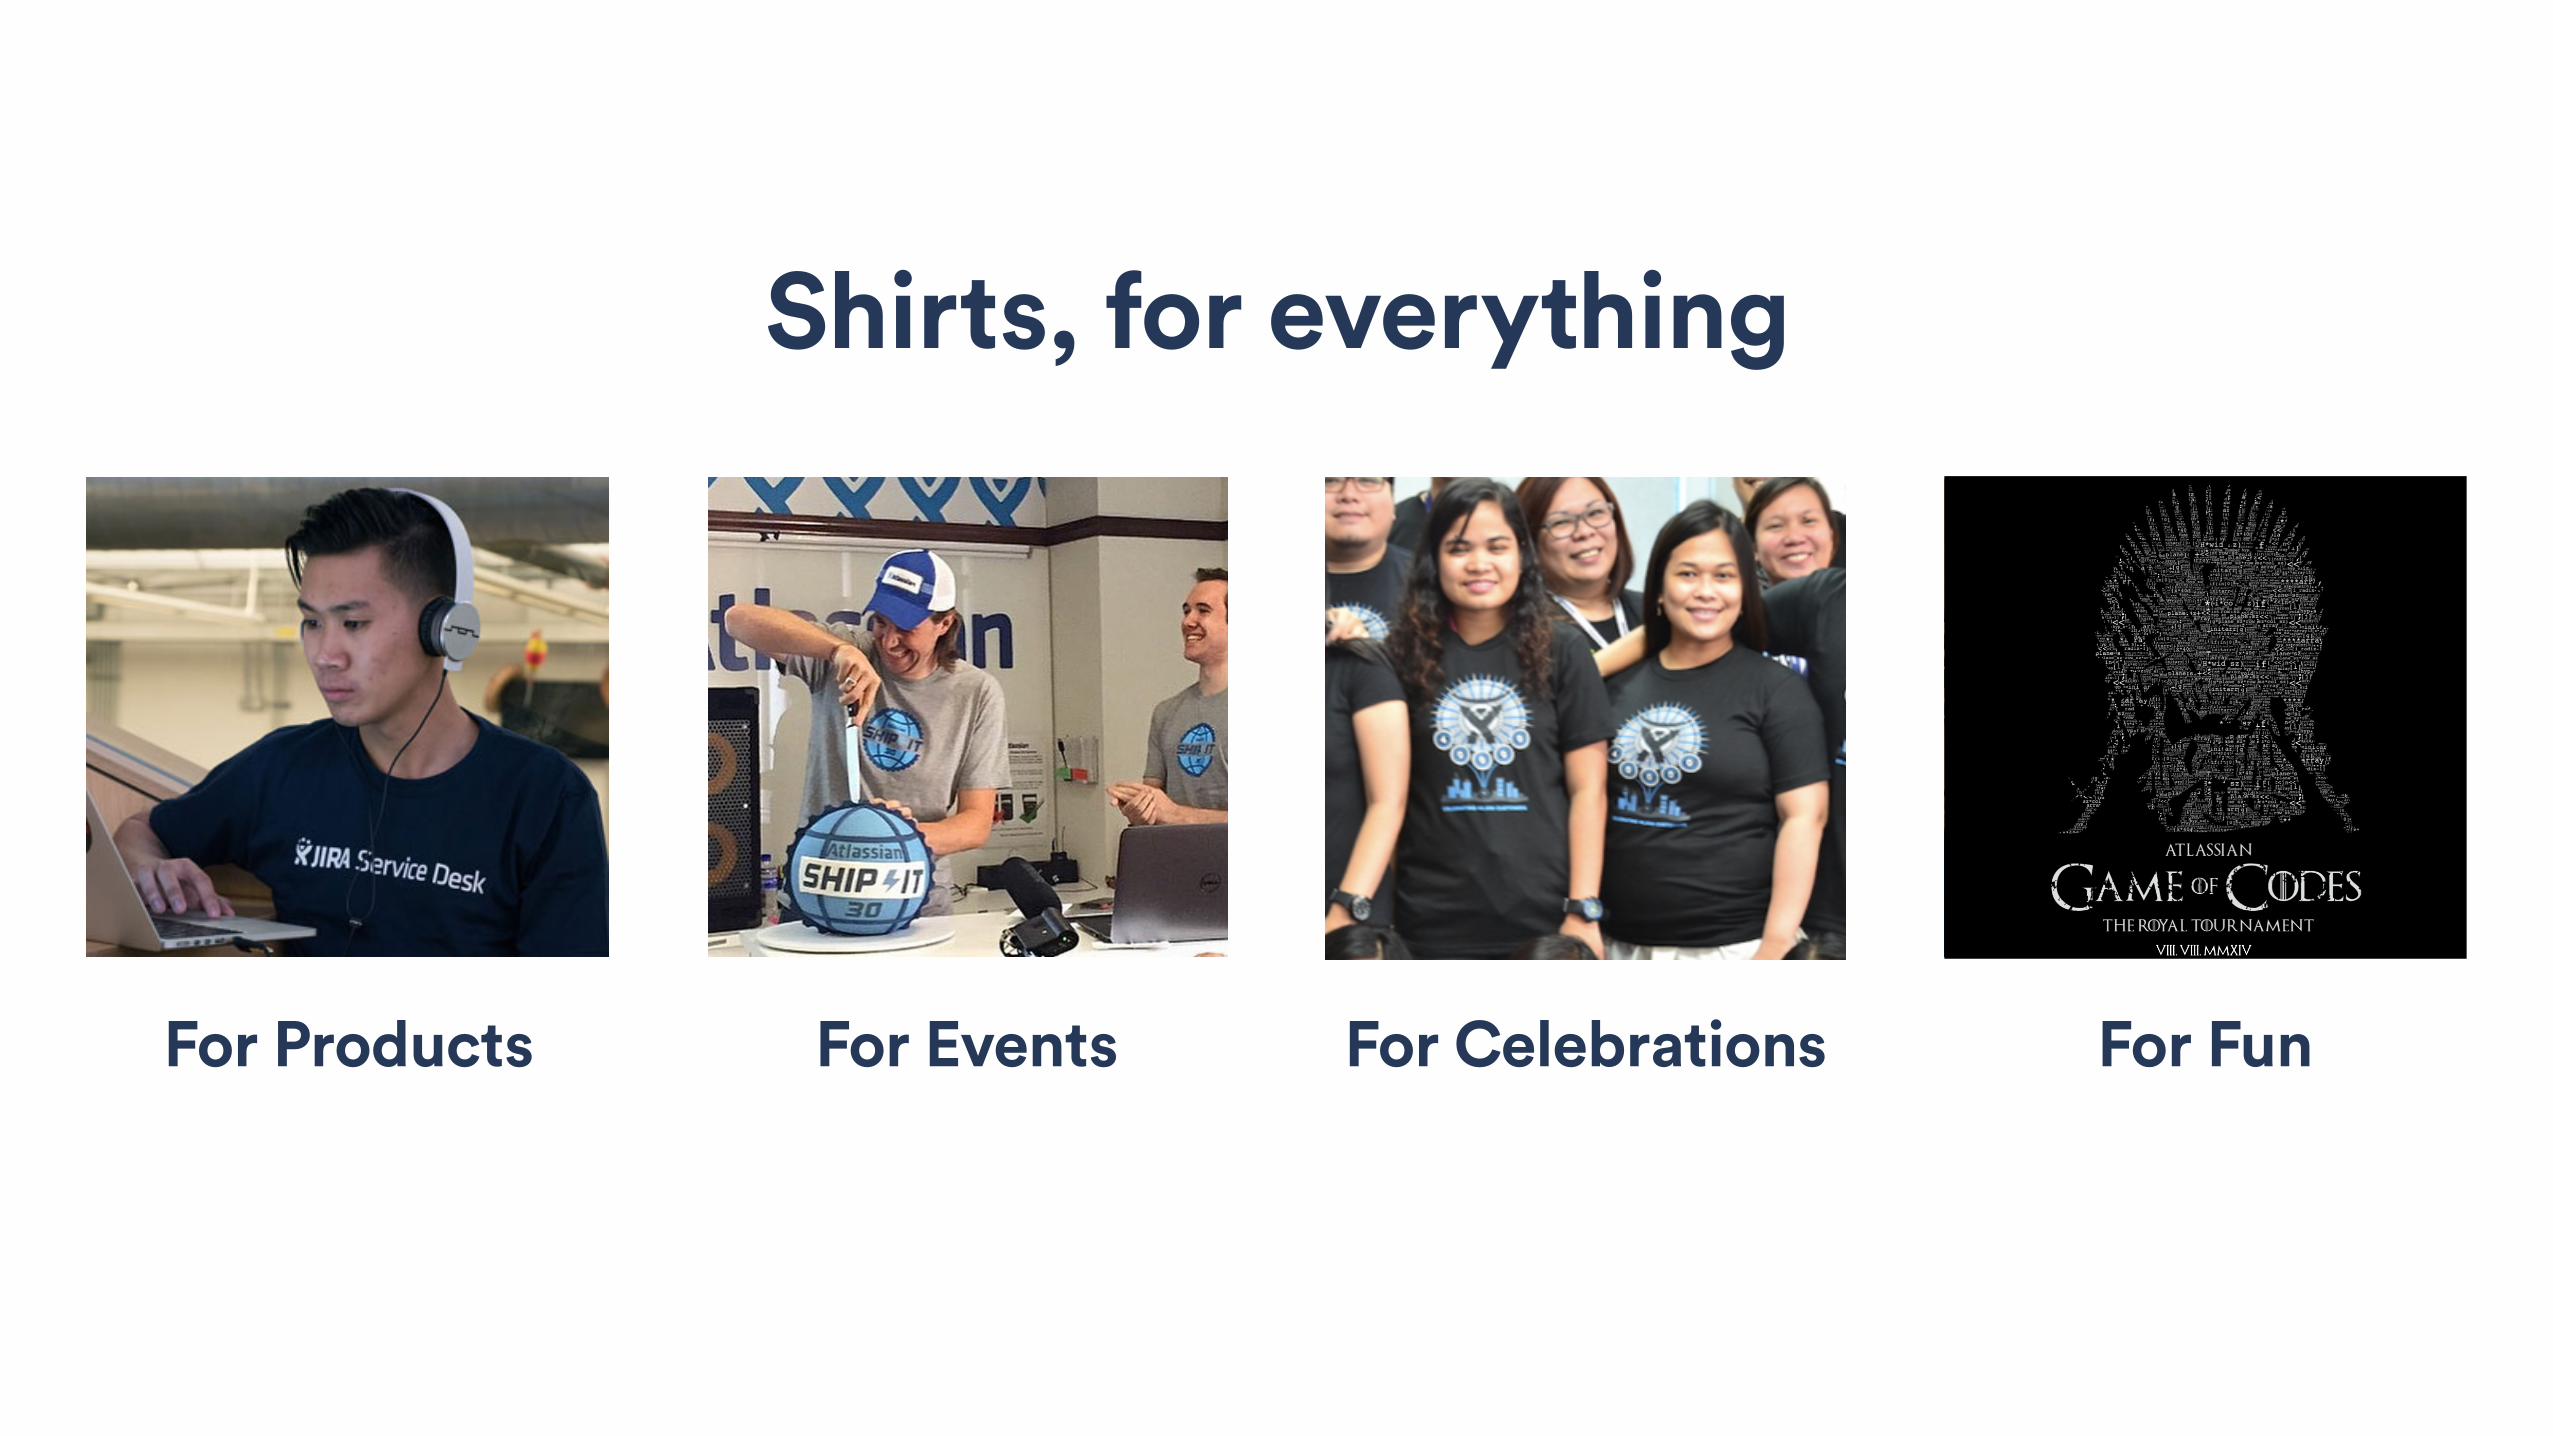
Shirts, for everything
For Products For Events For Celebrations For Fun
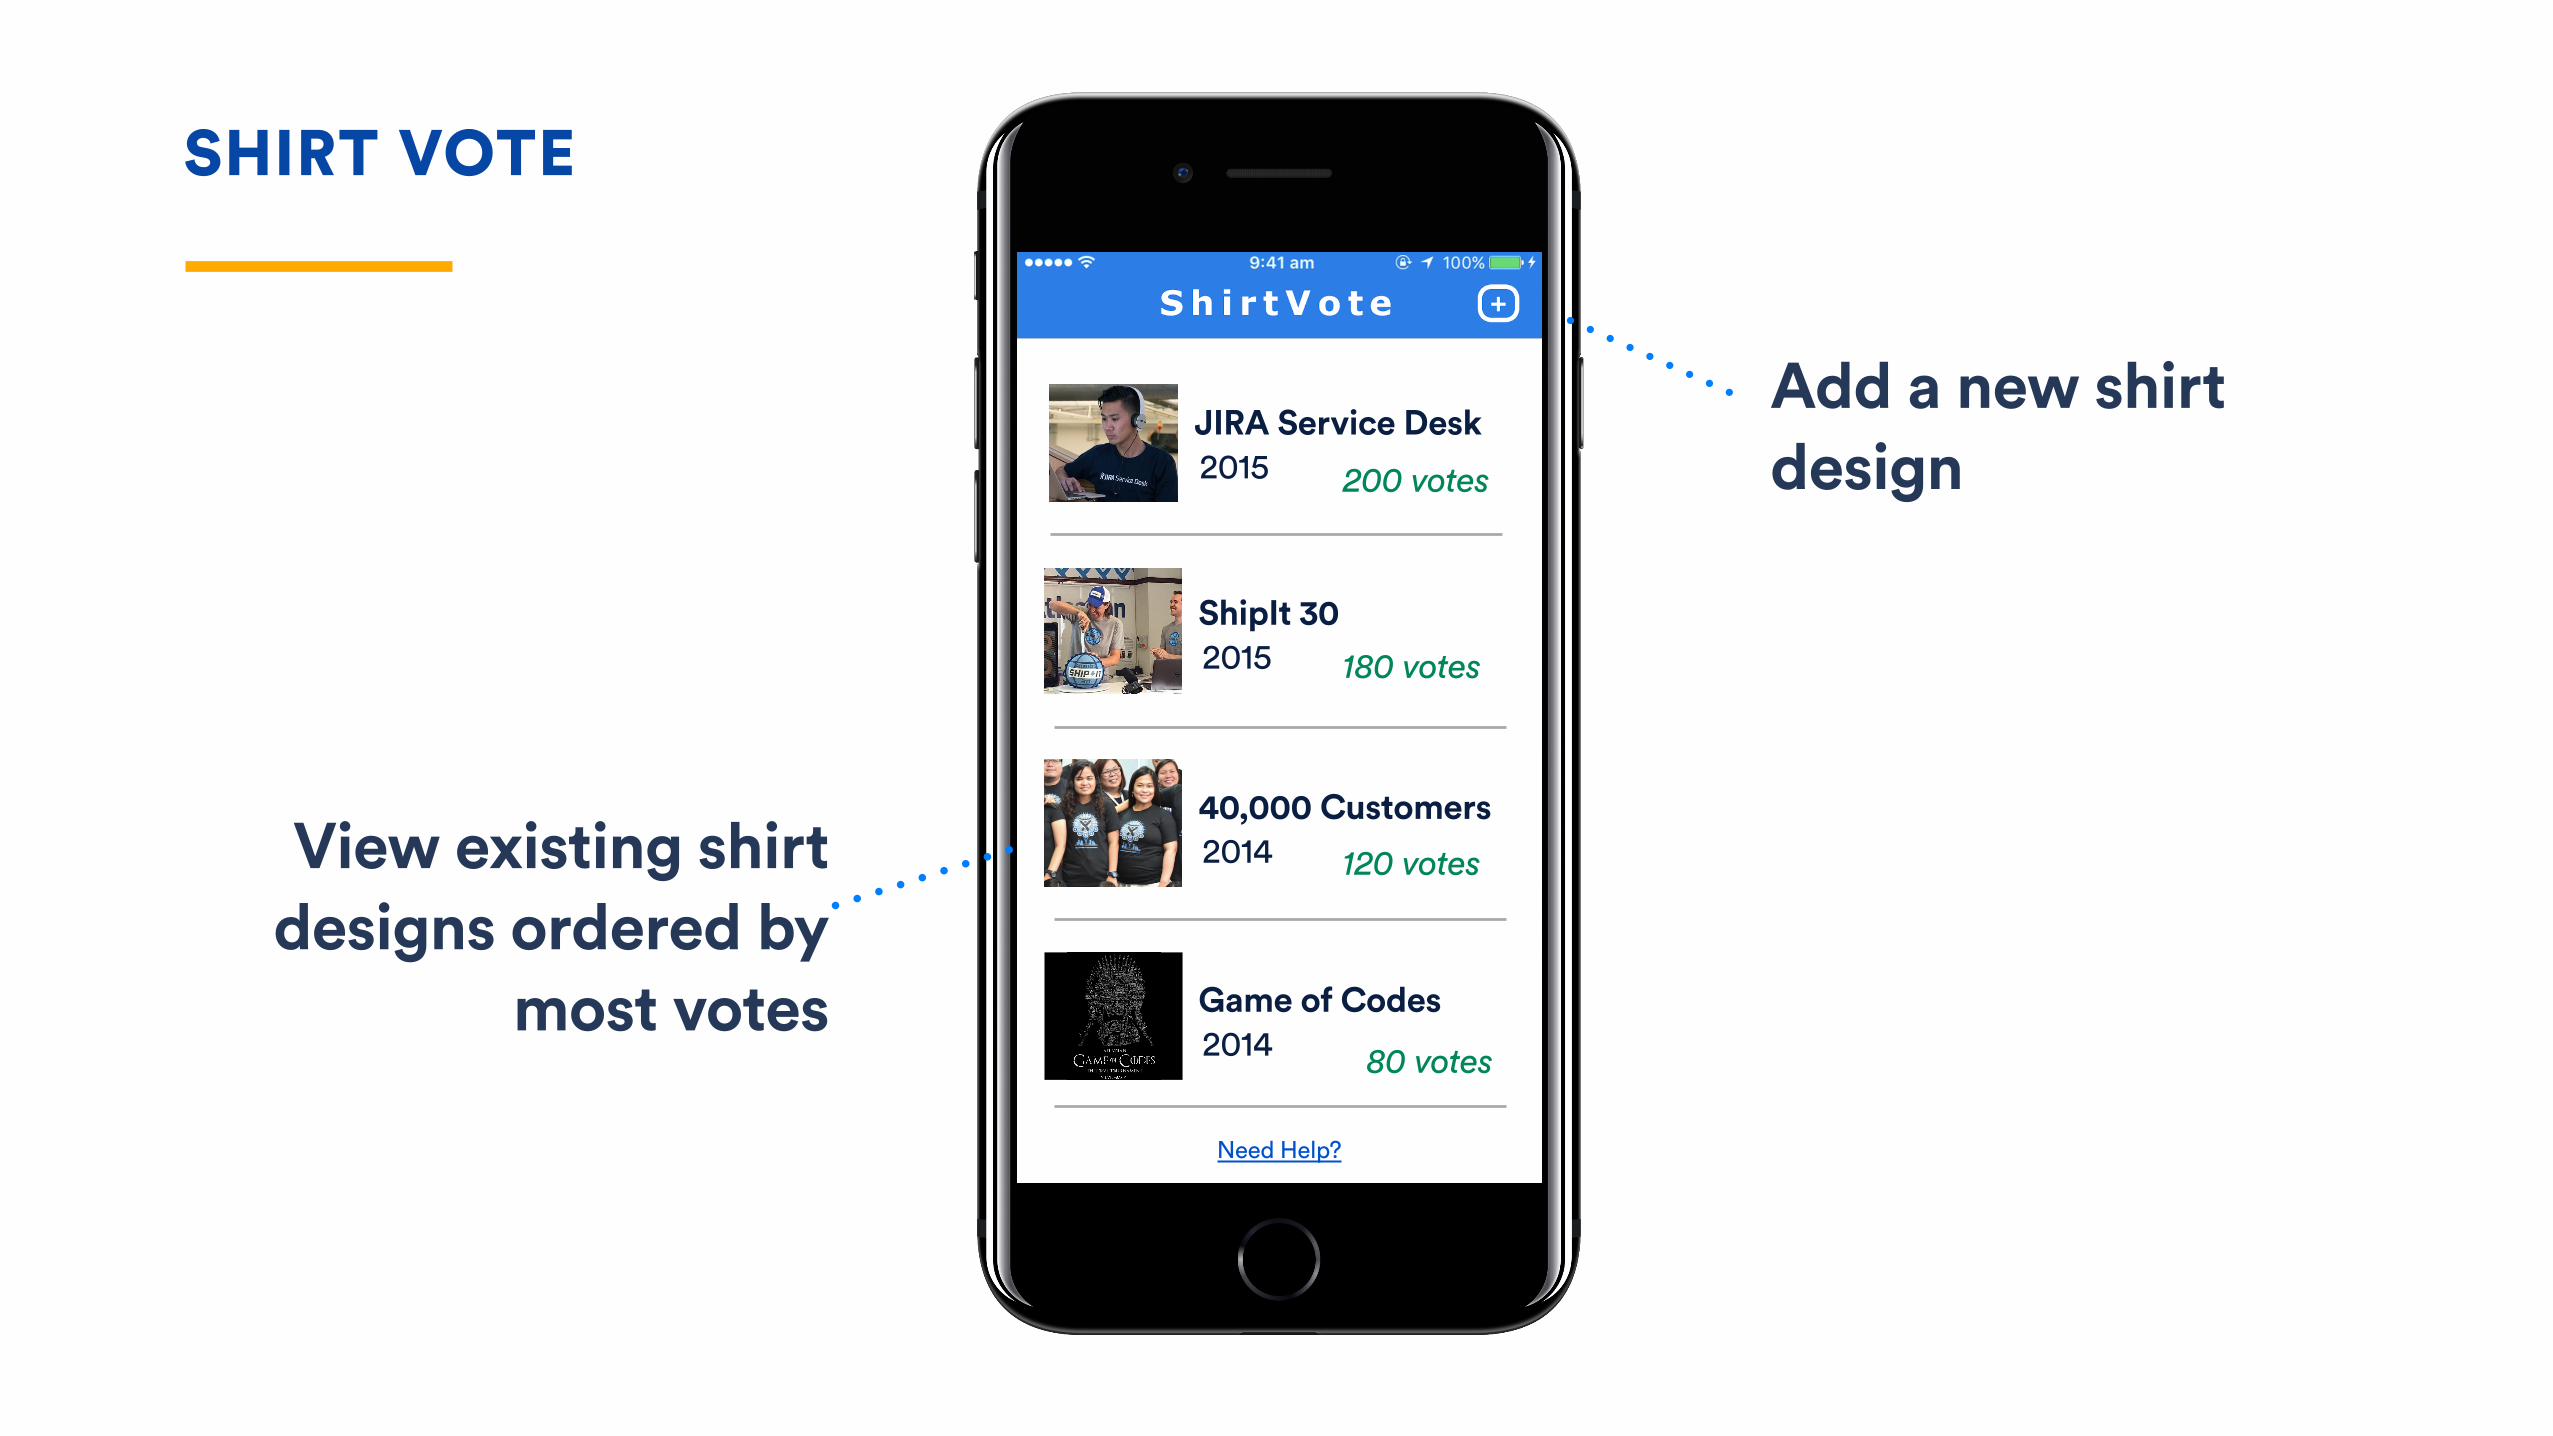
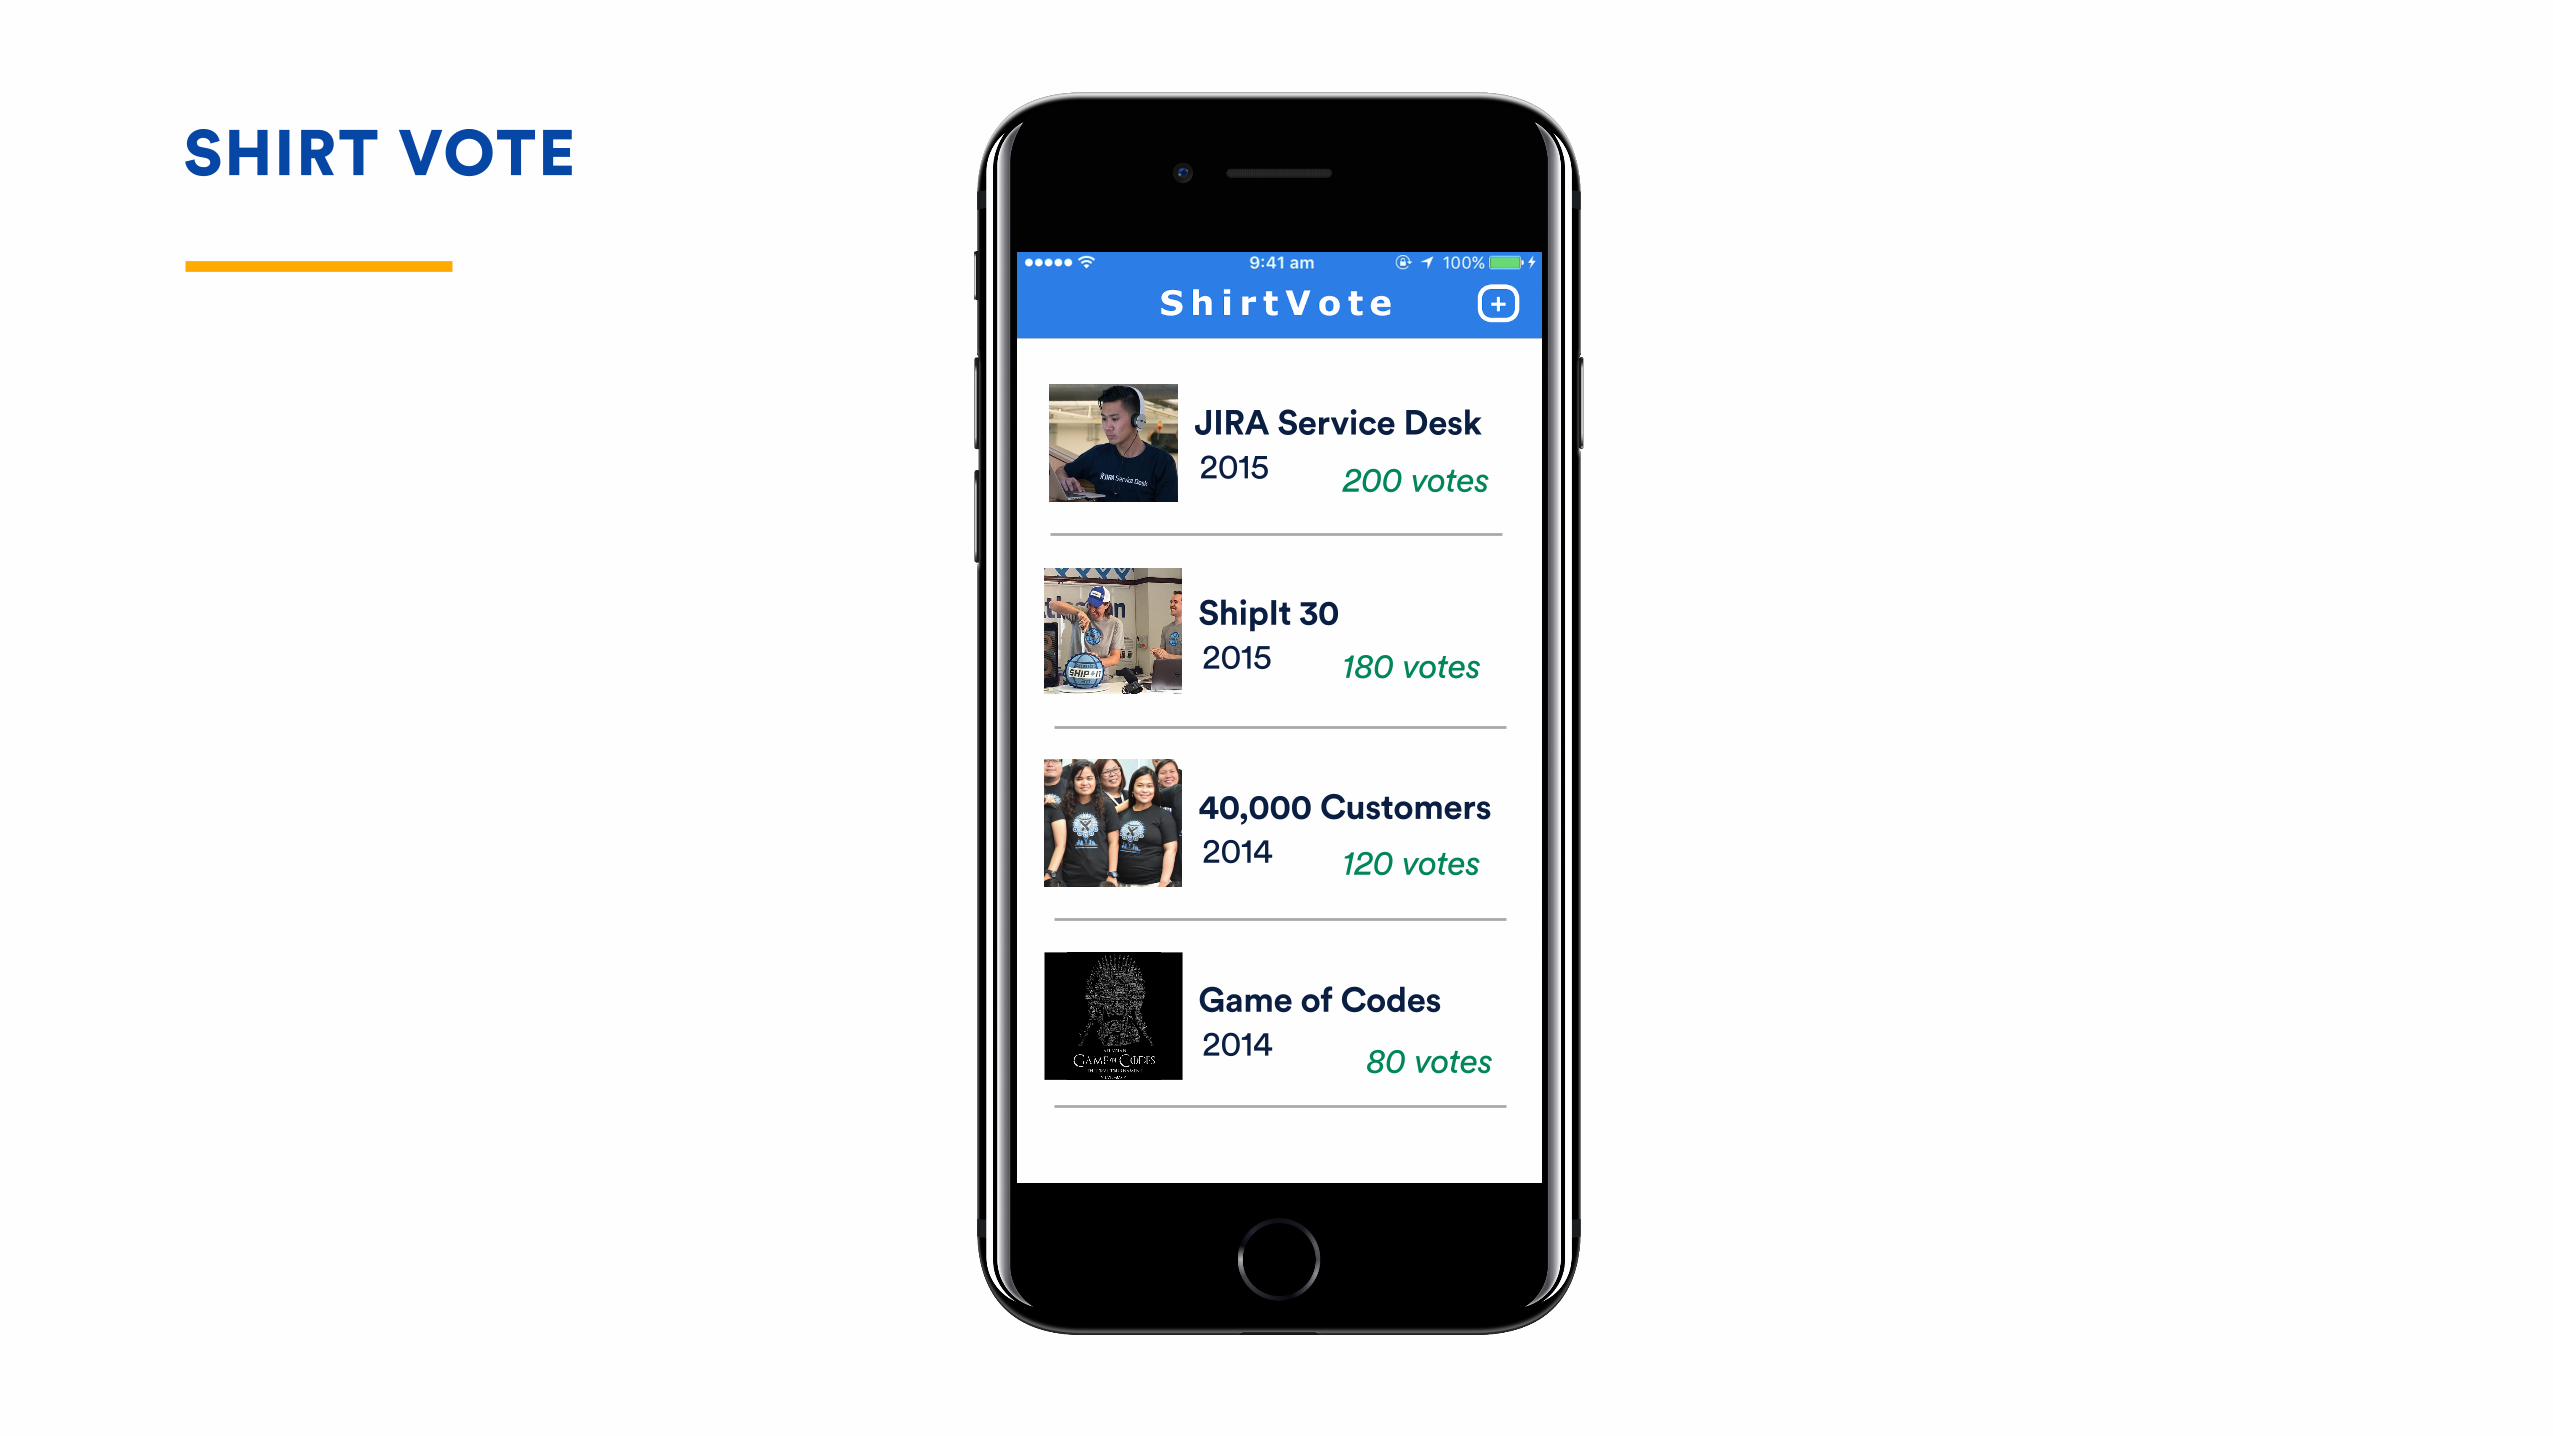
SHIRT VOTE
Add a new shirt design
View existing shirt designs ordered by
most votes
JIRA Service Desk2015
ShipIt 302015
40,000 Customers2014
Game of Codes2014
200 votes
180 votes
120 votes
80 votes
Need Help?
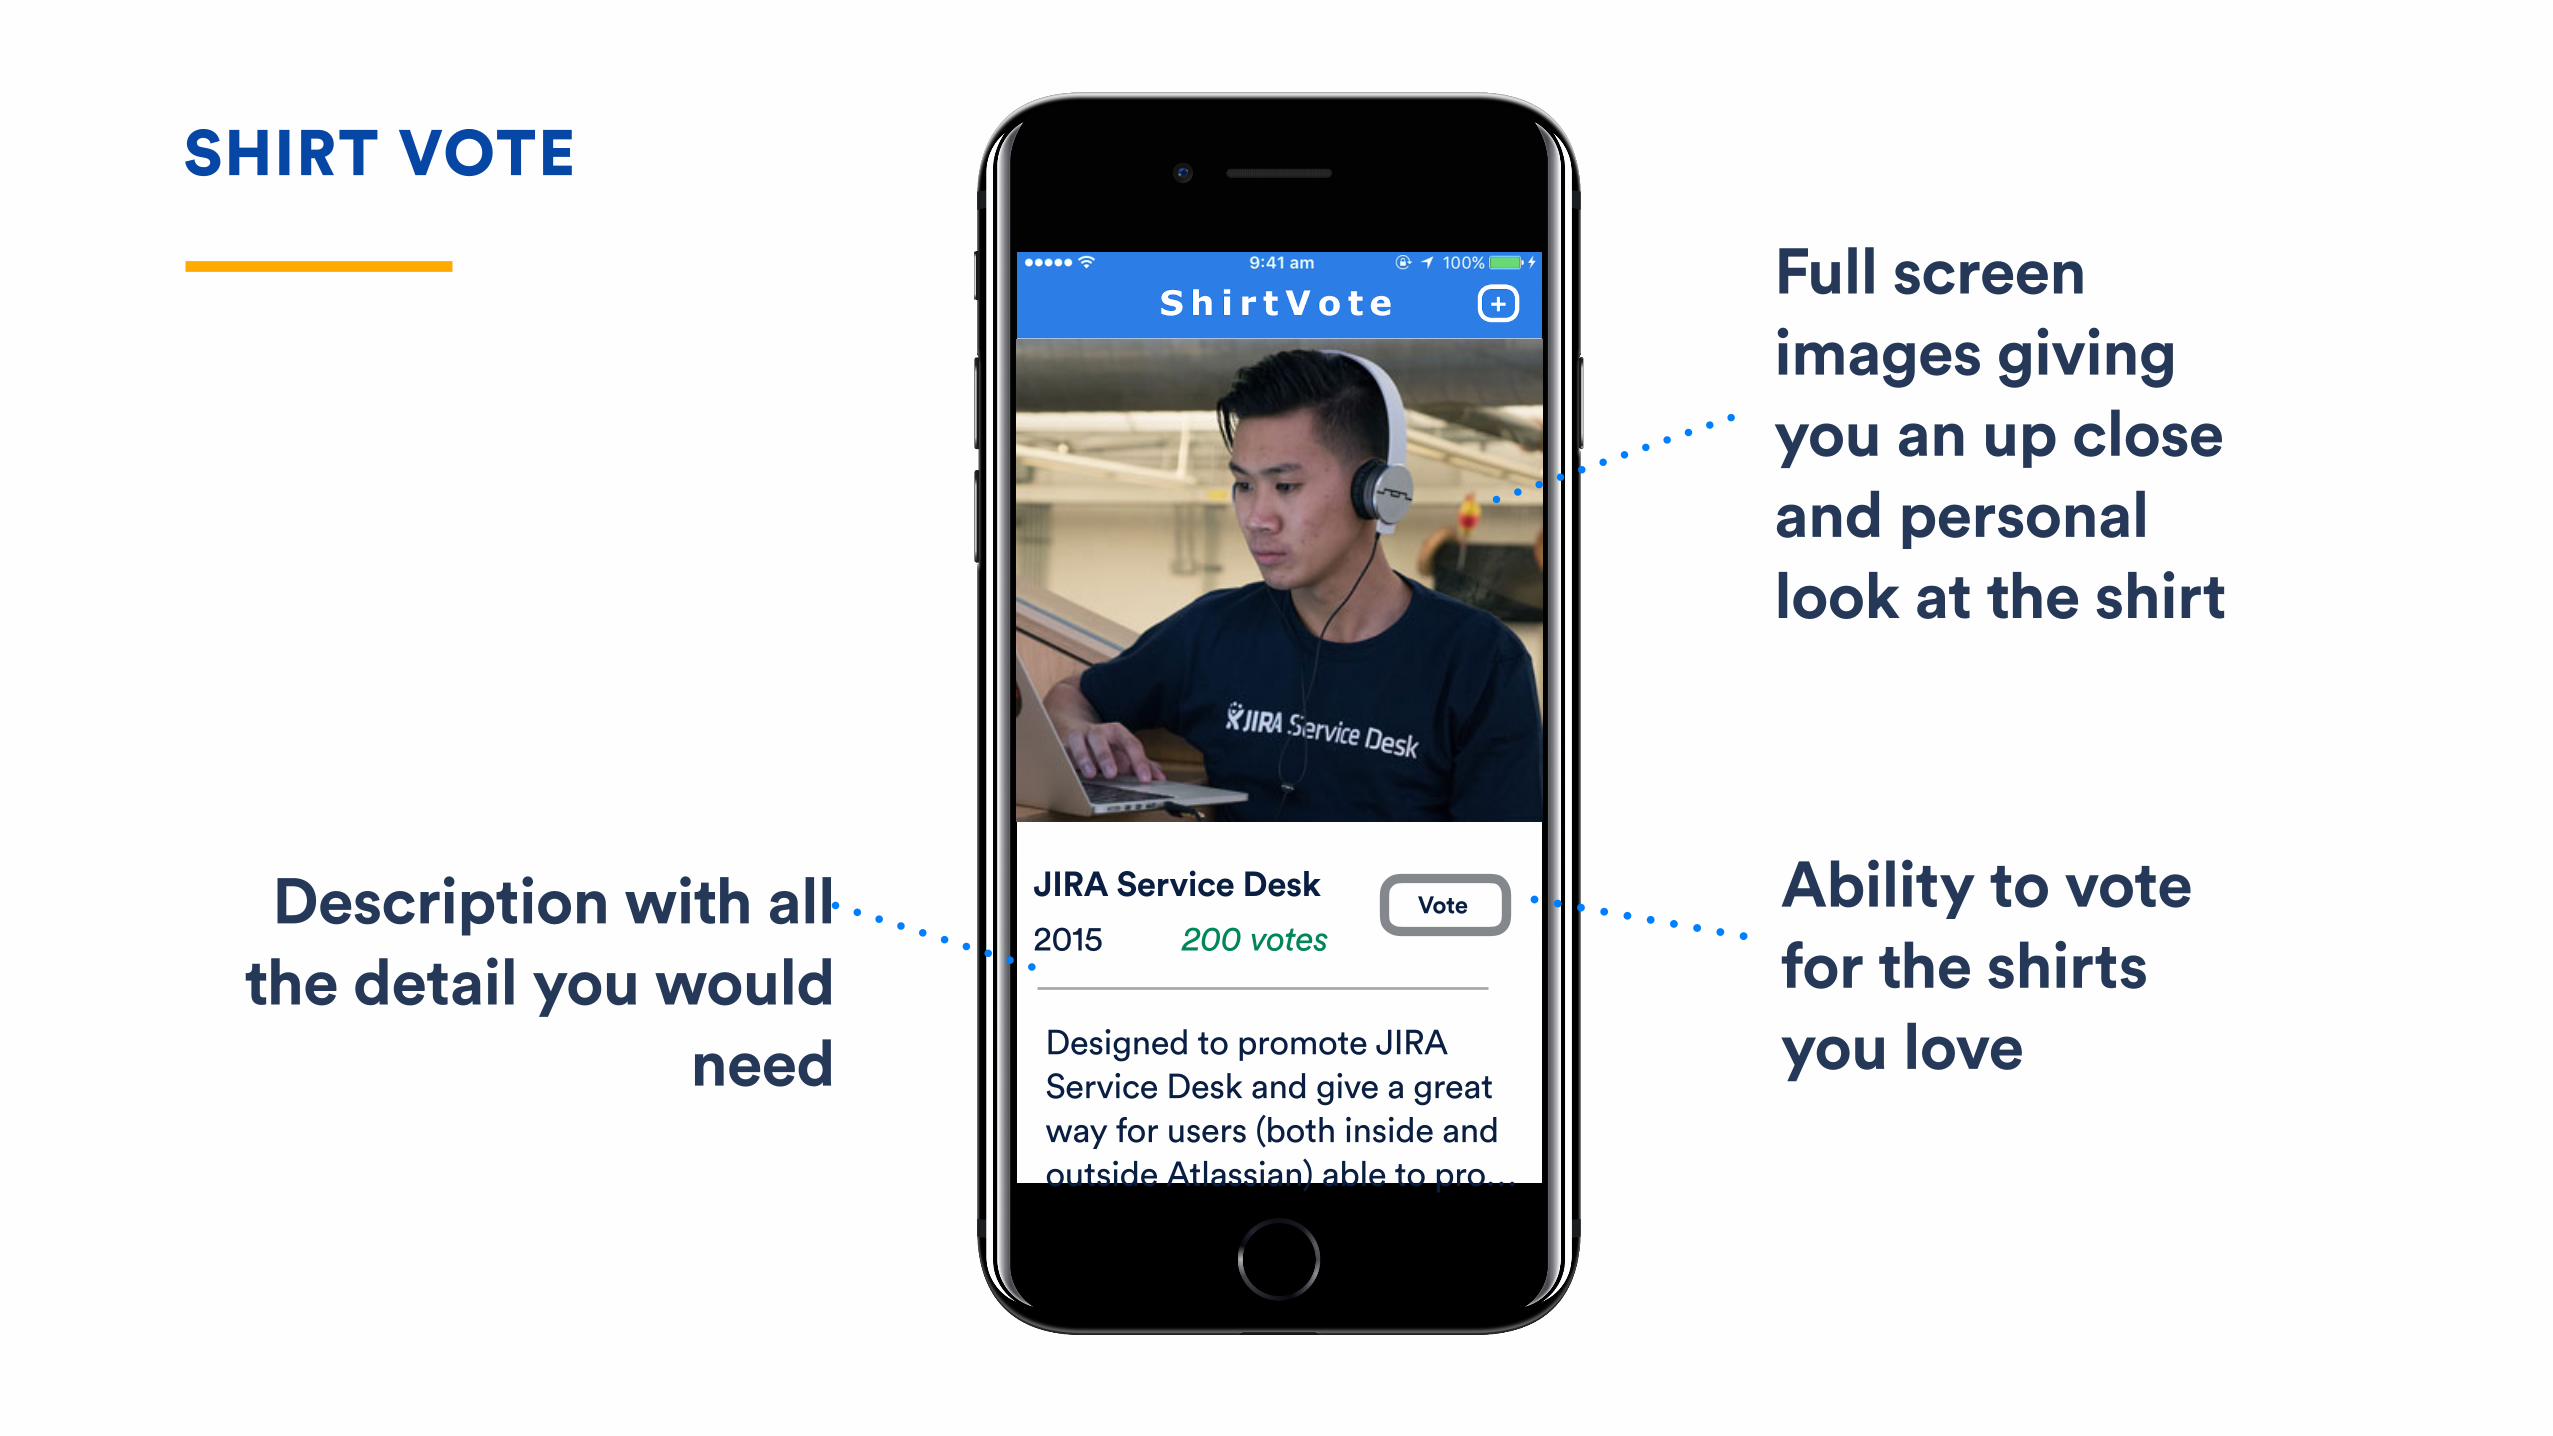
SHIRT VOTE
Full screen images giving you an up close and personal look at the shirt
Description with all the detail you would
need
JIRA Service Desk2015
Vote
Designed to promote JIRA Service Desk and give a great way for users (both inside and outside Atlassian) able to pro…
Ability to vote for the shirts you love
200 votes

AgendaReporting
Insights
Prediction
The Problem

How do you tell if a product is causing customer pain?

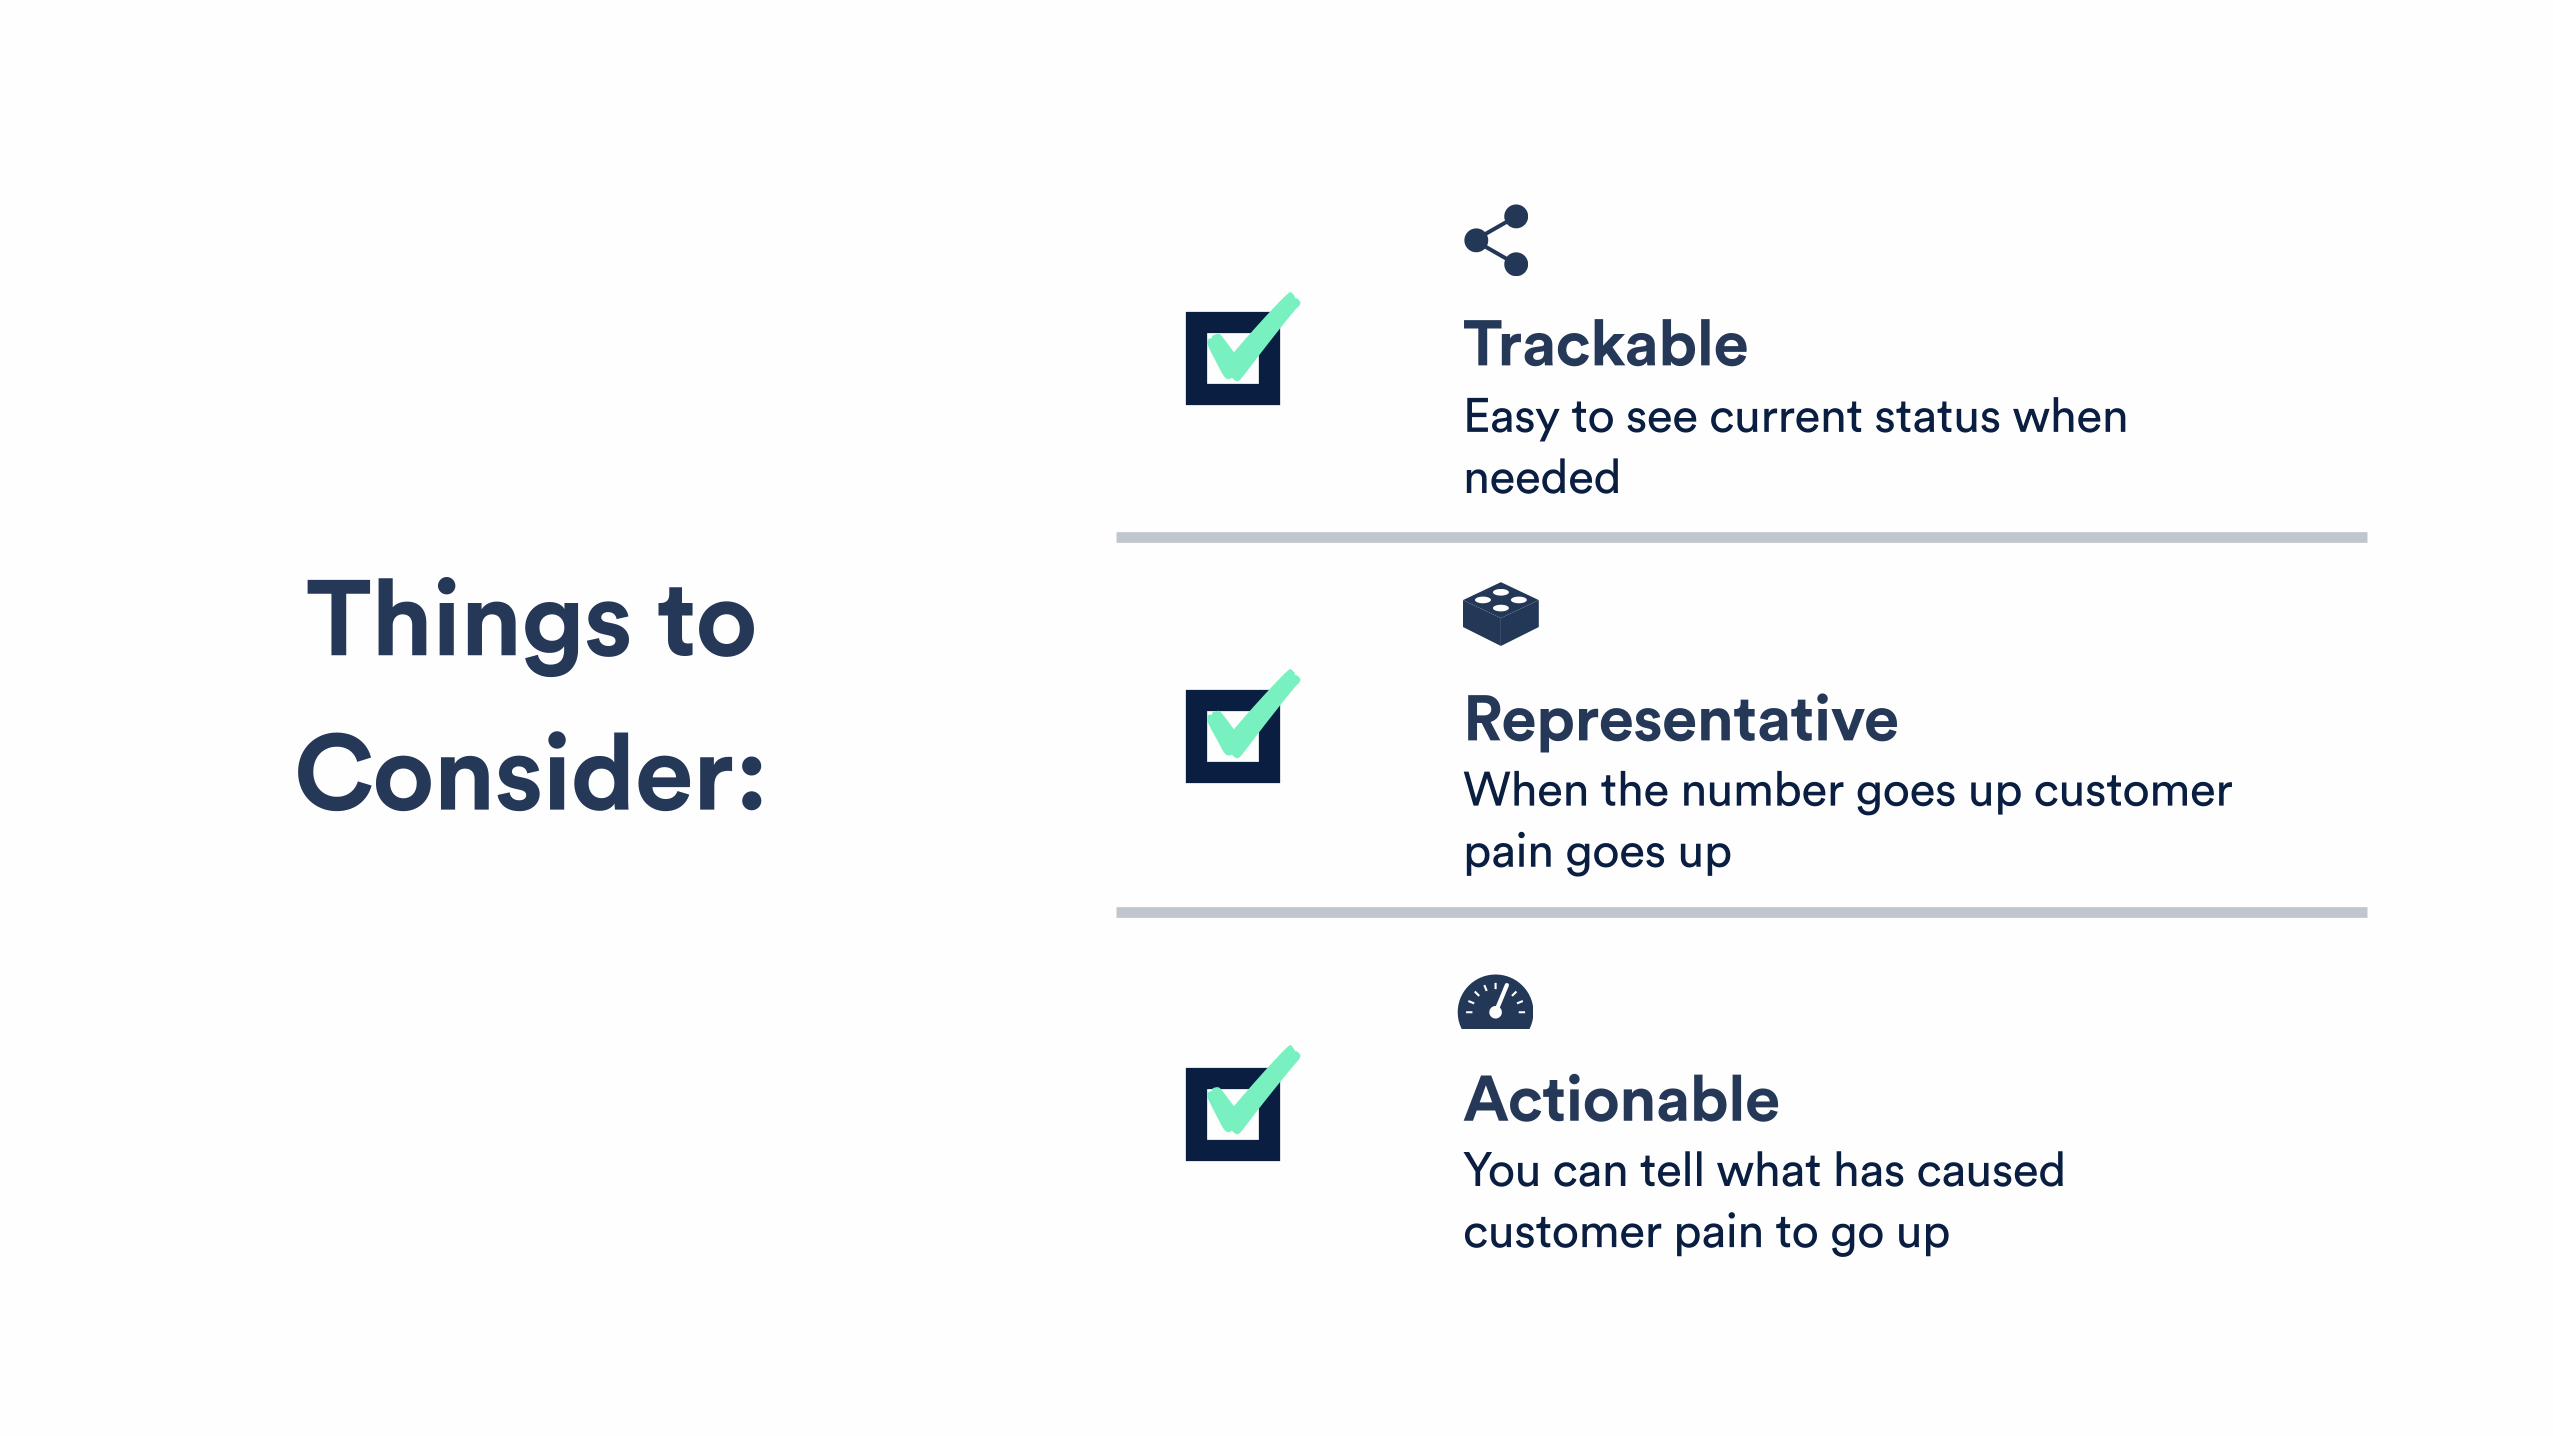
Things to Consider:
Actionable You can tell what has caused customer pain to go up.
Representative When the number goes up customer pain goes up.
Trackable Easy to see current status when needed

60Support tickets in a month
90Support tickets in a month
40Support tickets in a month

Things to Consider:
Actionable You can tell what has caused customer pain to go up
Representative When the number goes up customer pain goes up
Trackable Easy to see current status when needed
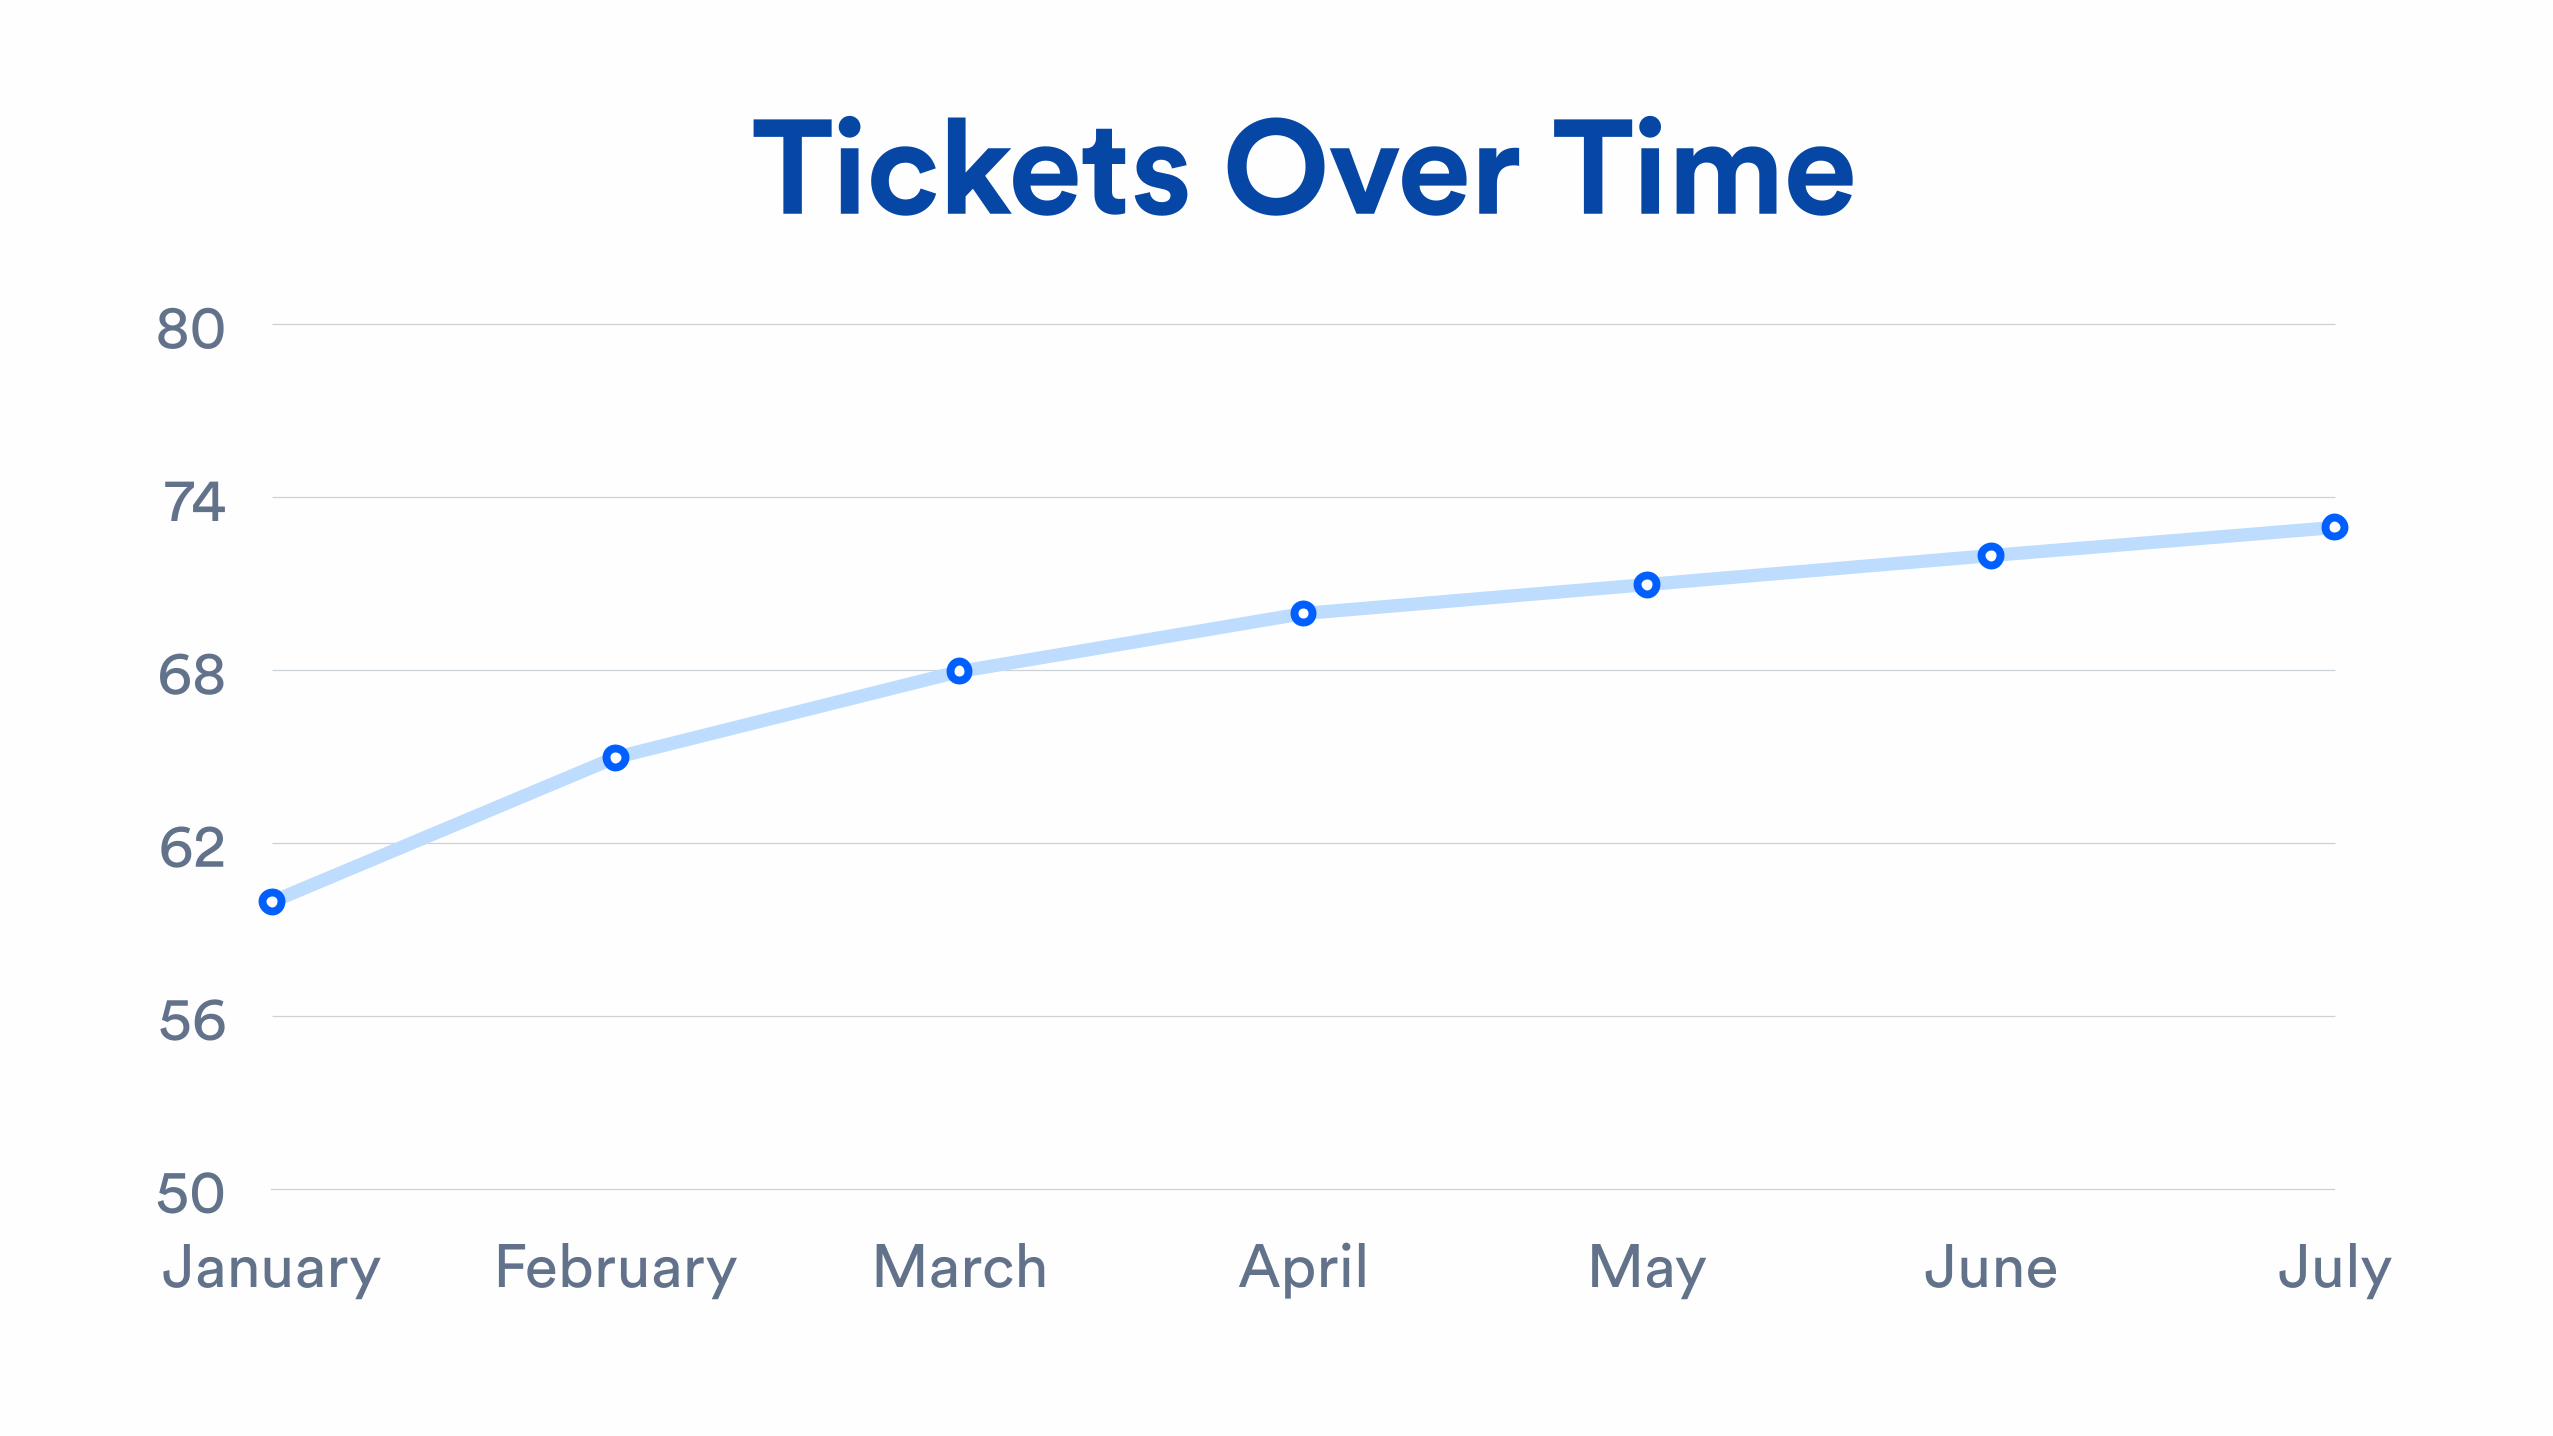
Tickets Over Time
50
56
62
68
74
80
January February March April May June July
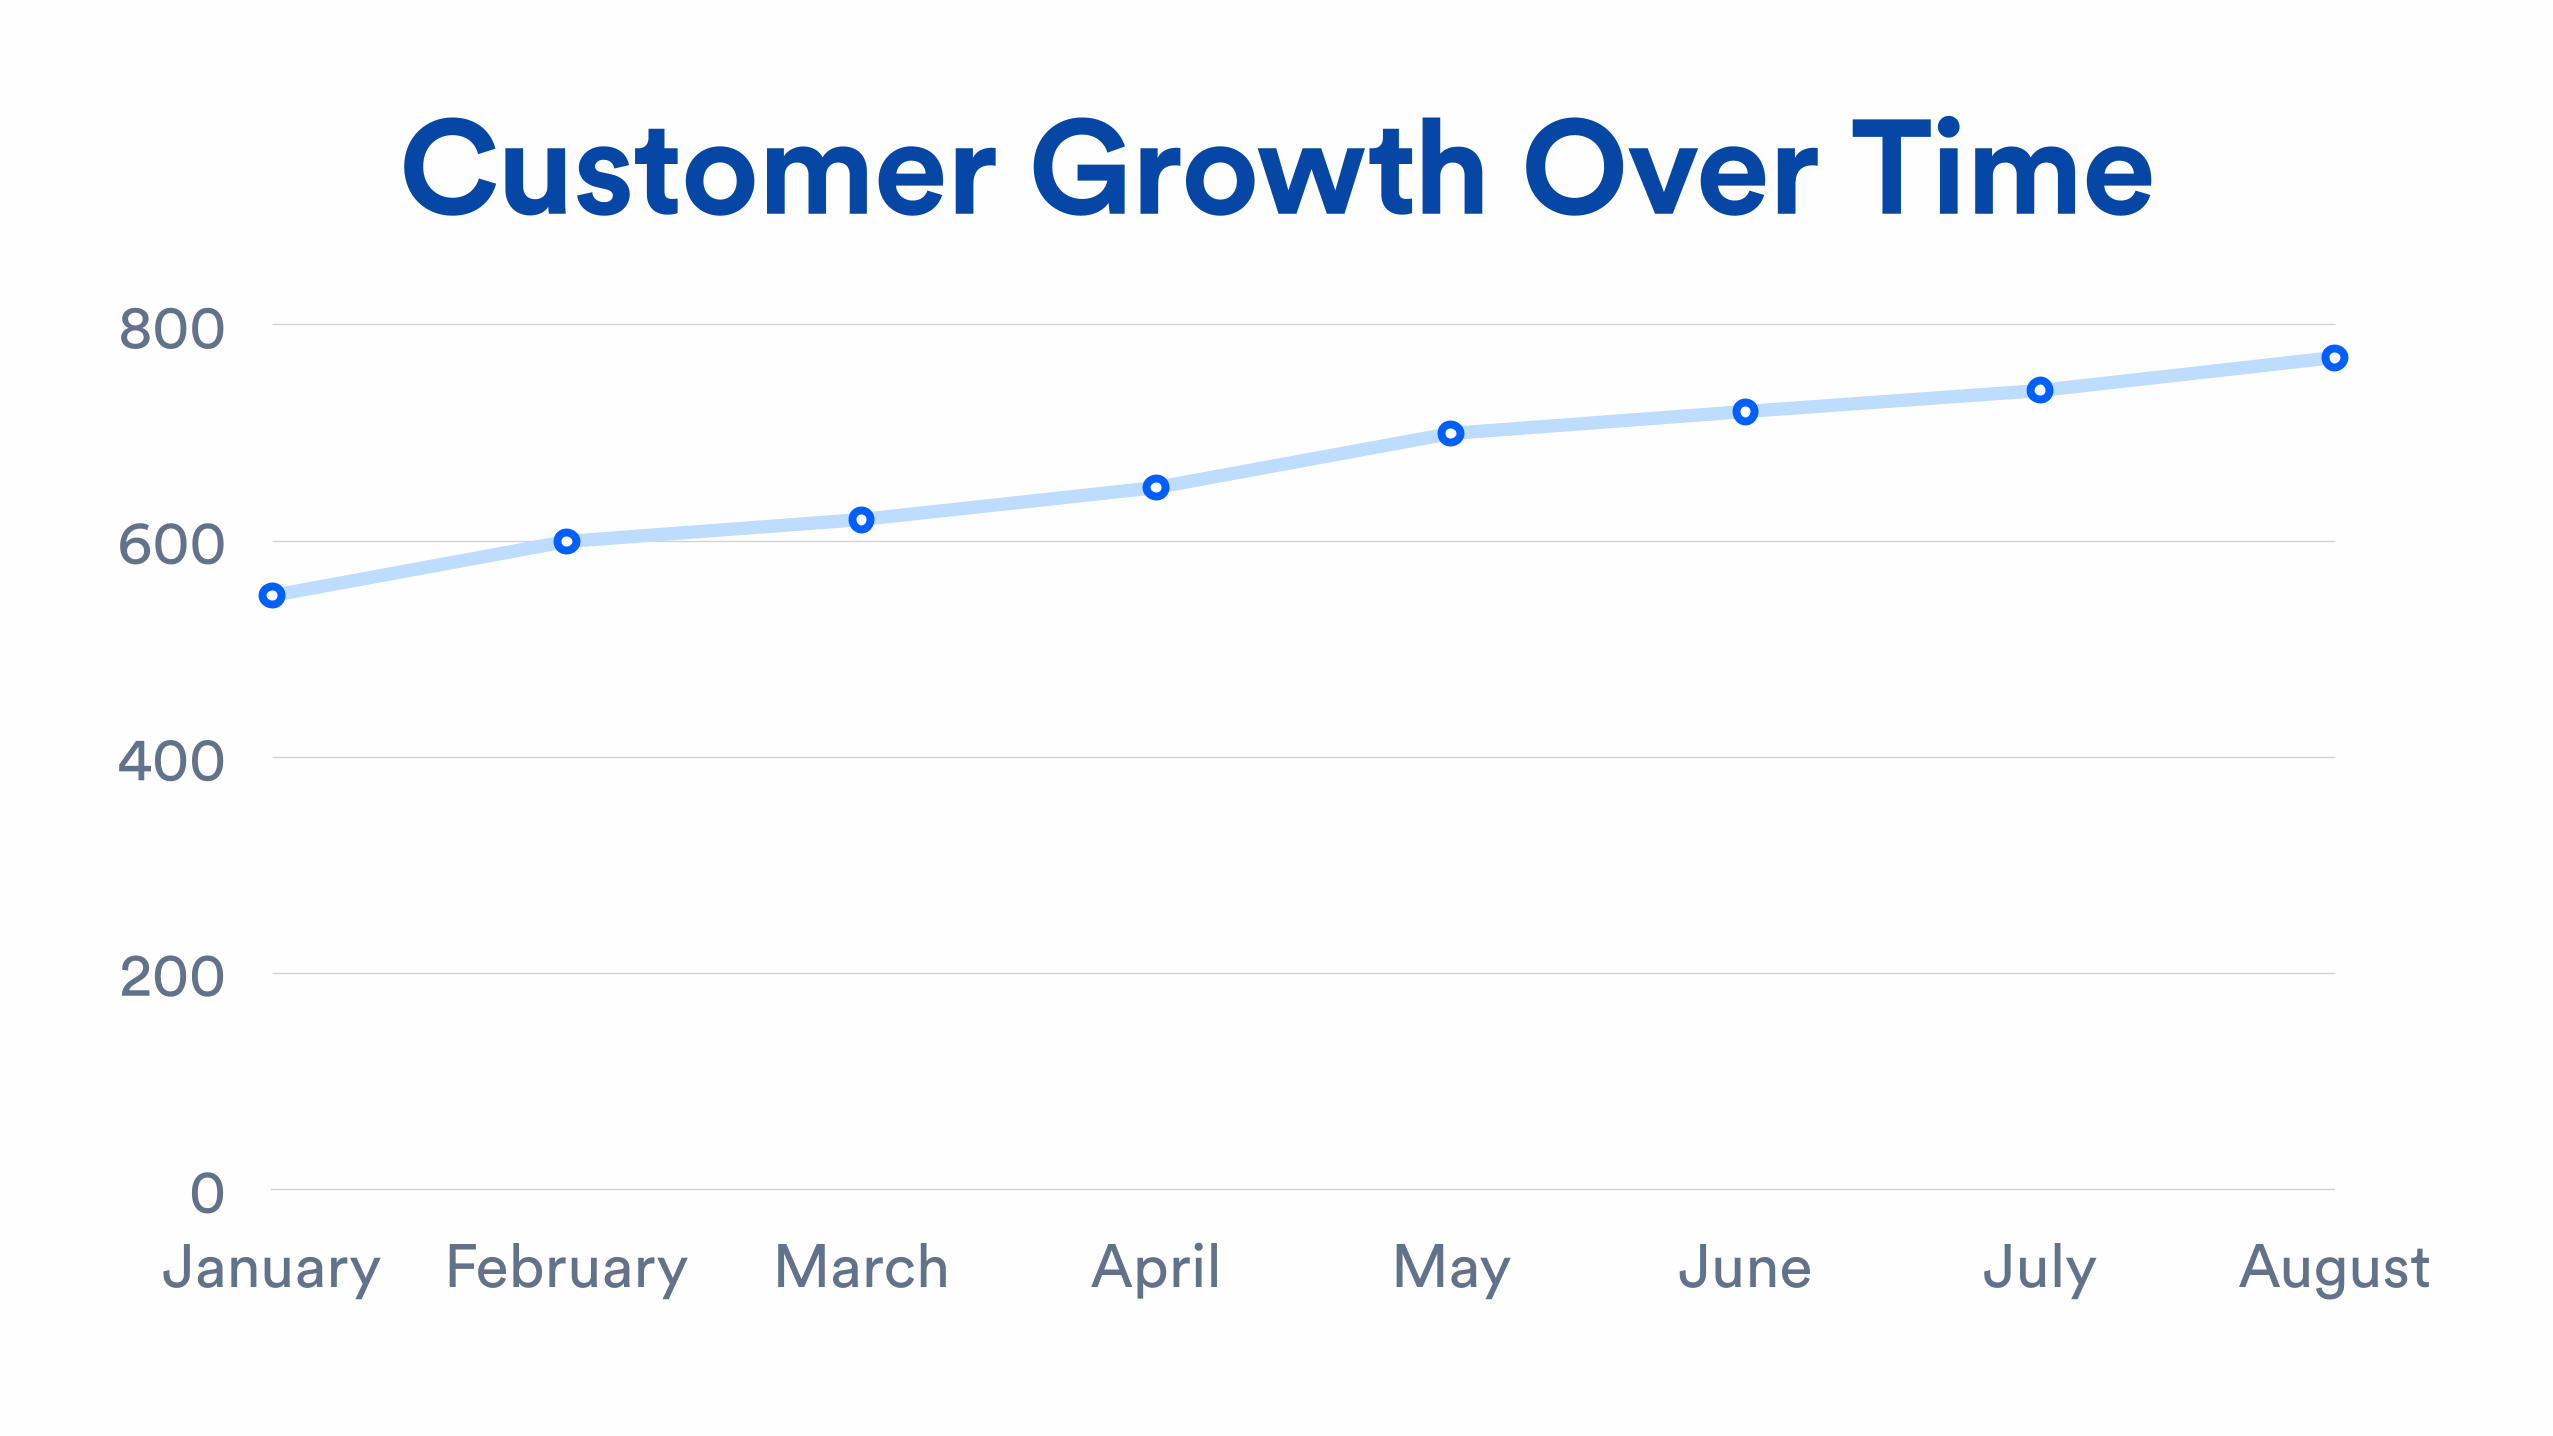
Customer Growth Over Time
0
200
400
600
800
January February March April May June July August
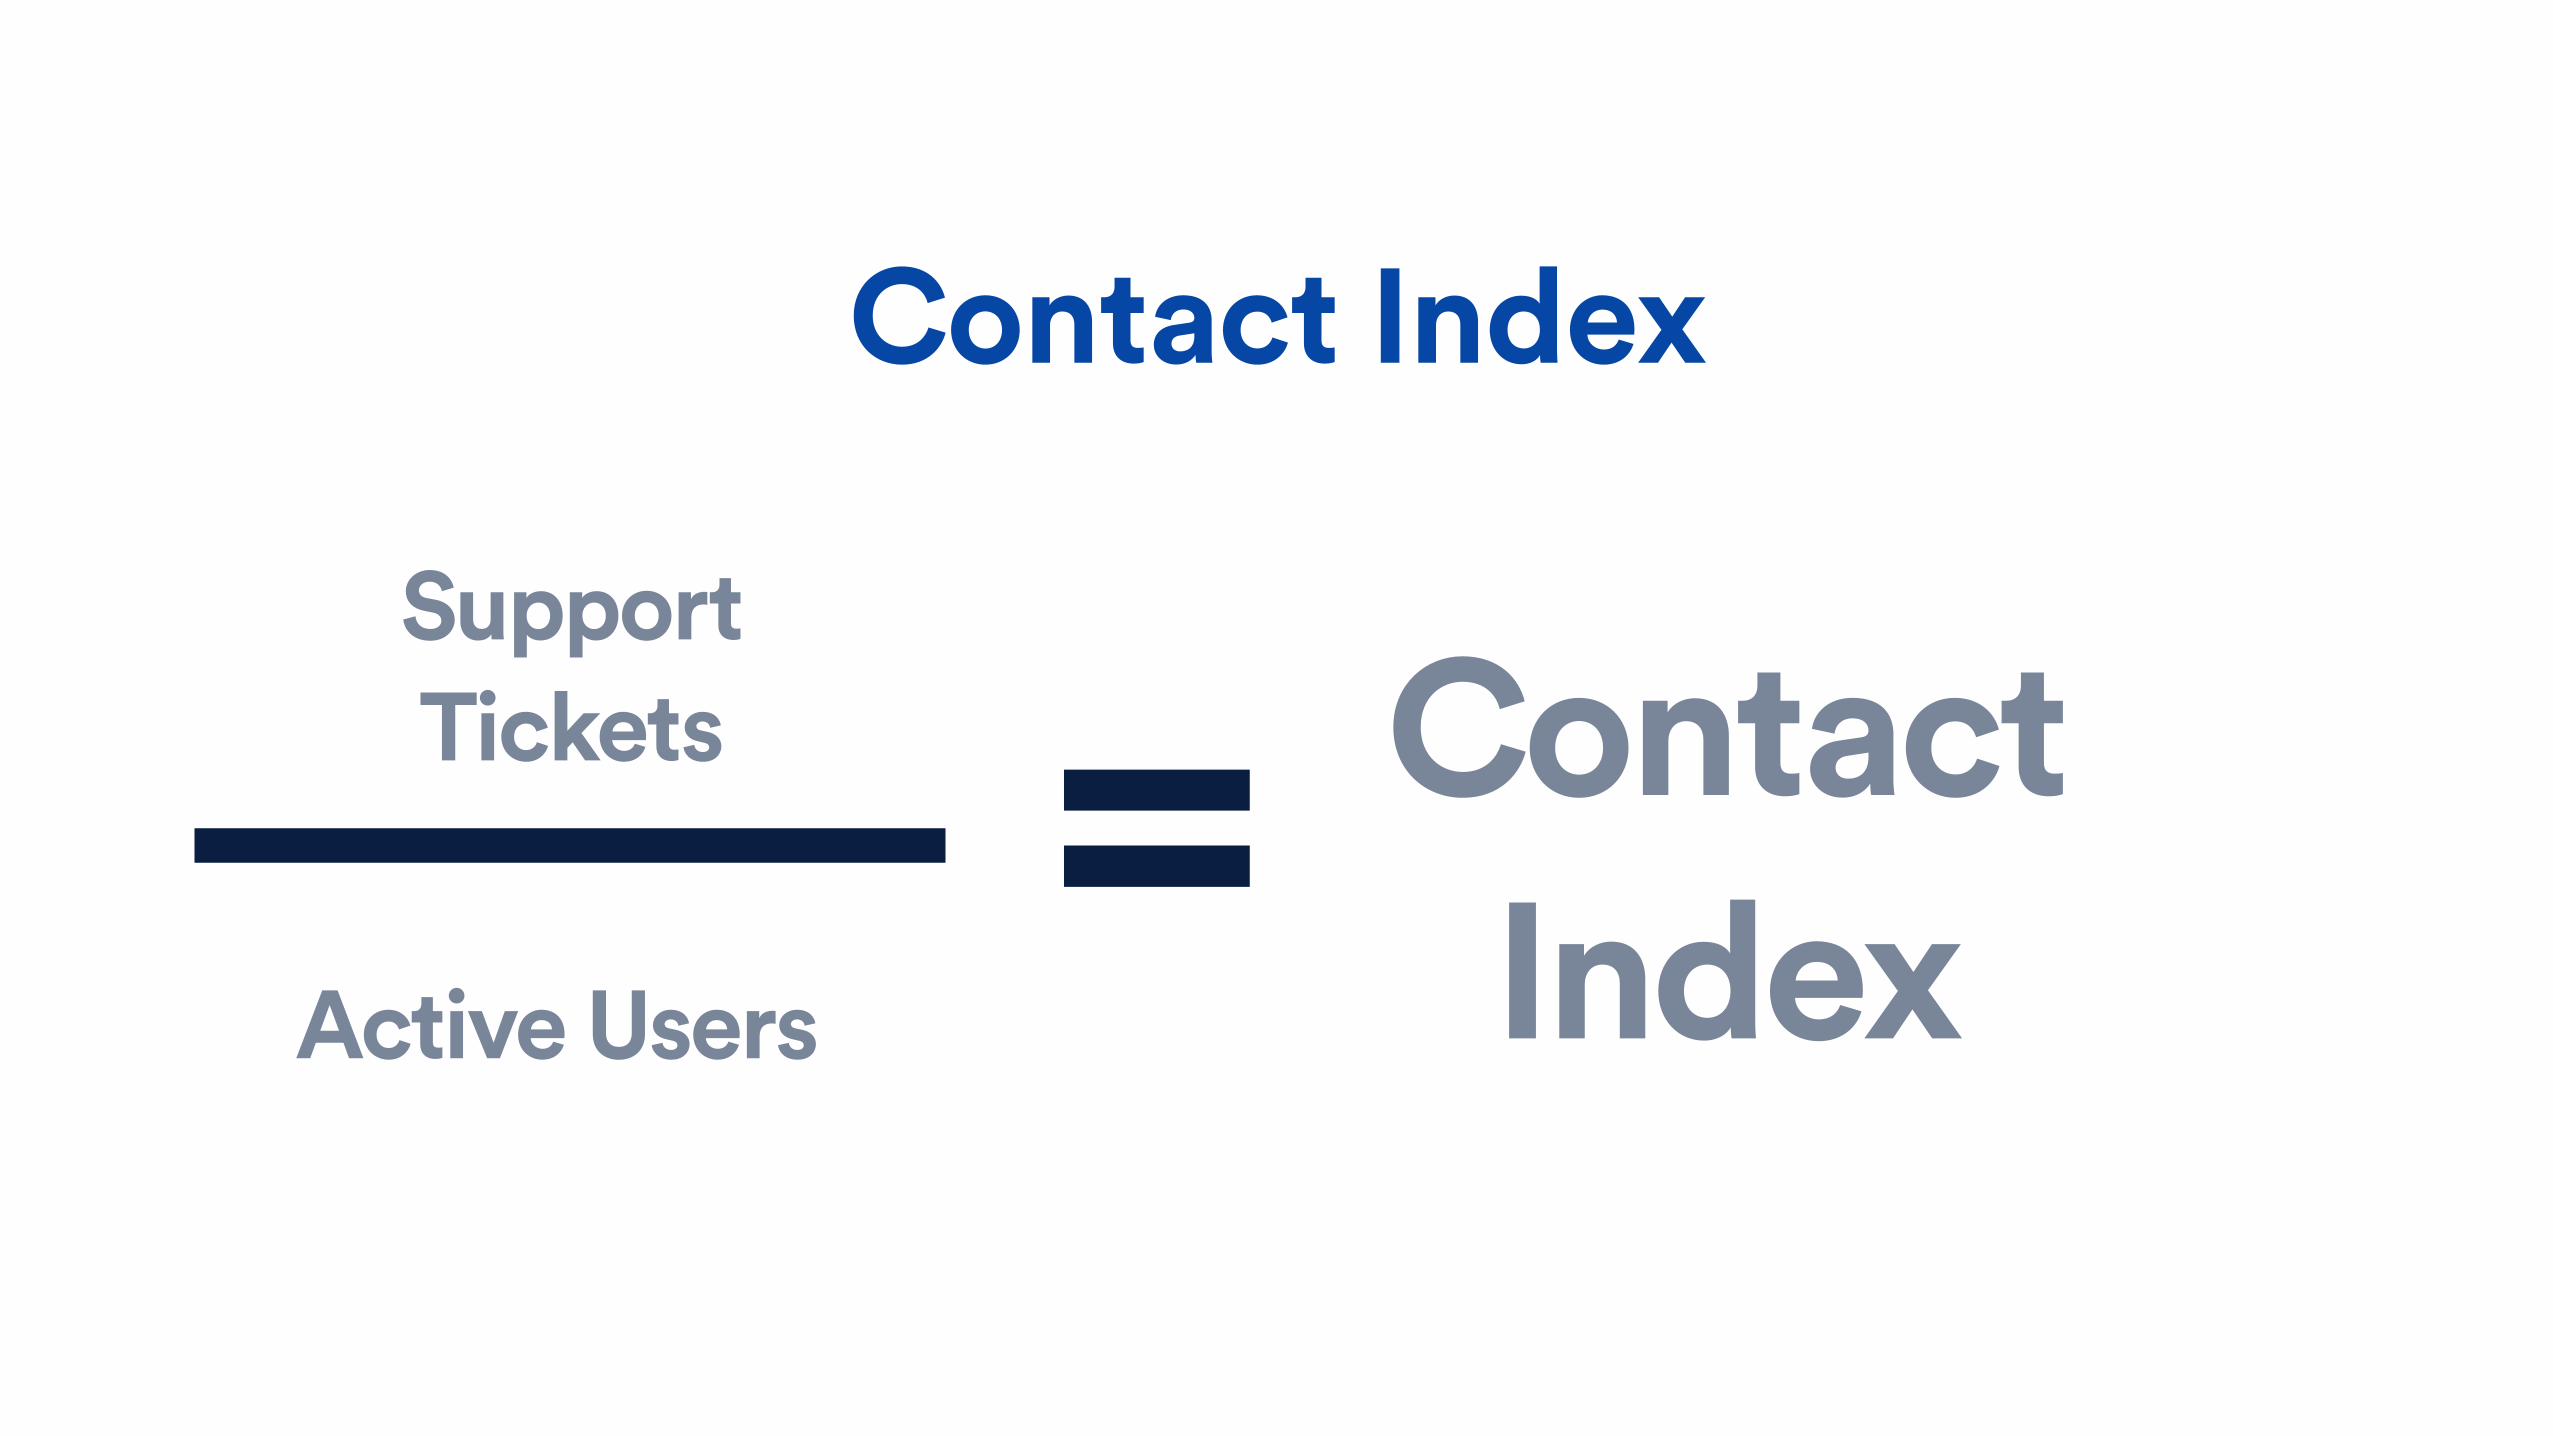
Contact Index
Support Tickets =
Active Users
Contact Index
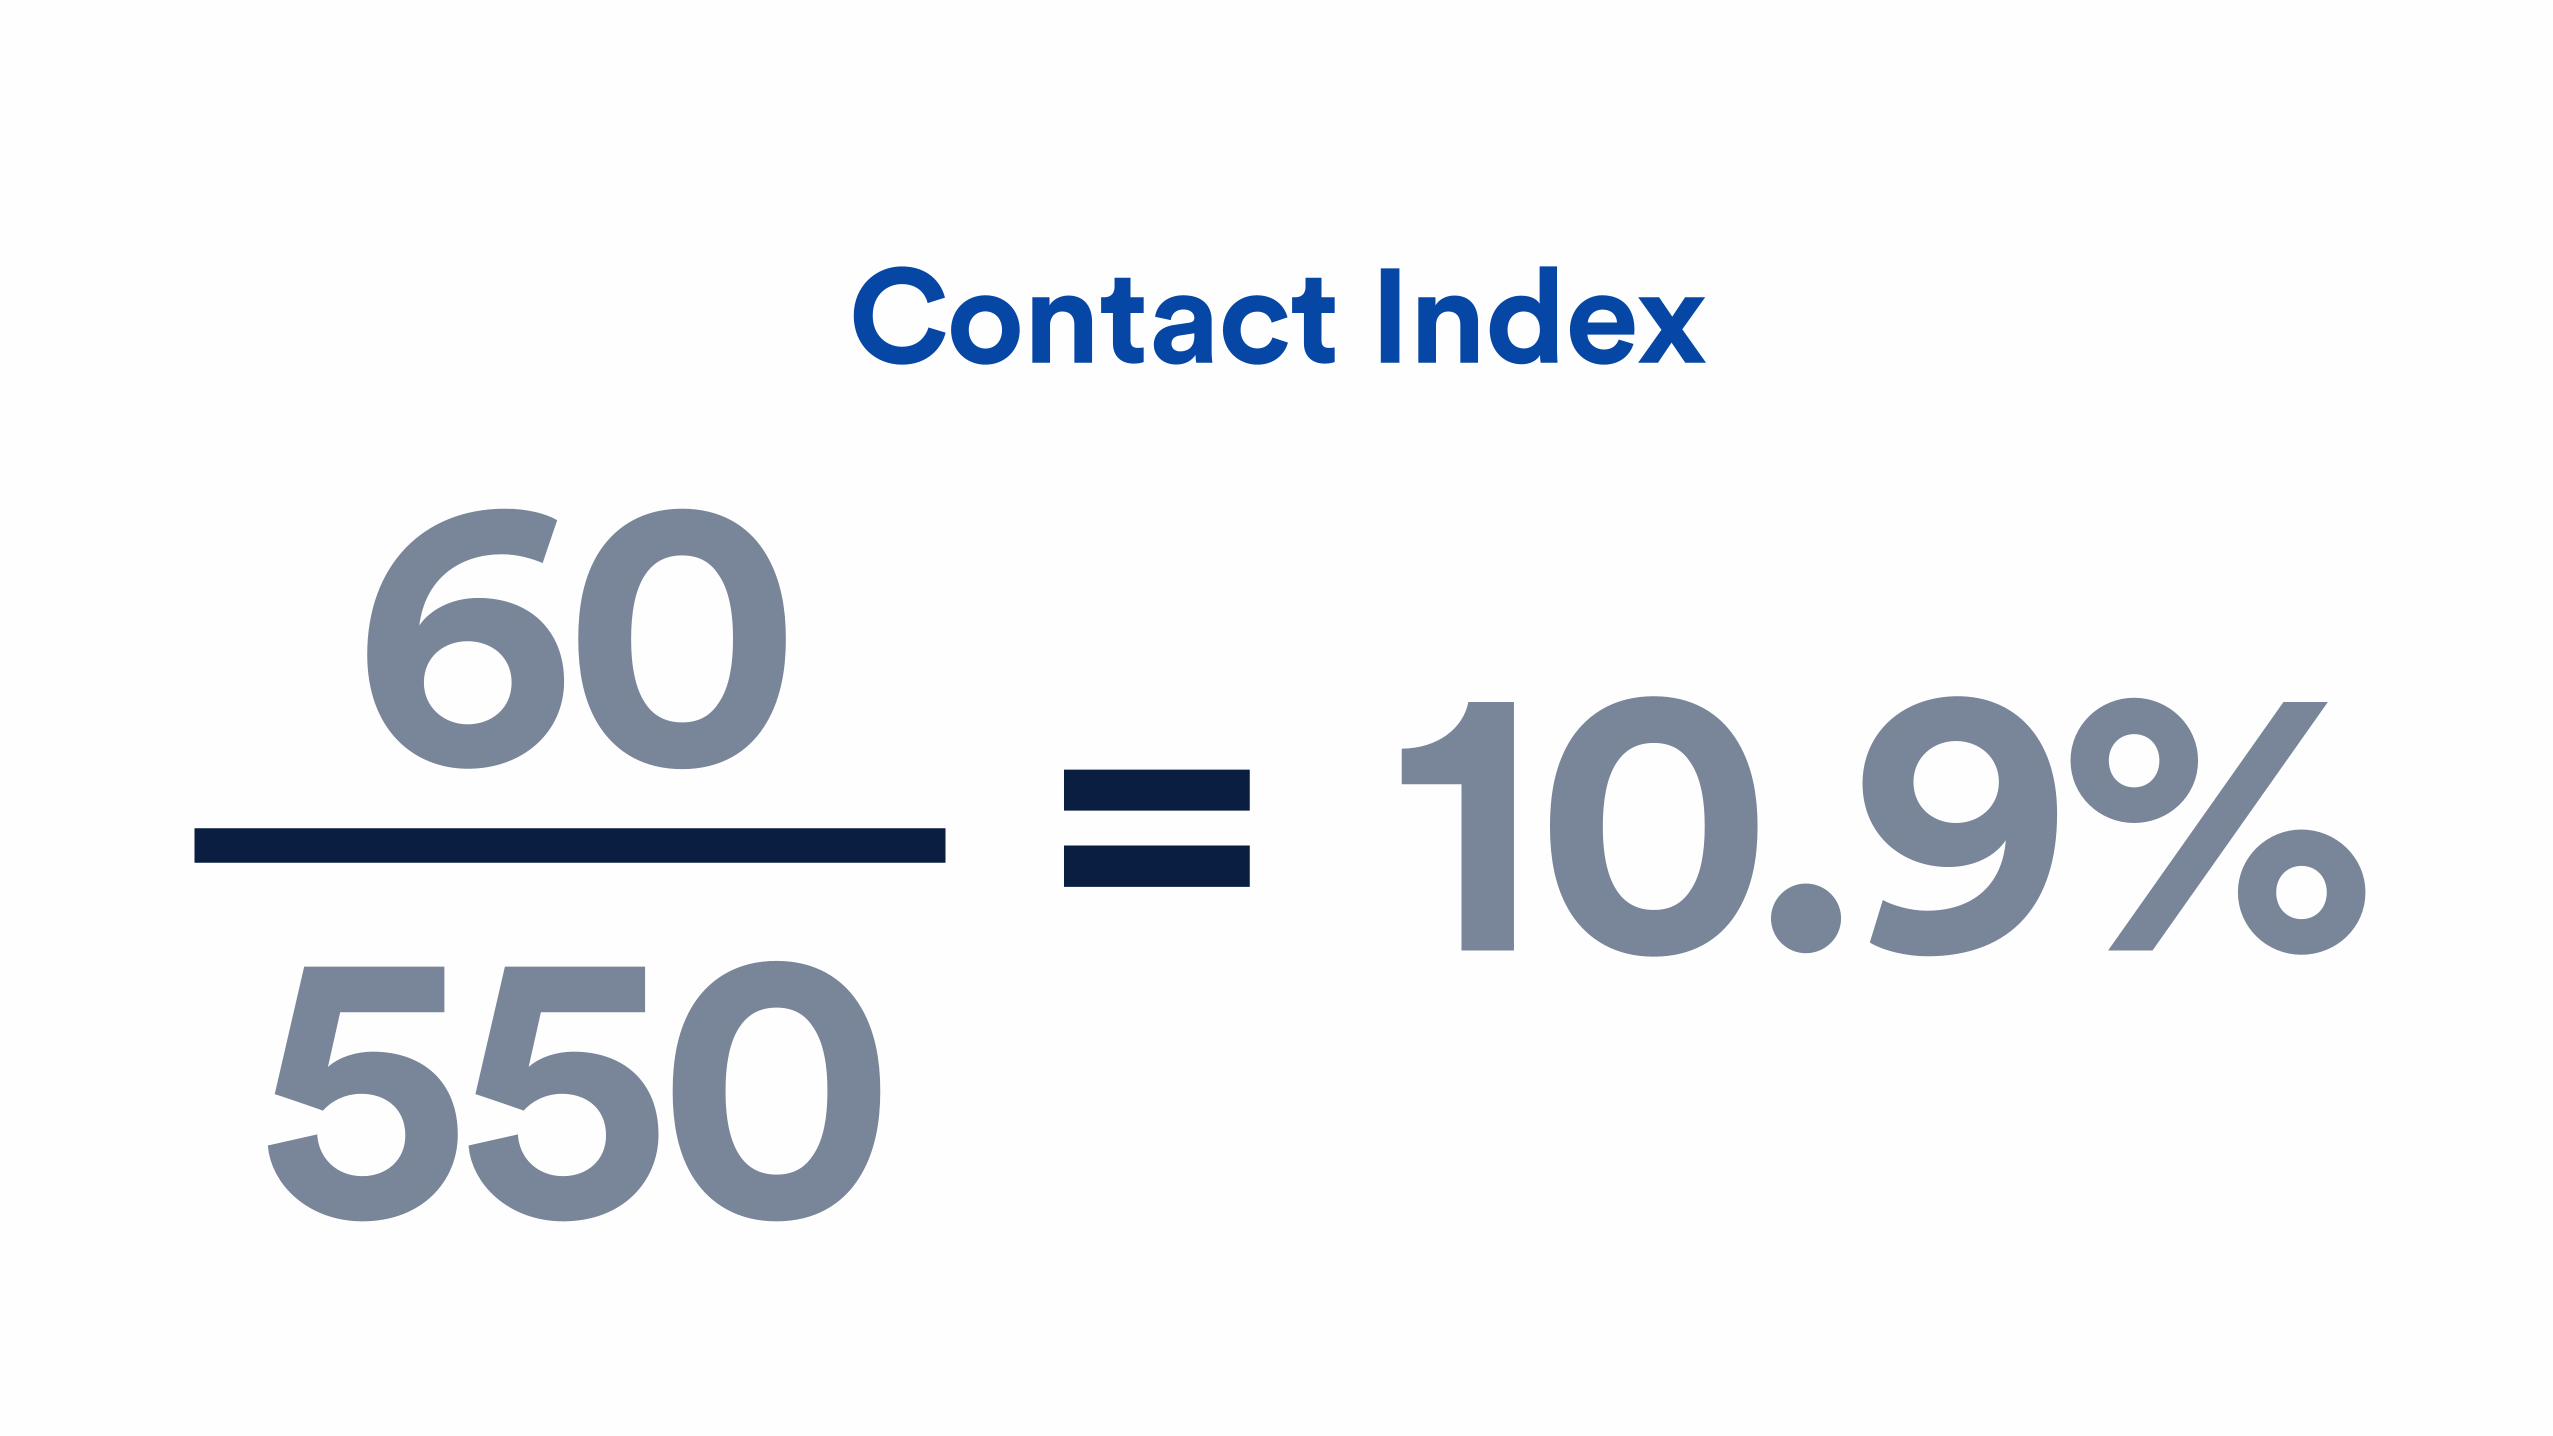
Contact Index
60550
10.9%=
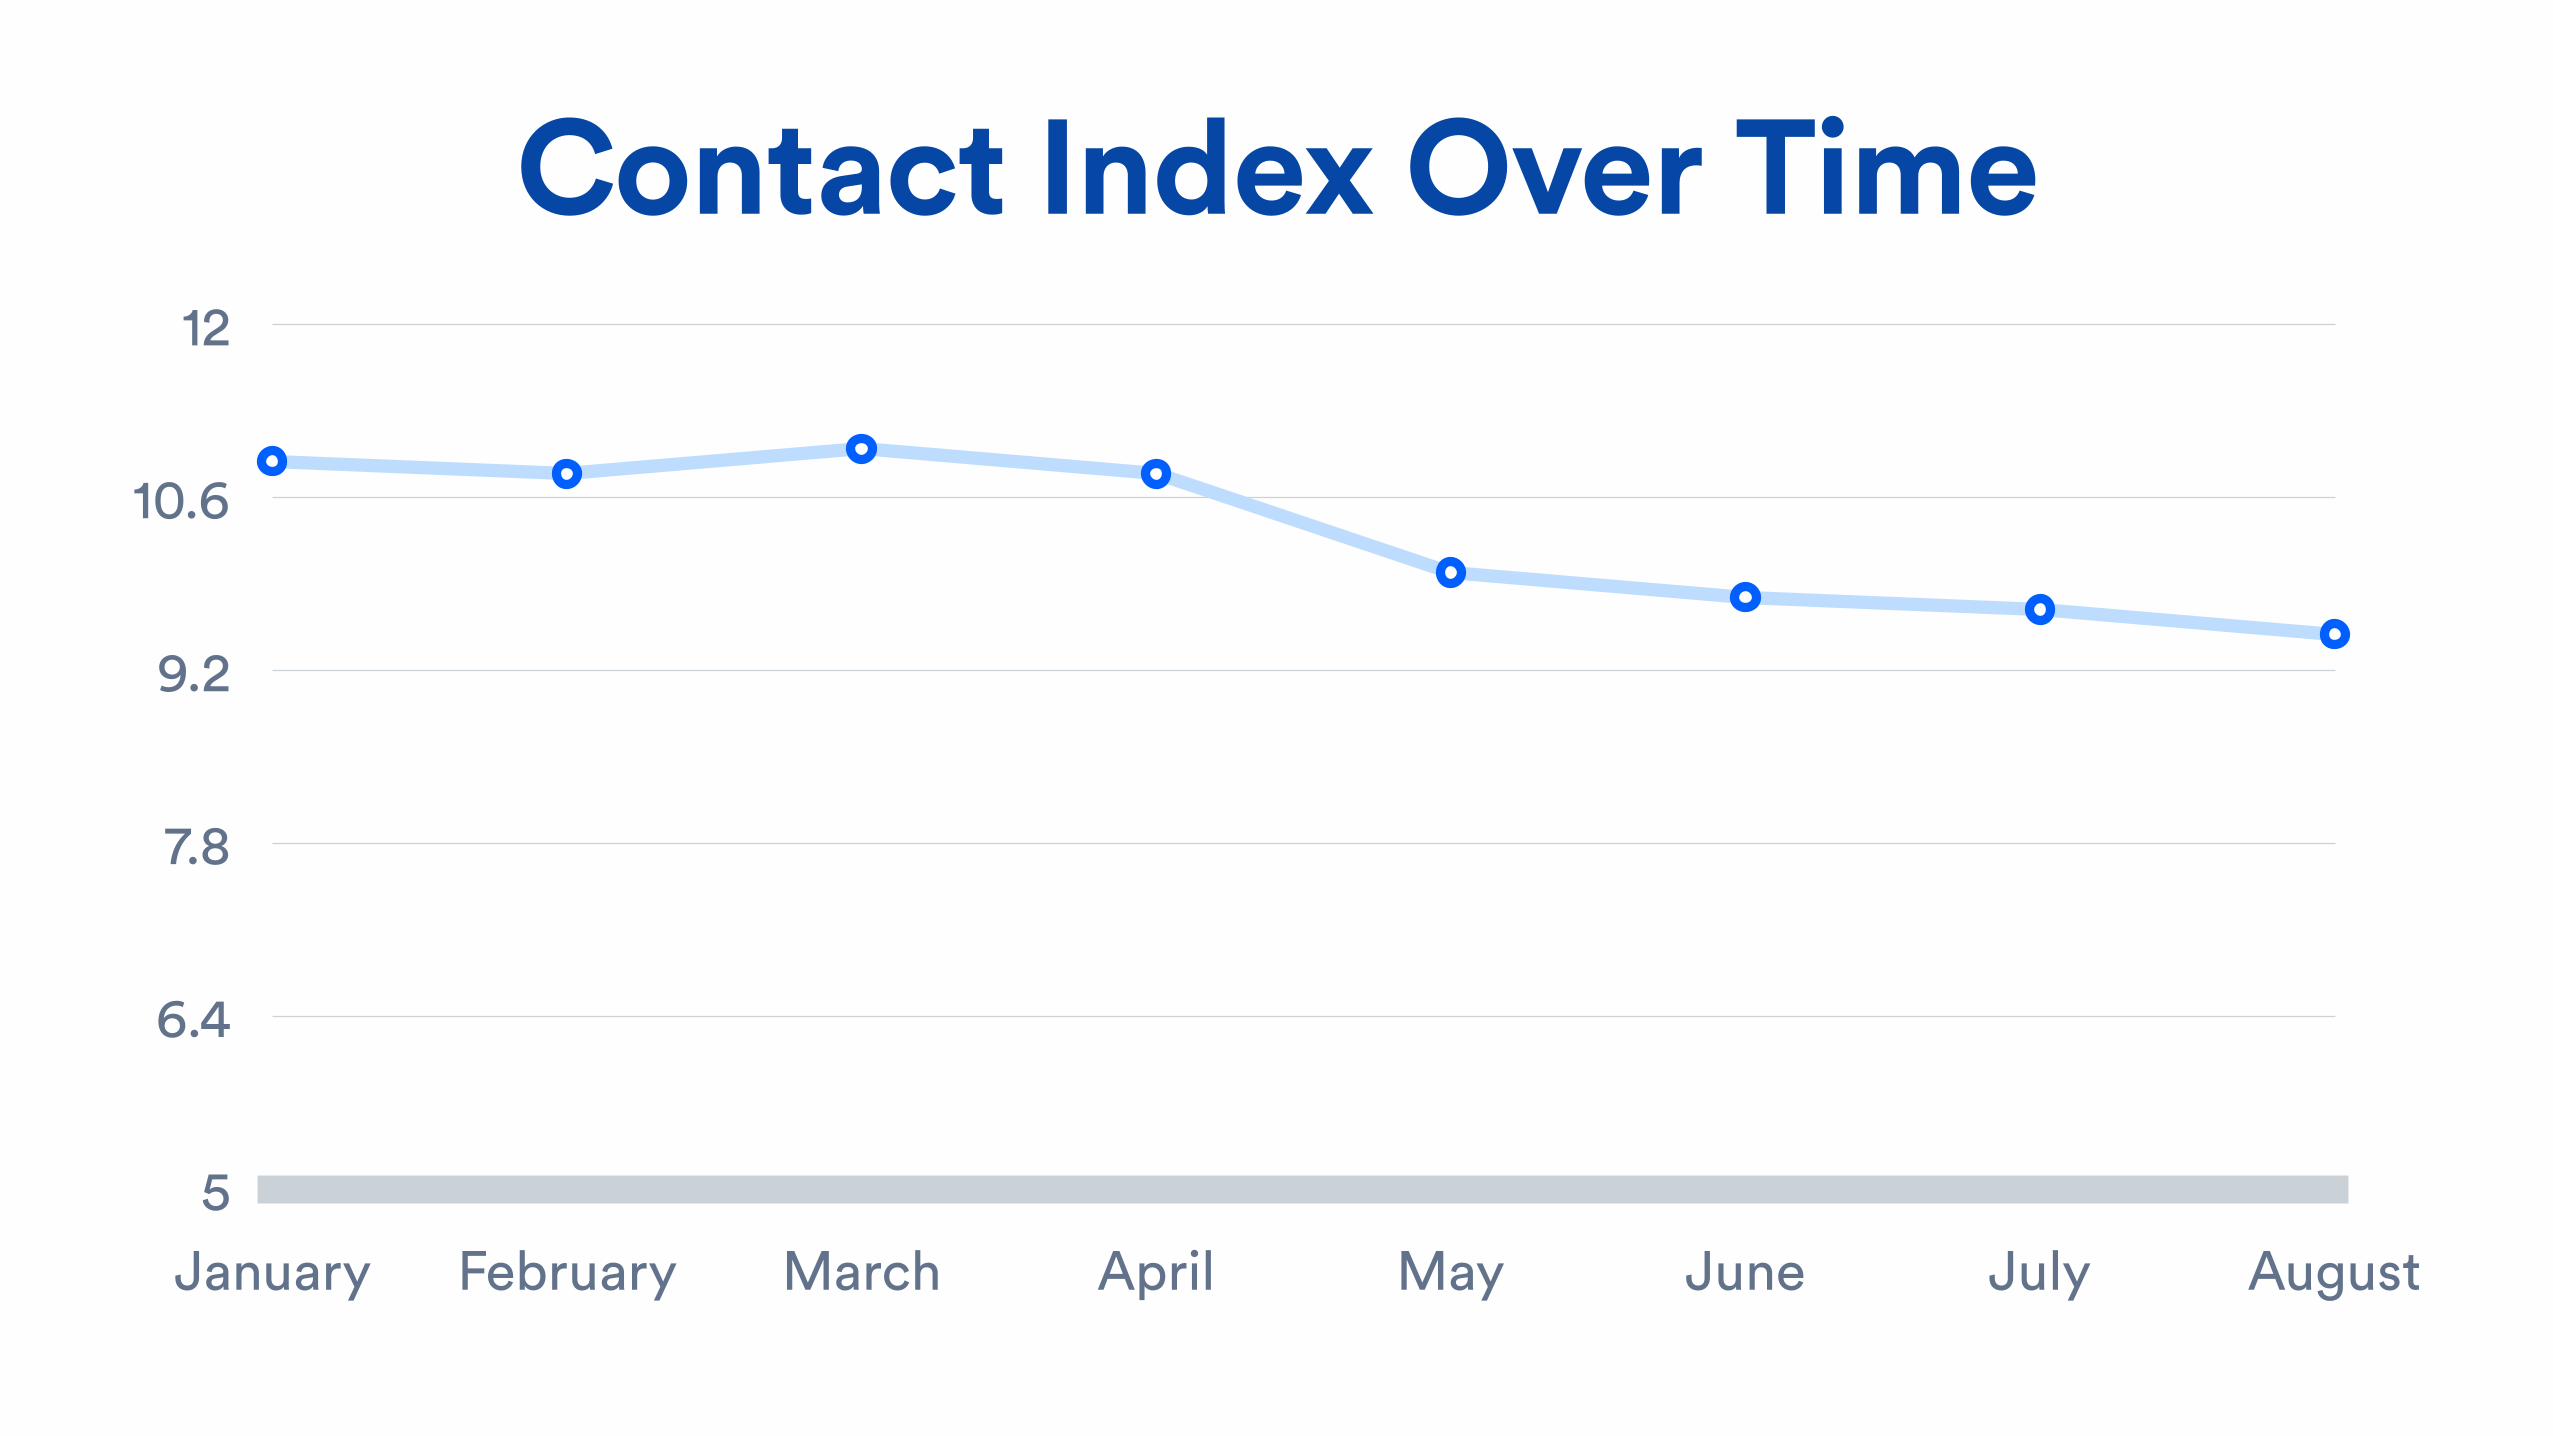
Contact Index Over Time
5
6.4
7.8
9.2
10.6
12
January February March April May June July August

Things to Consider:
Actionable You can tell what has caused customer pain to go up
Representative When the number goes up customer pain goes up
Trackable Easy to see current status when needed
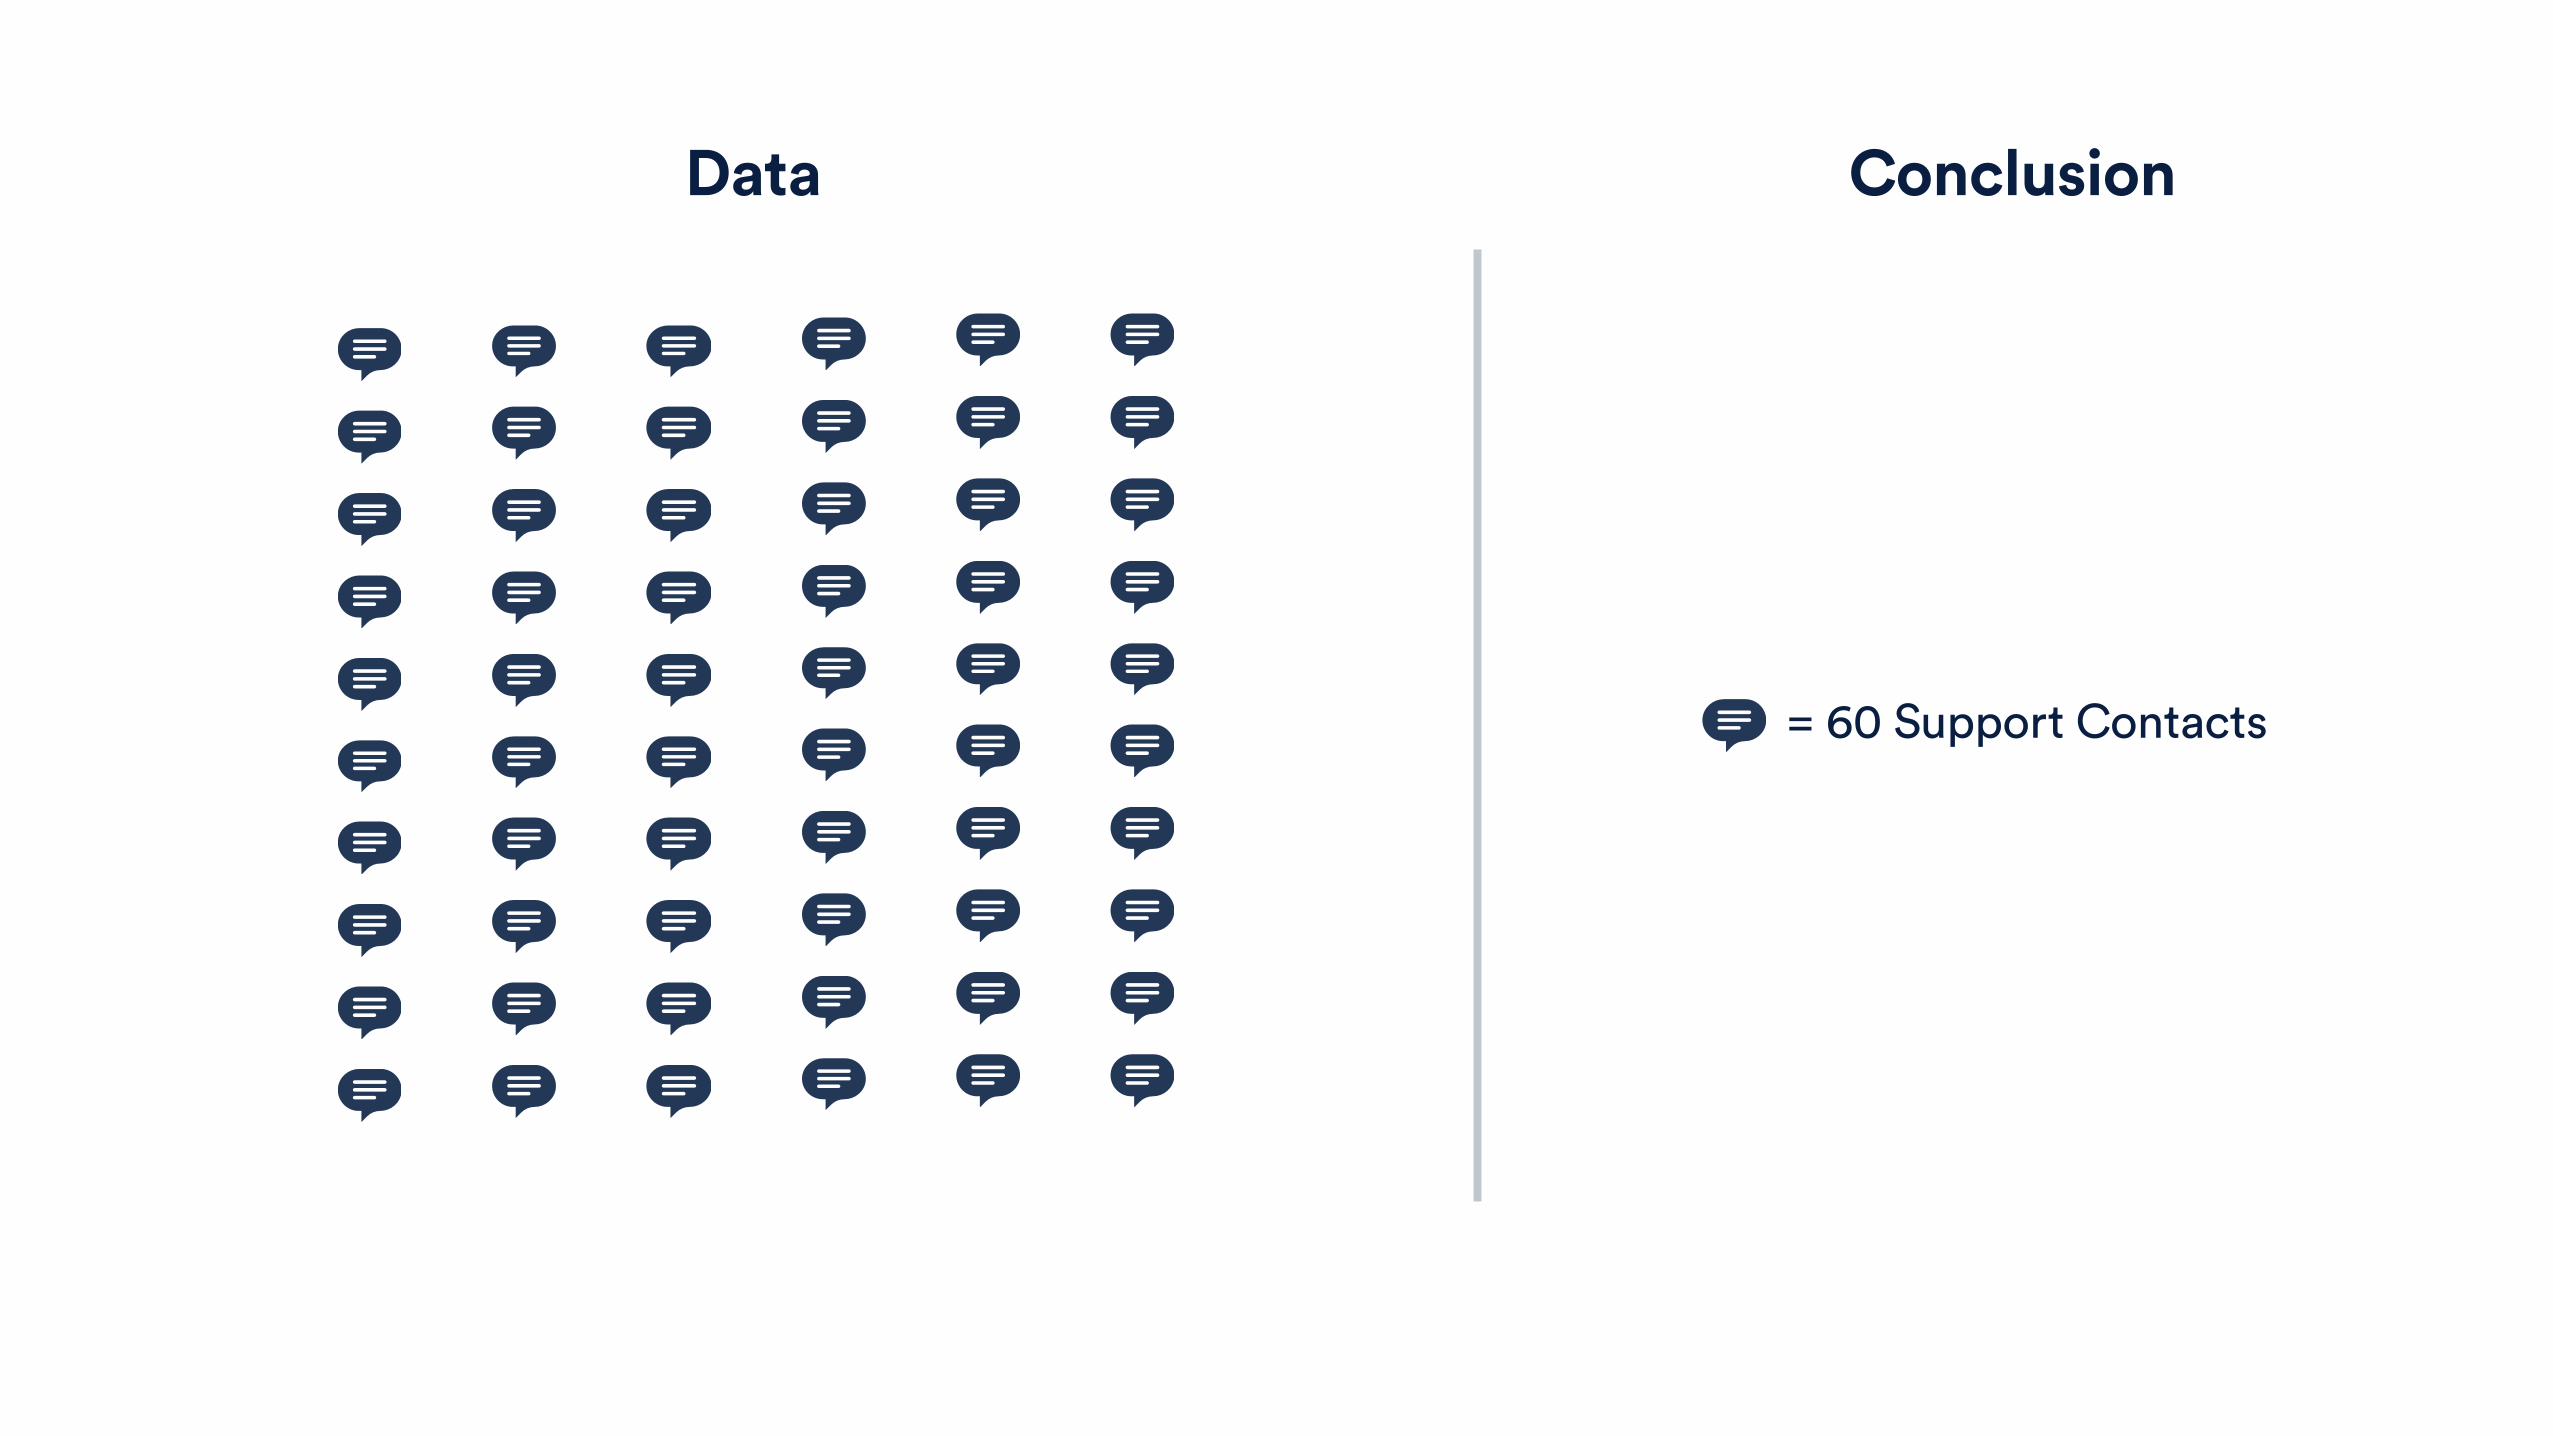
= 60 Support Contacts
Data Conclusion
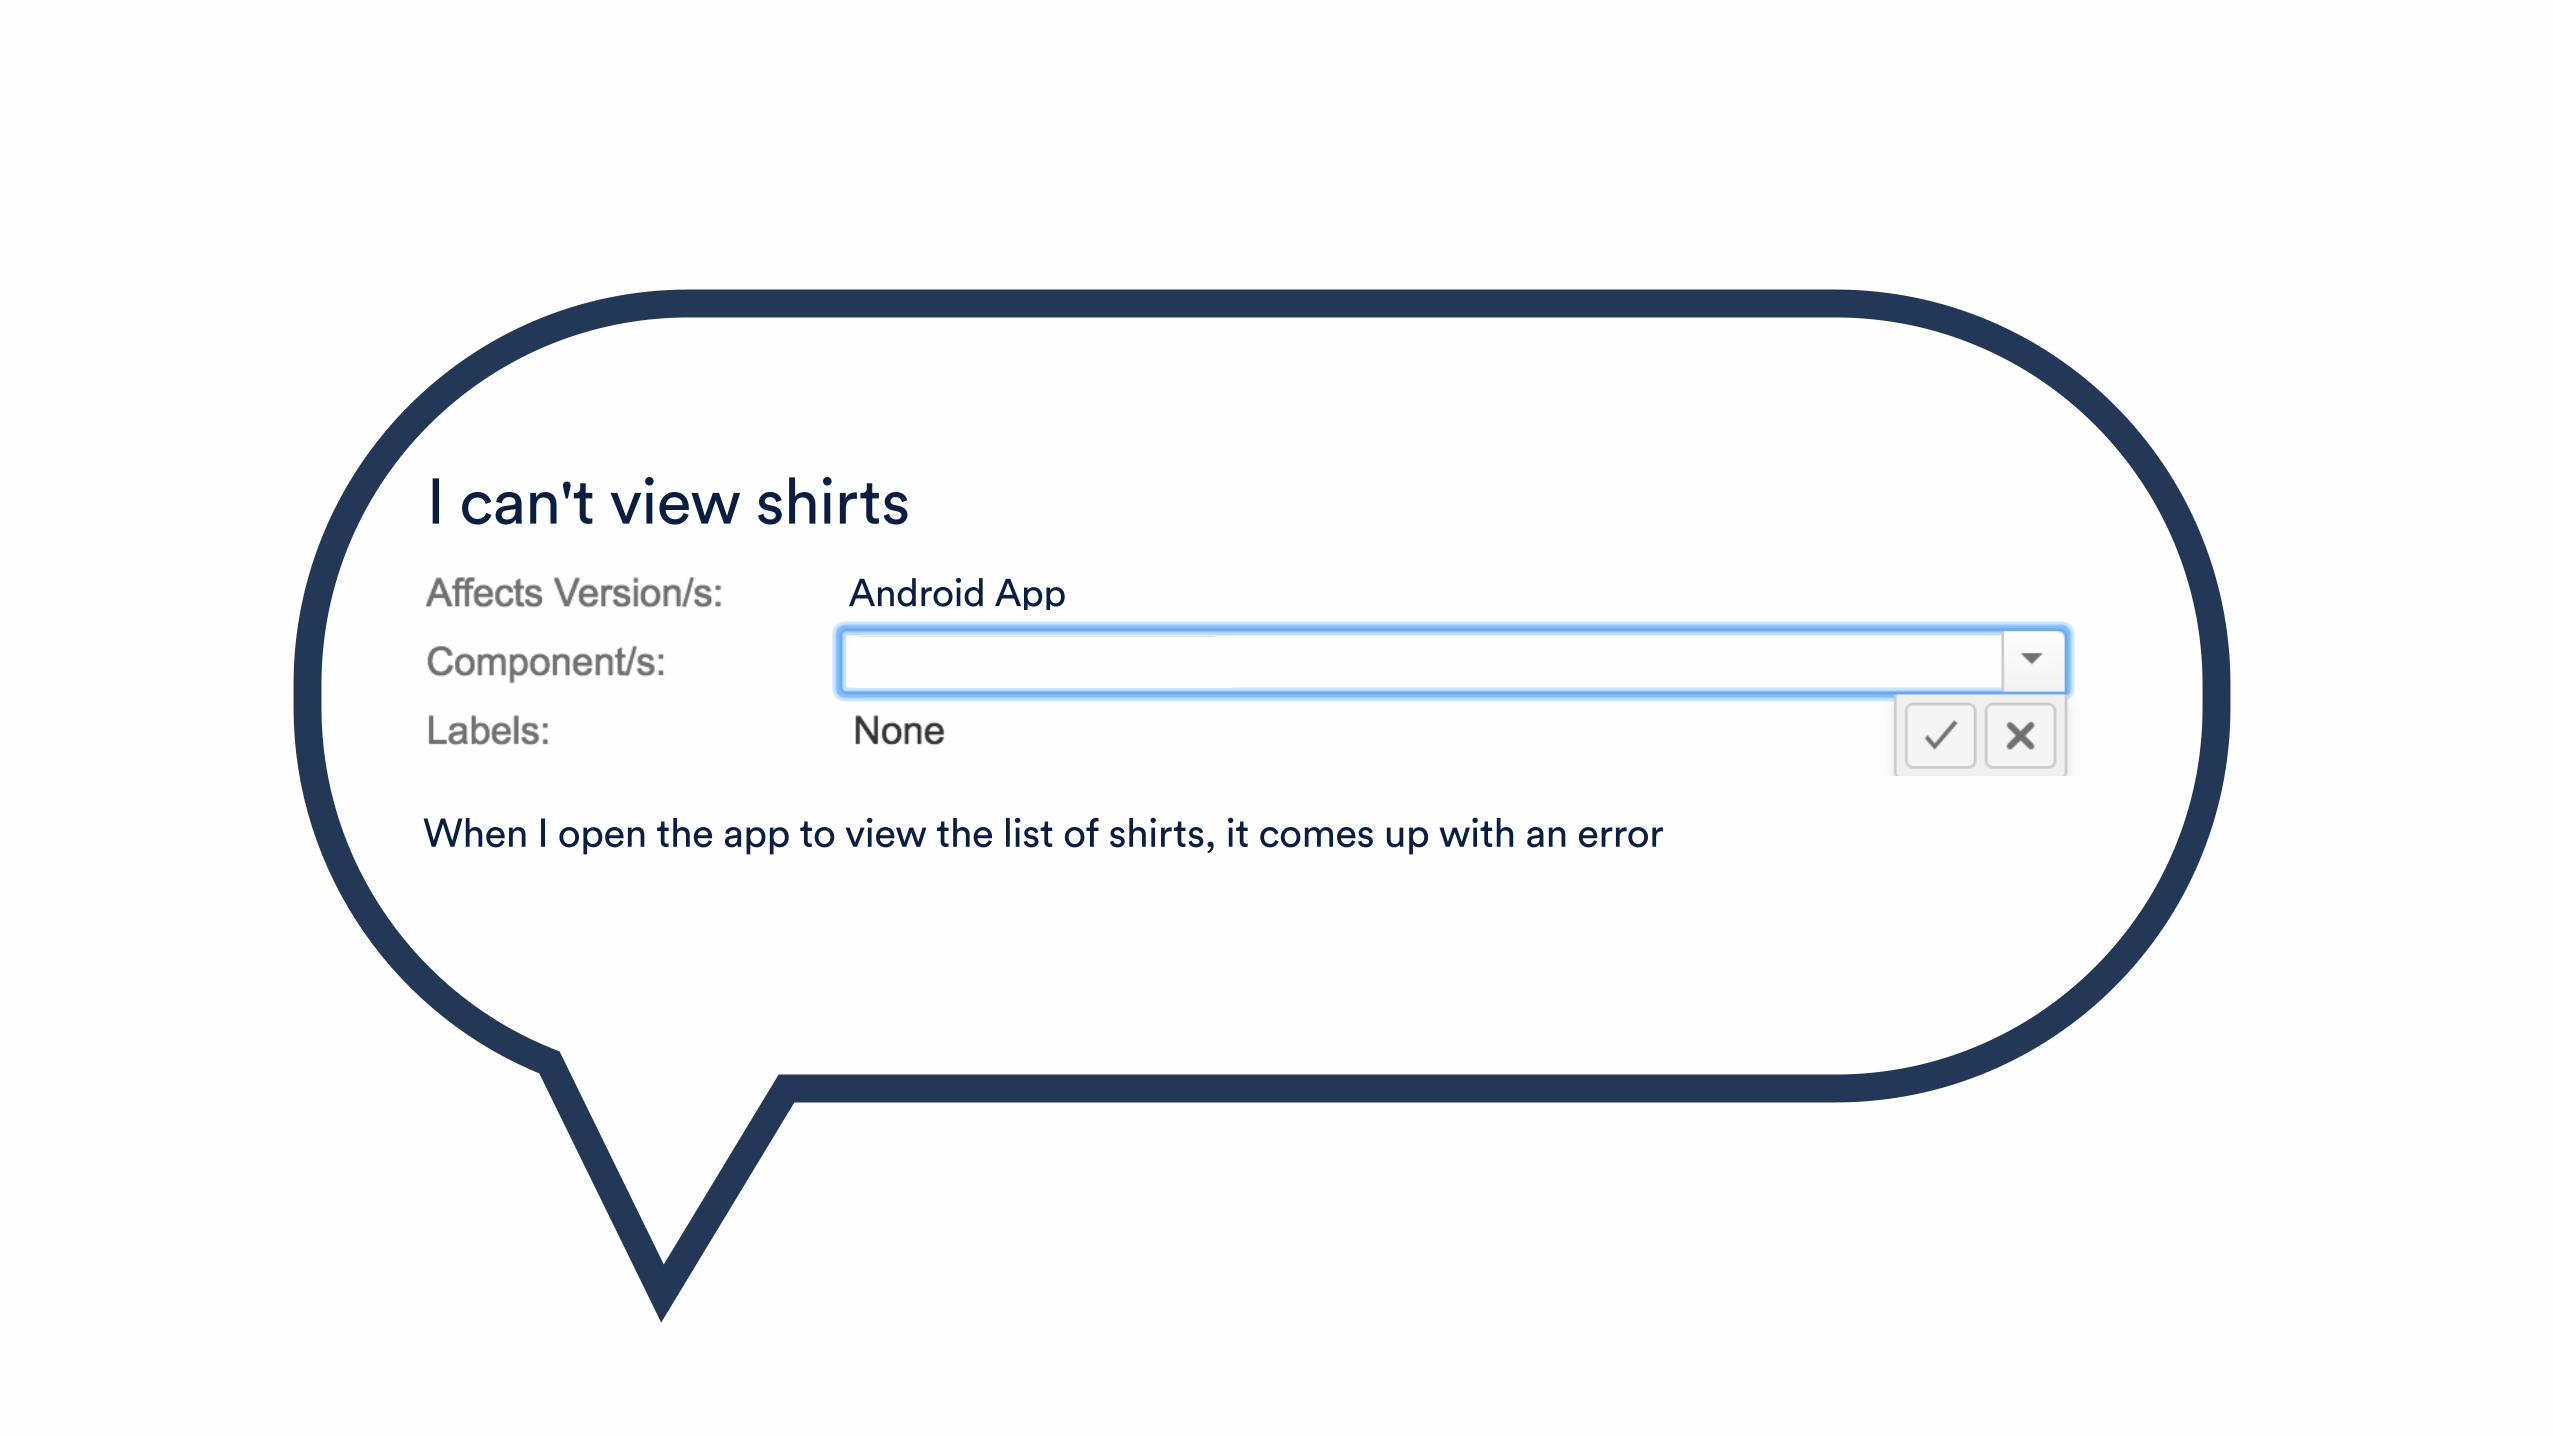
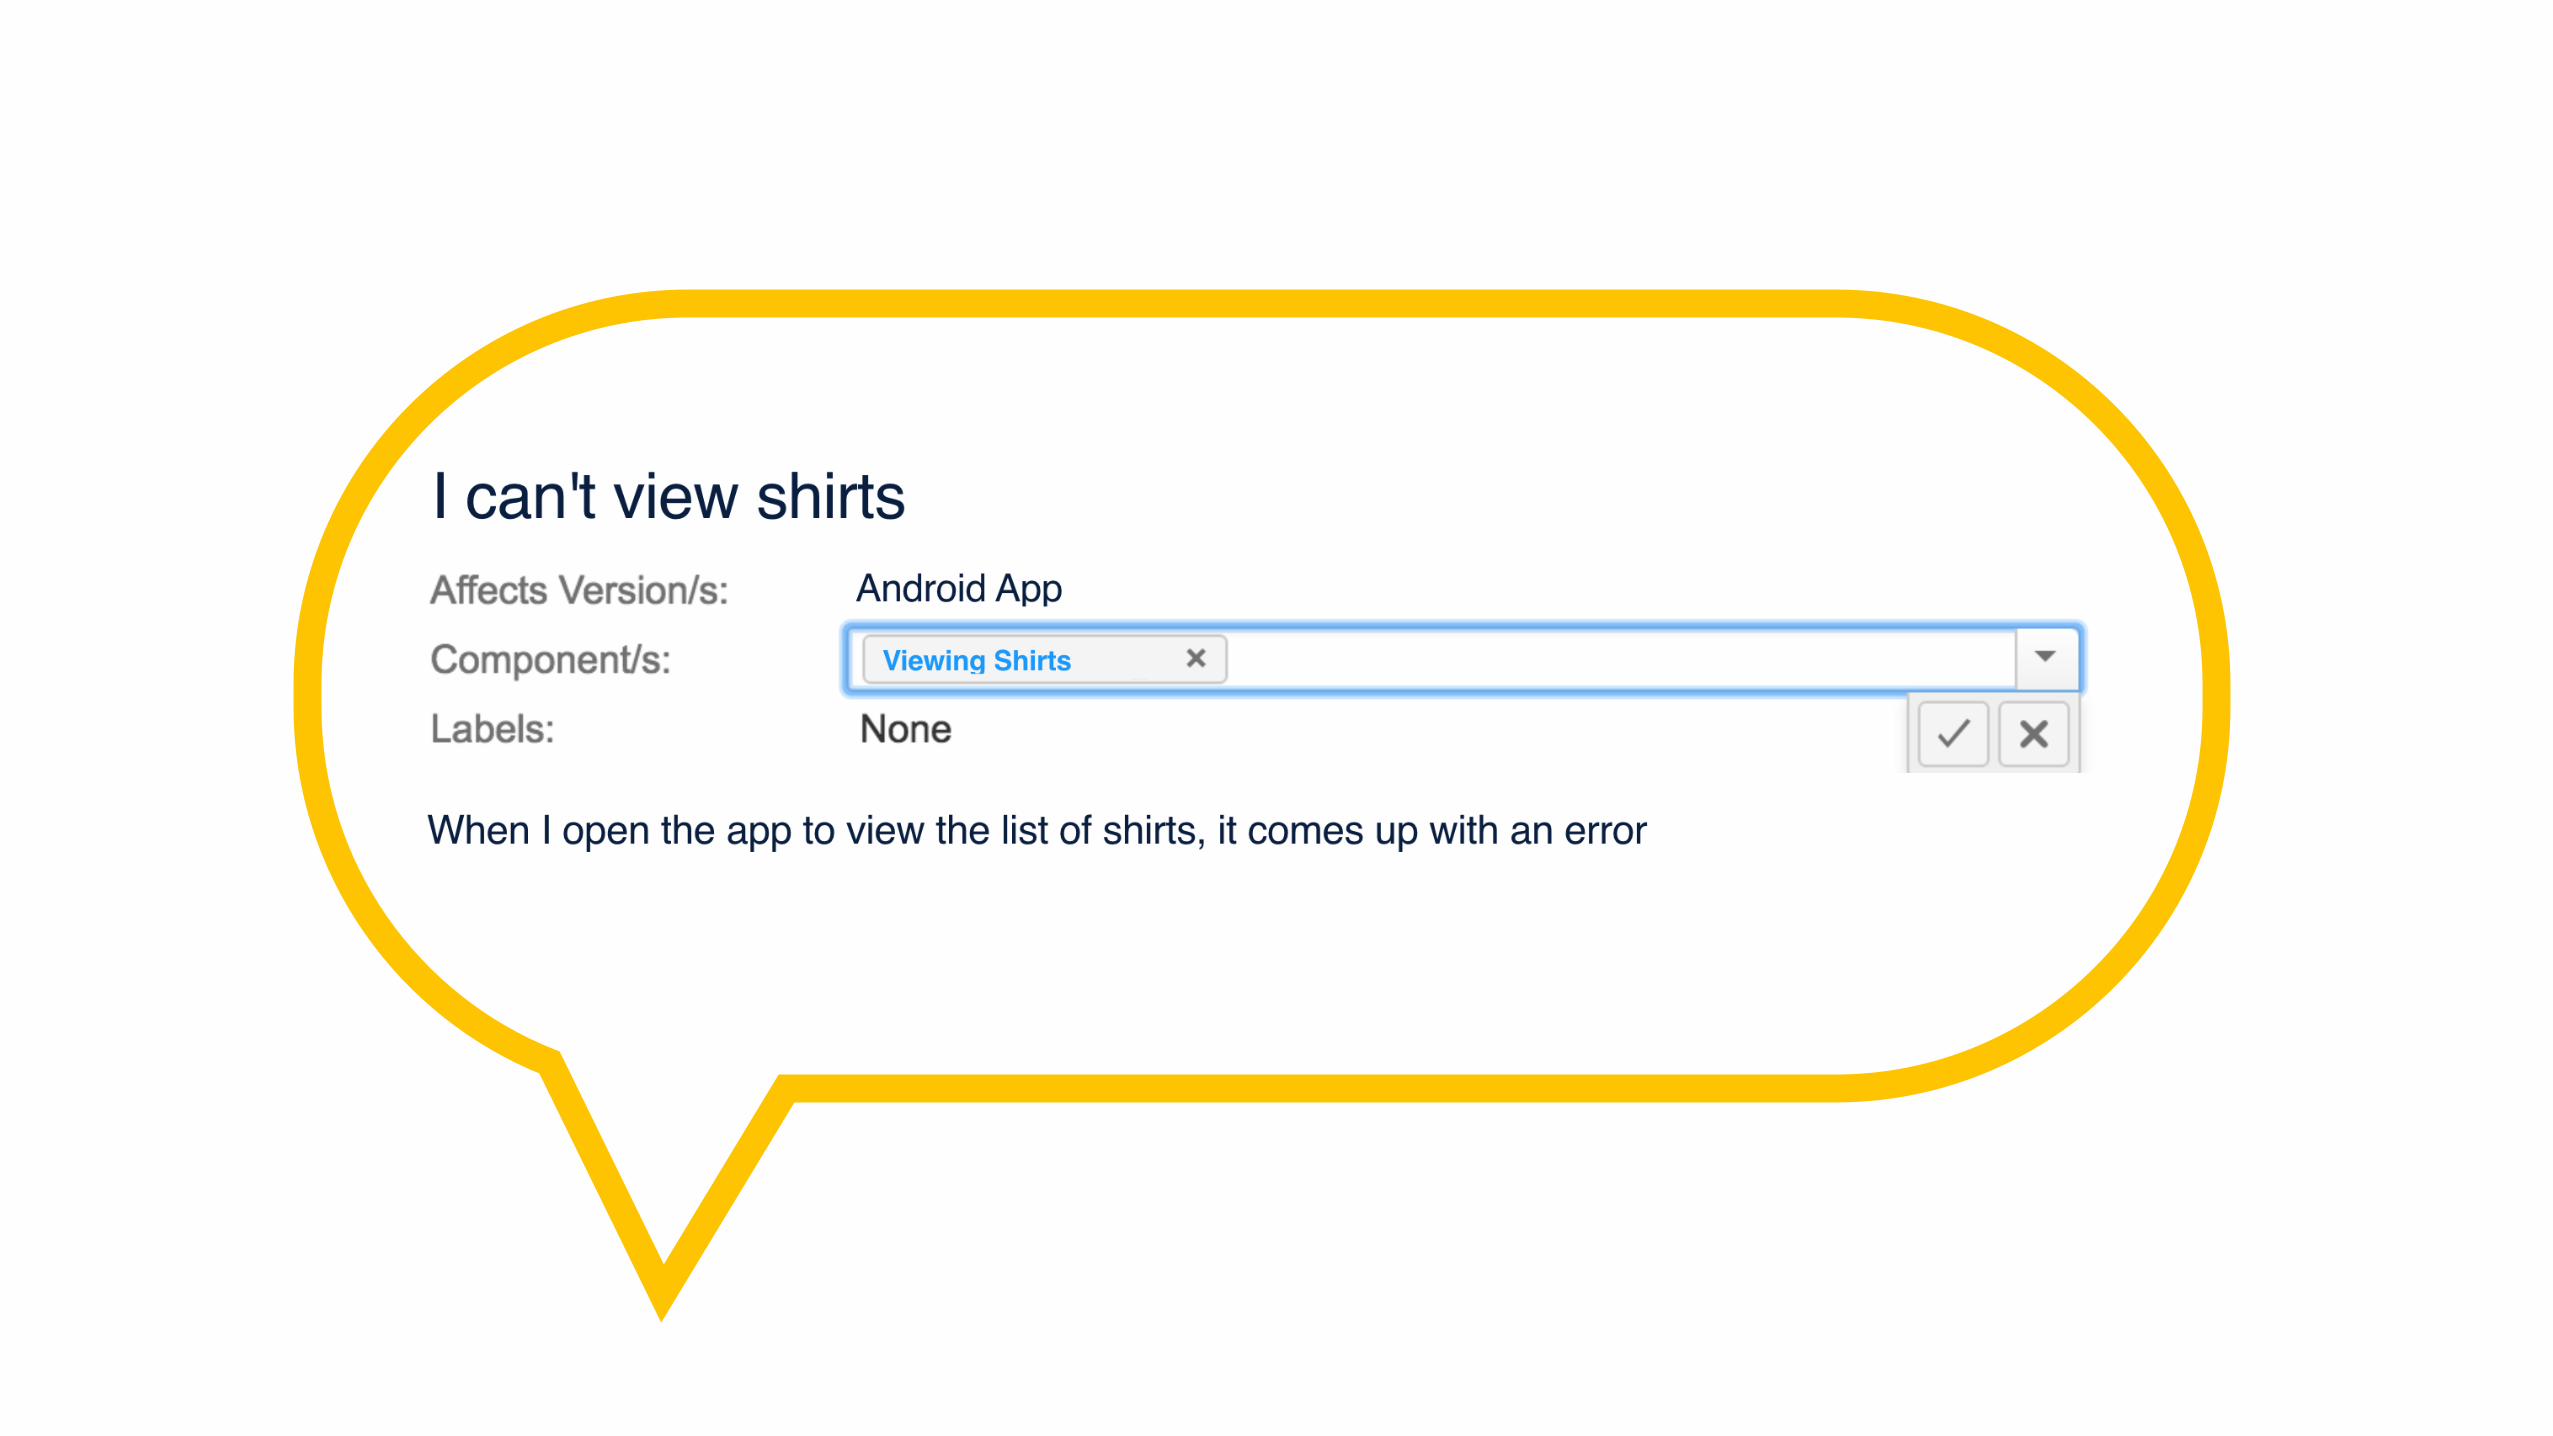
Android App
I can't view shirts
When I open the app to view the list of shirts, it comes up with an error
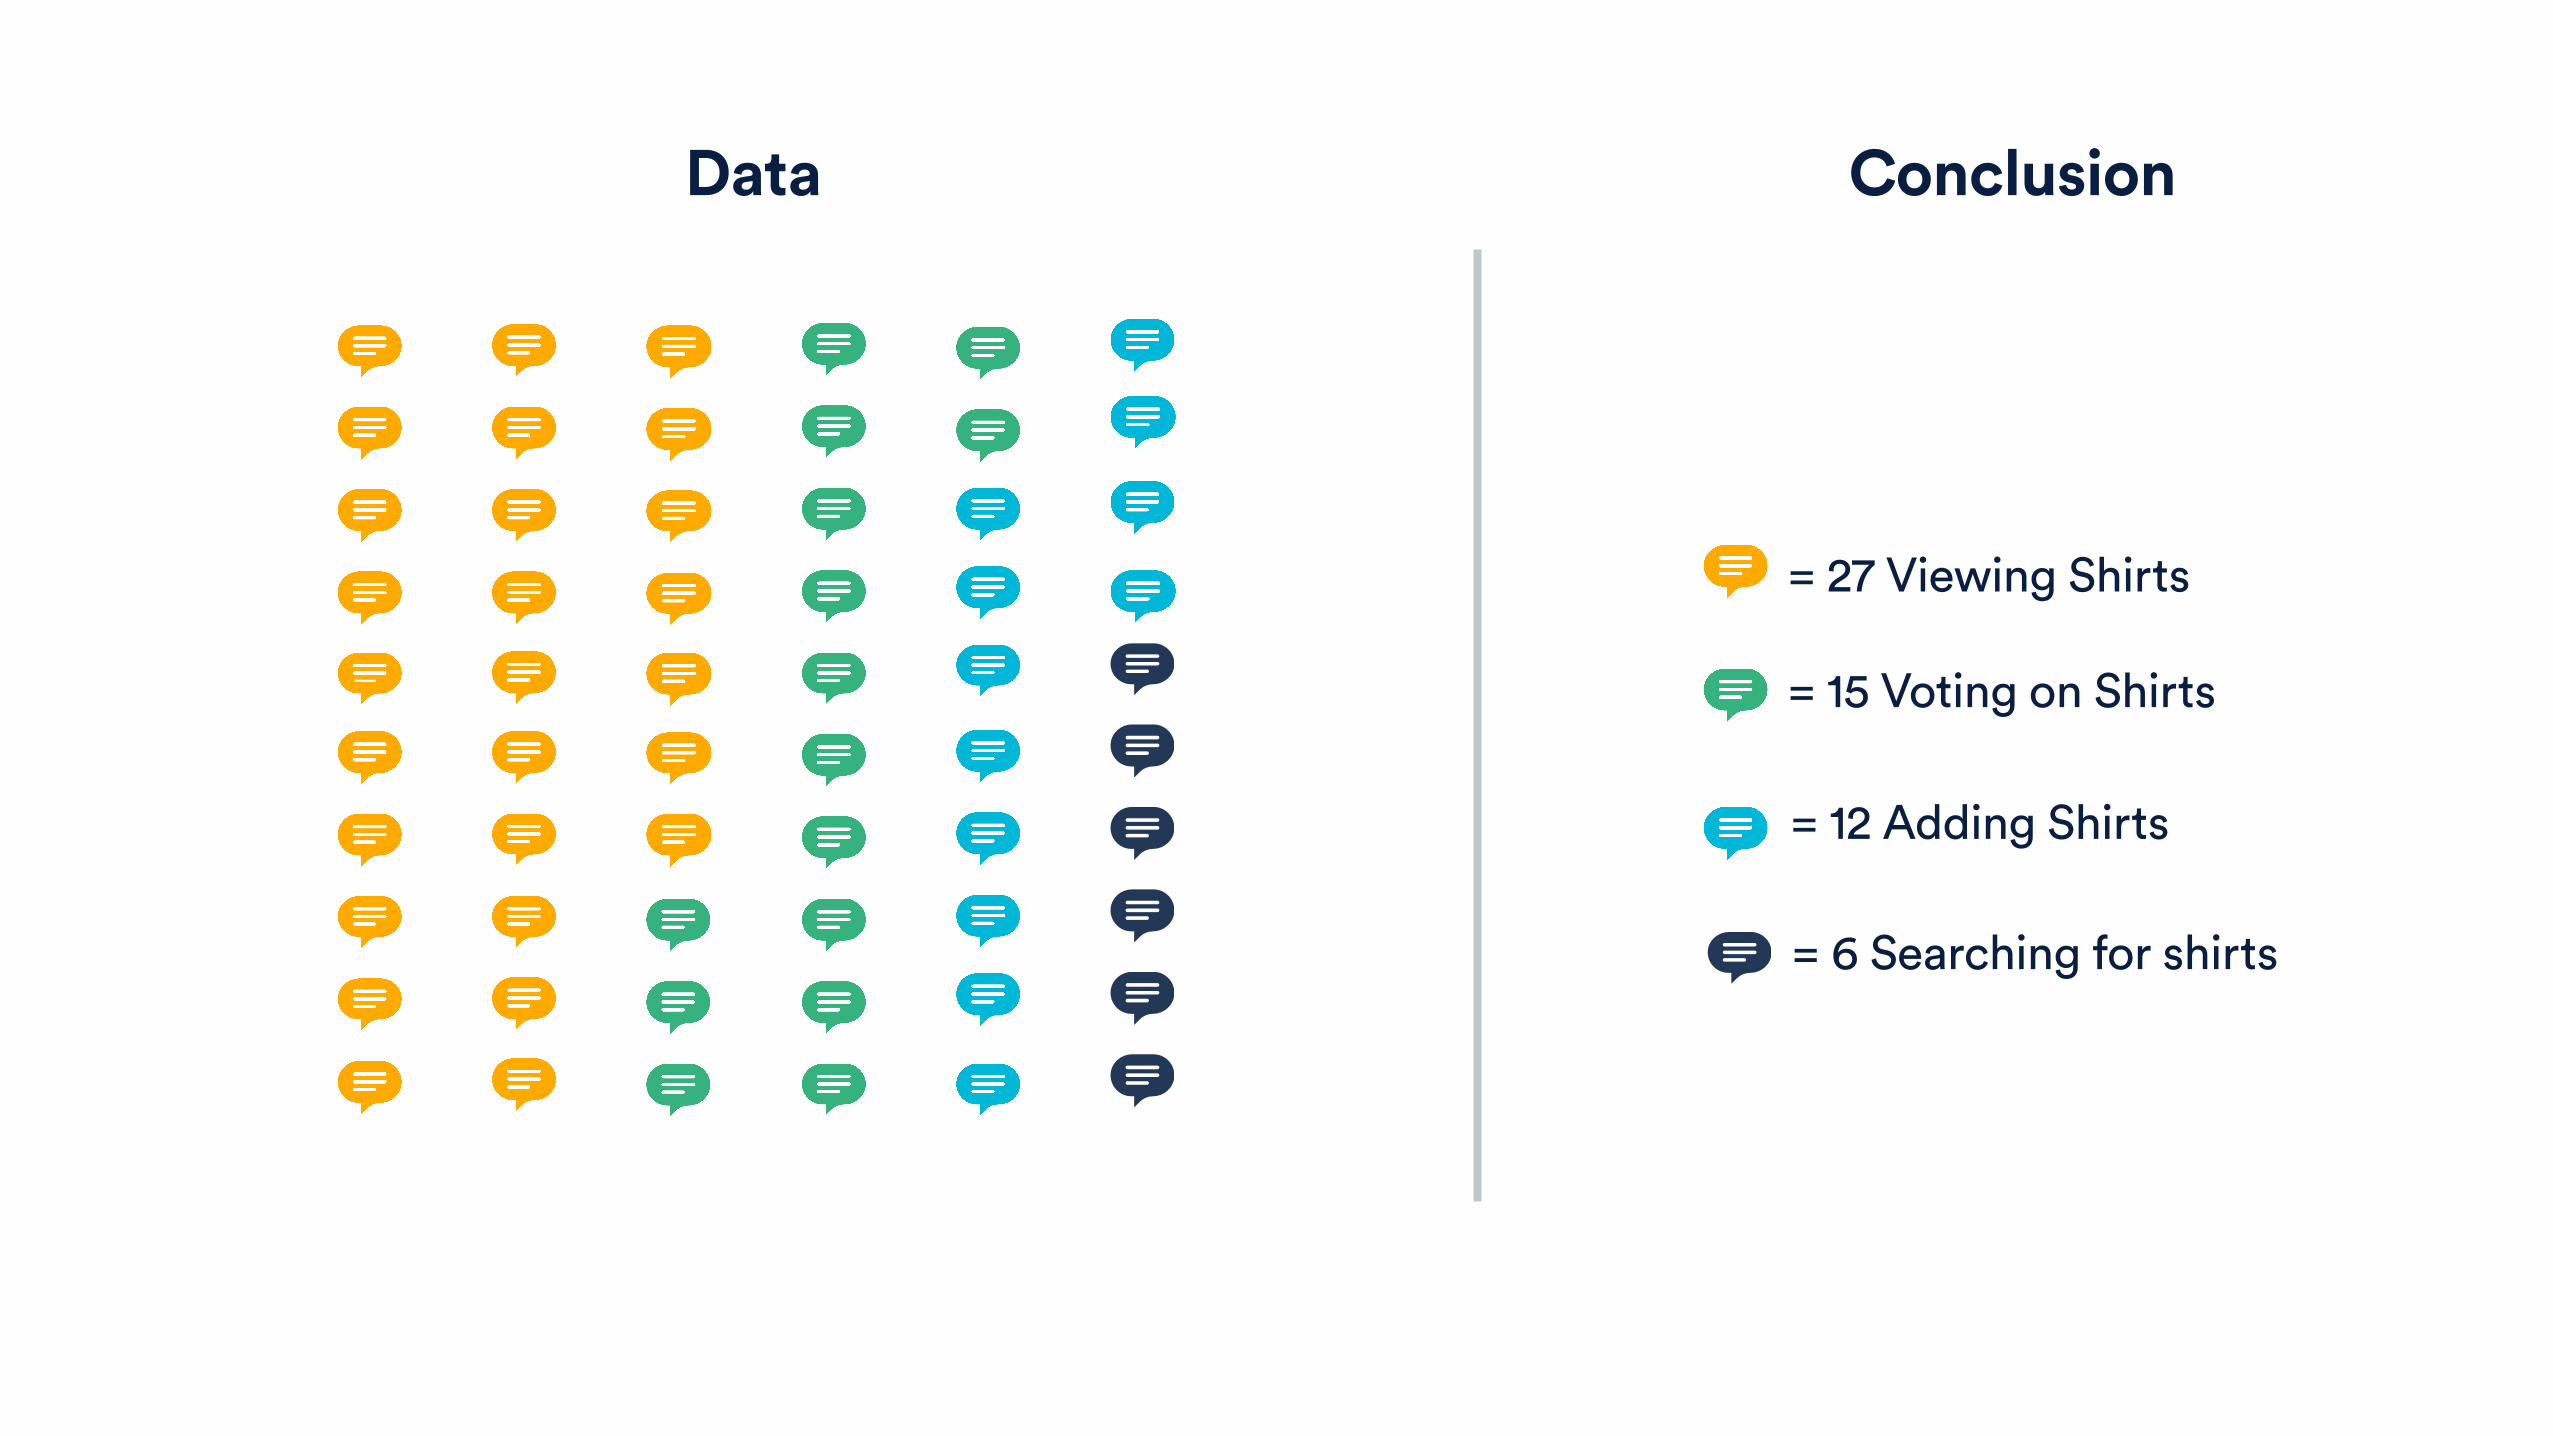
= 15 Voting on Shirts
Data Conclusion
= 27 Viewing Shirts
= 12 Adding Shirts
= 6 Searching for shirts
Things to Consider:
Actionable You can tell what has caused customer pain to go up
Representative When the number goes up customer pain goes up
Trackable Easy to see current status when needed

AgendaReporting
Insights
Prediction
The Problem
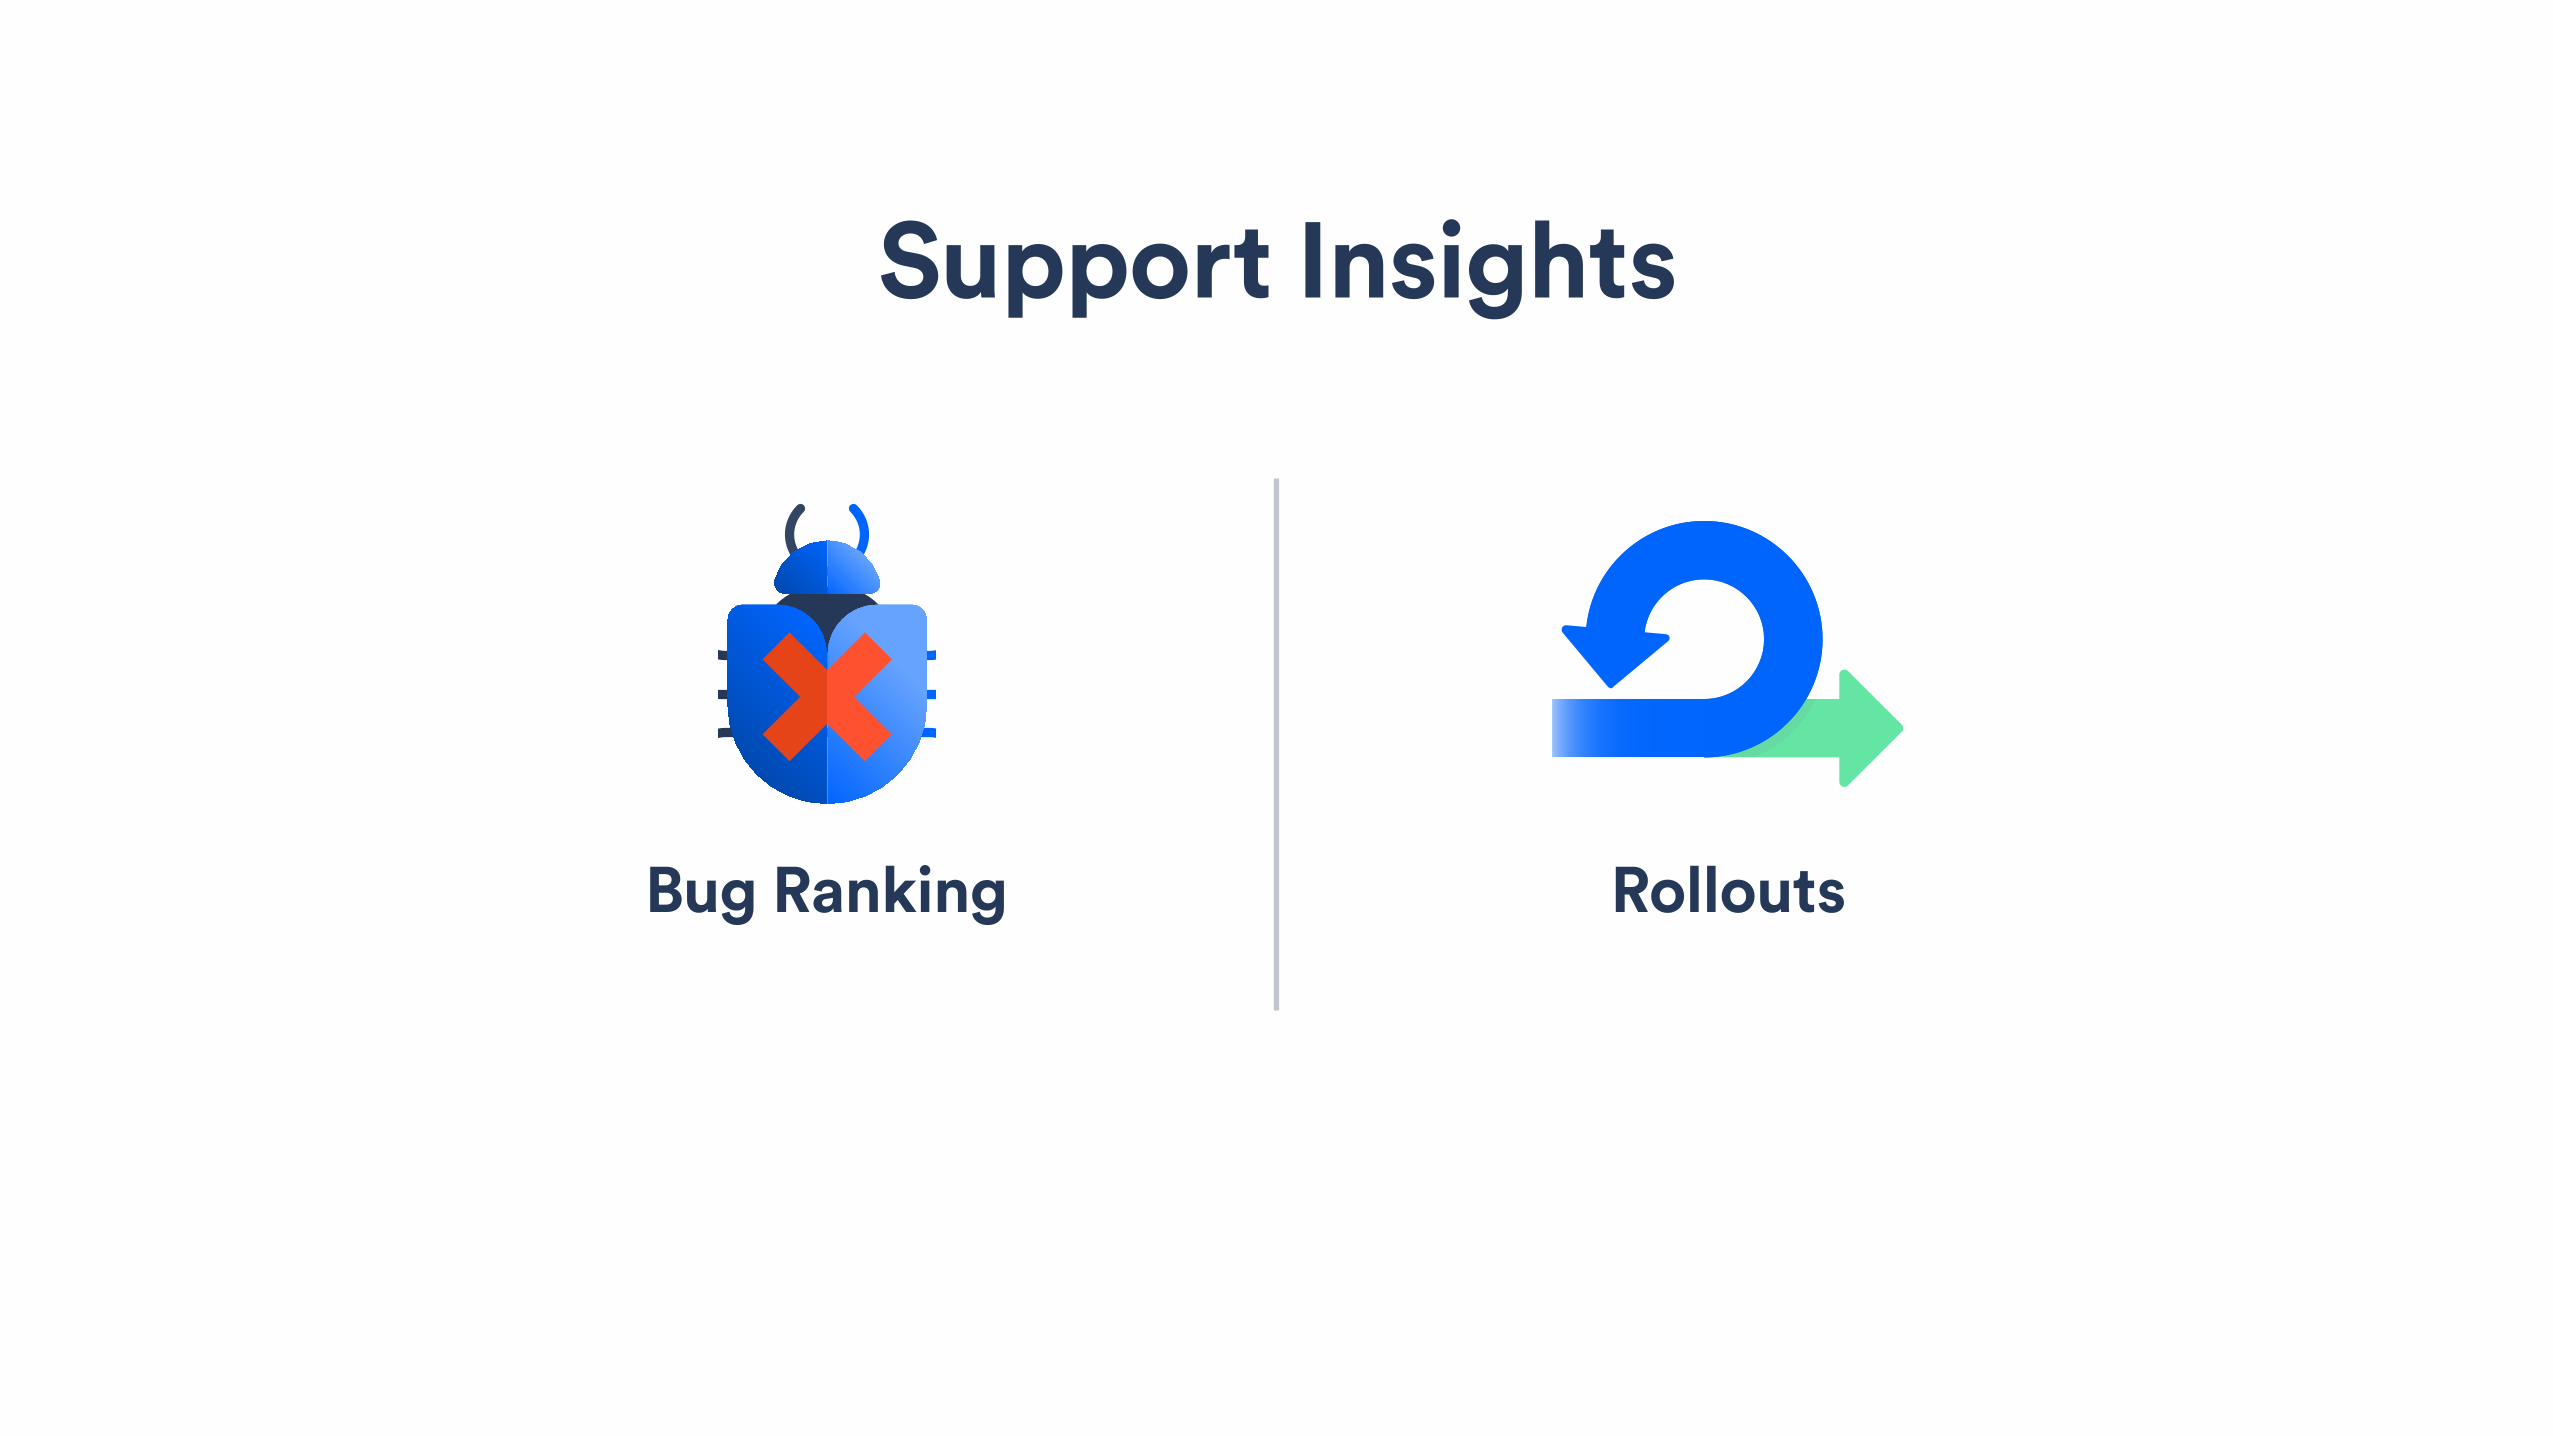
TURNING DATA INTO INSIGHTS
Service Enablement has built a partnership with development through turning data into insights.

Bug Ranking Rollouts
Support Insights
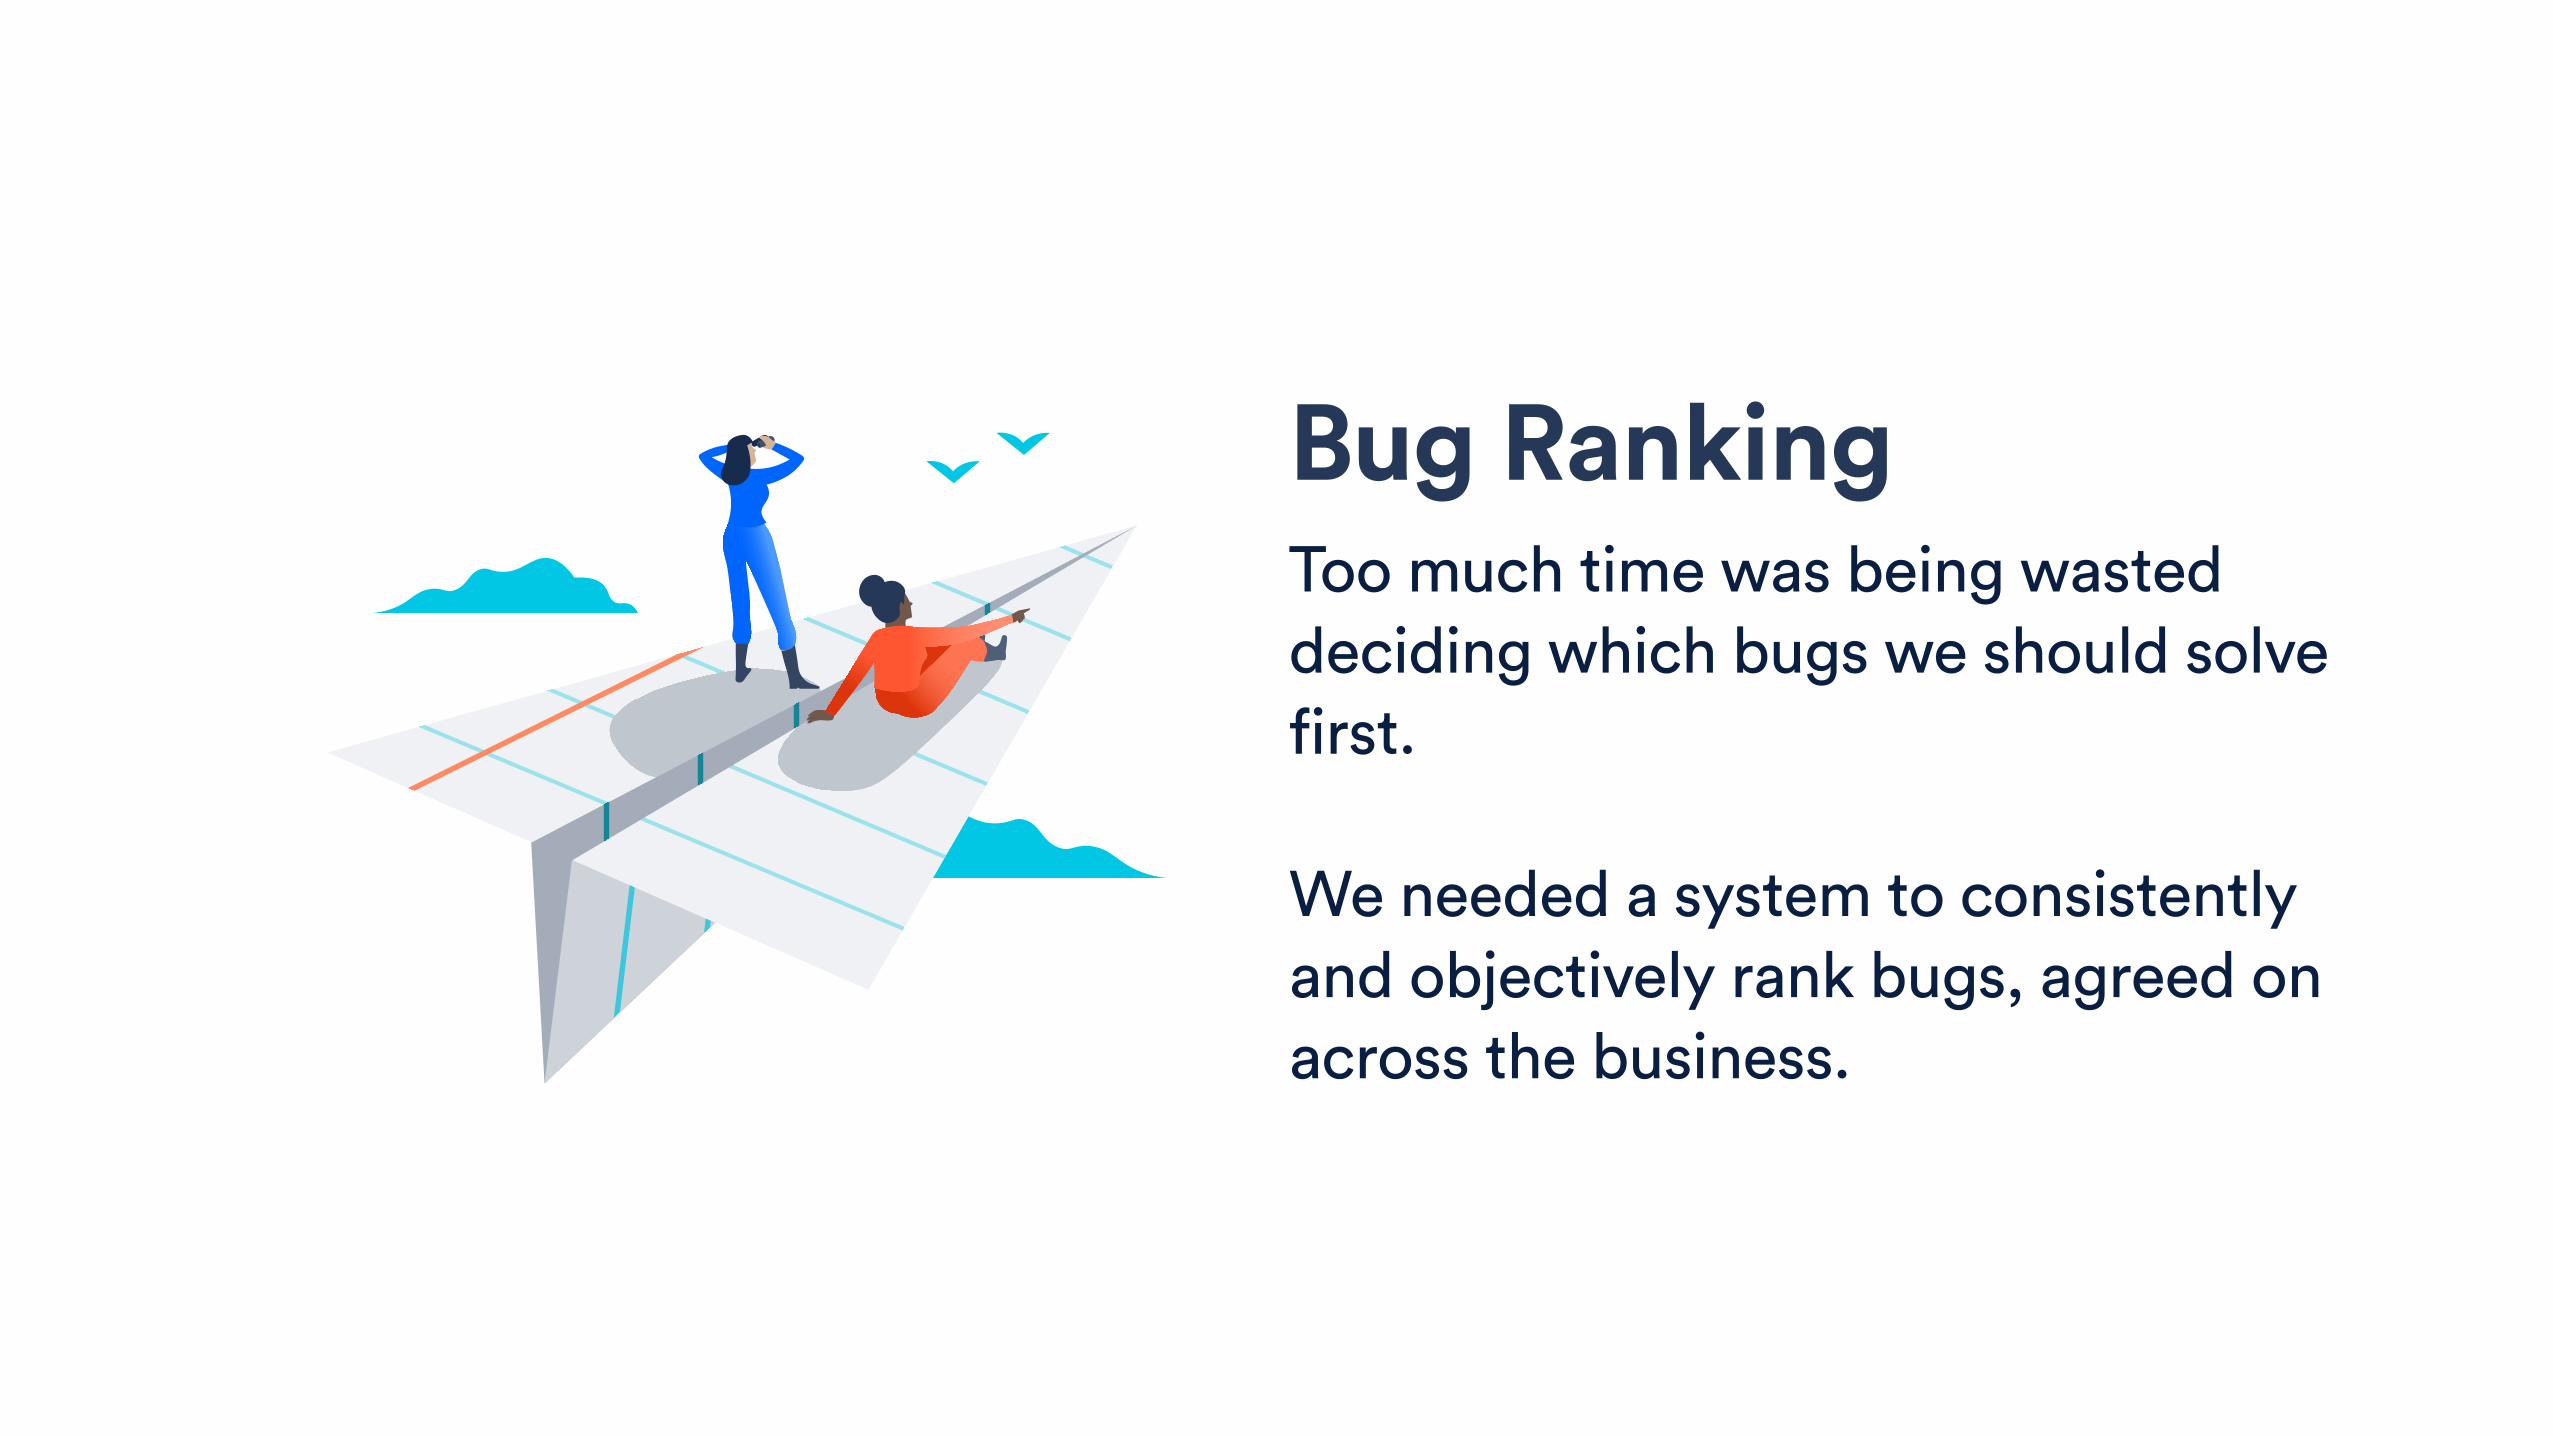
Bug Ranking Too much time was being wasted deciding which bugs we should solve first.
We needed a system to consistently and objectively rank bugs, agreed on across the business.
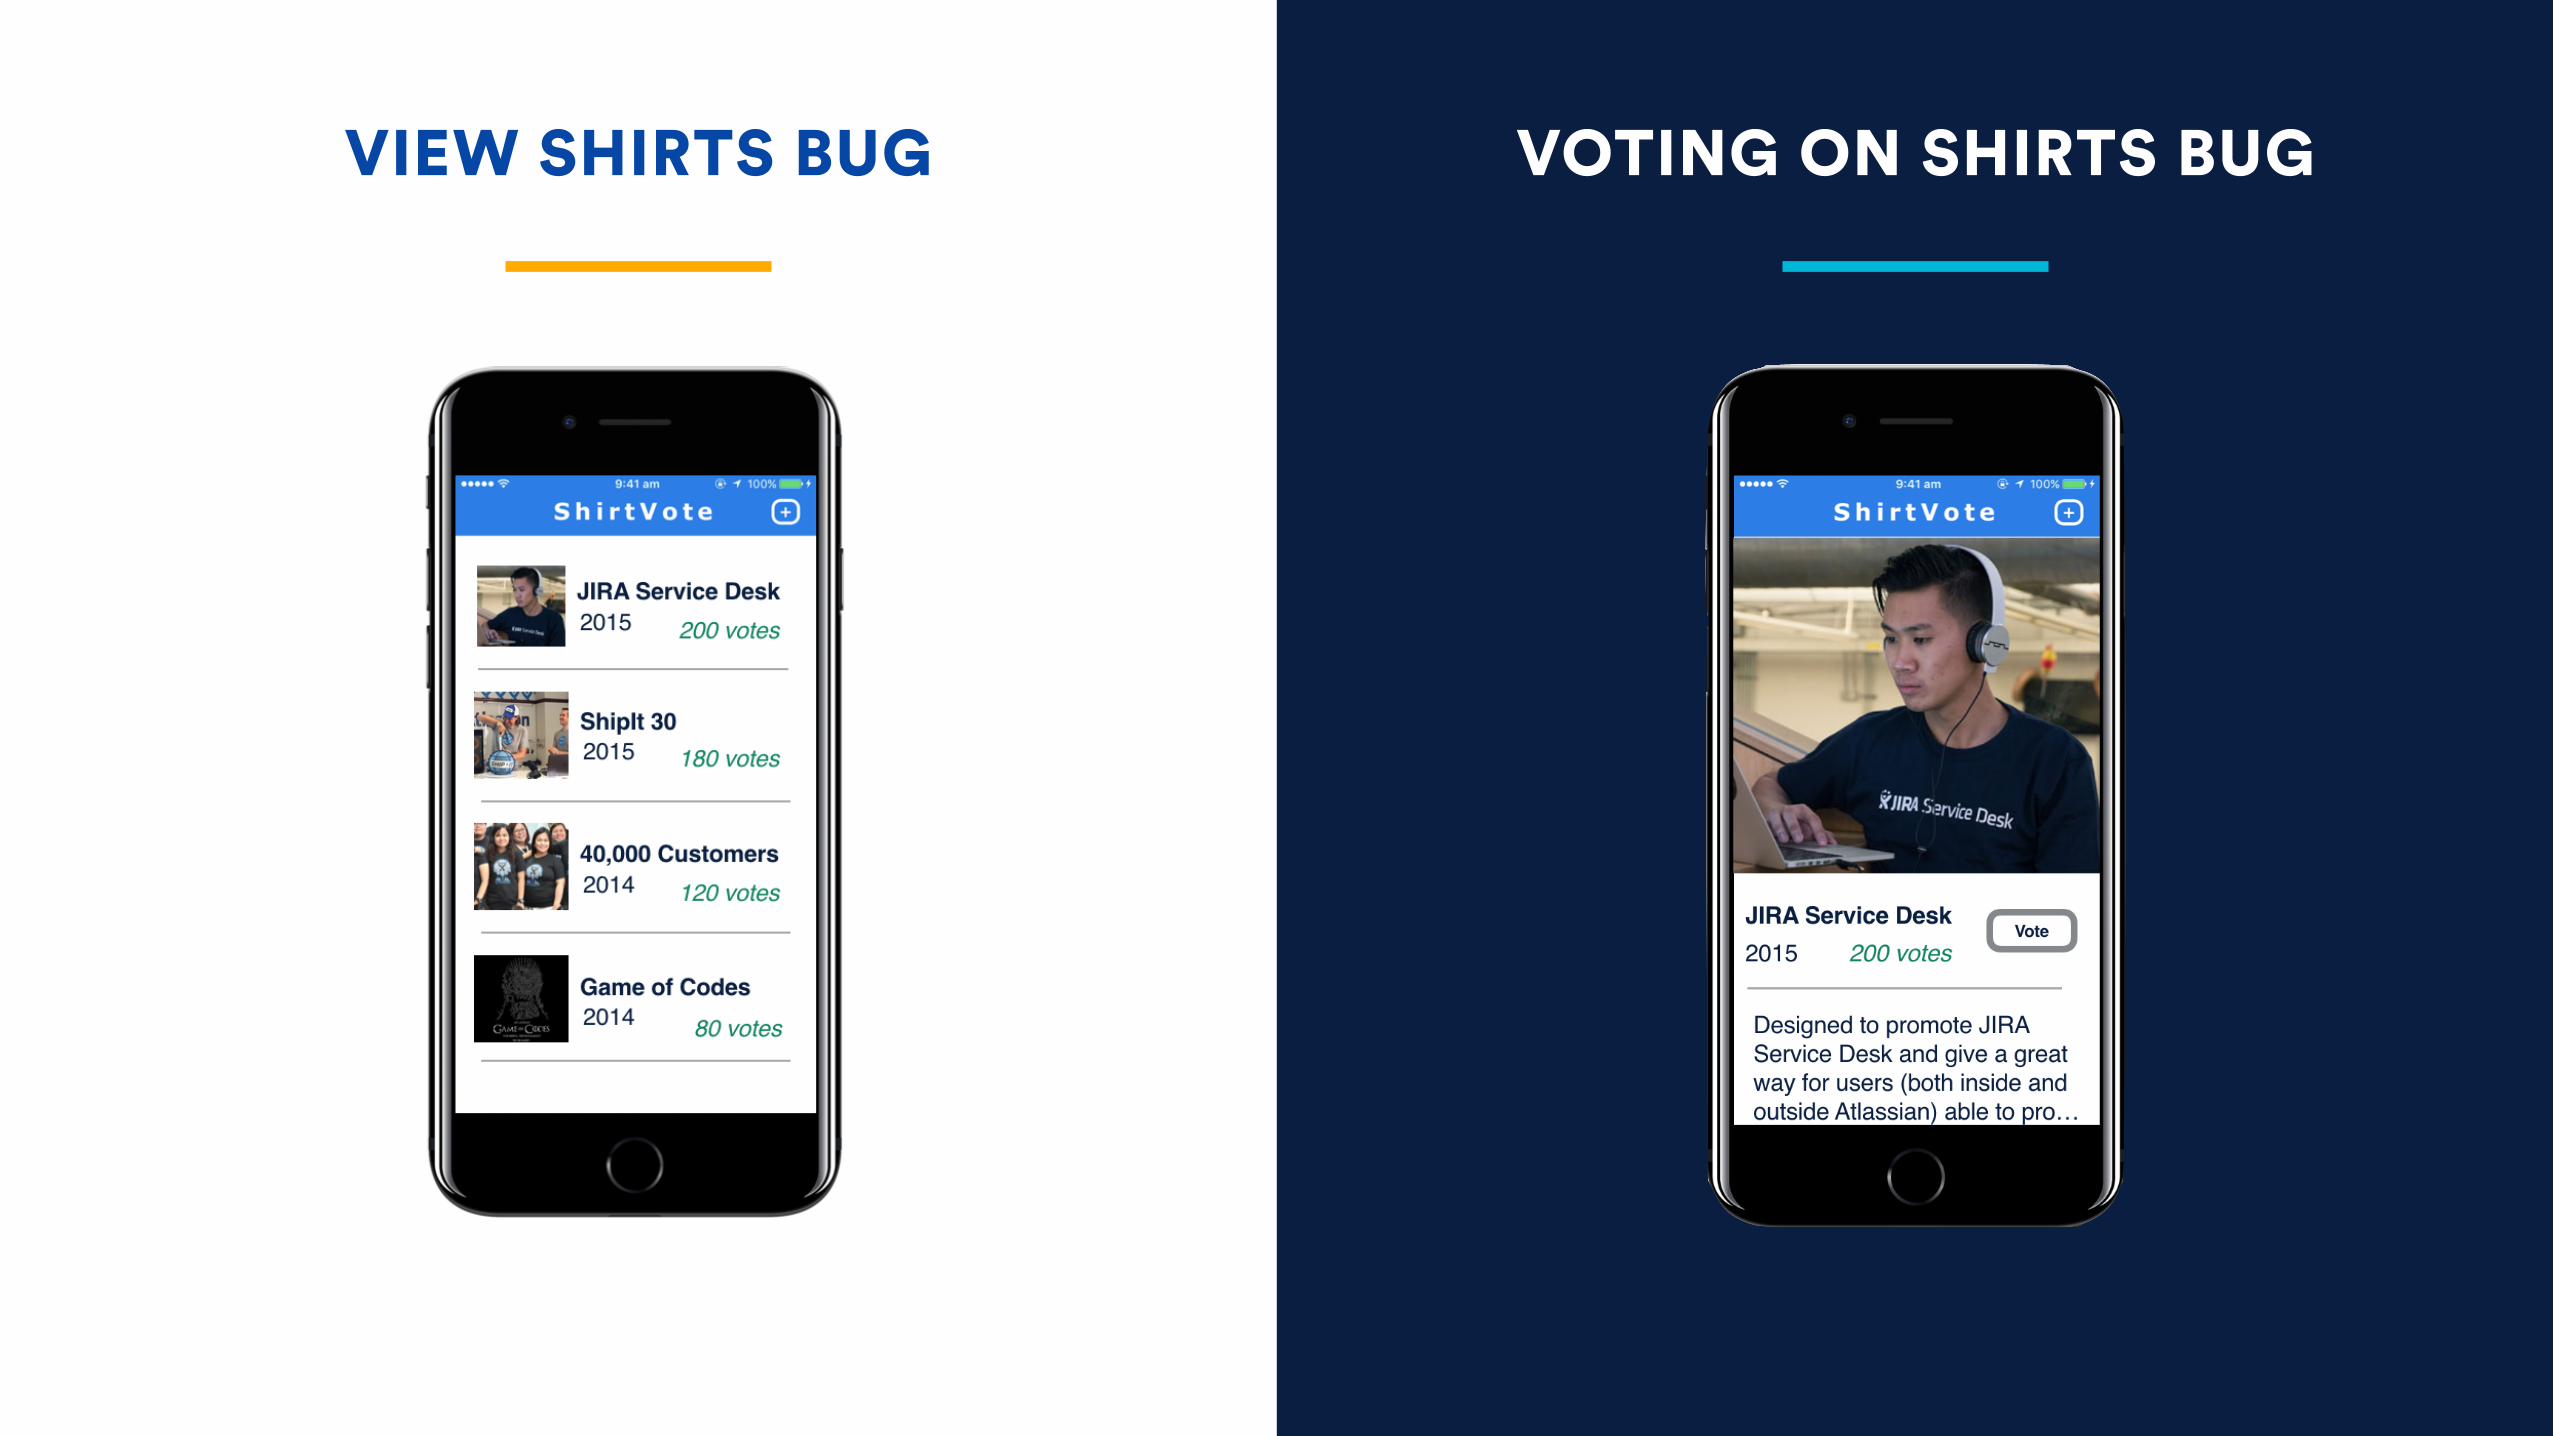
VIEW SHIRTS BUG VOTING ON SHIRTS BUG

How do we gauge interest in a Bug?
Votes and WatchersLinked Support cases

10 reports20 reports
VIEW SHIRTS BUG VOTING ON SHIRTS BUG
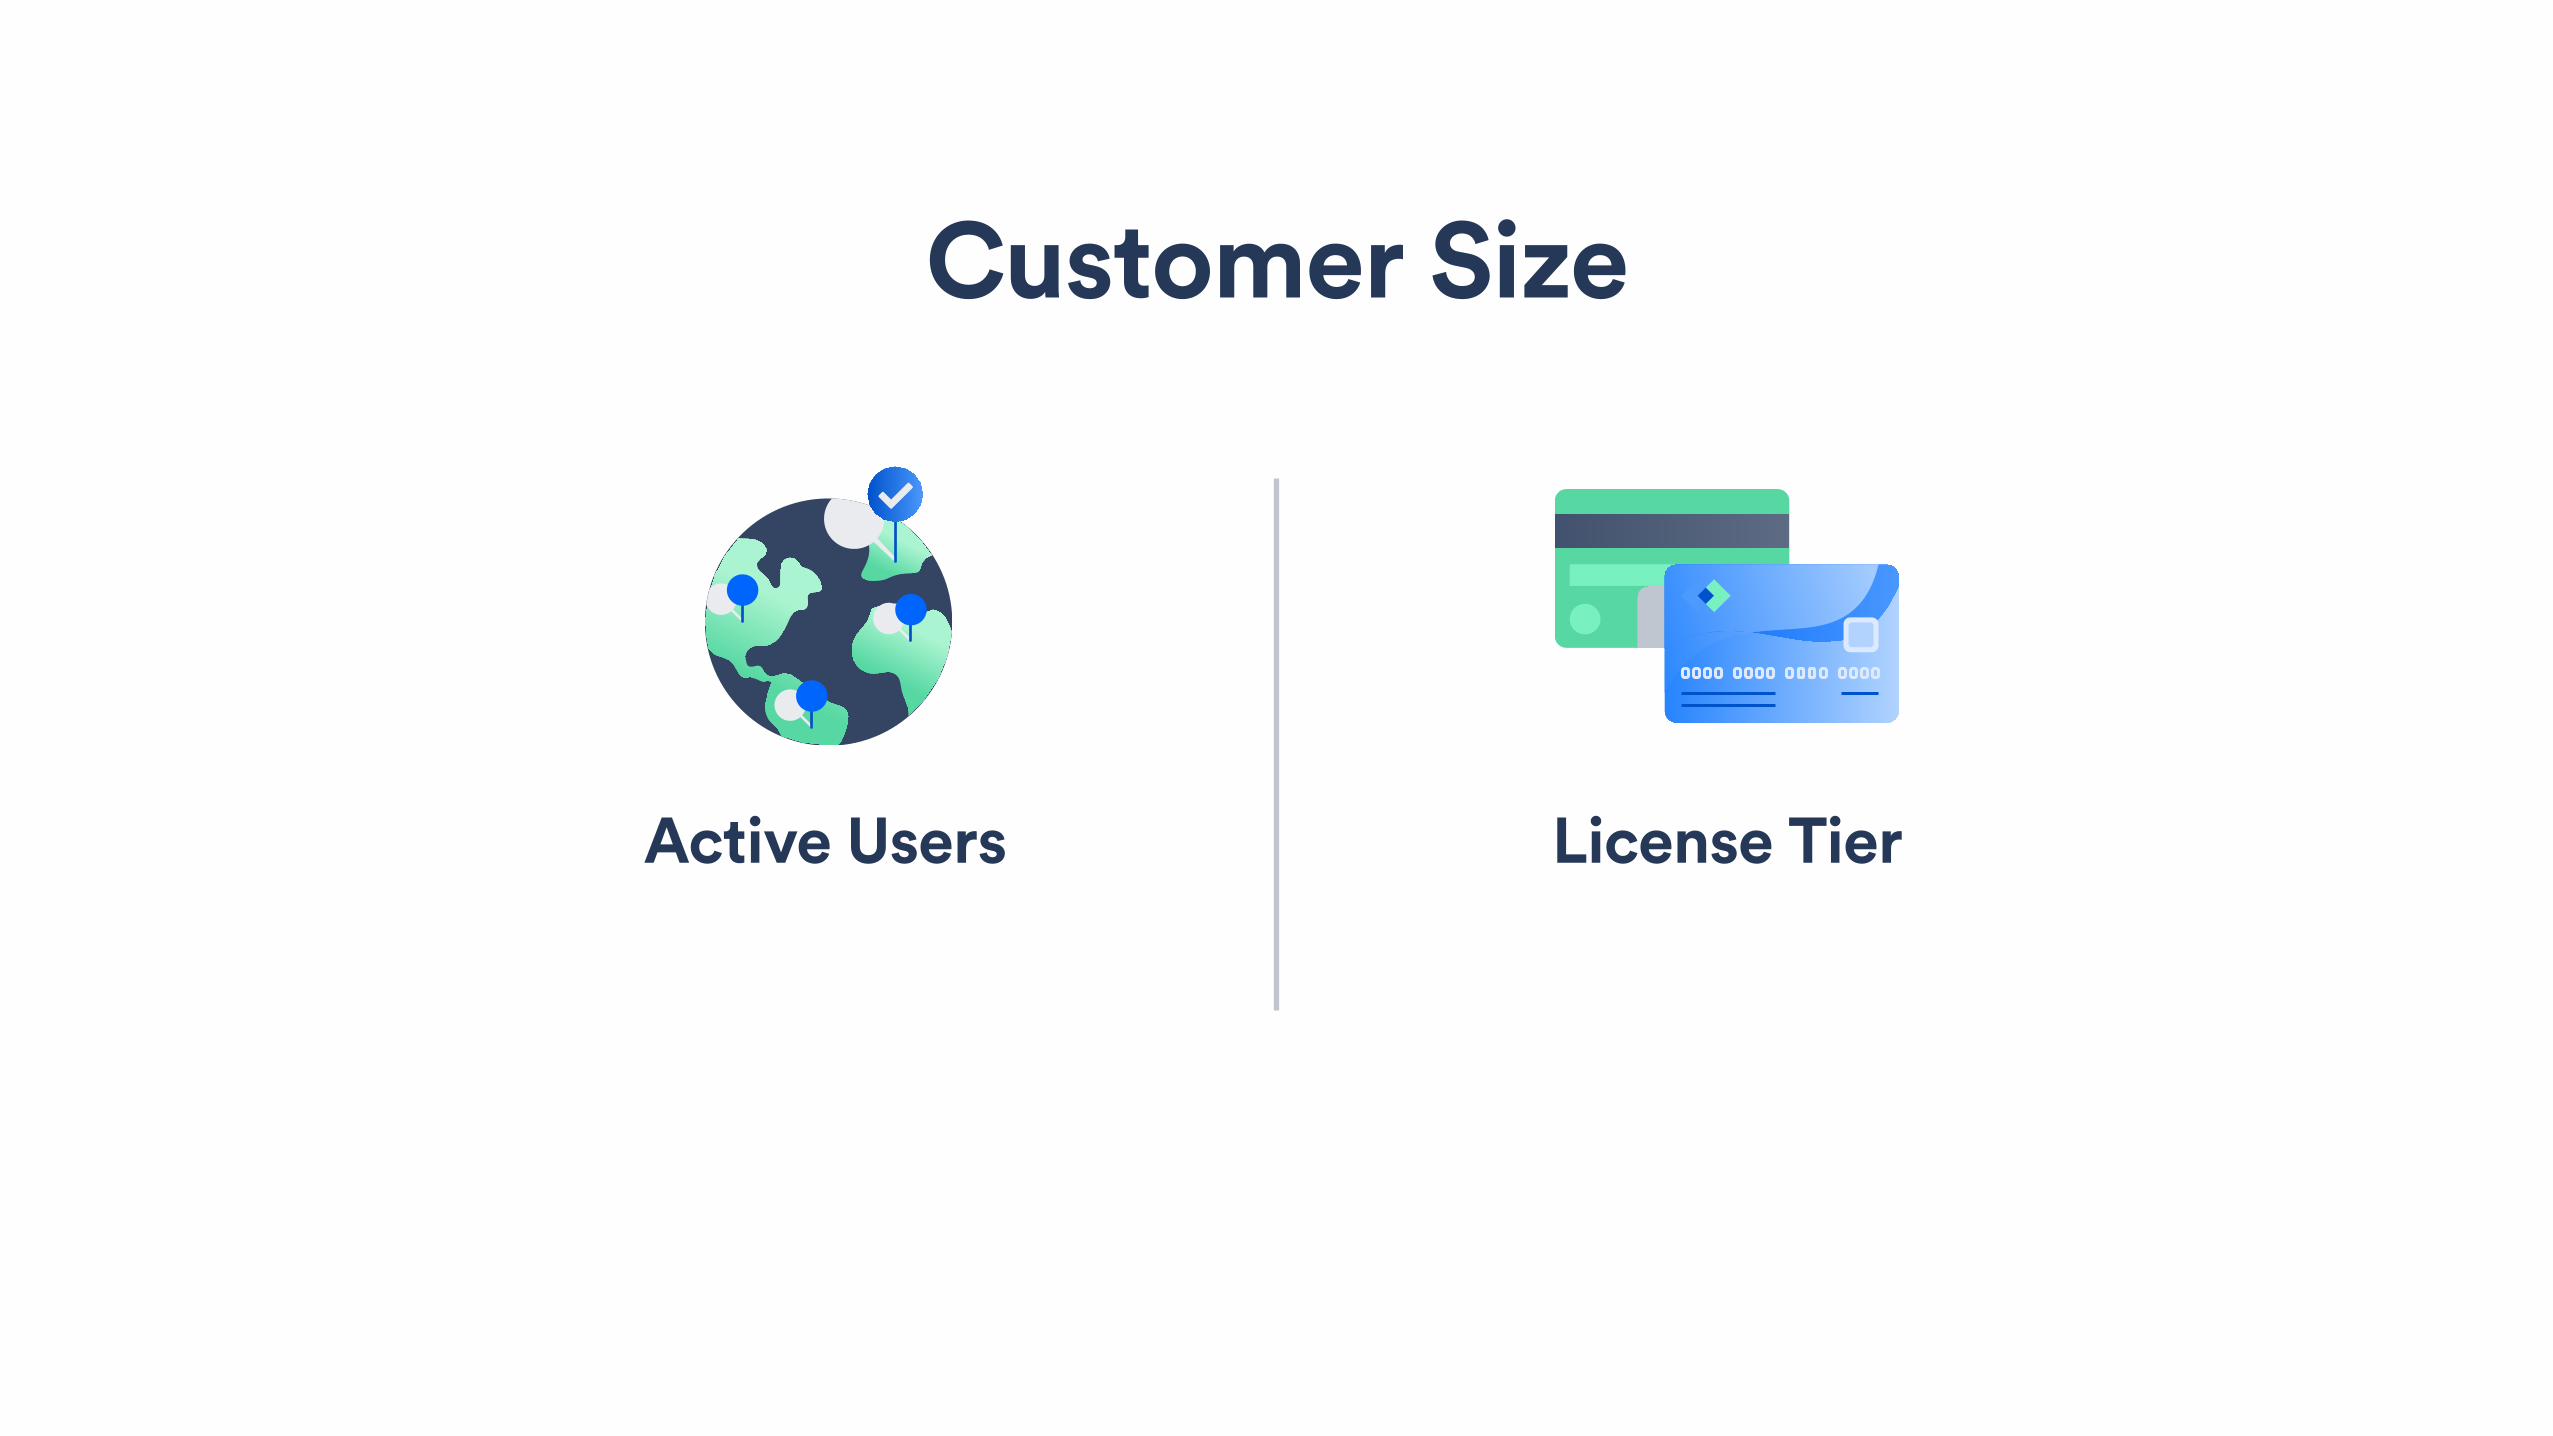
Active Users License Tier
Customer Size
10 customers20 customers
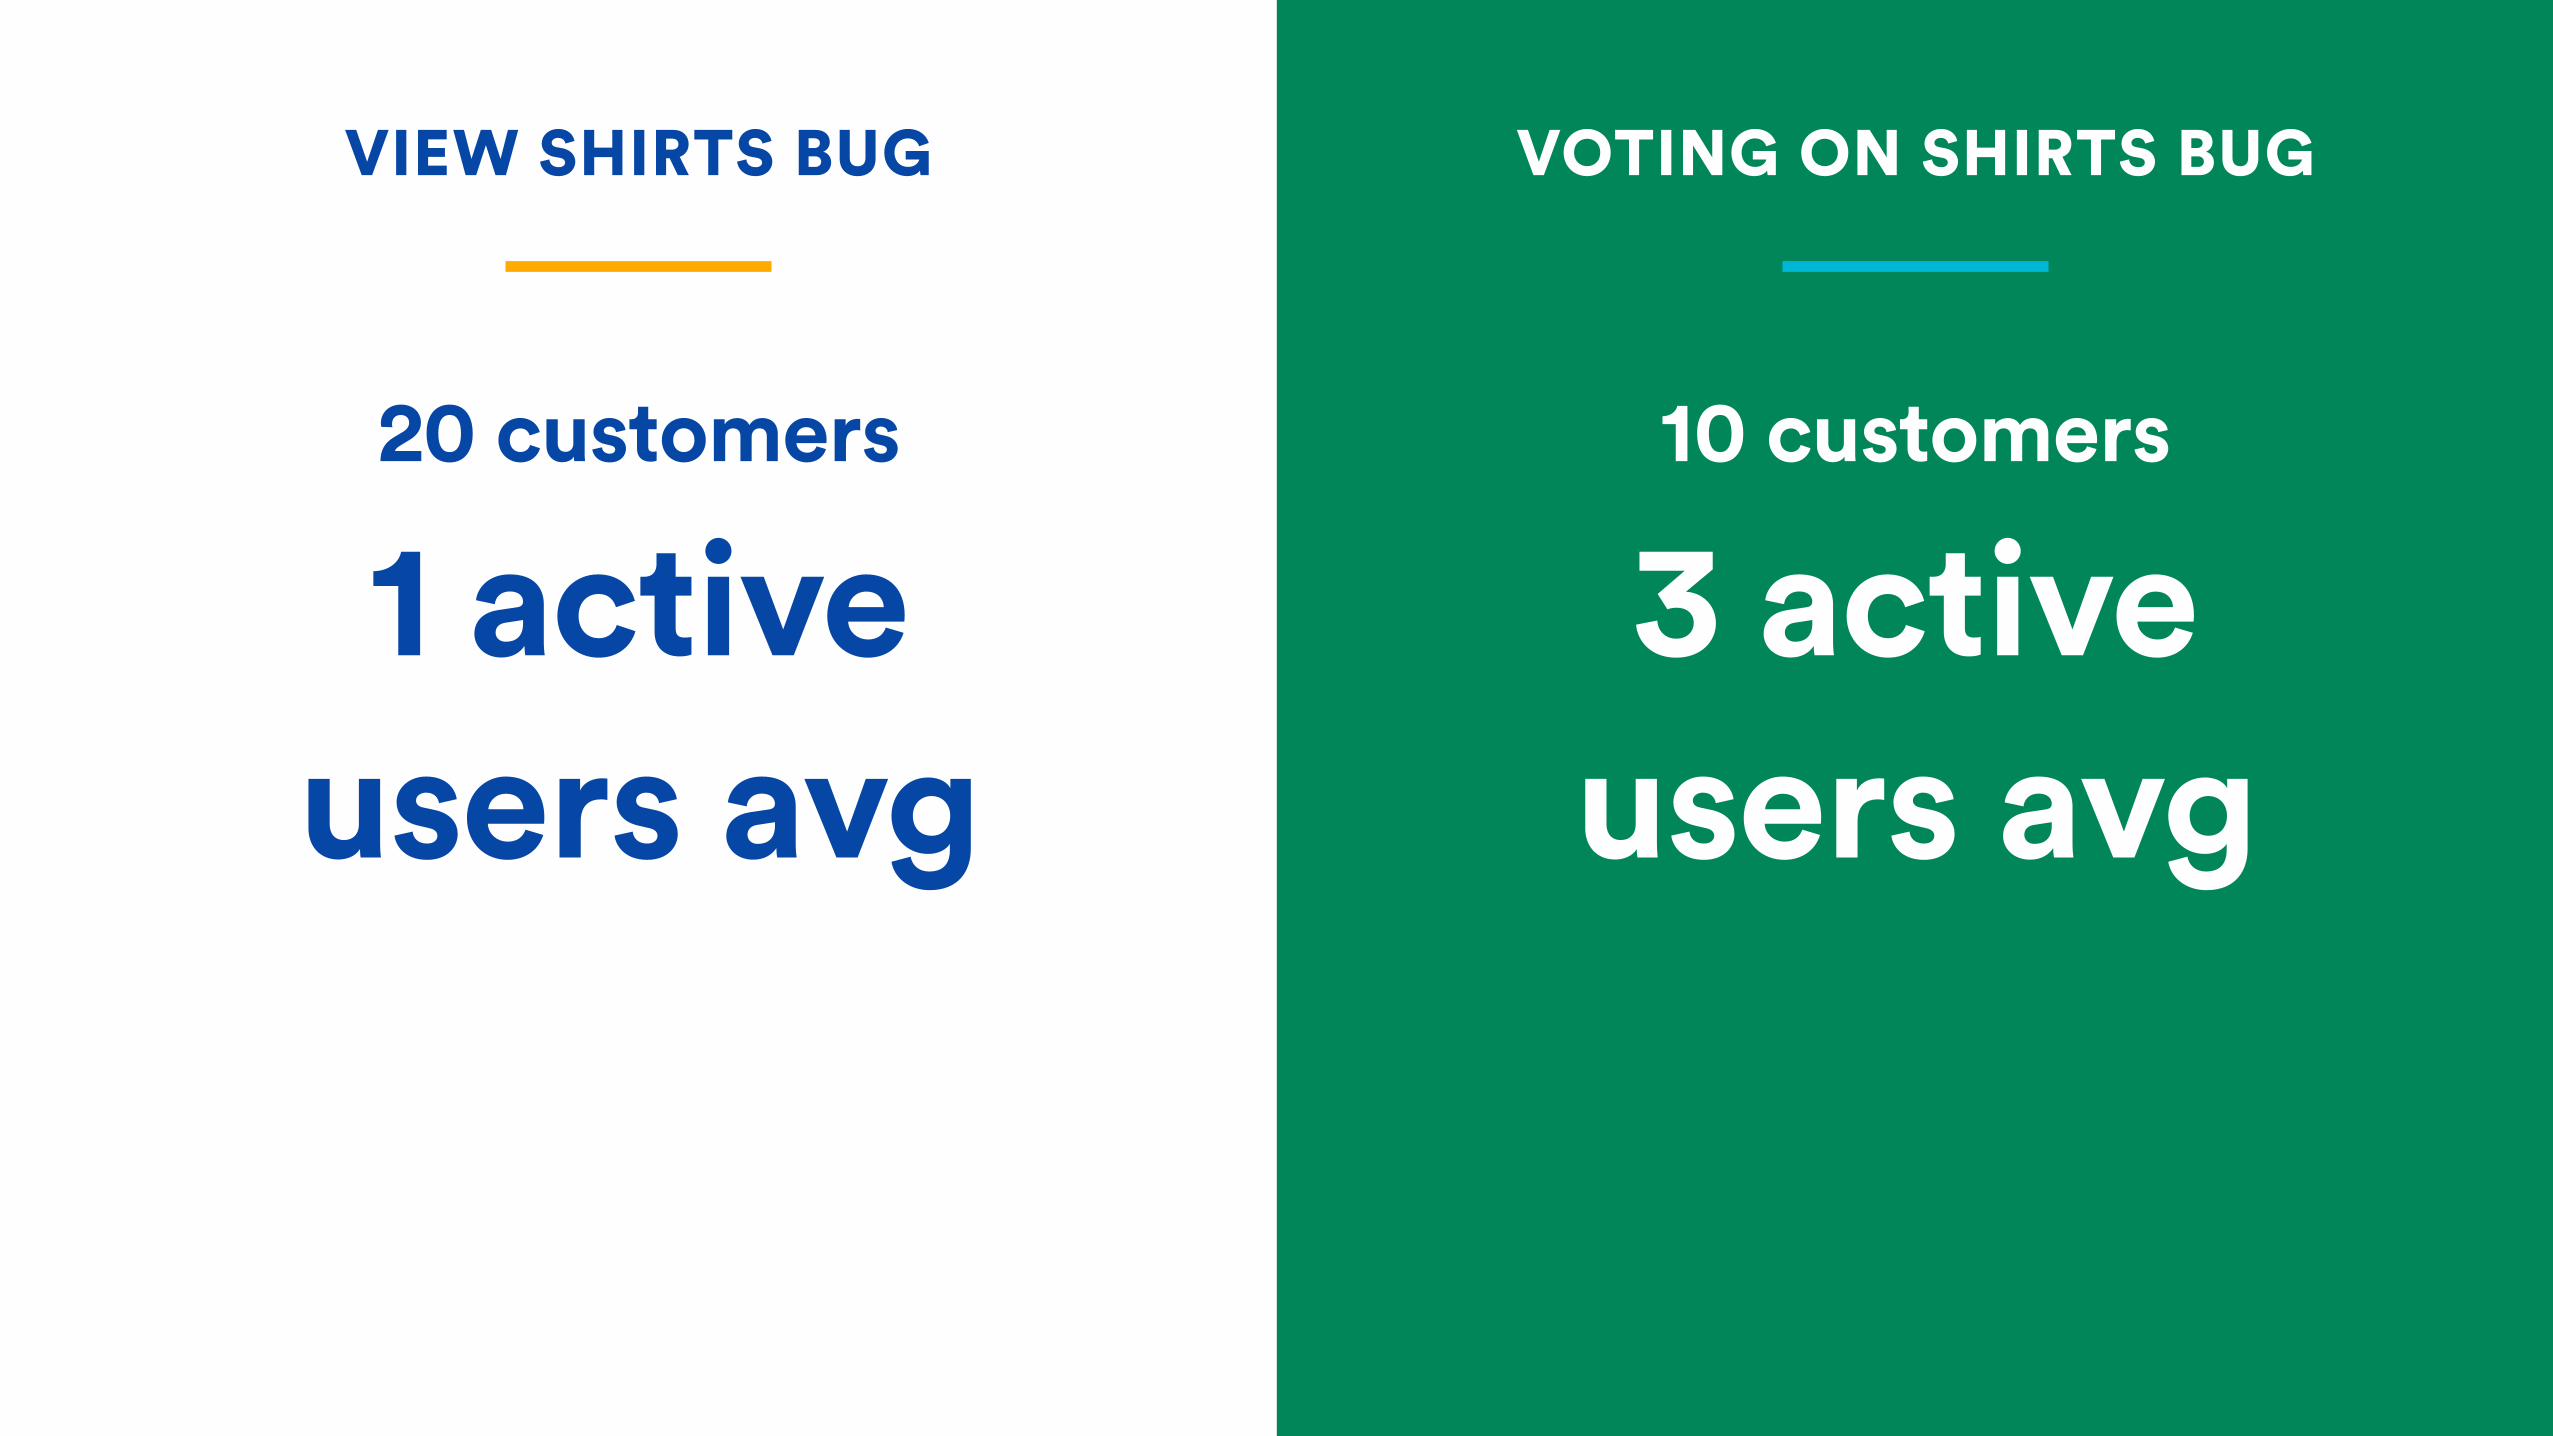
VIEW SHIRTS BUG VOTING ON SHIRTS BUG
1 active users avg
3 active users avg
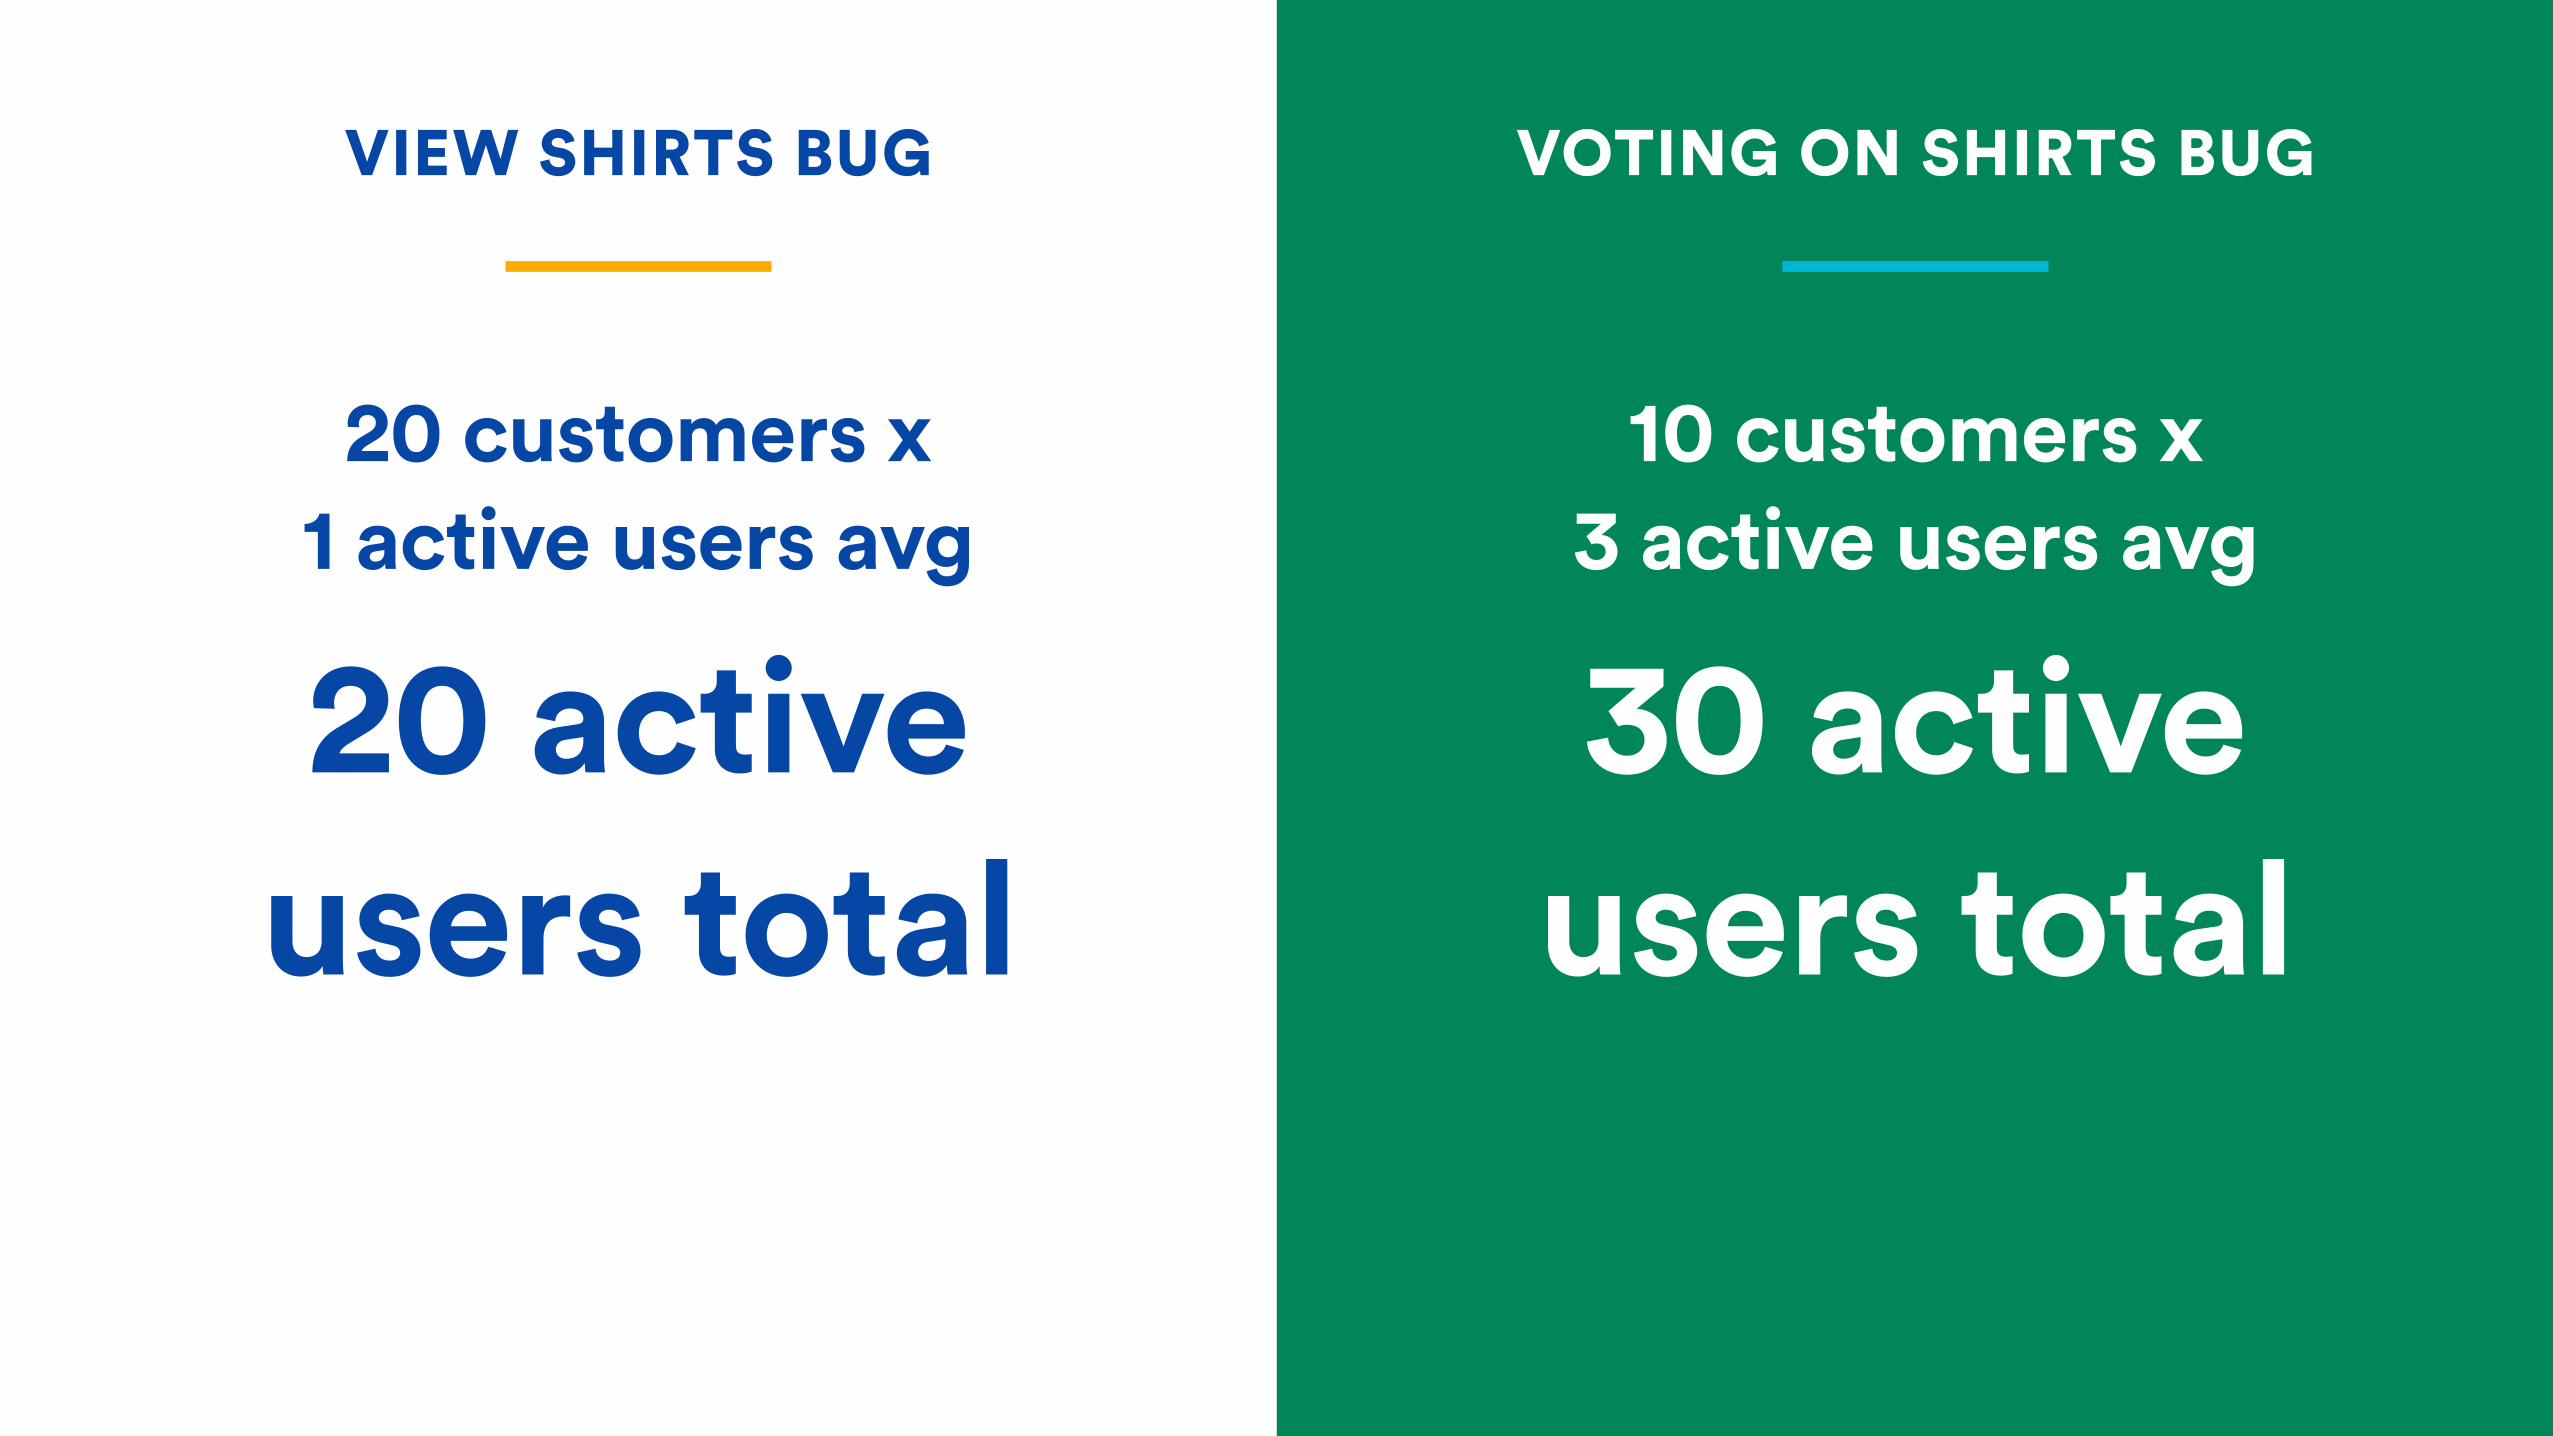
10 customers x 3 active users avg
20 customers x 1 active users avg
VIEW SHIRTS BUG VOTING ON SHIRTS BUG
20 active users total
30 active users total

Severity The impact of a bug on the end user, system or business.
How bad is it?
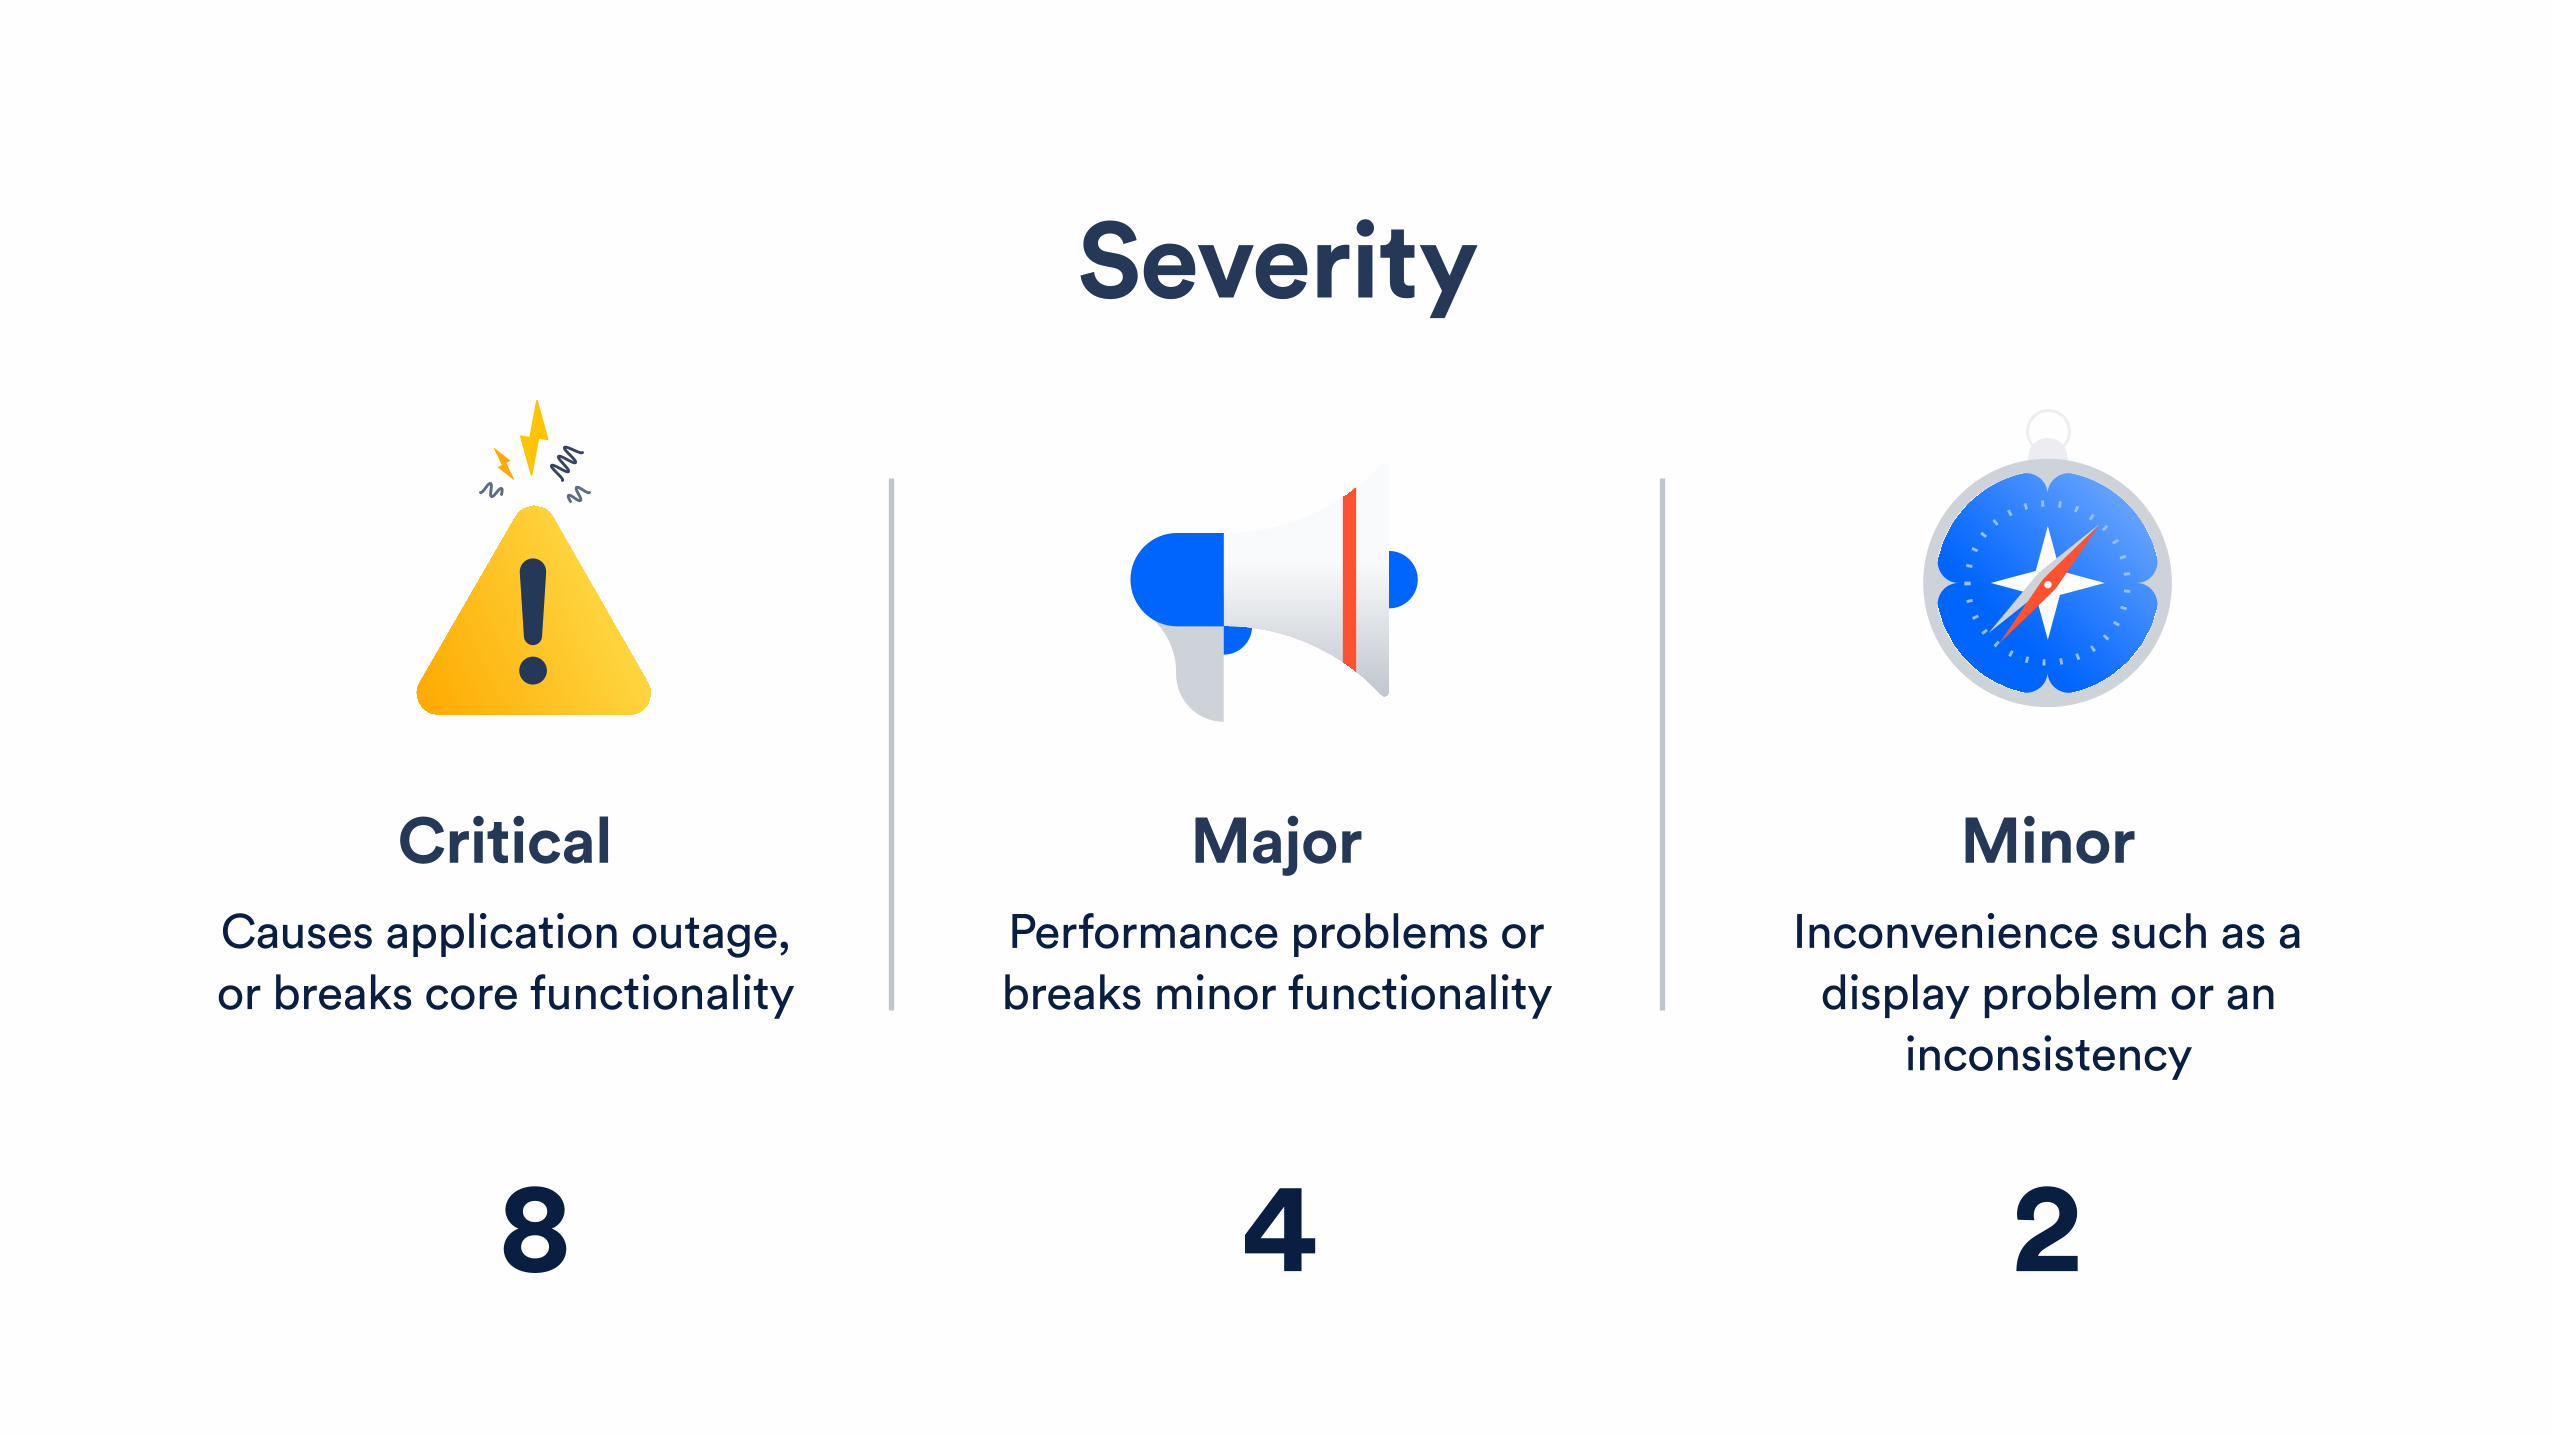
Major Performance problems or breaks minor functionality
Severity
Minor Inconvenience such as a
display problem or an inconsistency
Critical Causes application outage, or breaks core functionality
8 4 2
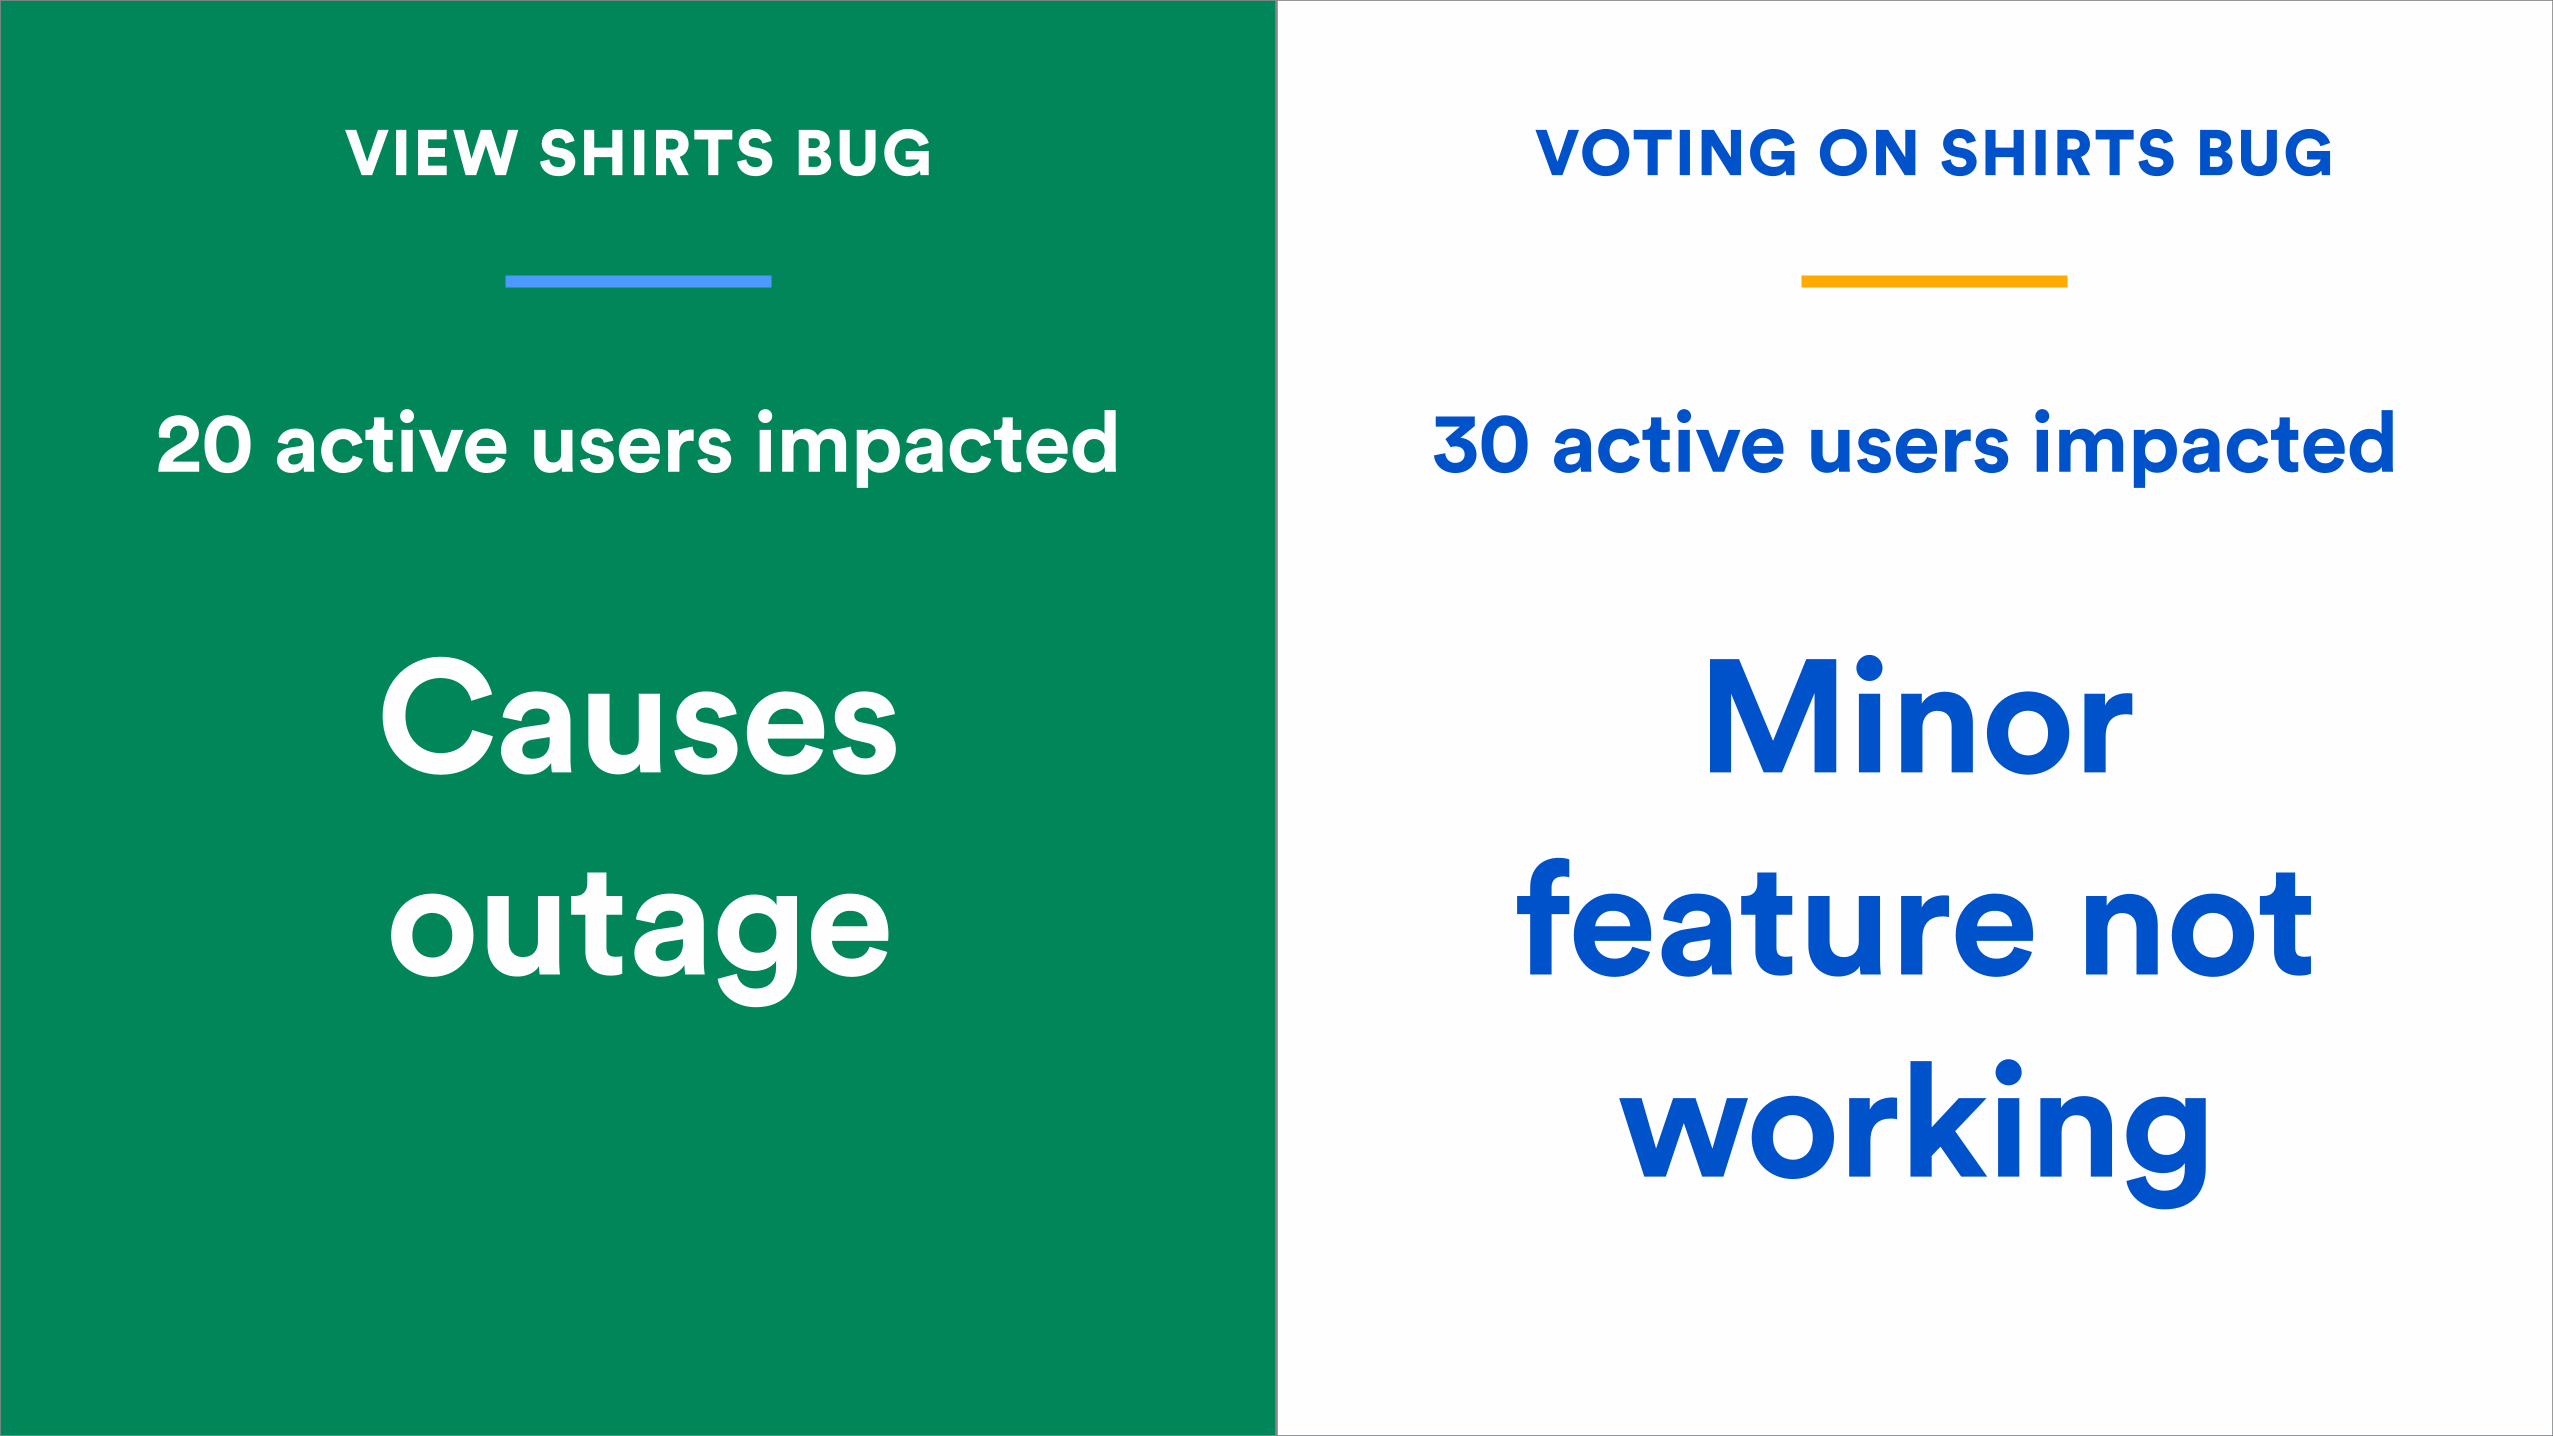
30 active users impacted20 active users impacted
VIEW SHIRTS BUG VOTING ON SHIRTS BUG
Causes outage
Minor feature not
working
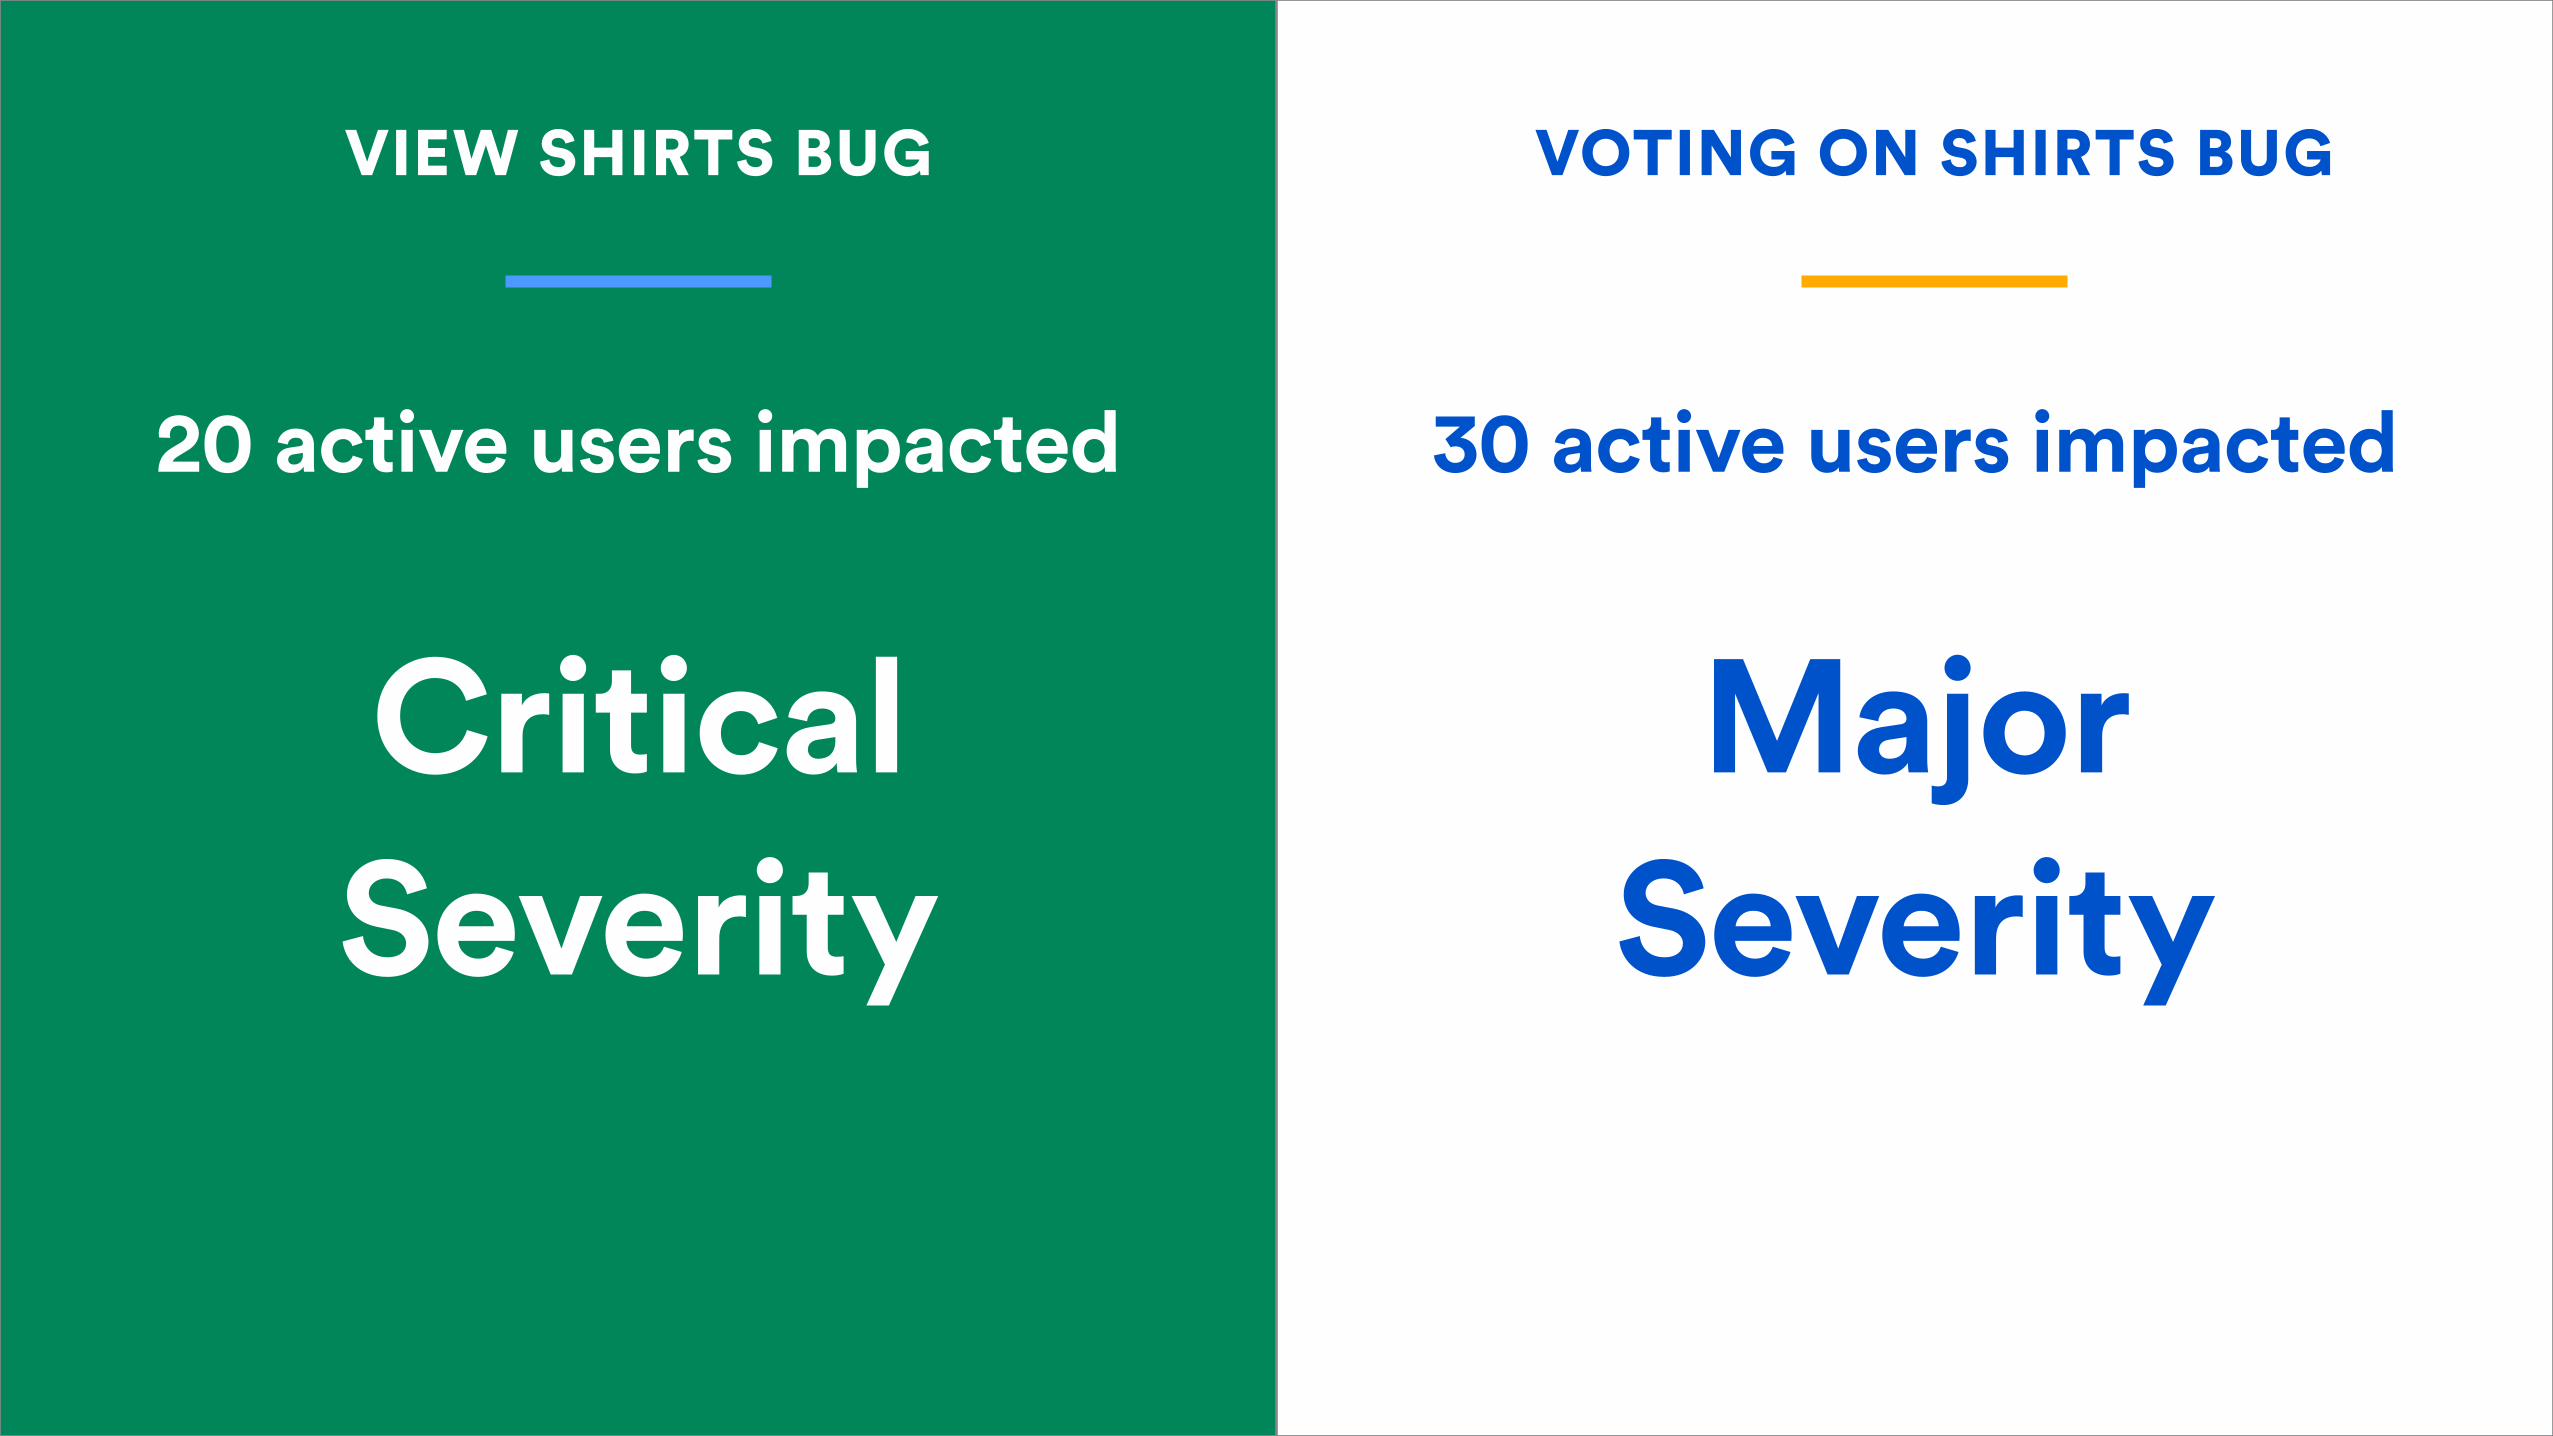
30 active users impacted20 active users impacted
VIEW SHIRTS BUG VOTING ON SHIRTS BUG
Critical Severity
Major Severity
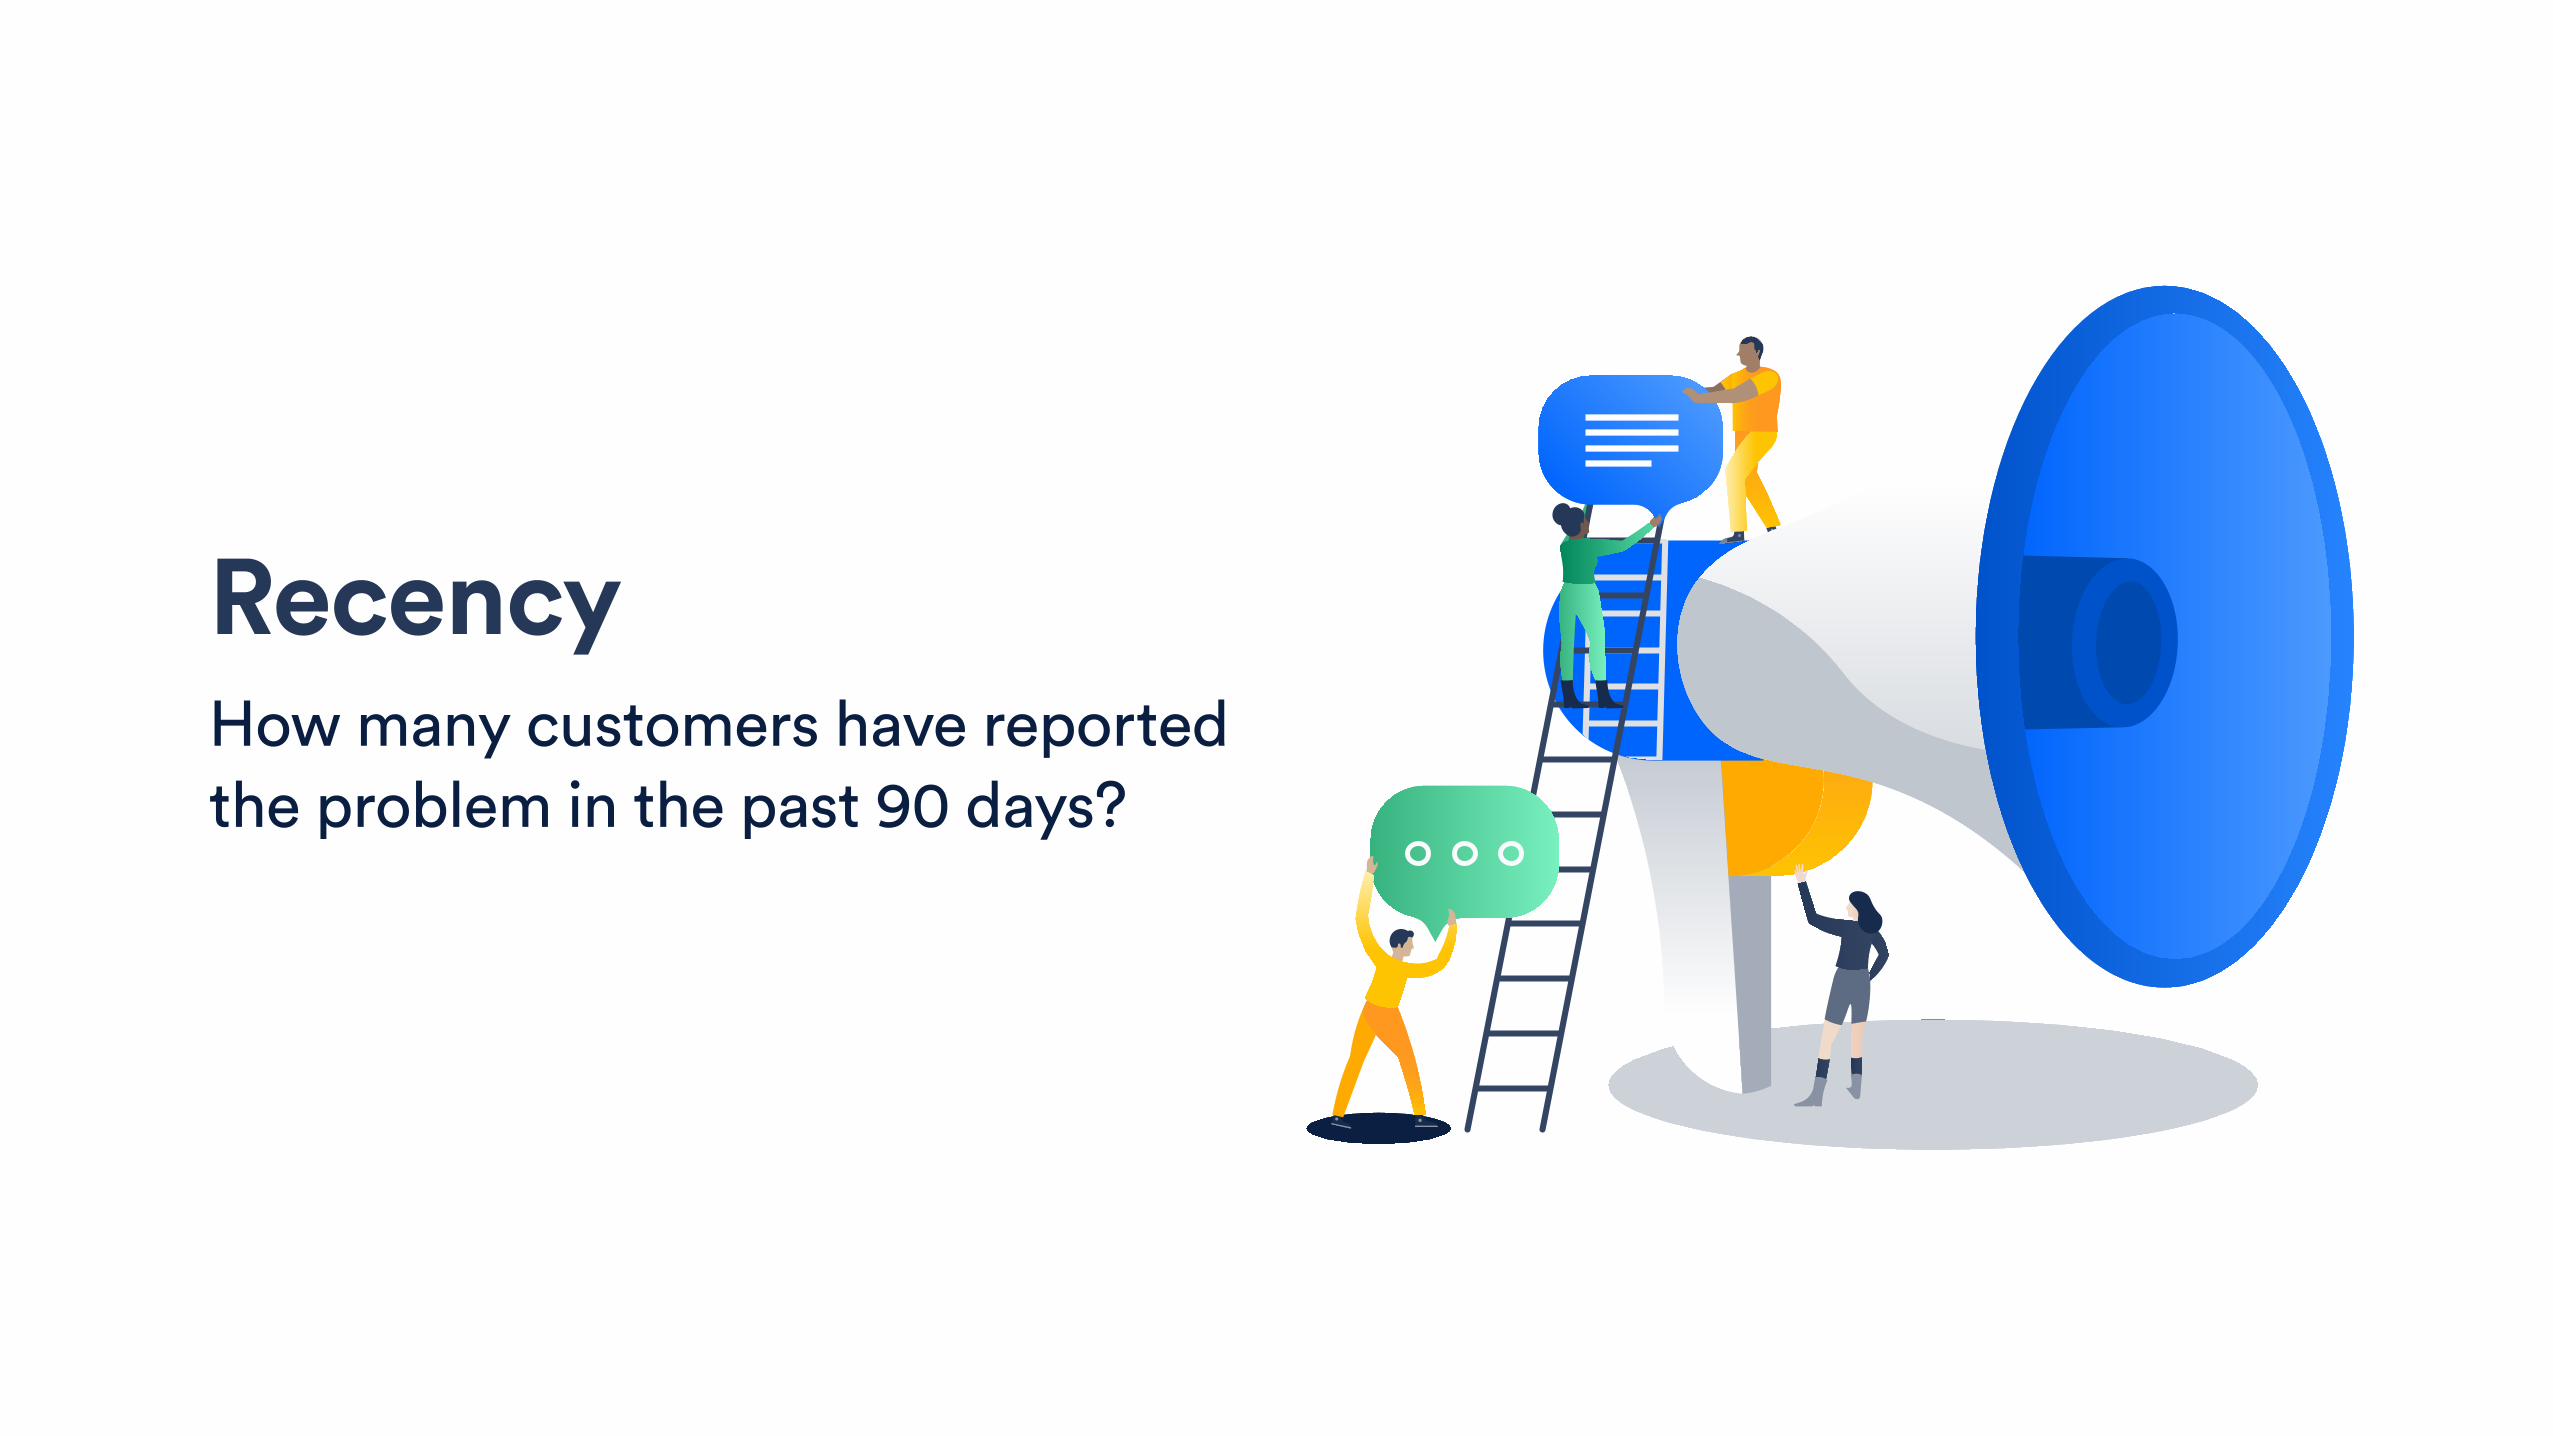
Recency How many customers have reported the problem in the past 90 days?
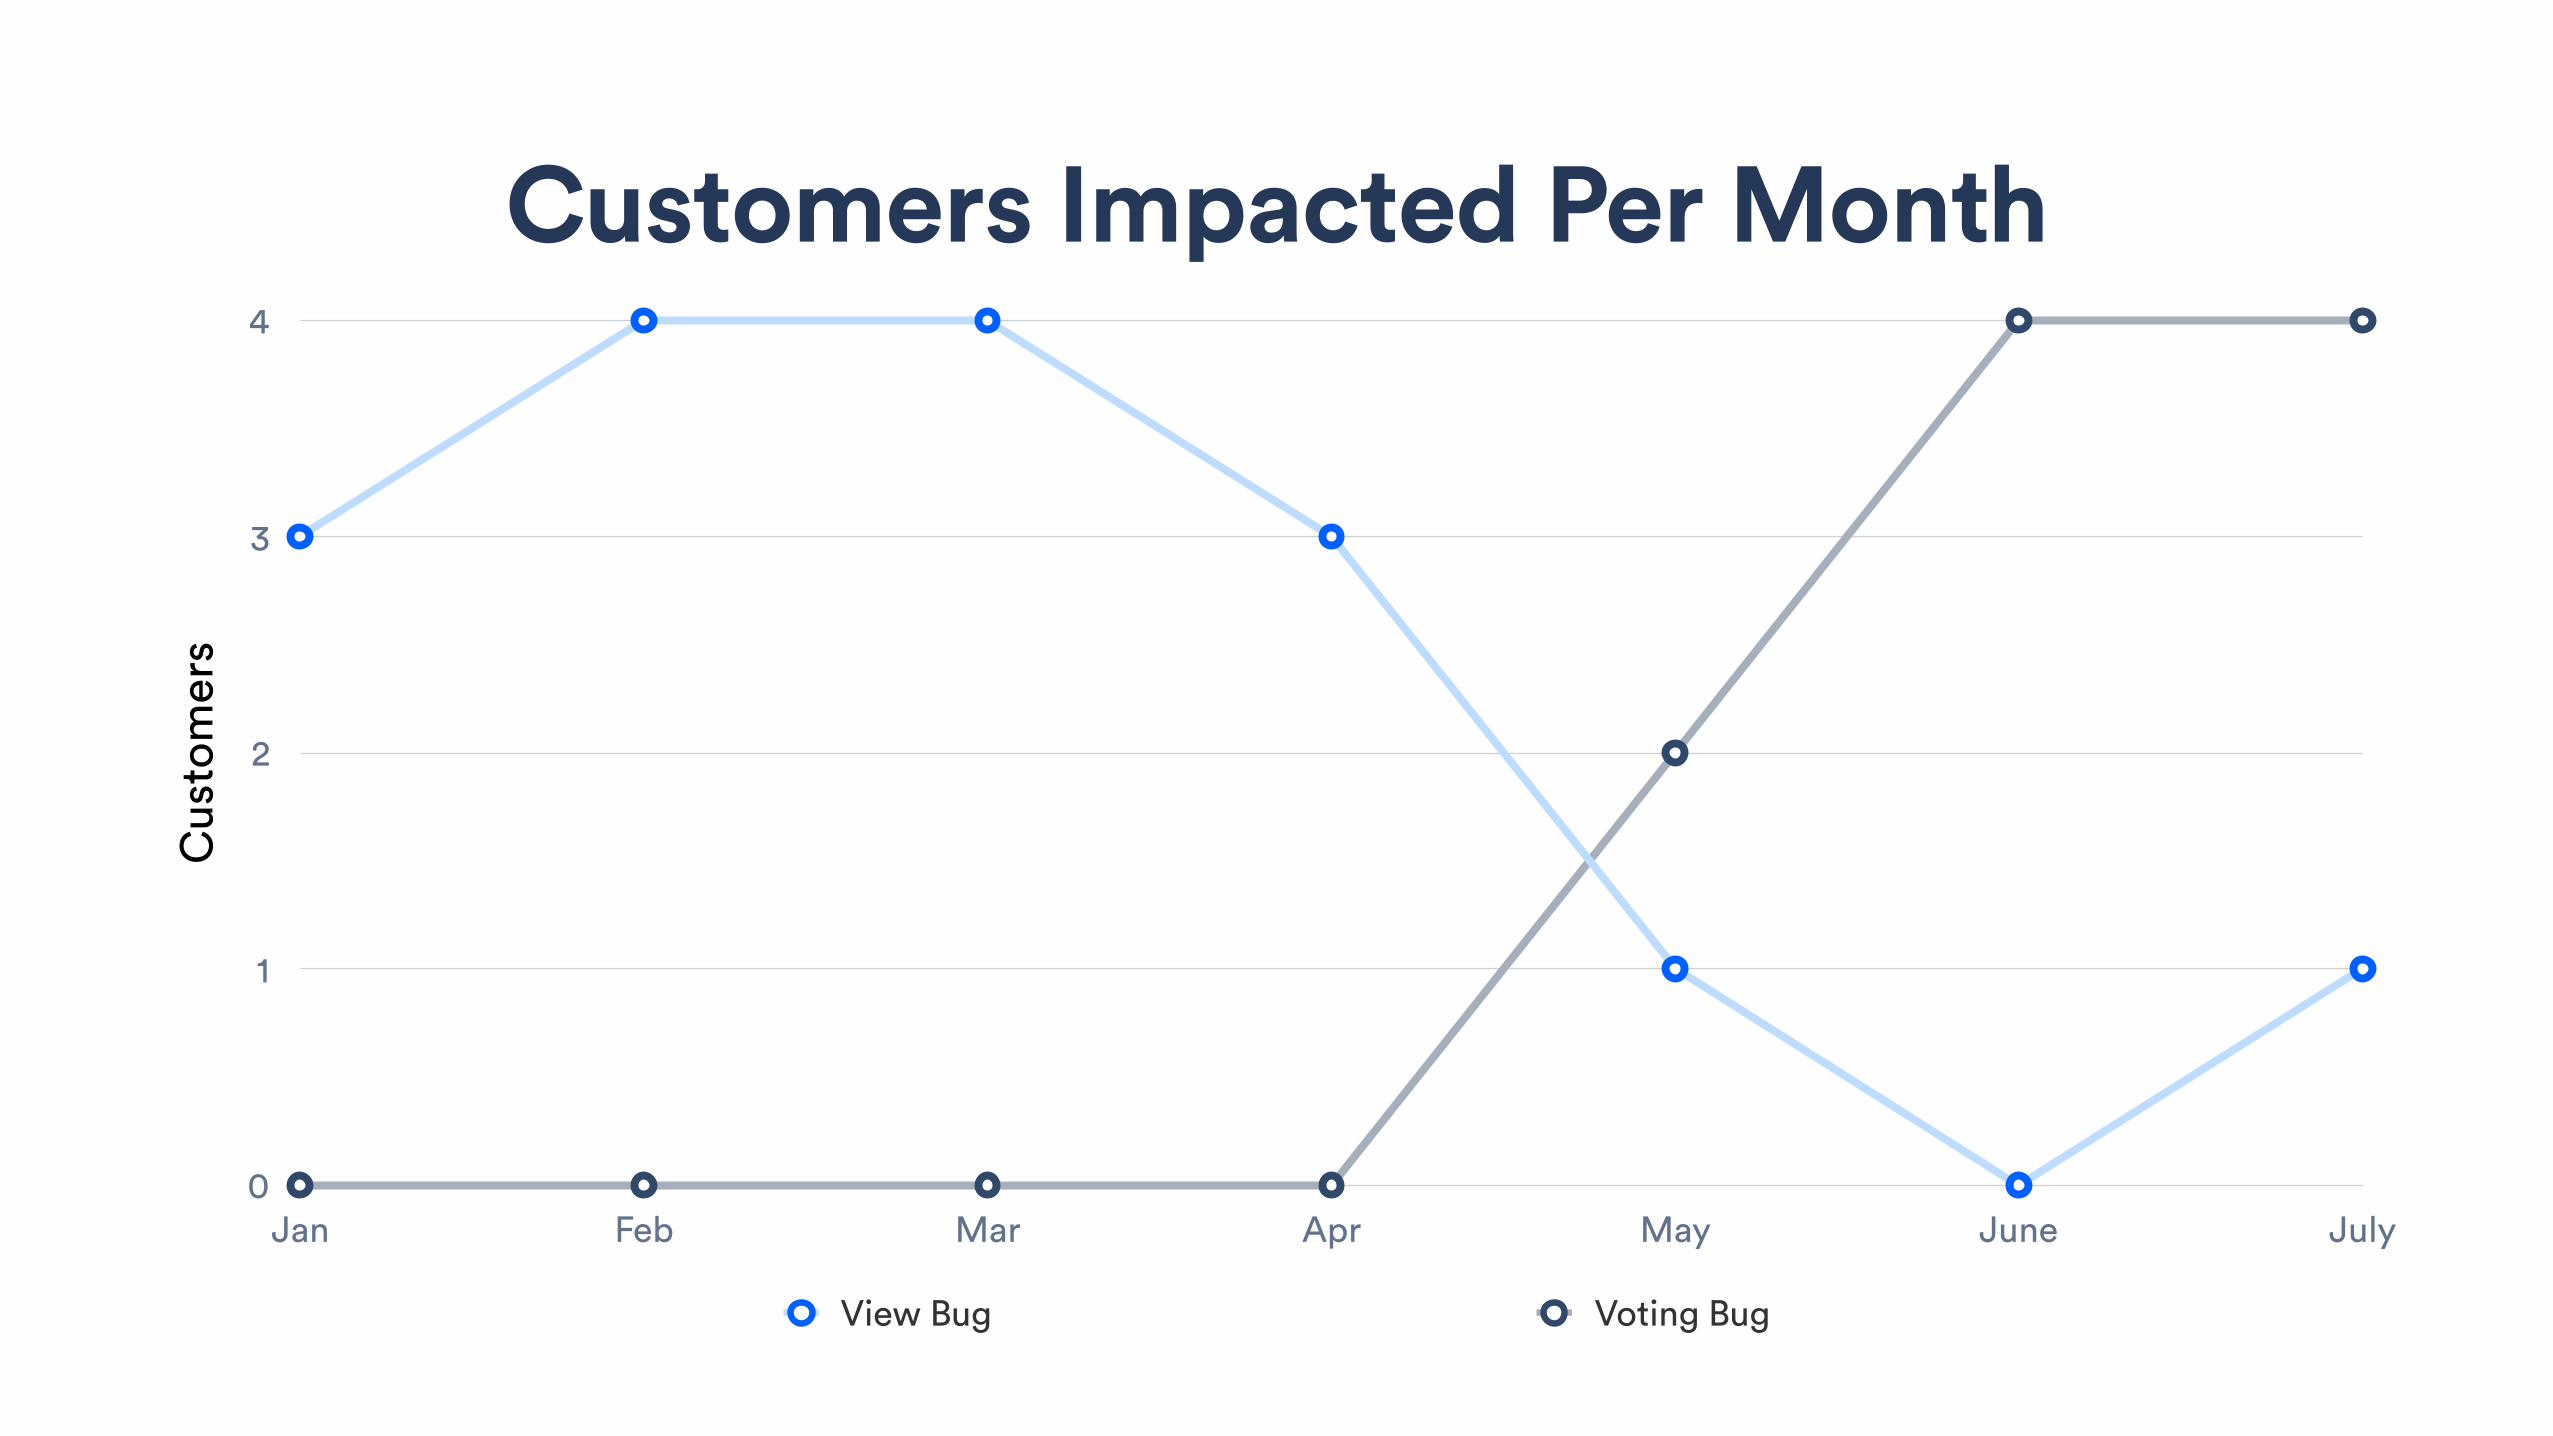
Customers Impacted Per MonthC
usto
mer
s
0
1
2
3
4
Jan Feb Mar Apr May June July
View Bug Voting Bug

30 active users impacted
Major Severity
20 active users impacted
Critical Severity
VIEW SHIRTS BUG VOTING ON SHIRTS BUG
2 reports in last 90 days
10 reports in last 90 days

Severity How bad is the impact of the
bug?
User Impact Score
Recency Is the bug getting better or
worse?
Impacted Users Number of users impacted
by a bug
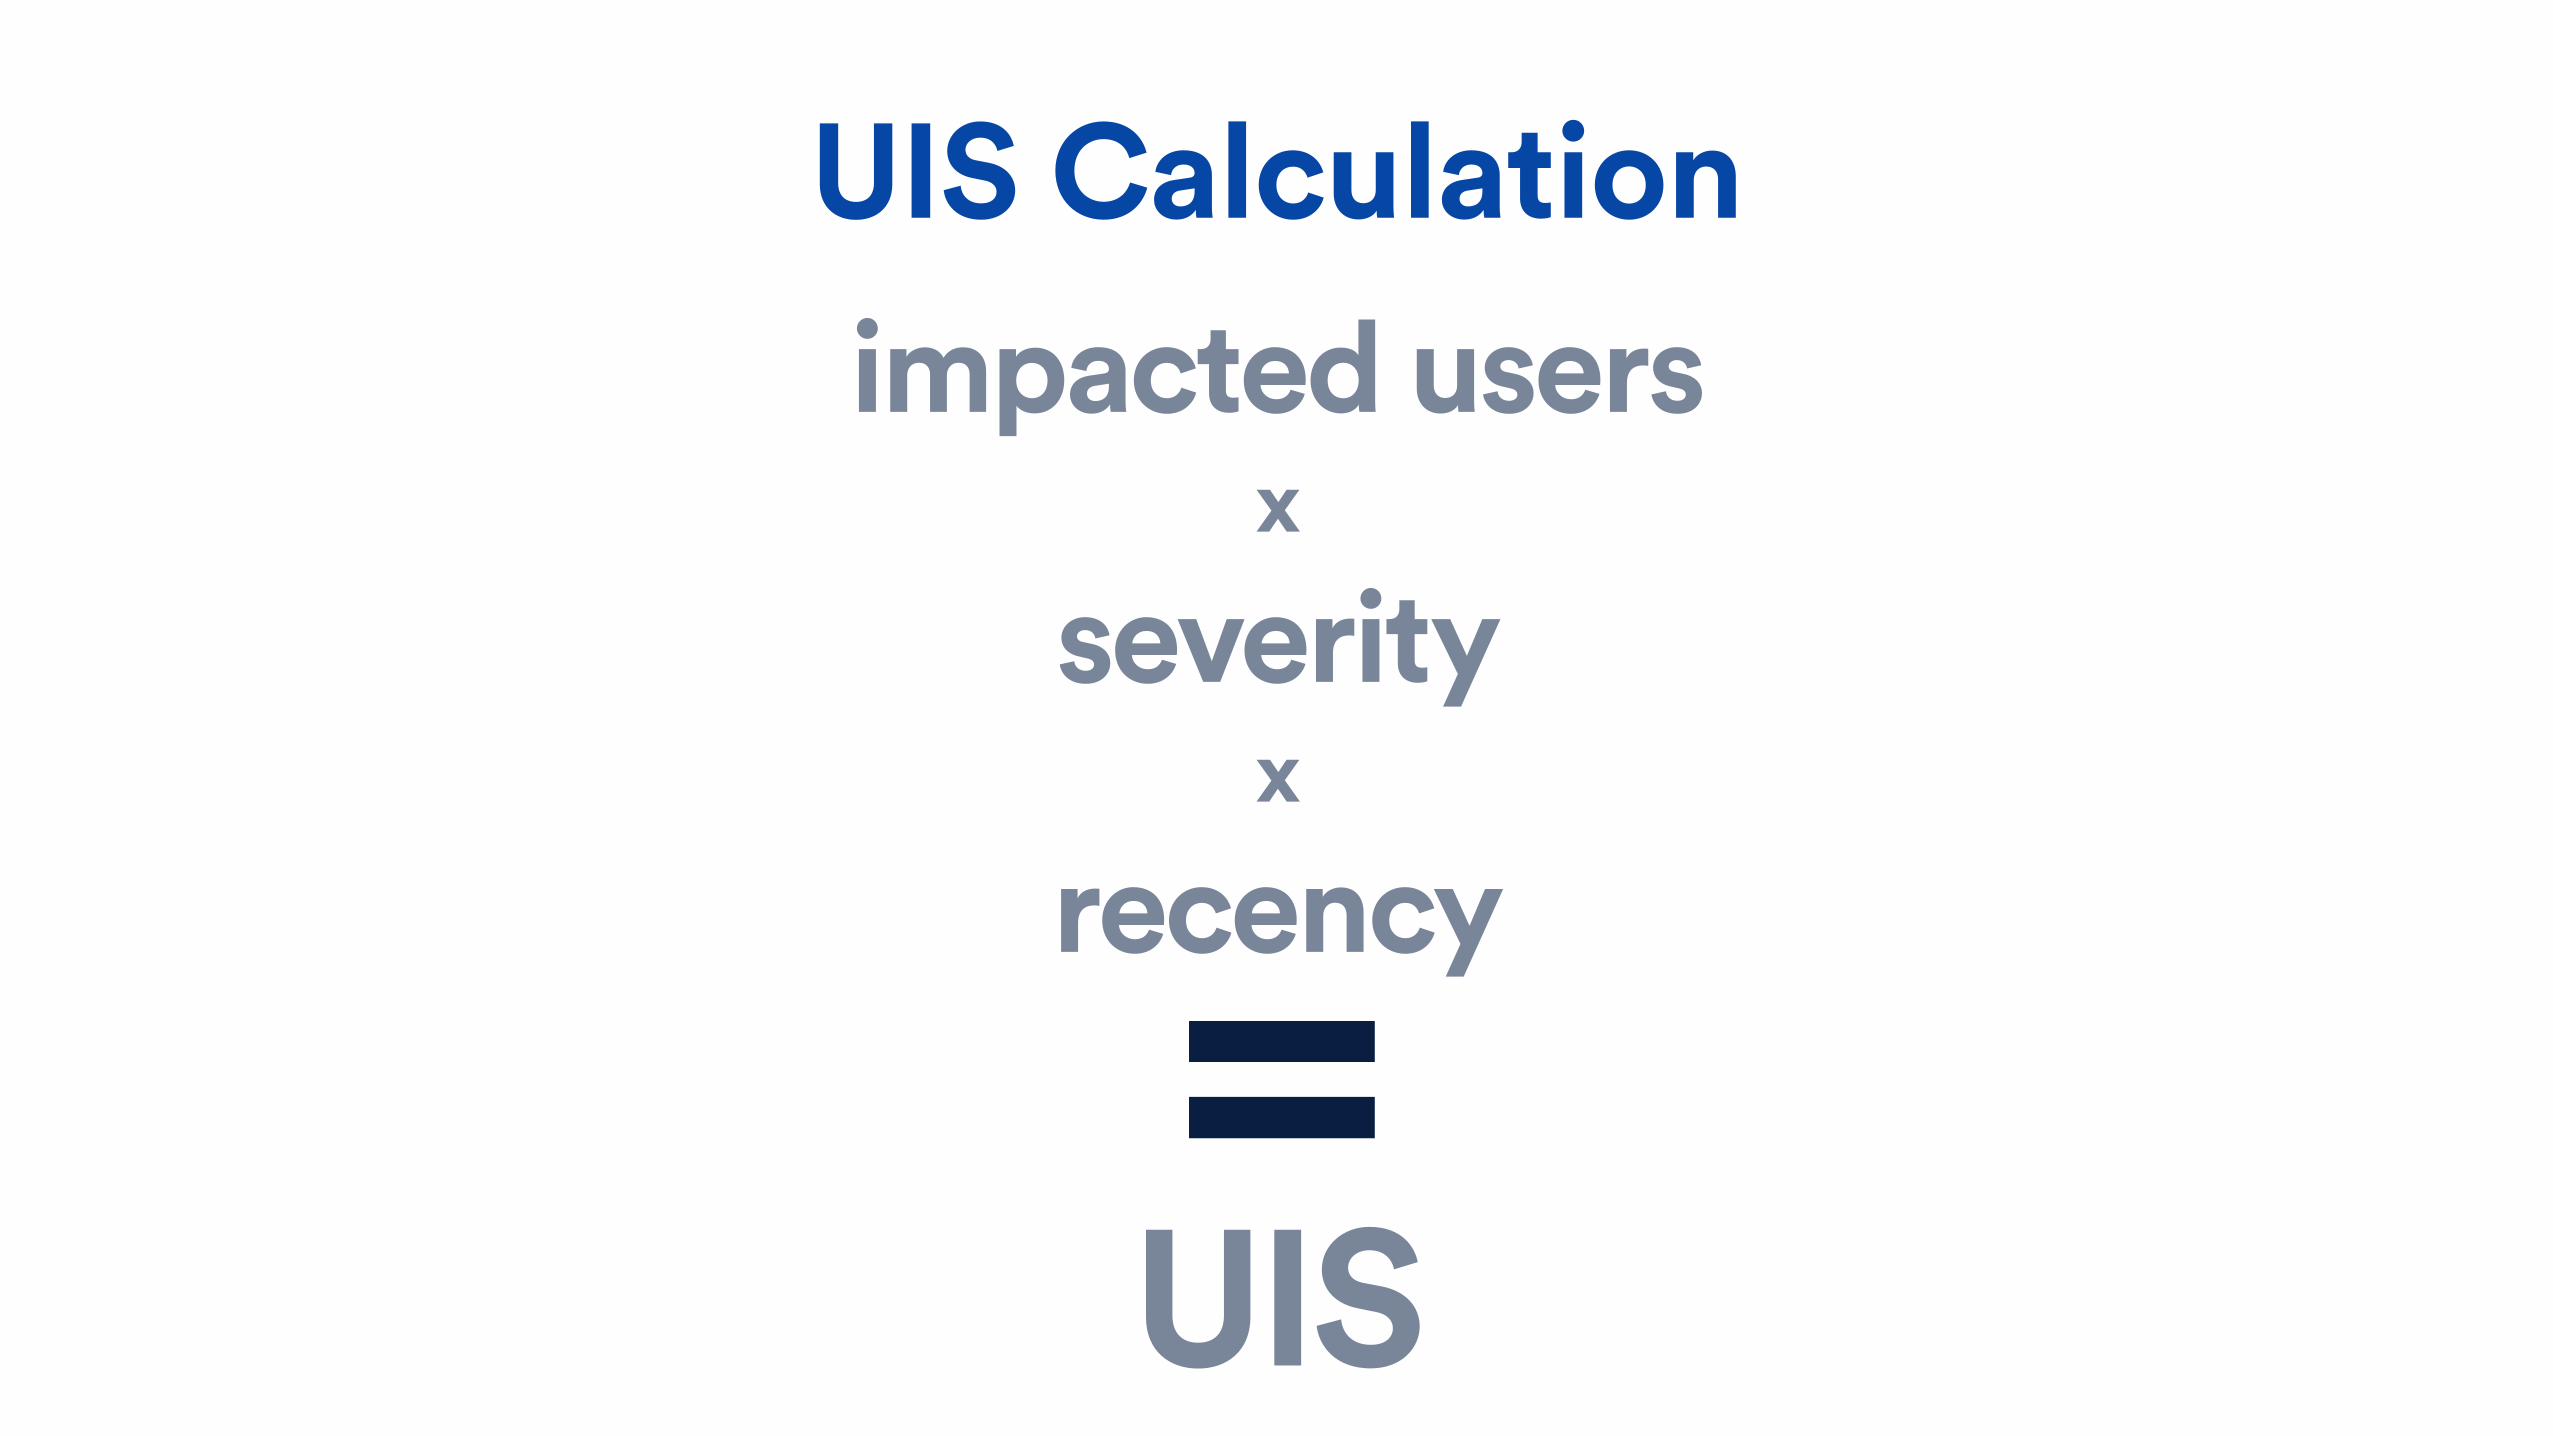
UIS Calculationimpacted users
x
severity x
recency=UIS
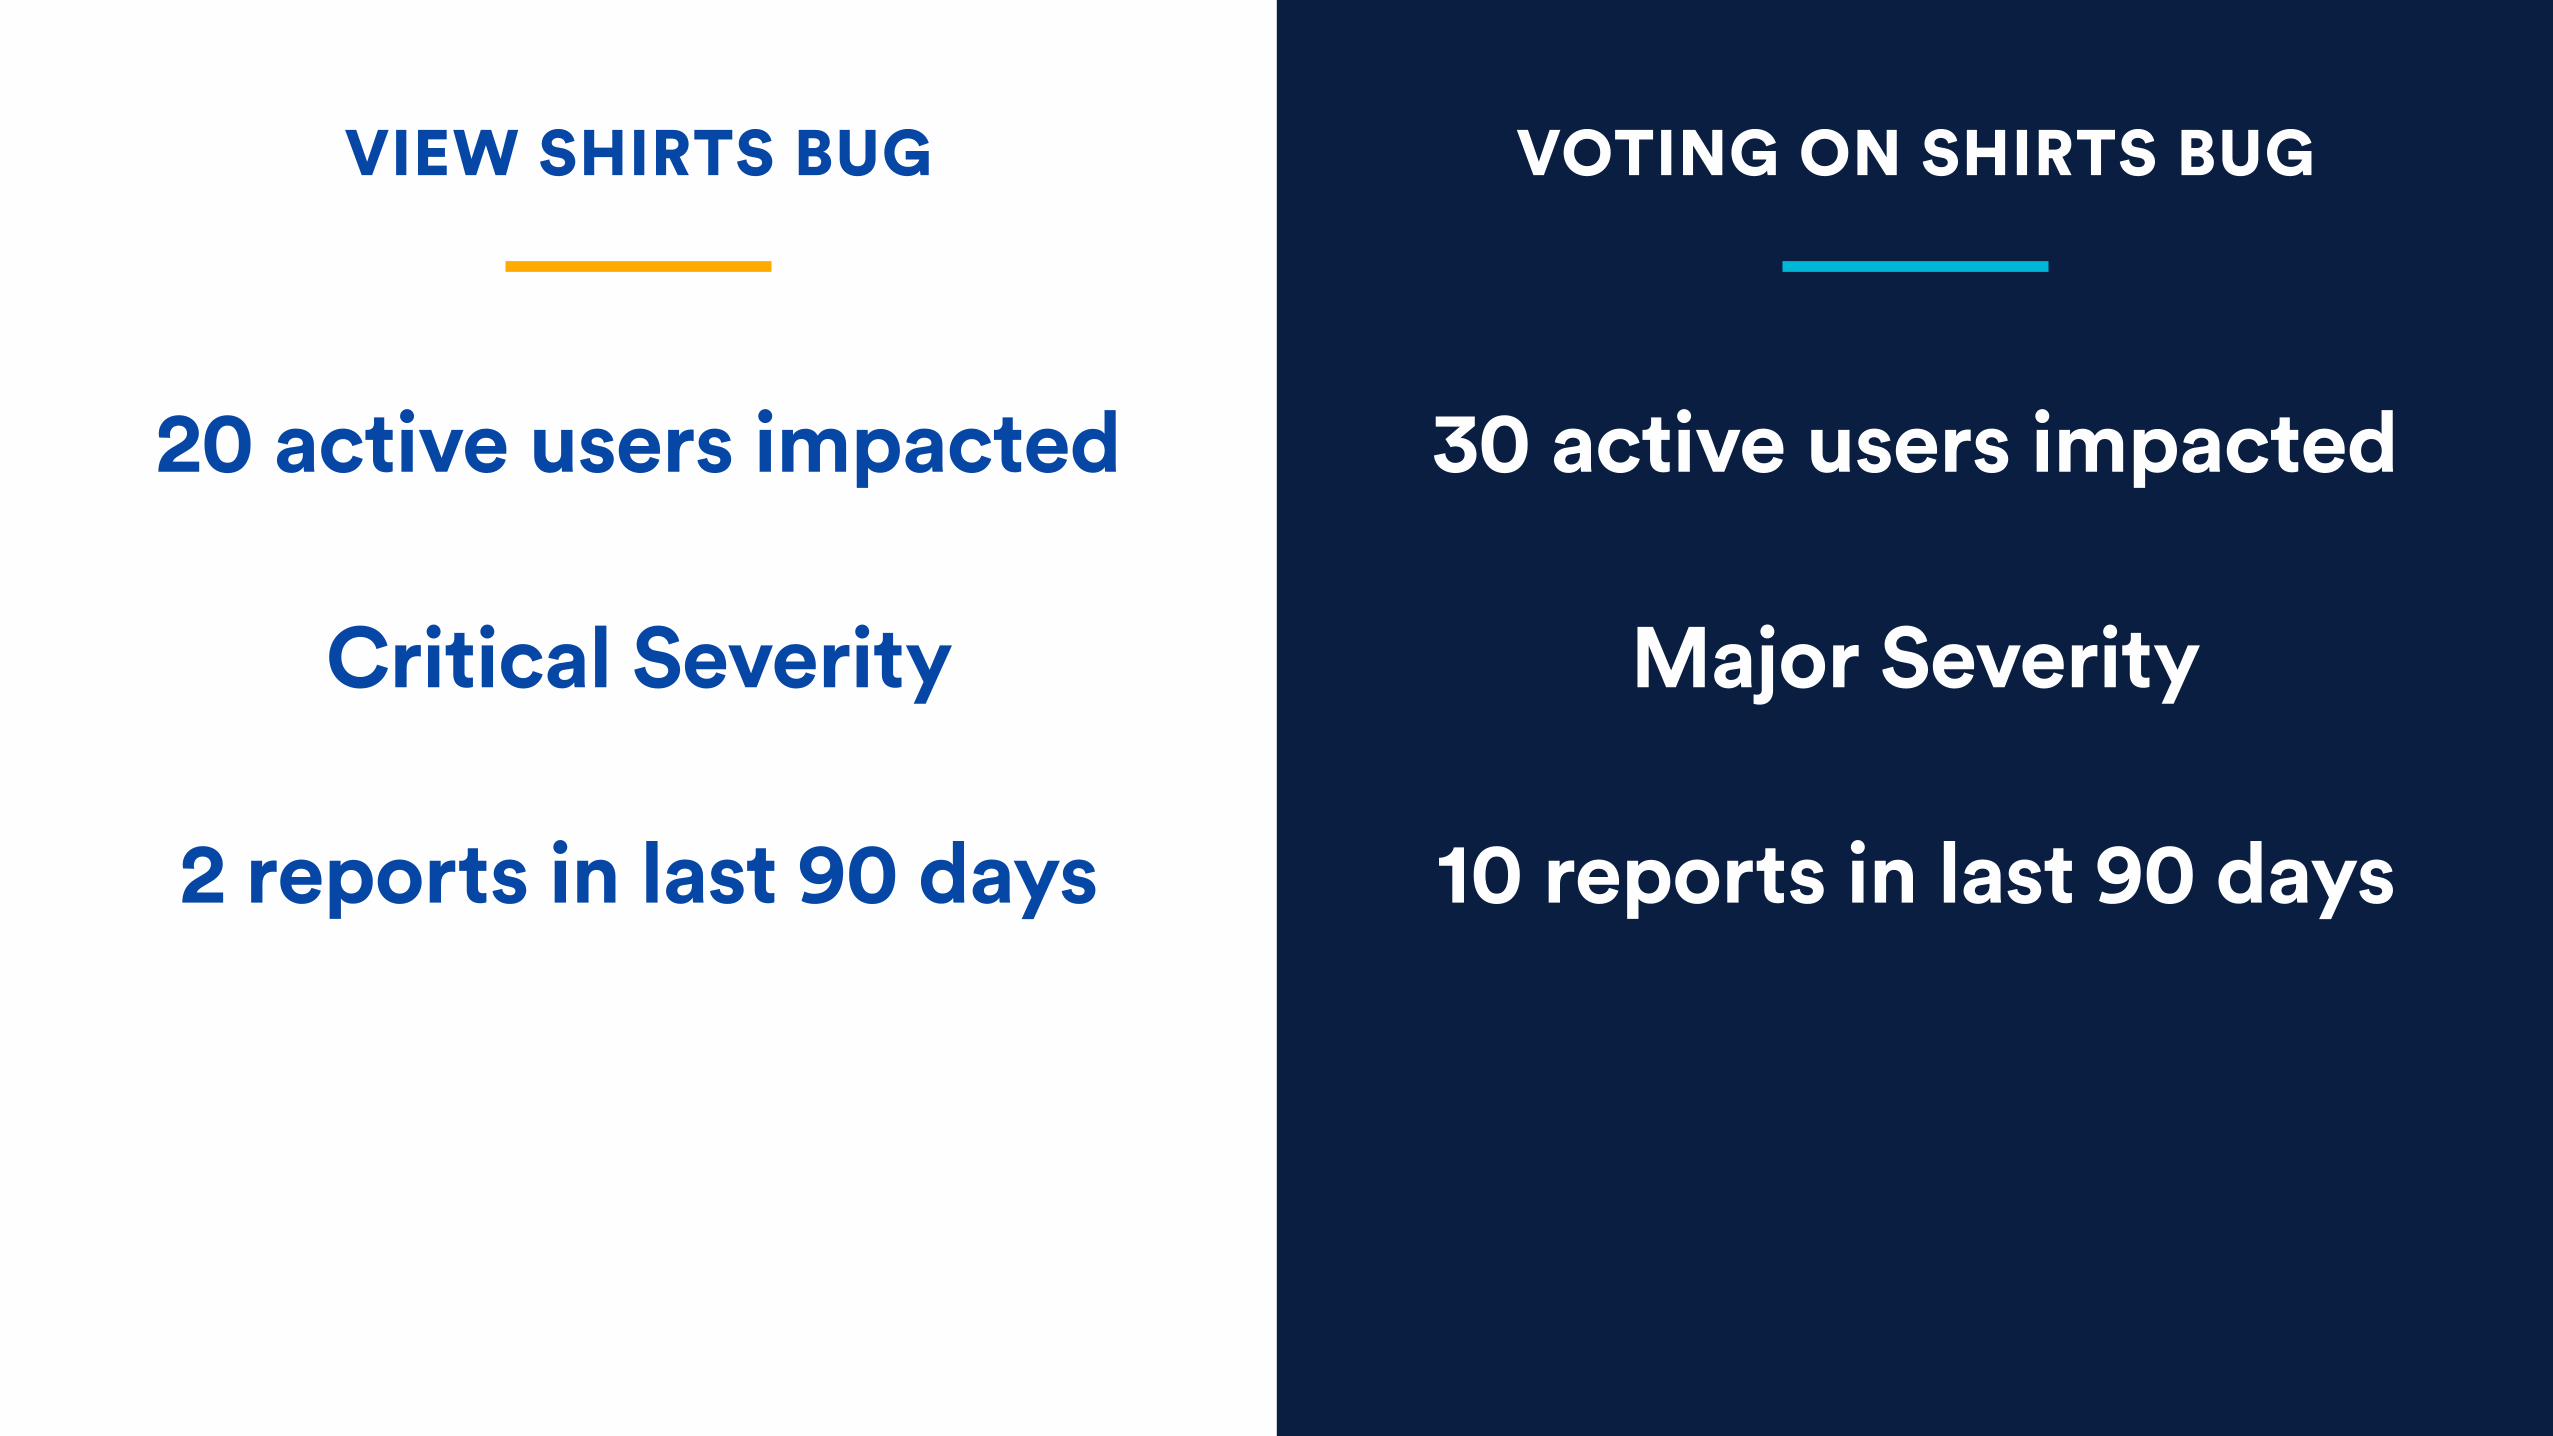
30 active users impacted
Major Severity
10 reports in last 90 days
20 active users impacted
Critical Severity
2 reports in last 90 days
VIEW SHIRTS BUG VOTING ON SHIRTS BUG

30 (users) x
4 (severity) x
10 (recency)
20 (users) x
8 (severity) x
2 (recency)
VIEW SHIRTS BUG VOTING ON SHIRTS BUG
= 320 = 1200

30 x 4 x 10
20 x 8 x 2
VIEW SHIRTS BUG VOTING ON SHIRTS BUG
3 UIS 12 UIS
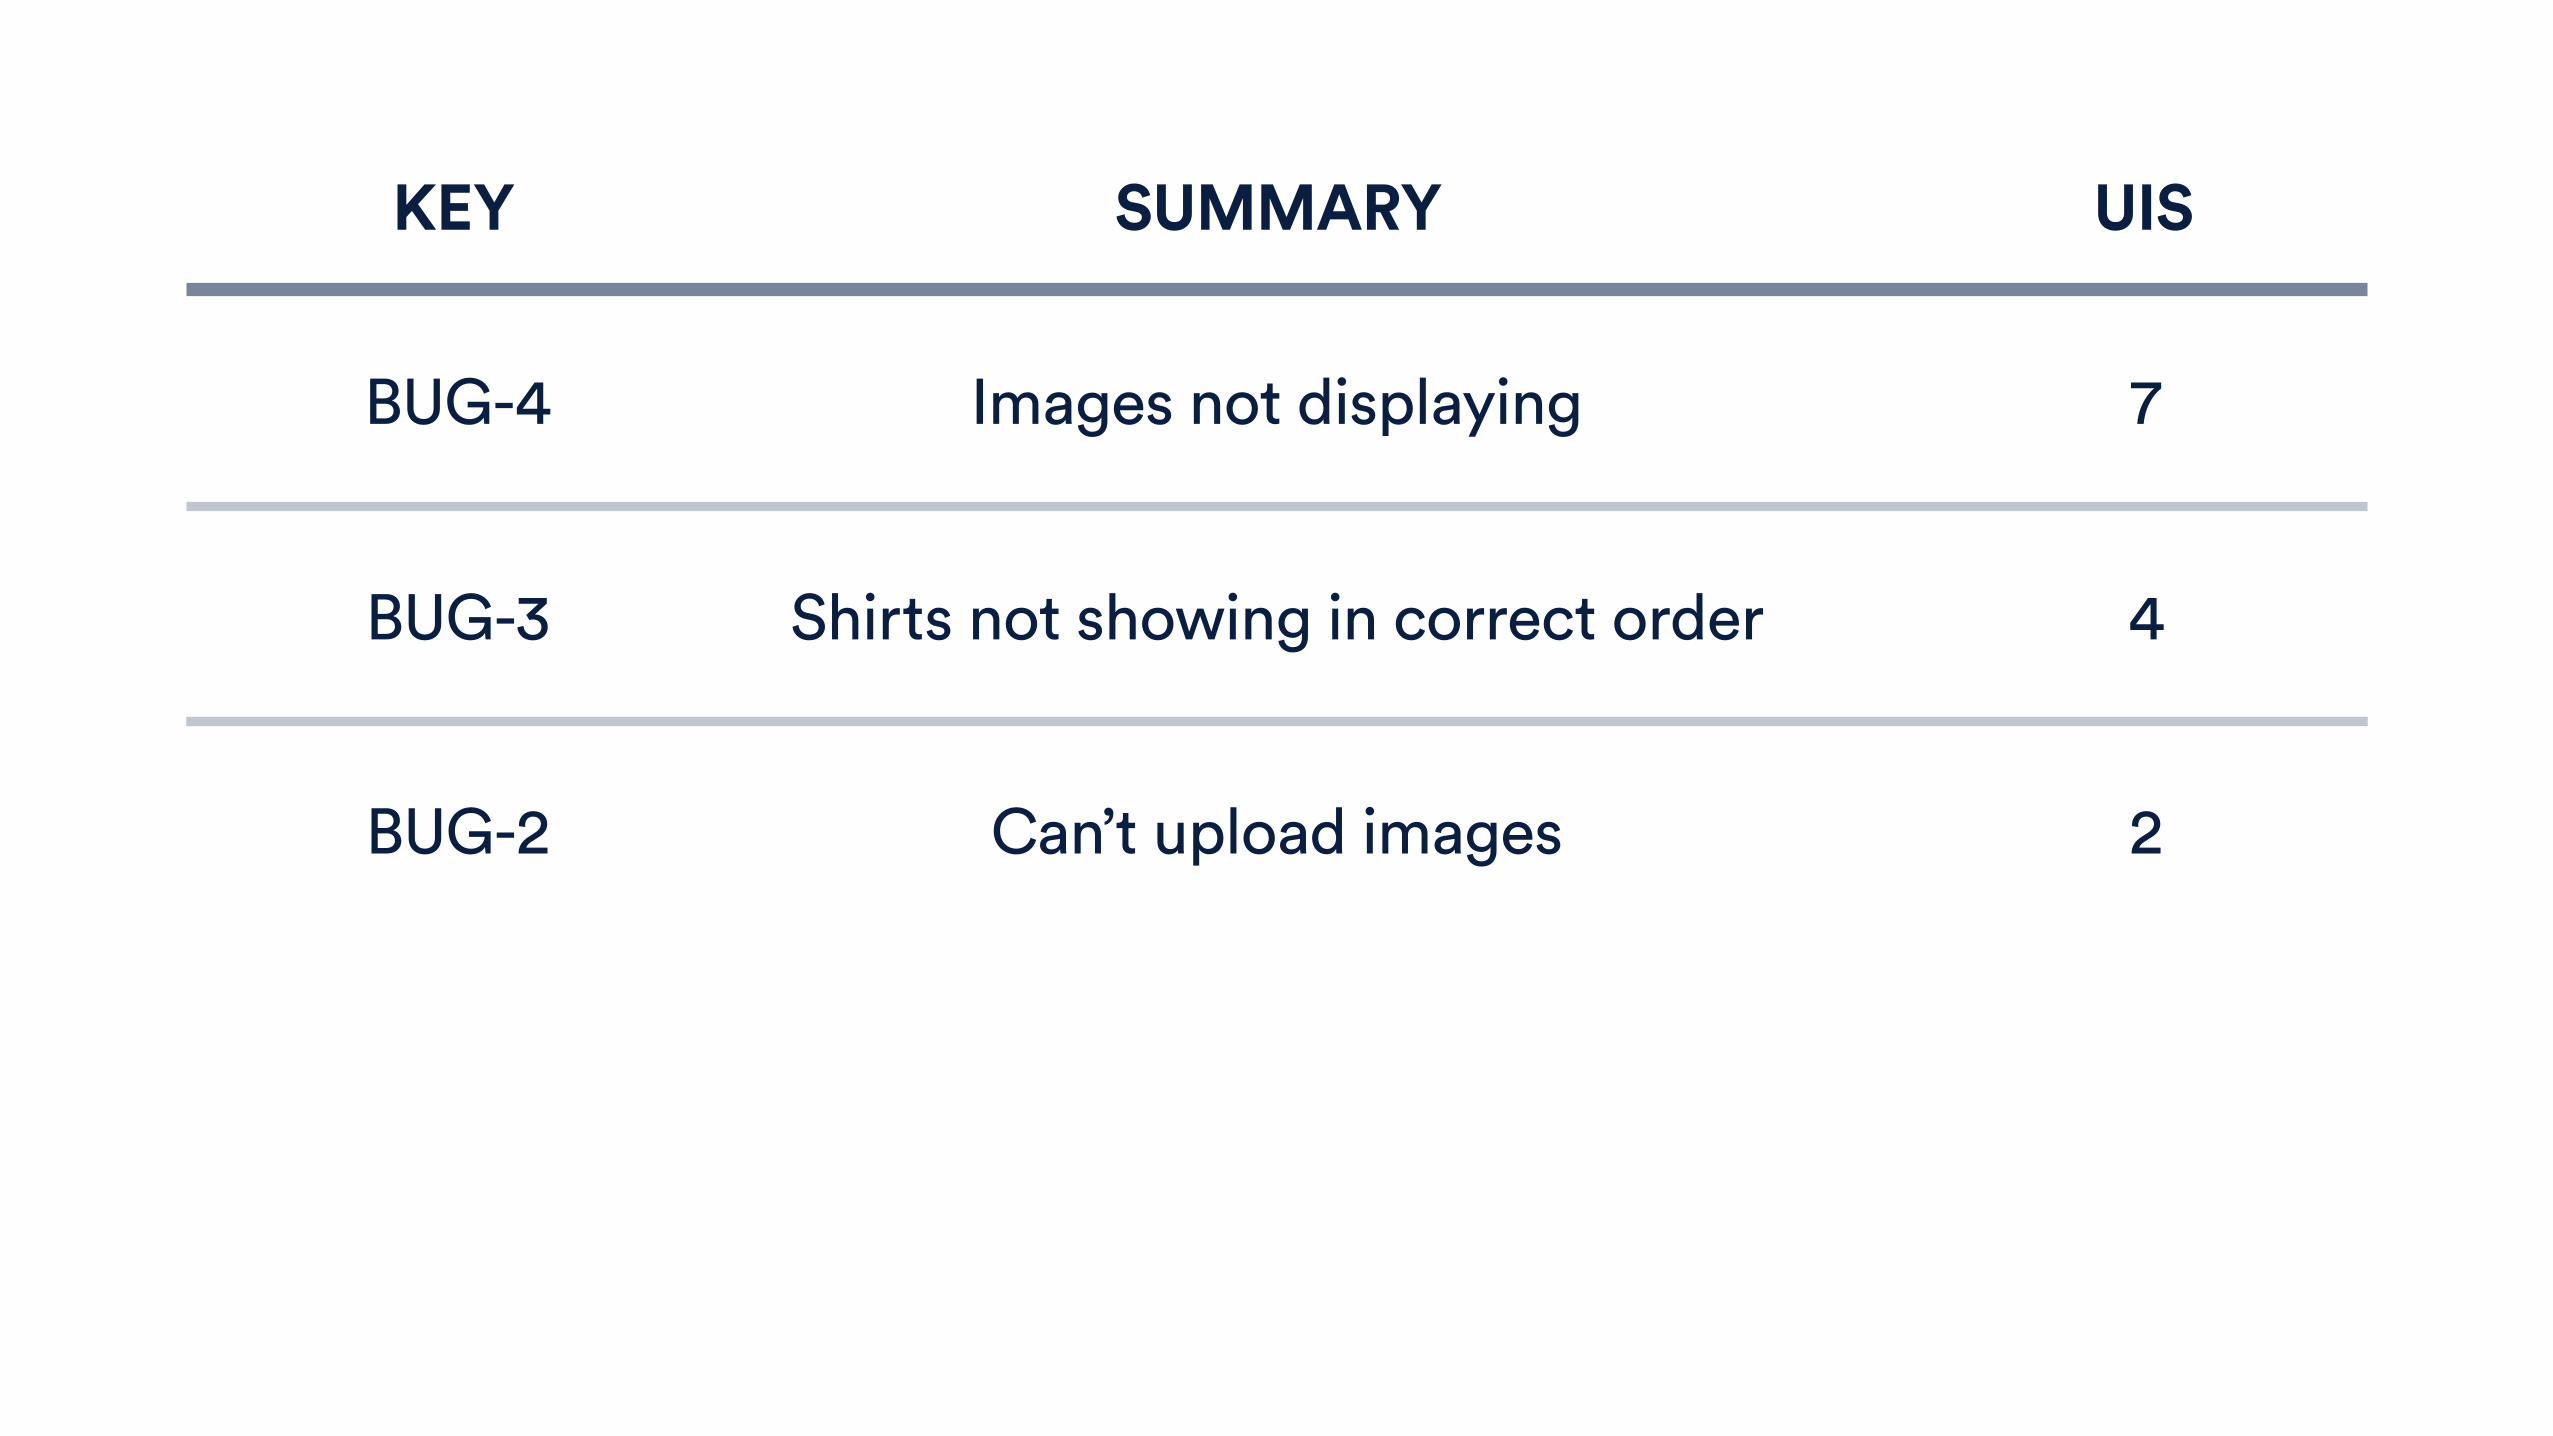
KEY SUMMARY UIS
BUG-4
BUG-3
Images not displaying 7
Shirts not showing in correct order 4
BUG-2 Can’t upload images 2
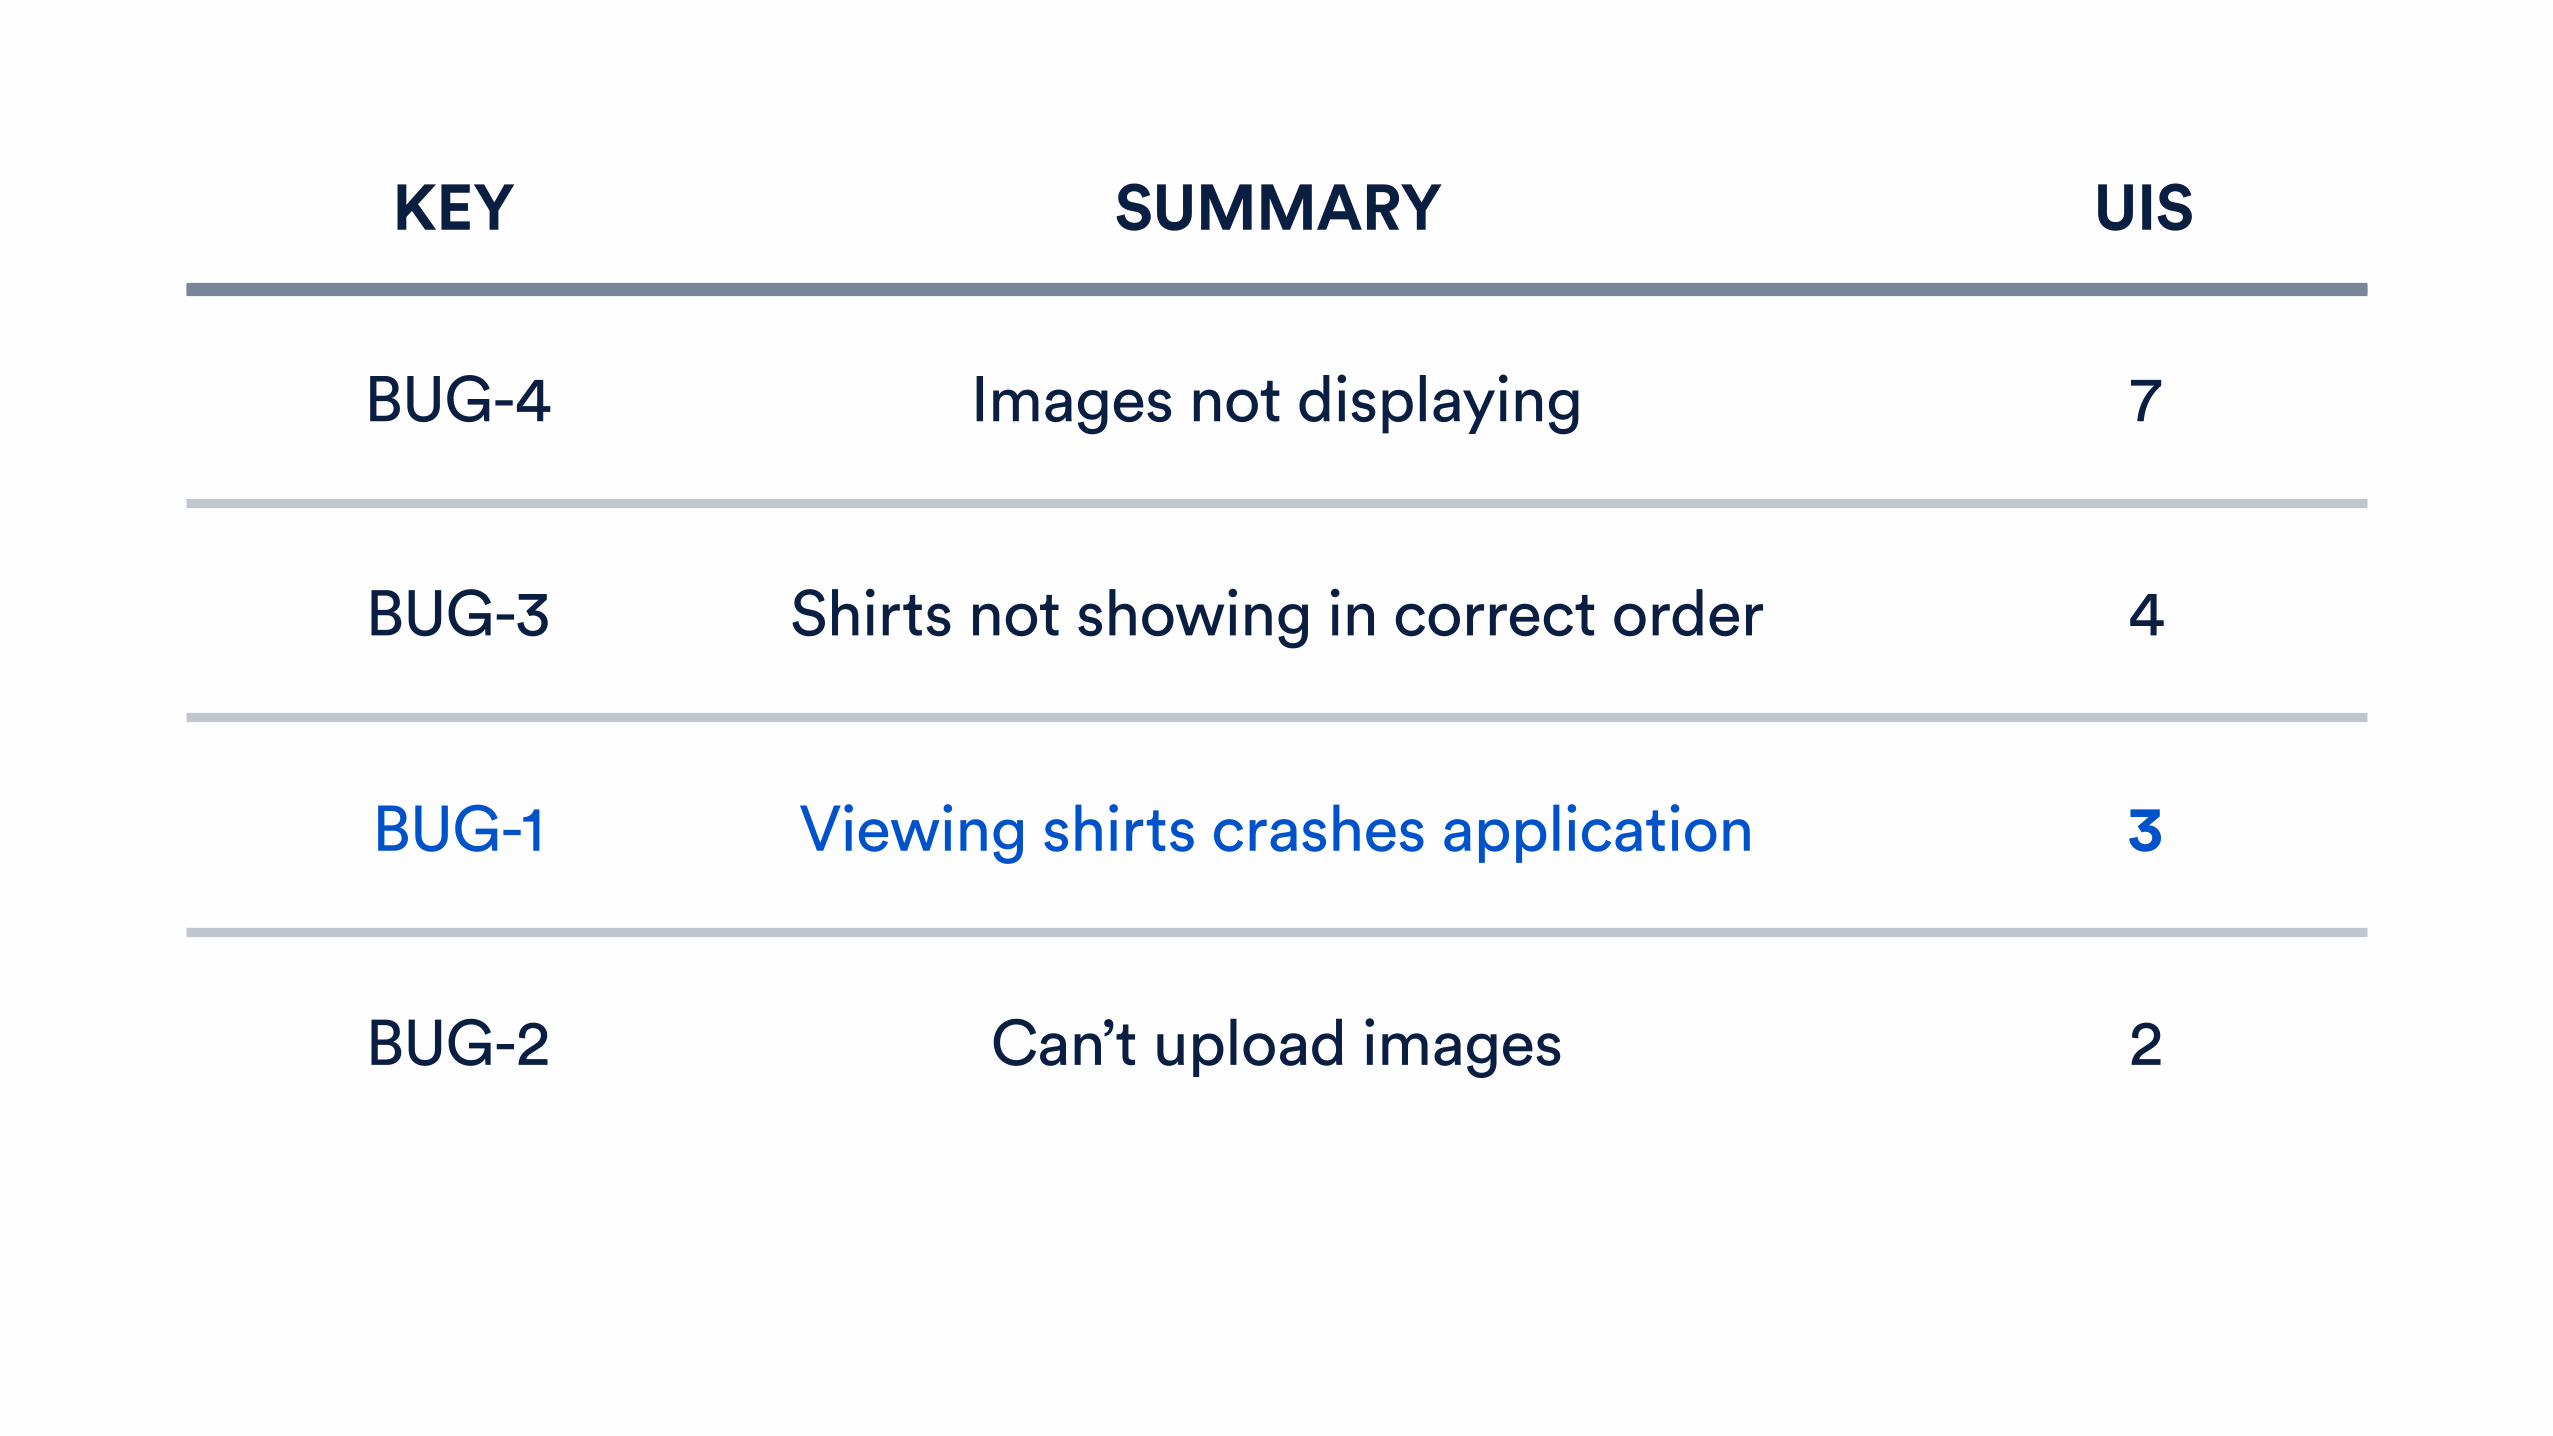
KEY SUMMARY UIS
BUG-4 Images not displaying 7
BUG-3
BUG-1
Shirts not showing in correct order 4
Viewing shirts crashes application 3
BUG-2 Can’t upload images 2
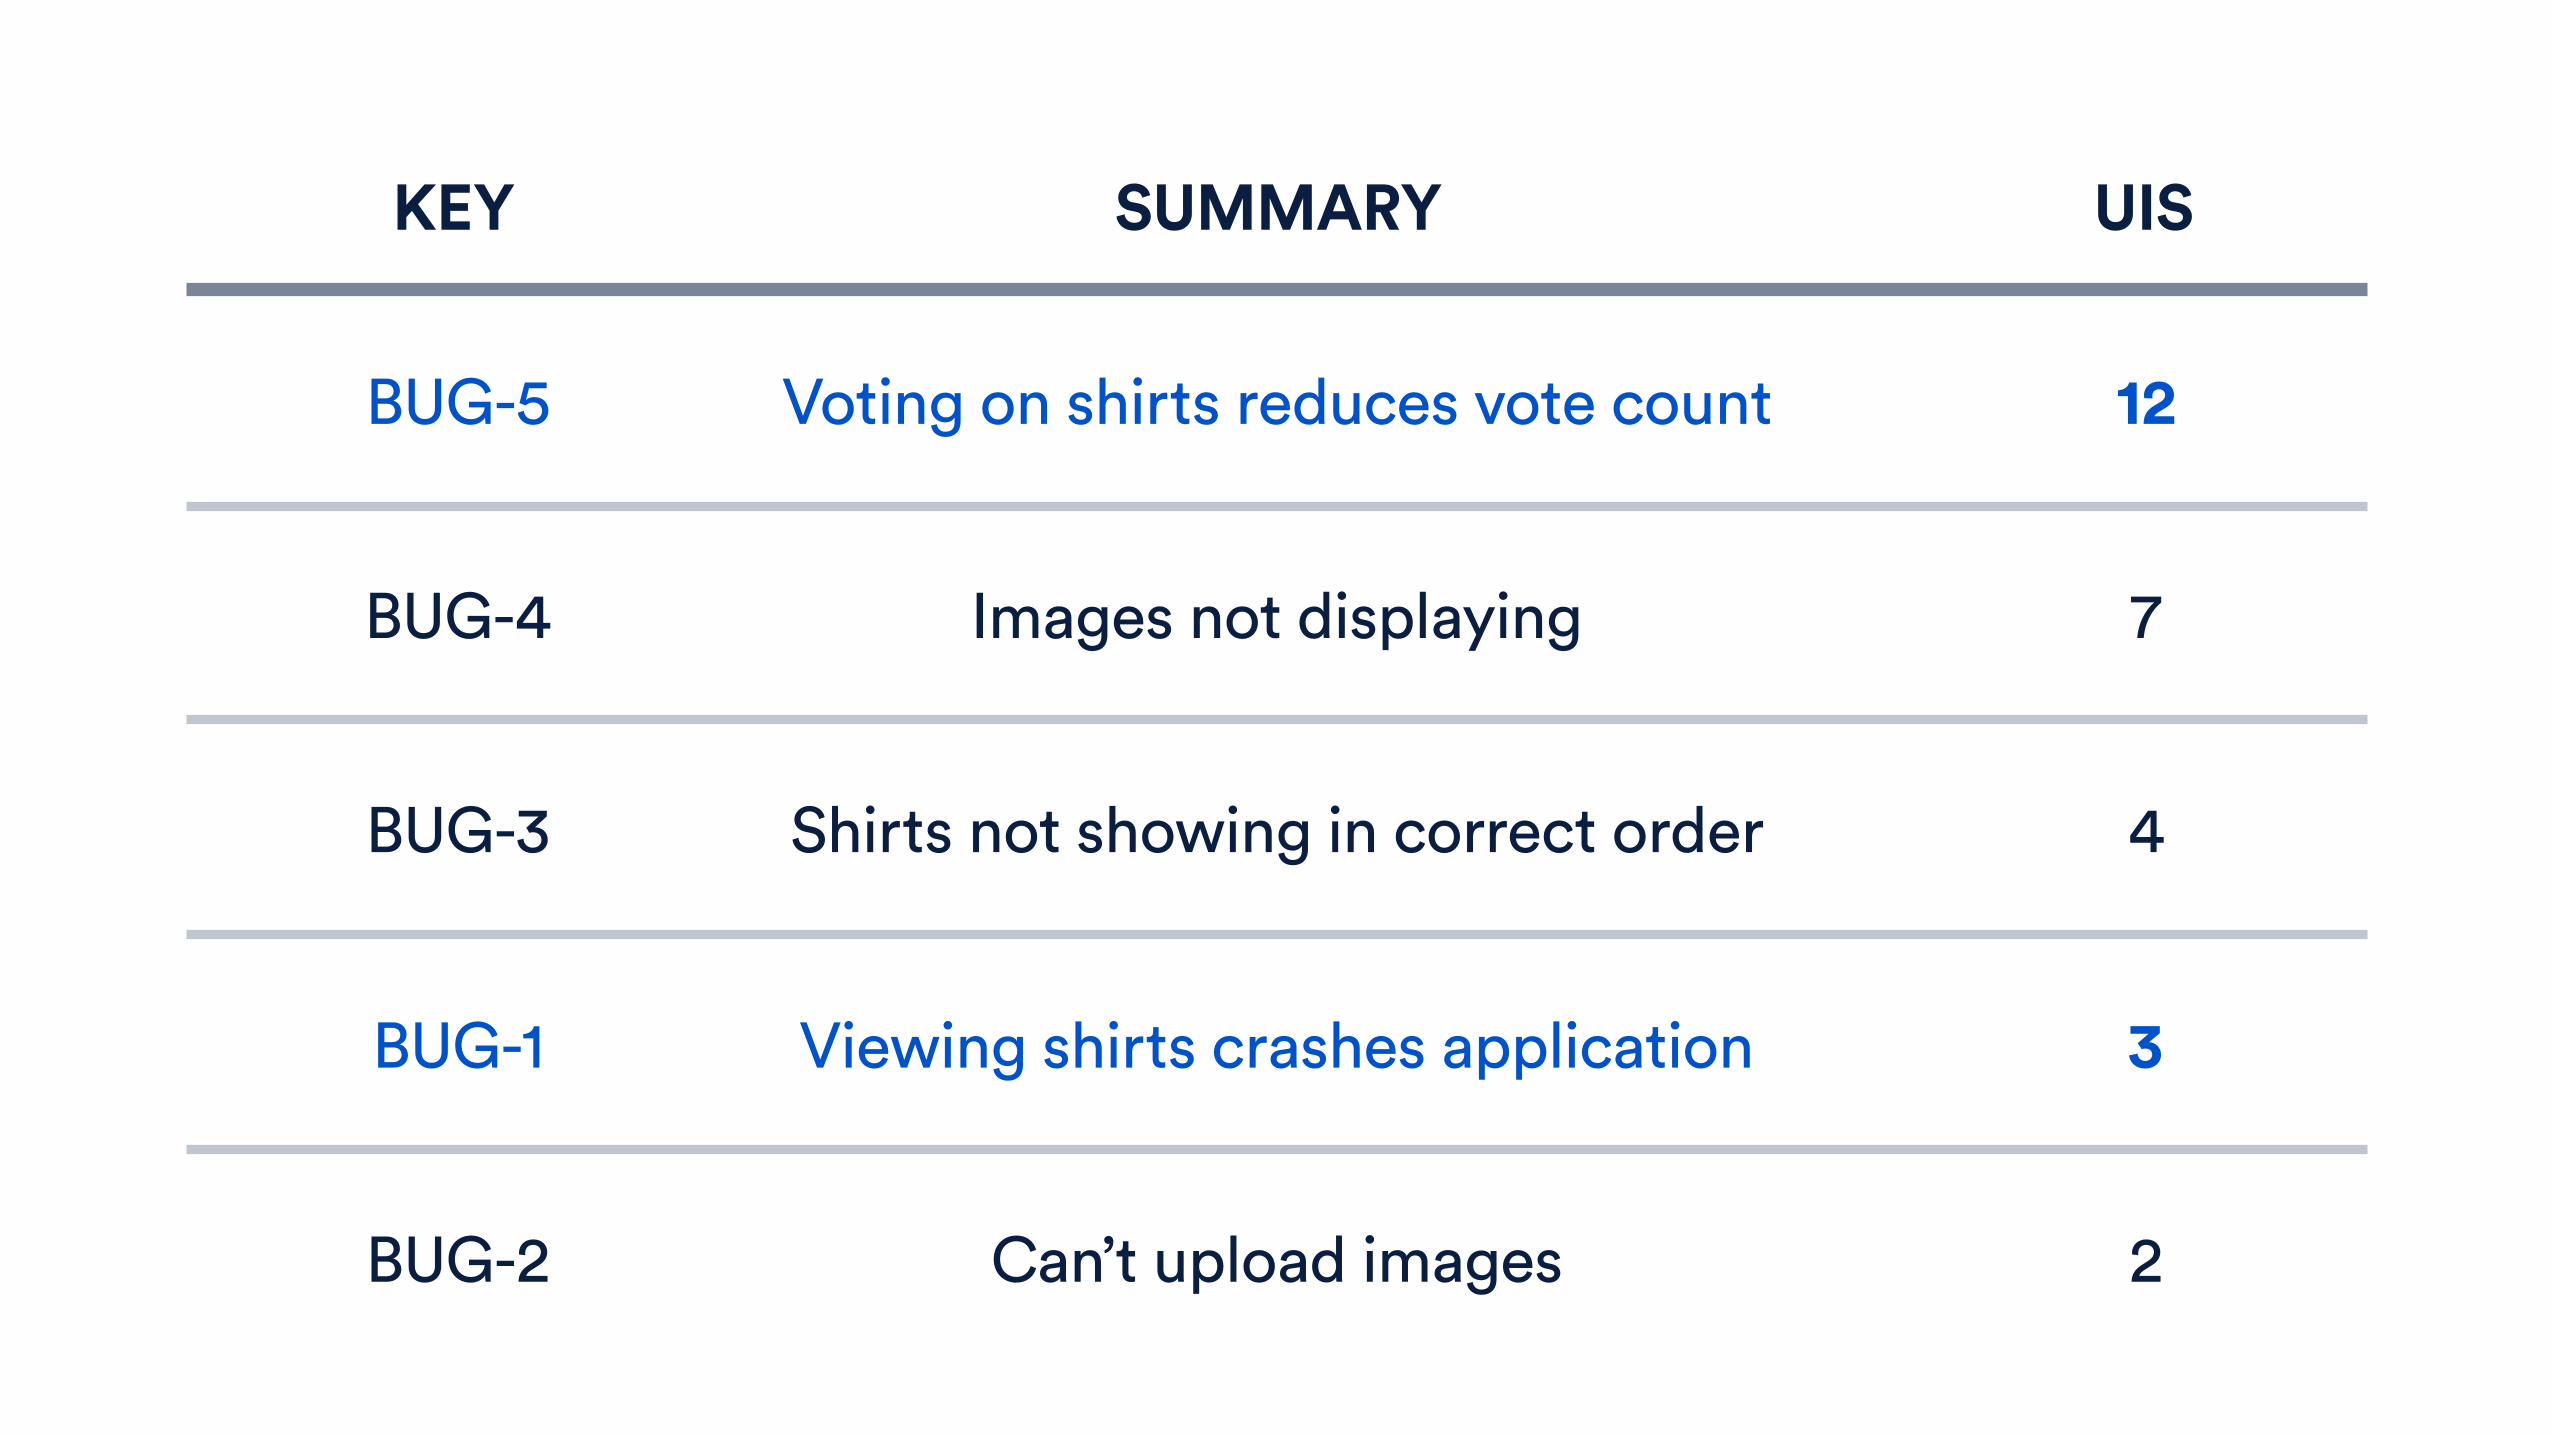
KEY SUMMARY UIS
BUG-4 Images not displaying 7
BUG-3
BUG-1
Shirts not showing in correct order 4
Viewing shirts crashes application 3
BUG-2 Can’t upload images 2
BUG-5 Voting on shirts reduces vote count 12

After Alignment on which bugs are the most
important, bug master always grabs the issue with the highest UIS.
Before Frequent disagreement on the highest
bug priorities and what to work on next.
Bug Ranking Rollouts
Support Insights
SHIRT VOTE
JIRA Service Desk2015
ShipIt 302015
40,000 Customers2014
Game of Codes2014
200 votes
180 votes
120 votes
80 votes
SHIRT VOTE
JIRA Service Desk2015
ShipIt 302015
40,000 Customers2014
Game of Codes2014
200 votes
180 votes
120 votes
80 votes
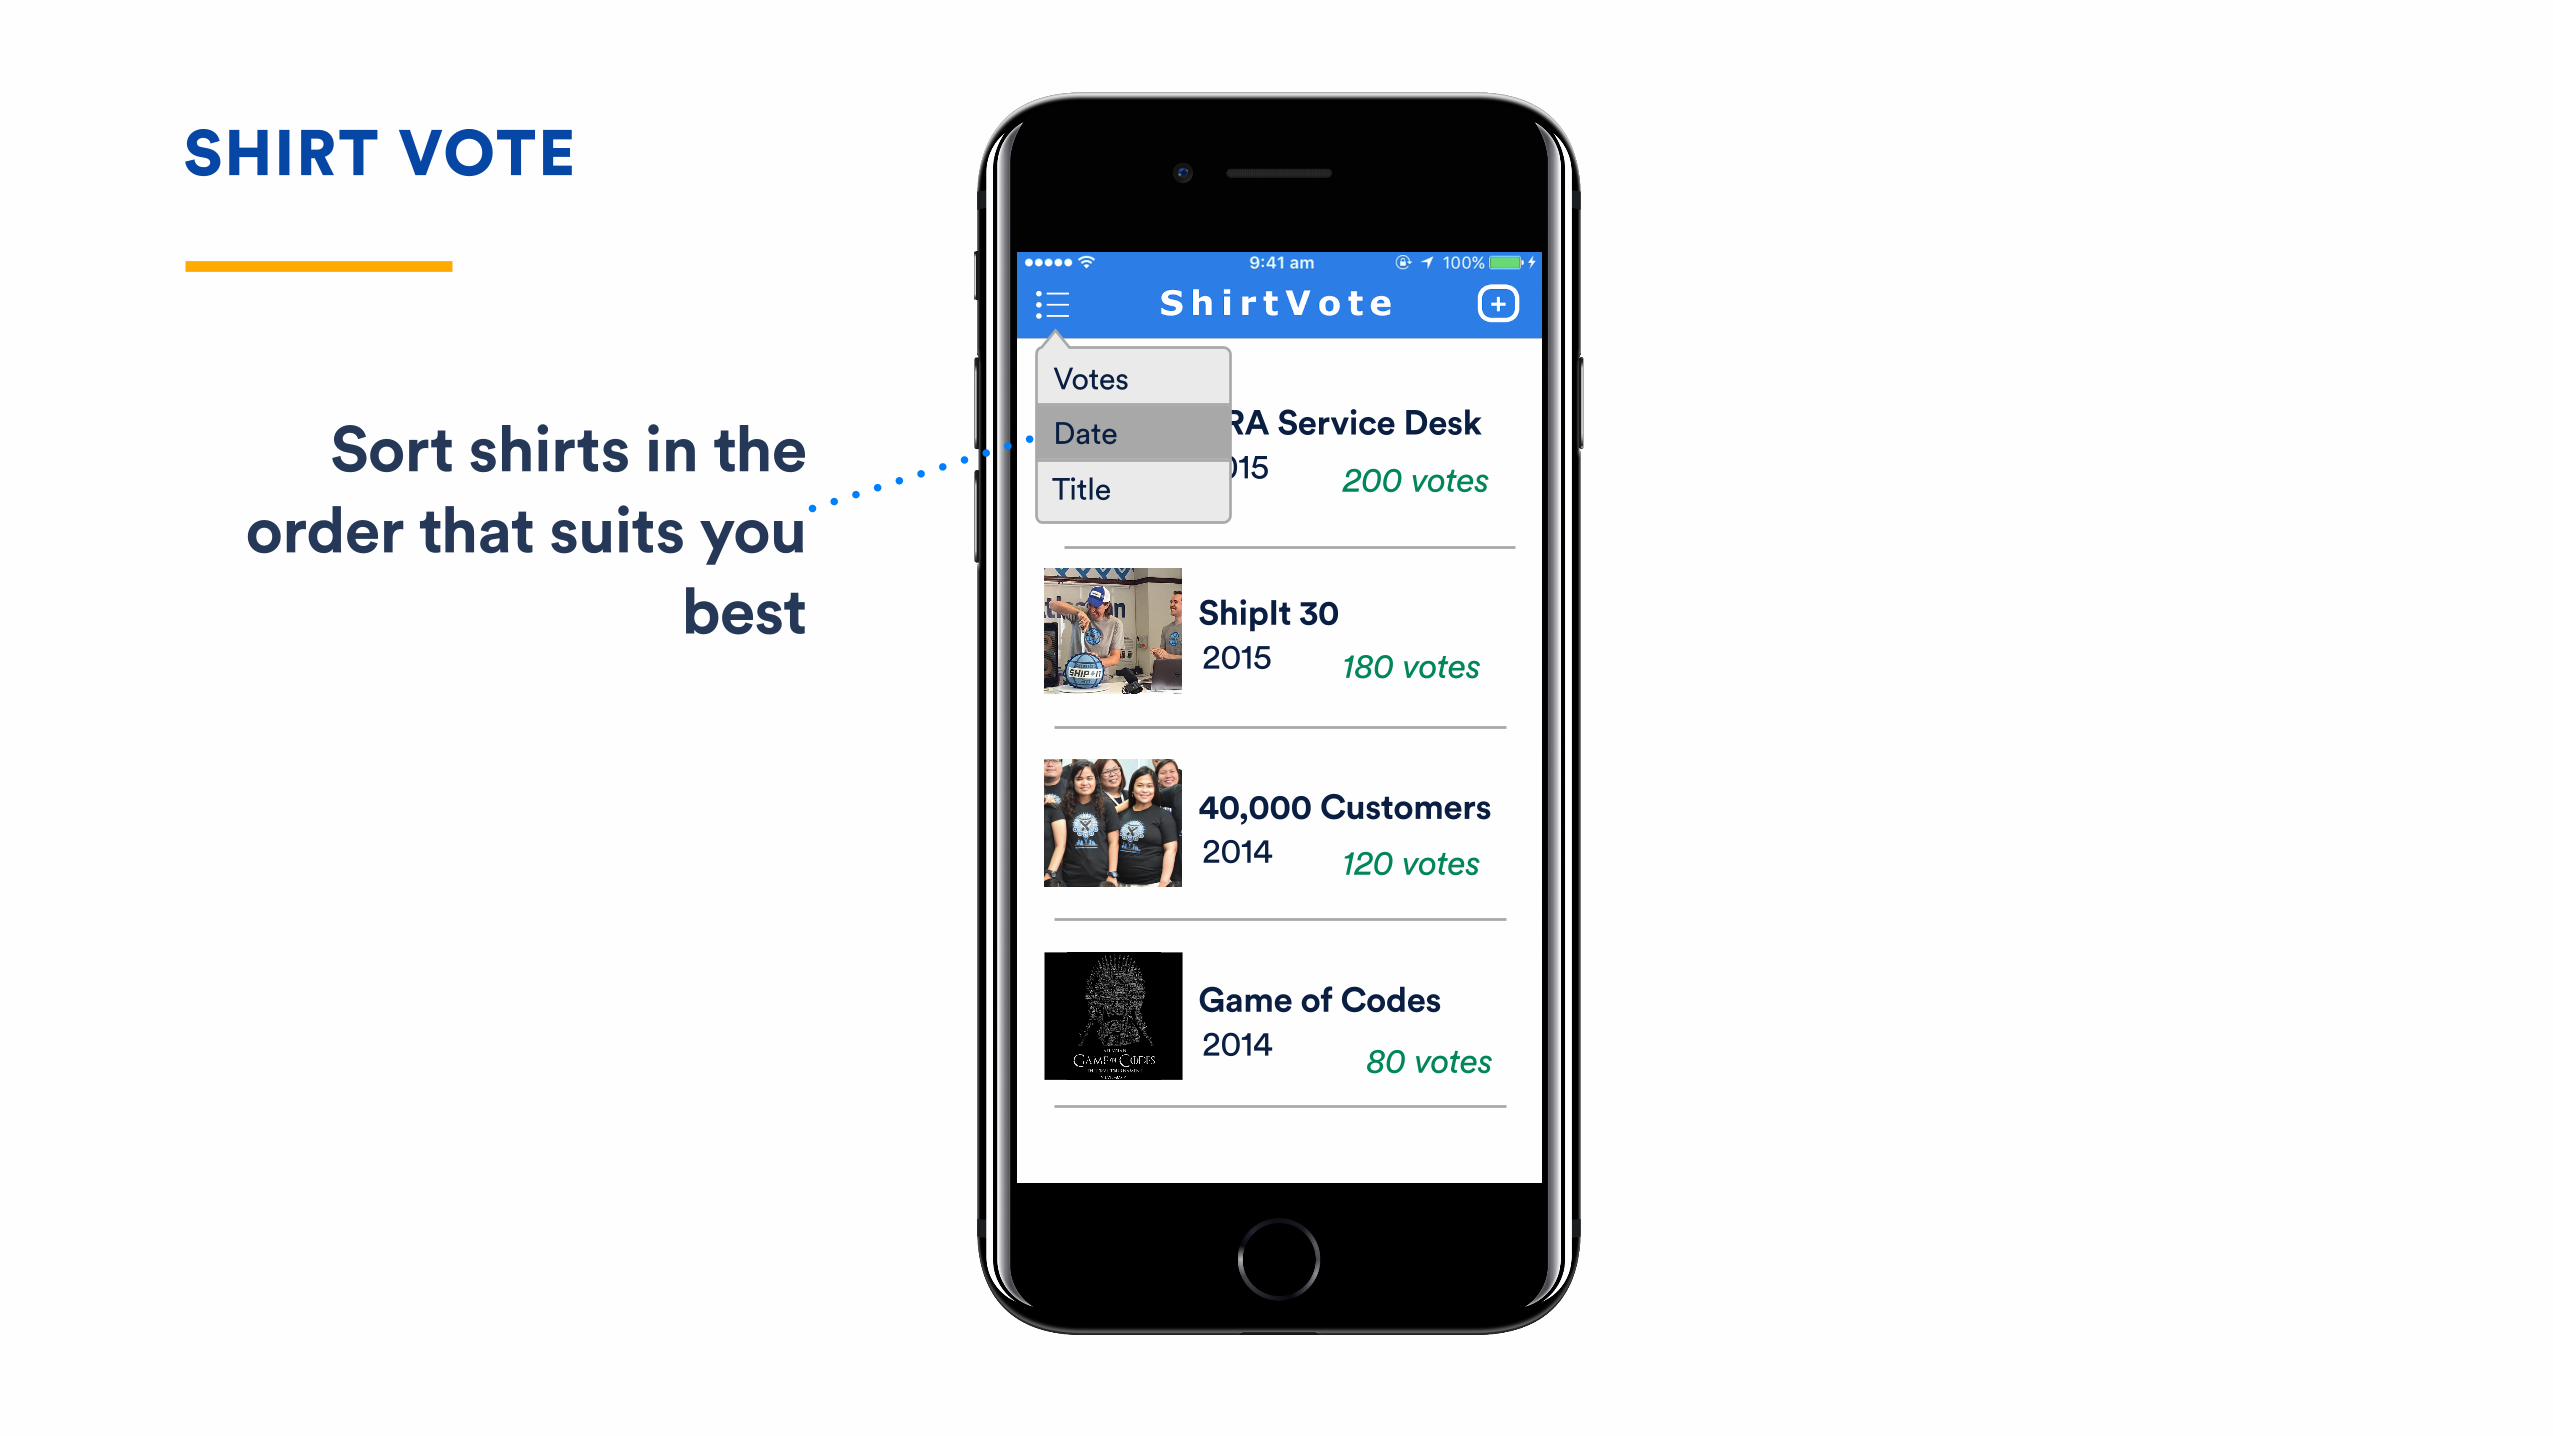
Votes
Title
DateSort shirts in the order that suits you
best
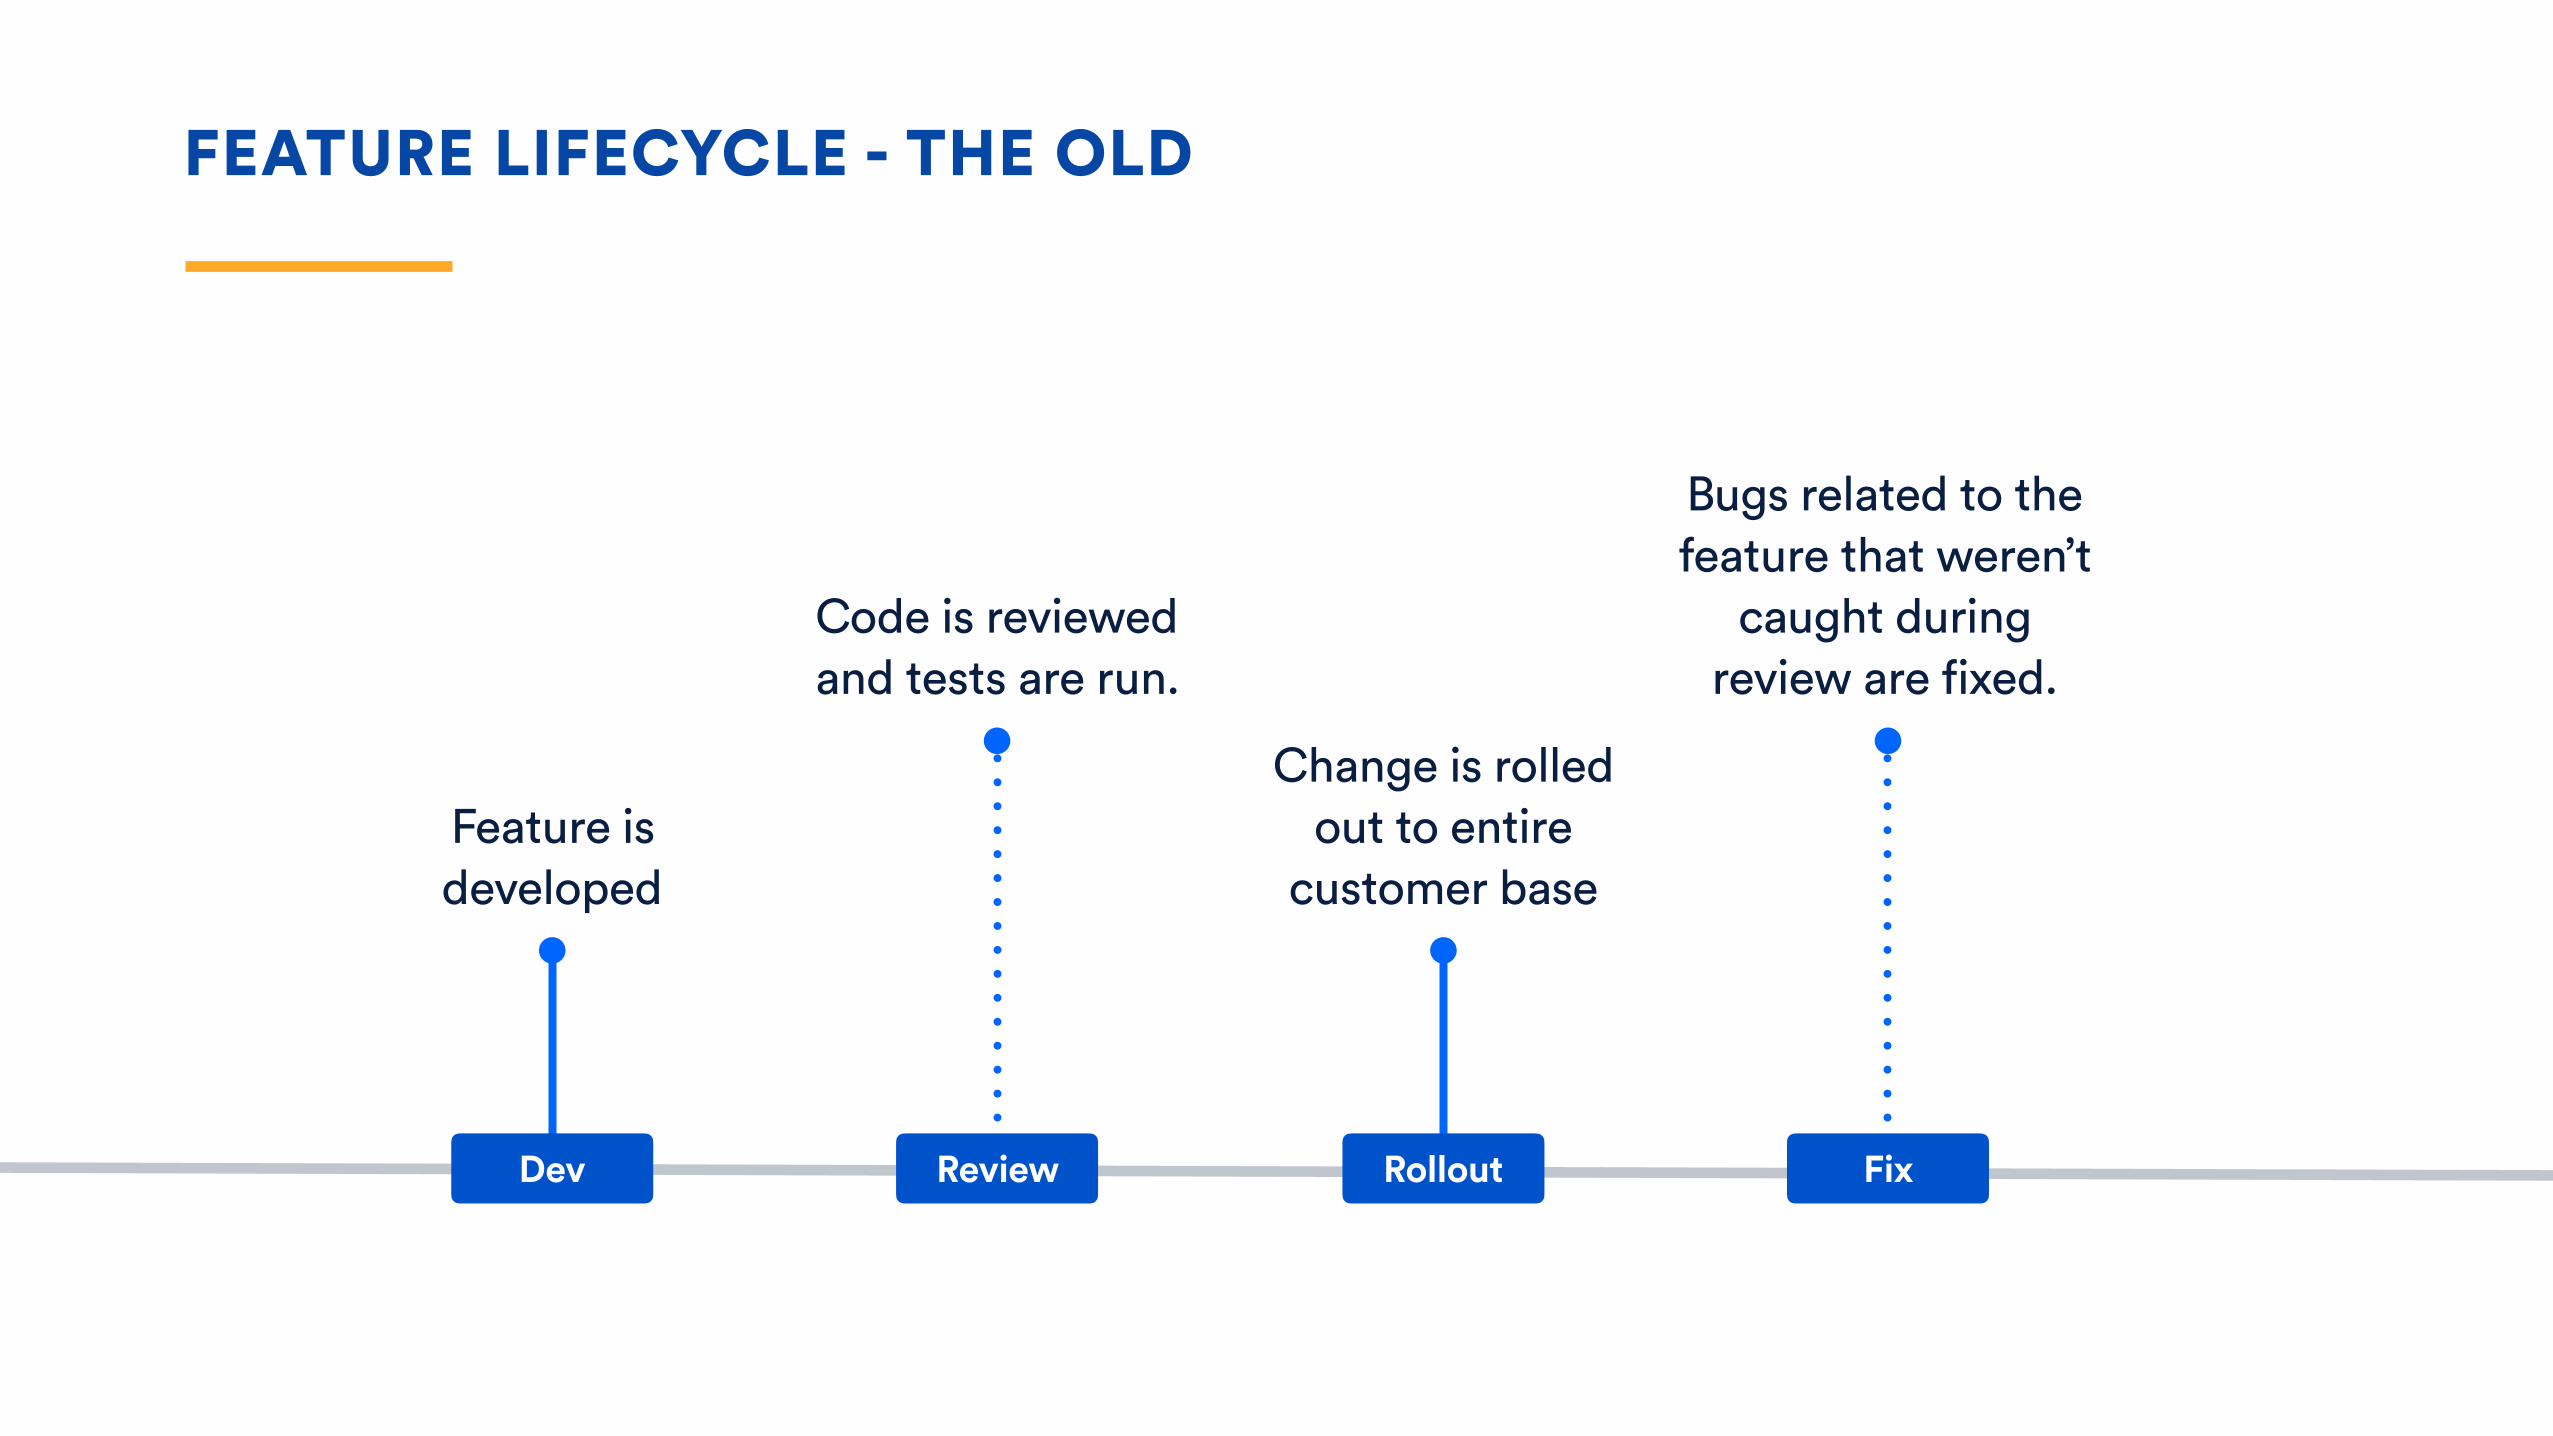
FEATURE LIFECYCLE - THE OLD
Feature is developed
Code is reviewed and tests are run.
Change is rolled out to entire
customer base
Bugs related to the feature that weren’t
caught during review are fixed.
Dev Review Rollout Fix

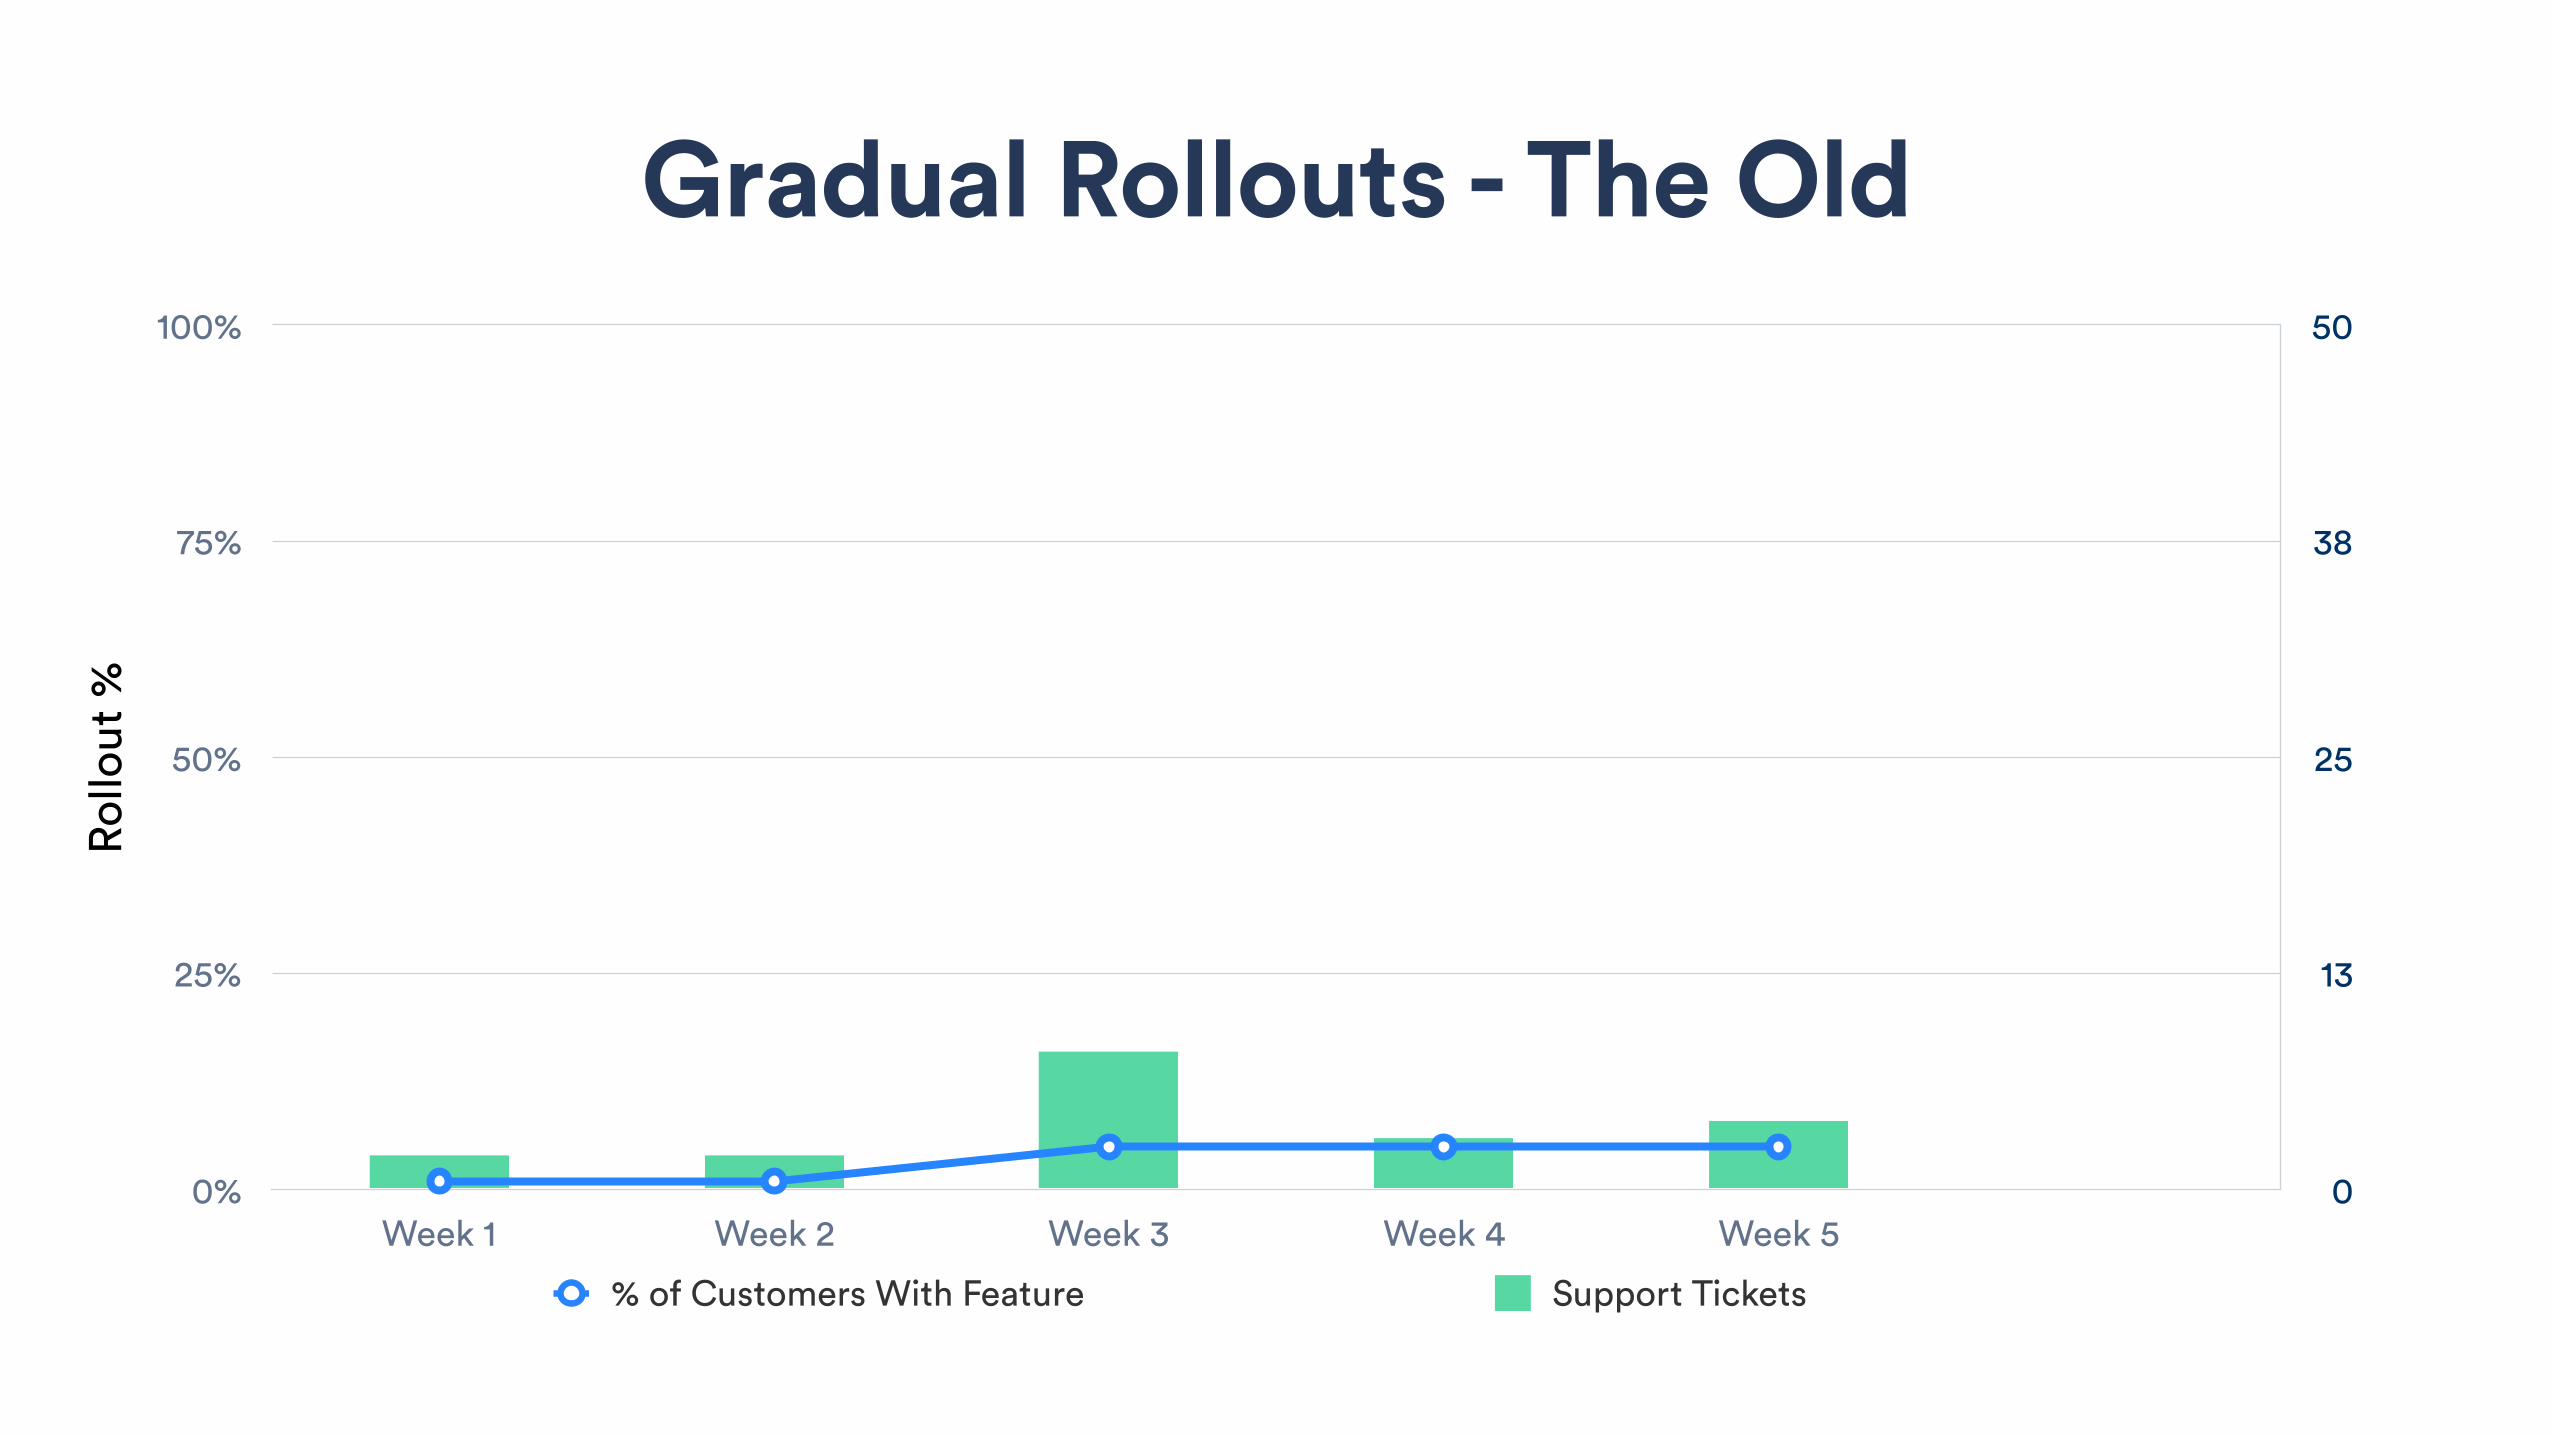
Gradual Rollouts - The Old
0
13
25
38
50
Rollo
ut %
0%
25%
50%
75%
100%
Week 1 Week 2 Week 3 Week 4 Week 5
% of Customers With Feature Support Tickets

SHIRT VOTE
JIRA Service Desk2015
ShipIt 302015
40,000 Customers2014
Game of Codes2014
200 votes
180 votes
120 votes
80 votes
Votes
Date
Title

SHIRT VOTE
Gradual Rollouts - The Old
0
13
25
38
50
Rollo
ut %
0%
25%
50%
75%
100%
Week 1 Week 2 Week 3 Week 4 Week 5
% of Customers With Feature Support Tickets

Gradual Rollouts - The Old
0
13
25
38
50
Rollo
ut %
0%
25%
50%
75%
100%
Week 1 Week 2 Week 3 Week 4 Week 5 Week 6
% of Customers With Feature Support Tickets

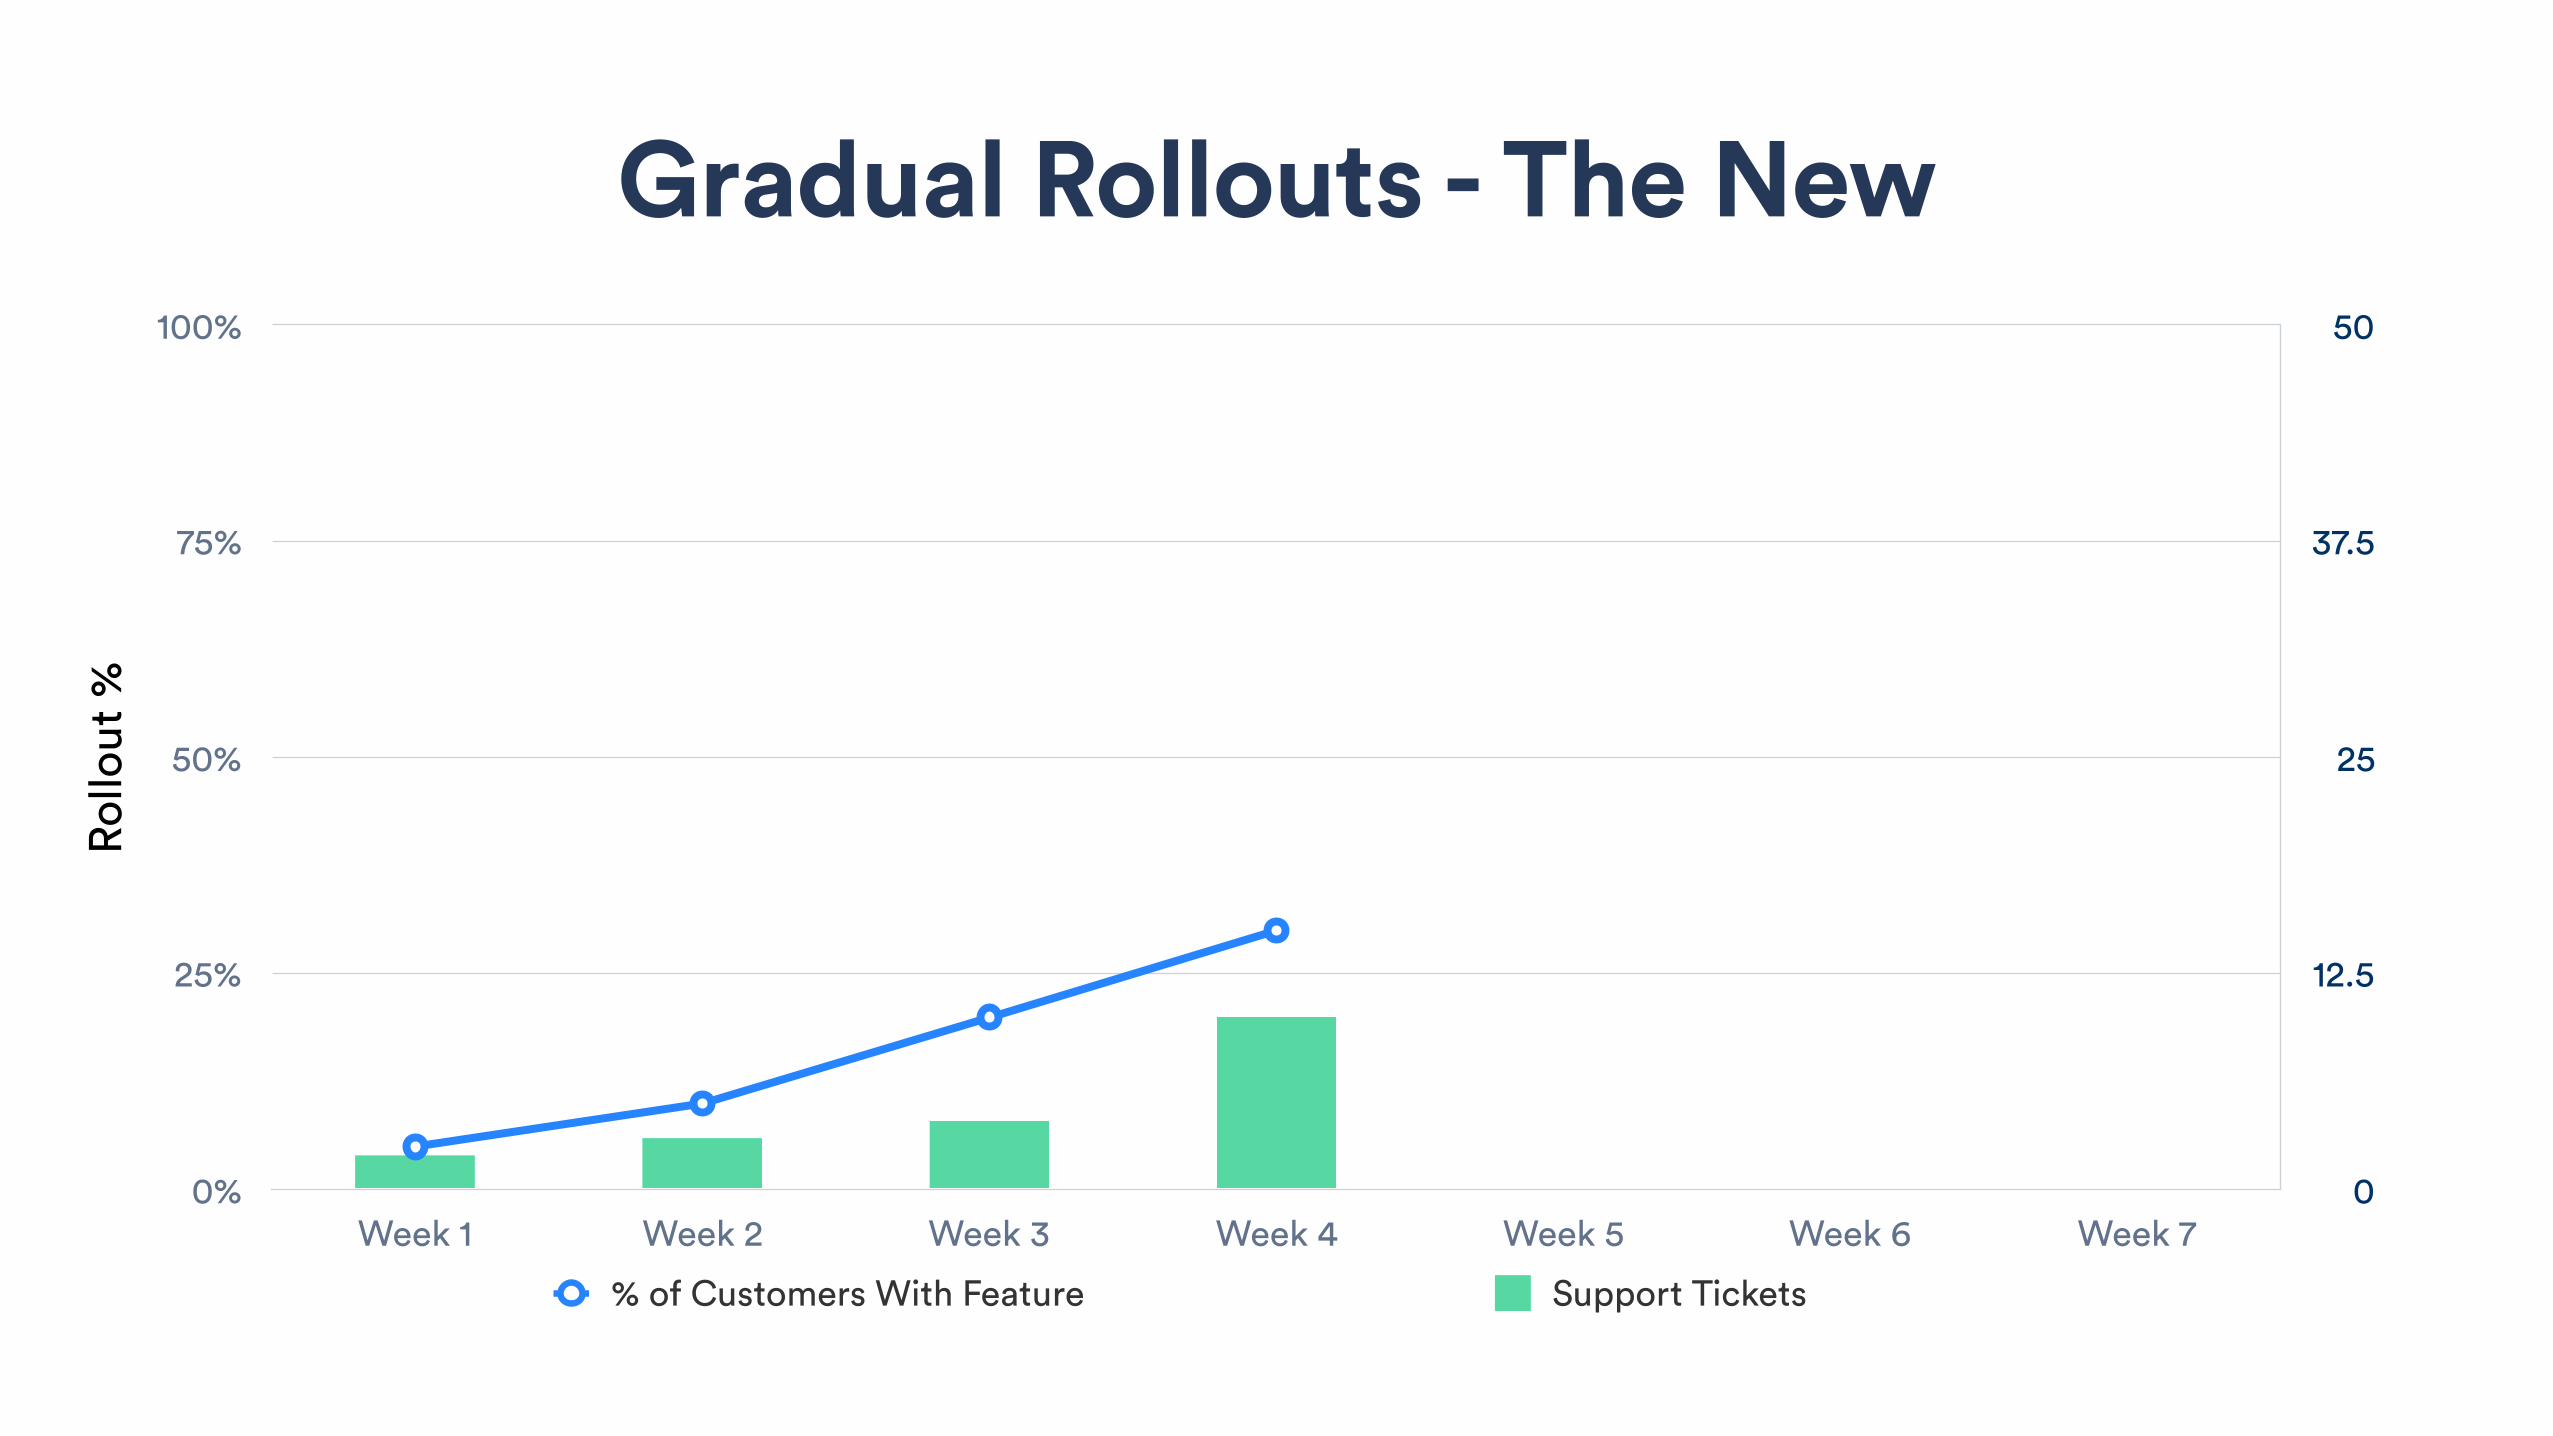
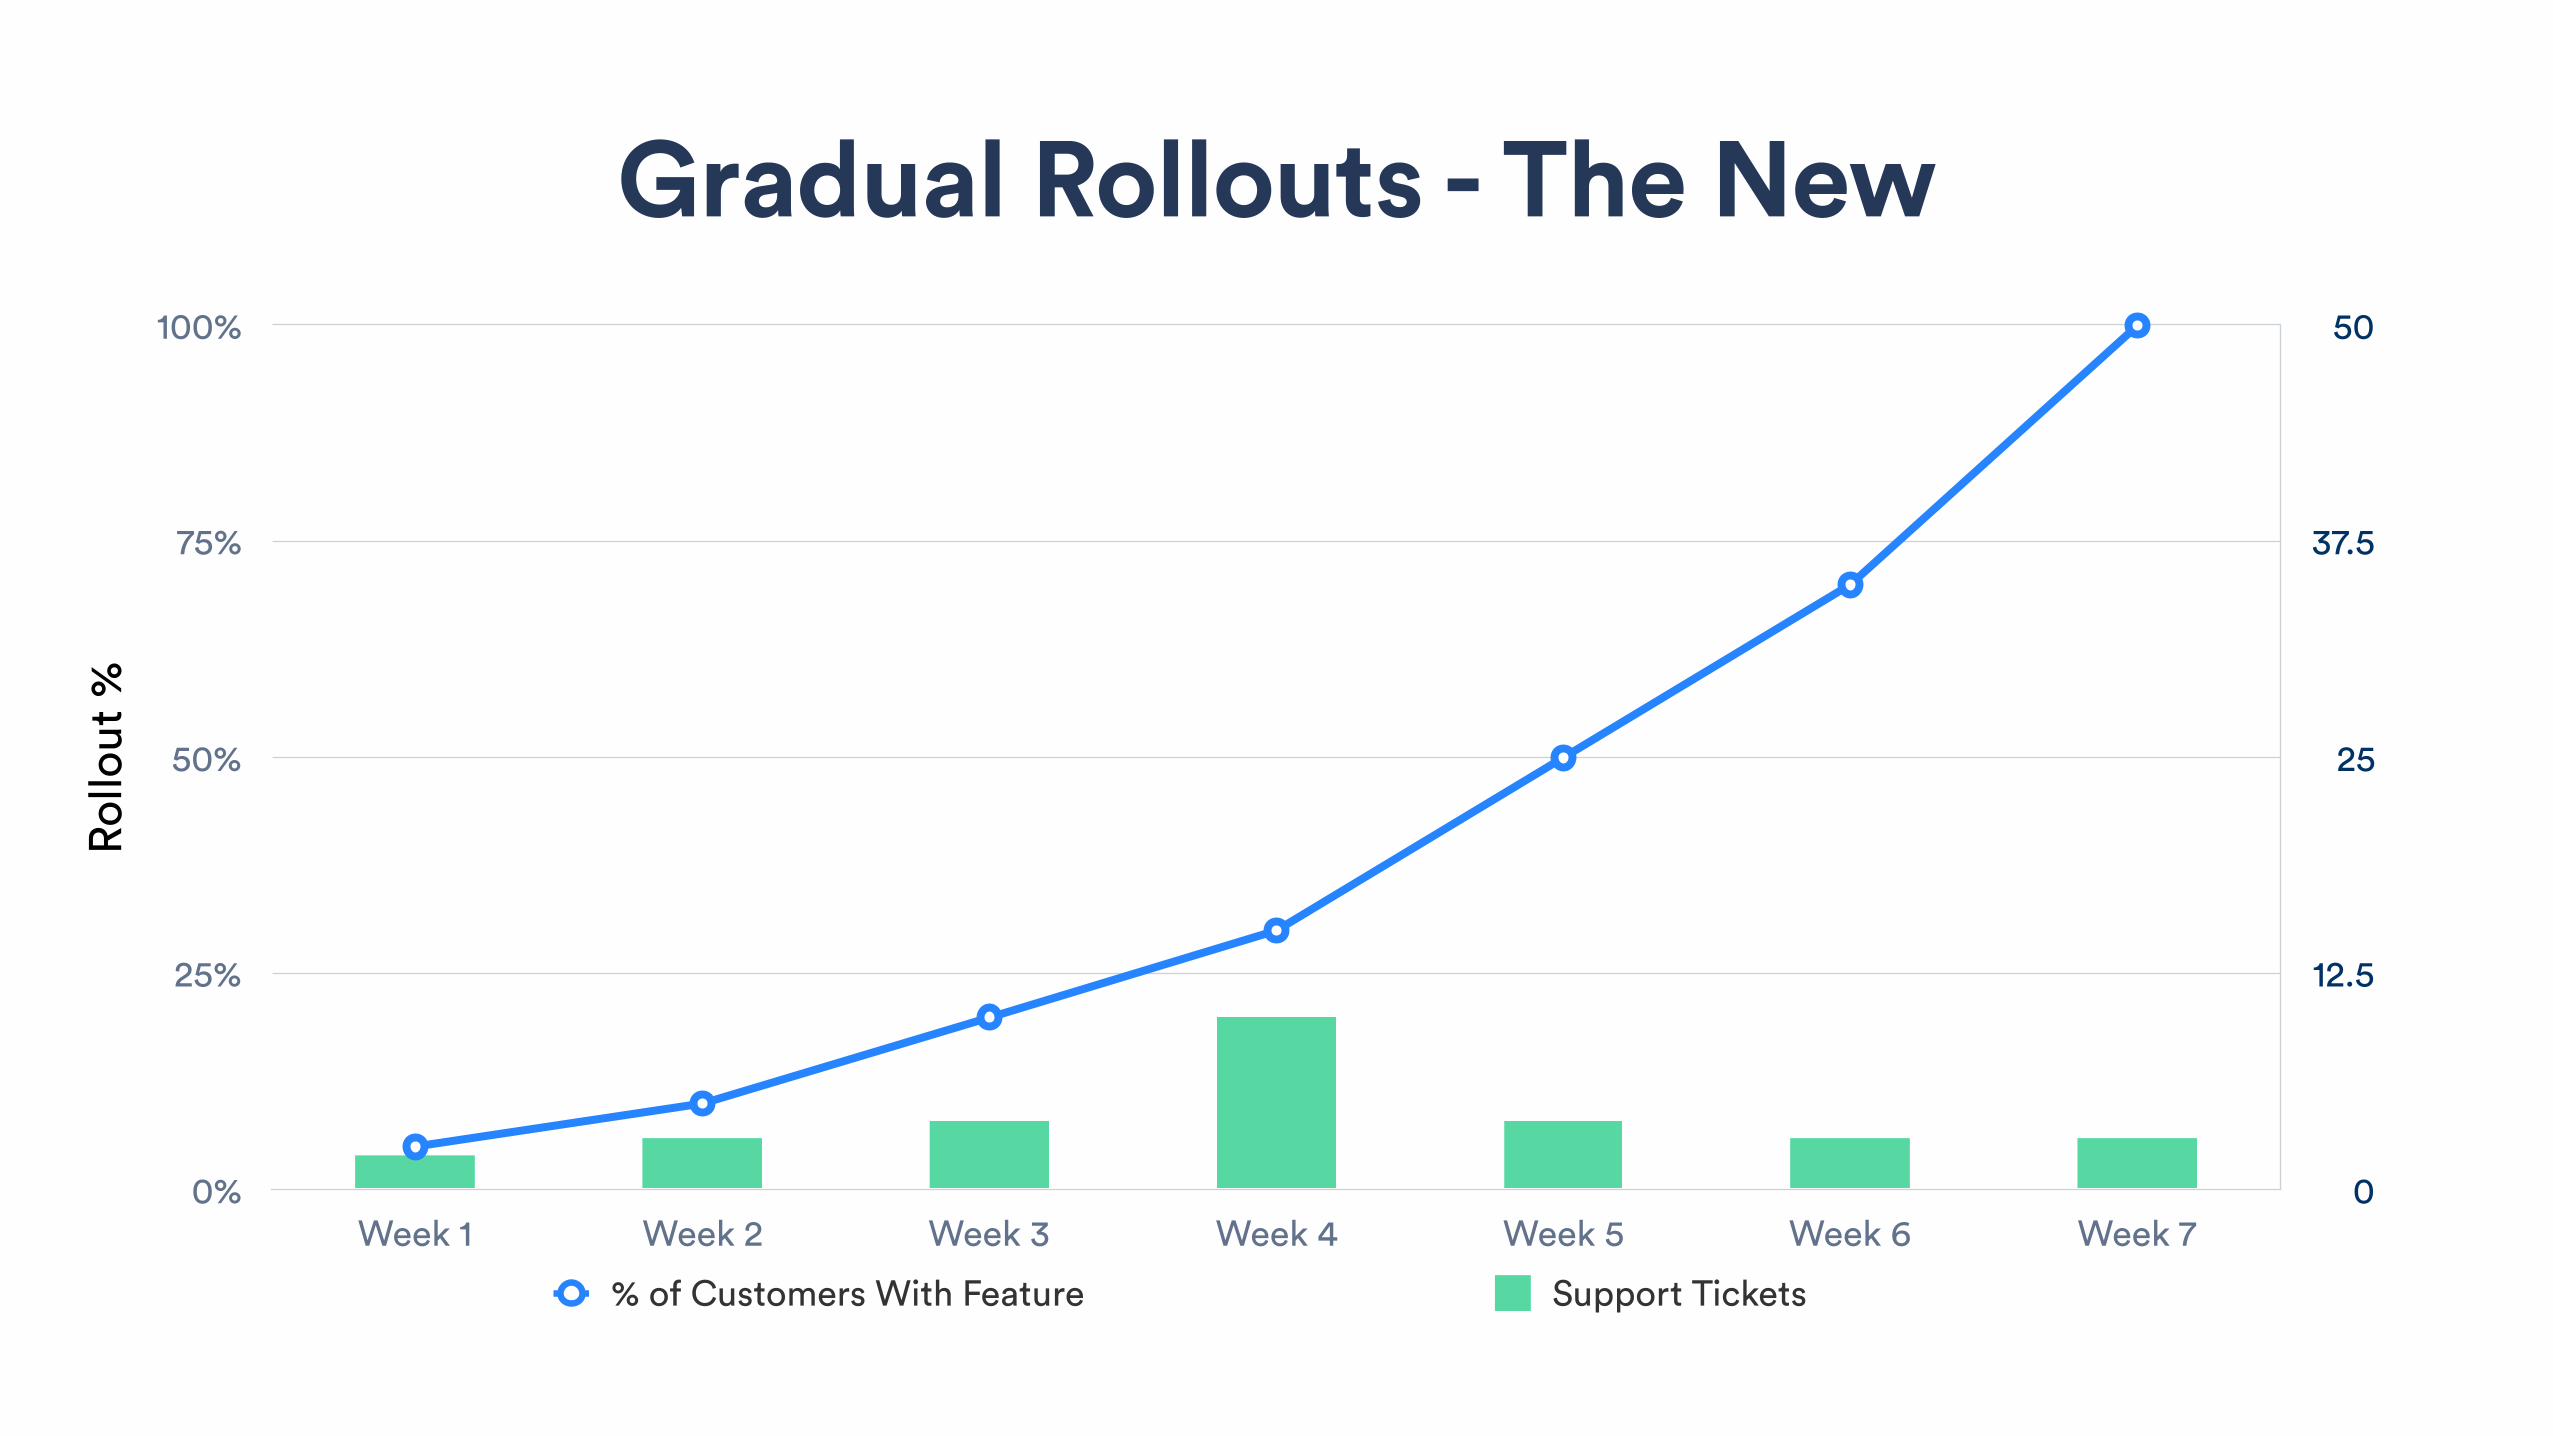
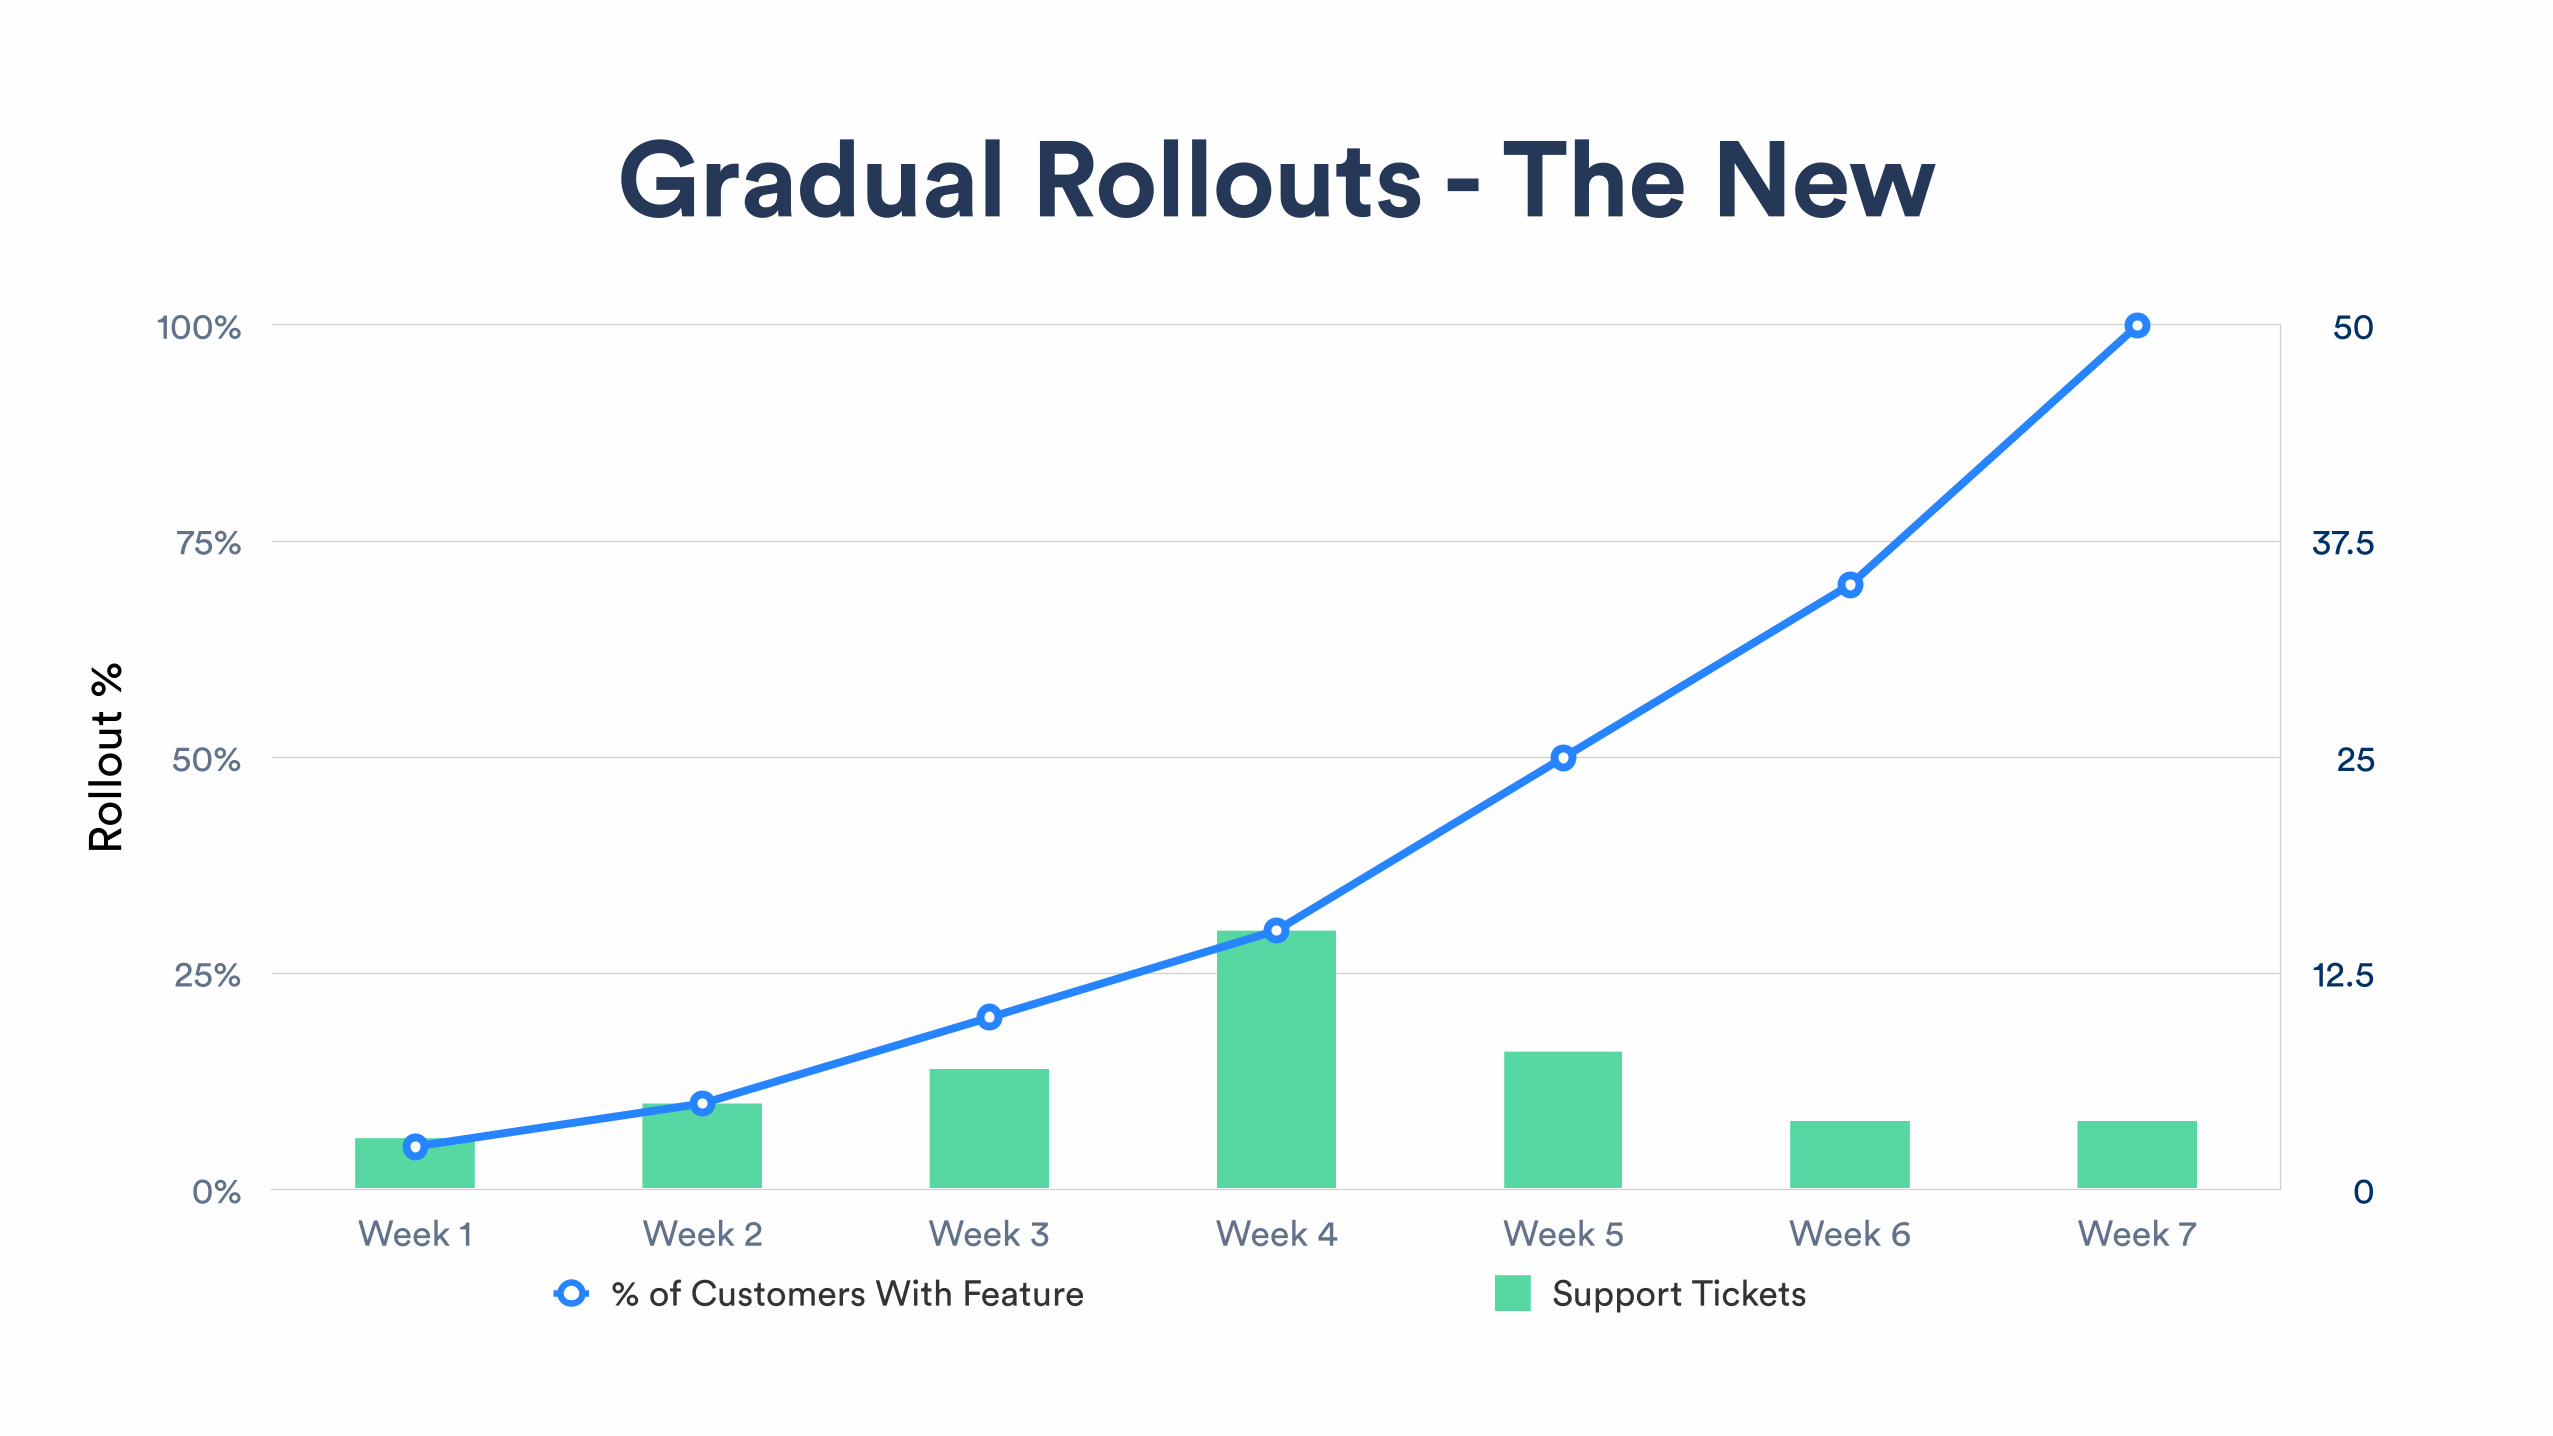
Gradual Rollouts - The New
0
12.5
25
37.5
50
Rollo
ut %
0%
25%
50%
75%
100%
Week 1 Week 2 Week 3 Week 4 Week 5 Week 6 Week 7
% of Customers With Feature Support Tickets
Gradual Rollouts - The New
0
12.5
25
37.5
50
Rollo
ut %
0%
25%
50%
75%
100%
Week 1 Week 2 Week 3 Week 4 Week 5 Week 6 Week 7
% of Customers With Feature Support Tickets
Gradual Rollouts - The New
0
12.5
25
37.5
50
Rollo
ut %
0%
25%
50%
75%
100%
Week 1 Week 2 Week 3 Week 4 Week 5 Week 6 Week 7
% of Customers With Feature Support Tickets
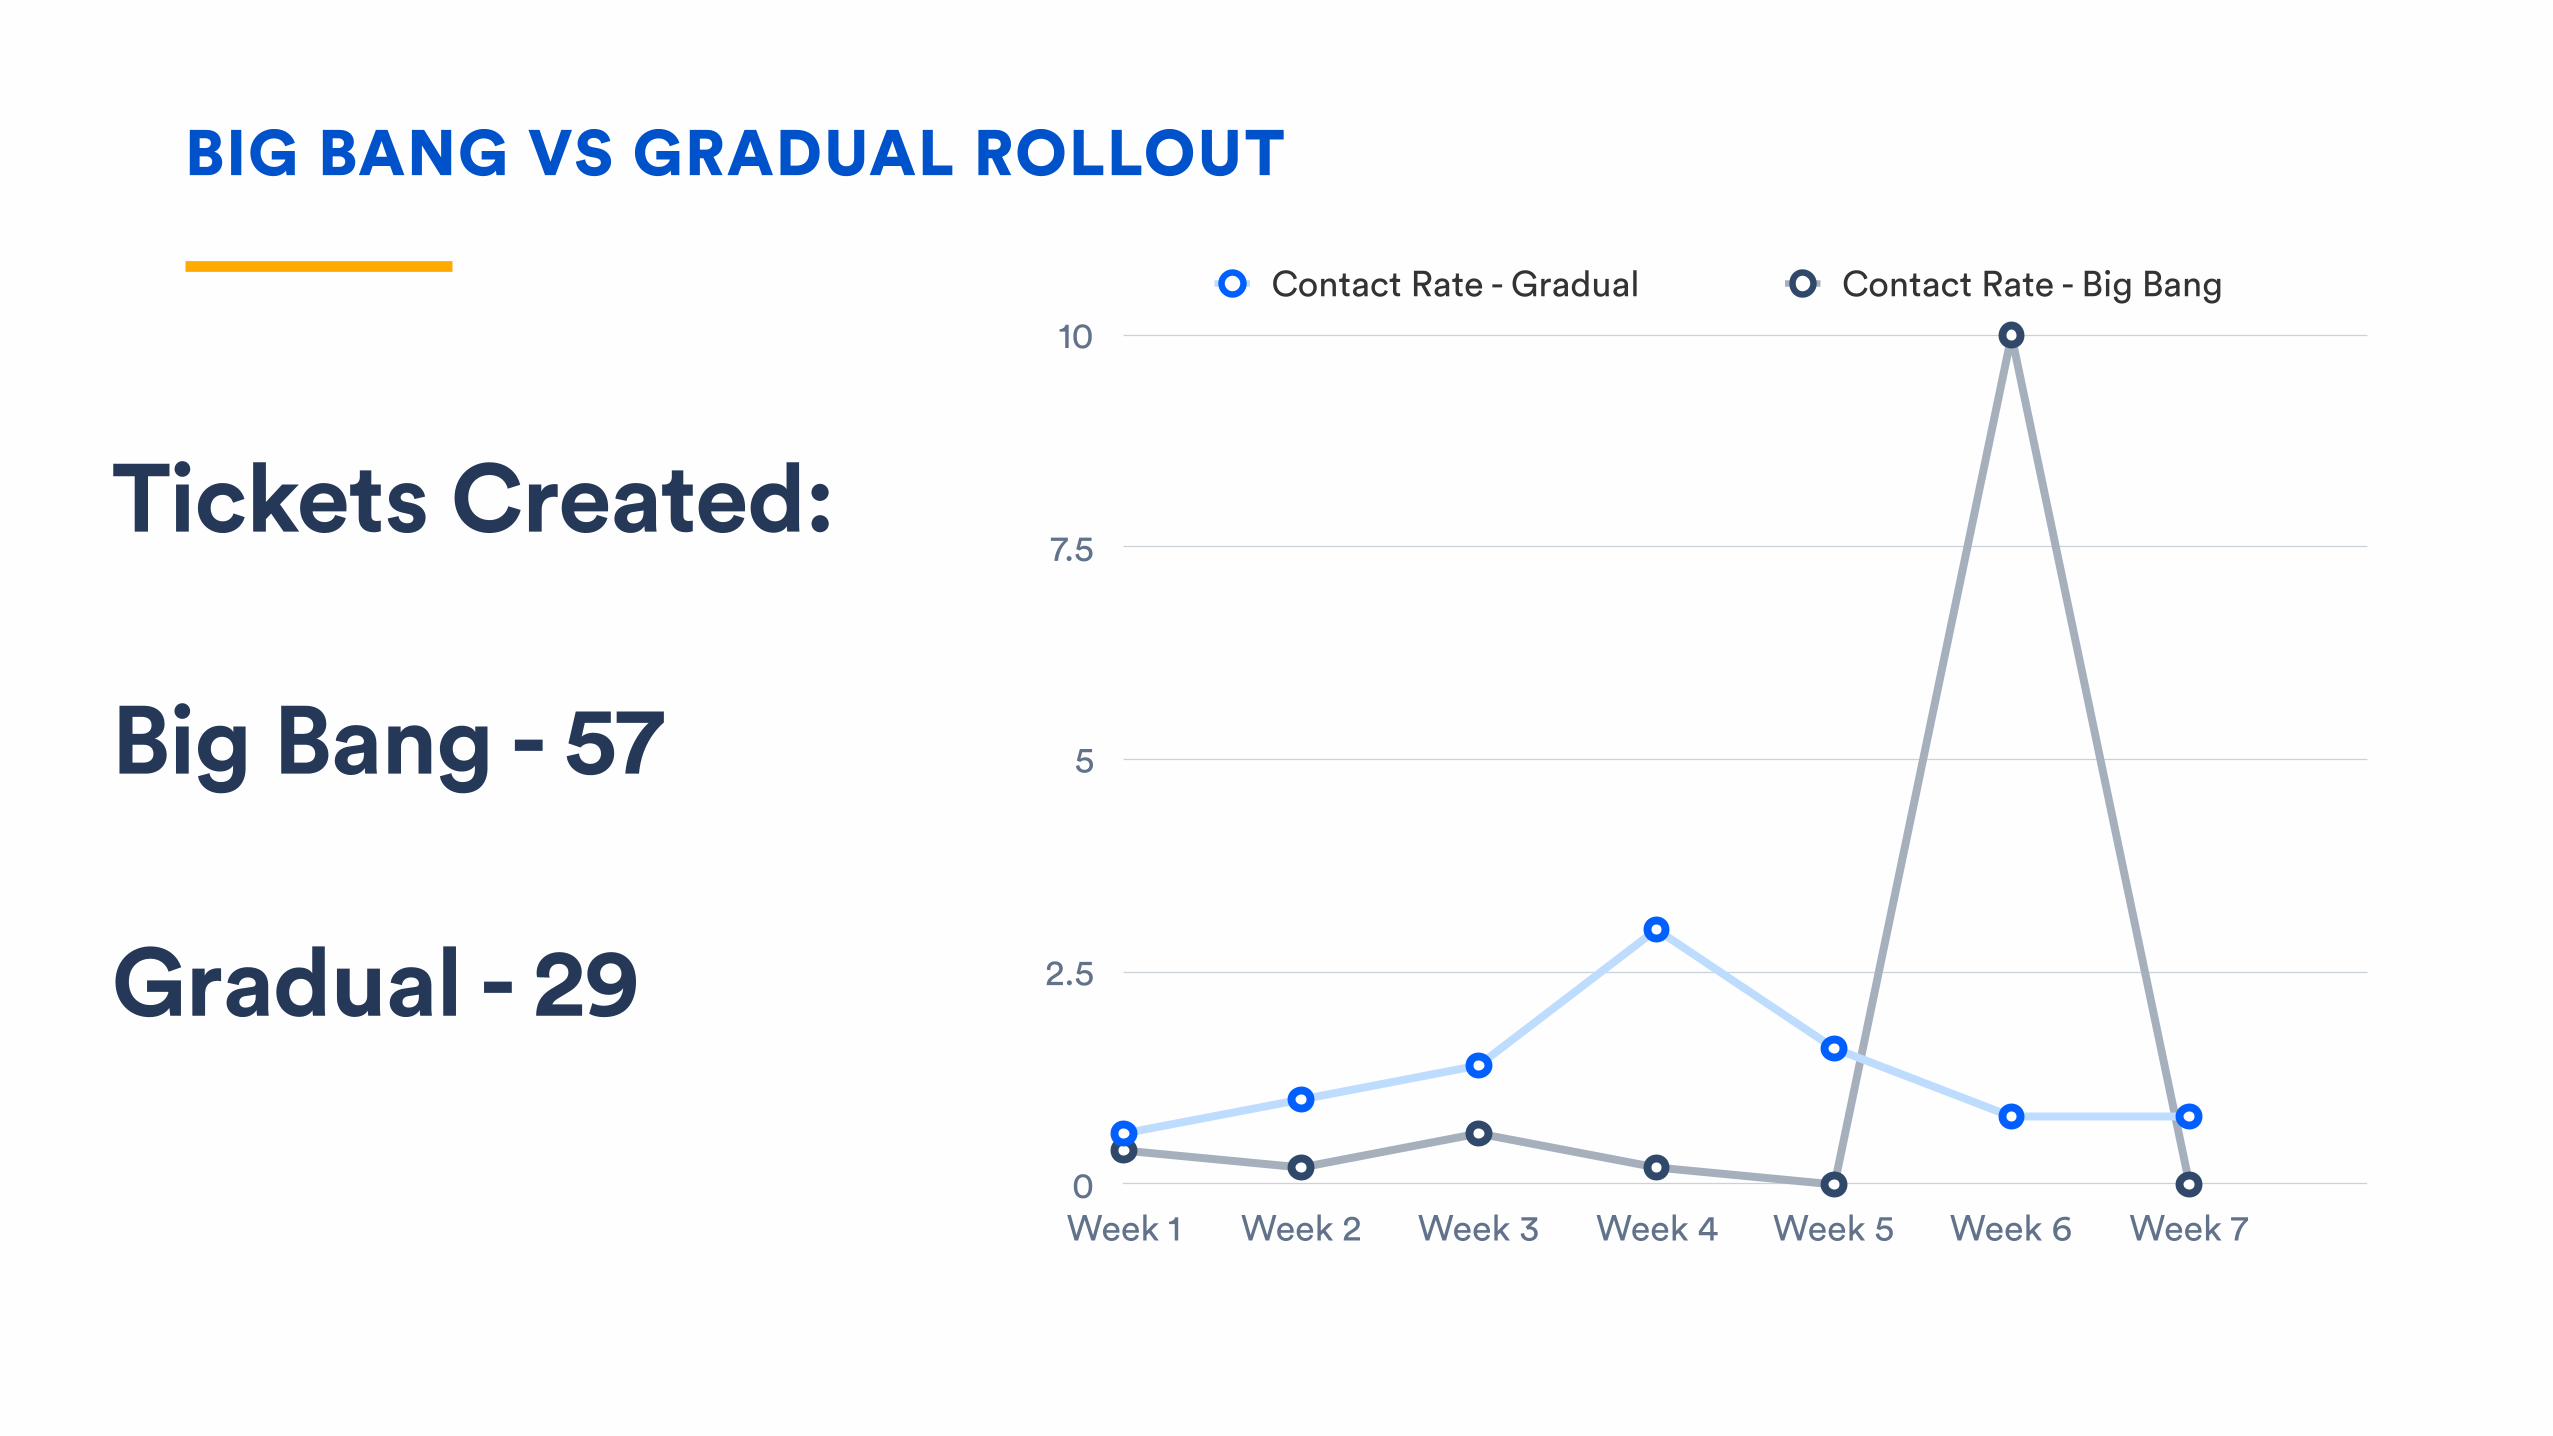
BIG BANG VS GRADUAL ROLLOUT
0
2.5
5
7.5
10
Week 1 Week 2 Week 3 Week 4 Week 5 Week 6 Week 7
Contact Rate - Gradual Contact Rate - Big Bang
Tickets Created:
Big Bang - 57
Gradual - 29
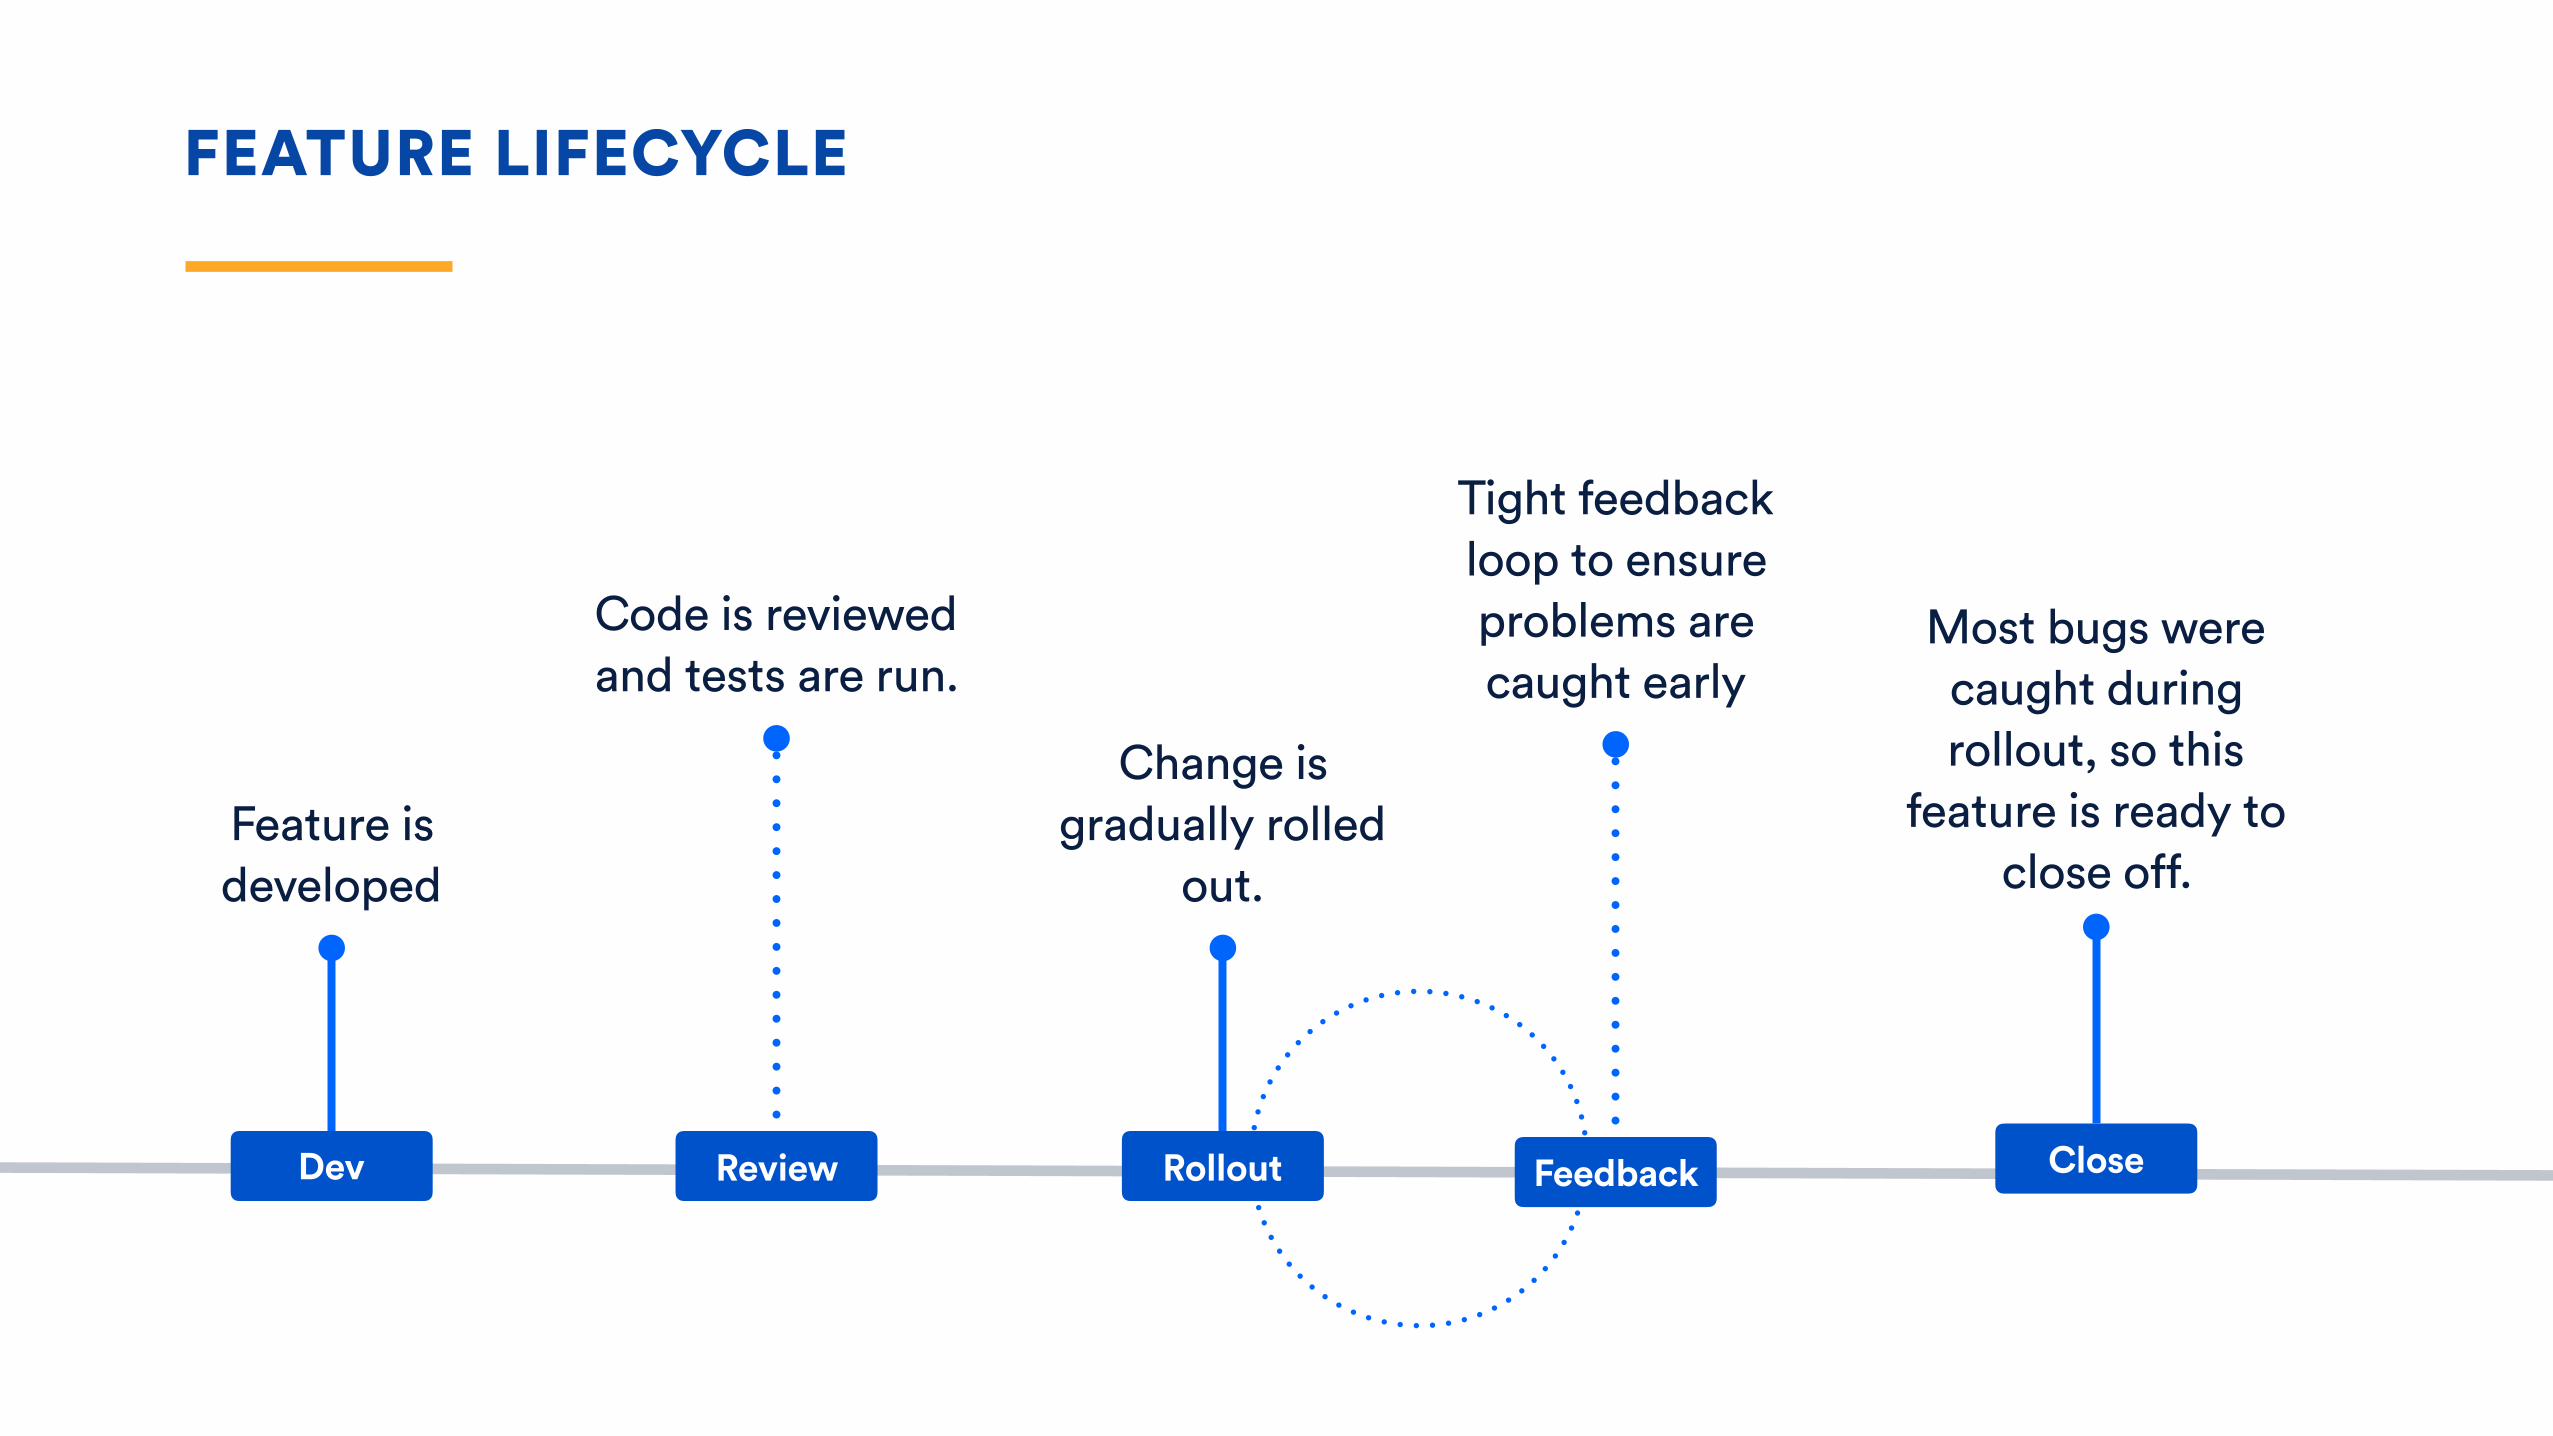
FEATURE LIFECYCLE
Feature is developed
Code is reviewed and tests are run.
Change is gradually rolled
out.
Most bugs were caught during rollout, so this
feature is ready to close off.
Dev Review Rollout Close
Tight feedback loop to ensure problems are caught early
Feedback

Contact Rate Create a contact rate
specifically monitoring tickets received from
customers with the feature.
Gradual Rollout Pro Tips
Feedback Loop Work closely with the
Development team to share feedback asap.
Readiness Involvement with
Development early in the cycle ensures the support
team is ready for the change.

AgendaReporting
Insights
Prediction
The Problem
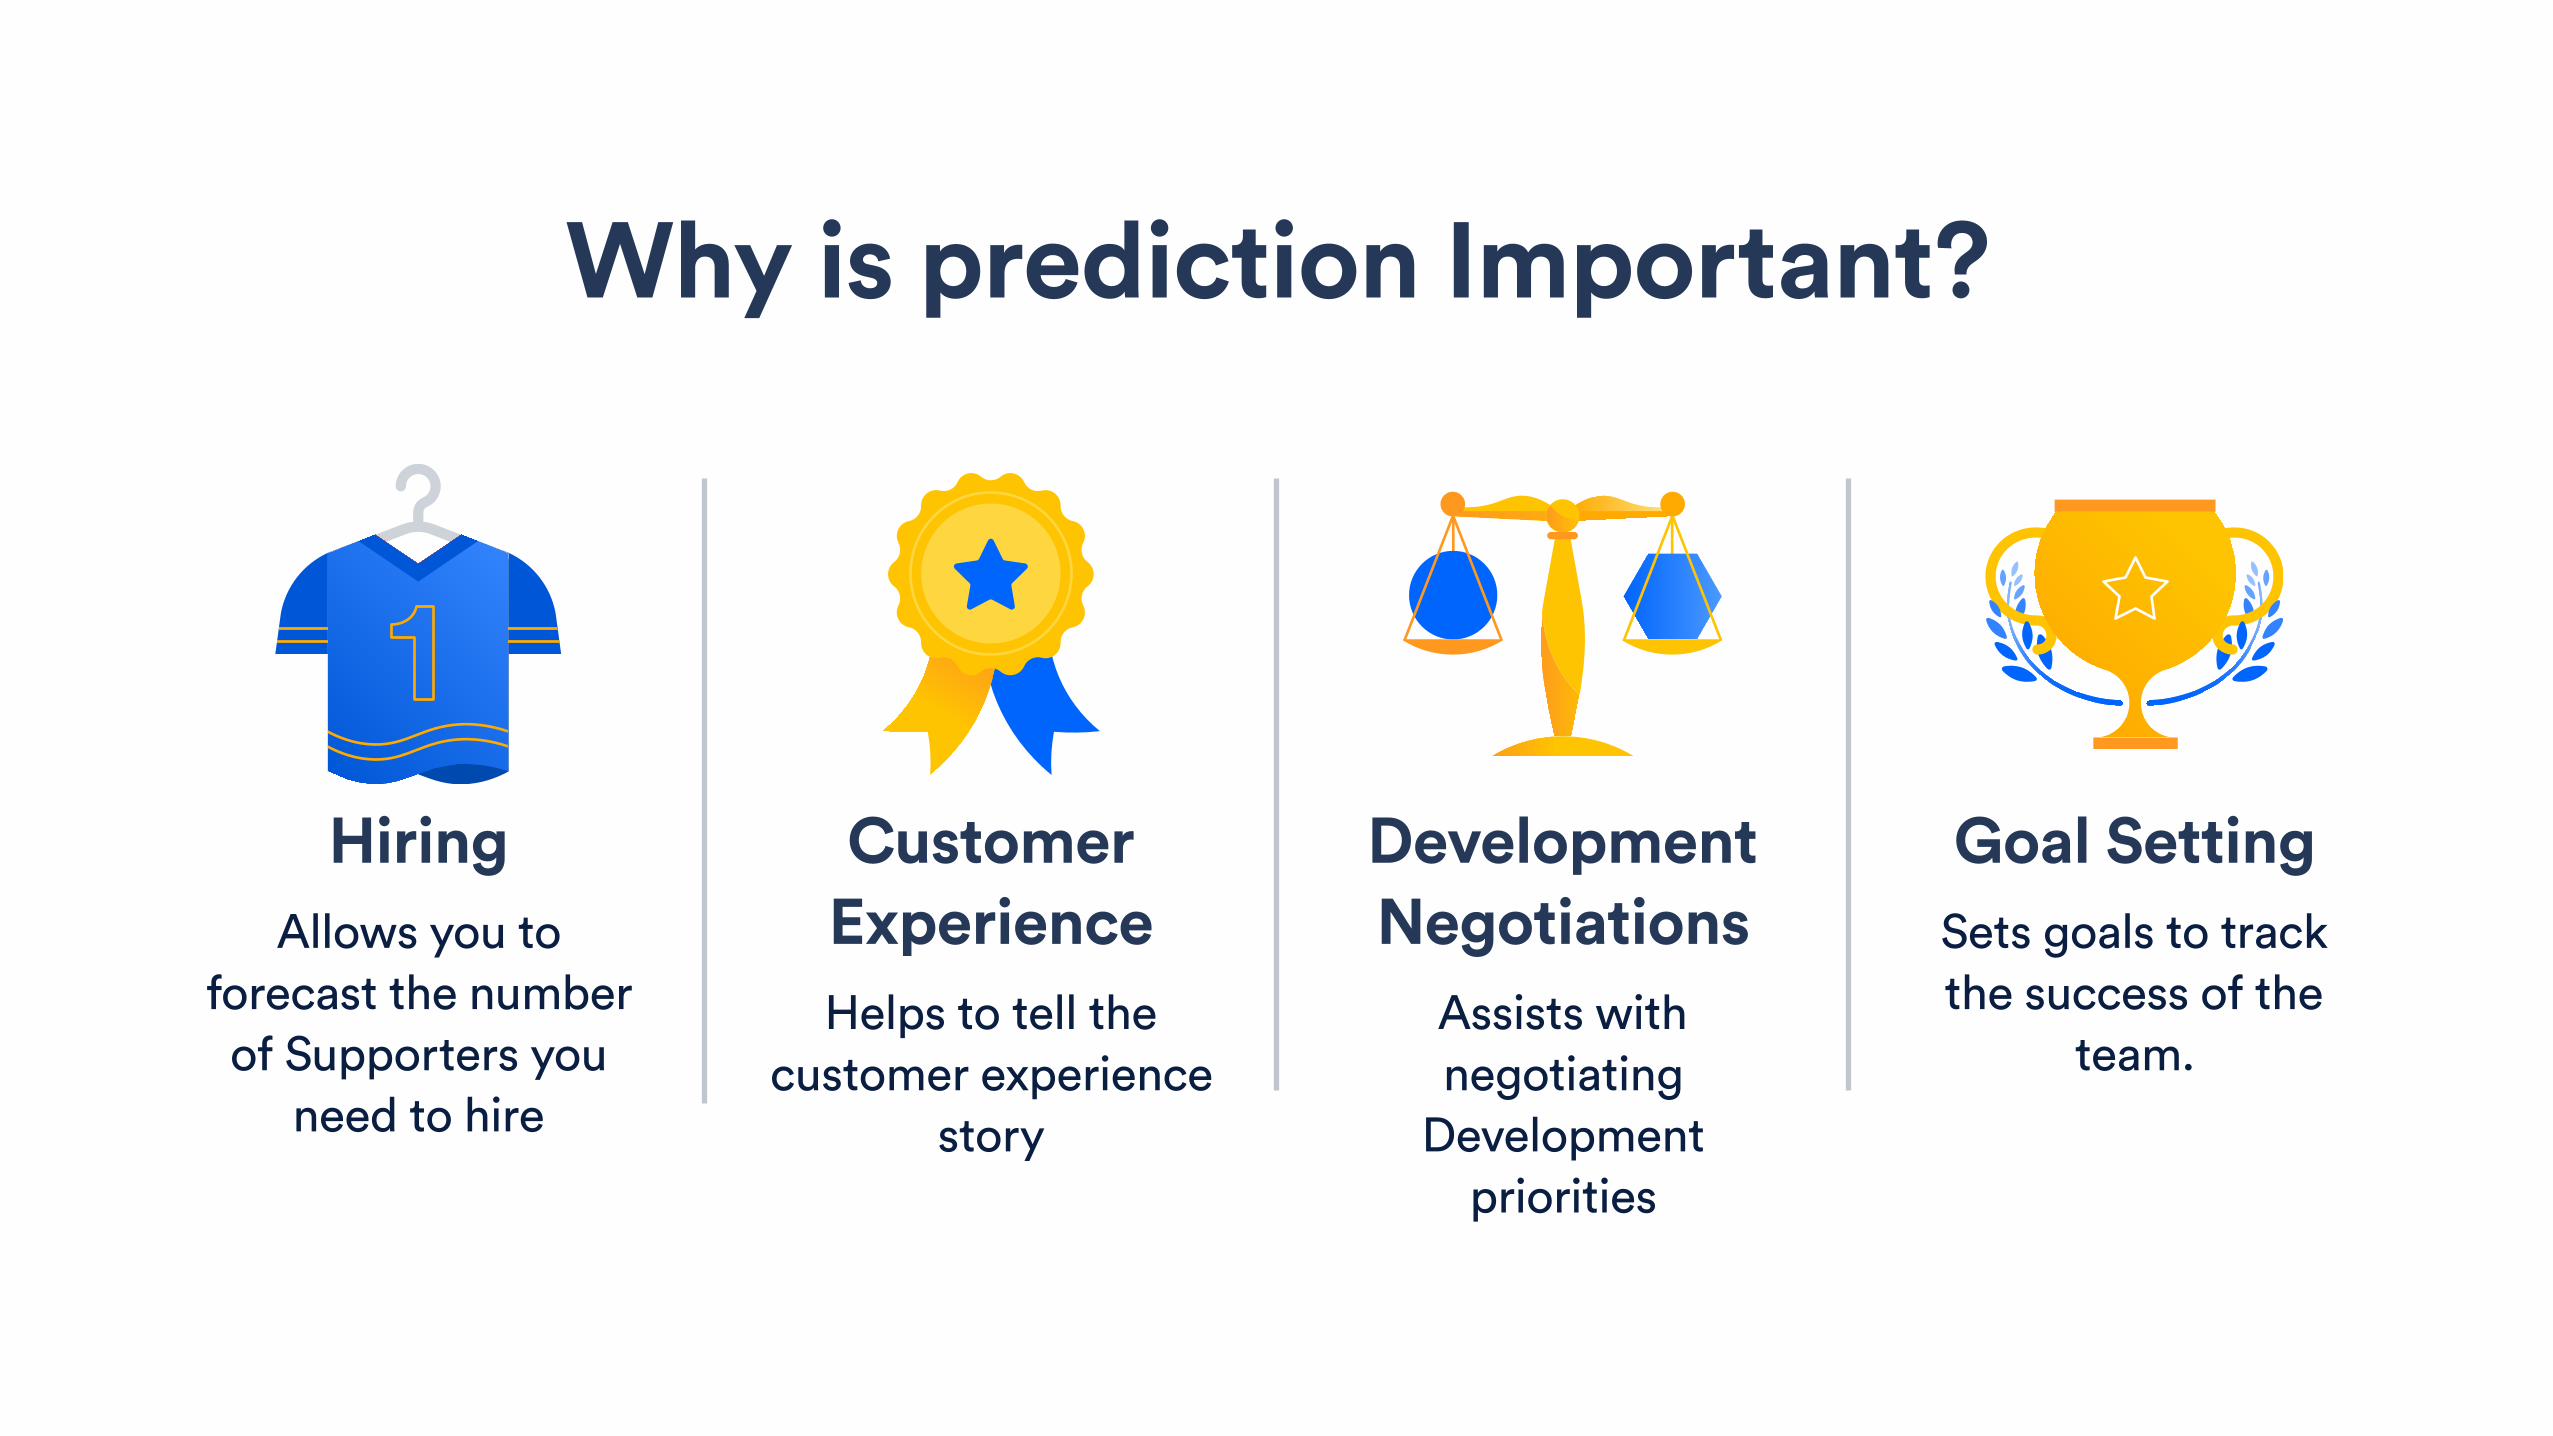
Hiring Allows you to
forecast the number of Supporters you
need to hire
Customer Experience Helps to tell the
customer experience story
Development Negotiations
Assists with negotiating
Development priorities
Goal Setting Sets goals to track the success of the
team.
Why is prediction Important?

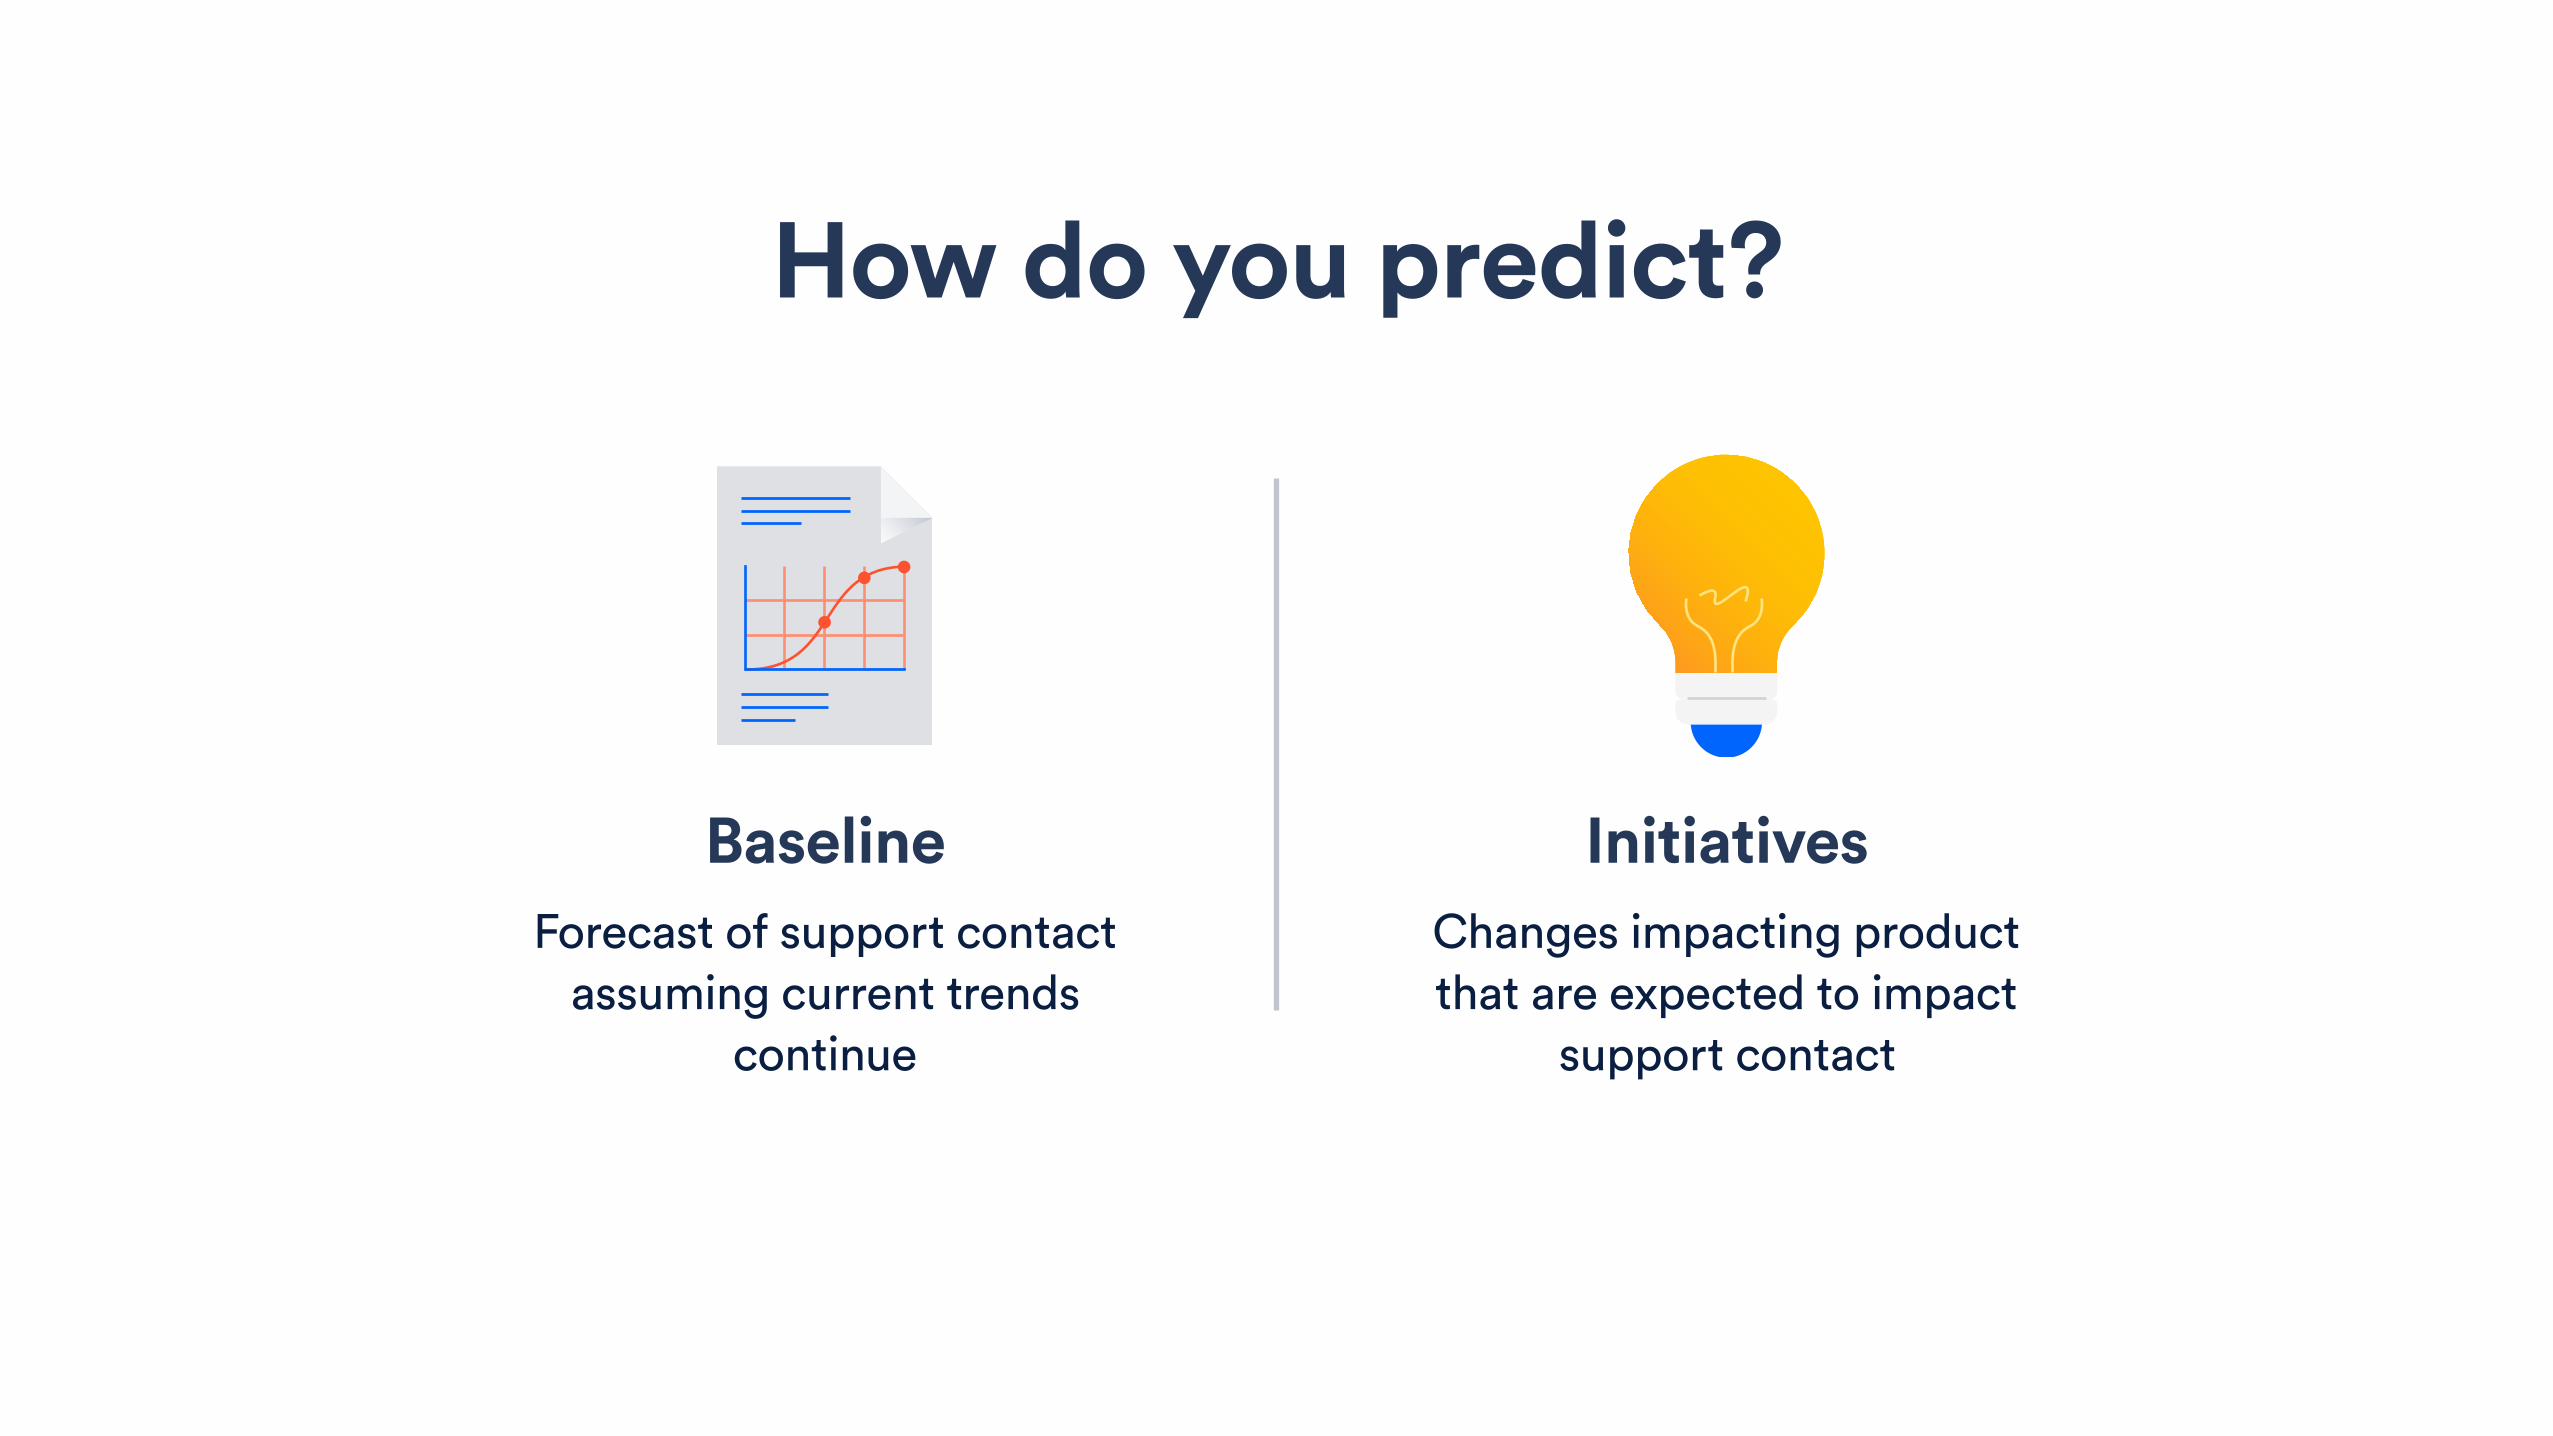
Baseline Forecast of support contact
assuming current trends continue
Initiatives Changes impacting product that are expected to impact
support contact
How do you predict?

Baseline Forecast of support contact
assuming current trends continue
Initiatives Changes impacting product that are expected to impact
support contact
How do you predict?

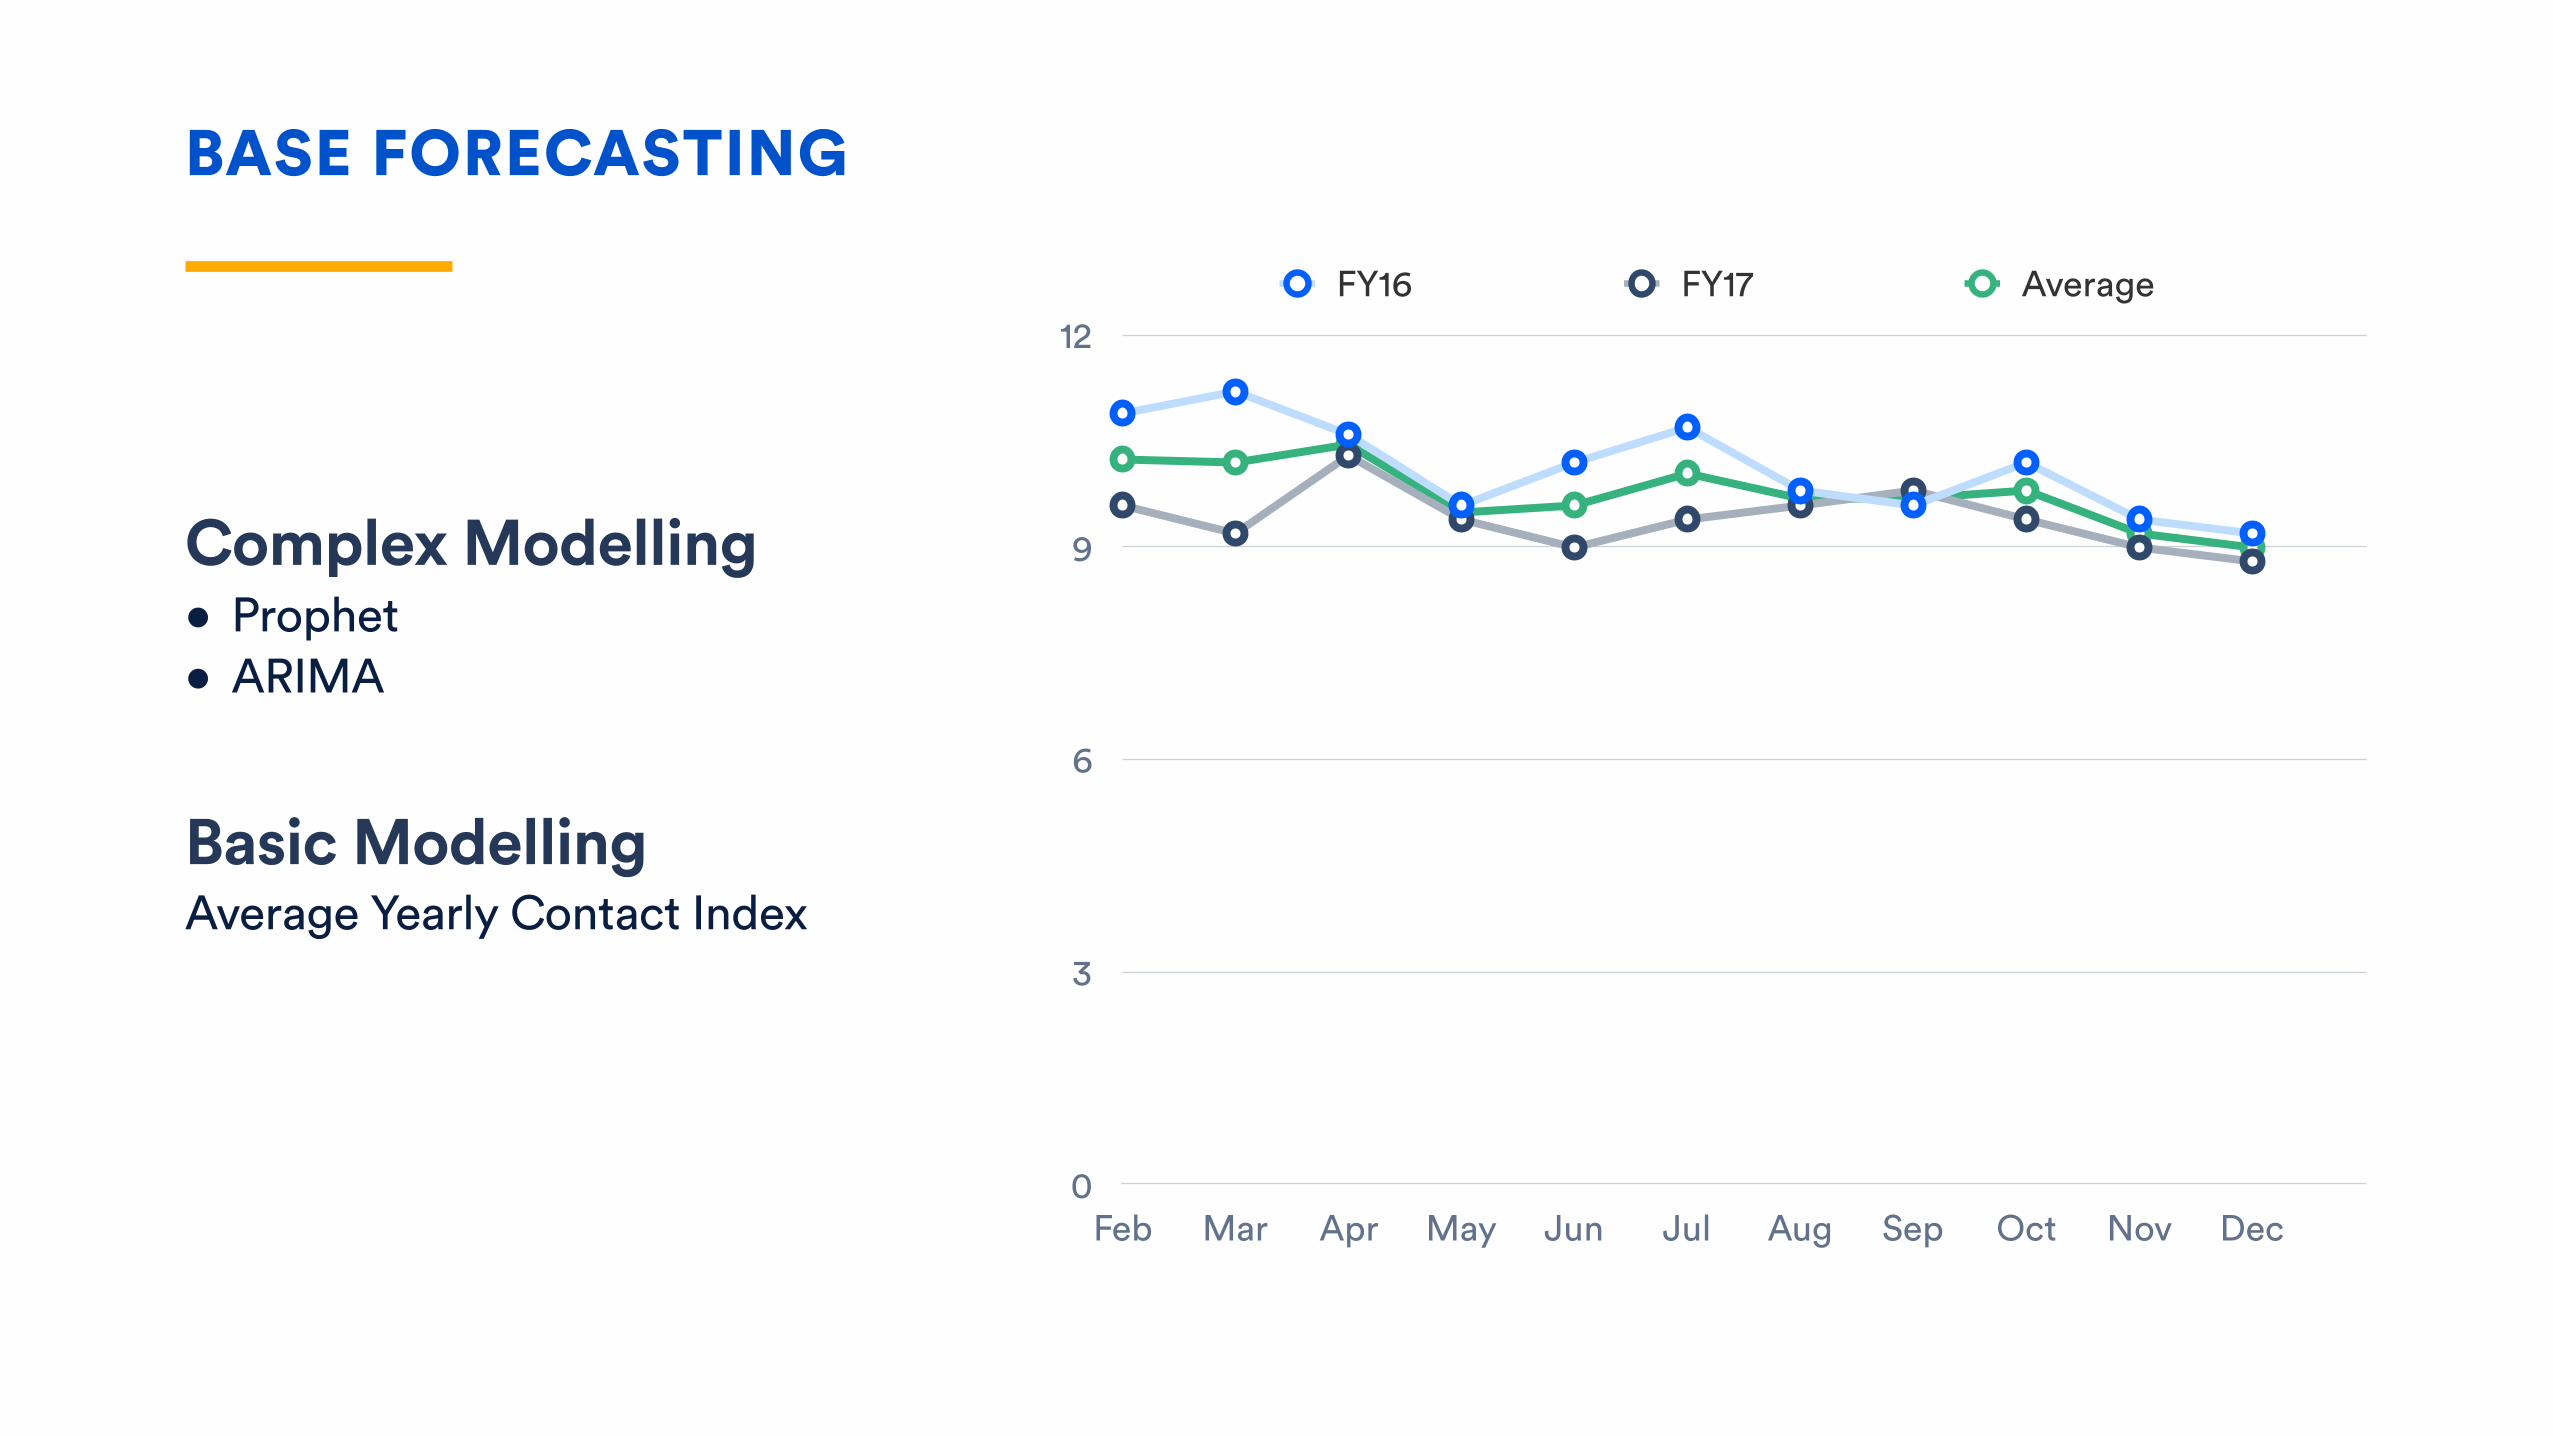
Complex Modelling • Prophet • ARIMA
BASE FORECASTING
Basic Modelling Average Yearly Contact Index
0
3
6
9
12
Feb Mar Apr May Jun Jul Aug Sep Oct Nov Dec
FY16 FY17
BASE FORECASTING
0
3
6
9
12
Feb Mar Apr May Jun Jul Aug Sep Oct Nov Dec
FY16 FY17 Average
Complex Modelling • Prophet • ARIMA
Basic Modelling Average Yearly Contact Index

BASE FORECASTING
0
3
6
9
12
Feb Mar Apr May Jun Jul Aug Sep Oct Nov Dec
Average
Complex Modelling • Prophet • ARIMA
Basic Modelling Average Yearly Contact Index

Contact Index
Support Tickets =
Active Users
Contact Index
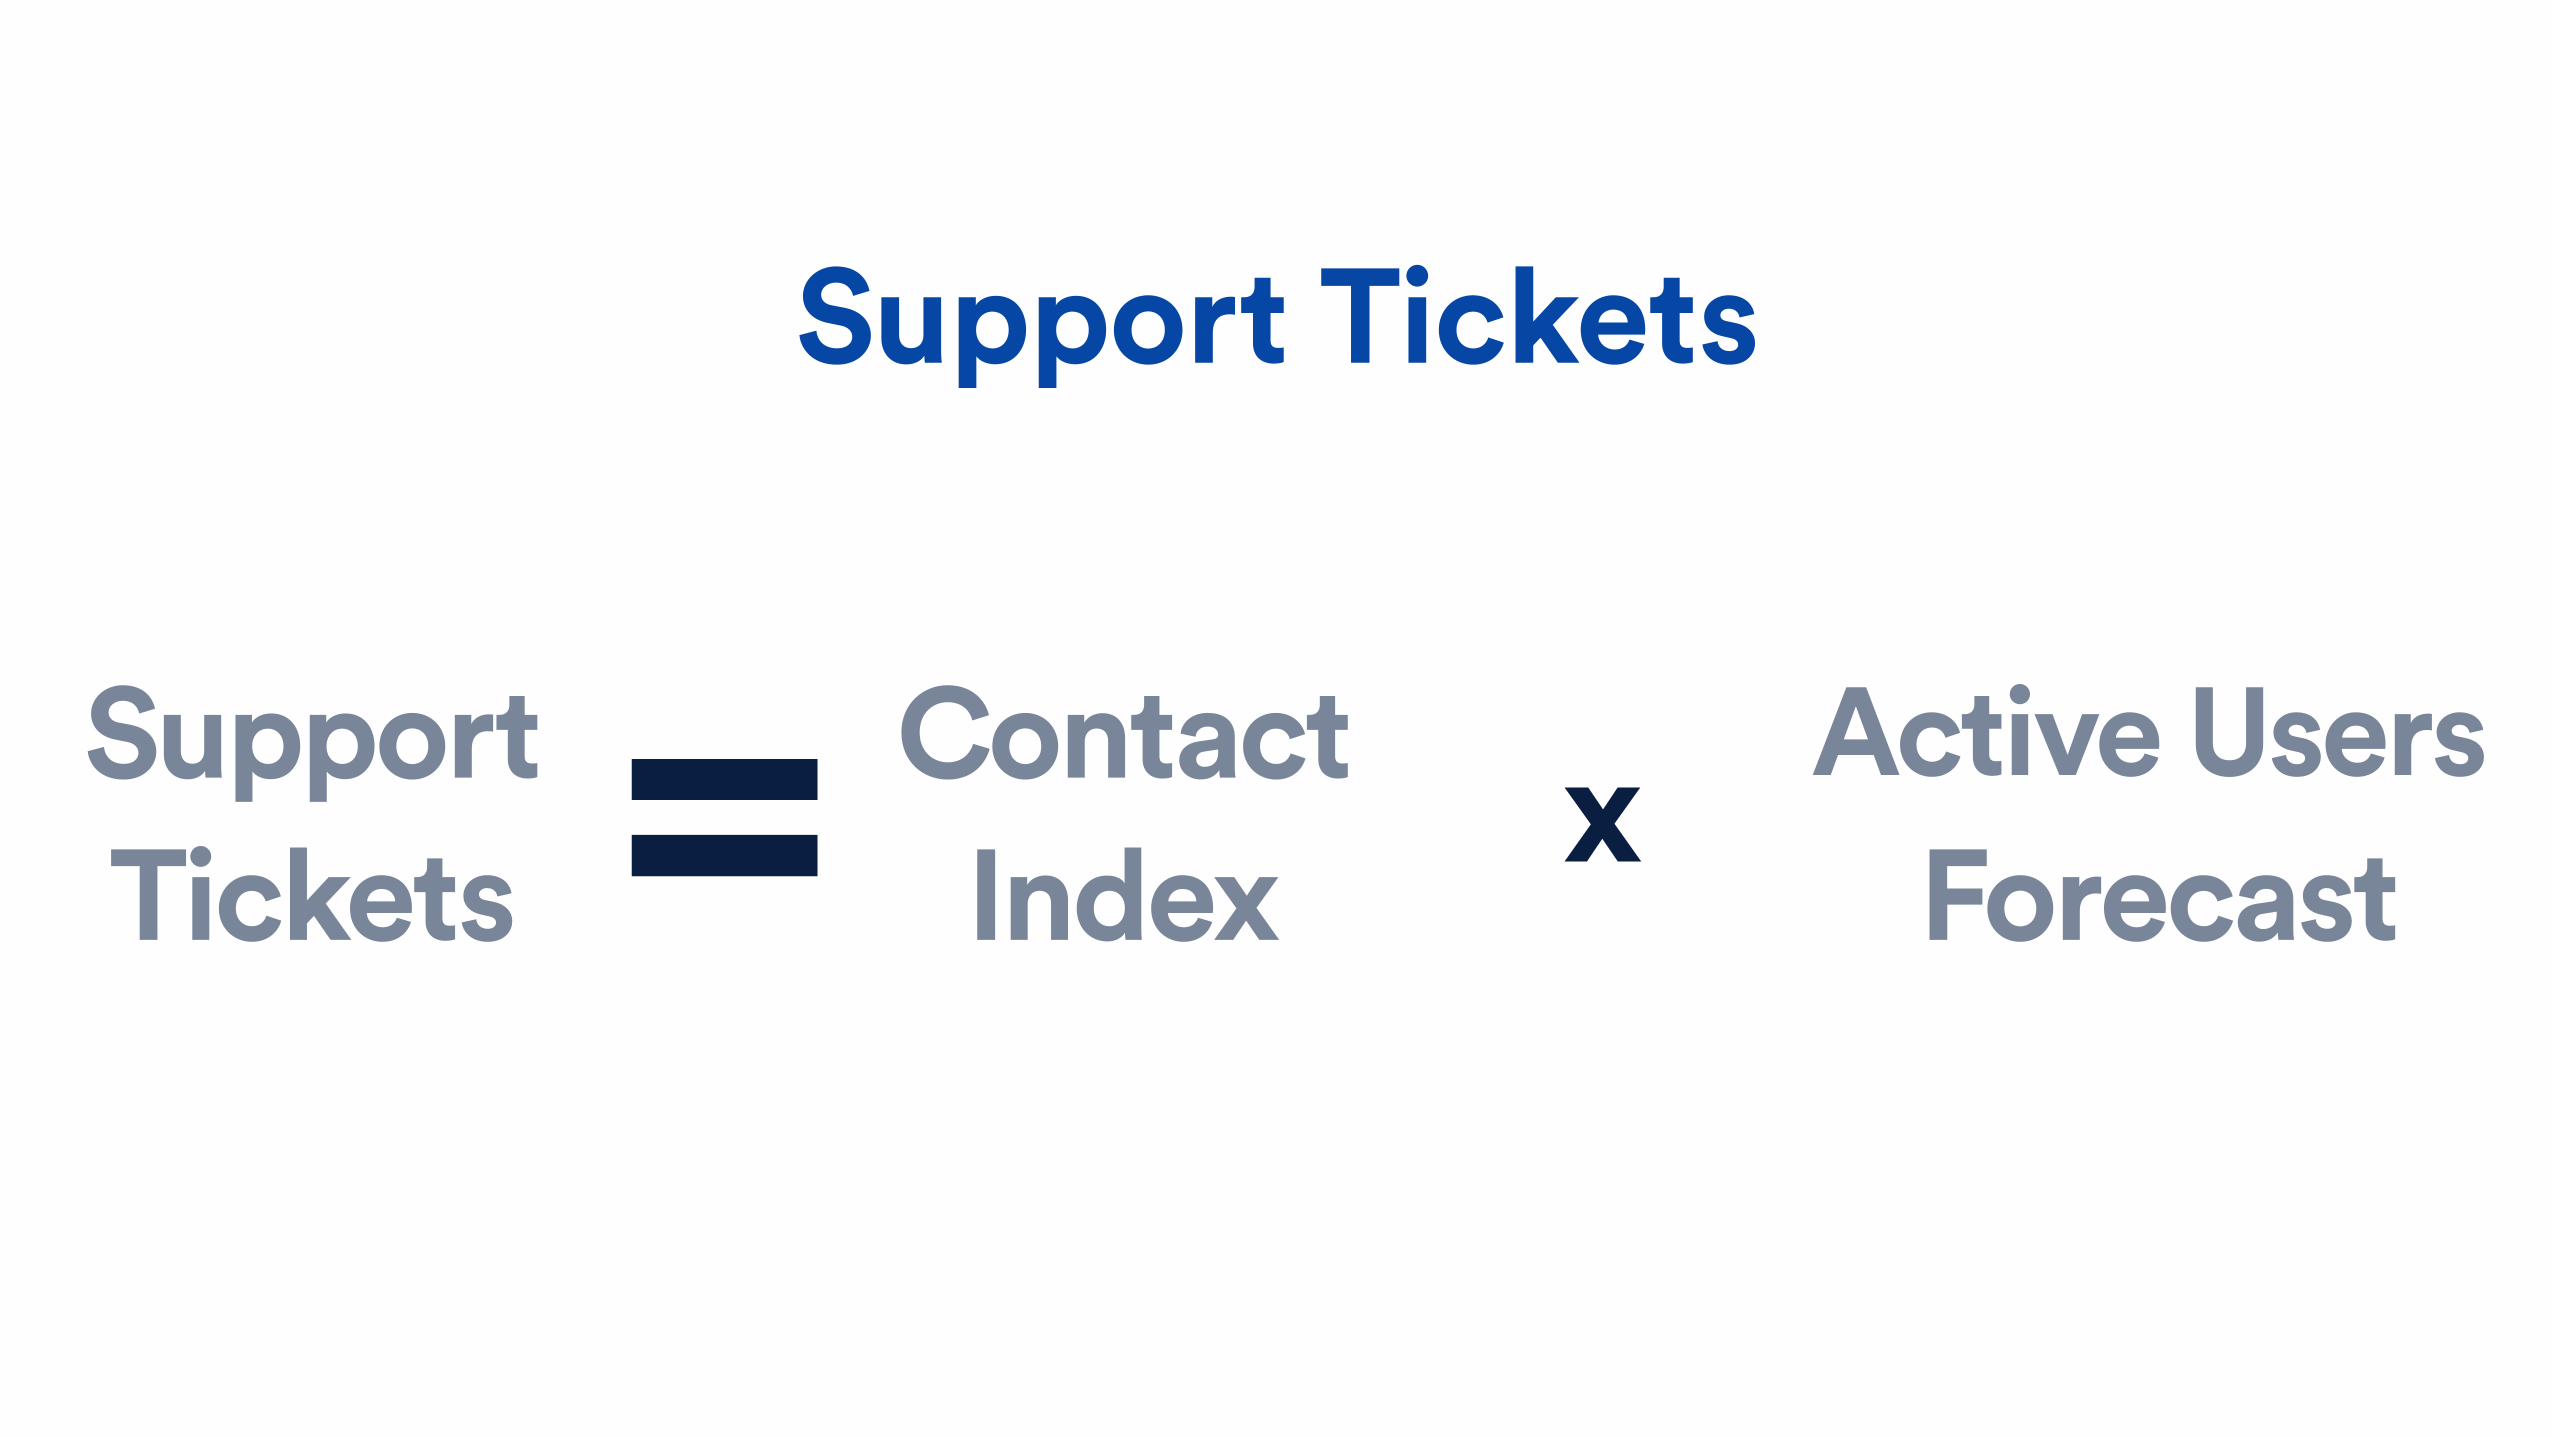
Support Tickets
Support Tickets = Forecast
Contact Index x Active Users

BASE FORECASTING
0
20
40
60
80
Jan Feb Mar Apr May Jun Jul Aug Sep Oct Nov Dec
Tickets
Baseline Forecast of support contact
assuming current trends continue
Initiatives Changes impacting product that are expected to impact
support contact
How do you predict?

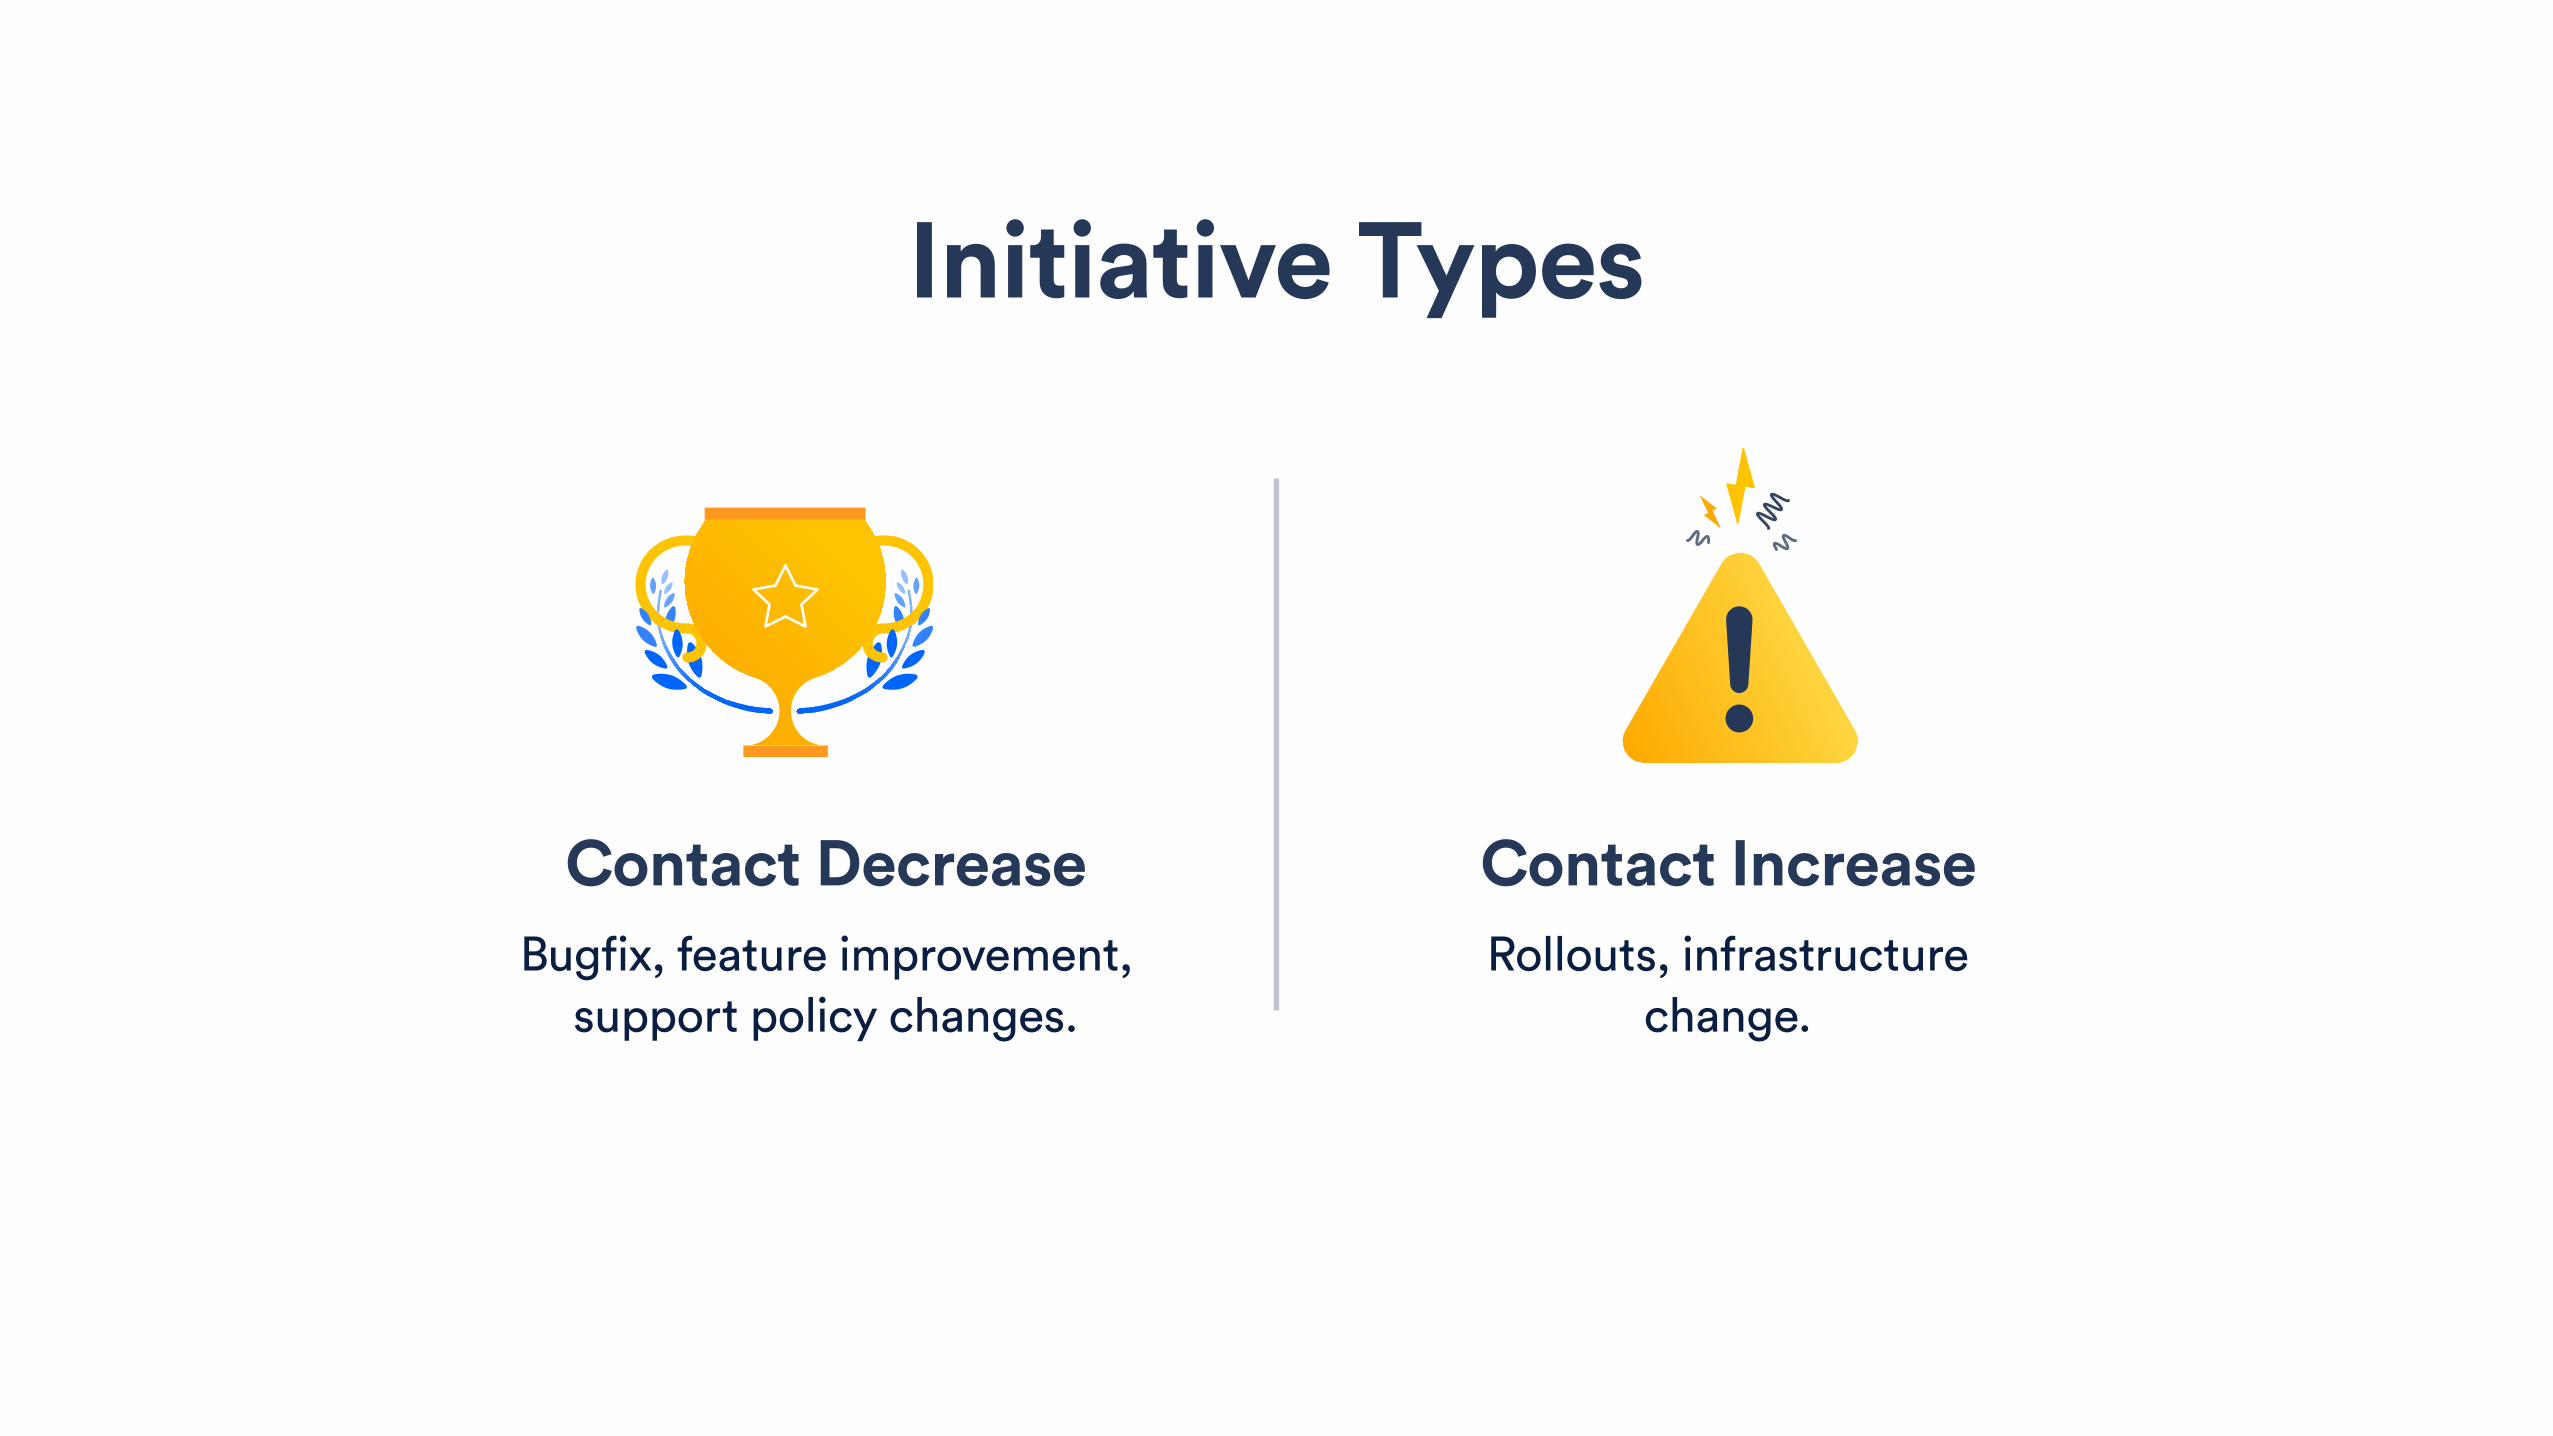
Contact Decrease Bugfix, feature improvement,
support policy changes.
Contact Increase Rollouts, infrastructure
change.
Initiative Types
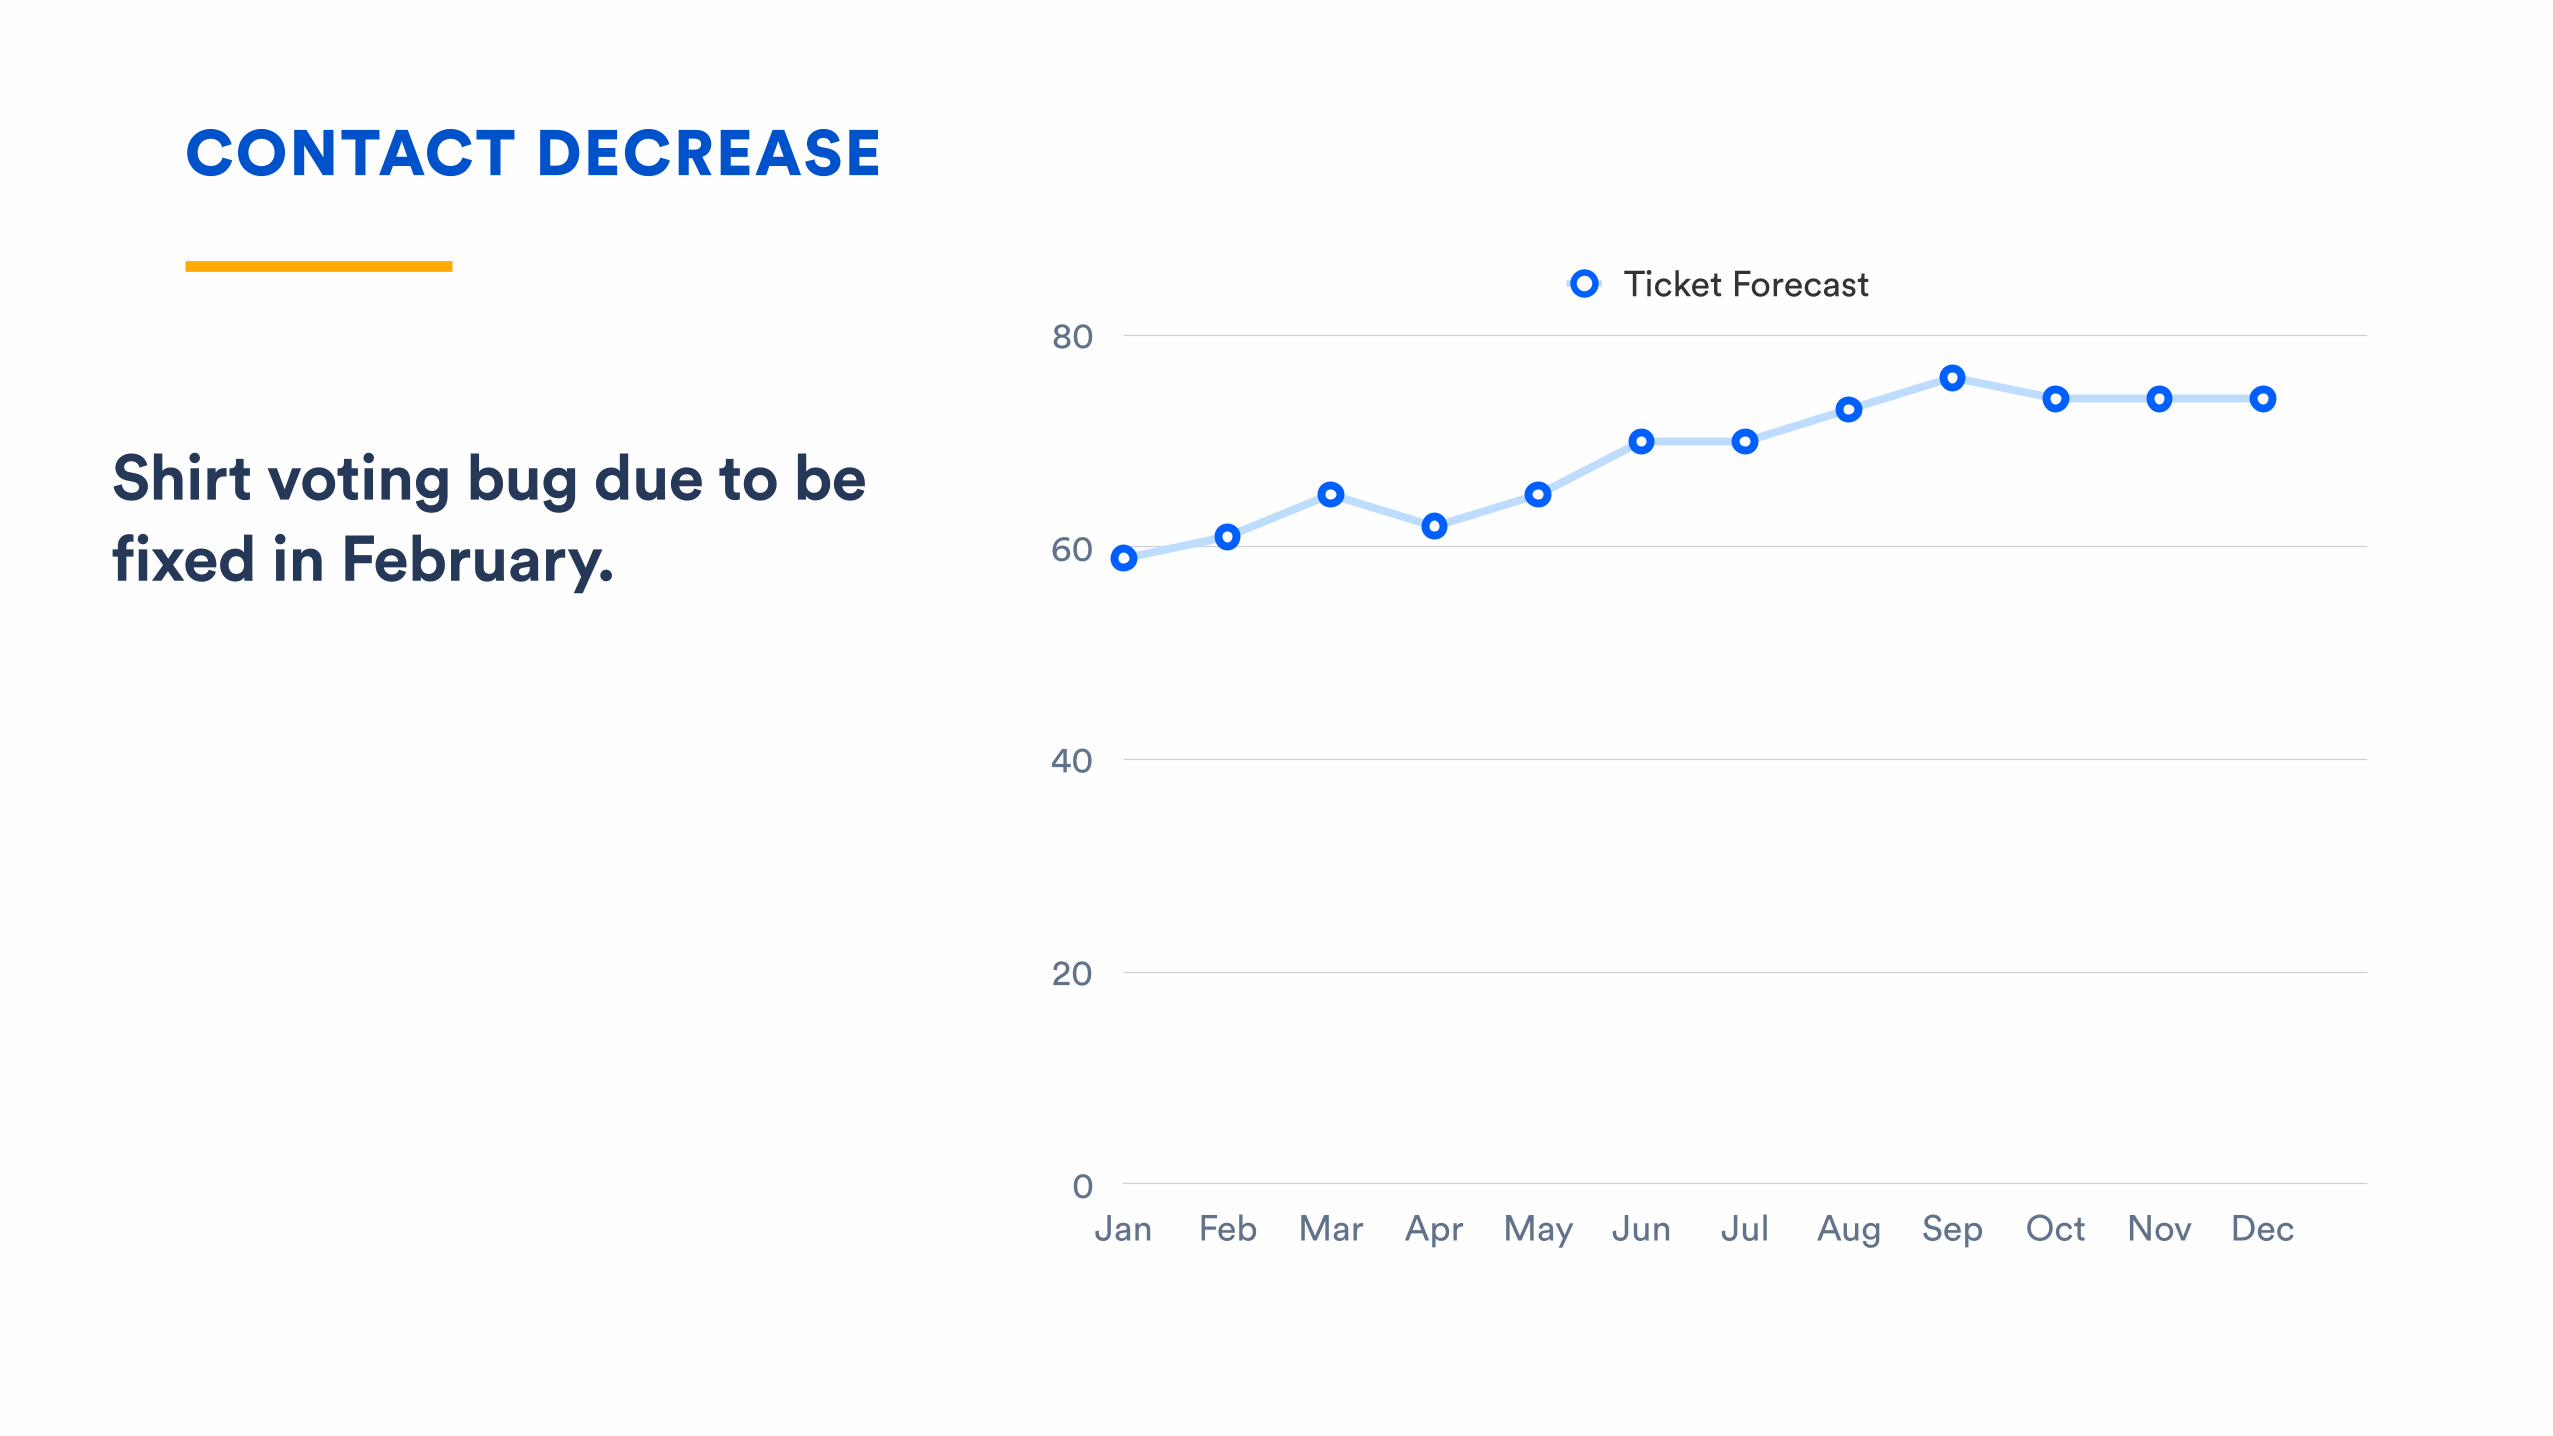
CONTACT DECREASE
0
20
40
60
80
Jan Feb Mar Apr May Jun Jul Aug Sep Oct Nov Dec
Ticket Forecast
Shirt voting bug due to be fixed in February.
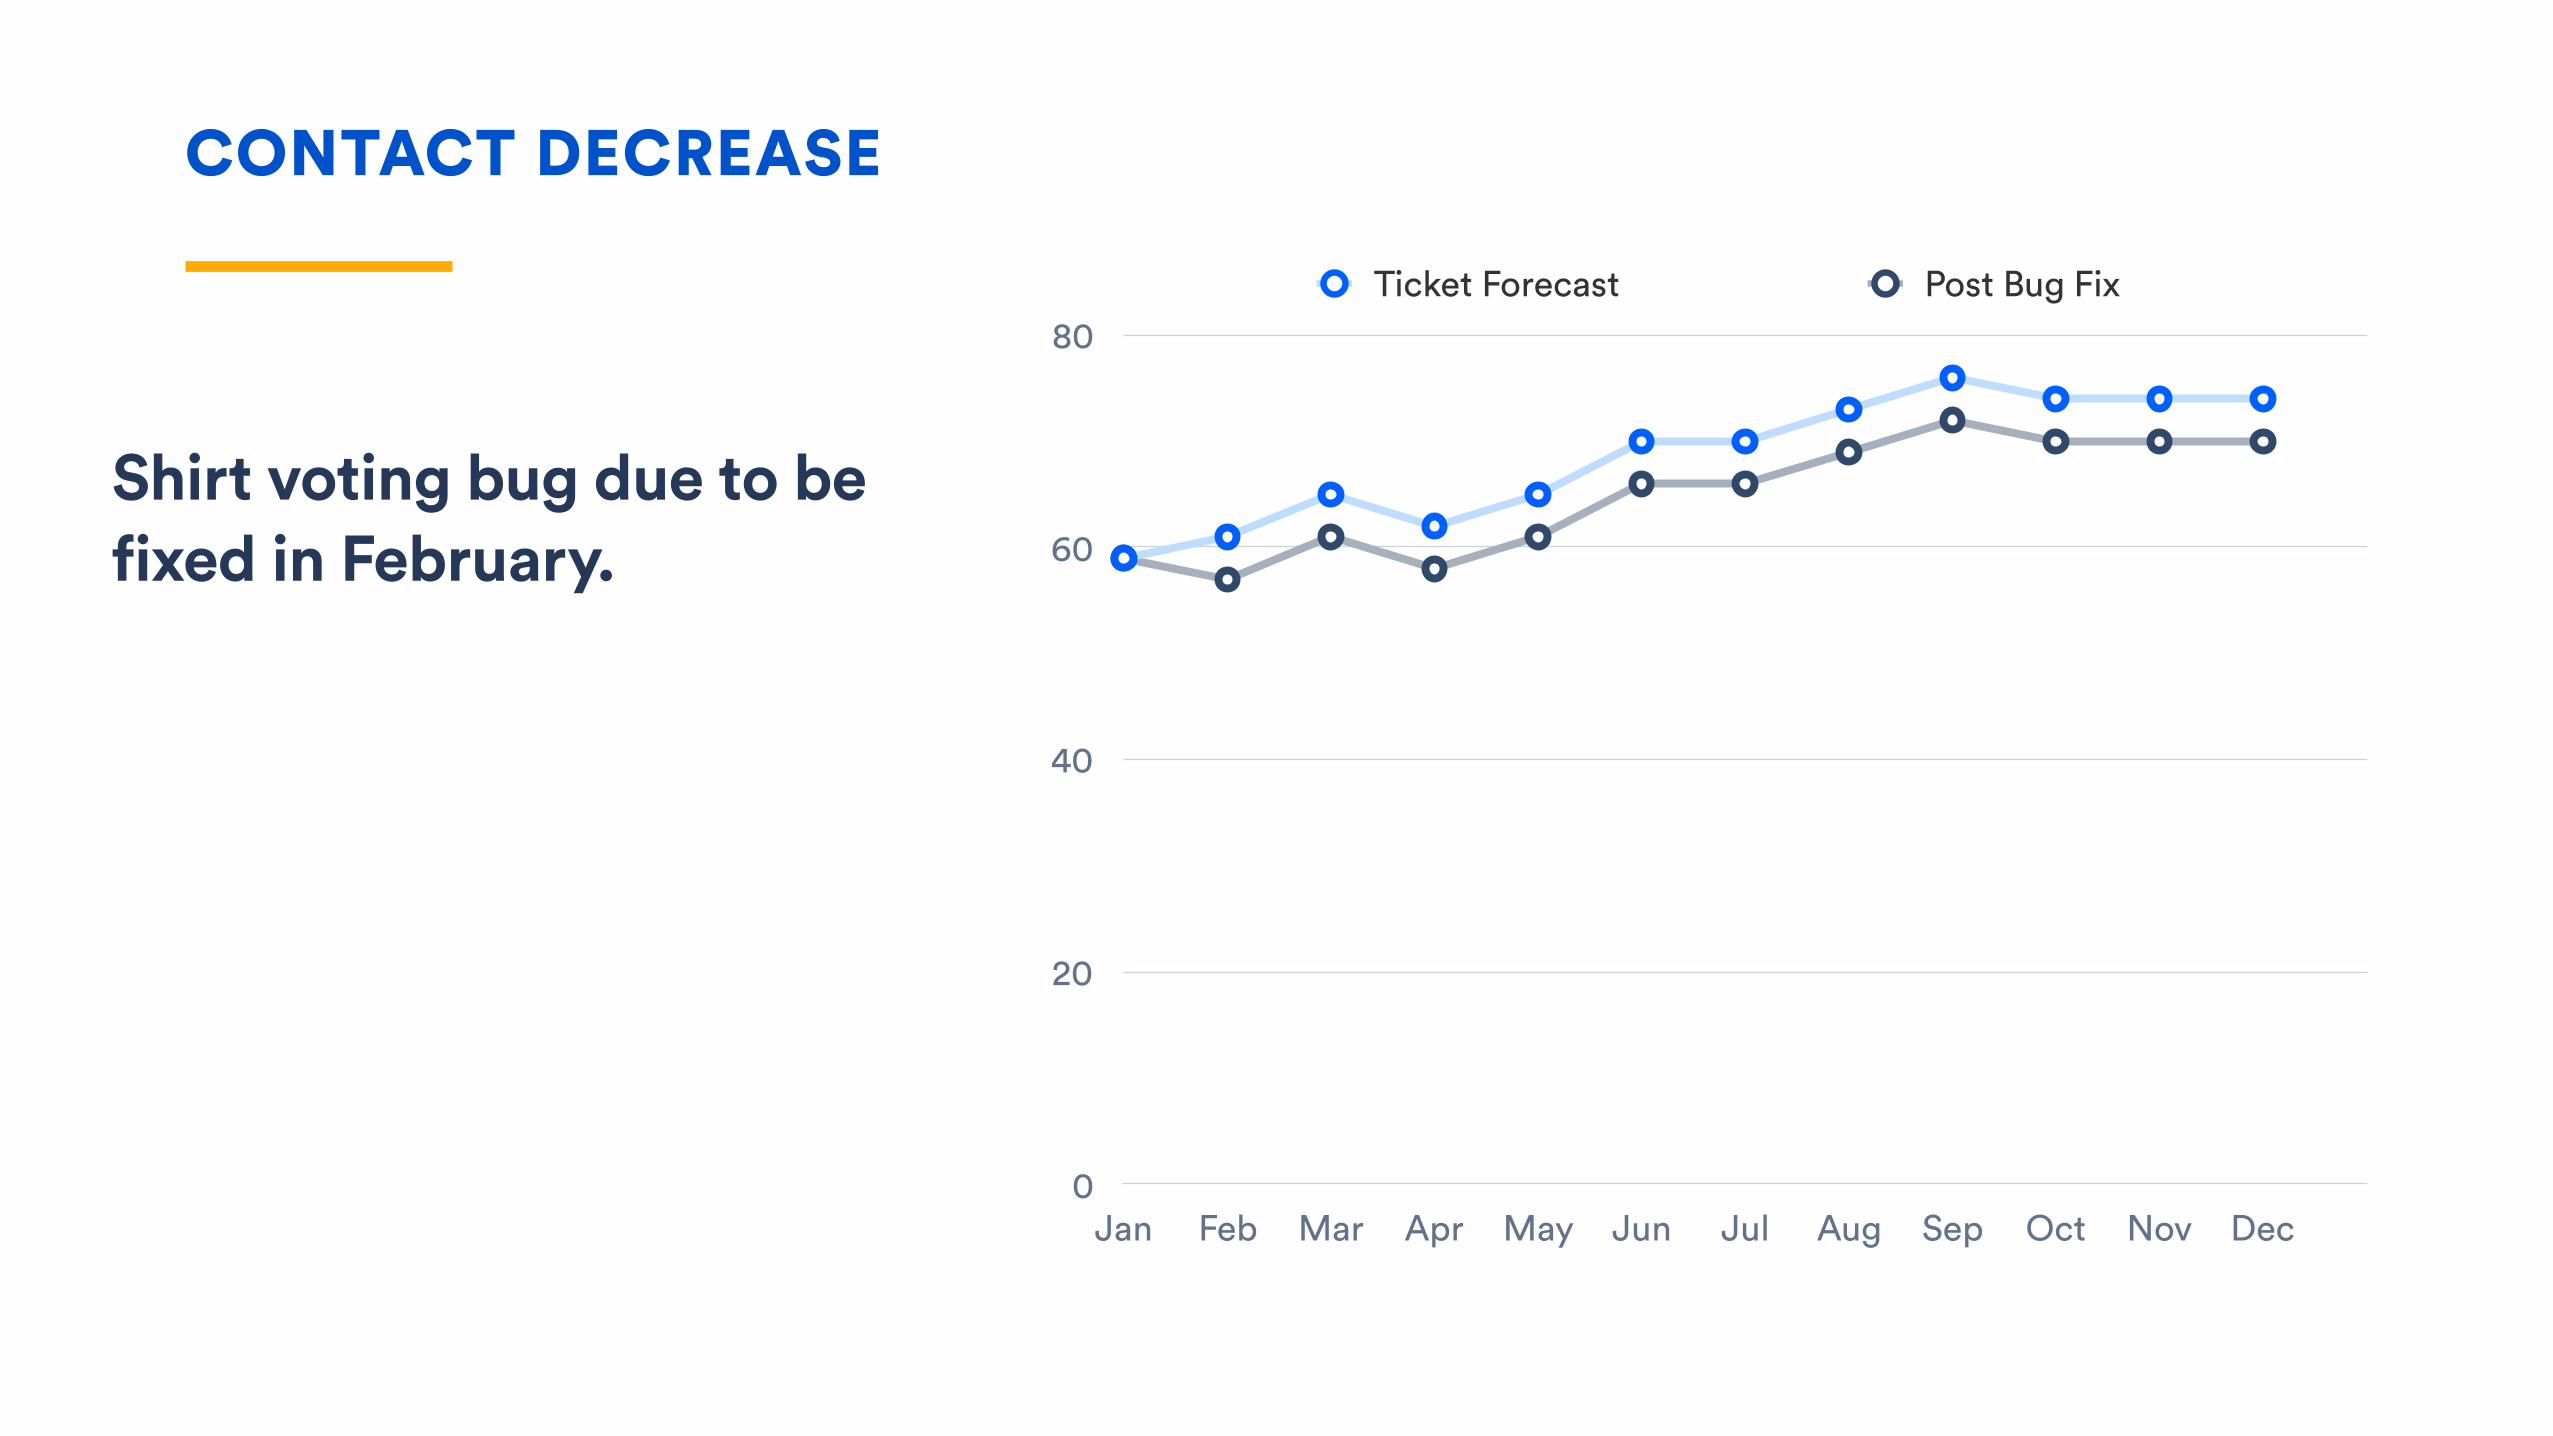
CONTACT DECREASE
0
20
40
60
80
Jan Feb Mar Apr May Jun Jul Aug Sep Oct Nov Dec
Ticket Forecast Post Bug Fix
Shirt voting bug due to be fixed in February.
Contact Decrease Bugfix, feature improvement,
support policy changes.
Contact Increase Rollouts, infrastructure
change.
Initiative Types

SHIRT VOTE
JIRA Service Desk2015
ShipIt 302015
40,000 Customers2014
Game of Codes2014
200 votes
180 votes
120 votes
80 votes
Search for the shirts that interest you
Search
The best predictor of future behaviour is past behaviour
DR PHIL
Gradual Rollouts - The New
0
12.5
25
37.5
50
Rollo
ut %
0%
25%
50%
75%
100%
Week 1 Week 2 Week 3 Week 4 Week 5 Week 6 Week 7
% of Customers With Feature Support Tickets

CONTACT INCREASE
0
22.5
45
67.5
90
Jan Feb Mar Apr May Jun Jul Aug Sep Oct Nov Dec
Ticket Forecast
Search feature due to be Rolled out in May and June
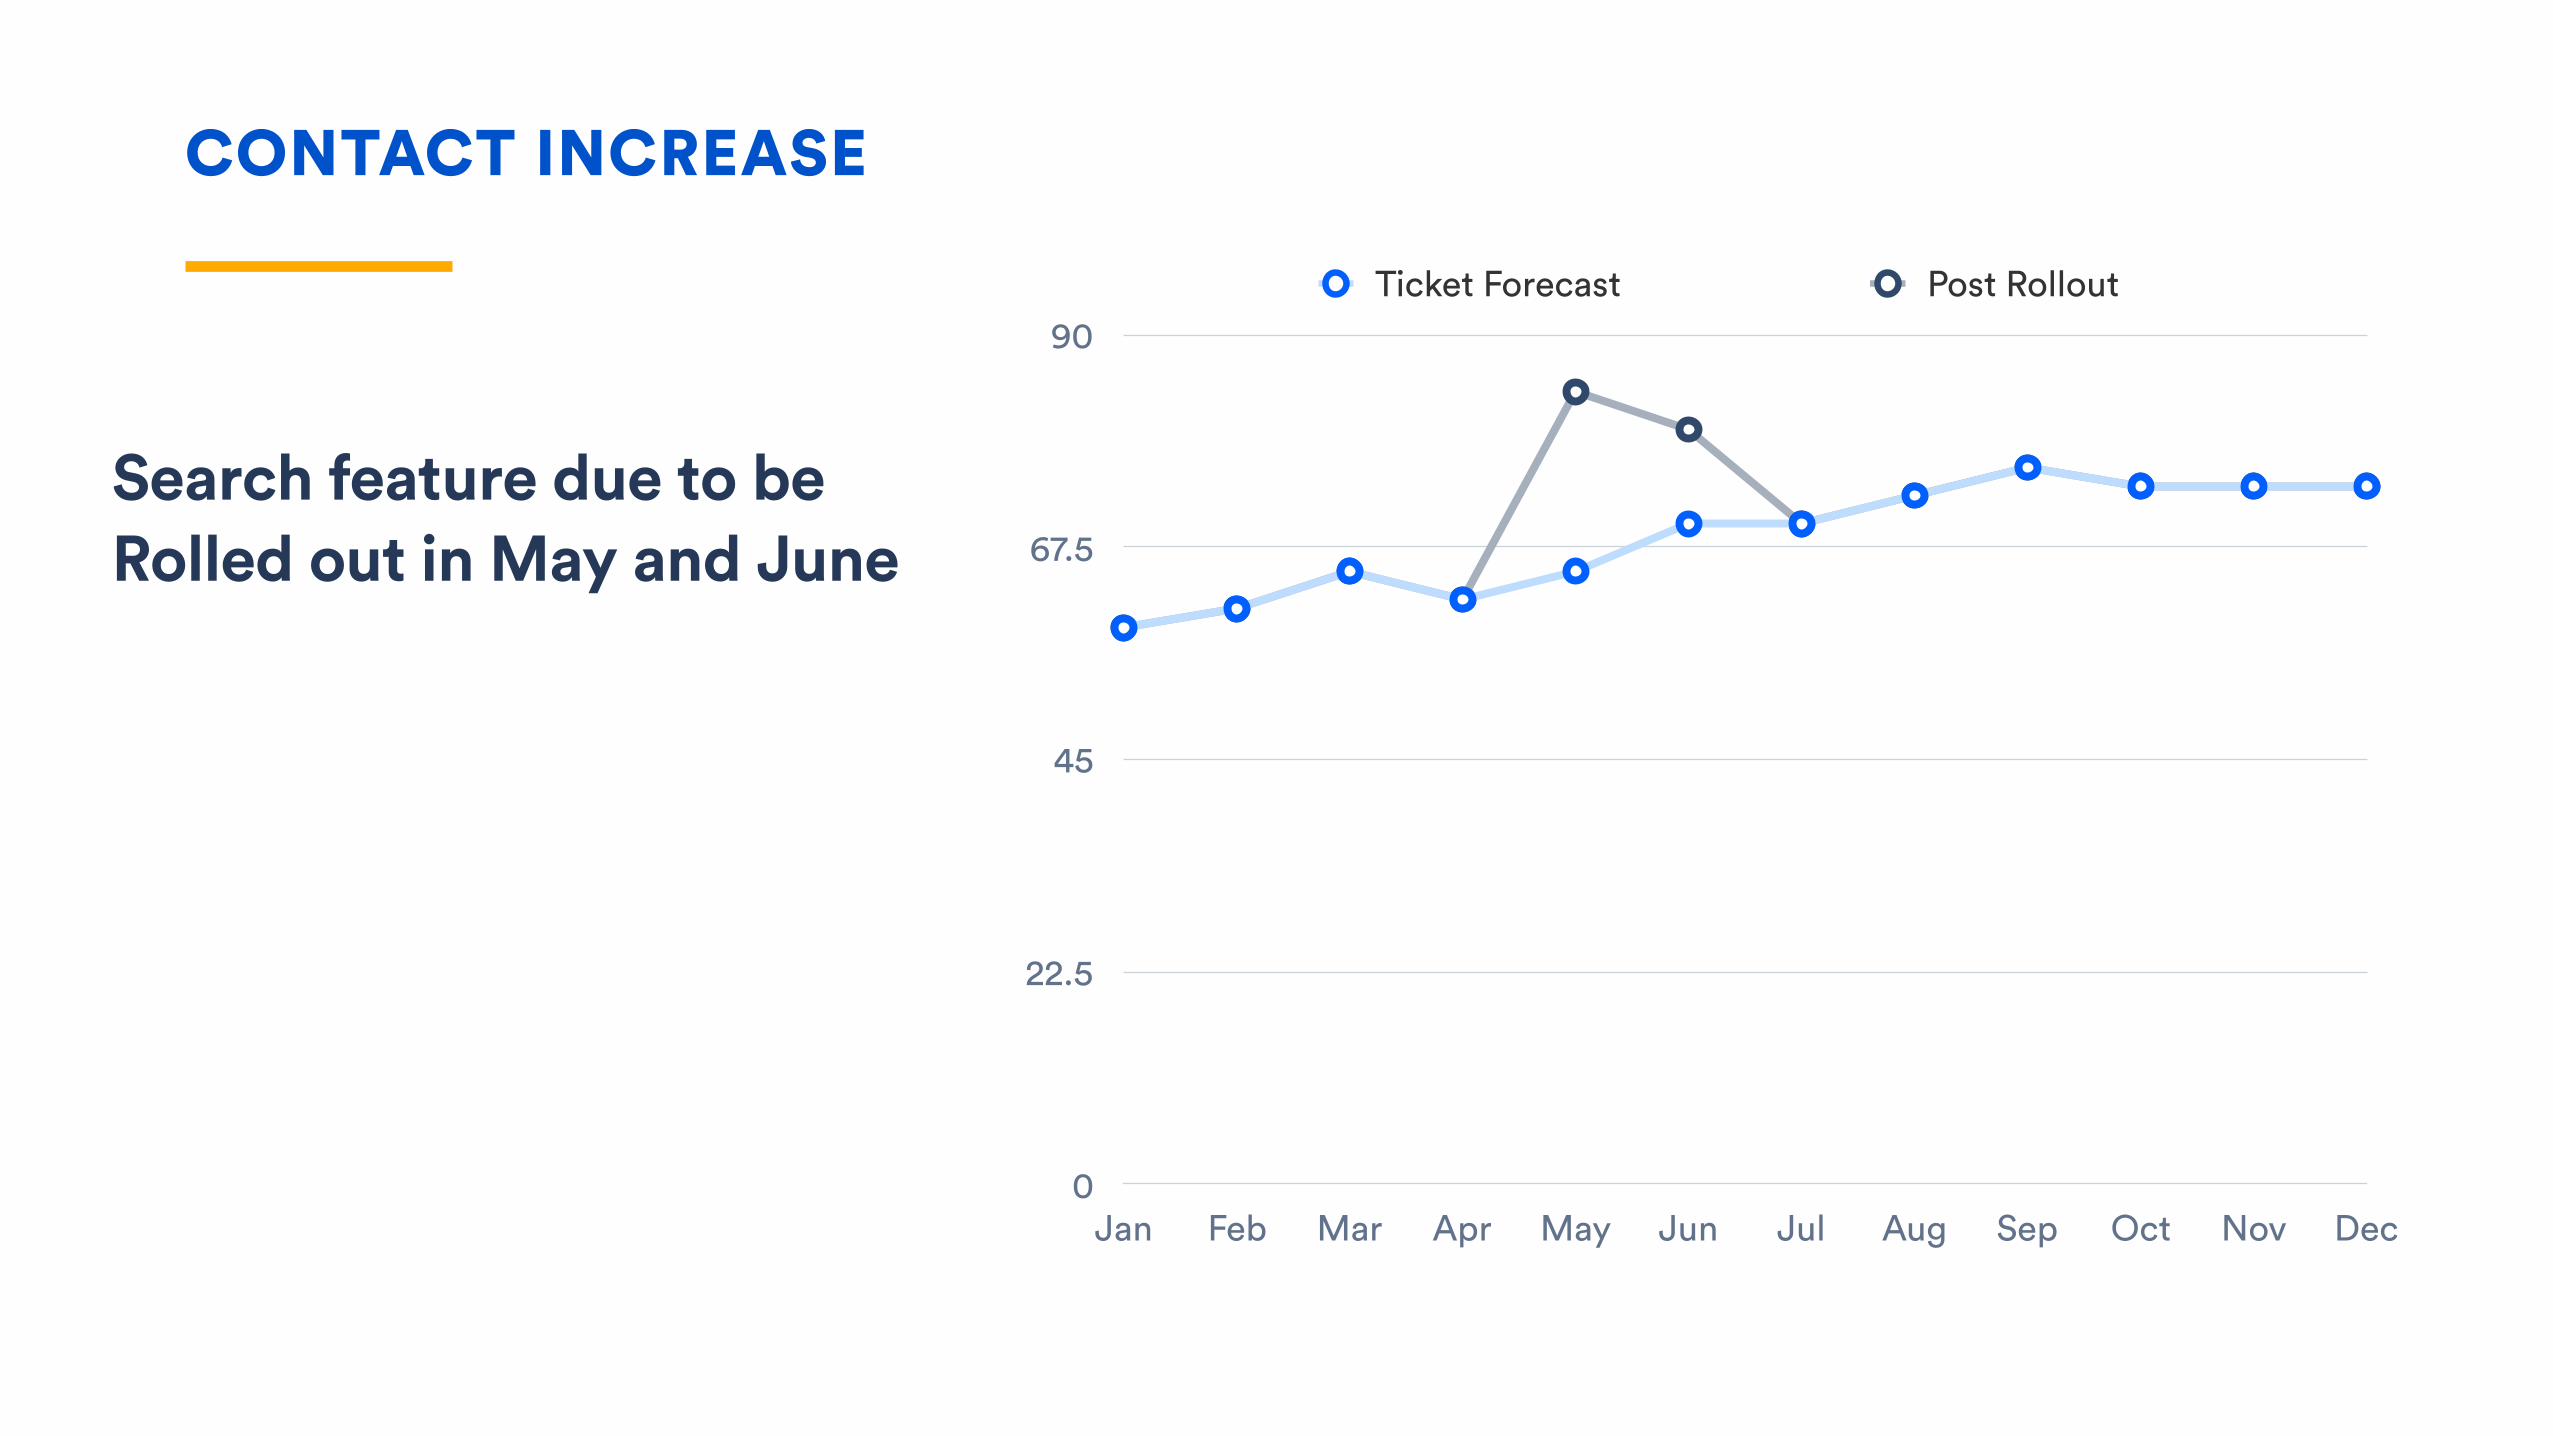
CONTACT INCREASE
0
22.5
45
67.5
90
Jan Feb Mar Apr May Jun Jul Aug Sep Oct Nov Dec
Ticket Forecast Post Rollout
Search feature due to be Rolled out in May and June

INITIATIVES COMBINED
0
22.5
45
67.5
90
Jan Feb Mar Apr May Jun Jul Aug Sep Oct Nov Dec
Baseline Forecast Final Forecast
Including both positive and negative contact changes

Hiring Allows you to
forecast the number of Supporters you
need to hire
Customer Experience Helps to tell the
customer experience story
Development Negotiations
Assists with negotiating
Development priorities
Goal Setting Sets goals to track the success of the
team.
Why is prediction important?

Insights Making things actionable is
fundamental to creating change
In Summary
Prediction You need to look to the future to prepare your
support team and ensure they can provide legendary
support
Reporting Have a Trackable,
Representative and Actionable way to gauge
customer impact.

Thank you!
MATT SAXBY | SERVICE ENABLEMENT TEAM LEAD | ATLASSIAN
MATT HUNTER | SERVICE ENABLEMENT TEAM LEAD | ATLASSIAN
What do you think?
Ask a question to win one of 10 Service
Desk Shirts