how ards should be treated in 2017 - sepse ostrava · how ards should be treated in 2017 2017,...
TRANSCRIPT
How ARDS should be
treated in 2017
2017, Ostrava
Luciano Gattinoni, MD, FRCP
Georg-August-Universität Göttingen
Germany

ARDS
1. Keep the patient alive
2. Cure the disease leading to the syndrome
3. Don‘t add damage
4. Provide the best environment for lung healing (???)
• lung
• body
• respiration
• circulation

Aim of the respiratory support
To buy time with minimal damage
Damaging factors
VentilatorLung
• Mechanical power
• Baby lung size
• Homogeneity
• Recruitability

VILI comes from
Small, inhomogeneous,
recruitable lung

Acute Respiratory Distress Syndrome
Timing Within 1 week of a known clinical insult or new/worsening respiratory symptoms
Chest Imaging a Bilateral opacities – not fully explained by effusions, lobar/lung collapse, or nodules
Origin of Edema
Respiratory failure not fully explained by cardiac failure or fluid overload;
Need objective assessment (e.g., echocardiography) to exclude hydrostatic edema if no risk
factor present
Mild Moderate Severe
Oxygenation b200<PaO2/FiO2< 300
with
PEEP or CPAP ≥ 5 cmH2Oc
100<PaO2/FiO2<200
with
PEEP ≥ 5 cmH2O
PaO2/FiO2<100
with
PEEP ≥ 5 cmH2O
aChest X-ray or CT ScanbIf altitude higher than 1000m,correction factor should be made as follows: PaO2/FiO2 x
(barometric pressure/760)cThis may be delivered non-invasively in the Mild ARDS group
JAMA. 2012;307(23):doi:10.1001/jama.2012.5669

PEEP 5 cmH2O
Clinical PEEP
MILD
PEEP
5 10 15 20
P/F
0
40
80
120
160
200
240
280
320
MODERATE
PEEP
5 10 15 20
P/F
0
40
80
120
160
200
240
280
320
SEVERE
PEEP
5 10 15 20
P/F
0
40
80
120
160
200
240
280
320
Caironi, et al. CCM 2015
MILD MODERATE
SEVERE
ARDS

Caironi, et al. CCM 2015

Baby lung
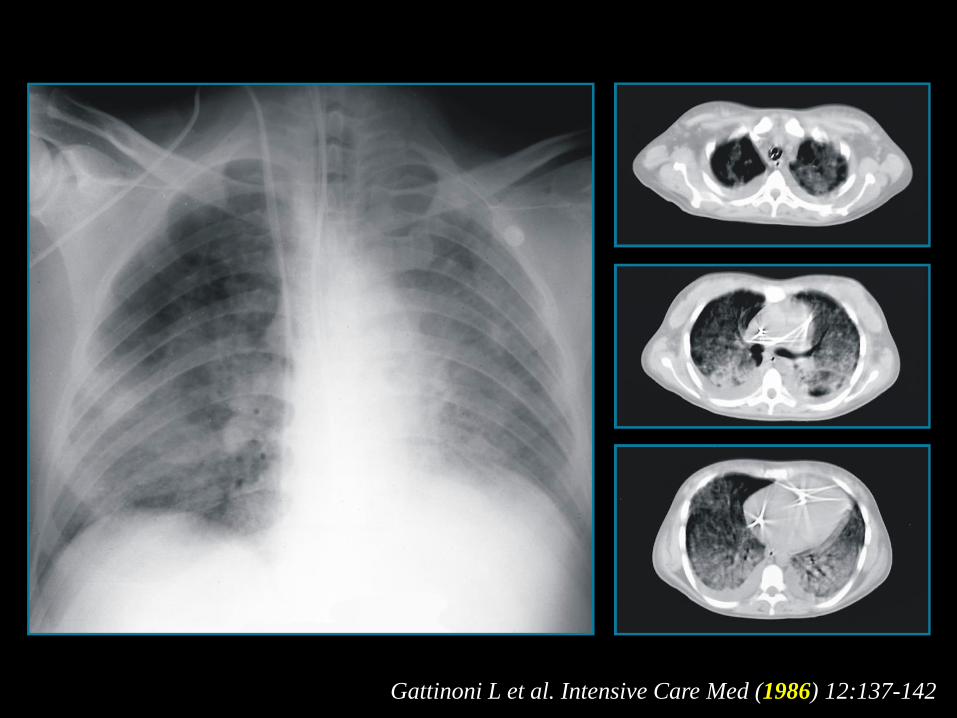
Gattinoni L et al. Intensive Care Med (1986) 12:137-142

CT
nu
mb
ers
fre
qu
en
cy
(%)
50
10
40
30
20
0
-900 -800 -700 -600 -500 -400 -300 -200 -100 0 100
CT numbers (Hounsfield Units)
-1000
Hyperinflate
d
No
rma
lly a
era
ted
Po
orly a
era
ted
No
n a
era
tedNormal
ARDS
Baby Lung
(1987)

Inhomogeneity

Voxel
Vgas
Weighted gas ratio = Vgas1/Vgas0 * fraction of tissue
Gas fraction = Vgas0/Vvoxel

Healthy subject
Moderate ARDS
Severe ARDS
Average ratio in normal subjects : 1.37±0.15

Ki/lung inhomogeneity interaction and gas/tissue
composition
MILD
MODERATE
SEVERE

Recruitability

5 cm H2O
PaO2: 97 mm Hg
d. 59% d. 56%
PaO2: 103 mm Hg
10 cm H2O
d. 53%
PaO2: 104 mm Hg
15 cm H2O
Morphological response (1986)
Intensive Care Med. 1986;12(3):137-42.
d. 70%
PaO2 : 34 mm Hg
5 cm H2O
d. 52%
PaO2 : 49 mm Hg
10 cm H2O
d. 32%
PaO2 : 121 mm Hg
15 cm H2O

0 20 40 60 80
0
20
40
60
80
100
6 dogs,
Oleic acid
Airway pressure [cmH2O]
%
recruitment
inflation
Potential for
recruitment 100%
Opening pressures (2001)
Pelosi et al. Am J Respir Crit Care Med. 2001 Jul 1;164(1):122-30.

Inflation %
5 patients,
ALI / ARDS
Paw [cmH2O]
Recru
itm
en
t an
d i
nfl
ati
on
%
0 5 10 15 20 25 30 35 40 45 50
0
20
40
60
80
100
Recruitment %
Inflation/Recruitment (2001)
Crotti et al. Am J Respir Crit Care Med 2001;
Potential for
recruitment 5%

potential for lung recruitment [% total lung weight]
Fre
quen
cy [
no. of
pat
ients
]
0
2
4
6
8
10
12
14
16
18
20
22
24
Figure 1
ALI patients
ARDS patients
higher
21 ± 10%
(374 ± 236 grams)
lower
5 ± 4%
(59 ± 51 grams)
Potential for lung recruitment
Gattinoni L, Caironi P, Cressoni M, Chiumello D, Ranieri VM, Quintel M,
Russo S, Cornejo R, Bugedo G, NEJM 2006, 354(17):1775-86

0 5 10 15 20 25 30 35 40 45
0
100
200
300
400
500
600
Pressure (cmH2O)
Rec
ruit
edlu
ng
tiss
ue
(g)
Opening Pressures
Mild ARDS (N=5)
Moderate ARDS (N=19)
Severe ARDS (N=19)
Courtesy of dr. Cressoni M.
Plateu pressure limit
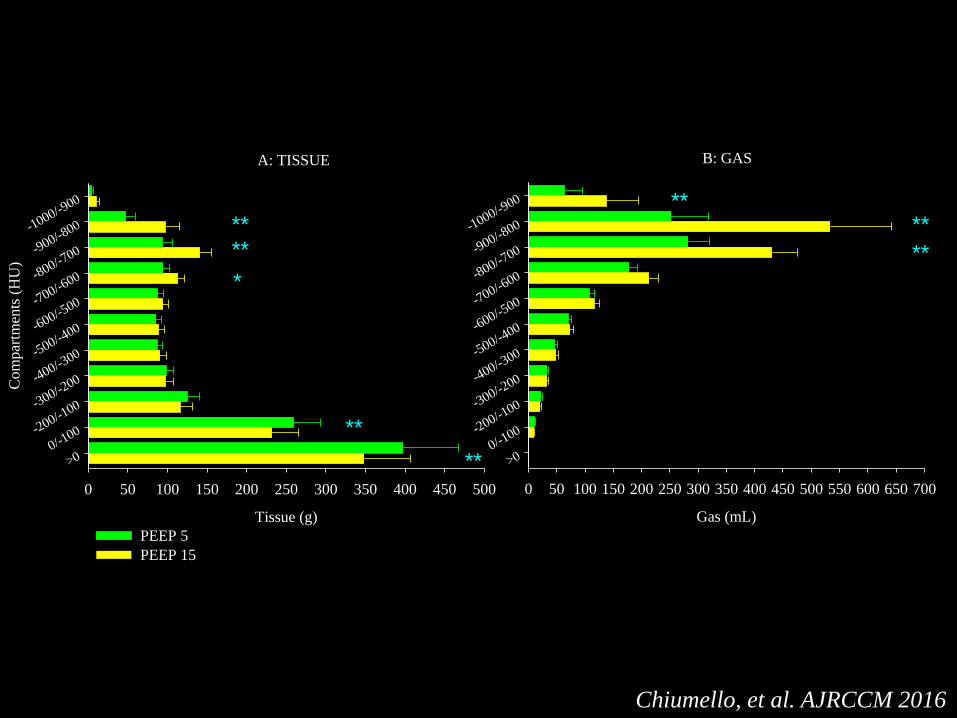
A: TISSUE
Tissue (g)
0 50 100 150 200 250 300 350 400 450 500
Co
mp
artm
ents
(H
U)
-1000/-900
-900/-800
-800/-700
-700/-600
-600/-500
-500/-400
-400/-300
-300/-200
-200/-100
0/-100
>0
B: GAS
Gas (mL)
0 50 100 150 200 250 300 350 400 450 500 550 600 650 700
-1000/-900
-900/-800
-800/-700
-700/-600
-600/-500
-500/-400
-400/-300
-300/-200
-200/-100
0/-100
>0
****
**
**
**
**
**
*
PEEP 5
PEEP 15
Chiumello, et al. AJRCCM 2016

Aim of the respiratory support
To buy time with minimal damage
Damaging factors
VentilatorLung
• Mechanical power
• Baby lung size
• Homogeneity
• Recruitability

Excessive power
VILI comes from
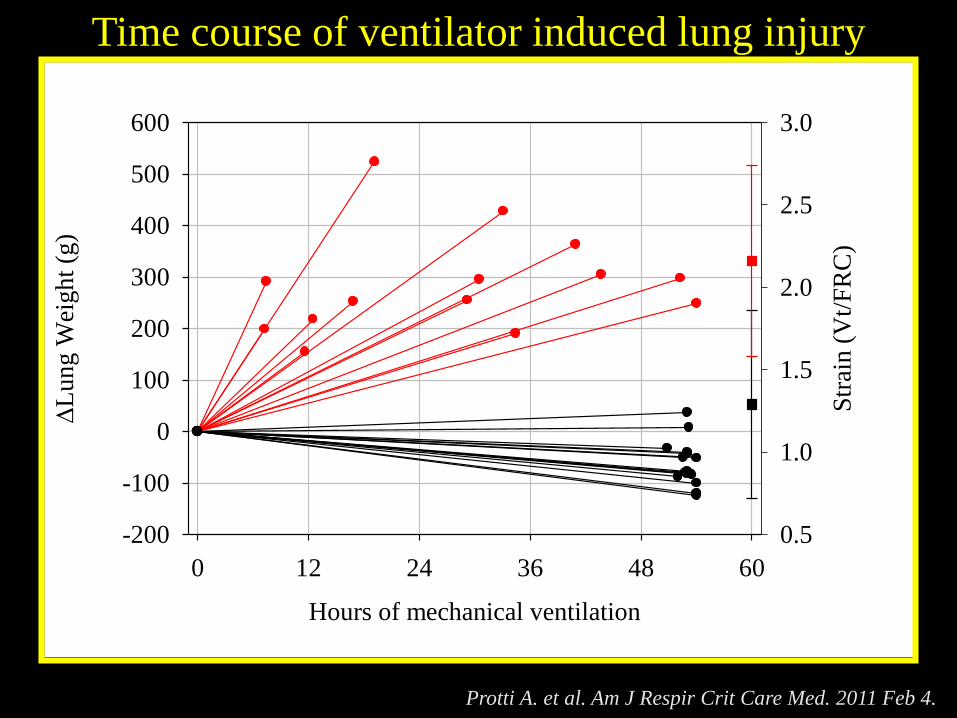
Time course of ventilator induced lung injury
Protti A. et al. Am J Respir Crit Care Med. 2011 Feb 4.
Hours of mechanical ventilation
0 12 24 36 48 60
L
un
g W
eigh
t (g
)
-200
-100
0
100
200
300
400
500
600
Str
ain (
Vt/
FR
C)
0.5
1.0
1.5
2.0
2.5
3.0
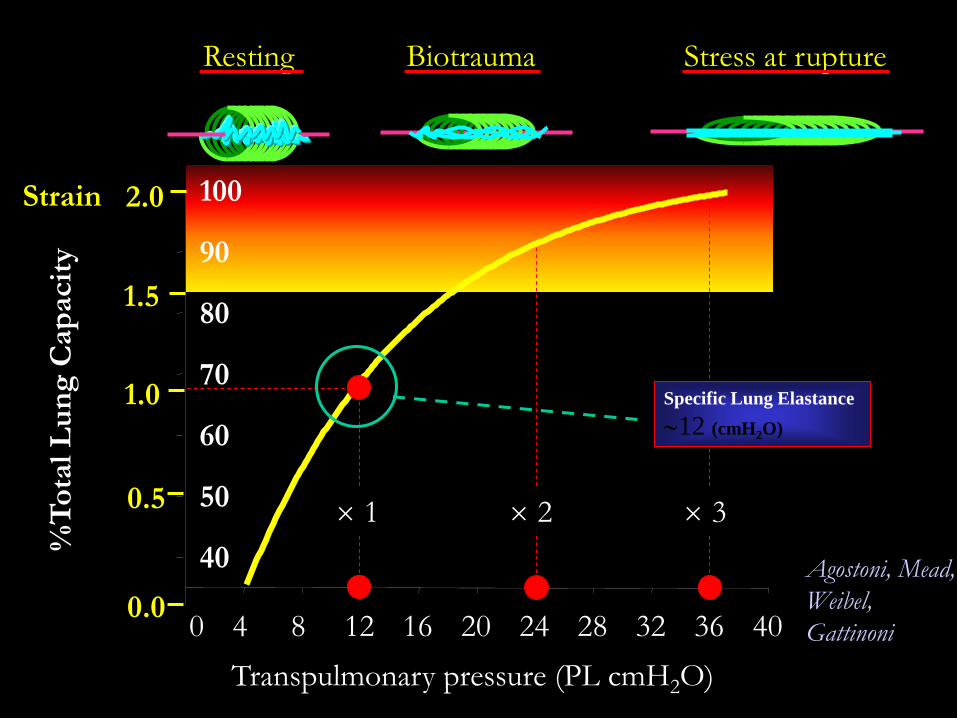
Transpulmonary pressure (PL cmH2O)
0 4 8 12 16 20 24 28 32 36 40
40
50
60
70
80
90
100
%T
ota
l L
un
g C
ap
acit
y
0.0
1.0
2.0
Resting Biotrauma Stress at rupture
Agostoni, Mead,
Weibel,
Gattinoni
Specific Lung Elastance
12 (cmH2O)
1.5
0.5
Strain
1 2 3

Strain (dVgas/Vgas0)
0.0 0.5 1.0 1.5 2.0 2.5 3.0 3.5 4.0
Str
ess
(PL
, cm
H2
O)
0
5
10
15
20
25
30
35
40
45
50
55
Stress-strain curve of healthy pigs
Specific Lung
Elastance
5.8 cmH2O
Protti A. et al. Am J Respir Crit Care Med. 2011 Feb 4.

TLC
FRC
Lun
g V
olu
me
VT 100%
VPEEP 0%
VT 75%
VPEEP 25%
VT 50%
VPEEP 50%
VT 25%
VPEEP 75%
Protti et al. Crit Care Med. 2013 Feb 4.

Mechanical ventilation and VILI
1.Volume
2.Pressure
3.Respiratory Rate
4.Flow
5.Or???
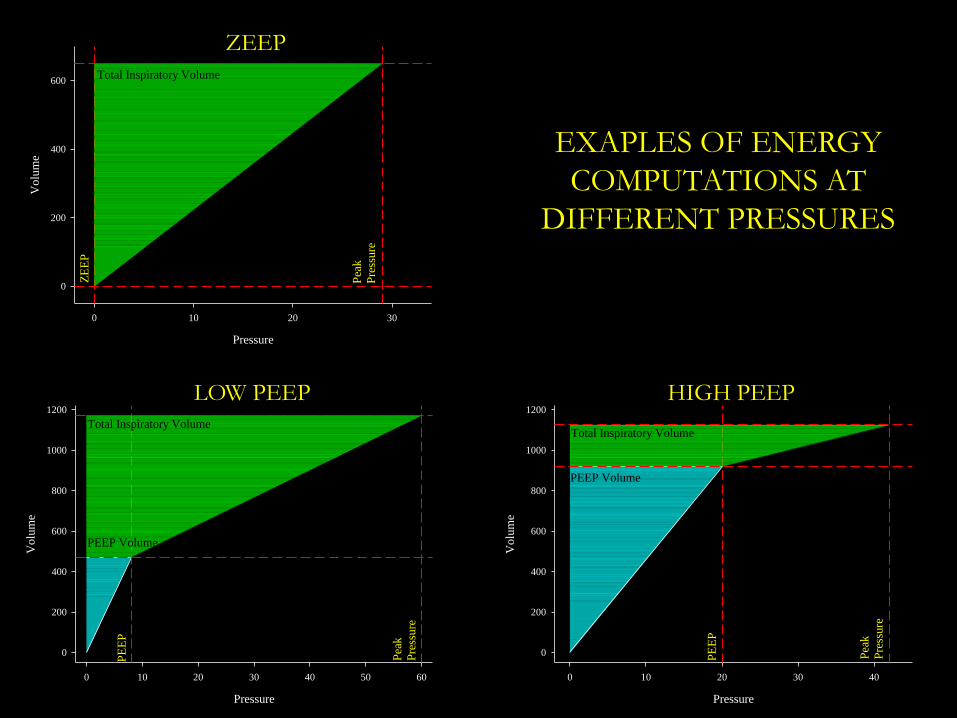
Pressure
0 10 20 30 40 50 60
Volu
me
0
200
400
600
800
1000
1200
PE
EP
Pea
k
Pre
ssure
PEEP Volume
Total Inspiratory Volume
Pressure
0 10 20 30
Volu
me
0
200
400
600Z
EE
P
Pea
k
Pre
ssure
Total Inspiratory Volume
Pressure
0 10 20 30 40
Volu
me
0
200
400
600
800
1000
1200
PE
EP
Pea
k
Pre
ssure
PEEP Volume
Total Inspiratory Volume
EXAPLES OF ENERGY
COMPUTATIONS AT
DIFFERENT PRESSURES
ZEEP
LOW PEEP HIGH PEEP

(𝐸𝑟𝑠 ∙ ∆𝑉) + (𝑅𝑎𝑤 ∙ 𝐹) + 𝑃𝐸𝐸𝑃
Motion equation
Distend the lung Move the gas Keep open
𝑇𝑜𝑡𝑎𝑙 𝑝𝑟𝑒𝑠𝑠𝑢𝑟𝑒
=

Mechanical Power
Distend the lung Move the gas Keep open
𝑇𝑜𝑡𝑎𝑙 𝑝𝑟𝑒𝑠𝑠𝑢𝑟𝑒 ∙ ∆𝑉 ∙ 𝑅𝑅
=𝑃𝑜𝑤𝑒𝑟𝑟𝑠
= 0,098 ∙ 𝑅𝑅 ∙ ∆𝑉2 ∙1
2∙ 𝐸𝑟𝑠 + 𝑅𝑅 ∙
1 + 𝐼: 𝐸
60 ∙ 𝐼: 𝐸∙ 𝑅𝑎𝑤 + ∆𝑉 ∙ 𝑃𝐸𝐸𝑃
ENERGYTIME

Contributions to Power generation
0%
10%
20%
30%
40%
50%
60%
70%
80%
90%
100%
0% 10% 20% 30% 40% 50% 60% 70% 80% 90% 100%
RR TV Peep Driving Press
Percent increase variable
Perc
ent
incre
ase
pow
er
Baseline values
RR 20
TV (L) 0,400
Ers 25
I:E 0,5
Raw 10
PEEP 10
Powerrs 14,90

Summary
❖ ↑ TV Power 2
❖ ↑ ∆Paw Power 2
❖ ↑ RR Power 1.6
❖ ↑ PEEP Power 1

Interaction

Excessive power
VILI comes from
Small, inhomogeneous,
recruitable lung

Chest wall elastance
EtotEtot
cmH2O
StiffStiff
2525
LEEL
“Soft”“Soft”
EwEw
55
StiffStiff
1515
EwEw
“Soft”“Soft”
1515
LEEL
EtottotE

Airway plateau pressure (cmH2O)
0 10 20 30 40 50 60
0
10
20
30
40
50
60
Airway plateau pressure (cmH2O)
0 10 20 30 40 50 60
T
ran
spulm
on
ary
pla
teau
pre
ssue
(cm
H2O
)
0
10
20
30
40
50
60
A
Surgical control group
Medical control group ARDS patients
ALI patients
B
Chiumello et al, Am J Respir Crit Care Med. 2008
Slope PL/Paw = Ew/Etot [0.2 - 0.8]

Always
consider:
𝐕𝐓𝐁𝐚𝐛𝐲 𝐥𝐮𝐧𝐠 𝐬𝐢𝐳𝐞

The ARDS lung is small and not stiff
Normal VT
FRC=
500 ml
2500 ml= 0.2
ARDS VT
FRC=
500 ml
500 ml= 1

Always
consider:
The lung inhomogeneity
Stress raisers Atelectrauma

VV
V V
Lung expansion/gas-free state
STRESS RAISER=(10/1)2/3 = 4.64
10
1
Mead J J Appl Physiol. 1970 May;28(5):596-608.


Mild
(N=82)
Moderate
(N=71)
Severe
(N=12)P
Dishomogeneity 1.49 ± 0.17 1.58 ± 0.29 1.75 ± 0.41 0.03
Extent 0.3 ± 0.1 0.36 ± 0.16 0.46 ± 0.18 0.01
Intensity 2.69 ± 0.27 2.76 ± 0.27 2.84 ± 0.41 0.31
Am J Respir Crit Care Med. 2014 Jan 15;189(2):149-58
Lung dishomogeneity and ARDS
Dishomogeneity2/3 1.30 ± 0.31 1.36 ± 0.44 1.45 ± 0.55
Intensity2/3 1.93 ± 0.42 1.97 ± 0.42 2.01 ± 0.55

Lung Height (%)
1
5
6
7
4
3
2
0
0 20 806040 100
Gas
/ T
issu
e R
ati
o
ARDS Prone
ARDS Supine
Normal Supine
Normal Prone
The gas/tissue ratio as a function of lung height
Gattinoni L et al. In: Tobin MJ (ed) New York

Gattinoni L. et al. Minerva
Anestesiol. 2010 Jun;76(6):448-54
Guerin C. et al. N Engl J Med.
2013 Jun 6;368(23):2159-68

Atelectrauma

10
12
14
8
6
4
2
00 5 10 15 20
PEEP (cmH2O)
End Expiration
End Inspiration
Plateau Pressure (cmH2O)
**
31 ± 1.821 ± 1.8
**
26 ± 1.4
**
46 ± 3.238 ± 2.1R
ec
ruit
me
nt
(g)
Gattinoni et al. Am J Respir Crit Care Med 1995;151:1807-1814
Opening and closing (1995)

Recru
ited
tiss
ue
Pressure
Recruitment-Pressure curve
5 15 25 35
Exp.
Exp.
Opening-closing

Lung protective strategy
Less energy
+
More homogeneous lung