houston/harris county · pdf filehouston/harris county ... harris county, per the u.s. census...
TRANSCRIPT
Hispanic Health ProfileHouston/Harris County
CITY OF HOUSTONDepartment of Health and Human Services
andHispanic Health Coalition
2013
Population Growth, Demographics, Chronic Disease and Health Disparities

Houston Department of Health and Human Services | Hispanic Health Profile: Houston/Harris County 2013 11
Letter from Houston Department of Health and Human Services Letter from Hispanic Health Coalition
January 2, 2013
This health profile highlights the important health issues among the Hispanic population in Harris County. This profile also
helps identify priority areas to promote health equity among the residents of our growing, culturally, and ethnically diverse county.
Hispanics is the largest and fastest growing population group in the nation. In Harris County, per the U.S. Census 2010, the Hispanic population constituted 41 percent of the population. Given the continuous growth and diversity of the Hispanics in our communities, it is the intention of the Houston Department of Health and Human Services (HDHHS), to promote a better understanding among local residents, community-based organizations, community leaders, medical providers, and the public health community of the unique character and circumstances of Hispanic communities. This profile also aims to draw attention to those issues that contribute to health disparities among the Hispanic population.
This profile also represents an effort on the part of HDHHS to provide a “baseline” of indicators of health in Hispanic communities, against which future trends in conditions can be measured and monitored, and appropriate public health actions taken.
We hope that this health profile will support these efforts in City of Houston and across Harris County.
Sincerely,
Stephen L. Williams, M. Ed., M.P.A. Director Houston Department of Health and Human Services
January 2, 2013
On behalf of the Hispanic Health Coalition, we are pleased to be a part of this collaborative to produce
a Hispanic Health Profile of Harris County, Texas that depicts the key health issues faced by Hispanics in Harris County.
Given the lack of comprehensive information about the overall health status of Hispanics in Harris County, we have relied on national and state level data to make decisions. With this profile, we will have important baseline information on the health status of Hispanics, and a valuable resource to prioritize our next steps. We hope that this profile will help initiate a dialogue among stakeholders in terms leveraging available resources, developing partnerships, and identifying potential strategies to address the health issues among Hispanics.
As a coalition of leaders from health care, education, social service, faith-based, business, community and government organizations with experience working with the Hispanic population, we are committed to improve the health of our community as our mission.
I would like to express my gratitude to Mr. Stephen L. Williams and his team at Houston Department of Health and Human Services for their expert contribution in developing, synthesizing, and publishing this timely profile.
Finally, I hope Hispanics living in Houston / Harris County, all the stakeholders and policy makers will find this profile useful in understanding and examining the health disparities and in advocating for health equity.
Thank you,
Norma Olvera, PhD President Hispanic Health Coalition, Houston, Texas

2 Houston Department of Health and Human Services | Hispanic Health Profile: Houston/Harris County 2013
Goals of this profile: u Depict the health of Hispanics living in Houston / Harris County.
u Present information on current demographics, selected health conditions, health behaviors, and quality of life.
u Highlight health disparities and identify priority areas to promote health equity.
u Inform public health interventions and programs to reduce disease burden among Hispanics.
u Provide information to policy makers and community leaders for decision making.
Project DirectorFaith Foreman
Assistant Director, Office of Health Planning, Evaluation & Program Development
Project Oversight and EditingDeborah Banerjee
Report ContributorsVishnu Nepal, Priyanka Acharya, Monica Slentz,
Misael Obregon, Patsy Cano
AcknowledgementWe would like to extend our warmest gratitude to Brenda Reyes, Beverly Nichols, Johanna DeYoung, Norma Olvera, Solly Diaz, Benjamin Hernandez and Lisandra
Lamboy for their valuable comments and for reviewing this profile.
Table of Contents Introduction .................................................................................. 3
Socioeconomic, Cultural and Environmental ConditionsDemographics ................................................................................ 6Language Issues ........................................................................... 12Household Characteristics .............................................................. 13Poverty ......................................................................................... 15Education ...................................................................................... 17Occupation ................................................................................... 18Insurance ...................................................................................... 19Other Issues Impacting Health ......................................................... 20Summary and Recommendations ..................................................... 22
Health Conditions and Quality of LifeStroke .......................................................................................... 24Diabetes ........................................................................................ 25Cancer ......................................................................................... 28Overweight/Obesity ........................................................................ 29High Blood Pressure and High Cholesterol ........................................ 31Mental Health ................................................................................. 32Quality of Life ................................................................................. 34Summary and Recommendations ..................................................... 36
Health BehaviorsAlcohol Consumption ..................................................................... 38Smoking ........................................................................................ 39Cancer Screening .......................................................................... 40Fruit/Vegetable Consumption and Physical Activity ............................ 41Summary and Recommendations ..................................................... 42
Other Health ConcernsTeen Pregnancy.............................................................................. 44Prenatal Care ................................................................................. 45HIV ............................................................................................... 46Summary and Recommendations ..................................................... 47
References ................................................................................. 48

Houston Department of Health and Human Services | Hispanic Health Profile: Houston/Harris County 2013 3
IntroductionThe Houston Department of Health and Human Services (HDHHS) has developed baseline neighborhood health profiles in the past, which highlighted important health issues facing residents. More recently, there is a growing interest in health profiles for population subgroups, such as by race/ethnicity, and to document and monitor the health status of these sub-populations. Following this trend, this document presents a snapshot of information on health issues affecting Hispanics/Latinos living in Harris County.
Tremendous growth in the Hispanic population across the U.S. has been attributed to higher fertility rates and a large influx of new immigrants. Texas has a large population of Hispanics and Harris County, in particular, has experienced a huge growth in this population.
This profile uses the term “Hispanic” to refer to any person of Cuban, Mexican, Puerto Rican, South or Central American or other Spanish culture or origin, regardless of race as indicated in the Standards for the Classification of Federal Data on Race and Ethnicity (Humes, Jones, & Ramirez, 2011). However, it is important to recognize the extensive diversity among those with Hispanic ethnicity since cultural norms, social status and socio-demographic factors can be vastly different depending in part on the region from which they originate. Hispanics can self-identify with any of the race groups.
While Hispanics play a significant role in the economic, social, and cultural progress of our county, they also face tremendous health disparities. The Centers for Disease Control and Prevention (CDC) has listed heart disease, cancer, unintentional injuries, stroke, and diabetes as some of the leading causes of illness and death among Hispanics. Other conditions and risk factors that significantly affect Hispanics include asthma, HIV/AIDS, obesity, liver disease and chronic obstructive pulmonary disease (COPD) (CDC, 2012).We have aligned the content areas with the nationally identified health concerns of Hispanics. Some priority issues among Hispanics, for example unintentional injuries, were not included in the profile because either the data were not available at the local level or the burden of condition did not seem alarming in Harris County. Many of these health
conditions are exacerbated by socioeconomic factors such as low educational attainment, language/cultural barriers, lack of access to health care, lack of health insurance, and immigration status.
The health of Hispanics in the U.S. is shaped by demography, disease trends, and social forces (Vega, Rodriguez & Gruskin, 2009).
This profile will present information on some of the factors based on the socio-ecological framework depicted in the Dahlgren and Whitehead framework as shown above.
According to Dahlgren and Whitehead (1991), health is impacted by many factors. These can be at the individual level (age, sex, hereditary factors, and individual lifestyle factors); at the community level (social and community networks) and at a broader level encompassing general socioeconomic, cultural and environmental conditions (agriculture and food production, education, work environment, living and working conditions, unemployment, health care services and housing). Changes in any or a combination of any of the above factors can have a profound impact on the health of a community.
Contextual Factors that Impact Health
Source: Dahlgren and Whitehead (1991)
(Continued on next page)

4 Houston Department of Health and Human Services | Hispanic Health Profile: Houston/Harris County 2013
(Introduction continued)
The profile begins with information on the broader macro-level factors that impact the health of Hispanics in Harris County. These are followed by factors at the community level such as social and community networks and a brief discussion on other health concerns of Hispanics in Harris County. Finally, factors related to individual and lifestyle behaviors are presented.
Wherever possible, data on Hispanics in Harris County are compared with the non-Hispanic White population, henceforth referred as to “Whites”. In some cases, data on Hispanics are unavailable at the county level, where state and national level data are presented instead. This brings to focus the gaps in available data, the need to collect detailed health data at a subgroup level due to the diverse backgrounds and country of origin of Hispanics that live in Harris County, issues in accuracy of mortality data, underestimation and classification of Hispanic groups in the U.S. Census present challenges in accessing accurate data to monitor, track trends and quantify health disparities among Hispanics.
The CDC’s Healthy People 2020 goals strive to achieve health equity, eliminate disparities, and improve the health of all groups by 2020 (Katzmarzyk & Staiano, 2012). It is hoped that community based organizations, government agencies, policy makers and community members will use this profile to initiate a dialogue to inform and discuss the current health status of Hispanics in Harris County and develop strategies to address disparities. Thus, a set of recommendations is presented at the end of each section for specific action items relevant for individuals, organizations, and communities.
Key Findingsu Overall socioeconomic status (primary indicators
being education, income, and occupation) of
Hispanics living in Houston / Harris County is far
lower than that of Whites.
u Health conditions that need to be addressed among
Hispanics include overweight/obesity and diabetes
among younger age group (<40 years).
u Behavioral risk factors include lack of physical
activity, unhealthy eating behaviors, binge drinking,
and lack of adherence to screening behaviors.
u High uninsurance rates result in poor health
outcomes due to lack of access to care.
u Some quality of life indicators are also poorer
among Hispanics compared to Whites.

Houston Department of Health and Human Services | Hispanic Health Profile: Houston/Harris County 2013 5
Socioeconomic, Cultural and Environmental Conditions
u Demographics
u Language Issues
u Household Characteristics
u Poverty
u Education
u Occupation
u Insurance
u Summary and Recommendations

6 Houston Department of Health and Human Services | Hispanic Health Profile: Houston/Harris County 2013
Hispanic Population Growth in the U.S.
The projected Hispanic population of the United States on July 1, 2050 will be
132.8 million. According to this projection, Hispanics will constitute 30 percent
of the nation’s population by 2050.
Source: Population projections <http://www.census.gov/newsroom/releases/archives/population/cb08-123.html> accessed on 10/10/2012.
The largest single Hispanic subpopulation by origin in a state is Mexican
in California at 11.8 million people. Texas is home to another 8.4 million
Mexicans. Together, these two states make 61 percent of the total Mexican
population in the U.S.
Source: Pew Hispanic Center, re-leased June 27, 2012. www.pewhispanic.org
Since 2000, among Hispanics, the foreign-born share of each major Hispanic
origin group has declined. Overall, the share of Hispanics that is foreign born
decreased from 40 percent in 2000 to 37 percent in 2010. The largest decline
—13 percentage points—was among Salvadorians (from 76% to 62%).
Source: Pew Hispanic Center, Tabulation of 2010 ACS and 2000 Census, released June 27, 2012. www.pewhispanic.org
U.S. Hispanics by Age and Generation in thousands
The Hispanic population in the U.S. grew from approximately 35.2 million people in 2000 to 50.7 million in 2010—a 44 percent increase.Pew Hispanic Center, released June 27, 2012.
Houston Department of Health and Human Services | Hispanic Health Profile: Houston/Harris County 2013 7
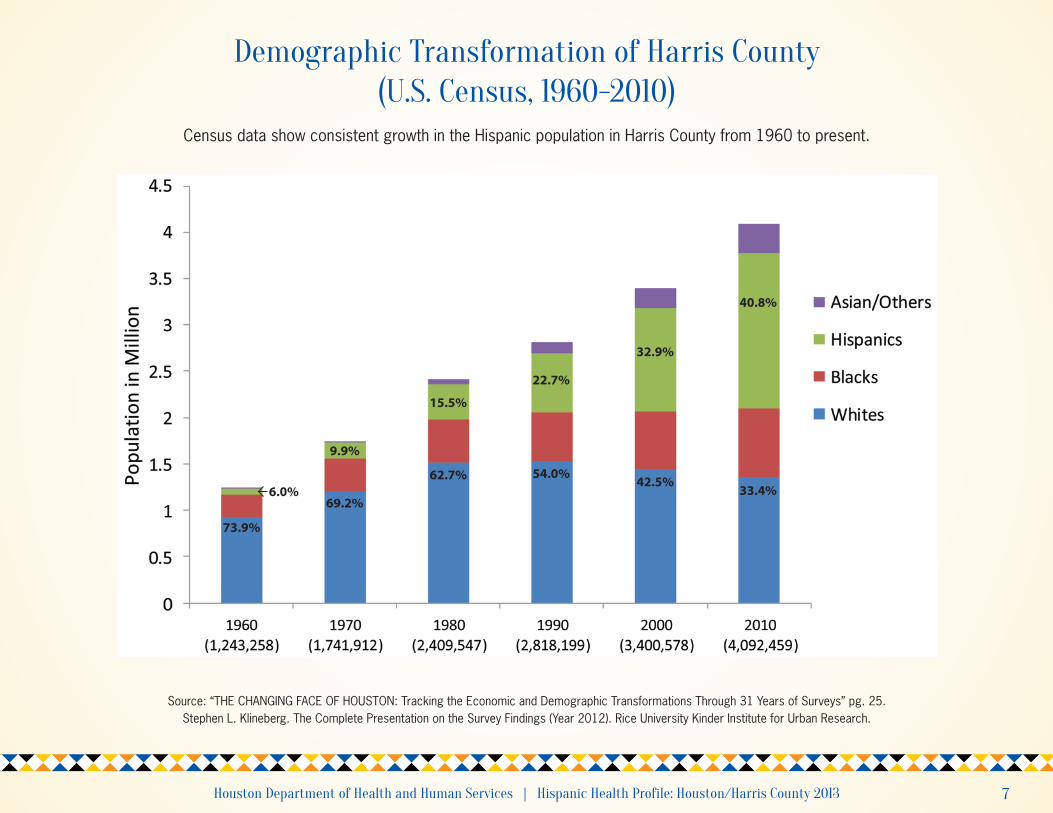
Demographic Transformation of Harris County(U.S. Census, 1960-2010)
Source: “THE CHANGING FACE OF HOUSTON: Tracking the Economic and Demographic Transformations Through 31 Years of Surveys” pg. 25. Stephen L. Klineberg. The Complete Presentation on the Survey Findings (Year 2012). Rice University Kinder Institute for Urban Research.
Census data show consistent growth in the Hispanic population in Harris County from 1960 to present.
6.0%
73.9%
69.2%
62.7% 54.0%42.5%
33.4%
40.8%
32.9%
22.7%
15.5%
9.9%
8 Houston Department of Health and Human Services | Hispanic Health Profile: Houston/Harris County 2013
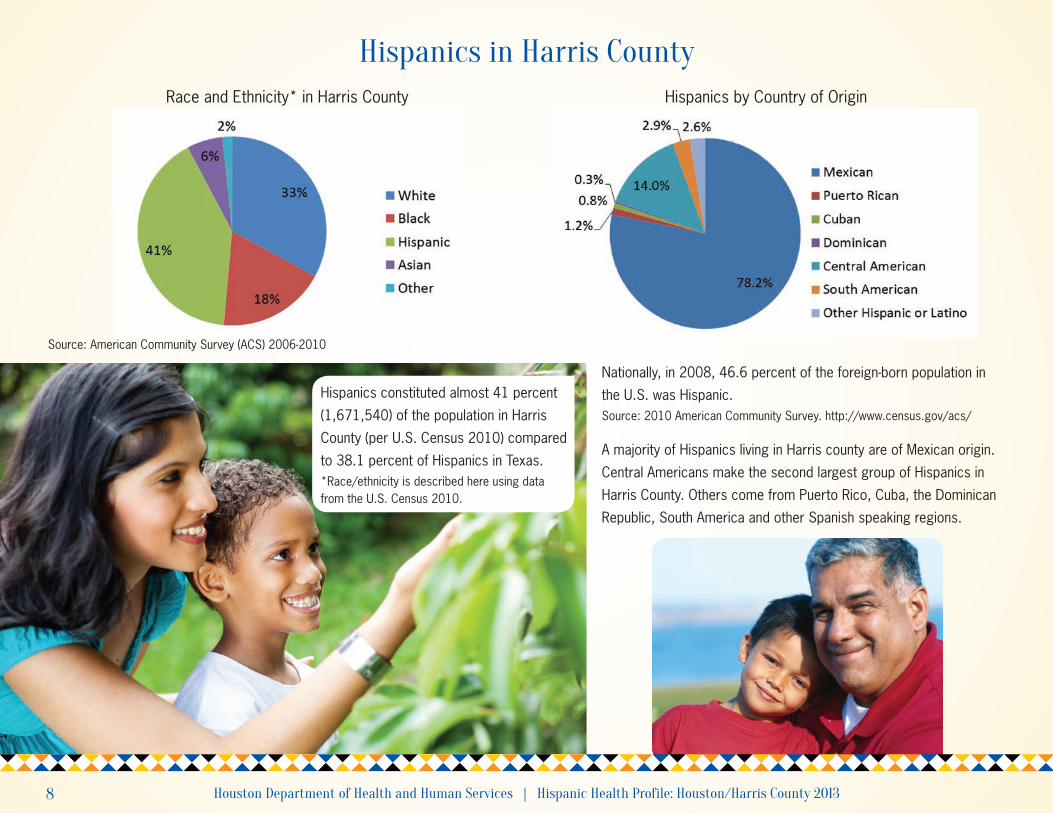
Hispanics in Harris CountyRace and Ethnicity* in Harris County Hispanics by Country of Origin
Source: American Community Survey (ACS) 2006-2010
Nationally, in 2008, 46.6 percent of the foreign-born population in
the U.S. was Hispanic.Source: 2010 American Community Survey. http://www.census.gov/acs/
A majority of Hispanics living in Harris county are of Mexican origin.
Central Americans make the second largest group of Hispanics in
Harris County. Others come from Puerto Rico, Cuba, the Dominican
Republic, South America and other Spanish speaking regions.
Hispanics constituted almost 41 percent
(1,671,540) of the population in Harris
County (per U.S. Census 2010) compared
to 38.1 percent of Hispanics in Texas.*Race/ethnicity is described here using data from the U.S. Census 2010.

Houston Department of Health and Human Services | Hispanic Health Profile: Houston/Harris County 2013 9
Population PyramidHispanics (Shaded) and Whites
Harris County Population Pyramid – U.S. Census 2010
A large proportion of Hispanics in Harris County are younger in age while the White population is more mature as seen in the bulge in the shaded pyramid in the 40
and younger age groups.
Aging Adults
The Hispanic population is
generally considered younger
at age and Harris County bears
this out, with only 4 percent of
Hispanics currently being 65 and
over. Nevertheless, the population
of elderly Hispanics is expected
to significantly increase in the
coming decades. On average,
Hispanics aged 65 and above in
the U.S. are poorer, less educated
and have higher rates of many
chronic diseases than their non-
Hispanic counterparts. Harris
County does not seem to be an
exception to this.

10 Houston Department of Health and Human Services | Hispanic Health Profile: Houston/Harris County 2013
Proportion of Hispanic Population by Census TractAll Hispanics Hispanics of Mexican Origin
Source: ACS, 2006-2010
Census tracts located to the north and southeast of downtown Houston have large proportions of Hispanics. Hispanics of Mexican origin mirror the same pattern
as that of overall Hispanics, as they comprise the majority (close to 80%) of Hispanics in Harris County.
Extensive literature exists on relationships between neighborhood resources such
as social cohesion and social networks and many health outcomes. Large studies
such as the Hispanic-Established Populations for Epidemiologic studies of the Elderly
(H-EPESE) found that a concentration of certain Hispanic groups (Mexican Americans)
in neighborhoods sometimes buffer the negative effects of poverty on health.
Social networks promote mutual trust and norms of reciprocity that result in greater
social cohesion. This explanation, although widely accepted, has not been conclusively
proven. Hispanics, particularly Mexican Americans, report having a wider and deeper
social networks and more social ties than other ethnic groups. This wider social
network is hypothesized to engender greater social cohesion among this group.
However, in high poverty neighborhoods, it is possible that social and economic
factors overshadow the positive effects of social cohesion.
A majority of Hispanics according to a Pew study (51%), say they most often identify themselves by their family’s country of origin; just 24% say they prefer a pan-ethnic label.
Source: Pew Research Centerhttp://www.pewhispanic.org/2012/04/04/ when-labels-don’t-fit-hispanics-and-their-views-of-identity/
up to 20%
20.1% - 40%
40.1% - 60%
60.1% - 80%
80.1% - 100%
Houston Department of Health and Human Services | Hispanic Health Profile: Houston/Harris County 2013 11
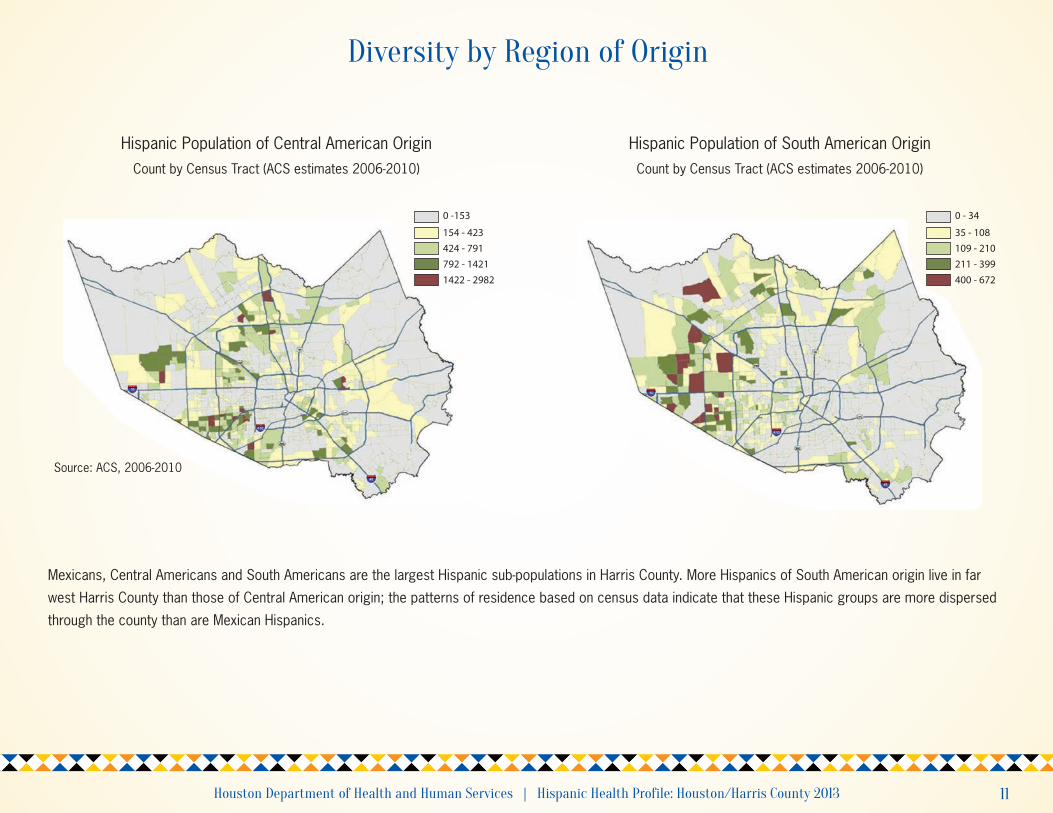
Diversity by Region of Origin
Hispanic Population of Central American OriginCount by Census Tract (ACS estimates 2006-2010)
Hispanic Population of South American OriginCount by Census Tract (ACS estimates 2006-2010)
Source: ACS, 2006-2010
Mexicans, Central Americans and South Americans are the largest Hispanic sub-populations in Harris County. More Hispanics of South American origin live in far
west Harris County than those of Central American origin; the patterns of residence based on census data indicate that these Hispanic groups are more dispersed
through the county than are Mexican Hispanics.
0 -153
154 - 423
424 - 791
792 - 1421
1422 - 2982
0 - 34
35 - 108
109 - 210
211 - 399
400 - 672

12 Houston Department of Health and Human Services | Hispanic Health Profile: Houston/Harris County 2013
Spanish Speakers with Limited English Proficiency by Census Tract
Source: ACS, 2006-2010
Twenty-one percent of the
Hispanic population in Harris
County does not speak English
well and 12 percent do not speak
English at all.
Language issues place Hispanics
at a disadvantage in accessing
services, employment and
education.
Limited English Proficient is defined as “individuals who do not speak English as their primary language and who have a limited ability to read, speak, write or
understand English” .
A Pew Hispanic Center national survey reports that Hispanics express a strong, shared connection to the Spanish language. More than eight-in-ten (82%) Latino adults say they speak Spanish, and nearly all (95%) say it is important for future generations to continue to do so.
Source: Pew Hispanic Center, http://www.pewhispanic.org/2012/04/04/when-labels-dont-fit-hispanics-and-their-views-of-identity/
Count by Census Tract (Quintile Classification)
0 - 47
48 - 192
193 - 463
464 - 926
927 - 3,202

Houston Department of Health and Human Services | Hispanic Health Profile: Houston/Harris County 2013 13
Household Type
Source: ACS, 2006-2010
Smaller proportions of Hispanics live in non-family households compared to Whites in Harris County. The
proportion of female-headed households is higher among Hispanics. According to the National Poverty
Center, nationwide poverty rates are highest for families headed by single women, particularly if they are
Black or Hispanic. In 2010, 31.6 percent of households headed by single women were poor, while 15.8
percent of households headed by single men and 6.2 percent of married-couple households lived in poverty.
(National Poverty Center, University of Michigan, http://npc.umich.edu/poverty/).
Compared to Whites, fewer Hispanics own the homes they live in (Williams & Collins, 2001). Home ownership
is a crucial factor in wealth building and has an indirect influence on health (Cairney & Boyle, 2004).
u 51 percent of Hispanic households are
“owner-occupied” compared to
69 percent of White households
u 16 percent of Hispanic households are
considered “overcrowded” compared
to 1 percent of White households
Hispanics by Household Type Whites by Household Type
Other household information:
n Married-couple family
n Male Householder
n Female householder
n Nonfamily households

14 Houston Department of Health and Human Services | Hispanic Health Profile: Houston/Harris County 2013
Overcrowding among Hispanics
“Overcrowding” is defined by the Census as more than one person per room in a household.
According to the World Health Organization, overcrowding may be a factor in poorer health outcomes due to greater likelihood of transmission of infectious disease, increased stress, and more respiratory diseases.
Hispanic Overcrowding (Percent of Hispanic Households)Count by Census Tract (ACS estimates 2006-2010)
The majority of census tracts in Harris County reflect a high proportion of overcrowding among Hispanic households.
Source: http://www.tdhca.state.tx.us/glossary.htm
Hispanic Overcrowding Relative to that of Harris County Overall*
* Approximately 6.6% of all occupied housing units in Harris County are overcrowded.
similar to or less than Harris County
up to 25% above Harris County
up to 50% above Harris County
up to 75% above Harris County
more than 75% above Harris County

Houston Department of Health and Human Services | Hispanic Health Profile: Houston/Harris County 2013 15
Poverty by Race/Ethnicity
Hispanics: Poverty by Age Whites: Poverty by Age
Poverty by Race/Ethnicity Forty-eight percent of Hispanics living in poverty in Harris County are children
under the age of 18 years compared to 21 percent among Whites.
Compared to 7 percent among White, a larger proportion of the Hispanic
population (26%) had incomes below the poverty level.
Overall, half of the impoverished population living in Harris County are Hispanics
compared to 10 percent Whites.
Sixteen percent of Hispanic households received food stamps or other social
assistance, compared to 4 percent of White households.
Source: ACS, 2006-2010
Source: U.S. Census 2010
n Under 12
n 12-17 years
n 18-34 years
n 35-64 years
n 65 and above
n White
n Black
n Asian and Others
n Hispanic
16 Houston Department of Health and Human Services | Hispanic Health Profile: Houston/Harris County 2013
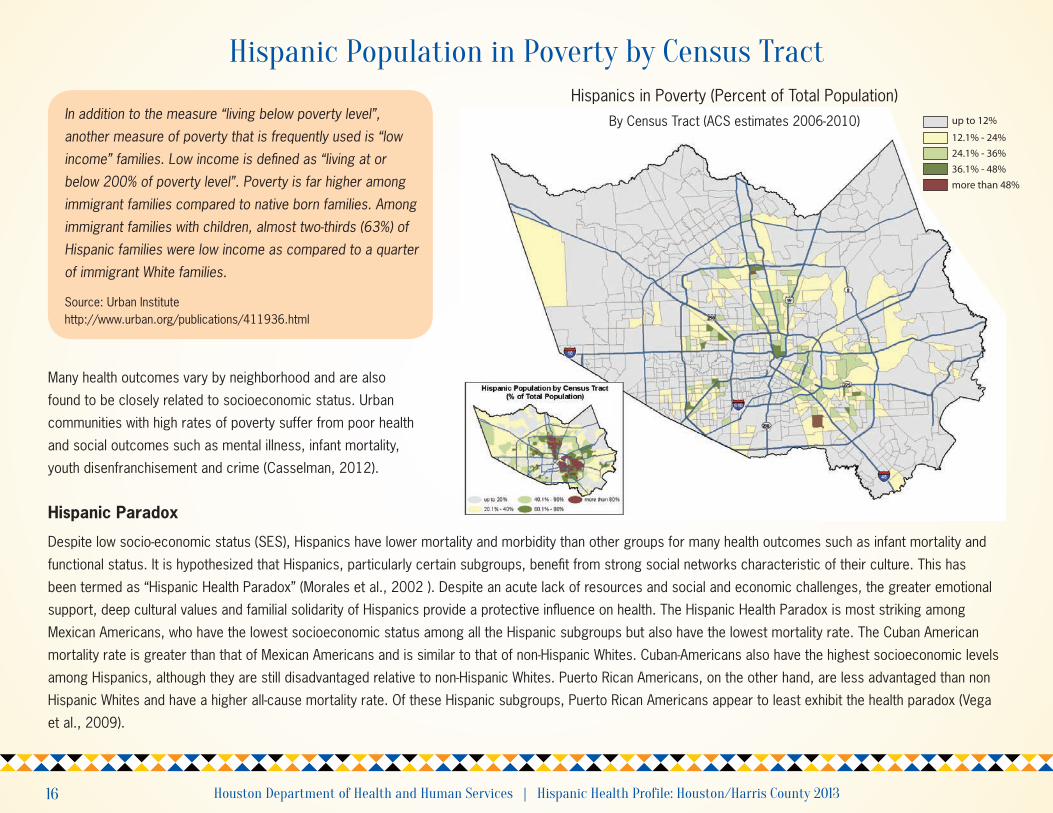
Hispanic Population in Poverty by Census Tract
In addition to the measure “living below poverty level”, another measure of poverty that is frequently used is “low income” families. Low income is defined as “living at or below 200% of poverty level”. Poverty is far higher among immigrant families compared to native born families. Among immigrant families with children, almost two-thirds (63%) of Hispanic families were low income as compared to a quarter of immigrant White families.
Source: Urban Institute http://www.urban.org/publications/411936.html
Hispanics in Poverty (Percent of Total Population)By Census Tract (ACS estimates 2006-2010)
Hispanic Paradox
Despite low socio-economic status (SES), Hispanics have lower mortality and morbidity than other groups for many health outcomes such as infant mortality and
functional status. It is hypothesized that Hispanics, particularly certain subgroups, benefit from strong social networks characteristic of their culture. This has
been termed as “Hispanic Health Paradox” (Morales et al., 2002 ). Despite an acute lack of resources and social and economic challenges, the greater emotional
support, deep cultural values and familial solidarity of Hispanics provide a protective influence on health. The Hispanic Health Paradox is most striking among
Mexican Americans, who have the lowest socioeconomic status among all the Hispanic subgroups but also have the lowest mortality rate. The Cuban American
mortality rate is greater than that of Mexican Americans and is similar to that of non-Hispanic Whites. Cuban-Americans also have the highest socioeconomic levels
among Hispanics, although they are still disadvantaged relative to non-Hispanic Whites. Puerto Rican Americans, on the other hand, are less advantaged than non
Hispanic Whites and have a higher all-cause mortality rate. Of these Hispanic subgroups, Puerto Rican Americans appear to least exhibit the health paradox (Vega
et al., 2009).
Many health outcomes vary by neighborhood and are also
found to be closely related to socioeconomic status. Urban
communities with high rates of poverty suffer from poor health
and social outcomes such as mental illness, infant mortality,
youth disenfranchisement and crime (Casselman, 2012).
up to 12%
12.1% - 24%
24.1% - 36%
36.1% - 48%
more than 48%
Houston Department of Health and Human Services | Hispanic Health Profile: Houston/Harris County 2013 17
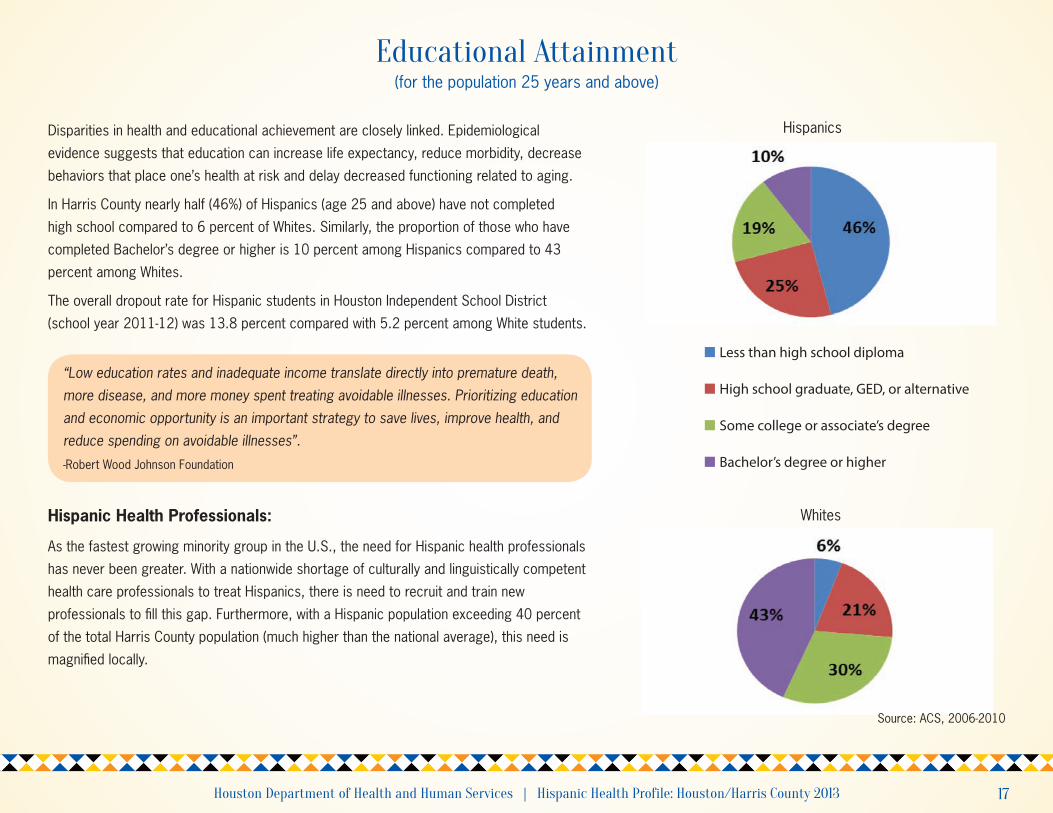
Educational Attainment
“Low education rates and inadequate income translate directly into premature death, more disease, and more money spent treating avoidable illnesses. Prioritizing education and economic opportunity is an important strategy to save lives, improve health, and reduce spending on avoidable illnesses”.
-Robert Wood Johnson Foundation
(for the population 25 years and above)
Hispanics
WhitesHispanic Health Professionals:
As the fastest growing minority group in the U.S., the need for Hispanic health professionals
has never been greater. With a nationwide shortage of culturally and linguistically competent
health care professionals to treat Hispanics, there is need to recruit and train new
professionals to fill this gap. Furthermore, with a Hispanic population exceeding 40 percent
of the total Harris County population (much higher than the national average), this need is
magnified locally.
Disparities in health and educational achievement are closely linked. Epidemiological
evidence suggests that education can increase life expectancy, reduce morbidity, decrease
behaviors that place one’s health at risk and delay decreased functioning related to aging.
In Harris County nearly half (46%) of Hispanics (age 25 and above) have not completed
high school compared to 6 percent of Whites. Similarly, the proportion of those who have
completed Bachelor’s degree or higher is 10 percent among Hispanics compared to 43
percent among Whites.
The overall dropout rate for Hispanic students in Houston Independent School District
(school year 2011-12) was 13.8 percent compared with 5.2 percent among White students.
Source: ACS, 2006-2010
n Less than high school diploma
n High school graduate, GED, or alternative
n Some college or associate’s degree
n Bachelor’s degree or higher

18 Houston Department of Health and Human Services | Hispanic Health Profile: Houston/Harris County 2013
Occupation
White by Type of OccupationHispanic by Type of Occupation
Only a small portion of Hispanics are employed in management, business, science and arts
occupations compared to Whites. Individuals belonging to these occupation categories are
typically better insured.
Occupation is linked to life opportunities and health equity. Hispanics in Harris County represent the largest percentage of all race/ ethnicity groups that are
uninsured (53%); 13 percent of Whites are uninsured. Some factors that explain the high level of uninsurance among Hispanics are working in the secondary labor
market, being economically disadvantaged, and relying on family for care especially among the elderly at later stages of life (Saenz and Rubio: 2007). Immigrant
workers, especially undocumented workers, are typically uninsured and employed among the lower rungs of occupations regardless of educational attainment from
the home country.
Source: ACS, 2006-2010
n Management, business science and arts
n Service occupations
n Sales and office occupations
n Natural resources, construction, and maintenance occupations
n Production, transportation, and material moving occupations
17% 16%
23%
7%8%
50%
9%
26%
22%
22%

Houston Department of Health and Human Services | Hispanic Health Profile: Houston/Harris County 2013 19
Uninsured Hispanics in Harris County
Uninsured Hispanics by Age Uninsured Population by Race/Ethnicity
No Access To Doctors Due To Cost
Fifty-three percent of the Hispanics in
Harris County had no health insurance
coverage at the time of the 2010
American Community Survey compared to
13 percent of Whites.
According to National Health Interview
Survey (2011) in the U.S., 29.6 percent
of Hispanics and 11 percent of Whites did
not have health insurance coverage.
Texas has the highest number of uninsured adults in the U.S. According to Pew Hispanic Center, 37
percent of the Hispanics living in Texas do not have health insurance. The numbers are even more
alarming in Harris County.
Nationwide, 30.4 percent of Hispanics and 9.9 percent of Whites do not have health insurance.
Sixty-two percent of the foreign born Hispanics living in Texas do not have health insurance.
Among Hispanics with health insurance, a third reported that they could not access a health care
provider due to the cost of the visit.
Higher proportions of Hispanics compared to Whites reported that cost was a reason for lack of
access to doctors.
Source: ACS, 2006-2010
Source: BRFSS (2004-2010)
n Under 18
n 18 to 24 years
n 25 to 34 years
n 35 to 44 years
n 45 to 54 years
n 55 to 64 years
n 65 and Above
n White
n Black
n Asian and Other
n Hispanic
20 Houston Department of Health and Human Services | Hispanic Health Profile: Houston/Harris County 2013
Broader Issues Impacting HealthSocial determinants are commonly categorized as proximal and distal factors
consisting of an individual’s biological makeup, behavior, social position, and
ecological surroundings (Roger, Hummer, and Nam, 2000) that affect health.
An individual’s access to life opportunities and equitable health is dependent on
factors that may or may not be within his or her control. Some of these factors
may pose a potential challenge to over-come if an individual is at a disadvantage
with respect to social determinants of health. Some aspects of the social position
of Hispanics within Harris County are presented through a sociological and
ecological perspective in this section.
Acculturation and Assimilation
The process of adapting to customs, culture, and social institutions such as
language, clothing, food, and government are aspects of acculturation where
the minority group, primarily adapts to the dominant majority. In rare cases, the
dominant majority accepts some aspects of the minority group. Acculturation
reflects adaptation and not acceptance into the dominant majority. The established
literature focuses primarily on four areas: socioeconomic status (SES), spatial
concentration, language attainment, and intermarriage (Waters and Jimenez,
2005) where acculturation occurs. When individuals are fully integrated in these
benchmarks it is expected that they are acculturated and accepted into the
dominant majority group.
For some Hispanics, acculturating and assimilating into the dominant group is
curtailed by individual and structural forces in their community. For a diverse
group such as Hispanics, each individual’s life experience is unique, in addition to
differences in culture, socioeconomic status (SES), human capital (education), and
mode of entrance into the U.S. (Bean and Stevens, 2003). Immigrants with high
levels of education and SES can acculturate and assimilate into the mainstream
middle class with greater ease compared to labor immigrants who start at the
bottom of the SES scale.
Literature suggests that Hispanic immigrants arrive in the U.S. practicing healthier
behaviors than their European American counterparts. As the number of years
living in the U.S. (a rough measure of acculturation) increases, there are changes
in health behaviors and health outcomes. Acculturation is associated with certain
lifestyle choices such as poorer nutrition, more tobacco use, and substance
abuse. Conversely, acculturation is also associated with some positive health
behaviors such as more leisure time physical activity (Escamilla, 2011).
Ethnic Enclaves
Many new Hispanic immigrants to the U.S. dealt with poverty, deprivation, poor
job opportunities and even social unrest in their country of origin. To adjust to
life in the U.S., new immigrants sometimes use their social networks and, when
available, the established ethnic enclaves to develop social ties.
Neighborhood social context affects health outcomes among immigrants with
the greatest health benefit seen in ethnic enclaves. Enclaves provide a safe
zone from potential hostility from the dominant group, serve as economic base
providing access to the low income jobs not in direct competition with the White
working class and legal wage regulations, low income housing, and provide an
environment that creates and illusion of “home” (Zhou, 1992).
Better health outcomes are seen in foreign born Hispanics across age groups,
different health indicators and in some cases, across different countries of
origin and these are more pronounced in those that live in ethnic enclaves
(Cagney, 2007).

Houston Department of Health and Human Services | Hispanic Health Profile: Houston/Harris County 2013 21
Broader Issues Impacting HealthA closer look at the highly concentrated residential areas for Hispanics show
a high percentage (80% – 100%) of the population living below the poverty
level (ACS estimates 2006-2010). Hispanics are known to be a close knit
and family-oriented group, and overcrowding within households appears to
be evident throughout the county (ACS estimates 2006-2010). Furthermore,
Hispanics have traditionally had the highest total fertility rate of the major race
and ethnic groups.
Civic Engagement
Civic engagement is important due to its potential to harness political power.
However, given the disadvantaged circumstances that many Hispanics find
themselves, such as low levels of education, occupation and wage degradation
and segmented assimilation, having high levels of civic engagement poses a
challenge for this group. This is more evident among immigrants living in the
shadows, those without legal status who are caught in an awkward position of
‘being in America but not being a part of it’ (Portes and Rumbaut, 2006). Even
among legal residents, civic engagement continues to remain limited in scope
among Hispanics across the country and they are noted to be underrepresented
in terms of political power and political representation. Civic engagement and
political representation are areas that needs to be monitored as the Hispanic
population continues to follow growth projections. Furthermore, as the White
population ages, the Hispanics’ working age population will be contributing a
larger share toward Social Security and Medicare (Malhotra and Raso, 2007).
Greater civic engagement and political representation for Hispanics is needed to
improve health and quality of life indicators, especially in accessing resources
to promote health equity in the largest racial and ethnic group in Harris County.
“It is time to refocus, reinforce, and repeat the message that health
disparities exist and that health equity benefits everyone”
– Kathleen G. Sebelius, Secretary,
U.S. Health and Human Services

22 Houston Department of Health and Human Services | Hispanic Health Profile: Houston/Harris County 2013
Summary u Hispanics constituted 41 percent of the population in Harris County,
with majority being of Mexican origin.
u A large proportion of Hispanics in Harris County are younger in age,
compared to Whites.
u The majority of Hispanics reside in the north and south-east side of
downtown Houston.
u Twenty-one percent of the Hispanic population in Harris County do not
speak English well and 12 percent do not speak English at all. Two
thirds speak English well.
u Home ownership among Hispanics in Harris County is less prevalent
than among Whites.
u A majority of census tracts in Harris County reflect overcrowding
among Hispanic households.
u Forty-eight percent of Hispanics living in poverty are children under the
age of 18 compared to 21 percent among Whites living in poverty.
u Nearly half (46%) of Hispanics, 25 years and older, have not completed
high school, compared to 6 percent of Whites.
u Only a small portion of Hispanics are employed in management,
business, science and arts occupation compared to Whites.
u A large proportion of Hispanics are uninsured.
Recommendations
Individuals may:
u Focus on educational attainment, including language proficiency,
which will ultimately result in better economic outcomes, through
better opportunities for employment.
u Improve English proficiency, which results in better access to services.
Organizations may:
u Focus their programs and services in areas where a majority of
Hispanics reside.
u Align their programs to address cultural and linguistic issues
among Hispanics.
u Focus their programs aimed at education, job training and
poverty reduction in identified geographic areas with high rates
of Hispanic poverty.
Communities (policy level) may:
u Realign resources and strategies to address key issues faced
by Hispanics in Harris County, e.g. educational attainment, housing,
and uninsurance.

Houston Department of Health and Human Services | Hispanic Health Profile: Houston/Harris County 2013 23
Health Conditions and Quality of Life
u Stroke
u Diabetes
u Cancer
u Overweight / Obesity
u Blood Pressure and Cholesterol
u Mental Health
u Quality of Life
u Summary and Recommendations

24 Houston Department of Health and Human Services | Hispanic Health Profile: Houston/Harris County 2013
Stroke
CDC Facts on Mortality Due to Stroke:
Healthy People 2020 goal: 42.2 deaths / 100,000
Hispanics in Harris County : 41.2 deaths / 100,000
Whites in Harris County : 48.9 deaths / 100,000
In Harris County, smaller proportions of Hispanics compared to Whites had been
told by a doctor, nurse, or other health professional that they had a stroke.
A stroke happens when blood flow to a part of the brain stops. The
symptoms of stroke depend on what part of the brain is damaged. High
blood pressure is the number one risk factor for stroke.
Texas
The prevalence of stroke in Texas has remained unchanged at 2.8 percent in
the last decade.
Hispanics have lower prevalence of stroke (1.6 percent) compared to Whites
(3 percent) in 2010.
Adults with higher education and higher household income have lower
prevalence of stroke compared to those with lower education and
low income.
Source: Texas Department of State Health Services (2012) Cardiovascular dis-ease in Texas 2012.
U.S.
According to CDC statistics, 2.6 percent of non-institutionalized U.S. adults
had a history of stroke during 2005. Overall, prevalence of stroke among
Hispanics was similar to the prevalence among Whites (MMWR, 2007).
Mean age at stroke death was lower among Hispanics compared to non-
Hispanics and overall, Hispanics had lower age-specific death rates for
stroke compared with Non-Hispanics (MMWR, 2005).
Nationally, there is no gender disparity in stroke related risk factors
and prevalence.
Source: BRFSS (2004-2010)
Stroke

Houston Department of Health and Human Services | Hispanic Health Profile: Houston/Harris County 2013 25
Diabetes
Diabetes by Age Group
The majority of the individuals with diagnosed diabetes are
within the age bracket of 40 to 65 years, in both race/
ethnic groups. However, many more Hispanics are affected
by diabetes at younger ages compared to Whites.
Source: HHS, 2010
CDC reports that diabetes is the fifth leading cause of death among Hispanics
and is a leading cause of heart disease, stroke, kidney disease, blindness and
amputations. Current statistics show that prevalence of diabetes among Hispanics
in Harris County is 11 percent and for Whites is 9.5 percent. (Houston Health
Survey, 2010), which are comparable to the Texas rate.
The lifetime risk of developing diabetes is higher for Hispanics compared to other
race/ ethnic groups.
Among Hispanics, Mexican Americans and Puerto Ricans have higher prevalence
of diabetes compared to Cubans and Central or South American Hispanics. (NDEP:
The Diabetes Epidemic among Hispanic and Latino Americans).
Source: HHS, 2010
Diabetes Prevalence
Hispanics Whites
65+ yrs7%
65+ yrs38%
<40 yrs5%
<40 yrs22%
40-65 yrs 71%
40-65 yrs 57%

26 Houston Department of Health and Human Services | Hispanic Health Profile: Houston/Harris County 2013
Diabetes
The mean age of diabetes diagnosis for Hispanics is lower than for Whites.
Both groups in Harris County are younger when diagnosed with diabetes as
compared to the national average of 52.5 years.
The HbA1C test measures an individual’s average blood glucose control for
the past two to three months, an indicator of diabetes management. HbA1C
monitoring uses a blood test that indicates how well a person’s blood sugar has
been controlled.
Disparities exist between Hispanics and Whites in management of diabetes.
Among those that have been diagnosed with diabetes a higher proportion of
Whites had HbA1C tests done in the past year compared to Hispanics.
Source: HHS, 2010
BRFSS (2004-2010) and HP 2020
Mean Age of Diabetes Diagnosis
HbA1C test in Past 12 Months
Healthy People 2020 Objective:
(D-11) Increase the proportion of adults with diabetes who have a
glycosylated hemoglobin (HbA1C) measurement at least twice per year
to 71.1 percent, compared to Hispanics. Proportion of Hispanics that
had HbA1C tests in the past year was also far lower than Healthy People
2020 Goals
HP 2020 Goal

Houston Department of Health and Human Services | Hispanic Health Profile: Houston/Harris County 2013 27
Diabetes Self-Management
On average, Hispanics with diabetes have seen a doctor, nurse, or other health
professional 3.6 times in the past year for their diabetes as compared to 4
times for Whites.
Among those who identified themselves as diabetic, almost half of the Hispanic
group had never attended a diabetes management class.
Health care providers play a critical role in communicating standards of care
to their patients. Literature demonstrates that patients that received advice on
self-management of disease were more likely to follow the provider guidelines.
Source: BRFSS (2004-2010)
Seen Health Professionals in Past Year for Diabetes
No Diabetes Management ClassIn Harris County, Texas, if 5 percent more people attended some college and 5 percent more had an income higher than twice the federal poverty level we could expect to save 1,200 lives, prevent 12,200 cases of diabetes, and eliminate $97.8 million in diabetes costs every year.
County Health Rankings, Robert Wood Johnson Foundation
White
4
5
4
3
2
1
0
Mea
n no
. of t
imes
Hispanic
3.6

28 Houston Department of Health and Human Services | Hispanic Health Profile: Houston/Harris County 2013
Cancer Incidence and Mortality
Note: All rates are per 100,000. Rates are age-adjusted to the 2000 U.S. Standard Population. Source: Texas Cancer Registry
In the U.S., for all cancers combined, and for the most common cancers
(prostate, breast, colorectal, and lung), incidence and death rates are
lower among Hispanics than among non-Hispanic Whites (American Cancer
Society, 2011)
According to a report by the American Cancer Society, cancer has passed
heart disease as the leading cause of death among Hispanics in the U.S.
Looking at trends, cancer mortality rates for Hispanics and Whites have
been decreasing in the last few years. Overall, Hispanics have lower rates of
cancer related mortality than that of Whites.
Important factors that will play a role in reducing the risk of cancer in
Hispanics include access to health care, including utilization of screening
and available vaccines, as well lifestyle factors such as reducing alcohol
consumption, obesity and smoking.
Cancer Mortality Rates in Harris County
(All sites, 2005-2009)Invasive Cancer Incidence Rates
Harris County, Texas
Both Genders, Hispanic, 2005-2009
(Top five most common types of cancers)
Site Age-adjusted Rate
All sites 340.7
Prostate (males only) 113.3
Breast 45.3
Colon and rectum 33.6
Lung and bronchus 33.5
Non-Hodgkin lymphoma 16.6

Houston Department of Health and Human Services | Hispanic Health Profile: Houston/Harris County 2013 29
Overweight / Obesity
For adults, overweight and obesity ranges are determined by using weight
and height to calculate a number called the “body mass index” (BMI). For
most people, BMI is a good indicator of body fat.
Higher proportions of Hispanics than Whites are overweight and obese in
Harris County.
In 2009, nearly 66.8 percent of Texas adults were either overweight or
obese. According to the Office of Minority Health, 78 percent of Hispanic
women are obese compared to 60.3 percent for Whites. Even among U.S.
children, in 2009-2010, Mexican American children were 1.6 times more
likely to be overweight than Whites.
BMI Categories
Healthy Weight
Source: BRFSS (2004-2010)
Source: HHS, 2010
For adults, a BMI between 25 and 29.9 is considered overweight.
An adult who has a BMI of 30 or higher is considered obese.
Source: http://www.cdc.gov/obesity/adult/defining.html
About 31 percent of persons aged 20 years and over were at a healthy
weight in 2005–08 (age adjusted to the year 2000 standard population)
in U.S. The Healthy People 2020 (HP 2020) goal is to improve healthy
weight to 33.9 percent. Harris County already has nearly achieved the HP
2020 goal for Whites for healthy weight at 33.5 percent while Hispanics
are trailing at 23 percent .
Promoting healthy weight among Harris County Hispanics is a high priority.
n Hispanic
n White

30 Houston Department of Health and Human Services | Hispanic Health Profile: Houston/Harris County 2013
Overweight / Obesity
Overweight Whites by Age
Obese Whites by Age
Overweight Hispanics by Age
Obese Hispanics by Age
Among overweight Hispanics, the
largest group is in the age group of
50 to 65 years. However, among
overweight Whites, the largest group
is among adults older than 66 years.
On the other hand, older Hispanics
(66+) represent a larger portions of
obese Hispanics, while the mid-age
population (50-65 years) represents
the larger portions of obese Whites.
Source: HHS, 2010

Houston Department of Health and Human Services | Hispanic Health Profile: Houston/Harris County 2013 31
Blood Pressure and Cholesterol
Diagnosed High Blood Cholesterol and Blood Pressure Prevalence
Blood Cholesterol Checked
Source: BRFSS (2004-2010)
Hispanics of Harris County reported lower prevalence of high
blood pressure and high cholesterol than Whites, which is
comparable to national statistics. It is noteworthy because
screening for blood pressure and cholesterol among Hispanics is
lower than among Whites.
According to the Office of Minority Health (2012), the percentage
of Hispanic adults in the U.S. who had high blood pressure (in
2010) was 22.5.
According to the Office of Minority Health (2012), the percentage
of Hispanic adults in the U.S. who received a blood cholesterol
measurement in the last five years (in 2008) was 71.8.
Access, availability, knowledge, attitude and several other factors
may contribute to lower screening rates among Hispanics

32 Houston Department of Health and Human Services | Hispanic Health Profile: Houston/Harris County 2013
Mental Health
Severe Psychological Distress Mental Health “Not Good” in Past 30 Days
Source: HHS, 2010 Source: BRFSS (2004-2010)
Severe Psychological Distress (SPD) is
a non-specific measure of psychological
distress. Among Hispanics, 7.9 percent
reported SPD as compared to 5.6 percent
of Whites. Slightly higher proportions of
Hispanics reported having poor mental
health for five or more days in a month
compared to Whites.
Over the past few decades, numerous research studies have found that from adolescence to adulthood,
Hispanics experience higher rates of stress and certain mental health problems than other racial and ethnic
groups. These conditions often result from depression, anxiety and post traumatic stress disorder (PTSD)
arising from family separation issues, social isolation, moving to a new country and ramifications of war
and/or violence in their country of origin. Despite this, they tend to under utilize mental health services.
Numerous studies also found evidence that highlights the lack of availability, lack of access to quality
mental health services to Hispanics (Acosta, 2008). Some reasons for this include: lack of culturally and
linguistically appropriate mental health resources, services and residential facilities; lack of knowledge of
resources; and lack of insurance.
Houston Department of Health and Human Services | Hispanic Health Profile: Houston/Harris County 2013 33
Mental Health
Mental Health Issues
Mental Health Appointment Difficulties
Source: HHS, 2010
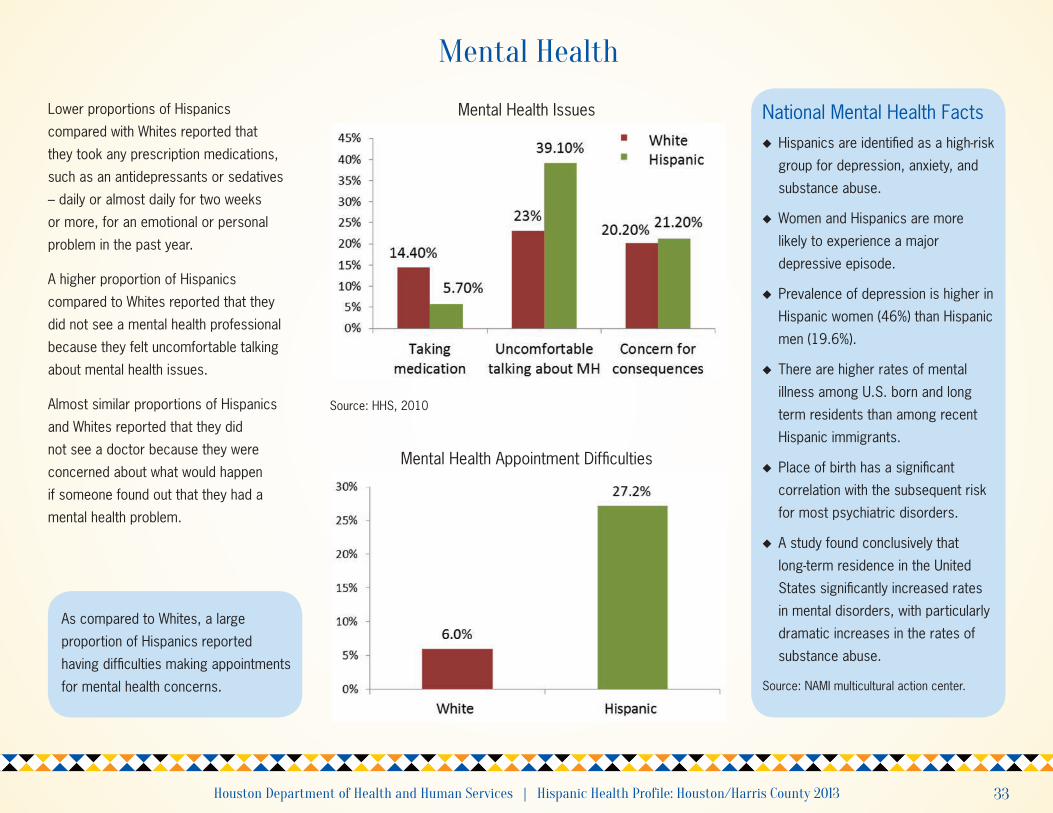
Lower proportions of Hispanics
compared with Whites reported that
they took any prescription medications,
such as an antidepressants or sedatives
– daily or almost daily for two weeks
or more, for an emotional or personal
problem in the past year.
A higher proportion of Hispanics
compared to Whites reported that they
did not see a mental health professional
because they felt uncomfortable talking
about mental health issues.
Almost similar proportions of Hispanics
and Whites reported that they did
not see a doctor because they were
concerned about what would happen
if someone found out that they had a
mental health problem.
National Mental Health Factsu Hispanics are identified as a high-risk
group for depression, anxiety, and
substance abuse.
u Women and Hispanics are more
likely to experience a major
depressive episode.
u Prevalence of depression is higher in
Hispanic women (46%) than Hispanic
men (19.6%).
u There are higher rates of mental
illness among U.S. born and long
term residents than among recent
Hispanic immigrants.
u Place of birth has a significant
correlation with the subsequent risk
for most psychiatric disorders.
u A study found conclusively that
long-term residence in the United
States significantly increased rates
in mental disorders, with particularly
dramatic increases in the rates of
substance abuse.
Source: NAMI multicultural action center.
As compared to Whites, a large
proportion of Hispanics reported
having difficulties making appointments
for mental health concerns.

34 Houston Department of Health and Human Services | Hispanic Health Profile: Houston/Harris County 2013
Quality of LifeGeneral Satisfaction and Social/Emotional Support
General Satisfaction with Life Social and Emotional Support
Whites Hispanics
Source: BRFSS (2004-2010)
How do social relationships affect health?Social relationships provide resources to minimize risk of disease, avoid risk of disease, or influence health promoting behaviors. The indirect pathways linking
social relationships and health outcomes such as mortality from all diseases and mortality from cardiovascular conditions are through social support, social
isolation, social norms and weak or strong social ties and marital status. The direct effects of social support on health, specifically on mortality, are through
physiologic systems such as immune responses, neuroendocrine responses through stress hormones and cardiovascular reactivity.
General satisfaction with life is a subjective measure of well-being.
Smaller proportions of Hispanics compared to Whites reported
general satisfaction with life.
Proportions of Hispanics who reported never having had social and
emotional support were higher than that for Whites (10 % vs. 3.4%).
n White
n Hispanic
Very satisfied
60%
50%
40%
30%
20%
10%
0%Satisfied Dissatisfied Very
dissatisfied
n Always
n Usually
n Sometimes
n Rarely
n Never
9.9%3.1% 3.4% 10.0%
8.6%

Houston Department of Health and Human Services | Hispanic Health Profile: Houston/Harris County 2013 35
Quality of LifeGeneral Health
General Health
General Health “Fair to Poor” by Age Group
Self Reported Physical Health “Not Good” (in Past 30 Days)
Proportions of respondents reporting fair and poor health status in
the past month were higher among Hispanics compared to Whites
(22.6% vs. 12.1%)
There was no significant difference in proportions of Hispanics and
Whites reporting number of days when physical health was not good.
General health among people gets poorer with age. Proportions of
people reporting poor health was higher among all age groups for
Hispanics compared to Whites.
Source: BRFSS (2004-2010)
Excellent Very good Good
83.1% 82.1%
16.9% 17.9%
Fair
18 to 44 45 to 64 65+
Poor
27.2%
8.2%
18.7%12.9%
32.8%
22.5%
49.7%
15.1%
34.4%
41.9%
26.3%
18.6%
9.0%
3.1% 4.0%
WhiteHispanic
20.5%
None or less than 5 days 5 or more days
45%
40%
35%
30%
25%
20%
15%
10%
5%
0%
90%
80%
70%
60%
50%
40%
30%
20%
10%
0%
60%
50%
40%
30%
20%
10%
0%
36 Houston Department of Health and Human Services | Hispanic Health Profile: Houston/Harris County 2013
Summary u Overall prevalence of diagnosed stroke among Hispanics is lower than that
of Whites, however, the older age group among Hispanics has a higher
burden of disease compared to the same age group of Whites.
u Diagnosed diabetes prevalence is higher among Hispanics compared to
Whites. The younger Hispanic population (<40 years) has an alarming
rate of diabetes diagnosis. Access to and utilization of services related to
diabetes management among Hispanics appears to be poor compared
to Whites.
u The most common types of cancer among Hispanics living in Harris County
are prostate, breast and colon/ rectal cancer. Overall cancer mortality is
lower among Hispanics compared to Whites.
u Both overweight and obesity are high among Hispanics living in Harris
County, especially among the younger age group (<40 years).
u Hispanics have lower a prevalence of high blood pressure and high
cholesterol. It is noteworthy that screening for both conditions are lower
among Hispanics compared to Whites.
u Slightly higher proportions of Hispanics reported poor mental health for
five or more days in a month compared to Whites. As compared to Whites,
a larger proportion of Hispanics feel uncomfortable talking about mental
health concerns and a larger proportion of Hispanics report difficulties in
making appointments for mental health.
u Hispanics report poorer quality of life compared to Whites, in all age groups.
u Proportions of Hispanics who reported having “no social support” was
higher than that reported by Whites.
Recommendations
Individuals may:
u Focus on individual health concerns such as adopting more healthy
behaviors and distancing from unhealthy behaviors to achieve better
health outcomes. Examples may include adopting healthy eating patterns
(higher consumption of fruits and vegetables and lower consumption of fat
and sugar) and 60 minutes of daily physical activity.
u Adhere to regular screening to promote early detection of health issues,
thus creating an opportunity for early intervention.
Organizations may:
u Realign their health care services targeting identified health conditions as
priority issues.
Communities (policy level) may:
u Develop and implement strategic approach to address obesity and
diabetes among Hispanics by enhancing:
w Opportunities to access healthy food choices.
w Making the healthy choice the easier choice.
w Safe opportunities to be active at schools, parks, community centers,
work sites.
Houston Department of Health and Human Services | Hispanic Health Profile: Houston/Harris County 2013 37
Health Behaviors
u Alcohol Consumption
u Smoking
u Cancer Screening
u Fruit/Vegetable Consumption and Physical Activity
u Summary and Recommendations
38 Houston Department of Health and Human Services | Hispanic Health Profile: Houston/Harris County 2013
Alcohol Consumption
Average Number of Alcoholic Drinks During Past 30 Days, (on the occasions when they drank)
Largest Number of Drinks on Any Occasion
Source: BRFSS (2004-2010)
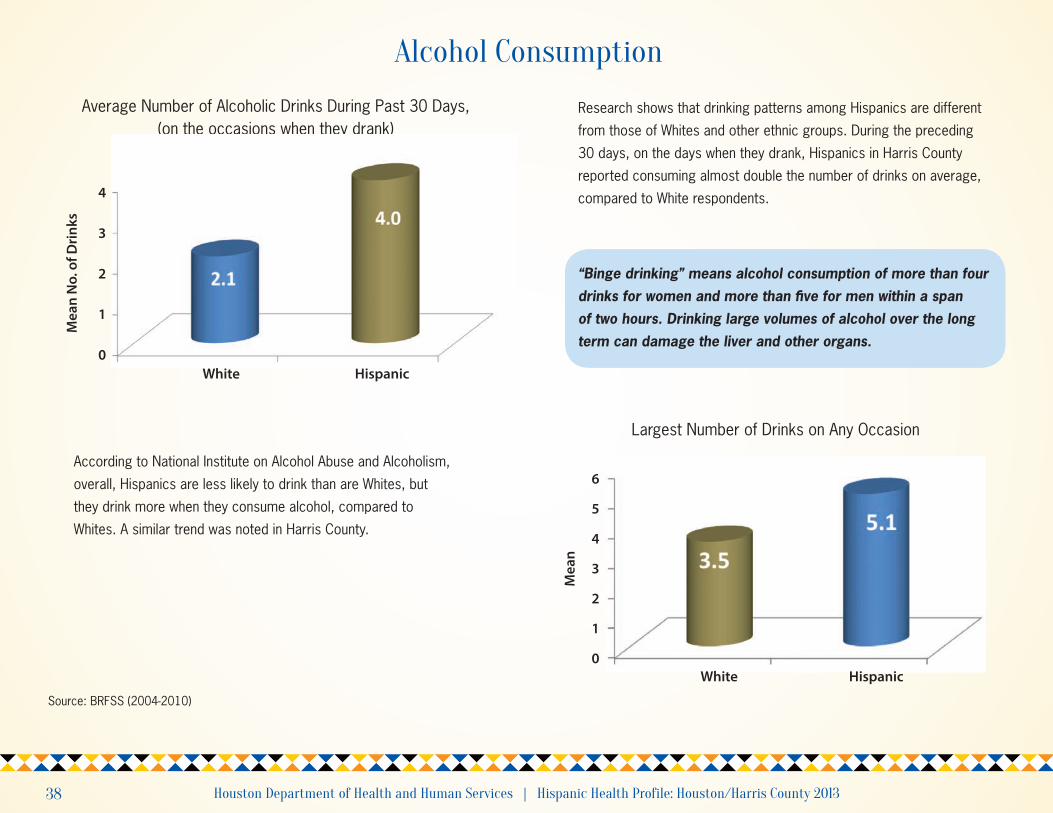
According to National Institute on Alcohol Abuse and Alcoholism,
overall, Hispanics are less likely to drink than are Whites, but
they drink more when they consume alcohol, compared to
Whites. A similar trend was noted in Harris County.
Research shows that drinking patterns among Hispanics are different
from those of Whites and other ethnic groups. During the preceding
30 days, on the days when they drank, Hispanics in Harris County
reported consuming almost double the number of drinks on average,
compared to White respondents.
“Binge drinking” means alcohol consumption of more than four drinks for women and more than five for men within a span of two hours. Drinking large volumes of alcohol over the long term can damage the liver and other organs.
White
White
Mea
n
Mea
n N
o. o
f Dri
nks
6
5
4
3
2
1
0
Hispanic
Hispanic
4
3
2
1
0

Houston Department of Health and Human Services | Hispanic Health Profile: Houston/Harris County 2013 39
Smoking
Current Smoker
Source: BRFSS (2004-2010)
Source: BRFSS (2004-2010)
Smoking is the leading cause of preventable morbidity, mortality and
disabilities. In the U.S., annual deaths attributable to cigarette smoking
was 443,000 during 2000 to 2004 (CDC Smoking Fact Sheet: http://
www.cdc.gov/tobacco/data_statistics/tables/health/attrdeaths/)
Lower prevalence of smoking among Hispanics is sometimes used to
explain the Hispanic Paradox. In general, foreign born Hispanics smoke
substantially less than U.S. born Hispanics, which may potentially
contribute to Hispanics’ longevity advantage in the U.S. (Blue and
Fenelon, 2011).
Hispanics in Harris County report smoking less than Whites. During 2004
to 2010, higher proportion of Whites (17.4 percent) reported smoking
compared to Hispanics (14.1 percent).
According to CDC data, 21 percent of Whites and 12.5 percent of
Hispanics are current smokers in the U.S.
In Harris County, the prevalence of individuals who had smoked previously
is also lower among Hispanics compared to Whites.
Overall Adult Smoking Rates
Harris County 17%
Texas 19%
USA 14%
Smoked 100 Cigarettes in Entire Life
White
43.3%
26.9%
17.4%
14.1%
50%
40%
30%
20%
10%
0%
20%
15%
10%
5%
0%White
Hispanic
Hispanic

40 Houston Department of Health and Human Services | Hispanic Health Profile: Houston/Harris County 2013
Cancer ScreeningNo Mammogram Within the Past 2 Years No Blood Stool Test Within the Past 2 Years
No Digital Rectal Exam Within the Past 5 Years
Source: BRFSS (2004-2010)
Slightly higher proportions of Hispanics 50 years and older had no blood
stool test (to detect colorectal cancer) within the past two years. In Texas,
Hispanics and those under 65 are slightly less likely to be screened.
Hispanics appear to have a slightly lower screening rate than other groups.
Slightly higher proportions of Hispanic females, 40 years and older had no
mammograms (to detect breast cancer) and were thus at risk.
More than half of Hispanic male respondents 40 years and older had not
had a digital rectal exam within the past five years.
Some barriers that have been identified that prevent screening are lack of insurance, lack of access to care, lack of a usual provider, lack of awareness of screening and cultural and/or language differences impacting access to care.
White
29.4%81.4%
28.6%
57.0%
83.0%34.6%
White
White
40%
30%
20%
10%
0%
90%80%70%60%50%40%30%20%10%
0%
60%
50%
40%
30%
20%
10%
0%
Hispanic Hispanic
Hispanic
Houston Department of Health and Human Services | Hispanic Health Profile: Houston/Harris County 2013 41
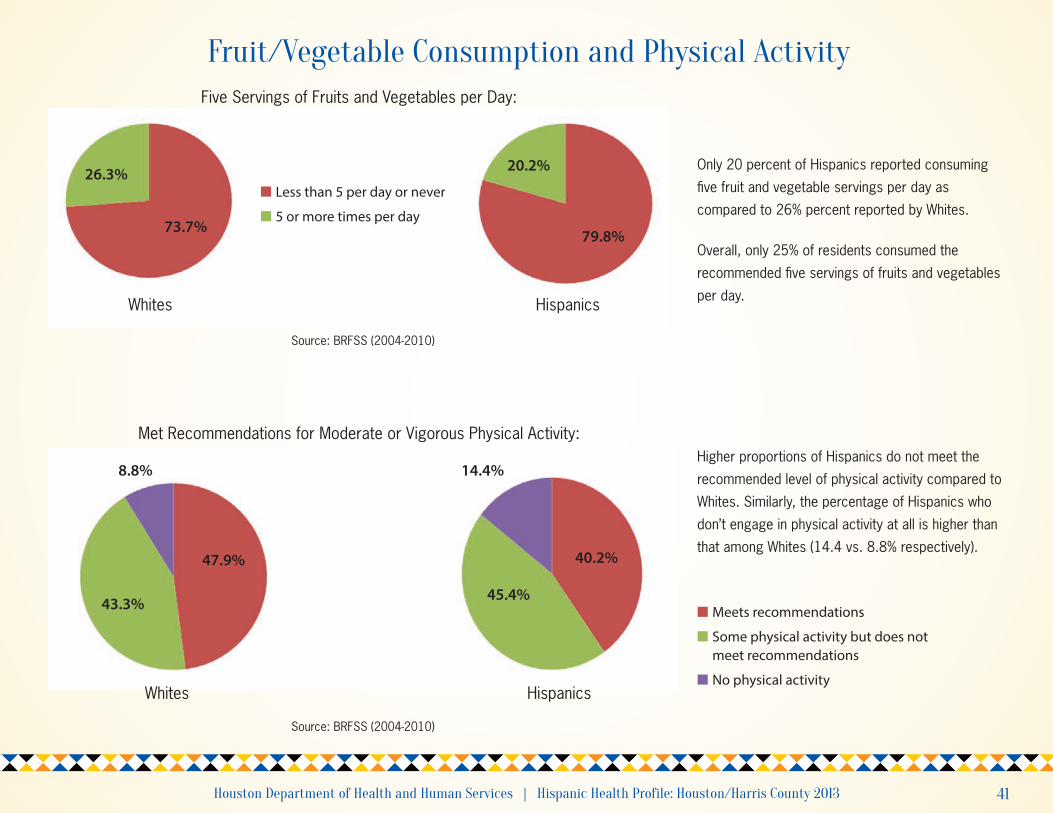
Fruit/Vegetable Consumption and Physical ActivityFive Servings of Fruits and Vegetables per Day:
Met Recommendations for Moderate or Vigorous Physical Activity:
Source: BRFSS (2004-2010)
Source: BRFSS (2004-2010)
Only 20 percent of Hispanics reported consuming
five fruit and vegetable servings per day as
compared to 26% percent reported by Whites.
Overall, only 25% of residents consumed the
recommended five servings of fruits and vegetables
per day.
Higher proportions of Hispanics do not meet the
recommended level of physical activity compared to
Whites. Similarly, the percentage of Hispanics who
don’t engage in physical activity at all is higher than
that among Whites (14.4 vs. 8.8% respectively).
Whites
Whites
Hispanics
Hispanics
26.3%
8.8%
43.3%
47.9%
14.4%
45.4%
40.2%
73.7%
20.2%
79.8%
n Meets recommendations
n Some physical activity but does not meet recommendations
n No physical activity
n Less than 5 per day or never
n 5 or more times per day

42 Houston Department of Health and Human Services | Hispanic Health Profile: Houston/Harris County 2013
Summary u It appears that binge drinking among Hispanics is an issue. Hispanics
are less likely to drink at all than are Whites, but when they do consume
alcohol, they drink more when compared to Whites.
u Screening behaviors (such as mammogram for breast cancer detection,
blood stool test for colorectal cancer and digital rectal exam to detect
prostrate related abnormalities) among Hispanics appear to be poorer
compared to Whites.
u Lower proportions of Hispanics compared with Whites meet the physical
activity recommendations.
u Lower proportions of Hispanics compared with Whites meet the fruit and
vegetable consumption recommendations.
u The smoking prevalence among Hispanics is substantially lower
compared to Whites. Foreign-born Hispanics smoke less than the U.S.
born Hispanics.
Recommendations
Individuals may:u Reduce or eliminate binge drinking behavior.
u Increase their uptake and adherence to recommended screening behaviors.
u Make an effort to adopt more healthful and nutritious eating behaviors,
while reducing on unhealthy foods.
u Adopt a more active lifestyle.
Organizations may: u Adapt/ develop and implement appropriate interventions for binge drinking
among Hispanics.
u Align preventive services and include health literacy programs to promote
screening behaviors among Hispanics by providing linguistically and
culturally appropriate services.
u Provide appropriate lifestyle modification programs and services to
encourage healthful eating and more active lifestyles.
u Conduct outreach to the uninsured to develop strategies to defray the cost
of screening—a key factor preventing Hispanics from being screened.
Communities (policy level) may: u Align resources and strategies to promote positive behaviors such as
healthy eating, active living, and screening for various health conditions
including early cancer detection which are likely responsible for the burden
of disability among Hispanics through community centers and work sites.

Houston Department of Health and Human Services | Hispanic Health Profile: Houston/Harris County 2013 43
Other Health Concerns
u Teen Pregnancy
u Prenatal Care
u HIV
u Summary and Recommendations

44 Houston Department of Health and Human Services | Hispanic Health Profile: Houston/Harris County 2013
Teen Pregnancy
BRFSS (2004-2010) by CDC, 2011
Source: Texas YRBSS, 2011
Giving birth to a child at a young age impacts the new mother, her child, her
family and society as a whole. Often a pregnancy will prevent a young woman
from graduating from high school or seeking higher education, impacting the
type of employment that she may be eligible for, as well as her ability to find
employment that offers health insurance. This can lead to a cycle of poverty
that is difficult to break. While the familial support that a young pregnant
Hispanic woman receives is a positive factor, pregnancy at such a young age
is likely to have a lifelong impact. (State of Health, 2012).
The teen birth rate (per 1000 female population, ages 15-19) for Harris County
is high (63) compared to national average of 22.
Examination of Youth Risk Behavioral Surveillance System data (2011)
revealed that there is a significant difference in sexual activity and
experience of sex between Hispanics and White high school students,
age 15 to 19 years, in Houston during 2011.
Hispanic compared to White students, were more likely to report having
had sexual intercourse with at least one person during the three months
prior to the survey and to report having ever had sexual intercourse.
There were no differences in risk factors related to early sex and having
multiple partners.
Texas Snapshot: Births From Teenage Mothers
Public Health issue Texas National
Birth Rates Per 1,000 Girls Aged 15-19 in 2007 64 43
Change in Birth Rate Among Girls Aged 15-19
1991-2005 -21% -34%
2005-2007 4% 5%
High School Students Who Have Had Sex (2009) 52% 46%
High School Students Who Have Had Sex with 4
or More People in Their Life 17% 14%
Sexual Behaviors Among High School Students, Houston (2011)(15-19 years of age) In Harris County, in 2008, the majority of births to girls
ages 10 – 17 years were among Hispanic girls (70.8%).
Houston Department of Health and Human Services | Hispanic Health Profile: Houston/Harris County 2013 45
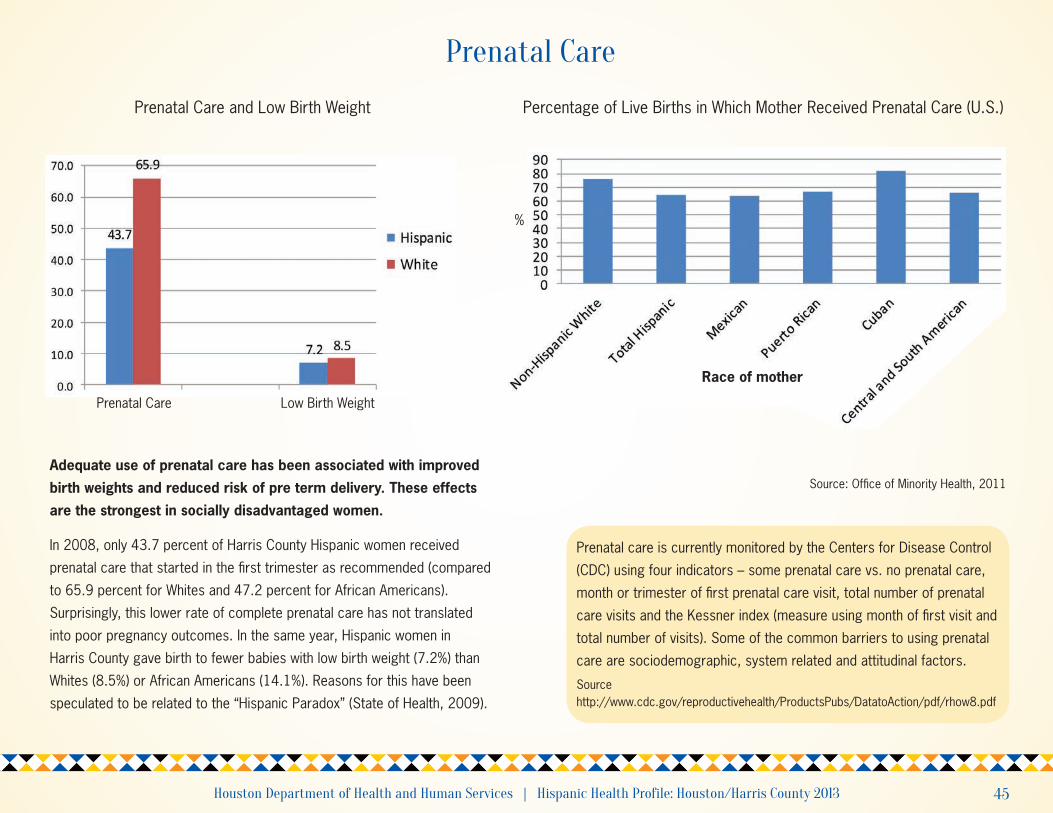
Prenatal Care
Source: Office of Minority Health, 2011Adequate use of prenatal care has been associated with improved
birth weights and reduced risk of pre term delivery. These effects
are the strongest in socially disadvantaged women.
In 2008, only 43.7 percent of Harris County Hispanic women received
prenatal care that started in the first trimester as recommended (compared
to 65.9 percent for Whites and 47.2 percent for African Americans).
Surprisingly, this lower rate of complete prenatal care has not translated
into poor pregnancy outcomes. In the same year, Hispanic women in
Harris County gave birth to fewer babies with low birth weight (7.2%) than
Whites (8.5%) or African Americans (14.1%). Reasons for this have been
speculated to be related to the “Hispanic Paradox” (State of Health, 2009).
Prenatal Care and Low Birth Weight Percentage of Live Births in Which Mother Received Prenatal Care (U.S.)
Prenatal care is currently monitored by the Centers for Disease Control
(CDC) using four indicators – some prenatal care vs. no prenatal care,
month or trimester of first prenatal care visit, total number of prenatal
care visits and the Kessner index (measure using month of first visit and
total number of visits). Some of the common barriers to using prenatal
care are sociodemographic, system related and attitudinal factors.
Source http://www.cdc.gov/reproductivehealth/ProductsPubs/DatatoAction/pdf/rhow8.pdf
Race of mother
%
Prenatal Care Low Birth Weight
46 Houston Department of Health and Human Services | Hispanic Health Profile: Houston/Harris County 2013
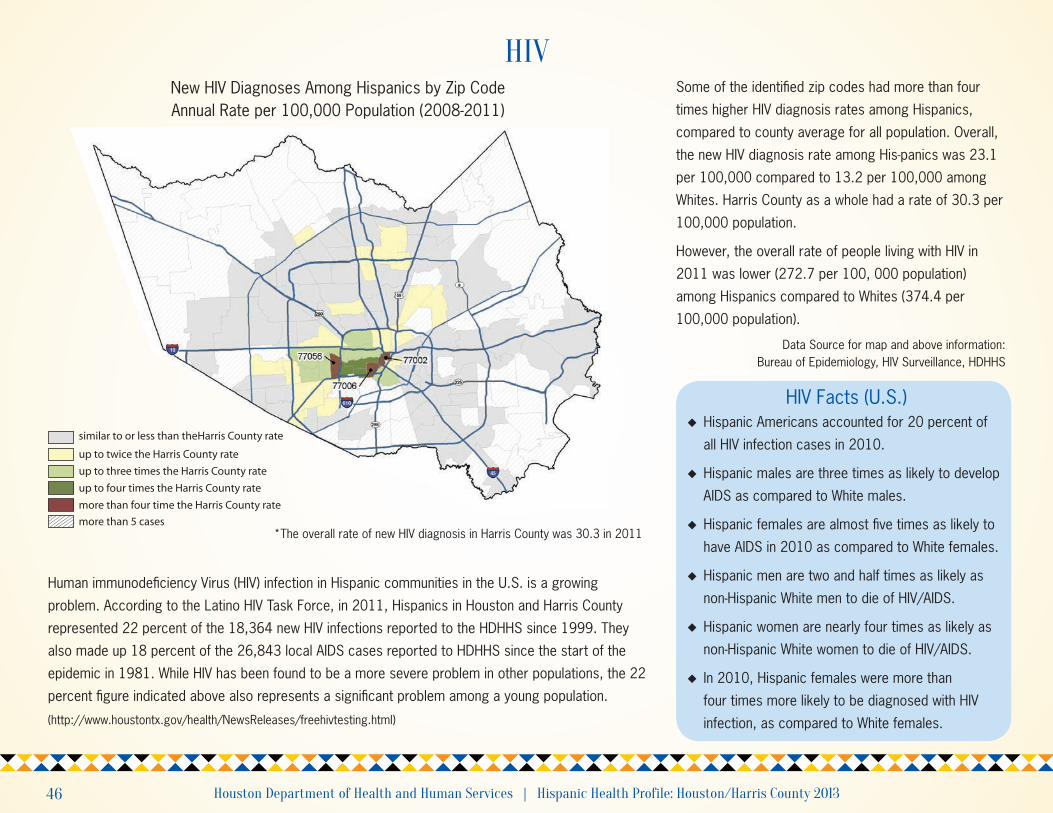
HIV
Data Source for map and above information: Bureau of Epidemiology, HIV Surveillance, HDHHS
Human immunodeficiency Virus (HIV) infection in Hispanic communities in the U.S. is a growing
problem. According to the Latino HIV Task Force, in 2011, Hispanics in Houston and Harris County
represented 22 percent of the 18,364 new HIV infections reported to the HDHHS since 1999. They
also made up 18 percent of the 26,843 local AIDS cases reported to HDHHS since the start of the
epidemic in 1981. While HIV has been found to be a more severe problem in other populations, the 22
percent figure indicated above also represents a significant problem among a young population.
(http://www.houstontx.gov/health/NewsReleases/freehivtesting.html)
Some of the identified zip codes had more than four
times higher HIV diagnosis rates among Hispanics,
compared to county average for all population. Overall,
the new HIV diagnosis rate among His-panics was 23.1
per 100,000 compared to 13.2 per 100,000 among
Whites. Harris County as a whole had a rate of 30.3 per
100,000 population.
However, the overall rate of people living with HIV in
2011 was lower (272.7 per 100, 000 population)
among Hispanics compared to Whites (374.4 per
100,000 population).
New HIV Diagnoses Among Hispanics by Zip Code Annual Rate per 100,000 Population (2008-2011)
u Hispanic Americans accounted for 20 percent of
all HIV infection cases in 2010.
u Hispanic males are three times as likely to develop
AIDS as compared to White males.
u Hispanic females are almost five times as likely to
have AIDS in 2010 as compared to White females.
u Hispanic men are two and half times as likely as
non-Hispanic White men to die of HIV/AIDS.
u Hispanic women are nearly four times as likely as
non-Hispanic White women to die of HIV/AIDS.
u In 2010, Hispanic females were more than
four times more likely to be diagnosed with HIV
infection, as compared to White females.
HIV Facts (U.S.)
* The overall rate of new HIV diagnosis in Harris County was 30.3 in 2011
similar to or less than theHarris County rate
up to twice the Harris County rate
up to three times the Harris County rate
up to four times the Harris County rate
more than four time the Harris County rate
more than 5 cases

Houston Department of Health and Human Services | Hispanic Health Profile: Houston/Harris County 2013 47
Summary u Teenage pregnancy rate is higher among Hispanics compared to Whites.
u Hispanic women do not receive adequate prenatal care. Despite this,
their birth outcomes are slightly better than other population sub-groups.
u HIV diagnosis rate among Hispanics is higher than Whites for
new cases.
Recommendation
Individuals may:u Educate their children about the consequences of teenage pregnancy.
u Adhere to adequate prenatal care recommendation.
u Promote HIV prevention behaviors among their families and
extended networks.
Organizations may: u Develop, adapt and implement evidence based programs to address
sexual activity among Hispanic adolescents.
u Reach out to pregnant women to encourage them to use adequate
prenatal care services.
u Focus on identified zip codes to offer culturally appropriate programs to
the Hispanic population for HIV prevention and implement programs for
those living with HIV.
Communities (policy level) may: u Align resources to reach out to adolescents to offer programs to curb the
teenage pregnancy and encourage prenatal care among pregnant women.
u Align the HIV prevention efforts in the identified areas where new HIV
diagnoses are higher.

48 Houston Department of Health and Human Services | Hispanic Health Profile: Houston/Harris County 2013
References1. Alba, R. D. and Nee, V. 2005. Remaking the American Main-stream: Assimilation and
Contemporary Immigration. Cambridge, MA: Harvard University Press.
2. Alba, R. 1999. “Immigration and the American Realities of Assimilation and Multiculturalism.” Sociological Forum 14 (1):3-25.
3. Bean, F. D. and Gillian, S. 2003. America’s Newcomers and the Dynamicsof Diversity. New York: Russell Sage Foundation.
4. Behavioral Risk Factor Surveillance System. 2004-2010 Texas data files. Retrieved from http://www.dshs.state.tx.us/chs/brfss/default.shtm
5. Blue, L and Fenelon, A. 2011. Explaining low mortality among US Immigrants relative to native-born Americans: the role of smoking. Int. Journal of Epi. 40: 3, 786-793.
6. Bourdieu, P. and Jean, C. P. 1990. Reproduction in Education, Society and Culture. London, Thousand Oaks, New Dehli: Sage Publications Inc.
7. Cagney K. A., Browning, C. R., and Wallace, D. A. 2007. The Latino Paradox in Neighborhood context: The case of Asthma and other respiratory conditions. American Journal of Public Health. Vol 97 (5): 919-925.
8. Cairney J., Boyle, M. H. 2004. Home ownership, mortgages and psycho-logical distress. Housing Stud. 19(2):161-174.
9. Casselman B. 2012. Neighborhood Confer Health, but Not Wealth. Wall Street Journal - Eastern Edition. 259(69):A3.
10. Catanzarite, L. 2003. “Race-Gender Composition and Occupational Pay Degradation.” Social Problems 50:14-37.
11. Centers for Disease Control and Prevention. 2011. Lowering the birth rate in Texas. Available at http://www.cdc.gov/prc/pdf/PRC-Teen.pdf
12. Centers for Disease Control and Prevention. 2012. Hispanic or Latino Populations. Retrieved 11/05/12 fromhttp://www.cdc.gov/minorityhealth/populations/REMP/hispanic.html#HiPrev.
13. Dahlgren G, Whitehead M. 1991. Policies and strategies to promote social equity in health. Stockholm: Institute for Future Studies.
14. Debra, U. and Jennifer, K. M. 2010. Social Relationships and Health: A Flashpoint for Health Policy 022146510383501, Journal of Health and Social Behavior, 51: S54.
15. Houston Health Survey.2010. Data retrieved from http://ava.nsd.uib.no/webview/ on October 2012.
16. Humes, K. R., Jones, N. A. & Ramirez, R. R. 2011. Overview of Race and Hispanic Origin: 2010 Census Breif. Retrieved 08/22/12, from http://www.census.gov/prod/cen2010/briefs/c2010br-02.pdf.
17. Kmec, J. A. 2003. “Minority Job Concentration and Wages.” Social Problems 50:38-59.
18. Malhotra, N. and Raso, C. 2007. “Racial Representation and U.S. Senate Apportionment.” Social Science Quarterly 88:1038-48.
19. MMWR. 2007, “Prevalence of Stroke—United States, 2005. 56(19): 469-474.
20. Morales L. S., Lara M., Kington R. S., Valdez R. O. 2002. Socioeconomic, cultural, and behavioral factors affecting Hispanic health outcomes. Journal of Health Care for the Poor and Underserved, 13(4), 477-503.
21. Perez-Escamilla, R. 2011. Acculturation, nutrition and health disparities in Latinos. The American Journal of Clinical Nutrition. Vol 93 (5): 1163-1167.
22. Portes, A. and Ruben, R. 2006. Immigrant America: A Portrait. Second ed. Berkeley and Los Angeles, California: University of Californian Press.
23. Rogers, R. G., Robert, A. H., and Patrick M. K. 2006. “Adult Mortality.” Pp. 283-310 in Dudley Poston and Michael Micklin (eds.), Handbook of Population. New York: Springer.
24. Rogers, R. G., Robert, A. H., and Charles B. N. 2000. Living and Dying in the USA: Behavioral, Health, and Social Differentials of Adult Mortality. San Diego, CA: Academic Press.
25. Saenz, R. and Mercedes, R. 2007. “Lack of Health Insurance and Mortality among Latino Elderly in the United States.” Pp. 181-194 in Jacqueline L. Angel and Keith E. Whitfield (eds.), The Health of Aging Hispanics: The Mexican-Origin Population. New York: Springer.
26. State of Health. 2009. The state of Health: Houston Harris County. http://houstonstateofhealth.org/soh_doc/
27. Vega, W. A., Rodriguez, A. A. and Gruskin, E. 2009. Health Disparities in the Latino Population. Epidemiologic Reviews. 31; 99-112.
28. Waters, M. C. 2001. Black Identities: West Indian Immigrant Dreams and American Reality. Cambridge, MA: Harvard Uni. Press.
29. Williams D., Collins C. 2001. Racial residential segregation: a fundamental cause of racial disparities in health. Public Health Rep. 116:404-417.
30. Zhou, M. 1992. Chinatown: The Socioeconomic Potential of an Urban Enclave Philadelphia: Temple University Press.


Hispanic Health ProfileHouston/Harris County
Population Growth, Demographics, Chronic Diseaseand Health Disparities
CITY OF HOUSTONDepartment of Health and Human Services
andHispanic Health Coalition
2013