houston firefighters’ relief and retirement fund firefighters’ relief and retirement fund . ......
TRANSCRIPT

Buck Consultants HFRRF 2015 Actuarial Valuation P:\share\Clients\HOU\VAL\HFRRF Actuarial Valuation Rpt_2015 2.docx
Houston Firefighters’ Relief and Retirement Fund
Actuarial Valuation Report As of July 1, 2015
Prepared by David L. Driscoll, FSA, EA, MAAA
David Kent, FSA, EA, MAAA Buck Consultants
October 2016

Buck Consultants HFRRF 2015 Actuarial Valuation P:\share\Clients\HOU\VAL\HFRRF Actuarial Valuation Rpt_2015 2.docx
Summary of Key Results ($000)
July 1, 2015
Actuarial Contribution Rate · Normal Cost (City Portion) 19.5%
· Amortization of Unfunded Actuarial
Accrued Liability (Surplus) 11.3
· Additional Statutory Requirement 0 · City's Actuarial Contribution Rate 30.8%
· Employee Contribution Rate 9.0%
Summary of Assets
· Market Value
$ 3,877,651
Rate of Return 1.3% · Actuarial Value(1)
$ 3,929,988
Rate of Return 9.3% Summary of Liabilities
· Actuarial Accrued Liability $ 4,397,007 · Actuarial Value of Assets $ (3,929,988)
· Unfunded Actuarial Accrued Liability $ 467,019 · Funded Ratio
89.4%
Summary of Data Number of Participants Included in the Valuation
Active Participants
3,142
DROP Participants
796
Retirees and beneficiaries 3,060
Vested terminated participants 23
Total
7,021 Projected Annual Payroll
Active Participants
$ 221,668
DROP Participants
70,821
Total
$ 292,489 (1) Past gains and losses were fully recognized in the Actuarial Value of Assets at July 1, 2013.

Buck Consultants HFRRF 2015 Actuarial Valuation P:\share\Clients\HOU\VAL\HFRRF Actuarial Valuation Rpt_2015 2.docx
Table of Contents
Page Section I: Asset Information
Summary of Market Value of Assets ......................................................................................... 1
Change in Market Value of Assets Since June 30, 2014 ........................................................... 2
Development of the Actuarial Value of Assets ........................................................................... 3 Section II: Basic Valuation Results
Unfunded Actuarial Accrued Liability ......................................................................................... 5 Section III: Contribution Rate Actuarially Determined City Contribution Rates ......................................................................... 6
Historical City Contributions as a Percentage of Covered Payroll.............................................. 7 Section IV: Participant Information
Participant Data Reconciliation ................................................................................................. 8
Summary of Active Participants as of July 1, 2015 .................................................................... 9
Summary of DROP Participants as of July 1, 2015 ................................................................. 10
Summary of Active and DROP Participants as of July 1, 2015 ................................................ 11
Historical Active and DROP Participant Data .......................................................................... 12
Summary of Inactive Participants as of July 1, 2015 ............................................................... 13
Retirees and Beneficiaries Added to and Removed from Rolls ............................................... 14 Section V: Miscellaneous Information
Summary of Actuarial Methods and Assumptions ................................................................... 15
Summary of Plan Provisions ................................................................................................... 22
Actuarial Certification .............................................................................................................. 28

Buck Consultants Page 1 HFRRF 2015 Actuarial Valuation P:\share\Clients\HOU\VAL\HFRRF Actuarial Valuation Rpt_2015 2.docx
Summary of Market Value of Assets ($000)
July 1, 2015 July 1, 2014 July 1, 2013 Amount Percent Amount Percent Amount Percent Investment Category Cash & Short Term Investments $ 163,566 4.2% $ 127,736 2.6% $ 105,737 3.1% Fixed Income Investments 1,216,922 31.4% 1,220,890 34.6% 1,123,763 32.9% Equity Securities 1,503,799 38.8% 1,557,858 36.2% 1,378,698 40.2% Other Assets
Alternative Investments - Partnerships 808,707 20.9% 812,356 19.5% 618,511 18.0%
Real Estate 171,053 4.4% 195,472 6.6% 189,252 5.5% Land, Building, etc. 5,659 0.1% 5,950 0.2% 6,990 0.2%
Other Net Assets, Receivables & Payables:
Accrued Interest & Dividends 16,984 0.4% 16,457 0.5% 17,507 0.5%
Accrued City Contributions 2,828 0.1% 2,474 0.0% 1,591 0.0% Accrued Member
Contributions 769 0.0% 671 0.0% 599 0.0% Net Other (12,636) (0.3)% (27,039) (0.2)% (12,211) (0.4)%
Total Market Value of Assets $ 3,877,651 100.0% $ 3,912,825 100.0% $ 3,430,437 100.0%

Buck Consultants Page 2 HFRRF 2015 Actuarial Valuation P:\share\Clients\HOU\VAL\HFRRF Actuarial Valuation Rpt_2015 2.docx
Change in Market Value Assets Fiscal Year End
June 30, 2015 Fiscal Year End June 30, 2014
1. Beginning of Year Market Value $ 3,912,825,278 $ 3,430,436,708
2. Increases Due to: a. Contributions:
i. City $ 92,609,565 $ 64,337,994
ii. Members 25,091,582 23,993,560
iii. Total $ 117,701,147 $ 88,331,554
b. Investment Income $ 51,802,139 $ 589,517,944
c. Total Increases $ 169,503,286 $ 677,849,498
3. Decreases Due to: a. Benefit Payments $ 195,493,351 $ 186,332,755
b. Refund of Member Contributions 868,618 784,927
c. Administrative Expenses 6,640,148 6,884,474
d. Professional Services 1,675,931 1,458,772
e. Total Decreases $ 204,678,048 $ 195,460,928
4. End of Year Market Value $ 3,877,650,516 $ 3,912,825,278

Buck Consultants Page 3 HFRRF 2015 Actuarial Valuation P:\share\Clients\HOU\VAL\HFRRF Actuarial Valuation Rpt_2015 2.docx
Development of the Actuarial Value of Assets ($000) Actuarial Investment Gain (Loss)
Fiscal Year End June 30, 2015
Fiscal Year End June 30, 2014
1. Market Value of Assets at beginning of year
$ 3,912,825 $ 3,430,437
2. 2014/2015 Net Cash Flow
a. Contributions
$ 117,701 $ 88,332
b. Disbursements
196,362 187,118
c. Net Cash Flow
$ (78,661) $ (98,786)
2.a.- 2.b.
3. Expected Investment Return
$ 329,247 $ 287,389
[ 1. x .085] + [2.c. x .0425]
4. Expected Market Value of Assets at end of year $ 4,163,411 $ 3,619,040
1. + 2.c. + 3.
5. Market Value of Assets at end of year
$ 3,877,651 $ 3,912,825
6. Investment Gain / (Loss)
$ (285,760) $ 293,785
5. - 4.

Buck Consultants Page 4 HFRRF 2015 Actuarial Valuation P:\share\Clients\HOU\VAL\HFRRF Actuarial Valuation Rpt_2015 2.docx
Development of the Actuarial Value of Assets ($000) (continued) Schedule of Actuarial Investment Gains (Losses)
Unrecognized
Plan Year
Initial Actuarial
Five-Year
Gain (Loss)*
Ending
Gain (Loss)
Recognition
As of July 1, 2015
July 1, 2015
$ (285,760)
$ (57,152)
$ (228,608)
July 1, 2014
$ 293,785
$ 58,757
$ 176,271
Actuarial Value of Assets
1. Market Value as of July 1, 2015
$ 3,877,651
2. (Gain) Loss to be Recognized in Future Years
$ 52,337
3. Actuarial Value as of July 1, 2015
$ 3,929,988
* Past gains and losses were fully recognized in the Actuarial Value of Assets at July 1, 2013. For 2013,
the Actuarial Value of Assets is equal to the Market Value of Assets. Starting in July 1, 2014, assets gains and losses are deferred for recognition in future years.

Buck Consultants Page 5 HFRRF 2015 Actuarial Valuation P:\share\Clients\HOU\VAL\HFRRF Actuarial Valuation Rpt_2015 2.docx
Unfunded Actuarial Accrued Liability ($000)
July 1, 2015
Actuarial Present Value of:
Future Benefits
Active
$ 1,380,606
DROP
1,079,558
Deferred Vested
1,869
Retired
2,711,549
Total for All Participants
$ 5,173,582
Future Employee Contributions $ 235,139
Future Normal Cost - City Portion $ 541,436
Actuarial Accrued Liability
$ 4,397,007
Actuarial Value of Assets
$ (3,929,988)
Unfunded Actuarial Accrued Liability $ 467,019
Total Normal Cost (BOY)
$ 79,670

Buck Consultants Page 6 HFRRF 2015 Actuarial Valuation P:\share\Clients\HOU\VAL\HFRRF Actuarial Valuation Rpt_2015 2.docx
Actuarially Determined City Contribution Rates
Actuarial Valuation
as of July 1, 2015
1. Normal Cost (City Portion) 19.5 % 2. Amortization of Unfunded Actuarial
Accrued Liability (Surplus) 11.3 %
3. Additional Statutory Requirement 0.0 4. City's Contribution Rate 30.8 %
5. Employee Contribution Rate 9.0 %
Analysis of Actual Contribution Rates Contribution Rate City Employee Fiscal Year 2009 29.4% 9.0% Fiscal Year 2010 29.4% 9.0% Fiscal Year 2011 29.4% 9.0% Fiscal Year 2012 23.9% 9.0% Fiscal Year 2013 23.9% 9.0% Fiscal Year 2014 23.9% 9.0% Fiscal Year 2015 33.2% 9.0%

Buck Consultants Page 7 HFRRF 2015 Actuarial Valuation P:\share\Clients\HOU\VAL\HFRRF Actuarial Valuation Rpt_2015 2.docx
Historical City Contributions as a Percentage of Covered Payroll
Actuarially Calculated City Contribution Rate(1)
Actual City Contribution Rate
Valuation Date Rate Period Rate
July 1, 1987 13.0% July 1, 1988 through June 30, 1989 15.0%
July 1, 1988 13.3 July 1, 1989 through June 30, 1990 15.0
July 1, 1989 12.9 July 1, 1990 through June 30, 1991 15.0
July 1, 1990 13.2 July 1, 1991 through June 30, 1992 15.0
July 1, 1991 15.4 July 1, 1992 through June 30, 1993 15.0(2)
July 1, 1992 15.3 July 1, 1993 through June 30, 1994 15.3
July 1, 1993 15.6 July 1, 1994 through June 30, 1995 15.0
July 1, 1994 14.9 July 1, 1995 through June 30, 1996 15.0
July 1, 1995 13.4(3) July 1, 1996 through June 30, 1997 15.4
July 1, 1996 14.1(3) July 1, 1997 through June 30, 1998 15.4
July 1, 1997 14.9(3) July 1, 1998 through June 30, 1999 15.4
July 1, 1998 11.5 July 1, 1999 through June 30, 2000 15.4
July 1, 1999 11.0 July 1, 2000 through June 30, 2001 15.4
July 1, 2000 9.9(3) July 1, 2001 through June 30, 2002 15.4
July 1, 2001 14.9(3) July 1, 2002 through June 30, 2003 15.4
July 1, 2002 23.8 July 1, 2003 through June 30, 2004 16.5(3)
July 1, 2003 N/A(4) July 1, 2004 through June 30, 2005 18.0
July 1, 2004 31.1 July 1, 2005 through June 30, 2006 23.8
July 1, 2005 33.5 July 1, 2006 through June 30, 2007 23.8
July 1, 2006 32.7 July 1, 2007 through June 30, 2008 23.8
July 1, 2007 29.4 July 1, 2008 through June 30, 2009 29.4
July 1, 2008 24.1 July 1, 2009 through June 30, 2010 29.4
July 1, 2009 23.8 July 1, 2010 through June 30, 2011 29.4
July 1, 2010 23.9 July 1, 2011 through June 30, 2012 23.9
July 1, 2011 26.9 July 1, 2012 through June 30, 2013 23.9
July 1, 2012 31.1 July 1, 2013 through June 30, 2014 23.9
July 1, 2013 33.2 July 1, 2014 through June 30, 2015 33.2
July 1, 2014 N/A(4) July 1, 2015 through June 30, 2016 33.2
July 1, 2015 30.8 July 1, 2016 through June 30, 2017 TBD
(1) Before application of statutory minimum contribution. (2) Excluding additional contribution due to settlement of lawsuit. (3) Average for the year. (4) No valuation performed.

Buck Consultants Page 8 HFRRF 2015 Actuarial Valuation P:\share\Clients\HOU\VAL\HFRRF Actuarial Valuation Rpt_2015 2.docx
Participant Data Reconciliation Deferred Active DROP Vested Retired Total 1. Number of members as of 3,041 785 16 2,998 6,840 July 1, 2014
2. Change in status during the plan year:
a. Actives who retired (2) (84) 86 0
b. Actives who terminated (11) 11 0
c. Actives who entered D.R.O.P. (100) 100 0
d. Inactives who retired
e. Participants who became disabled (6) (2) (1) 9 0
3. No longer members due to:
a. Death (2) (3) (71) (76)
b. Nonvested terminations (4) (4)
c. Child attained cut-off age (10) (10)
d. Benefits no longer due (16) (3) (4) (23)
4. New member due to:
a. Initial membership 245 14 259
b. Death of another member 35 35
c. Correction (3) 3 0
5. Number of members as of July 1, 2015 3,142 796 23 3,060 7,021

Buck Consultants Page 9 HFRRF 2015 Actuarial Valuation P:\share\Clients\HOU\VAL\HFRRF Actuarial Valuation Rpt_2015 2.docx
Summary of Active Participants as of July 1, 2015
Attained Age Under 1 1 to 4 5 to 9 10 to 14 15 to 19 20 to 24 25 to 29 30 to 34 35 to 39 40 & up Total Under 25 21 49 0 0 0 0 0 0 0 0 70 Avg. Pay 7,614 49,048 0 0 0 0 0 0 0 0 36,618 25 to 29 81 266 82 1 0 0 0 0 0 0 430 Avg. Pay 9,070 48,891 65,120 74,491 0 0 0 0 0 0 44,544 30 to 34 55 198 298 145 0 0 0 0 0 0 696 Avg. Pay 9,189 49,336 66,253 73,003 0 0 0 0 0 0 58,337 35 to 39 8 57 205 520 22 0 0 0 0 0 812 Avg. Pay 10,561 52,992 65,729 71,685 81,239 0 0 0 0 0 68,526 40 to 44 0 3 84 358 169 66 0 0 0 0 680 Avg. Pay 0 63,273 67,042 72,390 82,406 88,583 0 0 0 0 75,750 45 to 49 0 0 2 128 151 73 7 0 0 0 361 Avg. Pay 0 0 63,447 72,305 81,641 86,995 99,970 0 0 0 79,668 50 to 54 0 0 0 3 48 32 2 1 0 0 86 Avg. Pay 0 0 0 73,699 83,793 83,317 76,251 68,281 0 0 82,908 55 to 59 0 0 0 0 0 6 0 0 1 0 7 Avg. Pay 0 0 0 0 0 81,425 0 0 77,183 0 80,819 60 to 64 0 0 0 0 0 0 0 0 0 0 0 Avg. Pay 0 0 0 0 0 0 0 0 0 0 0 65 to 69 0 0 0 0 0 0 0 0 0 0 0 Avg. Pay 0 0 0 0 0 0 0 0 0 0 0 70 & up 0 0 0 0 0 0 0 0 0 0 0 Avg. Pay 0 0 0 0 0 0 0 0 0 0 0 Total 165 573 671 1,155 390 177 9 1 1 0 3,142 Avg. Pay 8,997 49,542 66,045 72,145 82,215 86,733 94,699 68,281 77,183 0 65,541
Average Age: 36.85 Average Service: 9.83

Buck Consultants Page 10 HFRRF 2015 Actuarial Valuation P:\share\Clients\HOU\VAL\HFRRF Actuarial Valuation Rpt_2015 2.docx
Summary of DROP Participants as of July 1, 2015
Attained Age Under 1 1 to 4 5 to 9 10 to 14 15 to 19 20 to 24 25 to 29 30 to 34 35 to 39 40 & up Total Under 25 0 0 0 0 0 0 0 0 0 0 0 Avg. Pay 0 0 0 0 0 0 0 0 0 0 0 25 to 29 0 0 0 0 0 0 0 0 0 0 0 Avg. Pay 0 0 0 0 0 0 0 0 0 0 0 30 to 34 0 0 0 0 0 0 0 0 0 0 0 Avg. Pay 0 0 0 0 0 0 0 0 0 0 0 35 to 39 0 0 0 0 0 0 0 0 0 0 0 Avg. Pay 0 0 0 0 0 0 0 0 0 0 0 40 to 44 0 0 0 0 0 23 5 0 0 0 28 Avg. Pay 0 0 0 0 0 83,107 87,383 0 0 0 83,871 45 to 49 0 0 0 0 0 104 57 0 0 0 161 Avg. Pay 0 0 0 0 0 82,004 87,455 0 0 0 83,934 50 to 54 0 0 0 0 0 96 110 98 0 0 304 Avg. Pay 0 0 0 0 0 81,250 84,870 85,908 0 0 84,061 55 to 59 0 0 0 0 0 26 37 155 52 2 272 Avg. Pay 0 0 0 0 0 79,805 83,611 85,362 86,818 87,935 84,890 60 to 64 0 0 0 0 0 0 0 16 10 2 28 Avg. Pay 0 0 0 0 0 0 0 81,310 89,293 75,392 83,738 65 to 69 0 0 0 0 0 0 0 0 0 2 2 Avg. Pay 0 0 0 0 0 0 0 0 0 91,359 91,359 70 & up 0 0 0 0 0 0 0 0 0 1 1 Avg. Pay 0 0 0 0 0 0 0 0 0 109,347 109,347 Total 0 0 0 0 0 249 209 269 62 7 796 Avg. Pay 0 0 0 0 0 81,585 85,412 85,320 87,217 88,388 84,351
Average Age: 52.73 Average Service: 28.59

Buck Consultants Page 11 HFRRF 2015 Actuarial Valuation P:\share\Clients\HOU\VAL\HFRRF Actuarial Valuation Rpt_2015 2.docx
Summary of Active and DROP Participants as of July 1, 2015
Attained Age Under 1 1 to 4 5 to 9 10 to 14 15 to 19 20 to 24 25 to 29 30 to 34 35 to 39 40 & up Total Under 25 21 49 0 0 0 0 0 0 0 0 70 Avg. Pay 7,614 49,048 0 0 0 0 0 0 0 0 36,618 25 to 29 81 266 82 1 0 0 0 0 0 0 430 Avg. Pay 9,070 48,891 65,120 74,491 0 0 0 0 0 0 44,544 30 to 34 55 198 298 145 0 0 0 0 0 0 696 Avg. Pay 9,189 49,336 66,253 73,003 0 0 0 0 0 0 58,337 35 to 39 8 57 205 520 22 0 0 0 0 0 812 Avg. Pay 10,561 52,992 65,729 71,685 81,239 0 0 0 0 0 68,526 40 to 44 0 3 84 358 169 89 5 0 0 0 708 Avg. Pay 0 63,273 67,042 72,390 82,406 87,168 87,383 0 0 0 76,071 45 to 49 0 0 2 128 151 177 64 0 0 0 522 Avg. Pay 0 0 63,447 72,305 81,641 84,062 88,823 0 0 0 80,984 50 to 54 0 0 0 3 48 128 112 99 0 0 390 Avg. Pay 0 0 0 73,699 83,793 81,767 84,716 85,730 0 0 83,807 55 to 59 0 0 0 0 0 32 37 155 53 2 279 Avg. Pay 0 0 0 0 0 80,108 83,611 85,362 86,636 87,935 84,788 60 to 64 0 0 0 0 0 0 0 16 10 2 28 Avg. Pay 0 0 0 0 0 0 0 81,310 89,293 75,392 83,738 65 to 69 0 0 0 0 0 0 0 0 0 2 2 Avg. Pay 0 0 0 0 0 0 0 0 0 91,359 91,359 70 & up 0 0 0 0 0 0 0 0 0 1 1 Avg. Pay 0 0 0 0 0 0 0 0 0 109,347 109,347 Total 165 573 671 1,155 390 426 218 270 63 7 3,938 Avg. Pay 8,997 49,542 66,045 72,145 82,215 83,724 85,795 85,257 87,058 88,388 69,343
Average Age: 40.05 Average Service: 13.62
Buck Consultants Page 12 HFRRF 2015 Actuarial Valuation P:\share\Clients\HOU\VAL\HFRRF Actuarial Valuation Rpt_2015 2.docx
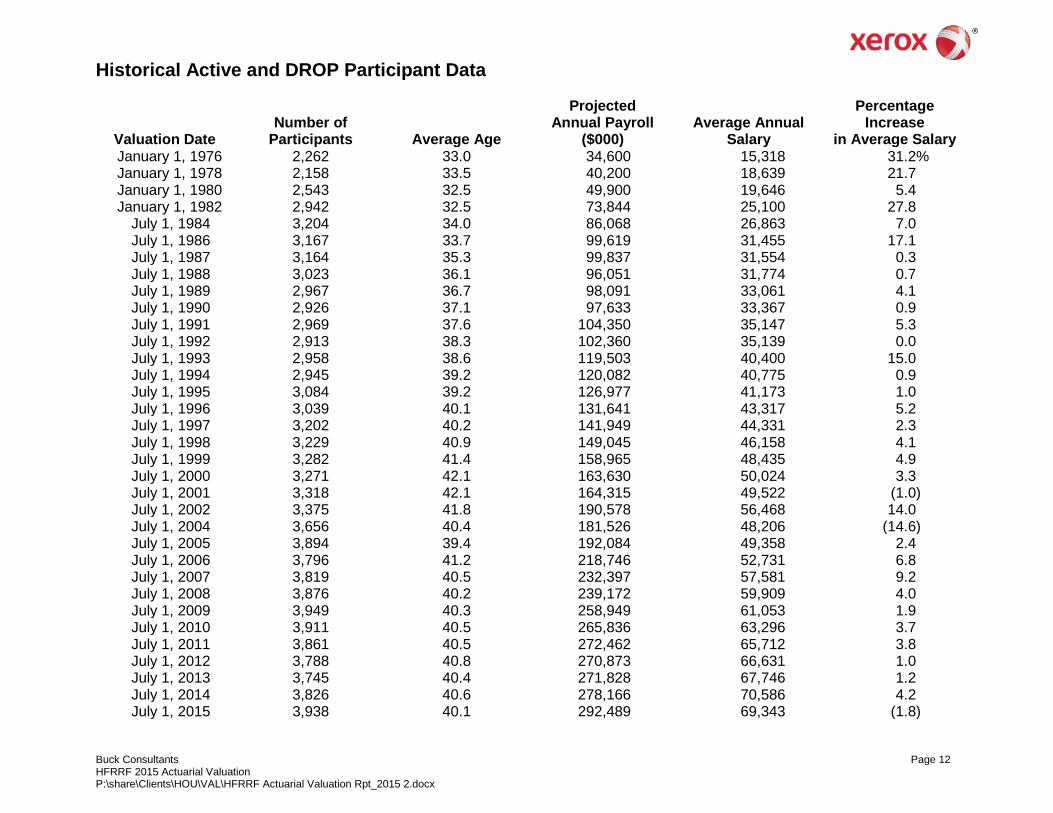
Historical Active and DROP Participant Data
Valuation Date Number of
Participants Average Age
Projected Annual Payroll
($000) Average Annual
Salary
Percentage Increase
in Average Salary January 1, 1976 2,262 33.0 34,600 15,318 31.2% January 1, 1978 2,158 33.5 40,200 18,639 21.7 January 1, 1980 2,543 32.5 49,900 19,646 5.4 January 1, 1982 2,942 32.5 73,844 25,100 27.8
July 1, 1984 3,204 34.0 86,068 26,863 7.0 July 1, 1986 3,167 33.7 99,619 31,455 17.1 July 1, 1987 3,164 35.3 99,837 31,554 0.3 July 1, 1988 3,023 36.1 96,051 31,774 0.7 July 1, 1989 2,967 36.7 98,091 33,061 4.1 July 1, 1990 2,926 37.1 97,633 33,367 0.9 July 1, 1991 2,969 37.6 104,350 35,147 5.3 July 1, 1992 2,913 38.3 102,360 35,139 0.0 July 1, 1993 2,958 38.6 119,503 40,400 15.0 July 1, 1994 2,945 39.2 120,082 40,775 0.9 July 1, 1995 3,084 39.2 126,977 41,173 1.0 July 1, 1996 3,039 40.1 131,641 43,317 5.2 July 1, 1997 3,202 40.2 141,949 44,331 2.3 July 1, 1998 3,229 40.9 149,045 46,158 4.1 July 1, 1999 3,282 41.4 158,965 48,435 4.9 July 1, 2000 3,271 42.1 163,630 50,024 3.3 July 1, 2001 3,318 42.1 164,315 49,522 (1.0) July 1, 2002 3,375 41.8 190,578 56,468 14.0 July 1, 2004 3,656 40.4 181,526 48,206 (14.6) July 1, 2005 3,894 39.4 192,084 49,358 2.4 July 1, 2006 3,796 41.2 218,746 52,731 6.8 July 1, 2007 3,819 40.5 232,397 57,581 9.2 July 1, 2008 3,876 40.2 239,172 59,909 4.0 July 1, 2009 3,949 40.3 258,949 61,053 1.9 July 1, 2010 3,911 40.5 265,836 63,296 3.7 July 1, 2011 3,861 40.5 272,462 65,712 3.8 July 1, 2012 3,788 40.8 270,873 66,631 1.0 July 1, 2013 3,745 40.4 271,828 67,746 1.2 July 1, 2014 3,826 40.6 278,166 70,586 4.2 July 1, 2015 3,938 40.1 292,489 69,343 (1.8)

Buck Consultants Page 13 HFRRF 2015 Actuarial Valuation P:\share\Clients\HOU\VAL\HFRRF Actuarial Valuation Rpt_2015 2.docx
Summary of Inactive Participants as of July 1, 2015
Number Annual Benefits
($000) Average
Annual Benefits
• Benefits in Pay Status
Retirees 2,160 $ 103,826 $ 48,068
Beneficiaries 578 21,657 37,533
Disabled Participants 322 15,146 47,039
Total 3,060 $ 140,629 $ 45,957
• Deferred Benefits
Vested Terminated Participants 23 $ 170 $ 7,406
Beneficiaries N/A N/A N/A
Disabled Participants N/A N/A N/A
Total 23 $ 170 $ 7,406
Buck Consultants Page 14 HFRRF 2015 Actuarial Valuation P:\share\Clients\HOU\VAL\HFRRF Actuarial Valuation Rpt_2015 2.docx
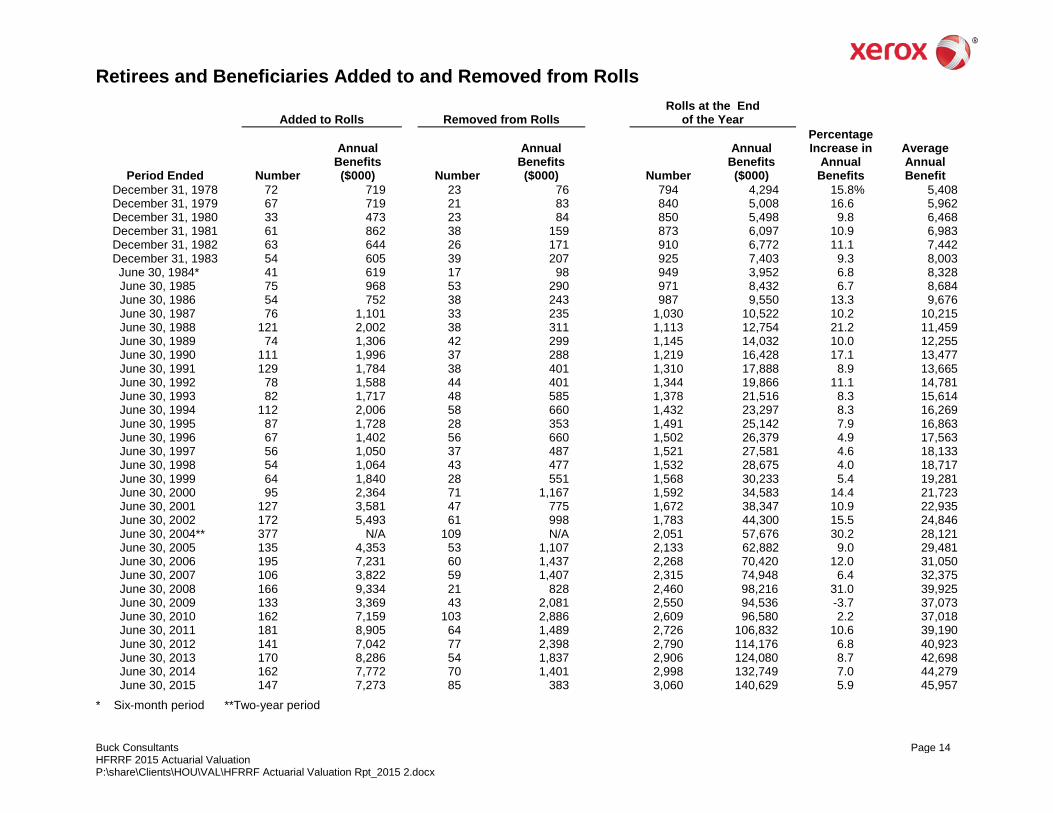
Retirees and Beneficiaries Added to and Removed from Rolls
Added to Rolls Removed from Rolls Rolls at the End
of the Year
Period Ended Number
Annual Benefits ($000) Number
Annual Benefits ($000) Number
Annual Benefits ($000)
Percentage Increase in
Annual Benefits
Average Annual Benefit
December 31, 1978 72 719 23 76 794 4,294 15.8% 5,408 December 31, 1979 67 719 21 83 840 5,008 16.6 5,962 December 31, 1980 33 473 23 84 850 5,498 9.8 6,468 December 31, 1981 61 862 38 159 873 6,097 10.9 6,983 December 31, 1982 63 644 26 171 910 6,772 11.1 7,442 December 31, 1983 54 605 39 207 925 7,403 9.3 8,003
June 30, 1984* 41 619 17 98 949 3,952 6.8 8,328 June 30, 1985 75 968 53 290 971 8,432 6.7 8,684 June 30, 1986 54 752 38 243 987 9,550 13.3 9,676 June 30, 1987 76 1,101 33 235 1,030 10,522 10.2 10,215 June 30, 1988 121 2,002 38 311 1,113 12,754 21.2 11,459 June 30, 1989 74 1,306 42 299 1,145 14,032 10.0 12,255 June 30, 1990 111 1,996 37 288 1,219 16,428 17.1 13,477 June 30, 1991 129 1,784 38 401 1,310 17,888 8.9 13,665 June 30, 1992 78 1,588 44 401 1,344 19,866 11.1 14,781 June 30, 1993 82 1,717 48 585 1,378 21,516 8.3 15,614 June 30, 1994 112 2,006 58 660 1,432 23,297 8.3 16,269 June 30, 1995 87 1,728 28 353 1,491 25,142 7.9 16,863 June 30, 1996 67 1,402 56 660 1,502 26,379 4.9 17,563 June 30, 1997 56 1,050 37 487 1,521 27,581 4.6 18,133 June 30, 1998 54 1,064 43 477 1,532 28,675 4.0 18,717 June 30, 1999 64 1,840 28 551 1,568 30,233 5.4 19,281 June 30, 2000 95 2,364 71 1,167 1,592 34,583 14.4 21,723 June 30, 2001 127 3,581 47 775 1,672 38,347 10.9 22,935
June 30, 2002 172 5,493 61 998 1,783 44,300 15.5 24,846 June 30, 2004** 377 N/A 109 N/A 2,051 57,676 30.2 28,121 June 30, 2005 135 4,353 53 1,107 2,133 62,882 9.0 29,481 June 30, 2006 195 7,231 60 1,437 2,268 70,420 12.0 31,050 June 30, 2007 106 3,822 59 1,407 2,315 74,948 6.4 32,375 June 30, 2008 166 9,334 21 828 2,460 98,216 31.0 39,925 June 30, 2009 133 3,369 43 2,081 2,550 94,536 -3.7 37,073 June 30, 2010 162 7,159 103 2,886 2,609 96,580 2.2 37,018 June 30, 2011 181 8,905 64 1,489 2,726 106,832 10.6 39,190 June 30, 2012 141 7,042 77 2,398 2,790 114,176 6.8 40,923 June 30, 2013 170 8,286 54 1,837 2,906 124,080 8.7 42,698 June 30, 2014 162 7,772 70 1,401 2,998 132,749 7.0 44,279 June 30, 2015 147 7,273 85 383 3,060 140,629 5.9 45,957
* Six-month period **Two-year period
Buck Consultants Page 15 HFRRF 2015 Actuarial Valuation P:\share\Clients\HOU\VAL\HFRRF Actuarial Valuation Rpt_2015 2.docx
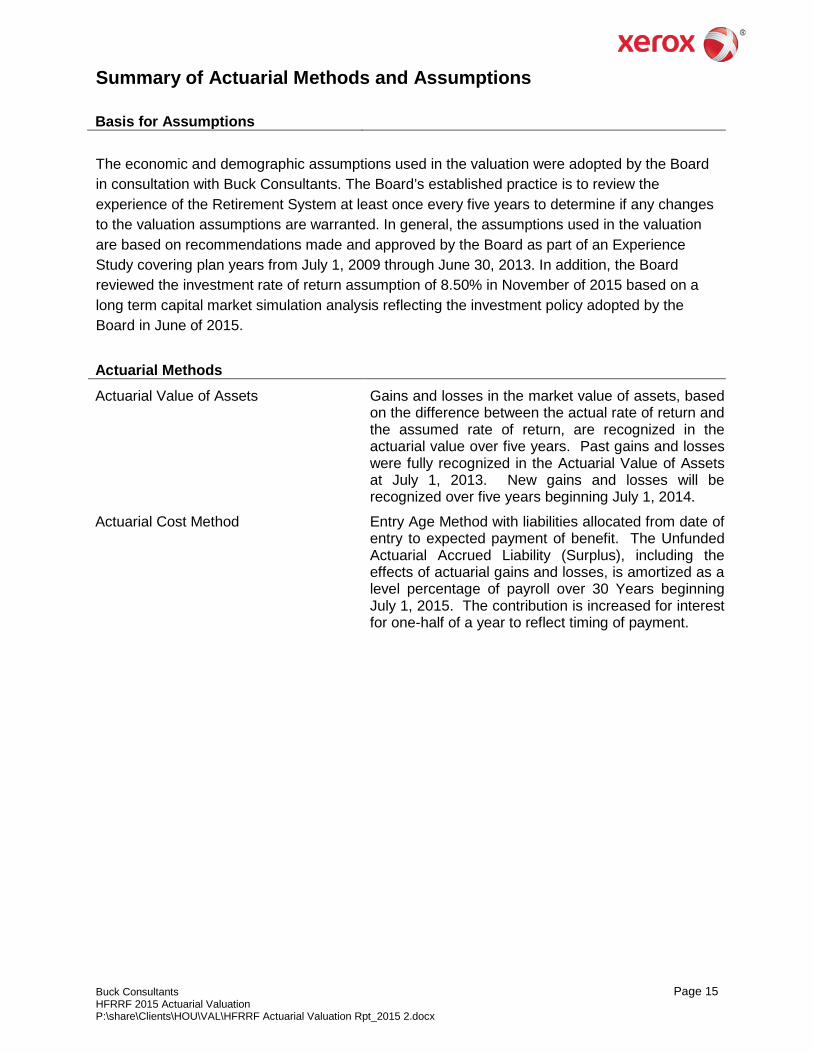
Summary of Actuarial Methods and Assumptions
Basis for Assumptions
The economic and demographic assumptions used in the valuation were adopted by the Board in consultation with Buck Consultants. The Board’s established practice is to review the experience of the Retirement System at least once every five years to determine if any changes to the valuation assumptions are warranted. In general, the assumptions used in the valuation are based on recommendations made and approved by the Board as part of an Experience Study covering plan years from July 1, 2009 through June 30, 2013. In addition, the Board reviewed the investment rate of return assumption of 8.50% in November of 2015 based on a long term capital market simulation analysis reflecting the investment policy adopted by the Board in June of 2015.
Actuarial Methods
Actuarial Value of Assets Gains and losses in the market value of assets, based on the difference between the actual rate of return and the assumed rate of return, are recognized in the actuarial value over five years. Past gains and losses were fully recognized in the Actuarial Value of Assets at July 1, 2013. New gains and losses will be recognized over five years beginning July 1, 2014.
Actuarial Cost Method Entry Age Method with liabilities allocated from date of entry to expected payment of benefit. The Unfunded Actuarial Accrued Liability (Surplus), including the effects of actuarial gains and losses, is amortized as a level percentage of payroll over 30 Years beginning July 1, 2015. The contribution is increased for interest for one-half of a year to reflect timing of payment.

Buck Consultants Page 16 HFRRF 2015 Actuarial Valuation P:\share\Clients\HOU\VAL\HFRRF Actuarial Valuation Rpt_2015 2.docx
Summary of Actuarial Methods and Assumptions (continued)
KEY ECONOMIC ASSUMPTIONS Investment Return
Real Rate of Return 5.5% Price Inflation 3.0% Total Nominal Rate 8.5%
Expected future investment returns are assumed to be net of administrative and investment expenses. Wage and Price Inflation 3.0% Payroll Growth Rate 3.0% Individual Pay Increase Rate
(Nominal =
Merit + Wage Inflation) Age Nominal Merit 20 7.00% 4.00% 25 6.25% 3.25% 30 5.50% 2.50% 35 5.00% 2.00% 40 4.00% 1.00% 45 3.70% 0.70% 50 3.40% 0.40% 55 3.00% 0.00%

Buck Consultants Page 17 HFRRF 2015 Actuarial Valuation P:\share\Clients\HOU\VAL\HFRRF Actuarial Valuation Rpt_2015 2.docx
Summary of Actuarial Methods and Assumptions (continued) Demographic Assumptions
Retirement Rates
Number of Years Probability of Retiring of Service Within One Year
20 1% 21 1% 22 1% 23 1%
24 1% 25 5% 26 5% 27 5% 28 5% 29 5% 30 15% 31 15% 32 15% 33 15% 34 15% 35 25% 36 25% 37 30% 38 35% 39 40% 40+ 100%

Buck Consultants Page 18 HFRRF 2015 Actuarial Valuation P:\share\Clients\HOU\VAL\HFRRF Actuarial Valuation Rpt_2015 2.docx
Summary of Actuarial Methods and Assumptions (continued)
Demographic Assumptions
DROP Duration Duration of DROP at
Retirement Percentage of Participants Electing Retirement at the Specified Duration
0 3 5 8
10
0% 0 5
30 65
Sample Rates Number of Years
of Service at Actual Retirement
Percentage of Participants Retiring with
Specific Drop Durations 0 yr 3 yrs 5 yrs 8 yrs 10 yrs 20
25 30 35 40+
0% 0% 0% 0% 0% 0 0 100 0 0 0 0 5 30 65 0 0 5 30 65 0 0 0 0 100

Buck Consultants Page 19 HFRRF 2015 Actuarial Valuation P:\share\Clients\HOU\VAL\HFRRF Actuarial Valuation Rpt_2015 2.docx
Summary of Actuarial Methods and Assumptions (continued)
Mortality Rates
Active participants and nondisabled pensioners
RP-2000 Table projected to year 2025 using Scale AA.
Note: The RP-2000 Mortality Table projected to year 2025 using scale AA is used to determine the mortality assumptions for the plan, including the probability of ceasing active service due to death.
Disabled pensioners Graduated rates (see table below for sample rates).
Disability Rates Graduated rates (see table below for sample rates).
Percentage of Deaths and Disabilities in the Line of Duty Age Death Disability*
25 35 45 55
100% 100 42 20
60% 60 34 25
* 1% of firefighters who become disabled in the line of duty are assumed to be incapable of performing any substantial gainful activity.
Termination Rates Age Termination Rate
20 25 30 35 40 45 50
1.30% 1.30 1.18 0.70 0.40 0.45 0.00
For participants terminating with at least 10 years but less than 20 years of service:
• 50% will elect a contribution refund
• 50% will elect a deferred monthly pension benefit
Marital Status at Benefit Eligibility
Percentage married • 90% of participants are assumed to be married.
• No beneficiaries other than the spouse assumed.
Age difference • Husbands assumed to be three years older than wives.

Buck Consultants Page 20 HFRRF 2015 Actuarial Valuation P:\share\Clients\HOU\VAL\HFRRF Actuarial Valuation Rpt_2015 2.docx
Summary of Actuarial Methods and Assumptions (continued) Load of Nature of Average Monthly Salaries
• Active liabilities and normal costs were increased 5% to account for differences between the plan’s definition of average monthly salary (average of the highest 78 pay periods), and the average of the final 78 pay periods.
Development of Valuation Pay • Valuation pay is developed by increasing the prior year’s pay with the nominal individual pay increase rate.
Age at which Benefits End for Child Beneficiaries
• Benefits are assumed to end once the child beneficiary reaches age 23.
Missing Data Assumptions
Pay for New Hires None were missing.
Employee Contributions Based on the prior year’s contributions and current year’s pay.
Age at First Payment for Vested Terminations: 50
Benefits Not Valued The proportional retirement program between the Houston municipal, police and fire pension funds which allows for combining service credit from two or more City of Houston pension plans was not valued because its impact is expected not to be material.
Sample Rates Sample Rates per 100 Participants
Non-disabled Mortality Disabled Mortality Disability
Age Male Female Male Female All 20
25 30 35 40 45 50 55 60
0.03 0.04 0.04 0.07 0.10 0.15 0.21 0.36 0.67
0.02 0.02 0.03 0.05 0.07 0.11 0.17 0.27 0.50
2.30 2.60 2.90 2.80 3.10 3.50 4.10 5.30 6.50
0.70 1.30 1.90 2.20 2.30 2.30 2.60 3.00 3.40
0.75 0.75 0.75 1.50 1.50 1.50 1.50 1.50 3.00

Buck Consultants Page 21 HFRRF 2015 Actuarial Valuation P:\share\Clients\HOU\VAL\HFRRF Actuarial Valuation Rpt_2015 2.docx
Changes in Assumptions and Methods Since the Prior Year The following changes in assumptions and methods have taken place since the July 1, 2013 valuation: In general, the mortality rates applicable to active and non-disabled participants are based on the RP-2000 table projected 10 years from the valuation date. Therefore, the mortality rates have been updated from the RP-2000 table projected to 2023 using scale AA to the RP-2000 table projected to 2025 using Scale AA. This increased the actuarial accrued liability by $2.5M. Past gains and losses were fully recognized in the Actuarial Value of Assets at July 1, 2013. New gains and losses will be recognized over five years beginning July 1, 2014. The funding policy was changed to amortize the Unfunded Actuarial Accrued Liability (Surplus), including the effects of actuarial gains and losses, as a level percentage of payroll over 30 Years beginning July 1, 2015.
Buck Consultants Page 22 HFRRF 2015 Actuarial Valuation P:\share\Clients\HOU\VAL\HFRRF Actuarial Valuation Rpt_2015 2.docx
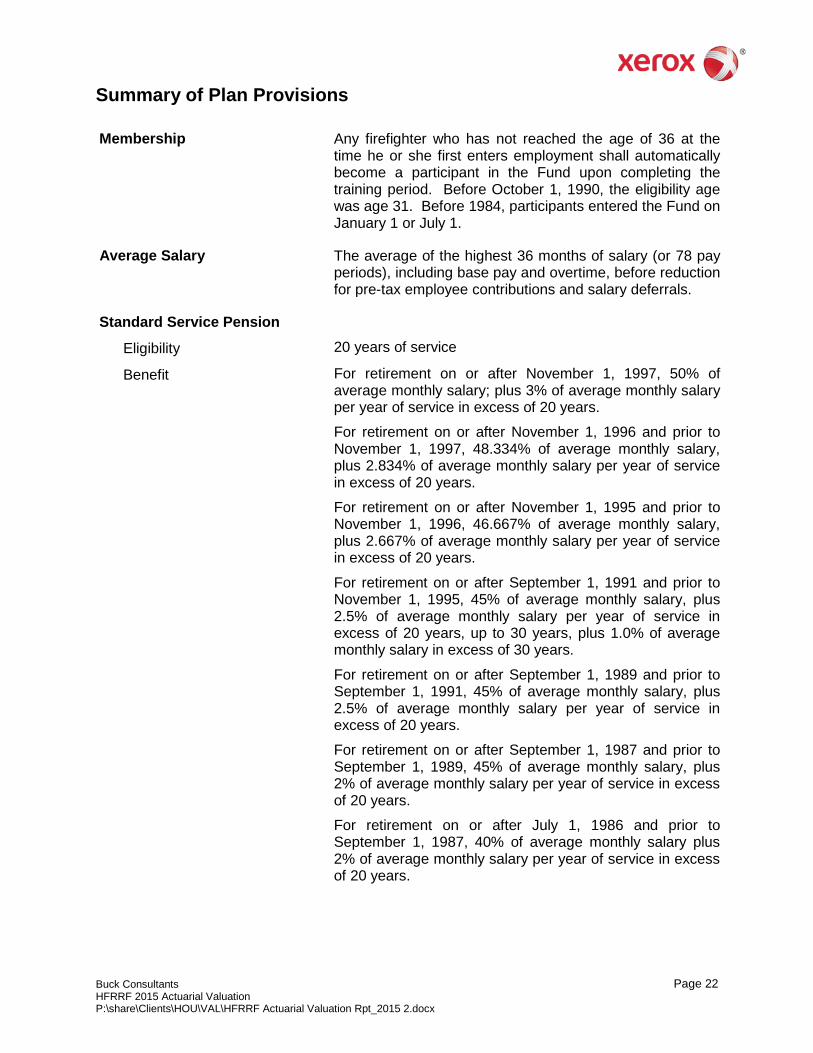
Summary of Plan Provisions
Membership Any firefighter who has not reached the age of 36 at the time he or she first enters employment shall automatically become a participant in the Fund upon completing the training period. Before October 1, 1990, the eligibility age was age 31. Before 1984, participants entered the Fund on January 1 or July 1.
Average Salary The average of the highest 36 months of salary (or 78 pay periods), including base pay and overtime, before reduction for pre-tax employee contributions and salary deferrals.
Standard Service Pension
Eligibility 20 years of service
Benefit For retirement on or after November 1, 1997, 50% of average monthly salary; plus 3% of average monthly salary per year of service in excess of 20 years.
For retirement on or after November 1, 1996 and prior to November 1, 1997, 48.334% of average monthly salary, plus 2.834% of average monthly salary per year of service in excess of 20 years.
For retirement on or after November 1, 1995 and prior to November 1, 1996, 46.667% of average monthly salary, plus 2.667% of average monthly salary per year of service in excess of 20 years.
For retirement on or after September 1, 1991 and prior to November 1, 1995, 45% of average monthly salary, plus 2.5% of average monthly salary per year of service in excess of 20 years, up to 30 years, plus 1.0% of average monthly salary in excess of 30 years.
For retirement on or after September 1, 1989 and prior to September 1, 1991, 45% of average monthly salary, plus 2.5% of average monthly salary per year of service in excess of 20 years.
For retirement on or after September 1, 1987 and prior to September 1, 1989, 45% of average monthly salary, plus 2% of average monthly salary per year of service in excess of 20 years.
For retirement on or after July 1, 1986 and prior to September 1, 1987, 40% of average monthly salary plus 2% of average monthly salary per year of service in excess of 20 years.

Buck Consultants Page 23 HFRRF 2015 Actuarial Valuation P:\share\Clients\HOU\VAL\HFRRF Actuarial Valuation Rpt_2015 2.docx
Summary of Plan Provisions (continued)
Standard Service Pension (continued) Benefit (continued) For retirement on or after January 1, 1970 and prior to July 1,
1986, 35% of average monthly salary plus 3% of average monthly salary per year of service in excess of salary per year of service in excess of 25 years.
Maximum For retirement on or after September 1, 1991, 80% of average monthly salary.
For retirement on or after September 1, 1989 and prior to September 1, 1991, 70% of average monthly salary.
For retirement on or after September 1, 1987 and prior to September 1, 1989, 65% of average monthly salary.
For retirements on or after January 1, 1970 and prior to September 1, 1987, 60% of average monthly salary.
In addition, a member will receive a $5,000 lump sum payment upon retirement.
Alternate Service Pension
Eligibility Firefighters who became participants prior to September 1, 1987 and who attain age 50 with 20 years of service will receive the greater of the standard or alternate pension.
Benefit 50% of average monthly salary plus 1% of average monthly salary per year of service after becoming eligible to retire on an alternate pension.
Maximum 65% of average monthly salary.
Supplemental Bonus Check Supplemental payments totaling up to $5 million will be payable on a prorated basis determined by the Board of Trustees to all retirees and survivors.

Buck Consultants Page 24 HFRRF 2015 Actuarial Valuation P:\share\Clients\HOU\VAL\HFRRF Actuarial Valuation Rpt_2015 2.docx
Summary of Plan Provisions (continued)
Deferred Retirement Option Plan (DROP)
Eligibility 20 years of service.
Benefit Effective July 1, 2000, eligible participants may elect to participate in the DROP for up to ten years or until they leave active service. The member’s standard or alternate service pension (whichever is greater) will be calculated based on service and earnings at the time the DROP is elected.
A notional account will be maintained for each DROP participant. This account will be credited with the following amounts while the member is a participant of the DROP:
• The member’s monthly retirement pension, including applicable cost-of-living adjustments,
• The member’s contribution to the Retirement Fund, and
• Investment earnings/losses at the rate of the Retirement Fund’s earnings/losses averaged over a five-year period.
A benefit equal to the DROP account balance would be paid at the time the member leaves active service. The payment would be made as a single lump sum or as the member chooses.
Effective on July 1, 2000, a three-year back DROP is available for all eligible participants. The DROP account would be recalculated based on what the account balance would have been had the participant elected the DROP up to 3 years earlier than he/she actually did. The initial DROP entry date cannot be backdated prior to September 1, 1995, or prior to 20 years of credited service, and must be on the first of the month selected.
Buck Consultants Page 25 HFRRF 2015 Actuarial Valuation P:\share\Clients\HOU\VAL\HFRRF Actuarial Valuation Rpt_2015 2.docx
Summary of Plan Provisions (continued) Deferred Retirement Option Plan (DROP) (cont.)
The monthly benefit for a participant at actual retirement will increase 2% for every year of DROP participation (Phased in at 1% effective September 1, 2000 and 1% effective September 1, 2001).
Members can remain in the DROP for 13 years. However, the member’s contributions to the Fund will only be credited to his DROP account for the first ten years. Additionally, a maximum of 20% will be added to his benefit at actual retirement.
If a DROP participant suffers an on-duty disability resulting in the inability to perform any gainful activity or dies in the line of duty, the death or disability annuity benefit would be calculated as though the participant had not entered the DROP. In addition, the DROP account would be payable to the participant or beneficiary.
Service-Connected Disability Pension
Eligibility No age or service requirements.
Benefit 50% of average monthly salary or service pension if greater and eligible. Firefighters who are not capable of performing any substantial gainful activity will receive 75% of average monthly salary, or service pension, if greater and eligible.
In addition, a member will receive a $5,000 lump sum.
Non-Service-Connected Disability Pension
Eligibility No age or service requirements.
Benefit 25% of average monthly salary, plus 2.5% of average monthly salary per year of service.
Maximum 50% of average monthly salary or service pension, if greater and eligible.
In addition, a member will receive a $5,000 lump sum.
Vested Pension
Eligibility At least 10 but less than 20 years of service.
Benefit 1.7% of average monthly salary per year of service, payable beginning at age 50 or optional refund of contributions with interest at a flat rate of 5% not compounded.
Buck Consultants Page 26 HFRRF 2015 Actuarial Valuation P:\share\Clients\HOU\VAL\HFRRF Actuarial Valuation Rpt_2015 2.docx
Summary of Plan Provisions (continued)
Death Benefits
Payable as specified below if survived by a spouse, dependent children, or dependent parents. Effective November 1, 1997 dependent children can continue to receive benefits between the ages of 18 and 22 if they are in college.
Non-service-connected: Monthly benefit that would have been payable had the participant retired for non-service-connected disability on the date of his or her death (or service pension if greater).
Postretirement: Monthly benefit which was payable to the participant prior to his or her death. Effective July 1, 1998, a “graded” postretirement death benefit is payable to a surviving spouse if the retiree was not married at the time of retirement. This “graded” benefit is equal to 20% of the postretirement death benefit for each year of marriage to a maximum 100% after five years of marriage.
Preretirement: Refund of contributions made if no eligible survivors. If death occurs after 10 years of service, interest is credited on the contributions at the flat rate of 5% not compounded. If death occurs before 10 years of service, no interest is credited.
Lump sum: A one-time $5,000 lump sum death benefit for any active or retired firefighter. This benefit applies to active members, current retirees, and disabled participants.
Additional Benefit Effective on or after July 1, 2001, an extra monthly benefit of $150 is payable for life to any retired or disabled member or to an eligible survivor of a deceased member. This benefit is not subject to the postretirement adjustment.
Excess Benefit Benefit equal to the excess of any members’ standard service pension benefit over the limit imposed by Section 415 of the code.
Postretirement Adjustment Prior to October 1, 1990: Pensions adjusted each year based on changes in the CPI-U, but not below original amount or above original amount increased 3% each year, not compounded.
Pension adjustments for participants who retire after March 1, 1982 begin at age 55.

Buck Consultants Page 27 HFRRF 2015 Actuarial Valuation P:\share\Clients\HOU\VAL\HFRRF Actuarial Valuation Rpt_2015 2.docx
Summary of Plan Provisions (continued)
Postretirement Adjustment (continued)
Pension adjustments begin immediately for participants whose benefits become payable on or after July 1, 1986 and are based upon 30 or more years of service.
On or after October 1, 1990 and prior to November 1, 1997: Pensions adjusted each year based on changes in the CPI-U. The adjustment is based on the amount of benefits payable at the time of adjustment. The maximum annual increase shall be 3% of the benefits payable at the time of adjustment.
Pension adjustments begin immediately for participants whose benefits become payable on or after July 1, 1986 and are based upon 30 or more years of service.
On or after November 1, 1997: Pensions adjusted each year at a fixed rate of 3%. The adjustment is based on the amount of benefits payable at the time of adjustment.
Pension adjustment for participants who retire or terminate with a vested benefit after March 1, 1982 begin at age 48. Pension adjustments begin immediately for participants who become disabled and cannot perform any substantial gainful activity (current and future) and qualify for general on-duty disability benefits. Participants whose benefits become payable on or after July 1, 1986 and are based upon 30 or more years of service are also eligible for pension adjustments to begin immediately.
Contribution Rates
Members 9% of salary. Refund of contributions without interest in the event of termination before 10 years of service.
City Beginning in 1983, the rate required to fund the Retirement Fund on an actuarial reserve basis. However, a minimum contribution of twice the employee contribution rate is required by statute.
Changes in Plan Provisions Since the Prior Year
Plan provisions reflected in the July 1, 2015 valuation are the same as those in the prior valuation.

Buck Consultants Page 28 HFRRF 2015 Actuarial Valuation P:\share\Clients\HOU\VAL\HFRRF Actuarial Valuation Rpt_2015 2.docx
Actuarial Certification We certify that the information contained in this Actuarial Report has been prepared in accordance with generally accepted actuarial principles and practices. To the best of our knowledge, the information fairly presents the actuarial position of the Houston Firefighters’ Relief & Retirement Fund as of July 1, 2015. The Board of Trustees of the Fund can use this report for determining the Actuarial City Contribution Rate. Use of this report for any other purpose or by anyone other than the Board may not be appropriate and may result in mistaken conclusions because of failure to understand applicable assumptions, methods, or inapplicability of the report for that purpose. Because of the risk of misinterpretation of actuarial results, Buck recommends requesting it to perform an advance review of any statement, document, or filing based on information contained in this report. Buck will accept no liability for any such statement, document or filing made without prior review by Buck. Future actuarial measurements may differ significantly from current measurements due to plan experience differing from that anticipated by the economic and demographic assumptions, increases or decreases expected as part of the natural operation of the methodology used for these measurements, and changes in plan provisions or applicable law. An analysis of the potential range of such future differences is beyond the scope of this valuation. Where presented, references to “funded ratio” and “unfunded accrued liability” typically are measured on an actuarial value of assets basis. It should be noted that the same measurements using market value of assets would result in different funded ratios and unfunded accrued liabilities. Moreover, the funded ratio presented is appropriate for evaluating the need and level of future contributions but makes no assessment regarding the funded status of the plan if the plan were to settle (i.e. purchase annuities) for a portion or all of its liabilities. In preparing the actuarial results, we have relied upon information provided by the Board of Trustees regarding plan provisions, plan participants, plan assets, contribution rates and other matters used in the actuarial valuation. Although we did not audit the data, we reviewed the data for reasonableness and consistency with the prior year’s information. The results of the valuation are dependent on the accuracy of the data. The prior actuaries prepared historical information for 2004 and prior fiscal years. We did not verify or provide an actuarial review of this historical information. The Board of Trustees selected the actuarial methods and assumptions used in this valuation on the basis of an experience study covering the five-year period ending June 30, 2013. The Board has sole authority to determine the expected investment return and other actuarial assumptions. In our opinion, the actuarial assumptions used are appropriate for purposes of the valuation and are reasonably related to the experience of the Fund and to reasonable long-term expectations. The mortality improvement assumption was updated in accordance with Actuarial Standard of Practice No. 35. The plan provisions are the same as those used in the previous valuation.

Buck Consultants Page 29 HFRRF 2015 Actuarial Valuation P:\share\Clients\HOU\VAL\HFRRF Actuarial Valuation Rpt_2015 2.docx
This report was prepared under the supervision of David Driscoll and David Kent. They are Fellows of the Society of Actuaries and Members of the American Academy of Actuaries. They meet the Academy’s Qualification Standards to issue this Statement of Actuarial Opinion. This report has been prepared in accordance with all applicable Actuarial Standards of Practice and they are available to answer questions about it. Buck Consultants, LLC David L. Driscoll, FSA, EA, MAAA, FCA David Kent, FSA, EA, MAAA