houston 2q15
TRANSCRIPT
“Houston has rapidly shifted in tenant's favor as availability expands and leasing dries up.”
Tim Wingfield,Savills Studley Research
Savills Studley Report Houston office sector Q2 2015
Savills Studley Research Houston
SUMMARYMarket Highlights
OVERALL RENTS STAGNANT
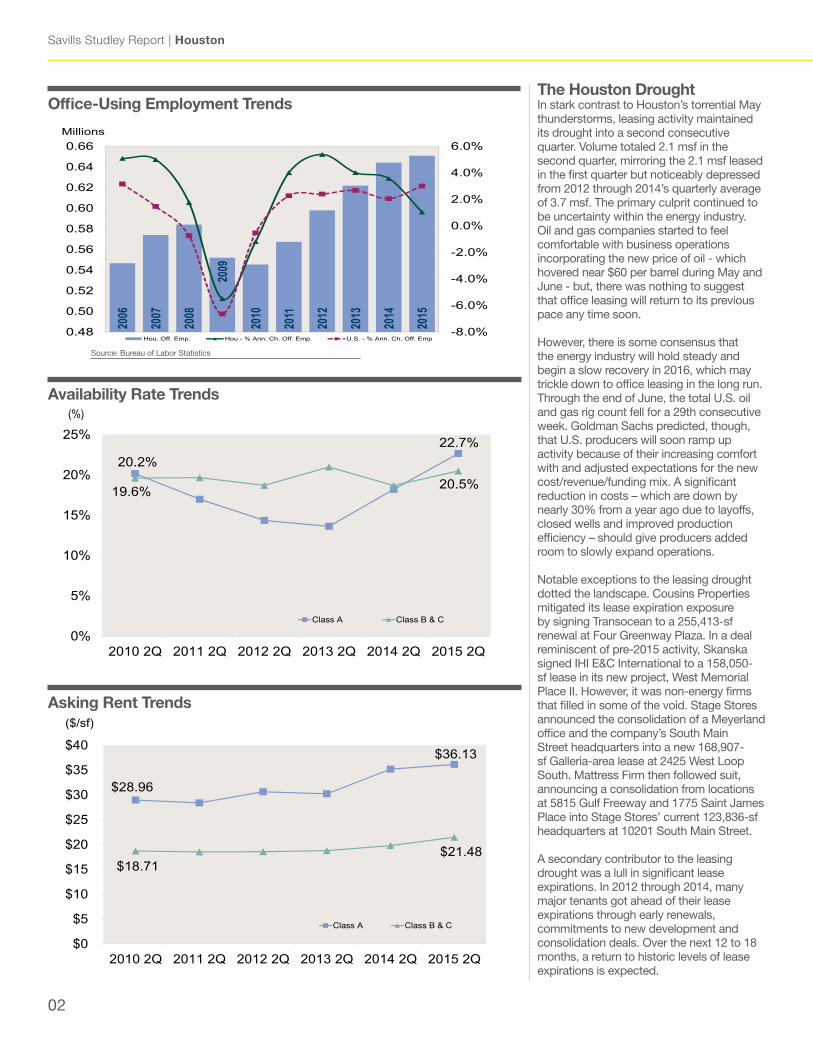
Overall asking rent, $29.79, rose by 0.5% for the quarter and by 7.3% for the year. Class A asking rent, $36.13, posted a slight quarterly decline of 0.3% but increased annually by 2.7%.
QUARTERLY LEASING REMAINS DOWN
Overall leasing totaled 2.1 msf, up by 0.6% for the quarter but down by 35.6% for the year. On a trailing four-quarter basis, volume attained 11.5 msf, dropping by 9.2% from the prior quarter and by 21.6% from the second quarter of 2014.
AVAILABILTY RATES INCREASE
The region’s overall availability rate (21.7%) grew by 1.1 pp from last quarter and by 3.3 pp from last year. The Class A rate (22.7%) jumped by 1.4 pp quarter-on-quarter and by 4.5 pp year-on-year.
02
Savills Studley Report | Houston
The Houston DroughtIn stark contrast to Houston’s torrential May thunderstorms, leasing activity maintained its drought into a second consecutive quarter. Volume totaled 2.1 msf in the second quarter, mirroring the 2.1 msf leased in the first quarter but noticeably depressed from 2012 through 2014’s quarterly average of 3.7 msf. The primary culprit continued to be uncertainty within the energy industry. Oil and gas companies started to feel comfortable with business operations incorporating the new price of oil - which hovered near $60 per barrel during May and June - but, there was nothing to suggest that office leasing will return to its previous pace any time soon.
However, there is some consensus that the energy industry will hold steady and begin a slow recovery in 2016, which may trickle down to office leasing in the long run. Through the end of June, the total U.S. oil and gas rig count fell for a 29th consecutive week. Goldman Sachs predicted, though, that U.S. producers will soon ramp up activity because of their increasing comfort with and adjusted expectations for the new cost/revenue/funding mix. A significant reduction in costs – which are down by nearly 30% from a year ago due to layoffs, closed wells and improved production efficiency – should give producers added room to slowly expand operations.
Notable exceptions to the leasing drought dotted the landscape. Cousins Properties mitigated its lease expiration exposure by signing Transocean to a 255,413-sf renewal at Four Greenway Plaza. In a deal reminiscent of pre-2015 activity, Skanska signed IHI E&C International to a 158,050-sf lease in its new project, West Memorial Place II. However, it was non-energy firms that filled in some of the void. Stage Stores announced the consolidation of a Meyerland office and the company’s South Main Street headquarters into a new 168,907-sf Galleria-area lease at 2425 West Loop South. Mattress Firm then followed suit, announcing a consolidation from locations at 5815 Gulf Freeway and 1775 Saint James Place into Stage Stores’ current 123,836-sf headquarters at 10201 South Main Street.
A secondary contributor to the leasing drought was a lull in significant lease expirations. In 2012 through 2014, many major tenants got ahead of their lease expirations through early renewals, commitments to new development and consolidation deals. Over the next 12 to 18 months, a return to historic levels of lease expirations is expected.
Source: Bureau of Labor Statistics
2006
2007
2008
2009
2010
2011
2012
2013
2014
2015
-8.0%
-6.0%
-4.0%
-2.0%
0.0%
2.0%
4.0%
6.0%
0.48
0.50
0.52
0.54
0.56
0.58
0.60
0.62
0.64
0.66Millions
Hou. Off. Emp. Hou - % Ann. Ch. Off. Emp. U.S. - % Ann. Ch. Off. Emp
Office-Using Employment Trends
$36.13
$28.96
$21.48$18.71
$0
$5
$10
$15
$20
$25
$30
$35
$40
2015 2Q 2014 2Q 2013 2Q 2012 2Q2011 2Q 2010 2Q
($/sf) Rental Rate Trends
Class A Class B & C
Asking Rent Trends
22.7%20.2%
20.5%19.6%
0%
5%
10%
15%
20%
25%
2015 2Q 2014 2Q 2013 2Q 2012 2Q2011 2Q2010 2Q
(%) Availability Rate Trends
Class A Class B & C
Availability Rate Trends
savills-studley.com/research 03
Q2 2015
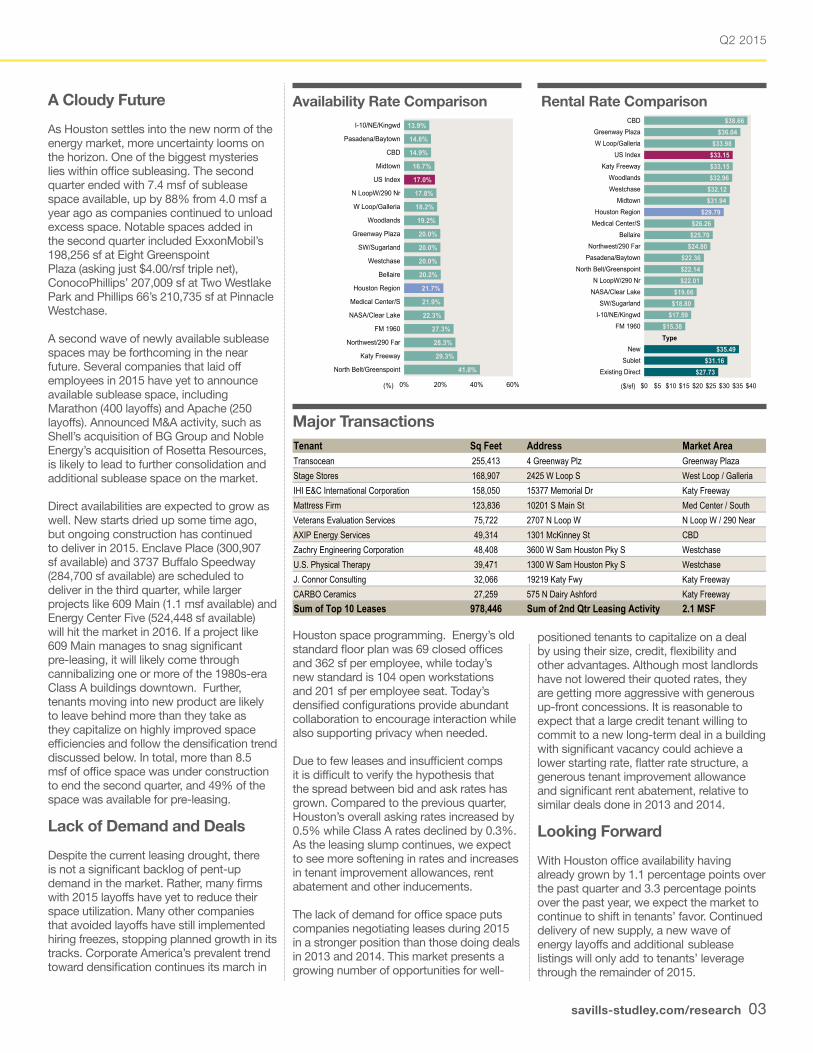
Tenant Sq Feet Address Market AreaTransocean 255,413 4 Greenway Plz Greenway PlazaStage Stores 168,907 2425 W Loop S West Loop / GalleriaIHI E&C International Corporation 158,050 15377 Memorial Dr Katy FreewayMattress Firm 123,836 10201 S Main St Med Center / SouthVeterans Evaluation Services 75,722 2707 N Loop W N Loop W / 290 NearAXIP Energy Services 49,314 1301 McKinney St CBDZachry Engineering Corporation 48,408 3600 W Sam Houston Pky S WestchaseU.S. Physical Therapy 39,471 1300 W Sam Houston Pky S WestchaseJ. Connor Consulting 32,066 19219 Katy Fwy Katy FreewayCARBO Ceramics 27,259 575 N Dairy Ashford Katy FreewaySum of Top 10 Leases 978,446 Sum of 2nd Qtr Leasing Activity 2.1 MSF
A Cloudy Future
As Houston settles into the new norm of the energy market, more uncertainty looms on the horizon. One of the biggest mysteries lies within office subleasing. The second quarter ended with 7.4 msf of sublease space available, up by 88% from 4.0 msf a year ago as companies continued to unload excess space. Notable spaces added in the second quarter included ExxonMobil’s 198,256 sf at Eight Greenspoint Plaza (asking just $4.00/rsf triple net), ConocoPhillips’ 207,009 sf at Two Westlake Park and Phillips 66’s 210,735 sf at Pinnacle Westchase.
A second wave of newly available sublease spaces may be forthcoming in the near future. Several companies that laid off employees in 2015 have yet to announce available sublease space, including Marathon (400 layoffs) and Apache (250 layoffs). Announced M&A activity, such as Shell’s acquisition of BG Group and Noble Energy’s acquisition of Rosetta Resources, is likely to lead to further consolidation and additional sublease space on the market.
Direct availabilities are expected to grow as well. New starts dried up some time ago, but ongoing construction has continued to deliver in 2015. Enclave Place (300,907 sf available) and 3737 Buffalo Speedway (284,700 sf available) are scheduled to deliver in the third quarter, while larger projects like 609 Main (1.1 msf available) and Energy Center Five (524,448 sf available) will hit the market in 2016. If a project like 609 Main manages to snag significant pre-leasing, it will likely come through cannibalizing one or more of the 1980s-era Class A buildings downtown. Further, tenants moving into new product are likely to leave behind more than they take as they capitalize on highly improved space efficiencies and follow the densification trend discussed below. In total, more than 8.5 msf of office space was under construction to end the second quarter, and 49% of the space was available for pre-leasing.
Lack of Demand and Deals
Despite the current leasing drought, there is not a significant backlog of pent-up demand in the market. Rather, many firms with 2015 layoffs have yet to reduce their space utilization. Many other companies that avoided layoffs have still implemented hiring freezes, stopping planned growth in its tracks. Corporate America’s prevalent trend toward densification continues its march in
Houston space programming. Energy’s old standard floor plan was 69 closed offices and 362 sf per employee, while today’s new standard is 104 open workstations and 201 sf per employee seat. Today’s densified configurations provide abundant collaboration to encourage interaction while also supporting privacy when needed.
Due to few leases and insufficient comps it is difficult to verify the hypothesis that the spread between bid and ask rates has grown. Compared to the previous quarter, Houston’s overall asking rates increased by 0.5% while Class A rates declined by 0.3%. As the leasing slump continues, we expect to see more softening in rates and increases in tenant improvement allowances, rent abatement and other inducements.
The lack of demand for office space puts companies negotiating leases during 2015 in a stronger position than those doing deals in 2013 and 2014. This market presents a growing number of opportunities for well-
positioned tenants to capitalize on a deal by using their size, credit, flexibility and other advantages. Although most landlords have not lowered their quoted rates, they are getting more aggressive with generous up-front concessions. It is reasonable to expect that a large credit tenant willing to commit to a new long-term deal in a building with significant vacancy could achieve a lower starting rate, flatter rate structure, a generous tenant improvement allowance and significant rent abatement, relative to similar deals done in 2013 and 2014.
Looking Forward
With Houston office availability having already grown by 1.1 percentage points over the past quarter and 3.3 percentage points over the past year, we expect the market to continue to shift in tenants’ favor. Continued delivery of new supply, a new wave of energy layoffs and additional sublease listings will only add to tenants’ leverage through the remainder of 2015.
Availability Rate Comparison Rental Rate Comparison
Major Transactions
$38.66$36.04
$33.98$33.15$33.15$32.96
$32.12$31.94
$29.79$26.26$25.70
$24.80$22.36$22.14$22.01
$19.66$18.80
$17.59$15.38
$35.49$31.16
$27.73
$0 $5 $10 $15 $20 $25 $30 $35 $40
CBDGreenway PlazaW Loop/Galleria
US IndexKaty Freeway
WoodlandsWestchase
MidtownHouston Region
Medical Center/SBellaire
Northwest/290 FarPasadena/Baytown
North Belt/GreenspointN LoopW/290 Nr
NASA/Clear LakeSW/Sugarland
I-10/NE/KingwdFM 1960
NewSublet
Existing Direct
($/sf)
Type
13.9%
14.8%
14.9%
16.7%
17.0%
17.8%
18.2%
19.2%
20.0%
20.0%
20.0%
20.2%
21.7%
21.9%
22.3%
27.3%
28.3%
29.3%
41.8%
0% 20% 40% 60%
I-10/NE/Kingwd
Pasadena/Baytown
CBD
Midtown
US Index
N LoopW/290 Nr
W Loop/Galleria
Woodlands
Greenway Plaza
SW/Sugarland
Westchase
Bellaire
Houston Region
Medical Center/S
NASA/Clear Lake
FM 1960
Northwest/290 Far
Katy Freeway
North Belt/Greenspoint
(%)
Savills Studley Report | Houston
04 @SavillsStudleywww.savills-studley.com
Please contact us for further information
(1) Percentage point change for availability rates. Unless otherwise noted, all rents quoted throughout this report are average asking gross (full service) rents psf. Statistics are calculated using both direct and sublease information. Short-term sublet spaces (terms under two years) were excluded.
The information in this report is obtained from sources deemed reliable, but no representation is made as to the accuracy thereof. Statistics compiled with the support of The CoStar Group. Copyright © 2015 Savills Studley
Savills Studley333 Clay Street, Suite 3700 Houston, TX 77002(713) 522-5300
Co-Branch ManagersMark W. O'Donnell - EVP, [email protected]. Derrell Curry - EVP, [email protected]. Mark Russell - EVP, [email protected] R. Biegel - EVP, [email protected]
290
288
95
95
17
17
710
6
53
14
13
12
2
15
4
1
8
9
16
11
8
Map Submarket Total
SF(1000's)
Last 12 Months
ThisQuarter
%Change
fromLast Qtr.
YearAgo
ThisQuarter
ppChange
fromLast Qtr. (1)
YearAgo
ThisQuarter
%Change
fromLast Qtr.
YearAgo
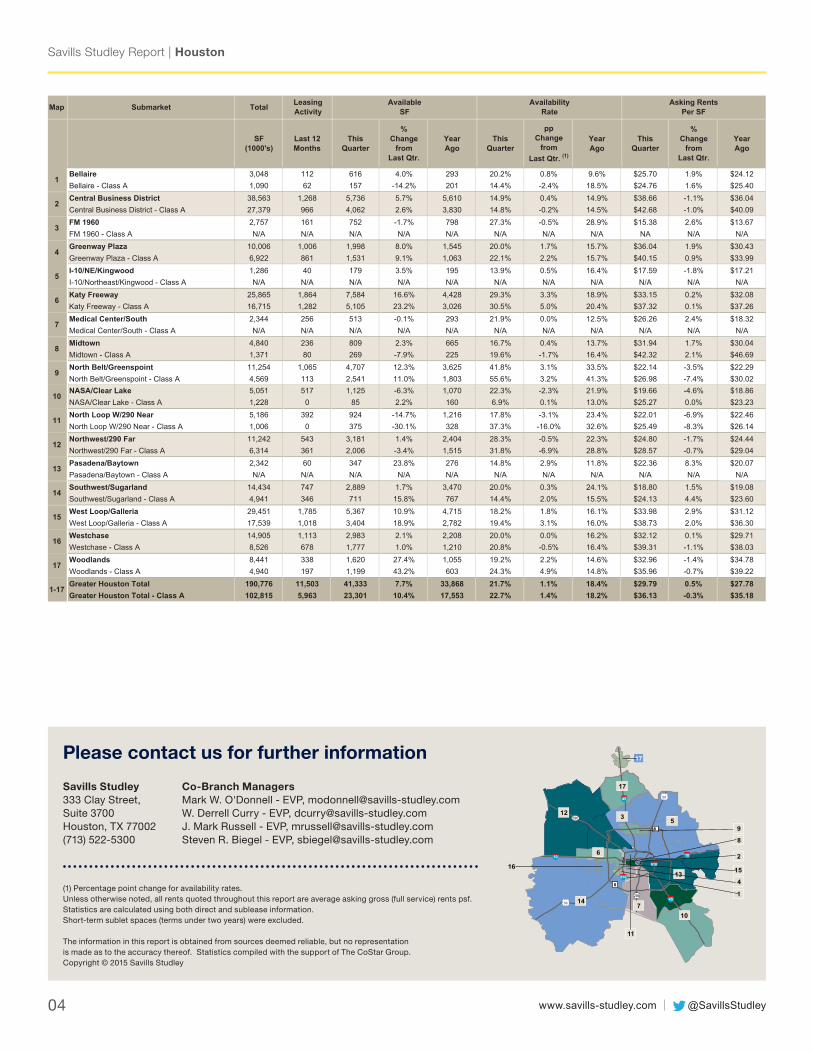
Bellaire 3,048 112 616 4.0% 293 20.2% 0.8% 9.6% $25.70 1.9% $24.12Bellaire - Class A 1,090 62 157 -14.2% 201 14.4% -2.4% 18.5% $24.76 1.6% $25.40Central Business District 38,563 1,268 5,736 5.7% 5,610 14.9% 0.4% 14.9% $38.66 -1.1% $36.04Central Business District - Class A 27,379 966 4,062 2.6% 3,830 14.8% -0.2% 14.5% $42.68 -1.0% $40.09FM 1960 2,757 161 752 -1.7% 798 27.3% -0.5% 28.9% $15.38 2.6% $13.67FM 1960 - Class A N/A N/A N/A N/A N/A N/A N/A N/A NA N/A N/AGreenway Plaza 10,006 1,006 1,998 8.0% 1,545 20.0% 1.7% 15.7% $36.04 1.9% $30.43Greenway Plaza - Class A 6,922 861 1,531 9.1% 1,063 22.1% 2.2% 15.7% $40.15 0.9% $33.99I-10/NE/Kingwood 1,286 40 179 3.5% 195 13.9% 0.5% 16.4% $17.59 -1.8% $17.21I-10/Northeast/Kingwood - Class A N/A N/A N/A N/A N/A N/A N/A N/A N/A N/A N/AKaty Freeway 25,865 1,864 7,584 16.6% 4,428 29.3% 3.3% 18.9% $33.15 0.2% $32.08Katy Freeway - Class A 16,715 1,282 5,105 23.2% 3,026 30.5% 5.0% 20.4% $37.32 0.1% $37.26Medical Center/South 2,344 256 513 -0.1% 293 21.9% 0.0% 12.5% $26.26 2.4% $18.32Medical Center/South - Class A N/A N/A N/A N/A N/A N/A N/A N/A N/A N/A N/AMidtown 4,840 236 809 2.3% 665 16.7% 0.4% 13.7% $31.94 1.7% $30.04Midtown - Class A 1,371 80 269 -7.9% 225 19.6% -1.7% 16.4% $42.32 2.1% $46.69North Belt/Greenspoint 11,254 1,065 4,707 12.3% 3,625 41.8% 3.1% 33.5% $22.14 -3.5% $22.29North Belt/Greenspoint - Class A 4,569 113 2,541 11.0% 1,803 55.6% 3.2% 41.3% $26.98 -7.4% $30.02NASA/Clear Lake 5,051 517 1,125 -6.3% 1,070 22.3% -2.3% 21.9% $19.66 -4.6% $18.86NASA/Clear Lake - Class A 1,228 0 85 2.2% 160 6.9% 0.1% 13.0% $25.27 0.0% $23.23North Loop W/290 Near 5,186 392 924 -14.7% 1,216 17.8% -3.1% 23.4% $22.01 -6.9% $22.46North Loop W/290 Near - Class A 1,006 0 375 -30.1% 328 37.3% -16.0% 32.6% $25.49 -8.3% $26.14Northwest/290 Far 11,242 543 3,181 1.4% 2,404 28.3% -0.5% 22.3% $24.80 -1.7% $24.44Northwest/290 Far - Class A 6,314 361 2,006 -3.4% 1,515 31.8% -6.9% 28.8% $28.57 -0.7% $29.04Pasadena/Baytown 2,342 60 347 23.8% 276 14.8% 2.9% 11.8% $22.36 8.3% $20.07Pasadena/Baytown - Class A N/A N/A N/A N/A N/A N/A N/A N/A N/A N/A N/A
$21 26Southwest/Sugarland 14,434 747 2,889 1.7% 3,470 20.0% 0.3% 24.1% $18.80 1.5% $19.08Southwest/Sugarland - Class A 4,941 346 711 15.8% 767 14.4% 2.0% 15.5% $24.13 4.4% $23.60West Loop/Galleria 29,451 1,785 5,367 10.9% 4,715 18.2% 1.8% 16.1% $33.98 2.9% $31.12West Loop/Galleria - Class A 17,539 1,018 3,404 18.9% 2,782 19.4% 3.1% 16.0% $38.73 2.0% $36.30Westchase 14,905 1,113 2,983 2.1% 2,208 20.0% 0.0% 16.2% $32.12 0.1% $29.71Westchase - Class A 8,526 678 1,777 1.0% 1,210 20.8% -0.5% 16.4% $39.31 -1.1% $38.03Woodlands 8,441 338 1,620 27.4% 1,055 19.2% 2.2% 14.6% $32.96 -1.4% $34.78Woodlands - Class A 4,940 197 1,199 43.2% 603 24.3% 4.9% 14.8% $35.96 -0.7% $39.22Greater Houston Total 190,776 11,503 41,333 7.7% 33,868 21.7% 1.1% 18.4% $29.79 0.5% $27.78Greater Houston Total - Class A 102,815 5,963 23,301 10.4% 17,553 22.7% 1.4% 18.2% $36.13 -0.3% $35.18
1
LeasingActivity
AvailableSF
AvailabilityRate
Asking Rents Per SF
2
9
10
3
4
7
8
5
6
16
1-17
11
12
13
14
17
15