housing review 2013 - habitat for humanity · housing review 2013 europe, ... deteriorating and is...
TRANSCRIPT

Housing review 2013on 23 countries in the Europe and Central Asia region Europe, Middle East and Africa

Housing review on 23 countries in the Europe and Central Asia region 5 Central and Eastern Europe countries: Czech Republic, Hungary, Poland, Slovakia, Slovenia
7 Southeastern Europe countries: Albania, Bosnia and Herzegovina, Bulgaria, Croatia, Macedonia, Romania, Serbia
9 Commonwealth of Independent States countries: Armenia, Azerbaijan, Kazakhstan, Kyrgyzstan, Moldova, Russia, Tajikistan, Ukraine, Uzbekistan
Other Europe and Central Asia countries: Georgia, Turkey
August 2013
Dr. Wolfgang AmannIIBW – Institute for Real Estate, Construction and Housing Ltd.Institut für Immobilien, Bauen und Wohnen GmbH Postfach 2, A 1020 Vienna, AustriaFN 193068 z Handelsgericht WienTel. +43-1-968-6008Email [email protected]
Prepared for:
Europe, Middle East and Africa
3


Europe is often thought of as having more developed housing than many other parts of the world. Recently, however, with the ongoing economic crisis, international attention has focused on several types of housing poverty that have spread throughout Europe and Central Asia.
What are the most common housing problems in this region? First of all, the rising prices of housing and utilities; housing-related expenditures make up the biggest component of consumer spending in the European Union. According to Eurostat, housing accounted for 23 percent of total expenditures in 2011. For 12 percent of the population, housing accounts for 40 percent of expenditures. In Central and Eastern Europe, previous construction and heating methods did not focus on energy efficiency. As a result, families now pay more for energy, and many live in energy poverty. Every 10th person in the EU lives in a household that was unable to pay utility bills in 2010, according to the EU Statistics on Income and Living Conditions.
Second, the affordability of housing itself is a rising problem. The share of social rental housing in the EU is on average 11 percent. In the new members of the EU and in the countries of the former Soviet Union, the share of social housing dropped to 3 to 5 percent after the transition to a free market economy in the 1990s. The constant reduction of public housing has resulted in long waiting lists, keeping a large number of people in inadequate housing conditions.
At the same time, mass privatization of housing in Eastern Europe has created a whole class of “poor owners” who are hardly in a position to take over responsibility for their property. These poor owners are mainly responsible for the ineffectiveness of condominium management, as they are not able to contribute to the maintenance and repair of the buildings.
This housing study focuses on Europe and Central Asia — that is, roughly, the transitional economies of Central and Eastern Europe, Southeastern Europe and the Commonwealth of Independent States nations. Our purpose is to analyse the housing situation across the region and identify the scale of existing problems.
Within the current review, we have put much more emphasis on systemic housing issues rather than a detailed analysis of poverty housing conditions and causes. However, this does not mean that we close our eyes to the problems faced by vulnerable groups in Europe and Central Asia, such as Roma, elderly people, young and single-headed families and people with disabilities. This work only reviews the housing sector and major problems faced in the region.
In the poorer areas of Europe and Central Asia, a legacy of chronic underinvestment in housing has resulted in a severely inadequate housing stock. At the heart of the huge social problems facing the region lies a ticking time bomb of inadequate shelter.
Only by analysing the situation and talking about the need for decent and affordable homes out loud can we start making progress to rid the region of poverty housing.
Greg FosterArea Vice PresidentEurope, Middle East and AfricaHabitat for Humanity International
FOREWORD
5
3
Core team
Author: Dr. Wolfgang Amann, Institute for Real Estate, Construction and Housing, Vienna, Austria Coordinator: Katerina Bezgachina, Habitat for Humanity, Europe, Middle East and AfricaEditor: Adam Smith, Habitat for Humanity InternationalDesign and layout: Barbora Fricova, Habitat for Humanity, Europe, Middle East and Africa
Contributors
Significant contributions in the collection of data and necessary background information:Behruz Daboboev, program development manager, Habitat for Humanity TajikistanBranislava Zakrovic, director, Housing Center in SerbiaDenitsa Ilieva, communications coordinator, Habitat for Humanity BulgariaDr. Dorina Pojani, assistant professor, Epoka University, Tirana, AlbaniaElena Evteeva, former advocacy officer, Habitat for Humanity Europe, Middle East and AfricaGabriela Grigori, director for resource development and communications, Habitat for Humanity RomaniaGalina Strachkova, former PR and advocacy specialist, Habitat for Humanity MacedoniaLea Kőszeghy, advocacy officer, Habitat for Humanity HungaryMagda Ruszkowska-Cieslak, former advocacy manager, Habitat for Humanity PolandMincho Benov, national director, Habitat for Humanity BulgariaNargiza Kydykova, resource development manager, Habitat for Humanity KyrgyzstanNargiz Rahmonova, Ph.D. researcher, Comenius University, Bratislava, Slovakia Samira Sharifkhodjaeva, national director, Habitat for Humanity Tajikistan Staff from LOK Microfinance, Bosnia and HerzegovinaStaff from Hope UkraineSiranush Vardanyan, former program development manager, Habitat for Humanity Armenia
Additional contributiuons in the analysis and review of data and collected information:
Ellen Hamilton, lead urban specialist, Urban Development and Resilience Unit, The World BankGyorgy Sumeghy, advocacy manager, Habitat for Humanity Europe, Middle East and AfricaLucija Popovska, director of programs, Habitat for Humanity Europe, Middle East and AfricaSandra Callison, associate director, Habitat for Humanity International, Center for Innovation in Shelter and Finance
ACKNOWLEDGMENTS
6
A. OVERVIEW AND KEY FINDINGS ................................................................................................9
B. BACKGROUND INFORMATION ................................................................................................12B.1 Demographic background ................................................................................................12B.2 Economic background ................................................................................................14
C. HOUSING STOCK AND HOUSING PROVISION ................................................................................................21 C.1 Housing stock ................................................................................................21C.2 Housing tenure ................................................................................................26C.3 Housing costs ................................................................................................30C.4 Housing maintenance and services ................................................................................................32 C.5 Housing legislation ................................................................................................35C.6 Housing vulnerability ................................................................................................38C.7 Environmental and planning issues ................................................................................................42 C.8 Institutional setting ................................................................................................42
D. HOUSING CONSTRUCTION, MARKETS, HOUSING FINANCE ................................................................................................45D.1 Housing construction ................................................................................................45D.2 Social housing construction ................................................................................................49D.3 Housing markets ................................................................................................50D.4 Housing finance ................................................................................................51
E. HOUSING POLICY ................................................................................................55E.1 United Nations strategic documents ................................................................................................55 E.2 Impact of EU housing policy ................................................................................................55E.3 Housing policy targets ................................................................................................56
F. ANNEX ................................................................................................66F.1 HFH/IIBW Housing Survey ECA Region 2012 ................................................................................................66F.2 References ................................................................................................67F.3 List of figures ................................................................................................71
CONTENTS
7
5
CEE Central and Eastern EuropeCIS Commonwealth of Independent States (former Soviet Union)CPI Consumer Price IndexECA Europe and Central AsiaEU 27 European Union (in the extent of 2011 with 27 member states)EU SILC Statistics on Income and Living ConditionsGDP Gross domestic productIDPs Internally displaced personsLTV Loan-to-value ratioOECD Organization for Economic Co-operation and DevelopmentPPS Purchase power standardSEE Southeastern Europe
For country abbreviations, the endings of Internet country domains are used:
AL AlbaniaAM ArmeniaAZ AzerbaijanBA Bosnia-Herzegovina BG BulgariaCZ Czech RepublicGE GeorgiaHR CroatiaHU HungaryKG KyrgyzstanKZ KazakhstanMD MoldovaMK MacedoniaPL PolandRO RomaniaRS SerbiaRU RussiaSI SloveniaSK Slovak RepublicTJ TajikistanTR Turkey
ABBREVIATIONS
8

The purpose of this report is to review and analyse the current housing situation in the countries of Central and Eastern Europe and Central Asia and to identify some of the underlying problems the region faces.
It is a daunting task to pull together the enormous amount of data on the region and provide a detailed evaluation of the diverse housing policies. At the same time, such studies and reference books are often valued by decision-makers and housing practitioners, who need to consult authoritative sources before they take key steps to shape national policies and approve important laws. Such comprehensive studies are rare.
The main purpose of this volume is to collect housing information in one place and try to analyse it. The aim is not only to understand the current state of housing but also to identify certain development trends. The first compilation of housing information on the countries in Europe and Central Asia was done by Habitat for Humanity in 2005. At that time, 12 countries were reviewed. This review expands on that first volume with recent data and a longer list of reviewed countries. Some of the general findings:
Affordability of housing in Central and Eastern Europe countries had decreased sharply by the mid-1990s. This trend has not stopped since then. - - -In most Central and Eastern Europe and Central Asia countries, the public rental sector has decreased to well below 10 percent of the current housing stock,
from previous levels of up to and more than 50 percent. - - -The majority of housing stock in Central and Eastern Europe and Commonwealth of Independent States countries was built from low-quality, prefabricated materials and has been seriously damaged by inadequate maintenance and underinvestment over decades. A high percentage of this housing is rapidly deteriorating and is considered the region’s “housing time bomb.” - - -Housing provision in Europe and Central Asia varies considerably. Housing outcomes are more favourable in those countries that joined the European Union in 2004 — Czech Republic, Hungary, Poland, Slovenia and Slovak Republic — while Romania and Bulgaria face significantly worse conditions, alongside non-EU countries of the region. - - -After liberalization of energy markets in most countries, energy prices have in many cases reached Western levels, but household incomes remain far below those of the West. For this reason, the topic has turned up quite high on the political agenda lately. - - -Condominium legislation for the management and maintenance of multiapartment buildings was introduced in all ECA countries. The new owners ought to set up owners’ associations and organise management of their assets by themselves. However, in many CIS countries, the establishment of these associations is not obligatory, and in most other countries it is hardly effective. - - -
In contrast with condominium or mortgage legislation, which was introduced within most ECA countries, there is still almost no rent legislation in place. An informal rental market flourishes. - - -A majority of the 12 million Roma who live in Central and Eastern Europe and the CIS are chronically poor and live in informal or illegal substandard settlements with limited access to water, sanitation and sewerage. - - -
This study assembles comprehensive information on the housing situation in 23 countries of Europe and Central Asia.
OVERVIEW AND KEY FINDINGSA.
9
7
ContentsTo understand housing, an analysis of the demographic and economic situation in the region is required (See Chapter B, p. 12). Chapter C.1 (p. 23) documents the housing stock and housing provision in the region, with data and analysis on the volume of housing, tenure, housing maintenance and services, housing legislation, affordability, homelessness and housing vulnerability, ethnicity and gender issues, environmental issues, housing costs, and housing markets. Chapter C.8 (p. 44) is about different institutional provisions for social housing. Chapter D (p. 45) looks at housing finance and housing markets. Chapter E (p. 55) describes housing policies in the region, including the impact of EU housing policies, policy targets and priorities.
Instructions for useThis study is developed both for sequential and selective reading. Data are prepared for easy reading and comparative analysis. Plenty of cross-references allow for easy orientation. For clarity and readability, data sources are quoted within the running text in only a few cases. Generally, these sources are instead presented in full below tables and figures.
Geographical coverageTo handle the 23 countries documented in this report, it was decided to group them into regions, with five countries from Central and Eastern Europe, or CEE; seven countries from Southeastern Europe, or SEE; nine countries from the former Soviet Union, now assembled in the Commonwealth of Independent States, or CIS; and Georgia and Turkey, which fit in none of those groups. All analysis in this report follows this regional structure:
Central and Eastern Europe countries:
CZ Czech RepublicHU HungaryPL PolandSK Slovak RepublicSI Slovenia
Southeastern Europe countries:AL AlbaniaBA Bosnia-Herzegovina BG BulgariaHR CroatiaMK MacedoniaRO RomaniaRS Serbia
Commonwealth of Independent States countries:AM ArmeniaAZ AzerbaijanKZ KazakhstanKG KyrgyzstanMD MoldovaRU RussiaTJ TajikistanUA UkraineUZ Uzbekistan
Other Europe and Central Asia countries:GE GeorgiaTR Turkey
MethodsTo give a comprehensive insight into the housing situation of such a big number of countries, an extensive literature review was required. Most valuable contents were gathered through a housing survey conducted in all countries of the region, including a detailed questionnaire and a data sheet (IIBW/HFH survey). A main challenge
was providing housing-related data with the fewest possible gaps, allowing for consistent and comprehensive cross-country analysis. We succeeded in providing data mostly from 2011; there were only a few cases in which we had to refer to older sources.
Some contents have been taken directly from the previous version of this study, conducted by Jennifer Duncan in 2005 (HFH 2005).
Data sourcesHousing-related data for some countries are rather difficult to access. It was therefore necessary to employ a wide variety of sources. IIBW provided a comprehensive database on housing-related information for many ECA countries. Main data sources are national statistical offices; Eurostat; World Bank and UNICEF databases; U.N. Economic Commission for Europe country profiles; Vienna Institute for International Economic Studies, or WIIW; European Mortgage Federation Hypostat; Euroconstruct; BuildEcon; Housing Statistics in the EU; the Habitat for Humanity Global Housing Policy Indicator Survey; several IIBW surveys; and plenty of country-specific literature. Remaining gaps were closed with data provided by Habitat for Humanity country representatives.
Definitions of poverty housing The United Nations Human Rights Council defines the human right to adequate housing as “the right of every woman, man, youth and child to gain and sustain a safe and secure home and community in which to live in peace and dignity.”
10

This definition is in line with the core elements of the right to adequate housing as defined by General Comment No. 4 of the United Nations Committee on Economic, Social and Cultural Rights. They include legal security of tenure, availability of services, materials, facilities and infrastructure, affordability, habitability, accessibility, location, and cultural adequacy (www.ohchr.org).
The Council of Europe considers a “triple-A” approach in analysing housing conditions:
1. AdequacyThe minimum standard offered should be sufficiently high, and a high proportion of the population in need should be covered (quality and quantity should be considered together).
2. AccessibilityLegal regulations, determining who should be eligible for social support.
3. Affordability“The ability of individuals and households to purchase goods and services, and the cost of provision.” (Council of Europe 2002: 9, 11).
The European Union formulated a similar approach at the European Council of Nice in December 2000, with the goal of implementing policies that aim to provide access for all to decent and sanitary housing, along with the basic services necessary to live normally with regard to local circumstances (Diamantopoulou, 2003). But further attempts at a European Agenda for Social Housing (EU Committee of the Regions, 2011) or even some kind of EU Housing Charter following the model of the European Social Charter from 1996 have failed to date.
Also of note is the official list of slum indicators identified for the CEE and CIS countries by the U.N. as part of its “slum dweller” target for the Millennium Development Goals. The current indicators are inadequate access to safe water, inadequate access to sanitation, insecure tenure, poor structural quality of housing, and overcrowding (un.org).
Habitat for Humanity often uses the term “poverty housing” to describe inadequate housing, a term that expresses the link between poor shelter and other poverty indicators such as economic well-being, health and education (HFH 2005: 10). The current review only identifies some of the poverty housing trends and groups affected by poor shelter conditions. It does not attempt to provide a comprehensive analysis of poverty housing in the region and its causes.
11

9
B.1 DEMOGRAPHIC BACKGROUND
B.1.1 Demographic developmentThe 23 countries covered by this report have a population of 457 million people (2011, see Table 1, next page). This is only slightly below the population of the EU 27. Several of the ECA countries have suffered from decreasing population between 2001 and 2011, such as Bulgaria (down 7.9 percent), Ukraine (down 6.3 percent), Romania (down 4.5 percent), Serbia (down 3 percent), Russia (down 2.3 percent), Hungary (down 2.1 percent), Moldova (down 2.1 percent) and Croatia (down 0.6 percent). Together, the 23 ECA countries had a total increase of population of 1.8 percent, compared with a 3.9 percent increase for the EU 27. But this increase was driven by a few big countries, particularly Turkey (up 8.6 percent to 73.7 million inhabitants), Uzbekistan (up 14.7 percent to 28.5 million) and Kazakhstan (up 10.7 percent to 16.4 million). Southeastern Europe had quite a negative demographic development (down 3.2 percent) compared with the other regions.
Urbanisation in the ECA region is only 64 percent — significantly below the EU average of 73 percent. Again, regional differences are extensive. Few countries have urbanisation rates close to or above the EU average, such as Czech Republic, Russia, Bulgaria and Turkey. In some countries — Tajikistan, Kyrgyzstan, Uzbekistan, Moldova, Bosnia-Herzegovina and Slovenia — the rural population is still in the majority. Altogether, urbanisation is particularly low in Southeastern Europe. The negative demographic development seems to correlate with a backlog in the development of urban regions. In the CIS countries, the average
urbanisation is close to the entire ECA region (64 percent), but only because of the high rate of Russia and its dominating size.
Urbanisation increased in the EU 27 by 1.2 percentage points within the past decade, and similarly in the ECA region. It stagnated both in the CEE and CIS countries, but increased in SEE by 2.2 percent. The strongest increase in urbanisation was experienced in Albania (up 12 percentage points), Turkey (up 8), Macedonia and Hungary (each up 5). In Kazakhstan, Kyrgyzstan, Poland and Slovenia, urbanisation decreased.
The average share of the population between ages 15 and 24 — i.e., the age group particularly important for housing markets and housing construction — is 11.8 percent for the EU, but almost 15 percent in the ECA region, even though it is rapidly decreasing in most countries. A particularly young population is found in Azerbaijan (20 percent are age 15 to 24), Albania (19 percent), Moldova (18 percent), Turkey (17 percent), Macedonia and Georgia (15 percent each). Slovenia, Bulgaria, Czech Republic and Serbia have relatively small shares of young households, 12 percent or below.
The average household size in the European Union is 2.4 people. This is quite different in the ECA region, with 2.72 people in the average of all CEE countries, 3 people in the average of SEE countries and much higher in many CIS countries (except Russia) and Turkey.
B.1.2 MigrationMigration has different dimensions. Many ECA countries suffered from massive emigration during transition, as people were seeking income opportunities which they could not find in their home country. As the transition countries saw more economic development, emigration decreased and, in several CEE countries, reversed.
A second dimension is migration from rural to urban areas. Increasing urbanisation is a global trend, driven again by better income opportunities in cities and by improved urban technologies (infrastructure) to make large metropolitan areas livable. As mentioned (p. 10), within the previous decade, the average urbanisation has increased in the EU by 1.2 percentage points and by 2.2 percent in the SEE region, but was stagnant in both the CEE and CIS regions.
This allows for conclusions on rural-urban migration in the region. The different patterns seem to have the following main reasons:Increased urbanisation in the SEE countries correlates with negative demographic development. It seems that it was mainly the rural population that migrated abroad. Additionally, the region started from quite a low level of urbanisation. - - -In many ECA countries, migration to the cities was hampered by the consequences of economic restructuring in the course of transition. As alternative jobs (e.g., in the service sector) developed at only a slow pace, cities offered income opportunities on a much smaller scale than in other parts of the world.
BACKGROUND INFORMATION
12
B.
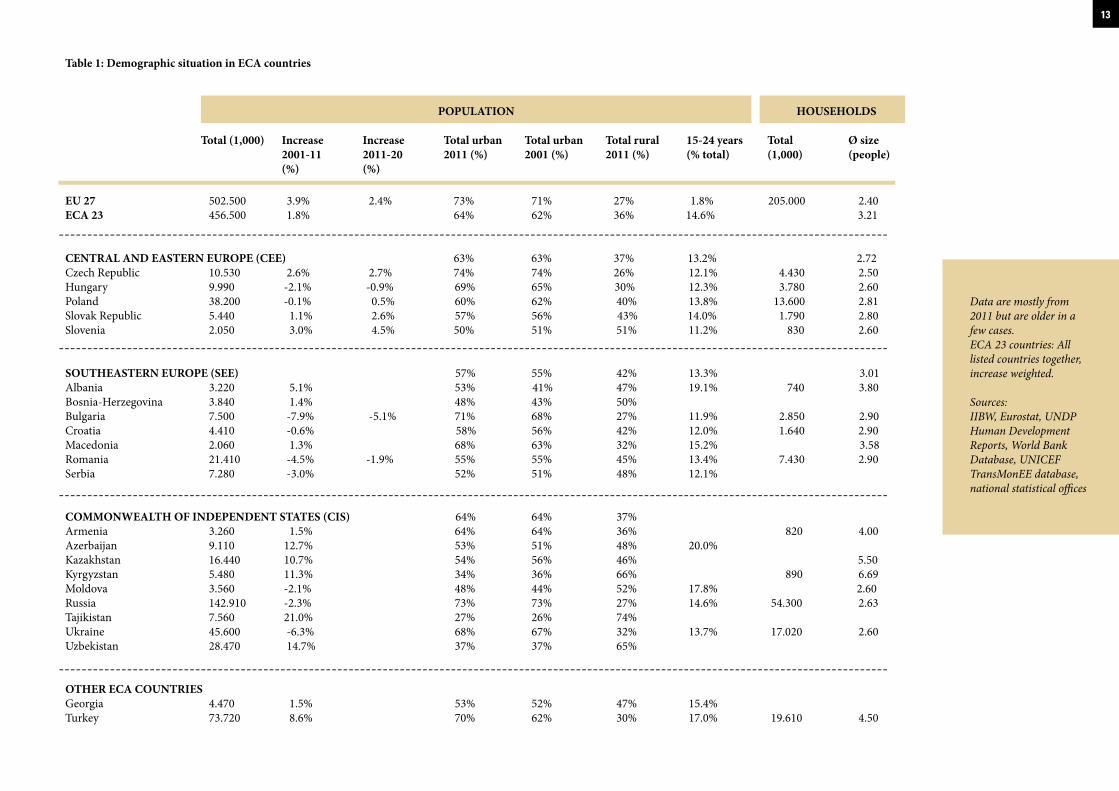
Table 1: Demographic situation in ECA countries
POPULATION HOUSEHOLDS
EU 27 502.500 3.9% 2.4% 73% 71% 27% 1.8% 205.000 2.40ECA 23 456.500 1.8% 64% 62% 36% 14.6% 3.21
CENTRAL AND EASTERN EUROPE (CEE) 63% 63% 37% 13.2% 2.72Czech Republic 10.530 2.6% 2.7% 74% 74% 26% 12.1% 4.430 2.50Hungary 9.990 -2.1% -0.9% 69% 65% 30% 12.3% 3.780 2.60Poland 38.200 -0.1% 0.5% 60% 62% 40% 13.8% 13.600 2.81Slovak Republic 5.440 1.1% 2.6% 57% 56% 43% 14.0% 1.790 2.80Slovenia 2.050 3.0% 4.5% 50% 51% 51% 11.2% 830 2.60
SOUTHEASTERN EUROPE (SEE) 57% 55% 42% 13.3% 3.01Albania 3.220 5.1% 53% 41% 47% 19.1% 740 3.80Bosnia-Herzegovina 3.840 1.4% 48% 43% 50% Bulgaria 7.500 -7.9% -5.1% 71% 68% 27% 11.9% 2.850 2.90Croatia 4.410 -0.6% 58% 56% 42% 12.0% 1.640 2.90Macedonia 2.060 1.3% 68% 63% 32% 15.2% 3.58Romania 21.410 -4.5% -1.9% 55% 55% 45% 13.4% 7.430 2.90Serbia 7.280 -3.0% 52% 51% 48% 12.1%
COMMONWEALTH OF INDEPENDENT STATES (CIS) 64% 64% 37% Armenia 3.260 1.5% 64% 64% 36% 820 4.00Azerbaijan 9.110 12.7% 53% 51% 48% 20.0% Kazakhstan 16.440 10.7% 54% 56% 46% 5.50Kyrgyzstan 5.480 11.3% 34% 36% 66% 890 6.69Moldova 3.560 -2.1% 48% 44% 52% 17.8% 2.60Russia 142.910 -2.3% 73% 73% 27% 14.6% 54.300 2.63Tajikistan 7.560 21.0% 27% 26% 74% Ukraine 45.600 -6.3% 68% 67% 32% 13.7% 17.020 2.60Uzbekistan 28.470 14.7% 37% 37% 65%
OTHER ECA COUNTRIESGeorgia 4.470 1.5% 53% 52% 47% 15.4% Turkey 73.720 8.6% 70% 62% 30% 17.0% 19.610 4.50
Total (1,000)
Increase 2001-11 (%)
Increase 2011-20 (%)
Total urban 2011 (%)
Total urban 2001 (%)
Total rural 2011 (%)
15-24 years (% total)
Total (1,000)
Ø size (people)
Data are mostly from 2011 but are older in a few cases.ECA 23 countries: All listed countries together, increase weighted.
Sources:IIBW, Eurostat, UNDP Human Development Reports, World Bank Database, UNICEF TransMonEE database, national statistical offices
--------------------------------------------------------------------------------------------------------------------------------------------------
--------------------------------------------------------------------------------------------------------------------------------------------------
--------------------------------------------------------------------------------------------------------------------------------------------------
--------------------------------------------------------------------------------------------------------------------------------------------------
13
11
Housing seems to be a major aspect of low rural-to-urban migration in many ECA countries. Housing mobility in most of these countries is just as low as labour mobility. A high ownership rate tends to reduce housing mobility. But practice in some Asian and Anglophone countries proves that this is not necessarily the case. It is different under conditions of efficient and transparent housing markets. And it is different if affordable housing alternatives in the target areas are available. Neither is the case in most ECA countries. An owned house or a privatized apartment is in many cases the only asset of a household. In economically weak regions, the cash value of residential property is low, as neither demand nor solvency is given. At the same time, housing markets in the metropolitan regions are skyrocketing, with only a short break after the global financial crisis (see Chapter D.3, p. 50). With their property in rural areas, prospective migrants cannot afford accommodation in the cities. Affordable housing supply and financing are lacking. Secondary markets are not transparent, with insiders skimming the few good offers. Combined with labour markets of still limited potential, it is in many cases economically irrational to take the risk of leaving one’s rural home.
A third dimension is migration caused by war and violence, extreme poverty, or natural or man-made disasters. If people affected by such incidents migrate across a border, the term “refugee” is applied. If they remain within the borders of their home country, the term “internally displaced person,” or IDP, is used. Such migrants are particularly vulnerable to human rights violations, and the enjoyment of housing is among the most endangered rights. Although several international instruments oblige states and other agents to ensure the right to adequate housing, these
migrants are frequently the victims of discrimination in that respect (U.N. Special Rapporteur 2010: para. 9). Internal displacement affects most SEE and CIS countries covered in this report. The housing situation of refugees and IDPs is described in Chapter C.6.4 (p. 40). Strategies to solve the problems are the subject of Chapter E.3.15 (p. 64).
B.2 ECONOMIC BACKGROUND
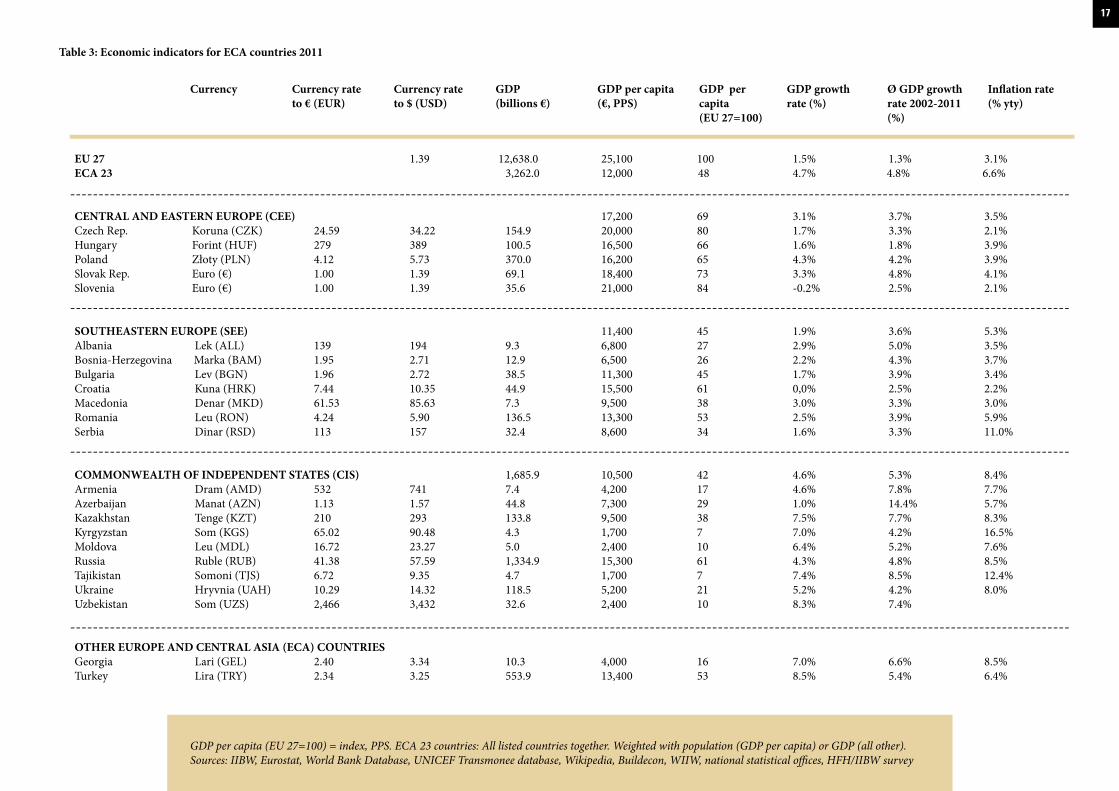
B.2.1 Economic developmentBy contrast to population, where the 23 ECA countries covered in this report come close to the EU 27, their gross domestic product is far lower, at € 3.26 trillion. (nominal, 2011, see Table 3, p. 17) That is only about one-fourth of EU 27’s GDP. In the ECA countries, GDP per capita in purchase power standard is €12,000, compared with an average of €25,100 for the EU. GDP growth in ECA is almost 5 percent in 10 years (2002-11). This is significantly stronger than in the European Union, where growth is only 1.3 percent. But inflation is also much higher, at 6.6 percent in 2011. The informal sector has grown rapidly during transition, particularly in the CIS (UNECE 2004a: 166).
In 2012, most ECA countries performed quite well. High fiscal discipline and high liquidity of the international capital markets led to economic recovery, relatively low budget deficits and economic growth rates above Western European levels.
Central and Eastern Europe The five EU member states in CEE — Czech Republic, Hungary, Poland, Slovak Republic and Slovenia — have GDPs per capita between €16,000
and €21,000, with a weighted average of €17,200 (for 2011, in purchase power standard; see Table 3, p. 17).This is 35 percent (Poland) to 16 percent (Slovenia) below the EU average. It is an interesting pattern that all five countries have, at different times, experienced periods of outstanding economic development followed by stagnation or recession. The Czech Republic had an economic boom right after transition, followed by a recession in the late 1990s. Today, the Czech Republic follows the footsteps of Germany, becoming one of the economically strongest countries in Central Europe. Hungary experienced quite a stable economic development until the mid-2000s, followed by severe political and economic hardship, which is still not resolved. Slovakia entered a boom phase in 2002, with GDP growth rates of up to 10 percent until 2008. Poland is currently at a peak of economic development, which is best characterized by the fact that it was the only EU country with no recession in the crisis year of 2009. Slovenia had steady economic development until 2008 but was hit by the global financial crisis more heavily than all the other CEE countries, and its outlook remains negative.
In boom times, all these countries had economic levels on par with those of western EU countries, but they all fell back in the following recession years. In total, after 20 years of transition, the backlog persists with only gradual progress, even though the average long-term GDP growth rates were considerably above the EU 27’s level. In a 10-year average (2002-11, which includes the crisis year of 2009), the EU 27 reached only 1.3 percent GDP growth per year. The Czech Republic saw 3.3 percent, Hungary had 1.8 percent, Poland saw 4.2 percent, Slovak Republic had 4.8 percent and Slovenia had 2.5 percent.
14
The weighted average was 3.7 percent. Inflation in the CEE region is currently 3.5 percent, only slightly above the EU average.
Southeastern Europe The seven SEE countries covered in this report are characterized by quite diverse economic developments. In a weighted average, they have a GDP per capita of 11,400 euros (for 2011, in purchase power standard; see Table 3, p. 17). This is 55 percent below the EU average, ranging from €6,500 in Bosnia-Herzegovina to €15,500 in Croatia. In a 10-year average, the region has achieved an annual GDP growth rate of 3.6 percent. This is virtually the same performance as the five CEE countries described above, and much higher than the EU average of 1.3 percent. The 10-year average GDP growth was an impressive 5 percent in Albania, 4.3 percent in Bosnia-Herzegovina, 3.9 percent in Bulgaria, 2.5 percent in Croatia, 3.3 percent in Macedonia, 3.9 percent in Romania and 3.3 percent in Serbia.
The diversity of economic performance is a direct result of different stages of EU integration in these countries. Romania and Bulgaria both enjoyed tremendous economic development in the years after they joined the EU. But increasing international integration and an unsustainable real estate boom led to a heavy downturn of economic development in the crisis year of 2009. Since then, both countries have been recovering well.
The economic level of Croatia since 2009 far exceeds those of the other SEE countries. In economic terms, Croatia fits in better with the CEE countries than with the SEE group. In 2001, its GDP per capita was higher than that of Poland and similar to Slovakia’s.
Early EU accession was prevented because of political reasons. Late European integration led to a restrained economic development in the 2000s. But Croatia also suffers from structural deficits, resulting in an economic slump in 2009 and a recession since then.
If the whole region suffered heavily from the Yugoslav Wars in the 1990s, the nations hit hardest, in terms of economic development, were Serbia and Bosnia-Herzegovina. Serbia was even in Yugoslav times economically behind Slovenia and Croatia. But after transition, the backlog grew. Because of less international integration, the global financial crisis of 2009 had less severe consequences in Serbia and Bosnia-Herzegovina than in Croatia and Slovenia. But economic recovery is still instable. Bosnia-Herzegovina is in a very complicated political situation, combined with a low level of economic development. Despite this, economic development has been steadily positive, with no downturn in 2009. Development there is currently stagnant.
Quite interesting is the performance of Albania, which may be classified as a “hidden tiger economy.” Long-term political isolation led to a situation that means even today Albania is rather invisible as an economy in the international concert. But it was the only European country besides Poland and Bosnia-Herzegovina with no economic slump in 2009, and it has continued to perform well up to today. In the average of 10 years (2002-11), it had an annual GDP growth of 5 percent, compared with 4.2 percent for Poland, but with a GDP per capita that is less than half of Poland’s.
Inflation in the SEE region is currently at 5.3 percent (2011), considerably above the EU average, but this
is driven mainly by Serbia (11 percent) and Romania (5.9 percent), whereas the other countries have much lower levels.
Commonwealth of Independent StatesThe CIS countries are economically dominated by Russia, which has a GDP representing almost 80 percent of the entire region — 10 times the volume of the second-largest economy, Kazakhstan. The average GDP per capita of the CIS region is €10,500 (2011, in purchase power standard), compared with the EU average of €25,100.
In economic terms, these countries may be distinguished in four groups: Russia is a relatively wealthy country with a GDP per capita of €15,300 (2011, in purchase power standard), which is still 39 percent below the EU average. But economic power is concentrated in a few metropolitan regions, some of which exceed the economic potential of the strongest agglomerations in Western Europe. The second group includes Kazakhstan and Azerbaijan, with GDPs per capita of €7,300 to €9,500 (38 percent and 52 percent below Russia’s, respectively). Both countries are benefiting from a substantial oil boom after transition, and Azerbaijan has tripled its GDP per capita since 2000. Ukraine and Armenia have GDPs per capita of €4,200 to €5.200 (66 percent and 73 percent below Russia’s, respectively), and both countries have had major political and economic difficulties during transition. The Central Asian countries Uzbekistan, Kyrgyzstan and Tajikistan, along with Moldova, have GDPs per capita below €2,400 (84 percent to 90 percent below Russia).
15
13
These countries also have gradually improved, in some cases showing remarkable growth rates since the early 2000s. But because of their very low economic level and, in some cases, political instability, they are closer to developing countries than to emerging markets.
The CIS region has experienced a weighted average GDP growth rate for the past decade (2002-11) of 5.3 percent, which is much higher than that of the SEE or CEE region and of course of the EU. The growth rate was 4.8 percent in Russia, 7.7 percent in Kazakhstan, a remarkable 14.4 percent in Azerbaijan, 4.2 percent in Ukraine, 7.8 percent in Armenia, 5.2 percent in Moldova, 7.4 percent in Uzbekistan, 3.8
percent in Kyrgyzstan and 8.5 percent in Tajikistan. The inflation rate is also quite high —currently above 8 percent in weighted average, with no country below 6 percent.
Other ECA countriesIn economic terms, Georgia closely resembles its neighbouring country, Armenia. It ceased to be part of the CIS region after the South Ossetia War against Russia in 2008. Turkey has shown quite impressive economic development, with the strongest GDP growth rate of all ECA countries in 2010 and 2011.
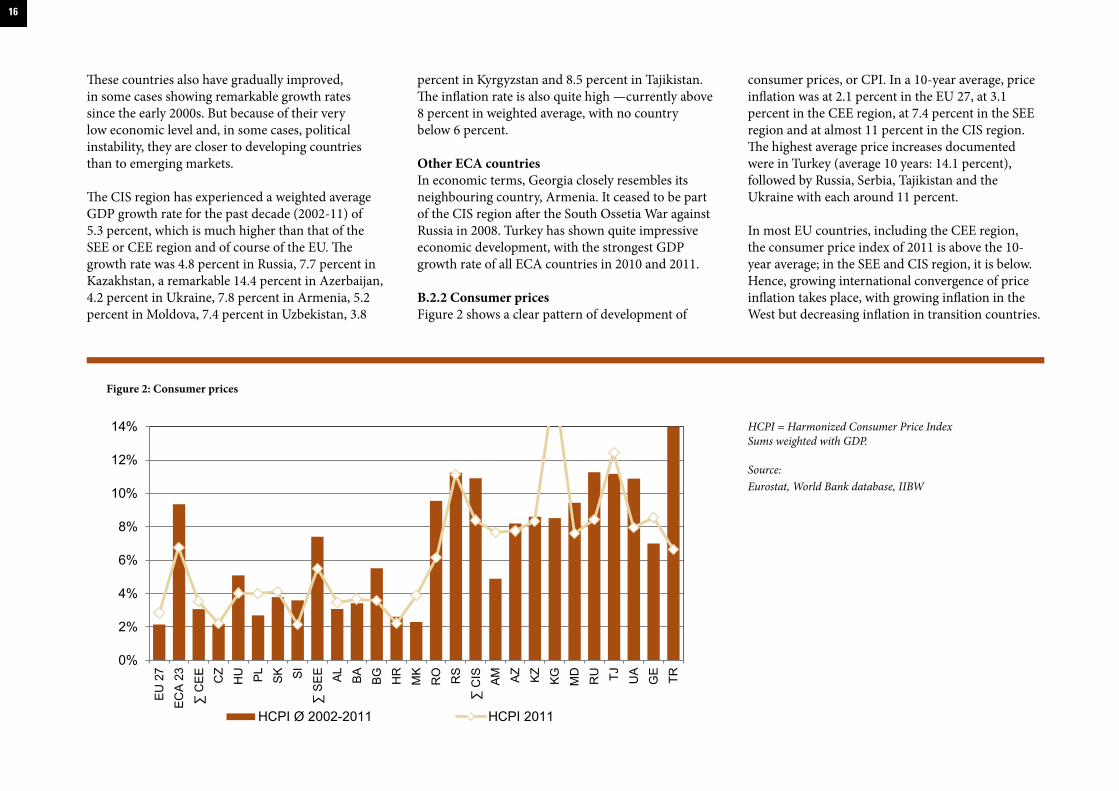
B.2.2 Consumer pricesFigure 2 shows a clear pattern of development of
consumer prices, or CPI. In a 10-year average, price inflation was at 2.1 percent in the EU 27, at 3.1 percent in the CEE region, at 7.4 percent in the SEE region and at almost 11 percent in the CIS region. The highest average price increases documented were in Turkey (average 10 years: 14.1 percent), followed by Russia, Serbia, Tajikistan and the Ukraine with each around 11 percent.
In most EU countries, including the CEE region, the consumer price index of 2011 is above the 10-year average; in the SEE and CIS region, it is below. Hence, growing international convergence of price inflation takes place, with growing inflation in the West but decreasing inflation in transition countries.
16
Figure 2: Consumer prices
HCPI = Harmonized Consumer Price IndexSums weighted with GDP.
Source:Eurostat, World Bank database, IIBW
0%
2%
4%
6%
8%
10%
12%
14%
EU 2
7EC
A 23
∑ C
EE CZ
HU PL SK SI
∑ S
EE AL BA BG HR
MK
RO RS
∑ C
IS AM AZ KZ KG MD
RU TJ UA
GE TR
HCPI Ø 2002-2011 HCPI 2011
EU 27 1.39 12,638.0 25,100 100 1.5% 1.3% 3.1%ECA 23 3,262.0 12,000 48 4.7% 4.8% 6.6%
CENTRAL AND EASTERN EUROPE (CEE) 17,200 69 3.1% 3.7% 3.5%Czech Rep. Koruna (CZK) 24.59 34.22 154.9 20,000 80 1.7% 3.3% 2.1%Hungary Forint (HUF) 279 389 100.5 16,500 66 1.6% 1.8% 3.9%Poland Złoty (PLN) 4.12 5.73 370.0 16,200 65 4.3% 4.2% 3.9%Slovak Rep. Euro (€) 1.00 1.39 69.1 18,400 73 3.3% 4.8% 4.1%Slovenia Euro (€) 1.00 1.39 35.6 21,000 84 -0.2% 2.5% 2.1%
SOUTHEASTERN EUROPE (SEE) 11,400 45 1.9% 3.6% 5.3%Albania Lek (ALL) 139 194 9.3 6,800 27 2.9% 5.0% 3.5%Bosnia-Herzegovina Marka (BAM) 1.95 2.71 12.9 6,500 26 2.2% 4.3% 3.7%Bulgaria Lev (BGN) 1.96 2.72 38.5 11,300 45 1.7% 3.9% 3.4%Croatia Kuna (HRK) 7.44 10.35 44.9 15,500 61 0,0% 2.5% 2.2%Macedonia Denar (MKD) 61.53 85.63 7.3 9,500 38 3.0% 3.3% 3.0%Romania Leu (RON) 4.24 5.90 136.5 13,300 53 2.5% 3.9% 5.9%Serbia Dinar (RSD) 113 157 32.4 8,600 34 1.6% 3.3% 11.0%
COMMONWEALTH OF INDEPENDENT STATES (CIS) 1,685.9 10,500 42 4.6% 5.3% 8.4%Armenia Dram (AMD) 532 741 7.4 4,200 17 4.6% 7.8% 7.7%Azerbaijan Manat (AZN) 1.13 1.57 44.8 7,300 29 1.0% 14.4% 5.7%Kazakhstan Tenge (KZT) 210 293 133.8 9,500 38 7.5% 7.7% 8.3%Kyrgyzstan Som (KGS) 65.02 90.48 4.3 1,700 7 7.0% 4.2% 16.5%Moldova Leu (MDL) 16.72 23.27 5.0 2,400 10 6.4% 5.2% 7.6%Russia Ruble (RUB) 41.38 57.59 1,334.9 15,300 61 4.3% 4.8% 8.5%Tajikistan Somoni (TJS) 6.72 9.35 4.7 1,700 7 7.4% 8.5% 12.4%Ukraine Hryvnia (UAH) 10.29 14.32 118.5 5,200 21 5.2% 4.2% 8.0%Uzbekistan Som (UZS) 2,466 3,432 32.6 2,400 10 8.3% 7.4%
OTHER EUROPE AND CENTRAL ASIA (ECA) COUNTRIESGeorgia Lari (GEL) 2.40 3.34 10.3 4,000 16 7.0% 6.6% 8.5%Turkey Lira (TRY) 2.34 3.25 553.9 13,400 53 8.5% 5.4% 6.4%
Currency Currency rate to € (EUR)
Currency rateto $ (USD)
GDP (billions €)
GDP per capita (€, PPS)
GDP per capita (EU 27=100)
Table 3: Economic indicators for ECA countries 2011
--------------------------------------------------------------------------------------------------------------------------------------------------------------------------------
--------------------------------------------------------------------------------------------------------------------------------------------------------------------------------
--------------------------------------------------------------------------------------------------------------------------------------------------------------------------------
--------------------------------------------------------------------------------------------------------------------------------------------------------------------------------
GDP per capita (EU 27=100) = index, PPS. ECA 23 countries: All listed countries together. Weighted with population (GDP per capita) or GDP (all other).Sources: IIBW, Eurostat, World Bank Database, UNICEF Transmonee database, Wikipedia, Buildecon, WIIW, national statistical offices, HFH/IIBW survey
GDP growth rate (%)
Ø GDP growth rate 2002-2011 (%)
Inflation rate (% yty)
17

15
B.2.3 Employmenta) Wages Transition occurred in all former socialist countries. It was followed by a decrease in economic output and accompanied by a fall of real wages (UNECE 2004a: 167). Recovery of wages and hence of domestic demand developed only slowly during the 2000s. Today, even in the most developed CEE countries, average wages reach only half of the EU average at best (for example, in Slovenia; see Table 4, p. 20). The average monthly wages in the five CEE countries covered in this report are about €900. Slovenia and the Czech Republic have higher wages, and the other three CEE countries have lower wages.Turkey’s income level is similar to that of the CEE region. In the SEE region, only Croatia can keep up with this level. The average of the seven countries of that region is below €500. In Albania, Bulgaria and Macedonia, average incomes are around €300. In the CIS region, the spread of incomes is even bigger. In Russia, the average gross monthly wages are €560. In Armenia, Moldova, Ukraine and Uzbekistan, they reach only about €200. In Tajikistan and Kyrgyzstan, gross wages are even below €100 per month.
b) UnemploymentUnemployment is hardly interrelated with the level of incomes. Altogether, the unemployment rate in the ECA region is similar to that of the EU (see Table 4, p. 20). In the CEE region, the rate is almost exactly the EU average — 9.7 percent (2011) — with below-average unemployment in the Czech Republic and above-average in Slovakia. Both Slovakia and Poland have made great efforts to reduce unemployment in recent years. The level of unemployment is significantly higher in the SEE region, at 14 percent, whereas the two EU member states — Romania and Bulgaria — perform better than states of the
former Yugoslavia. There is particular hardship in Macedonia (31 percent unemployment), Bosnia-Herzegovina (28 percent) and Serbia (23 percent). In contrast, CIS countries enjoy relatively low unemployment rates of only 7 percent in weighted average. Unemployment is particularly low in Tajikistan, and at a moderate level of below 7 percent in Azerbaijan, Kazakhstan and Russia. Very high unemployment is seen only in Armenia, Georgia and Kyrgyzstan. But the official unemployment rate gives only a fragmented picture. In many ECA countries, much of the population has no access to the labour market without being registered as unemployed.
B.2.4 Income inequalityInequality is statistically documented with the inequality of incomes ratio and the Gini Coefficient (see Table 4, p. 20). The inequality of incomes ratio is the multiplier between the average incomes of the highest- and lowest-income quintile (20 percent) of the population. The Gini Coefficient distinguishes equality with zero for total equality and 1 or 100 percent for total inequality. Both indicators provide a clear picture on the different regions covered in this report. In mature Western economies, both indicators provide consistent results. In less mature economies with less reliable data, the indicators in some cases show quite divergent results.
Before transition, almost all countries of Eastern Europe and the CIS had less inequality of incomes than in the Organisation for Economic Co-operation and Development (OECD) average. High levels of social expenditure and low wage differentials meant that the distribution of incomes within the Eastern bloc was significantly more egalitarian than in most market economies. Economic transition has resulted in a rise in inequality right across the
region. However, the size of the increase has varied considerably (UNECE 2004a: 165).
Today, the EU 27 has an inequality of incomes ratio of 5.2 (Gini Coefficient 30 percent). But some of the highest developed countries have ratios below 4, including some Scandinavian countries, the Netherlands and Austria (Gini below 26 percent each). CEE countries are characterized by an astonishing extent of equality, with ratios below 4 in Slovenia, Czech Republic and Hungary. In the SEE region, inequality is much higher, with a weighted inequality of incomes ratio of 6.1 (Gini Coefficient 34 percent), but it is still remarkably consistent throughout the individual countries. The CIS region has quite a low inequality of incomes ratio of 4.7 (without Russia), but a very high Gini index of 38 percent. The divergence of the two indicators is particularly evident in Azerbaijan or Kazakhstan, with low levels in the one indicator and very high levels in the other. Rather equal societies seem to persist in Tajikistan and the Ukraine. Georgia and Turkey both show very high levels of inequality.
B.2.5 PovertyStatistical data on poverty are widely inconsistent, since the phenomenon of poverty is a question not only of monetary indigence, but also of access to social life and infrastructure. The share of people below the poverty line — an indicator based on consumption (or income) levels — is often used, but other indicators are needed to capture other dimensions of poverty. The Millennium Development Goals also specify a number of relevant indicators (World Bank; CPRC 2005: 8).
Eurostat, meanwhile, provides reliable data from a regular household survey (EU SILC, Statistics on
18

Income and Living Conditions), which combines data on incomes, the relative income level in a country, and a set of criteria of social exclusion. But this source is available only for a limited set of countries with recent data (see Table 4, p. 20). A converse data concept is a fixed level of individual incomes, considering different purchasing power. But such a threshold does not reflect price inflation. This concept describes quite well extreme poverty (e.g. people living with less than US$2 per day), as under conditions of extremely low incomes, all other aspects of vulnerability become less relevant. Most countries have additionally defined national poverty lines, but they hardly qualify for comparative analysis.
In the EU average, 23.1 percent of the population is threatened by poverty (Table 4). This level is generally lower in more equal societies and higher in countries with high income disparities. For the CEE region, the weighted average is slightly above the EU average at 25.3 percent, but the Czech Republic, Slovenia and Slovakia are characterized by a particularly low level of poverty, whereas Poland and Hungary are far above the EU average. SEE countries have altogether a much higher level of pauperism, with almost 36 percent of households under threat of poverty. The level is particularly high in Bulgaria and Romania, with each above 40 percent. By contrast, the poverty level in Serbia is 23 percent, close to the EU average. Respective data are available for only a few other countries. The poverty level is quite moderate in Turkey, but extremely high in Armenia.
Given the decrease in production output and real wages and the increase in inequality, it is not surprising that both absolute and relative poverty levels increased during the 1990s, particularly in the CIS and Southeast Europe (UNECE 2004a: 168). The
percentage of people living below the poverty line increased by three to five times (Council of Europe 2002: 12). The relative numbers of poor have risen in almost every country throughout the region. While poverty began to decrease in some countries — such as Hungary, the Czech Republic and Slovakia — after the initial shock of transition, it has continued to rise in most. Poverty developed worst in the former Soviet Union (UNDP 1997: 58). But information on poverty levels from before the transition is not generally considered accurate. The UNDP states that mass impoverishment, reaching into the middle classes, is the most important aspect of the “new poverty” emerging from transition (UNDP 1997: 24; Aidukaite 2011: 214).
Extreme poverty was no evident problem in the ECA countries before transition. It seems to be one of the most humiliating failures of the political process of transition that in several countries this has changed radically. In some CIS countries, extreme poverty is a problem similar to that in sub-Saharan Africa, if not in absolute numbers, than in terms of negative dynamics. In most Western European countries, virtually no one lives on less than US$2 per day. The same is the case for most CEE countries (see Table 4, p. 20). Only Hungary has 0.4 percent of the population at this income level. The situation is much worse in the SEE region, with altogether 1.4 percent of the population classified as extremely poor (2011). This seems like a small percentage, but taking into account that roughly 700,000 people are concerned, the severity of the situation becomes evident. Extreme poverty is a particular challenge in Albania, Macedonia and Romania. In the CIS region, 1.9 percent of the population lives on less than US$2 per day. No fewer than 4.4 million people are affected by extreme poverty. The biggest problems are in Tajikistan and Kyrgyzstan, with more than
20 percent of the population each at that income level, and Armenia, with 12 percent. By contrast, Russia and Ukraine have levels of extreme poverty close to zero. Further hotspots of extreme poverty are Georgia and Turkey. For the whole ECA region, 2.3 percent, or 10.4 million people, live in extreme poverty.
Poverty is closely linked to unaffordability of housing. Further analysis of this aspect is provided in chapter C.3 (p. 30).
Recently, a new form of poverty has become widespread in the region — energy poverty. This is a lack of access to modern energy services or high energy prices that become a burden to most households. On an EU level, energy poverty only in 2009 went to the official agenda, with the Directives 2009/72/EC and 2009/73/EC “concerning common rules for the internal market in electricity and natural gas supply,” followed by the “European Economic and Social Committee opinion on energy liberalization” of 2010 (Bouzarovski et al. 2012: 3).
This is a very complex issue, and it varies across the region. In transition countries after liberalization of energy markets, energy prices have in many cases reached Western levels, but household incomes remain far below those of the West. For this reason, the topic came to the political agenda.
For Western Balkan countries, the EU initiated an Energy Community Treaty in the early 2000s. This supranational initiative is responsible for the biggest part of legislation on energy efficiency and other issues related to EU energy policy in the region, and also considers social issues (UNECE 2012; Bouzarovski et al. 2012: 4).
19

17 20
Table 4: Living conditions 2011 (incomes, equality, poverty)
EU 27 9.6% 5.2 30% 23.1% ECA 23 8.5% 5.7 37% 2.3%
CENTRAL AND EASTERN EUROPE (CEE) 9.7% 4.5 30% 25.3% 0.2%Czech Republic 990 6.7% 3.5 25% 15.3% 0.0%Hungary 760 10.9% 3.6 24% 29.9% 0.4%Poland 830 9.7% 5.2 34% 27.8% 0.2%Slovak Republic 850 13.6% 4.0 26% 20.6% 0.1%Slovenia 1,530 8.2% 3.4 24% 19.3% 0.0%
SOUTHEASTERN EUROPE (SEE) 13.8% 6.1 34% 35.8% 1.4%Albania 290 14.0% 5.3 35% 4.3%Bosnia and Herzegovina 410 27.6% 36% 28.1% 0.2%Bulgaria 330 11.3% 5.9 33% 41.6% 0.4%Croatia 1,050 13.5% 5.2 34% 31.3% 0.1%Macedonia 330 31.0% 36% 5.9%Romania 470 7.4% 6.6 33% 40.3% 1.7%Serbia 510 23.0% 5.6 35% 23.4% 0.7%
COMMONWEALTH OF INDEPENDENT STATES (CIS) 6.9% 4.7 38% 1.9%Armenia 210 19.0% 8.8 40% 51.7% 12.4%Azerbaijan 5.6% 3.0 44% 2.8%Kazakhstan 440 5.4% 4.2 41% 1.1%Kyrgyzstan 40 12.0% 6.4 37% 21.7%Moldova 210 6.7% 6.7 38% 4.4%Russia 560 6.6% 42% 0.1%Tajikistan 70 2.1% 4.7 31% 27.7%Ukraine 240 7.9% 3.6 27% 0.2%Uzbekistan 210 6.2 37%
OTHER ECA COUNTRIES Georgia 15.1% 9.5 42% 24.7% 9.2%Turkey 860 8.8% 8.0 40% 26.5% 4.2%
Data are mostly from 2011 but in a few cases are older.Gross monthly wages = 1/12 of yearly wages.Inequality of incomes ratio = multiplier between highest and lowest income quintile.Threat of poverty: before social transfer, percentage of total population.Extreme poverty level = percentage of population with less than US$ 2 a day (PPS).ECA 23 countries = all listed countries together.Sums weighted with population.
Sources: Eurostat, WIIW, BuildEcon, UNICEF TransMonEE database, ADB (2012), National Statistical Offices, HFH/IIBW survey 2012
Gross monthly income (€)
Unemploy-ment rate (%)
Inequality of incomes ratio
Gini Coefficient
Threat of poverty (% of population)
Extreme poverty (% of population)
-----------------------------------------------------------------------------------------------------------------------------
-----------------------------------------------------------------------------------------------------------------------------
-----------------------------------------------------------------------------------------------------------------------------
-----------------------------------------------------------------------------------------------------------------------------
C.1 HOUSING STOCK
Housing provision in in the ECA region varies considerably. Housing outcomes are more favorable in those countries that joined the European Union in 2004 (Czech Republic, Hungary, Poland, Slovenia and Slovak Republic) whilst Romania and Bulgaria face significantly worse conditions, alongside non-EU countries of the region. Table 8 (p. 23)summarizes key housing characteristics across the region.
Altogether, the 23 ECA countries assembled in this report have a housing stock of approximately 163 million units. This is 30 percent fewer than in the EU 27, whereas the population is only 10 percent less (see Table 1, p. 13). The CIS countries are the biggest region, with more than 98 million housing units. Russia alone contributes almost 61 million, followed by the CEE countries, with 25 million dwellings, and the SEE countries, with 20 million. Turkey has almost the housing volume of the entire SEE region, with 18 million dwellings.
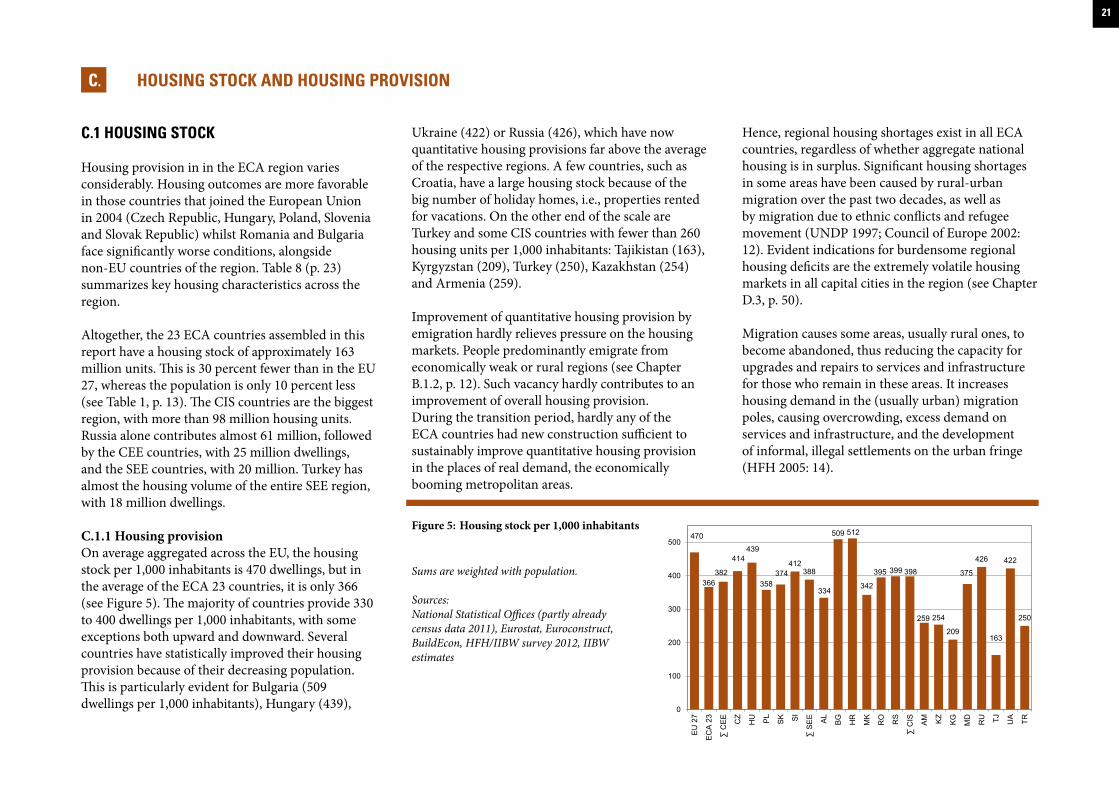
C.1.1 Housing provisionOn average aggregated across the EU, the housing stock per 1,000 inhabitants is 470 dwellings, but in the average of the ECA 23 countries, it is only 366 (see Figure 5). The majority of countries provide 330 to 400 dwellings per 1,000 inhabitants, with some exceptions both upward and downward. Several countries have statistically improved their housing provision because of their decreasing population. This is particularly evident for Bulgaria (509 dwellings per 1,000 inhabitants), Hungary (439),
Ukraine (422) or Russia (426), which have now quantitative housing provisions far above the average of the respective regions. A few countries, such as Croatia, have a large housing stock because of the big number of holiday homes, i.e., properties rented for vacations. On the other end of the scale are Turkey and some CIS countries with fewer than 260 housing units per 1,000 inhabitants: Tajikistan (163), Kyrgyzstan (209), Turkey (250), Kazakhstan (254) and Armenia (259).
Improvement of quantitative housing provision by emigration hardly relieves pressure on the housing markets. People predominantly emigrate from economically weak or rural regions (see Chapter B.1.2, p. 12). Such vacancy hardly contributes to an improvement of overall housing provision. During the transition period, hardly any of the ECA countries had new construction sufficient to sustainably improve quantitative housing provision in the places of real demand, the economically booming metropolitan areas.
Hence, regional housing shortages exist in all ECA countries, regardless of whether aggregate national housing is in surplus. Significant housing shortages in some areas have been caused by rural-urban migration over the past two decades, as well as by migration due to ethnic conflicts and refugee movement (UNDP 1997; Council of Europe 2002: 12). Evident indications for burdensome regional housing deficits are the extremely volatile housing markets in all capital cities in the region (see Chapter D.3, p. 50).
Migration causes some areas, usually rural ones, to become abandoned, thus reducing the capacity for upgrades and repairs to services and infrastructure for those who remain in these areas. It increases housing demand in the (usually urban) migration poles, causing overcrowding, excess demand on services and infrastructure, and the development of informal, illegal settlements on the urban fringe (HFH 2005: 14).
HOUSING STOCK AND HOUSING PROVISIONC.
Figure 5: Housing stock per 1,000 inhabitants
Sums are weighted with population.
Sources: National Statistical Offices (partly already census data 2011), Eurostat, Euroconstruct, BuildEcon, HFH/IIBW survey 2012, IIBW estimates
470
366382
414439
358374
412388
334
509 512
342
395 399 398
259 254
209
375
426
163
422
250
0
100
200
300
400
500
EU
27
EC
A 2
3
∑ C
EE CZ
HU PL
SK SI
∑ S
EE AL
BG
HR
MK
RO RS
∑ C
IS AM KZ
KG
MD
RU TJ UA TR
21
19
60
73
79 80
71
59
76
6864
96
71
6355
105
70
59 53 54 56
0
20
40
60
80
100
EC
A 2
3
∑ C
EE CZ
HU PL
SK SI
∑ S
EE
BG
HR
MK
RO
∑ C
IS AM KG
MD
RU TJ UA
22
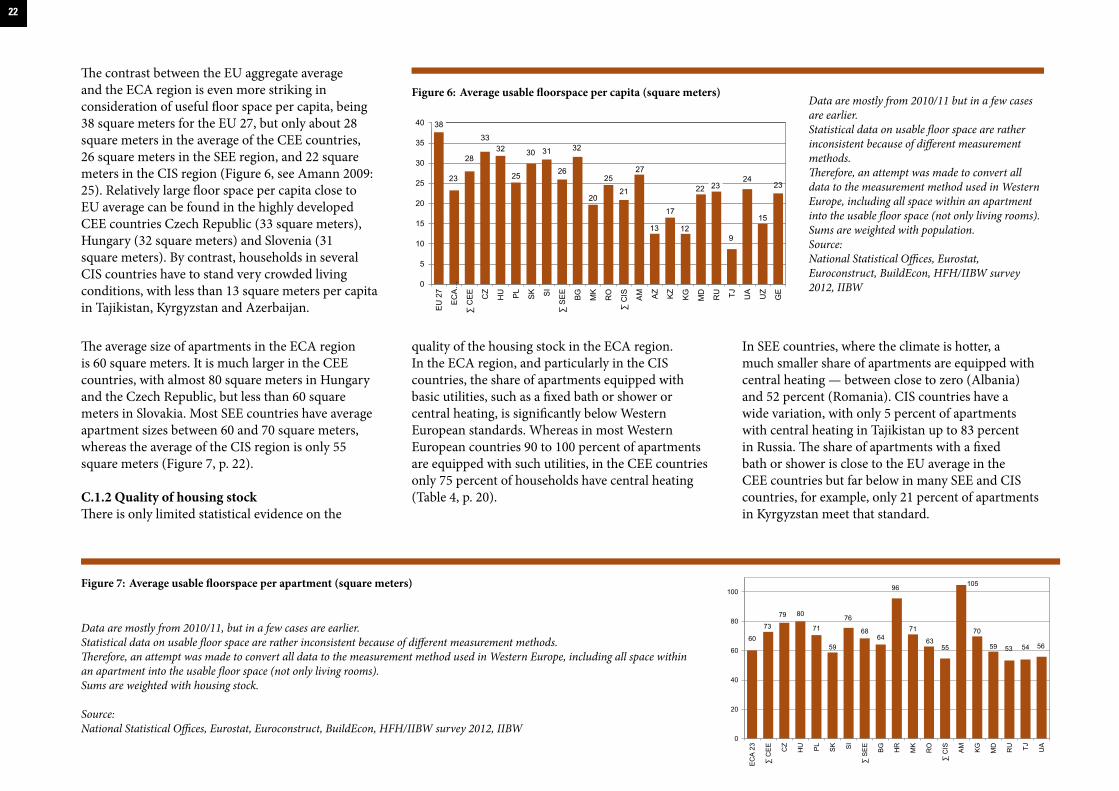
The contrast between the EU aggregate average and the ECA region is even more striking in consideration of useful floor space per capita, being 38 square meters for the EU 27, but only about 28 square meters in the average of the CEE countries, 26 square meters in the SEE region, and 22 square meters in the CIS region (Figure 6, see Amann 2009: 25). Relatively large floor space per capita close to EU average can be found in the highly developed CEE countries Czech Republic (33 square meters), Hungary (32 square meters) and Slovenia (31 square meters). By contrast, households in several CIS countries have to stand very crowded living conditions, with less than 13 square meters per capita in Tajikistan, Kyrgyzstan and Azerbaijan.
The average size of apartments in the ECA region is 60 square meters. It is much larger in the CEE countries, with almost 80 square meters in Hungary and the Czech Republic, but less than 60 square meters in Slovakia. Most SEE countries have average apartment sizes between 60 and 70 square meters, whereas the average of the CIS region is only 55 square meters (Figure 7, p. 22).
C.1.2 Quality of housing stockThere is only limited statistical evidence on the
quality of the housing stock in the ECA region. In the ECA region, and particularly in the CIS countries, the share of apartments equipped with basic utilities, such as a fixed bath or shower or central heating, is significantly below Western European standards. Whereas in most Western European countries 90 to 100 percent of apartments are equipped with such utilities, in the CEE countries only 75 percent of households have central heating (Table 4, p. 20).
In SEE countries, where the climate is hotter, a much smaller share of apartments are equipped with central heating — between close to zero (Albania) and 52 percent (Romania). CIS countries have a wide variation, with only 5 percent of apartments with central heating in Tajikistan up to 83 percent in Russia. The share of apartments with a fixed bath or shower is close to the EU average in the CEE countries but far below in many SEE and CIS countries, for example, only 21 percent of apartments in Kyrgyzstan meet that standard.
Figure 6: Average usable floorspace per capita (square meters)
Figure 7: Average usable floorspace per apartment (square meters)
Data are mostly from 2010/11 but in a few cases are earlier.Statistical data on usable floor space are rather inconsistent because of different measurement methods. Therefore, an attempt was made to convert all data to the measurement method used in Western Europe, including all space within an apartment into the usable floor space (not only living rooms).Sums are weighted with population.Source: National Statistical Offices, Eurostat, Euroconstruct, BuildEcon, HFH/IIBW survey 2012, IIBW
38
23
28
3332
25
30 31
26
32
20
2521
27
13
17
12
22 23
9
24
15
23
0
5
10
15
20
25
30
35
40
EU
27
EC
A…
∑ C
EE
CZ
HU PL
SK SI
∑ S
EE
BG
MK
RO
∑ C
IS AM AZ
KZ
KG
MD
RU TJ UA UZ
GE
Data are mostly from 2010/11, but in a few cases are earlier.Statistical data on usable floor space are rather inconsistent because of different measurement methods. Therefore, an attempt was made to convert all data to the measurement method used in Western Europe, including all space within an apartment into the usable floor space (not only living rooms).Sums are weighted with housing stock.
Source: National Statistical Offices, Eurostat, Euroconstruct, BuildEcon, HFH/IIBW survey 2012, IIBW

Table 8: Housing stock in the ECA region 2011
Data are mostly from 2010/11, but in a few cases are older.Housing stock per Jan. 1.Share of social rents = below market level.ECA 23 countries = all listed countries together.Sums weighted with housing stock.
Sources: National Statistical Offices (partly already census data 2011), Eurostat, Euroconstruct, BuildEcon, AHML,HFH/IIBW survey 2012, IIBW estimates for Azerbaijan, Georgia and Uzbekistan
EU 27 236,000 71% 11% 18%ECA 23 163,000 86% CEE COUNTRIES TOTAL 25,280 75% 90% 82% 12% 4%Czech Republic 4,360 82% 96% 80% 13% 7%Hungary 4,380 57% 91% 90% 8% 2%Poland 13,670 78% 87% 77% 16% 3%Slovak Republic 2,030 74% 93% 90% 2% 8%Slovenia 840 80% 93% 78% 17% 6%
SEE COUNTRIES TOTAL 20,180 92% Albania 1,080 1% 100% Bosnia-Herzegovina 960 Bulgaria 3,820 14% 82% 87% 11% 2%Croatia 2,260 36% 90% 8% 2%Macedonia 700 95% Romania 8,460 52% 59% 97% 2% 1%Serbia 2,900 84%
CIS COUNTRIES TOTAL 98,260 89% Armenia 850 96% 4% 1%Azerbaijan 2,300 88% 12% Kazakhstan 4,140 97% Kyrgyzstan 1,100 10% 21% 97% Moldova 1,340 35% 36% 97% Russia 60,800 83% 67% 86% 14% 11%Tajikistan 1,230 5% 93% Ukraine 19,400 93% 3% 2%Uzbekistan 7,100 98%
OTHER COUNTRIES Georgia 1,100 95% Turkey 18,450 94% 68%
Housing stock (1,000 units)
Share of stock with central heating
Share of stock with fixed bath or shower
Ownership rate
Share of social rents
Share of market rents
---------------------------------------------------------------------------------------------------------------------------------
---------------------------------------------------------------------------------------------------------------------------------
---------------------------------------------------------------------------------------------------------------------------------
---------------------------------------------------------------------------------------------------------------------------------
23

21
Much of the housing throughout the region was built in the three decades preceding transition, and so it is relatively new. The majority of this stock, however, was built from low-quality prefabricated materials in the form of multistory apartment buildings. In some cases, prefabricated buildings were executed with a planned life span of only 30 years. This period has already expired.
The quality of the housing stock suffers from decades of inadequate maintenance and under-investment. Before and after transition, repairs and maintenance were quite limited, and investment in the existing stock was negligible (Balchin 1997: 234-35). A high percentage of this housing is rapidly deteriorating and is considered the region’s “housing time bomb” (HFH 2005: 17).
The transition period brought even further reductions in the resources available for building repair and maintenance. Because privatization was offered at very low costs — or in some cases for free (see Chapter C.2.3, p.27) — many of the people who received ownership rights were poor and lacked the resources necessary for even minimal levels of repair and maintenance. As unemployment and poverty escalated throughout the 1990s, new homeowners became even less able to pay for immediate housing repairs, let alone long-term maintenance and rehabilitation. During this time, public subsidies for housing maintenance and repair slowed to a trickle and in many countries were cut off completely (UNECE 2003: 10).
There is a big gap in the quality of housing stocks among ECA countries, both in older buildings, particularly prefabricated panel block buildings, and in new construction. Quality standards in CEE countries are basically similar to those of
Western Europe. In contrast, in some SEE and CIS countries, parts of the existing housing stock are highly deteriorated. Particularly grave is the situation in some Central Asian and Caucasus countries. UNECE shows that, for example, Azerbaijan has many problems with leaking and unsafe roofs, nonfunctioning elevators, the lack of proper insulation, neglected common areas, and structural problems with buildings (UNECE 2010a: 35). Similar findings have been made for Armenia (Amann & Komendantova 2010) and other countries of the region.
C.1.3 Energy efficiency in the residential sectorGenerally, the thermal quality of the housing stock in the ECA region is low. There is a rising awareness of the significance of energy efficiency in the housing sector, as energy consumption and emissions for heating and cooling contribute heavily to total consumption. In several countries, according legislation is on the way. For EU member and candidate states, the EU Energy Performance of Buildings Directive (EPBD recast, 2010/31/EU) is of major importance, as it defines, for example, the implementation of energy performance certificates, energy audit and conditions of thermal refurbishment. For the Western Balkans and a few CIS countries, the EU in 2005 initiated the “Energy Community” intergovernmental body, which has provided congruent legal regulations on the topic for several countries (see UNECE, 2010a: 34; UNECE, 2011; UNECE 2012).
In all ECA countries, energy poverty is becoming an important issue, as the energy consumption of buildings and energy prices are similar to those of Western countries, but household incomes are not (see Chapter B.2.5, p. 20).
C.1.4 Present refurbishment rate, need for refurbishmentStatistical data on the present refurbishment rate are not available for any of the ECA countries. Even for Western Europe, only estimates are available. This has to change, in view of very ambitious EU targets on the reduction of greenhouse gas emissions from heating and cooling. All CEE countries and the SEE EU member and candidate countries are bound to EU energy targets. This is, in the short perspective, the EU 20/20/20 goals, including a 20 percent reduction in greenhouse gas emissions from 1990 levels, raising the share of renewable energy consumption to 20 percent, and improving energy efficiency by 20 percent by 2020. In the long perspective — until 2050 — energy consumption in the housing sector ought to be reduced by not less than 90 percent (EC 2011).
This means that virtually the total existing housing stock requires thermal refurbishment, including the building surface, windows, doors and heating systems. For very low energy consumption, new innovative heating systems with ventilation and heat exchanging devices will be necessary, and energy-efficient cooling will require thermo-active building systems. Western EU countries have set target refurbishment rates of 3 percent of the total housing stock per year, but at present it seems to be very difficult to exceed 1 percent (e.g., in Germany or Austria).
In many ECA countries, energy performance requirements are subordinate to other urgent requirements of repair, such as roofs, elevators, staircases, facades and even structural elements. Information on the need for refurbishment in ECA countries is scarce.
24

An old source estimates that Poland has 1 million units in need of major renovation, along with 300,000 that should be demolished (Slabkowicz 2000: 72). For Romania, the U.N. estimates that 40 percent of all urban housing is of low quality and in urgent need of investment (UNECE Housing Profile Romania, 2001: 3-17; 95-106). For Ukraine, the government estimates that all housing built during the “mass industrial housing development period” (about 10 percent of the national stock) needs either reconstruction or replacement (State Committee of Ukraine on Construction, Architecture and Housing Policy 1999). For Russia, the U.N. estimates that 11 percent of the stock needs urgent renovation and 9 percent should be demolished, and about 2 million people currently live in officially condemned housing.
Funding is a main barrier for thermal refurbishment. The savings of energy costs are usually by far not enough to finance rehabilitation. Owners often are not able to afford the necessary investments. Energy saving companies (ESCOs) are an option, but only set preconditions. Subsidy schemes, if in place, usually close a small gap, but financing is not the only issue. Similarly burdensome are insufficient legal regulations on maintenance and repair (see Chapter C.4, p. 32), particularly for condominiums and mixed-ownership premises. Owners associations are poorly implemented in many countries. The decision-making process of owners is insufficiently regulated. Opposing owners cannot be forced to contribute to refurbishment projects. Savings for a reserve fund for future investments in rehabilitation are almost nowhere obligatory.
C.1.5 Informal housingThe challenge of informal settlements is widely recognised in international and national programs for change and action. At a global level, the U.N. Habitat Agenda, adopted in 1996, and the Declaration on Cities and Other Human Settlements in the New Millennium, adopted by the U.N. General Assembly in 2001, reaffirm the commitment of governments to ensure access to adequate housing. Addressing the challenge of informal settlements is also critical for the achievement of The Millennium Development Goals, particularly Target 11 on slums. On a regional level, The Vienna Declaration on National and Regional Policy Programmes regarding informal settlements in Southeastern Europe identifies the issue as a priority and engages countries in policies to legalize and improve informal settlements in a sustainable way. It argues that the prevention of future settlement formation is critical through sustainable urban management, principles of good governance, and inclusive capacity building (Vienna Declaration, 2004). Successful regularisation efforts contribute to long-term economic growth and to social equity, cohesion and stability (Amann & Tsenkova 2011: 16).
Informal housing has grown rapidly since the early 1990s. For the SEE region, UN-HABITAT assesses that politically required rapid urbanisation during the countries’ industrialisation meant that the monopolistic socially owned enterprises were not able to provide sufficient housing to the new arrivals. Illegal construction was further supported by urban plans that did not allocate sufficient affordable plots for individual construction. Authorities in Yugoslavia had a higher tolerance toward informal housebuilding, so large informal areas in Montenegro, Serbia, Croatia and Macedonia
date back to the 1970s. However, the scale of these developments today is much more challenging and varied, from slums to luxury residences, from centrally located areas to suburbs, and from several small units to large settlements (UN-HABITAT 2005: 125; Tsenkova 2011: 82).
The solutions implemented so far in SEE range from legalization and inclusion in formal urban plans, regularisation and provision of essential social services (schools, medical services) and technical infrastructure (safe roads, public transit, water and sewer), as well as resettlement programs in social housing (Tsenkova 2009; Tsenkova, Potsiou & Badina 2009).
25

24
C.2 HOUSING TENURE
C.2.1 Tenure structure
Present stateMass privatization and a lack of new rental housing construction led to a sharp decrease of rental housing in all transition countries. Today, more than half of the ECA countries may be classified as Super Homeownership States (Stephens, 2005) with ownership rates above 90 percent (Table 8, p. 23). Whereas in the EU 27, the average homeownership rate is 71 percent, it is 86 percent in the ECA region. Two of the CEE countries, Slovakia and Hungary, have ownership rates above 90 percent, and all others have 80 percent or less, still relying on strong housing cooperative sectors. SEE countries have an ownership rate of more than 90 percent on average, with particularly high shares in Albania (close to 100 percent), Romania (97 percent) and Macedonia (95 percent). The situation is quite similar in the CIS region, with most countries being Super Homeownership States. Only Russia has a lower ownership rate, with 86 percent. There seems to be a correlation between the state of economic development of countries and lower ownership rates.
Rental housing has a decreasing significance in all transition countries, despite all the emphasis on re-establishing affordable rental housing (see Chapter D.2, p. 49). Russia, Azerbaijan and some CEE countries, such as Slovenia, Poland and Czech Republic, have social rental housing sectors above the EU 27 average (i.e., more than 11 percent of the total housing stock). But the majority of ECA countries have far below that average. Market rental sectors differ even more from EU standards. Whereas 18 percent of the total housing stock in the
EU is rented out on market conditions, that figure is less than 2 percent in most SEE and CEE countries and only slightly higher in the CIS region.
Tenure structure in the course of transitionThe development of the tenure structure in CEE countries followed similar paths: Owner-occupied housing became the dominant tenure. Housing policymakers in the region were very reluctant to overturn the distortions built into the tenure structure after the system change. Distortions have been caused by the financial disadvantages of the sector and the legal uncertainty of rental tenure. There was a need for radical change for the social sector where the “old contracts” (with an extreme tenure security, conservative rent regulation and unfixed terms) were mixed with the “new contracts” (with free-market rents, fixed terms and much lower tenant protection) (Amann, Hegedüs, Lux & Springler 2012).
Statistical difficultiesHowever, these statistics hide important differences in rental tenures. For example, cooperative housing has to be classified somewhere between rental and owner-occupied housing. In some countries, tenants of cooperative housing have tenancy rights close to ownership, but in other countries such dwellings are clearly rentals. In some countries, such as Poland, both types exist side by side. On the other hand, an informal rental market has emerged in all transition countries. Privatized owner-occupied apartments are rented out, mainly serving demand at the lower end of the market. This tenure is mostly unregulated, with hardly any tenant protection (see Chapter C.5.5, p. 38). Despite its considerable size, this tenure sector is statistically elusive, with no real data available. Hence, the ownership rates listed in Table 8 (p. 23)
have to be discussed as an approximation, which makes cross-country comparison quite difficult (Amann & Lawson, 2012; Amann & Mundt, 2011; Andrews, Caldera Sánchez, Johansson, 2011).
C.2.2 Affordable rental housingBefore transition, the significance and institutional setting of social rental housing was quite diverse. The public rental sector occupied more than 50 percent of the housing stock in the Soviet Union, about 28 percent in CEE countries, and only 19 percent in SEE countries such as Albania, Croatia and Bulgaria. It was primarily state-owned in CIS countries, but enterprise-owned in the former Yugoslavia. There, social ownership titles could be inherited and swapped for private ownership. Consequently, a social rental sector as such did not exist in the former Yugoslavia. The homeownership sector in Bulgaria or the cooperatives in Czechoslovakia functioned quite similarly (Amann & Lawson 2012; Council of Europe 2002: 12-13; Charles Kendall/ Eurasylum 2009: 7).
But in the socialist housing system, the definition of social housing was quite uncertain, as the state housing policy followed a “unitary” structure, to use the term coined by J. Kemeny (Kemeny 1995, Kemeny et al. 2001, Kemeny et al. 2005), which meant that state-subsidized housing (both in the public and in the owner-occupied sector) was open for a wide range of different incomes and professional groups (Amann, Hegedüs, Lux & Springler 2012).
By the 1980s, it became clear that the governments were failing in their constitutional responsibility for the provision of adequate housing. Countries such
26

as Hungary and Slovenia decided to maximize the resources of the population to address the persistent housing shortages. As a result, their shares of public housing decreased. Other countries, such as Russia, devoted more budget resources to housing production, thereby retaining the emphasis on state rentals (Roy 2008: 136).
Currently, the share of social rental housing is 11 percent in the EU average (2011). In the ECA region, social rental housing has quite a diverse significance, with less than 5 percent of the housing stock in Slovakia, Romania, Ukraine, Hungary and Armenia, but above the EU average in Slovenia, Russia, Poland, Czech Republic and Azerbaijan (Table 8, p. 23). The costs of social rental housing in the ECA region are extremely low (Chapter C.3.4, p. 32).
There is a clear link between the rise in housing prices — and the resulting affordability problems — and the demand for public and affordable housing. The constant reduction of public housing has resulted in long waiting lists, keeping a large number of people in inadequate housing conditions or affecting their expenditures in other areas, such as food, clothing and health (U.N. Special Rapporteur 2009: para. 34). Having a sufficient supply of affordable housing affects different areas of development. It is important not only for shelter purposes, but also for the formation of a cohesive, inclusive society and for a country’s economic development.
C.2.3 Housing privatizationIn shifting from a command to a market economy, many countries across the area of the study have conducted a radical privatization of housing stock since 1990. By contrast to housing privatization in
many Western European countries, only one model was applied: selling off social rental apartments at very low prices to sitting tenants. Other models, such as right-to-buy policies to sitting tenants (as in the United Kingdom), property transfers from public to not-for-profit actors (as in the Netherlands and the United Kingdom), and sale of public housing stocks to commercial investment companies (as in Germany), were not considered. The impact of housing privatization on the population has varied from country to country (U.N. Special Rapporteur 2009: para. 37, 39. Hegedüs et al. 2012: 41).
The starting point for privatizing the housing stock was different for every country. In some countries, a private housing market had existed legally or clandestinely for many years before 1990. Although state ownership was extreme in Armenia or Russia, other countries, such as Bulgaria, Hungary and Slovenia, experienced levels of homeownership above those of Western Europe. In Czechoslovakia and Poland, cooperative housing was very important before 1990, and it continues to be important today (Struyk 2000: 3). In most CEE and Central Asian countries, the public rental sector has decreased from previous levels of 20 percent to 50 percent or more of the housing stock to current levels of well below 10 percent.
QuantityThe volume of housing privatization (expressed in percentage of the total housing stock) differs a lot, ranging from only 2 percent in Bulgaria to 65 percent in Kazakhstan (Figure 9), with a weighted average all over the ECA countries of 35 percent. In total numbers, the biggest volume of housing privatization was conducted in Russia, with no fewer than 28.9 million units (48 percent of the
stock), followed by Ukraine, with 6.2 million units (32 percent); Kazakhstan, with 2.5 million units (65 percent); Poland, with 2.3 million units (18 percent); and Romania, with 2.2 million units (27 percent of stock). The shares of privatized dwellings were bigger in CIS countries (approximately 43 percent in weighted average) than in CEE or SEE countries (approximately 18 percent each), mainly because private ownership had a much lower significance in these countries before transition.
In the entire ECA region, close to 50 million apartments were privatized during transition, representing about 35 percent of the total housing stock of more than 160 million.
Privatization concerned both state-owned apartments (mainly in CIS countries), company-owned dwellings (e.g., in the former Yugoslavia) and cooperative housing (e.g., in some CEE countries). In many cases, privatization was not conducted directly but via a transfer of authority and property to municipalities. The sale was then organised by the municipalities.
27

25
PricingSale prices of privatization almost never came close to “replacement value,” i.e., a price that allows the public to build a new housing unit and hence keep the total social housing stock stable. Since privatization was never intended to be used for financing new social housing construction, this argument was hardly ever applied. By contrast, in many cases there was a consensus that sitting tenants had a legitimate claim for property rights on their apartment. Housing was in former times financed by contributions from the workers (in CIS countries to the state, in the former Yugoslavia as a fixed royalty from salaries to “Solidarity Funds”). As the former system of social transfers ceased to function, privatization to sitting tenants seemed to be the fairest solution to the biggest number of beneficiaries.
In most cases, sale prices were below 20 percent of replacement value, but in many countries the sales were free or only symbolic. Giveaway privatisation took place in Slovakia and Czech Republic, in Albania and Macedonia, and in most CIS countries, including Russia.
AssessmentMass housing privatization is often assessed critically or negatively (e.g., UNECE 2003, Balchin 1997: 243; HFH 2005: 29; Dübel et al. 2006; Tsenkova 2009; Amann 2009; Amann, Hegedüs, Lux & Springler 2012). The following main negative aspects are detected: Rash implementation negated old systems before the new mechanisms were established, particularly condominium legislation and regulations on housing maintenance and management (UNDP1997: 67). This contributed to long-lasting deficiencies in owners’ associations, management and maintenance; in several cases, the negative effects have lasted until today. - - -Privatization diminished affordable rental housing. What was good for the sitting tenants up to that time became a big disadvantage for following generations. If today young households, migrants to the cities, and the poor are confronted with a very difficult housing situation, it is the result of that transitional policy.
Privatization generated plenty of “poor owners,” who are hardly in a position to take over the responsibility linked to their property. Not only can poor owners hardly benefit from the asset of owning an apartment (e.g., as security for business activities), but also they are mainly responsible for the poor effectiveness of condominium management. Being barely able to contribute financially to maintenance and repair of general parts of the buildings, they aggrevate decision-making processes within owners’ associations and cause improvement measures to fail. Orderly housing maintenance works only with a low share of free riders. If there are too many in one building, both decision-making and funding will fail. It is also more difficult to allocate housing allowances to poor owners than to poor renters, as social transfers to them are more difficult to politically justify.- - -It is in question whether mass housing privatization contributed to the rapidly increasing inequality in transitional societies.
28
Figure 9: Housing privatization in the ECA region
Sums are weighted with housing stock.
Source: PRC (2005), Ecorys (2005), Tsenkova (2005), Yemtsov (2007), Hegedüs (2011), Struyk (2000), National Statistical Offices, Housing Statistics in the EU 2010, HFH Global Housing Index, AHML, HFH/IIBW survey 2012, IIBW
0%
10%
20%
30%
40%
50%
0
500
1,000
1,500
2,000
2,500
EC
A 2
3
∑ C
EE CZ
HU PL
SK SI
∑ S
EE AL
BG
HR
RO RS
∑ C
IS AM AZ
KZ
KG
MD
RU TJ UA
Absolute number (1,000)(left scale)
Share of total stock(right scale)

There are arguments supporting this opinion, and others that emphazise the equalizing factor of everybody becoming a homeowner (see Chapter B.2.4, p. 18; Yemtsov 2007: 5).- - -Finally, mass privatization and the rapid increase of ownership rates contributed to the very low housing and labour mobility in ECA countries, which led to negative effects on overall economic development (see Chapter B.1.2, p. 12).
With these issues unresolved, deteriorating privatized housing will in the medium term become a heavy public liability. If private owners resist taking over responsibility for repairs, this responsibility will fall back to the public. Leaving unwilling owners in collapsing structures is no political option. The public wanted to get rid of the responsibility for housing provision of the poor. This proved to be an illusion. Housing for those in need will always be a public service obligation.
But it seems reasonable to also value some positive aspects of privatization. In many individual cases, the underlying core idea of privatization to give households an asset succeeded. Ownership on the inhabited apartment was, in many cases, a starting point for economic well-being. Housing privatization was probably the best visible symbol of the system change to a market economy. It was therefore politically highly rational. Ownership made it easier for many poor households to survive the following economic hardship. In a short-term perspective, this policy relieved social tension as it allowed for low housing costs for large parts of the population. Most ECA countries have housing cost ratios below the EU average (see Chapter C.3, p. 30). With the applied inadequate model of housing privatization, implementation was possible in the short term.
Any complex model, anticipating problems as seen today, would have been much more difficult to implement with a lot of political risks. Finally, housing privatization was quite popular. People enjoyed the opportunity to become the legal owners of their apartments, as it promised security and some economic safeguard. Rapid implementation is therefore understandable.In times of introduction of privatization laws, an increase of ownership rates was a main international trend. Policymakers all over the world believed this to be a core measure for economic development. But differentiation was missing. Among all worldwide policies to increase homeownership, the ECA model of housing privatization was one of the most successful in quantity, but one of the most problematic in quality.
C.2.4 RestitutionOnly some countries (such as the Czech Republic, Slovenia, Poland, Bulgaria, Romania or Albania) used restitution in addition to privatization. Under restitution, the rights of the former owners to regain title to their property took precedence over the rights of sitting tenants to buy the unit through privatisation. This left sitting tenants with limited tenancy rights to their current housing and often without ownership rights to any housing. In some cases, it led to eviction. Restitution provoked many disturbances, mainly because of corrupt practices and the insufficient availability of affordable housing for compensation. It is still under way in some ECA countries, even though it is fading out (HFH 2005:29. UNDP 1997; Council of Europe 2002: 17; Amann, Bejan & Mundt 2012). In countries of the former Soviet Union, restition had hardly any significance.Restitution has a different dimension in post-conflict countries. In Bosnia-Herzegovina, Kosovo or
Tajikistan, restitution rights have been recognised, and laws and procedures have been developed and enforced. Within this process, many displaced people have been able to return to repossess and re-inhabit their original homes, lands and properties (COHRE 2005: 4).
29

27
C.3 HOUSING COSTS
C.3.1 Housing cost inflationPrice inflation in the EU 27 was 2 percent per annum on average from 2005 to 2011, whereas housing costs (CPI housing) increased by 3.3 percent and energy by 5.3 percent per year. This makes a difference. In ECA countries, price inflation was generally higher (see Figure 2, p. 16), but house price inflation exceeded even general inflation. For the five CEE countries, the yearly average price inflation from 2005 to 2011 was 3.2 percent, but housing costs increased by 6.2 percent per year (Table 10, p. 33). Particularly high was the difference between general inflation and housing cost inflation in the Czech Republic and Hungary, each of which had more than 4 percentage points difference on yearly averages.
The consumer price index for the expenditure group “housing” is available only for Russia and the small group of countries covered by Eurostat. For Croatia and Romania, the same pattern applies, with housing cost inflation considerably above the general price increase. For Bulgaria, housing costs did not exceed general inflation. A specific situation is documented for Russia, where the average general inflation between 2005 and 2012 was 10 percent per year, but housing cost inflation was at almost 19 percent on average per year.
As seen in Table 10, the average housing costs of the population in CEE countries is around 64 percent of the EU level, ranging from 60 percent in Hungary and Poland to 72 percent in the Czech Republic. Housing costs are much lower in Romania and Bulgaria, with 32 percent and 42 percent of the EU average, respectively. Turkey is also in this range, with 35 percent of the EU level.
C.3.2 Housing cost ratio below EU averageThe strong housing cost inflation resulted in increased shares of housing expenditures within the budgets of the individual households. In the European average, 24 percent of private consumption is spent on housing. Ten years earlier, it was only 21 percent. The sources for this number are national accounts. It is therefore not a household view on expenditure, but a “top-down” national economics point of view. A different concept is applied by EU-SILC (Statistics on Incomes and Living Conditions), which provides data on housing expenditures based on a large household survey in all EU member and candidate states. This is a “bottom-up” approach from the household point of view. Under this concept, the housing costs of European households (including energy costs) amounted in 2011 to 22.5 percent of disposable household income. The two numbers seem similar, but both sources show some severe inconsistencies. As always, statistical data have to be treated and interpreted with care.
At first sight, the housing cost ratio (national accounts) in the average of ECA countries is below the EU average and has increased at a similar pace within the past decade. The ratio is slightly above the EU average in the CEE countries (24 percent), but only at 22 percent in SEE countries and at 7 percent to 18 percent in those CIS countries where such data are available. The average of all ECA countries is below 21 percent (Table 10). The ratio has increased in a 10-year period by 3 percentage points in both the EU and in the average of the ECA countries.
From a household point of view (EU-SILC data), the majority of ECA countries, for which this database is available, have lower housing expenditures from total disposable incomes than the EU average (with the exception of Hungary).
The relatively low housing cost ratios have the following reasons:Generally, poorer countries have lower housing cost ratios than more-developed countries, because a much higher share of expenditures goes to meet basic needs, in particular food.- - -The intention of mass housing privatization to keep housing costs for much of the population on a low and stable level succeeded (see Chapter C.2.3, p. 27).- - -The ineffectiveness of housing maintenance schemes with hardly any household expenditures on housing management, maintenance and repair has contributed to lasting low housing costs. But it must be clear that this is at the cost of the residents’ welfare and future investment requirements.- - -The old stock of owner-occupied housing, whether owner-occupied from the beginning or privatized, was basically financed without mortgages, and hence has no financing costs at present.- - -The mostly very high house price-to-income ratios for new condominium dwellings seem to have minor influence on the statistics because of the still low quantity of this part of the housing stock.- - -The low housing mobility in most ECA countries — in several cases below 2 percent per year, compared with more than 10 percent, for example, in the USA — is a major break for housing cost development. On the other hand, the low mobility is basically caused by the inaffordability of changing accommodation. Low housing mobility and, hence, labour mobility are assumed to be main barriers for the economic development of ECA countries.
30

C.3.3 Housing cost overburden rateEU-SILC also provides data on the overburden of housing costs. This is defined as spending more than 40 percent of the disposable household income on rents, mortgages, maintenance and energy. This means that a household with a total net income of €1,200 per month has to spend more than €480 for accommodation, including mortgage rates and energy. This seems to be a good indicator of poverty housing. In the EU average, 11.5 percent of households belongs to this category (2011, Table 10, p. 33). This share has decreased slightly since 2005, but has increased again since 2009.
In the EU member and candidate states within the ECA region, the situation differs quite a lot. In several of them, the housing cost overburden rate is below the EU average, particularly in Slovenia, Bulgaria and Slovakia. In Czech Republic, Romania and Hungary, the rate is close to the EU average. But in Poland and Croatia, it is extremely high.
There have been some changes in this rate over the years in several countries. In Bulgaria, housing cost overburden was reduced significantly, from a rate above 15 percent in 2006 to only 6 percent in 2010. In Slovakia, the rate dropped from 18 percent to 8 percent; in Romania, it fell from 19 percent to 10 percent; and in Hungary, it dropped from 18 percent to 12 percent. Other countries have quite stable rates. For example, Slovenia is at a very low level, Czech Republic is at the EU average, and Poland is at a very high level of above 35 percent.
EU-SILC measures housing cost overburden for different tenure types. Table 10 shows the rate for market rental apartments, with again quite diverse results. In the EU average, one out of four
households living in market rental dwellings (26 percent) suffers from financial overburden (housing costs exceeding 40 percent of disposable income). In all CEE countries besides Hungary, this rate is lower. By contrast, in the three SEE countries covered by this statistical source, the rate is much higher, with up to 65 percent in Romania. Data on market rental tenure in these countries suffer from a small sample, as market rental is of quite small volume in all ECA countries (see Table 8, p. 23).
These results allow for the following conclusions:Comprehensive data are available only for a very limited set of ECA countries.- - -Even though housing cost inflation was significantly above general price development in almost all ECA countries, the share of housing costs on total household expenditures could in most countries be kept stable. - - -Several CEE countries have applied successful policies to hamper housing cost inflation and keep it below the development of household incomes.- - -It is considered particularly positive that several CEE countries could reduce their housing cost overburden rate significantly. Housing provision and particularly housing affordability seem to be better today than 10 years ago in many ECA countries.- - -But this rather successful policy had important negative externalities. It was executed at costs of a sustainable management of the existing housing stock, characterized by widespread underinvestment in maintenance and repair. Furthermore, keeping housing costs low was possible only by keeping people at the place where they used to be. The very
low housing mobility in most of the ECA countries is a burden for economic development. And it is a direct result of the housing policy described.
31

29
C.3.4 Rent level in social housingAs described in Chapter C.2.2 (p. 26), social rental housing has an insignificant volume of less than 10 percent of the stock in the majority of ECA countries. This is different for social rental housing in the five CEE countries, with a weighted average above the EU level (13 percent to 11 percent; see Table 8, p. 23). For those countries, some information about rent levels is available, even though it is from 2004 to 2010. In none of these countries does social rental housing cost more than €1 per square meter per month, with a weighted average of 83 cents per square meter (Housing Statistics in the EU 2010, national statistical offices, HFH/IIBW survey 2012). This is obviously far below both market rents and cost coverage rents. It shows quite clearly the positioning of social rental housing in these countries, which mainly targets vulnerable groups and applies the social housing policies of “dual rental markets,” following the classification of Jim Kemeny, who provided an influential approach to structure housing policy schemes by distinguishing integrated/unitary vs. dual rental markets (Kemeny et al. 2005). This concept differs fundamentally from the public-private partnership (PPP) approach successfully applied in many Western European countries (see Chapter E.3.10, p. 61).
C.4 HOUSING MAINTENANCE AND SERVICES
The question of maintenance and management of the existing housing stock is of particular importance, considering the low rate of new construction. Replacing the existing stock is not an option, neither in terms of housing need, nor for economic or legal reasons. Unfortunately, analysis of the housing management and maintenance schemes
in all countries of the ECA region show basic insufficiencies. Management schemes mostly work poorly. Maintenance funding is by far insufficient, and so are refurbishment rates (see Chapter C.1.4, p. 24). Further deterioration of the existing housing stock seems inevitable. Only in the higher developed CEE countries have things started to change.
C.4.1 Trouble with common ownershipThe development of housing management and maintenance is closely related to mass housing privatisation. Condominium legislation was introduced in all ECA countries. The new owners ought to set up owners’ associations (see Chapter C.5.1, p. 35) and reorganise management of their assets by themselves (Hegedüs, et al. 2012: 43). But in many CIS countries, the establishment of owners’ associations is not obligatory, and in most others establishment is hardly enforced.
Establishing owners’ associations is critical, because if these associations are poorly implemented they cannot represent the entire group of owners of one building. In many countries, owners’ associations are not a legal entity and hence cannot act accordingly, for example, in taking loans or running lawsuits against individual owners.
In many cases, privatization did not concern the entire building, including the land below (see Chapter C.2.3, p. 27). It is not just a question of maintenance of common parts of the buildings; it is also about legal rights and obligations for common infrastructure, such as constructive parts, staircases, elevators or roofs. If the involved parties have no legal or contractual relation to one another on this infrastructure, problems with common use are inevitable.
C.4.2 Housing management and maintenanceBefore transition, the multiapartment housing stock was managed by the state, by state or municipal agencies (so-called zheks in former Soviet Union countries), by company-based agencies (in the former Yugoslavia) or by cooperatives. There was no perception of the sitting tenants having responsibility for housing management. This has scarcely changed. The importance of maintenance as a precondition for keeping up the value of the building is still barely understood.
In the course of transition, housing management developed differently. In some countries, such as Russia and Serbia, housing management was continually organised by state management companies. In others, such as Romania and Hungary, the new condominiums had full responsibility for management and maintenance (Hegedüs et al. 2012: 43, PRC 2005). In some CIS countries, such as Armenia, the new concept of owners’ associations gradually transformed to a hybrid with the former state management agencies or zheks (Amann & Komendantova 2010).
Professional private housing management companies are allowed everywhere, but for cost reasons are hardly marketable for the existing housing stock. Aside from existing cooperatives and public services, there are no attempts detected to implement new business models for affordable housing management, for example on a public-private partnership, or PPP, basis (see Chapter E.3.9, p. 61).
In all those forms of housing management, the lowest possible management and maintenance fees are encouraged.
32

EU 27 100 23,6% 22,4% 10,0% 26,3% 3,3%ECA 23 20,8% CEE COUNTRIES TOTAL 61 24,3% 22,1% 24,0% 20,3% 6,2%Czech Republic 73 26,8% 22,5% 9,5% 25,0% 6,9%Hungary 58 22,0% 25,2% 11,3% 49,9% 9,3%Poland 58 24,2% 21,7% 36,4% 10,6% 5,3%Slovak Republic 59 25,3% 20,0% 7,6% 12,6% 4,6%Slovenia 68 19,0% 15,7% 4,7% 18,3% 5,9%
SEE COUNTRIES TOTAL 23,2% Albania 9,5% Bosnia-Herzegovina 22,2% Bulgaria 38 17,7% 18,2% 5,9% 30,8% 5,2%Croatia 30,8% 25.3% 47% 48.4% 5,1%Macedonia 19,0% Romania 32 23,5% 14,5% 9,9% 65,3% 8,9%Serbia 22,9%
CIS COUNTRIES Armenia 10,7% Azerbaijan 6,7% Moldova 17,8% Russia 18.8%Ukraine 9,3% OTHER COUNTRIES Georgia 11,7% Turkey 35 18,9%
Table 10: Housing costs in the ECA region 2011
Data are mostly from 2011, but in a few cases are older.Sums are weighted with GDP (National accounts, CPI) or housing stock (EU-SILC).EU-SILC: Eurostat Statistics on Incomes and Living Conditions.CPI Housing: Harmonized Consumer Price Index for the expenditure group „housing.“
Sources: Eurostat
Ø housing costs, EU27=100
Housing cost ratio (Nat. Accounts)
Housing cost ratio (EU-SILC)
Housing cost overburden ratio (EU-SILC)
Housing cost overburden ratio market rental (EU-SILC)
CPI Housing Ø 2005-2011
----------------------------------------------------------------------------------------------------------------------------------------------------------------
----------------------------------------------------------------------------------------------------------------------------------------------------------------
----------------------------------------------------------------------------------------------------------------------------------------------------------------
------------------------------------------------------------------------------------------------------------------------------------------------------------------
33

31
In Western countries such as Germany or Austria, fees for housing management and maintenance, including a built-up reserve fund for major repairs, sum up to around €3 per square meter per month, with a collection rate of close to 100 percent. In the least-developed ECA countries, such as Armenia, the typical maintenance fee is 2 cents per square meter, with a collection rate close to 50 percent (Amann & Komendantova 2010). But data on maintenance fees are altogether quite difficult to acquire. Particularly in CIS countries, housing management and maintenance is stil perceived as urban service and not as the responsibility of the apartment owners.
The development of effective housing management schemes is hampered by the partly very low purchase power of owners, resulting from giveaway privatization in many countries (Charles Kendall / Eurasylum 2009: 24). Arrears of maintenance fees are easier to handle in social rental housing than in owner-occupied units.
Taking the significance of keeping management and maintenance costs low, different strategies to maintain the buildings have evolved. In many cases, public utility costs, which in the West are included in maintenance fees, are contracted with the individual households, particularly water and sewerage. Costs for energy in common areas (such as lighting and elevators) are often organised by energy providers as an implicit part of individual contracts on energy provision. Housing management is often organised by single owners or semiprofessional individuals who serve a couple of buildings in the neighbourhood. In CIS countries, the old-style zheks still provide low-cost housing management services. Other services such as waste disposal or cleaning of common parts outside the buildings are often provided by the
public, without a clear division between private and public responsibility.
In our survey on all ECA countries, we have found no example of a legal implementation of reserve funds to collect savings for future major repairs. Similar regulations are important pillars of sustainable development and thermal refurbishment of the existing housing stock in several Western countries. In ECA countries, major repairs require full financing from the owners, the public or international donors. In a few cases, energy savings contribute to covering the cost — Energy Savings Companies (ESCOs). Banks are usually reluctant to contract financing of rehabilitation work with owners’ associations, since effective mechanisms between the association and the single owners to claim liens are widely missing (Lujanen 2010). Hence, financing is often possible only if all owners agree. Such investments are therefore rare.
C.4.3 Utility servicesCompared with many poorer countries in the world, CEE and CIS countries have high levels of access to water and wastewater services. However, most of the water infrastructure in these countries was built between 1950 and the 1970s. After the 1970s, very little investment was made in service infrastructure, and that trend worsened after 1990.
Deterioration affects infrastructure for critical services such as water, sanitation and gas, general urban infrastructure, and regional transportation and communications infrastructure. The current stock of infrastructure is in an incipient — if not already steep — decline (UNDP 1997: 5.).
Since the early 2000s, the costs of providing services to households have risen in many CEE and CIS countries, making water and sanitation services unaffordable to many poor families.
Utility services are today organized in different ways. In many CIS countries, they are still mainly provided by the state, whereas in other countries municipalities or private companies take responsibility. Restructuring has taken place in various forms, including privatization, contracting out, and reorganizing the public service companies. These attempts typically resulted in increased costs and prices, while promised investments held off and hence the security of the supply did not improve. In many cases, the negative consequences have outweighed any gains in market efficiency (Charles Kendall / Eurasylum 2009: 16; Council of Europe 2002: 13-14). The situation is often worsened as central and local governments under fiscal pressure had to cut subsidies that had earlier been given to public service providers.
Although access to services varies greatly by country, some regional trends do exist. For example, urban housing is generally much better equipped with utilities than is rural housing.
Discrepancies between the two can be great. Within urban housing, access to water and electricity is more prevalent than access to sewerage and drainage, which is often discharged into open waterways and frequently contaminates water delivery (HFH 2005: 18; World Bank 2003: 48).
A specific challenge is the maintenance of district heating grids. In CIS countries, many urban areas were provided with district heating before transition.
34

Many of these grids have collapsed since then or suffer from massive energy losses caused by long-term underinvestment. In Armenia, for example, the area served by district heating systems decreased by 70 percent between 1990 and 1999. This loss was compensated by a strong increase of gas networks in the early 2000s. This infrastructure is purely commercially driven, with access immediately cut off when payment is delayed.
C.5 HOUSING LEGISLATION
Housing legislation was not a particular policy priority during transition. Nevertheless, housing-related legislation centered on three important areas: property rights, management of condominiums and mortgages/foreclosures (Tsenkova 2011: 26). Condominium legislation was introduced in many ECA countries, but mostly after mass housing privatization. In many cases, this legislation was inadequate to the specific requirements. Social housing legislation and regulations on housing cooperatives are on the agenda in several countries, but have only partly been introduced. Rent legislation is mostly missing.
C.5.1 Condominium legislationThe sharp increase in owner-occupied housing resulting from mass privatization of formerly social rental housing made legislation necessary. CEE and most SEE countries now possess a regulatory and institutional framework comparable to that of Western European countries, but enforcement is often lacking (Roy 2008: 152; UNECE 2005a).
Condominium legislation in ECA countries is characterized by several weaknesses, either in ruling or enforcement:
Legislation was mostly introduced years after mass privatization (Tsenkova 2011: 26). It was not obligatory in a number of countries to set up a legal entity such as a condominium or owners’ association during the process of privatization, and while the homes in multiunit buildings were privatized, the common part of the building remained under state or municipal ownership. In other cases, only the buildings were privatized, while the lot they stand on remained under public ownership (Hegedüs et al. 2012: 43).- - -Condominiums and owners’ associations are mostly weak legal entities. Legal relations between the total of residents and the individual owner are unduly regulated. In many ECA countries, homeowners’ associations have only scattered membership. But effective representation of the interests of all residents require unanimous and obligatory membership in a common legal body.- - -Legal regulations in many cases had to follow facts established by earlier mass privatization. For this reason, regulations on ownership rights are stronger than those on ownership responsibilities. Because of the large number of poor owners and the lack of housing alternatives, regulations that impose consequences on those in arrears on their payment obligations to the owners’ association (e.g., privileged liens) are mostly missing. Rules often require unanimous approval among residents for any building improvements or repairs. Given the number of poor owners within most buildings, this requirement has stifled most attempts at improving the condition of the buildings.- - -The weakness of owners’ associations mainly concerns their responsibilities on commonly used
parts of the buildings, such as structural elements, staircases or roofs (see Chapter C.4.1, p. 32).- - -The terms of housing maintenance are regulated by different laws, but with similar weak enforcement, lacking clear responsibilities, minimum fees for management and maintenance, or regulations on reserve funds. - - -Regulations on ending common ownership in the case of deterioration are entirely missing.- - -Prepayments for new apartments are barely protected if the housing developer goes bankrupt (qualified tools would be bank guarantees or progress payment). - - -
Efficient representation of common interests of all owners in multiapartment buildings is crucial for sustainable development of owner-occupied housing sectors. Present regulations and enforcement in many ECA countries do not provide for this.
35
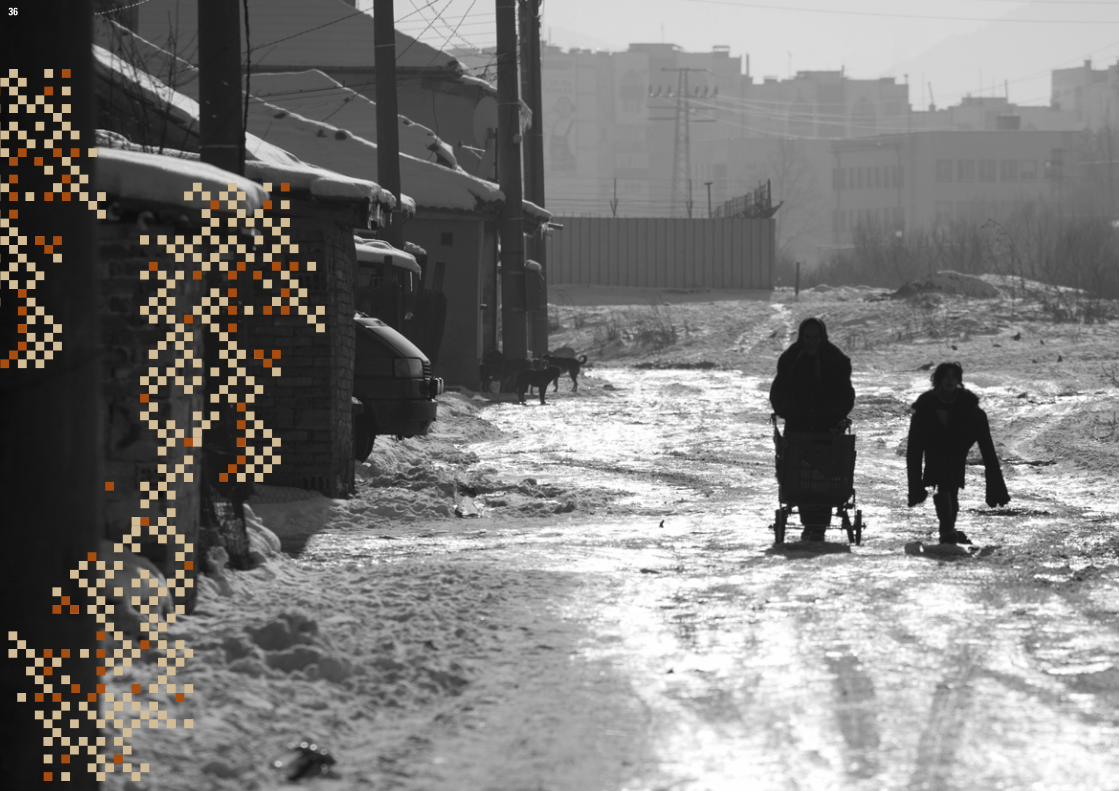
33 36

C.5.2 Rent legislationIn contrast with condominium or mortgage legislation, which was introduced with some priority in most ECA countries, there is still almost no rent legislation in place (UNECE 2005a). In socialist times, rental housing was mostly synonymous with public rental housing, with the state providing consumer protection as politically agreed. An informal rental market was disavowed.
The loss of public rental housing with privatization has strongly increased informal rental housing in all transition countries. But despite rental housing’s significance for providing housing for migrants to the cities and young households, most ECA countries have scarce information on quantity and price levels. Statistics refer mostly to the legal status of tenancy. Hence, informally rented private apartments are often recorded as owner-occupied dwellings. It may be estimated that 10 percent to 20 percent of the residents of typical urban areas live in informally rented apartments.
In several Western countries, the regular private rental sector also covers social issues. An innovative model is the German comparative rent list system, which replaces rent control with a high level of transparency of local housing markets. Quite common in many Western European countries is the use of housing allowances for private rental dwellings for low-income households. For transition countries, drawing on the private rental sector for social housing issues is critical because of its highly informal functioning (Amann, Hegedüs, Lux & Springler 2012).
In most transition countries, there is not much emphasis on regularizing informal rental sectors. There are different reasons for this. First, landlords
oppose it. Apartments for rent are important investment opportunities in an economic environment with a limited supply of capital market investment products. Such business interests often have strong lobbies in politics and media. In other industries, well-established producers advocate for strict legal regulations or technical standards, as this may give them competitive advantages. In renting out single apartments, this argument does not seem to apply. Secondly, enforcing regularisation is difficult. Policymakers may doubt whether the fiscal benefit exceeds the political costs. Thirdly, the informal rental market covers the needs of many poor households. Regularisation would make such apartments more expensive. This would lead to additional state obligations to provide affordable accommodations for these groups.
On the other hand, efficient rent regulations may substantially contribute to the social and economic development of transition countries: Regulations on terms of rent contracts, rights and obligations of the tenant and the lessor, termination of the contract, or terms of eviction are important aspects of consumer protection.- - -The effectiveness of price control regimes is disputed. On one hand, they may contribute to affordability. On the other hand, they distort market mechanisms. Several CEE countries, such as the Czech Republic and the Slovak Republic, have maintained strict rent ceilings for old contracts, often in context with restitution. This led to extremely uneven conditions of tenants, with particular discrimination against young households and harsh tenant-landlord conflicts (Amann, Hegedüs, Lux & Springler 2012). As a consequence, the Czech Republic phased out those regulations until 2012. Rent ceilings in public rental housing in several ECA countries have
strongly fueled privatization, because those housing stocks could not cover the cost of maintenance. Rent setting seems legitimate, particularly for apartments that were built or transferred to private ownership with public support. This is particularly the case for privatized dwellings at giveaway prices (Amann & Mundt 2010b). Mechanisms to increase market transparency, such as the German comparative rent lists, seem more effective than placing fixed caps on rent amounts. But they require highly developed markets with plenty of available statistical data. - - -Effective rent regulations may contribute to professionalism of the real estate sector, particularly regarding housing administration and maintenance.- - -Taxation of rents may evolve into important fiscal incomes.- - -Last but not least, the regularisation of private rents is an indispensable precondition for establishing models of new rental housing construction, for example, with a public-private-partnership approach (see Chapter E.3.10, p. 61). Such models have to consider full capital costs plus costs for management and maintenance, and they can hardly compete with informal rents in the (privatized) existing housing stock unless they are excessively subsidized (such as new public housing construction in several CEE countries).
Rental markets in all transition countries are quite intransparent, with some very low rents in the residual public housing sector and quite high rents in parts of the private market (see Chapter C.3.4, p. 32, and D.3.3, p. 51). Huge gaps and a lack of reliable statistical data impede regulations.
37

35
C.5.3 Social housing legislationSocial housing laws have been introduced in several countries of the ECA region, mainly defining beneficiaries of subsidized housing, conditions of social housing construction, and funding. The drivers for the establishment of social housing legislation included the EU Stability Pact for South Eastern Europe, which provided housing policy action plans for several countries in the region. In addition, the Council of Europe Development Bank, or CEB, has initiated social housing legislation, since this is one precondition for the bank’s soft loans.
C.5.4 Mortgage legislationMost countries in the ECA region have introduced mortgage legislation, which was a precondition for the upturn of mortgage financing products since the early 2000s (see Chapter D.4.5, p. 54). One important aspect of mortgage legislation is the regulation of foreclosure procedures in the case of arrears. This is where a gap is detected between legislation and enforcement. Because of different customs and practices and conflicting regulations on the right of housing, such procedures are still untested in several countries, such as Romania (Amann, Bejan & Mundt 2012).
C.5.5 Consumer protection in housingLack of consumer protections affects both rentals and owner-occupied housing. In the absence of rent legislation in most ECA countries (see above), most tenants have only contract regulations, if anything, to protect them. Further rent regulations are widely missing (Amann, Hegedüs, Lux & Springler 2012). Protection against evicition is critical for vulnerable households (see Chapter C.6, p. 38). But an effective eviction policy also must protect landlords, owners’ associations and financing institutions against
tenants who fail to pay rents or owners in arrears. Both aspects seem unsolved in many ECA countries. For example, in Romania, tenants can be evicted only under an irrevocable court decision, but this rarely happens, as mayors try to avoid such practices because of their low popularity (Amann, Bejan & Mundt 2012).
In the owner-occupied sector, the lack of legislation leads to an excessive amount of risk for purchasers who are inadequately protected in terms of completion of the property, timing of transfer or ultimate purchase price (Rabenhorst, Mihalache 2007: 27). This is particularly risky when a housing developer declares bankruptcy before legally handing over the prepaid apartment. Only occasionally do housing companies provide bank guarantees to safeguard early payments.
C.6 HOUSING VULNERABILITY
The most disadvantaged groups in regard to affordability and access to adequate housing are, according to EU definition (listed in descending order), (1) unemployed or otherwise economically inactive people and families; (2) single parents with young children; (3) young people living alone; (4) retired people, especially if living alone; (5) households with three or more children; and (6) single parents with one child (HFH 2005: 20). The Council of Europe proposes a different list: (1) marginalized homeless, substance abusers and battered women; (2) immigrants and refugees; (3) one-earner income, unemployed and nonworker families; (4) single-parent households; (5) young people in their first-time employment and first independent housing; and (6) elderly low-income
households in old housing (Council of Europe 2002: 14).
Hence, ethnicity, gender and age are the three predominant demographic factors cited as influencing access to housing. Particular concern is expressed for the housing welfare of the Roma population, considered the largest excluded and vulnerable group in Central and Eastern Europe (CPRC 2005: 84, see Chapter C.6.5, p. 42).
C.6.1 Is there a housing poverty trap?Obviously, poverty influences housing provision. But it is quite an interesting question whether it is also the other way around: Are poor housing conditions a primary cause for poverty, and do they contribute to a poverty trap? (Angel 2000: 112; HFH 2005: 23; Banerjee & Duflo 2011: 183) This question includes the following aspects:
When housing costs go up for those with few economic resources, household income available for other basic needs goes down. This issue is highly relevant in most ECA countries. Many poor people living in low-standard buildings are particularly affected by the current rise of energy prices. Unexpected strong increases of housing costs in several CEE and SEE countries were caused by foreign currency loans being used to finance housing purchases.
Devaluation of the local currencies has increased payment obligations for many households drastically, such as in Hungary or Romania. - - -
38
Adequate housing is linked with physical and mental health, the ability to acquire and maintain employment, and children’s capacity to succeed in school. - - -Many ECA countries are characterized by very low housing mobility. People decide not to move because the value of their property is not enough to allow them to enter the housing market in a more prosperous urban region. The resulting low labour mobility affects both individual income opportunities and the general economic development of transition countries. - - -Informal settlements do not allow for property titles. This excludes residents of settlements from most financing products for housing rehabilitation, business startups, etc. (de Soto 1993). - - -One of the main troubles of homeless people is the lack of an official address, which excludes them from entering into the formal labour market and state aid. - - -Adequate housing is a precondition for specific household incomes. A substantial part of the investment made to set up a microenterprise goes into the premises. Without the asset of an adequate dwelling, many poor families are unable to act entrepreneurial. Housing also has the potential to be an income-generating asset, either by being rented out or by increasing in market value at the time of sale (HFH 2005, 23).
These considerations suggest the existence of a poverty trap caused by housing. Nevertheless, this issue requires further research.
In many ECA countries, poverty housing becomes a burning question because of the development of extreme poverty, strongly increasing housing and energy costs, deterioration of the existing housing stock, insufficient legal regulations concerning poor owners, inefficient housing markets, and low housing mobility. Substandard housing is considered both a cause and a result of poverty; improving housing is imperative to alleviating poverty and its worst manifestations.
C.6.2 Homelessness The incidence of homelessness has increased throughout Europe and Central Asia since 1990, even in those countries that have experienced economic growth. This phenomenon is attributed to reductions in social housing, increased costs of housing for the poor, higher eviction rates, and new and covert forms of substandard housing (Edgar, Doherty & Meert 2002: 3).
FEANTSA, the European Federation of organisations working with the homeless, has defined 13 operational categories of homelessness, which proved to be purposive (feantsa.org). The European Typology of Homelessness and housing exclusion, or ETHOS, distinguishes between:
Roofless: (1) People living rough, living in the streets or public spaces. (2) People in emergency accommodation.- - -Houseless: (3) People in accommodation for the homeless. (4) People in women’s shelters. (5) People in accommodation for immigrants. (6) People due to be released from institutions.
(7) People receiving longer-term support (because of homelessness). - - -Insecure: (8) People living in insecure accommodation.(9) People living under threat of eviction.(10) People living under threat of violence.- - -Inadequate: (11) People living in temporary/nonconventional structures.(12) People living in unfit housing. (13) People living in extreme overcrowding.
39
37
C.6.3 Housing situation of refugees and IDPs
Wars and violence cause plenty of negative effects in terms of housing: (1) A huge volume of housing and infrastructure is destroyed. Since 1991, approximately 1 million housing units all over Europe have been destroyed or badly damaged because of war (HFH 2005: 37). (2) War causes an exodus of people seeking safety, either in other parts of the same country (Internally Displaced Persons - IDPs) or in other countries (refugees). (3) War affects construction and the institutional setting of a country. As seen in many examples, housing construction lags behind in warring countries even years after the conflicts. The same is true for housing maintenance and repair of the remaining housing stock. (4) Impoverishment of big parts of the population renders even well-functioning housing markets unable to meet the need for housing. (5) Violence in rural areas contributes to rapid urbanization and increases pressure on urban housing stocks, often expressed through the growth of informal settlements on the urban fringes. (6) Displacement caused by violence causes complicated property rights questions regarding housing.
Up to 2.5 million people were displaced at the end of 2011 in Europe, the Caucasus and Central Asia because of conflict, human rights violations or generalised violence. They made up nearly 10 percent of the global internally displaced population. The majority had been displaced by conflict in the 1990s during the breakup of the Soviet Union and Yugoslavia, or by conflict between Turkish government forces and the Kurdish
PKK. Internal displacement affects virtually all SEE and CIS countries covered in this report. In Southeastern Europe, this includes Albania, Bosnia and Herzegovina, Bulgaria, Croatia, Macedonia, Montenegro, Romania, and Serbia. In CIS countries, this includes Armenia, Azerbaijan, Belarus, Kazakhstan, Kyrgyzstan, Moldova, Russia, Tajikistan, Ukraine and Uzbekistan. Georgia and Turkey also fall under this category. Turkey had the highest number of IDPs, while Azerbaijan, Georgia and Serbia had the highest percentage relative to their population. The number of IDPs has gradually decreased during the past decade in Armenia, Bosnia and Herzegovina, Croatia, Kosovo, Kyrgyzstan, the Russian Federation, and Serbia, but it has remained stable in Azerbaijan, Georgia, Turkey, Turkmenistan and Uzbekistan (IDMC 2011: 61).
Displaced people often build shack housing in informal settlements on the periphery of villages and cities, move in with relatives, stay in refugee camps provided by the international community, or crowd into abandoned apartment buildings or hotels. Basic services such as water and heating are seldom accessible for them. Many IDPs become trapped in protracted displacement (Council of Europe 2003: 5).
The perspective of EU accession has motivated some European countries to develop sustainable solutions for IDPs in order to comply with EU human rights standards. In 2012, the Western Balkan countries Bosnia and Herzegovina, Croatia, Montenegro and Serbia, in cooperation with OSCE, UNHCR and the EU Commission, initiated a Regional Housing Programme to provide housing solutions to 74,000 individuals with estimated investment costs of almost €600 million within a five-year period. The Balkan Wars of the 1990s created 3 million IDPs,
and it is estimated that half a million of them remain displaced throughout the region (coebank.org).
C.6.4 Roma housing
“Roma” refers to a heterogeneous, stratified, geographically and linguistically diversified ethnic minority in many countries. In ECA countries, the Roma population is estimated at 12 million people, with the biggest shares of population in Romania (7 to 9 percent) and Bulgaria. But the demographic and housing situation of the Roma population is also a challenge in Albania, Bosnia and Herzegovina, Hungary, Macedonia, Montenegro, Serbia, and Slovakia. Although each country has its own characteristics, housing that fails to meet adequate living standards is a common issue facing many Roma in these countries.
The World Bank has called the Roma situation “the biggest challenge to poverty alleviation in Central and Eastern Europe.” The poverty of the Roma is closely related to housing, as Roma people often live in informal or illegal settlements on the outskirts of cities and villages. Housing quality in these settlements is substandard; services are few; and access to electricity, gas, water, sanitation and sewerage is limited. The Roma face a series of specific obstacles, including lack of information, restrictions and discriminatory criteria, which impede their access to social housing. A comprehensive analysis on Roma housing is provided by Berescu, et al. (2012) on case studies on Hungary, Romania and Serbia. The issue is widely unsolved in most ECA countries (see Chapter E.3.14, p. 63) (Berescu, et al. 2012: 99; ERRC 2010; HFH 2005: 21; Molnár, et al. 2012).
40

In June 2013, civil society organizations in Europe published a shadow report on the implementation of National Roma Integration strategies in the EU. The recommendation part of the report encourages a focus on the four areas where EU leaders signed up to common goals for Roma integration: access to education, employment, health care and housing. For putting together the targeted actions, it is important to allocate not only EU but also national-, private- and third-sector funds to Roma inclusion. (Habitat for Humanity contributed to the housing section of the report; the full text can be found on www.romadecade.org).
41

39
C.6.5 Housing for elderly peopleIn some ECA countries, such as Russia, life expectancy has dramatically decreased during transition. The change of mainstream ideology has strongly affected those socialised in the communist era. People who were in their 40s or older when socialist regimes collapsed had severe hardship to integrate into the new labour market conditions. A huge portion of the population was excluded from the official workforce and have resigned their attempts to return. Transition of labour markets and welfare regimes were particularly discriminatory for those who are elderly today. They face low, insecure and often informal incomes and pensions with a much lower purchase power compared with those before transition. Whereas the 50 and older generation in many Western countries are one of the wealthiest strata in society, the opposite is true in all transition countries. This generation is definitely the loser of transition.
In this situation, elderly people have no access to the housing market. Social housing may be accessible — where it is available. There is hardly any supply of homes for the elderly, particularly those with low or moderate incomes. New construction of homes for the elderly is at a very low level. Social services targeting elderly people, such as “meals on wheels” or mobile medical care, are also poorly developed.
C.7 ENVIRONMENTAL AND PLANNING ISSUES
As described in Chapter C.1.3 (p. 24) the energy efficiency of the existing housing stock is altogether poor, and thermal refurbishment rates are low. The environmental situation related to housing is also affected by poor utility services. Deficient waste disposal services spoil urban landscapes. Washed by
the rain into rivers, this litter also spoils lakes and the sea. Similarly problematic is insufficient purification of sewage. In many cases, seaside locations are heavily contaminated with litter coming from residential areas and wastewater. This hinders recreation and tourism as important levers of economic development.
C.7.1 Natural and man-made disastersIn the past decade, most major natural disasters have hit countries outside the ECA region. Nevertheless, there is high earthquake vulnerability in Armenia and the Western Balkans. Many countries in SEE and CIS are still affected by wars of the 1990s and 2000s. Refugees and IDPs are still serious problems in the Western Balkans and the Caucasus region. The housing situation of refugees and IDPs is described in Chapter C.6.4 (p. 40). Strategies to solve these problems are the subject of Chapter E.3.15 (p. 64).
The 2011 U.N. “Report of the Special Rapporteur on Adequate Housing as a Component of the Right to an Adequate Standard of Living” focuses on housing policy answers to natural and man-made disasters. Vulnerability is widely recognized as an important element in disaster risk reduction and management.
The most vulnerable groups of population, such as those living in poverty or with insecure tenure, are more likely to live in disaster-prone areas. They also are at greater risk of displacement and loss of livelihood in the event of a disaster, and they will recover with more difficulty from the disaster (U.N. Special Rapporteur 2011).
C.7.2 Deficient urban planningHousing construction in many SEE and CIS countries suffers from inefficient urban planning procedures. In many cases, metropolitan areas
expanded substantially without updating urban plans and building regulations. This led to widely chaotic urban developments, urban sprawl and informal construction. In several CIS countries, master plans have not been updated at all since transition. Regularisation of informal settlements is widely unsolved (see Chapter C.1.5, p. 25) (UNECE 2010a: 36; Tsenkova 2009; Amann/Tsenkova 2011).
C.8 INSTITUTIONAL SETTING
C.8.1 Decentralisation of housing policyIn many transition countries, reorganization of state authorities led to a shift of responsibility for housing policy to the municipalities. This shift of authority was driven by the idea that social policy would work more effectively if allocated close to the citizens. In terms of housing policy, decentralisation concerned housing privatization, maintenance and new social housing construction, but local governments were seldom adequately prepared to assume these responsibilities. Privatisation was mainly driven by the government interest to get rid of costly obligations. It was almost never intended to be used to acquire funds for new social housing construction. There was a fear among small municipalities that their social housing programs would lead to immigration of poor people from other municipalities, which would increase social tensions. Small local governments thus tend to “export” problems to other places rather than solve them. This “paradox of decentralization” especially hurt people in very acute housing need, such as the homeless or Roma households. Basically, decentralization meant empowering local authorities with supplementary tasks without providing them appropriate financial means (UNECE, 2001: 52; Amann/Komendantova, 2010; Amann, Hegedüs, Lux & Springler 2012).
42

C.8.2 Municipalities as social housing providersIn transition countries, the typical social landlords are the public management companies owned by municipalities. Their financial sustainability depends on the rent policy of a country, which is governed either on the national level (for example, in the Czech Republic until 2012) or the local level (for example, in Hungary), along with maintenance and operation schemes.
In most CEE and a few SEE and CIS countries, decentralisation and responsibility for social housing construction was accompanied by the establishment of state housing funds or similar institutions providing subsidy programs for municipal housing construction (see Chapter D.4.4, p. 54). But in many other countries, decentralisation did not go hand in hand with respective allocation of funds. Municipalities are in many cases disinterested in expanding social housing, as the fiscal burden of new social rental housing competes with other municipal responsibilities, such as education, health and infrastructure.
For social housing programs, the central governments typically impose certain conditions in terms of rent setting, allocation and construction. Maximum rents are defined either as percentage of the “replacement value” (as in Poland), as percentage of market value (as in the Czech Republic until 2012), on the basis of cost-coverage (as in Hungary or the Czech Republic until 2002) or were linked to the disposable family income (as in Romania). The actual rents are set by the local governments and are often below the defined limit, since local governments are uncertain about the tenants’ ability to pay (Amann, Hegedüs, Lux & Springler 2012).
C.8.3 Housing cooperativesHousing cooperatives today provide a variety of legal relations to their members. In some cases, cooperative housing is closly related to rental housing and hence clearly part of the social rental sector. In other cases, membership rights — and hence the exclusive right of use of an apartment — can be swapped or sold at market conditions. In some countries, cooperative members even have a right to change their organisation into an owners’ association. It is therefore not evident whether cooperative housing shall be dedicated to social rental or owner-occupied housing.
Housing cooperatives were important institutions in several ECA countries before transition. But in many cases the originally strong participation of tenants in such grassroots organisations was erased by the mid-20th century when such cooperatives were transferred to state ownership under communist regimes (such as in the Czech Republic). In several countries, these cooperatives developed in socialist times to major providers of affordable housing. After the fall of the communist regimes, cooperative housing was subject to privatization to the sitting tenants.
The models of privatization varied considerably (see Chapter C.2.3, p. 27), but the results were similar. With few exceptions (including Poland and the Czech Republic), rent-oriented cooperatives disappeared and ownership-oriented cooperatives basically transformed to housing management organisations.
Cooperatives did not recover as producers of new affordable housing — rental or owner-occupied — in any ECA country. The manifold trials to revive this sector failed despite substantial international support. In several countries, new housing cooperative
legislation was introduced (for example, Croatia). The reasons for failure require further investigation. Ownership-oriented cooperative housing probably is not distinguished clearly enough from commercial owner-occupied housing. Rent-oriented cooperative housing, on the other hand, requires substantial subsidies to flourish. But adequate subsidy programs are nowhere in place (Amann & Mundt 2011: 95).
C.8.4 Public - private partnership models on affordable housingNonprofit or limited-profit housing associations play a major role in affordable housing provision in many countries in Asia and Western and Northern Europe, with very good financing conditions from own equity, sector guarantee funds, subsidies and the capital market. Examples are the Dutch Woningcoporaties; the Austrian Limited Profit Housing Associations, or LPHA; the French Housing at Moderated Rents, or HLM; and the Swedish municipal housing companies.
It is difficult to explain why hardly any model with similar ecnomic sustainability could be introduced in an ECA country 20 years after transition. The introduction of such schemes in the West after World War II was characterized by a strong commitment from the public, both institutional and financial. Up to that time, the markets were not able to provide sufficient quantities of housing. Today, the higher capacities of the markets function as though other allocation schemes are unnecessary. Obviously, this is not the case. Market allocation cannot satisfy all housing needs, particularly the need for affordable and rental housing.
43
41
There were several attempts, most of them supported by European donor organizations, to establish new nonprofit or limited-profit associations to provide apartments for rent. The most successful attempt in the early years of transition was Poland’s TBS (housing association) program, which was based on the French HLM model. The rents for TBS housing were set by the municipal councils but could not be higher than 4 percent of the construction cost per year (replacement value). The program was not exclusively aimed at lower-income groups. Because the 30 percent downpayment frequently was provided by the tenants, selection followed their ability to pay. Consequently, the tenants considered themselves quasi-owners. This led to criticism of the program because of its insufficient social targeting and excessive public costs. The total volume of the TBS program amounted to 10 percent of total housing construction in 2001, but it has since expired.
Slovakia tried to implement a limited-profit housing sector with a Law on Non-Profit Organisations and a cooperation with the Netherlands’ Matra grant program. Subsidies and tax benefits apply only to housing associations predominantly owned by municipalities, tightened with excessive control mechanisms and very low building cost caps. Implementation proved difficult. Consequently, only two associations with altogether quite limited activities have been founded. Currently, a limited-profit housing association in Armenia has been established through a similar cooperation with the Dutch social housing sector.
In the former Yugoslavia, affordable housing provision was organised with Solidarity Funds for Housing Construction. Enterprises, institutions and state bodies were legally required to collect a percentage of salaries to provide housing for
employees. But in 2001, the legal basis for these funds was abolished, and social housing development organisations ceased to exist. In Serbia, some of these funds were transformed into municipal housing agencies, which are regarded as the basic implements of a future social housing system, as defined by the Social Housing Law of 2008. In the framework of the UN-HABITAT-granted Settlement and Integration of Refugees Programme, or SIRP, seven such agencies established low-rent dwellings for vulnerable households with highly subsidized loans on a nonprofit basis. In Montenegro, a Fund for Solidarity Housing Development, or CFSSI, was re-established in 2008 on a not-for-profit basis in a social partnership approach, with the government, the trade unions and the federation of employers as shareholders. CFSSI mainly provides affordable owner-occupied dwellings, but it has also started with rent and leasing schemes, following an Austrian model (Amann, Hegedüs, Lux & Springler 2012; Amann & Lawson 2012; Czischke 2009; Tsenkova 2005; World Bank 2006).
The re-establishment of affordable rental housing sectors with partnership models between public and private entities is returning to the political agenda in several transition countries, as described in Chapter E.3.10 (p. 61).
44
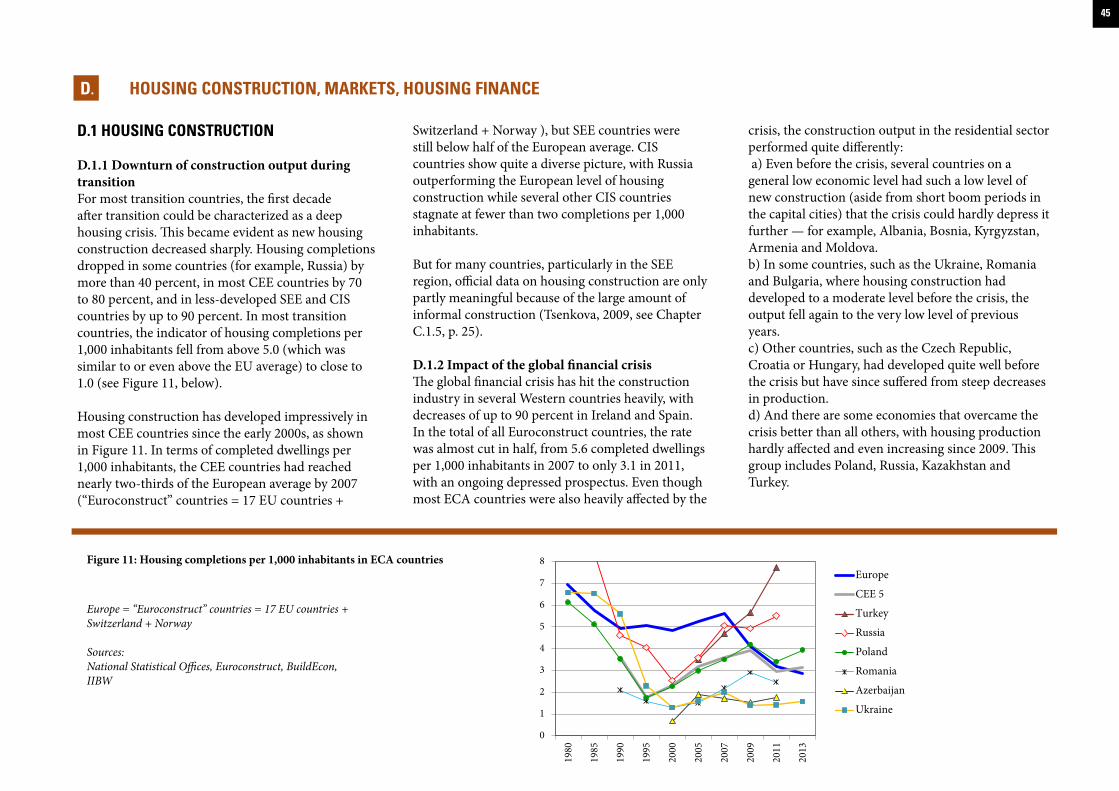
D.1 HOUSING CONSTRUCTION
D.1.1 Downturn of construction output during transitionFor most transition countries, the first decade after transition could be characterized as a deep housing crisis. This became evident as new housing construction decreased sharply. Housing completions dropped in some countries (for example, Russia) by more than 40 percent, in most CEE countries by 70 to 80 percent, and in less-developed SEE and CIS countries by up to 90 percent. In most transition countries, the indicator of housing completions per 1,000 inhabitants fell from above 5.0 (which was similar to or even above the EU average) to close to 1.0 (see Figure 11, below).
Housing construction has developed impressively in most CEE countries since the early 2000s, as shown in Figure 11. In terms of completed dwellings per 1,000 inhabitants, the CEE countries had reached nearly two-thirds of the European average by 2007 (“Euroconstruct” countries = 17 EU countries +
Switzerland + Norway ), but SEE countries were still below half of the European average. CIS countries show quite a diverse picture, with Russia outperforming the European level of housing construction while several other CIS countries stagnate at fewer than two completions per 1,000 inhabitants.
But for many countries, particularly in the SEE region, official data on housing construction are only partly meaningful because of the large amount of informal construction (Tsenkova, 2009, see Chapter C.1.5, p. 25).
D.1.2 Impact of the global financial crisisThe global financial crisis has hit the construction industry in several Western countries heavily, with decreases of up to 90 percent in Ireland and Spain. In the total of all Euroconstruct countries, the rate was almost cut in half, from 5.6 completed dwellings per 1,000 inhabitants in 2007 to only 3.1 in 2011, with an ongoing depressed prospectus. Even though most ECA countries were also heavily affected by the
crisis, the construction output in the residential sector performed quite differently: a) Even before the crisis, several countries on a general low economic level had such a low level of new construction (aside from short boom periods in the capital cities) that the crisis could hardly depress it further — for example, Albania, Bosnia, Kyrgyzstan, Armenia and Moldova. b) In some countries, such as the Ukraine, Romania and Bulgaria, where housing construction had developed to a moderate level before the crisis, the output fell again to the very low level of previous years. c) Other countries, such as the Czech Republic, Croatia or Hungary, had developed quite well before the crisis but have since suffered from steep decreases in production. d) And there are some economies that overcame the crisis better than all others, with housing production hardly affected and even increasing since 2009. This group includes Poland, Russia, Kazakhstan and Turkey.
HOUSING CONSTRUCTION, MARKETS, HOUSING FINANCED.
Europe = “Euroconstruct” countries = 17 EU countries + Switzerland + Norway
Sources: National Statistical Offices, Euroconstruct, BuildEcon, IIBW
Figure 11: Housing completions per 1,000 inhabitants in ECA countries
45
0
1
2
3
4
5
6
7
819
80
1985
1990
1995
2000
2005
2007
2009
2011
2013
Europe
CEE 5
Turkey
Russia
Poland
Romania
Azerbaijan
Ukraine

43
The regional development of housing outputs is shown for the CEE region in Figure 12, for SEE in Figure 13 and for the CIS region in Figure 14.
Altogether, the housing construction output differs greatly among the ECA countries, from far below 1 housing completion (in Georgia, Bosnia-Herzegovina, Albania, Moldova and Armenia) to almost 8 (in Turkey). See Figure 15, below.
46
Figure 14: Housing completions per 1,000 inhabitants in CIS countries
Figure 15: Housing completions per 1,000 inhabitants, 2011
Figure 12: Housing completions per 1,000 inhabitants in CEE countries
Figure 13: Housing completions per 1,000 inhabitants in SEE countries
Figures 12 - 14Europe = “Euroconstruct” countries = 17 EU countries, Switzerland and NorwaySources: National Statistical Offices, Euroconstruct, BuildEcon, IIBW
Sums weighted with GDP.Sources: National Statistical Offices, Euroconstruct, BuildEcon, HFH/IIBW survey 2012, UNECE country profiles, Hegedüs, Lux & Teller 2012, IIBW estimates
3.1
3.7
3.0 2.7
1.3
3.4
2.7
4.4
2.2
0.4 0.3
2.1
3.4
2.12.5
2.6
4.3
0.6
2.0
3.3
1.2
0.5
5.5
1.5 1.4
2.0
0.3
0
1
2
3
4
5
6
EU
27
EC
A 2
3
∑ C
EE CZ
HU PL
SK SI
∑ S
EE AL
BA
BG
HR
MK
RO RS
∑ C
IS AM AZ
KZ
KG
MD
RU TJ UA UZ
GE TR
7,7
0
1
2
3
4
5
6
7
8
1980
1985
1990
1995
2000
2005
2007
2009
2011
2013
Europe
CEE 5
Poland
Slovenia
Slovakia
Czech Rep.
Hungary
0
1
2
3
4
5
6
7
1985
1990
1995
2000
2005
2007
2009
2011
2013
Europe
Russia
Kazakhstan
Azerbaijan
Ukraine
Kyrgyzstan
Tajikistan
Armenia
Moldova
0
1
2
3
4
5
6
7
1985
1990
1995
2000
2005
2007
2009
2011
2013
Europe
Croatia
Serbia
Romania
Bulgaria
Albania
Bosnia-Herzegovina
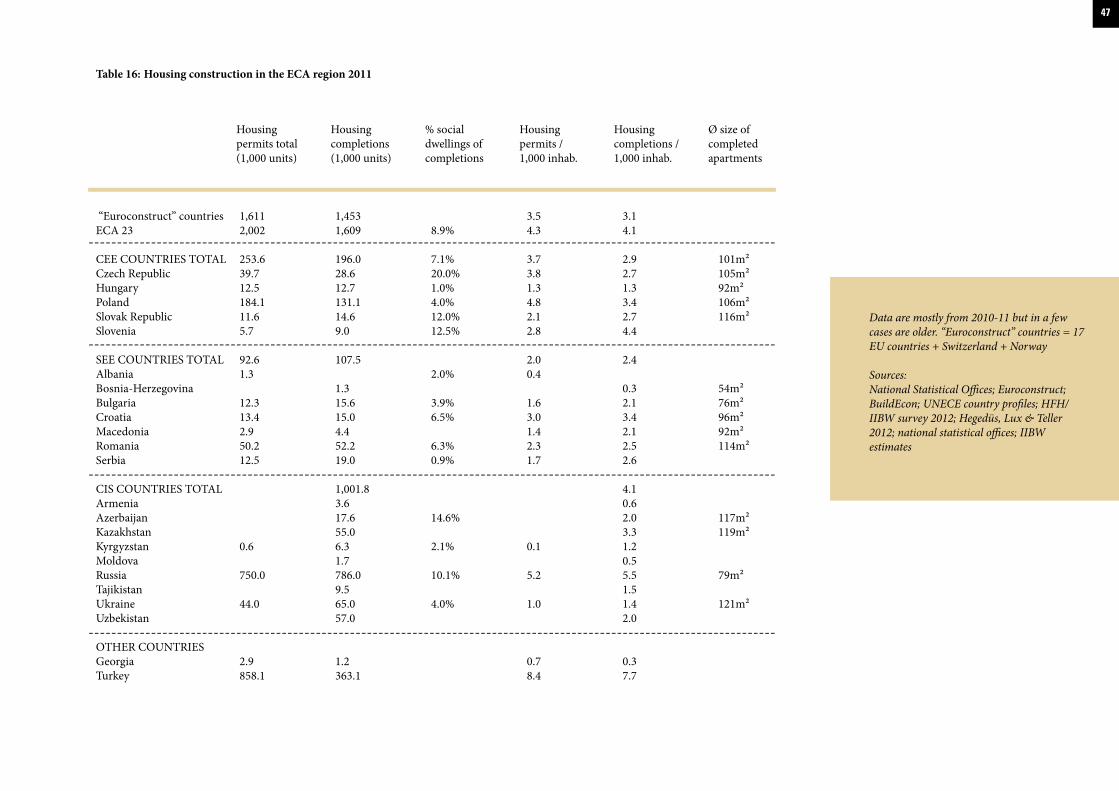
Table 16: Housing construction in the ECA region 2011
“Euroconstruct” countries 1,611 1,453 3.5 3.1 ECA 23 2,002 1,609 8.9% 4.3 4.1
CEE COUNTRIES TOTAL 253.6 196.0 7.1% 3.7 2.9 101m²Czech Republic 39.7 28.6 20.0% 3.8 2.7 105m²Hungary 12.5 12.7 1.0% 1.3 1.3 92m²Poland 184.1 131.1 4.0% 4.8 3.4 106m²Slovak Republic 11.6 14.6 12.0% 2.1 2.7 116m²Slovenia 5.7 9.0 12.5% 2.8 4.4
SEE COUNTRIES TOTAL 92.6 107.5 2.0 2.4 Albania 1.3 2.0% 0.4 Bosnia-Herzegovina 1.3 0.3 54m²Bulgaria 12.3 15.6 3.9% 1.6 2.1 76m² Croatia 13.4 15.0 6.5% 3.0 3.4 96m²Macedonia 2.9 4.4 1.4 2.1 92m²Romania 50.2 52.2 6.3% 2.3 2.5 114m²Serbia 12.5 19.0 0.9% 1.7 2.6
CIS COUNTRIES TOTAL 1,001.8 4.1 Armenia 3.6 0.6 Azerbaijan 17.6 14.6% 2.0 117m²Kazakhstan 55.0 3.3 119m²Kyrgyzstan 0.6 6.3 2.1% 0.1 1.2 Moldova 1.7 0.5 Russia 750.0 786.0 10.1% 5.2 5.5 79m²Tajikistan 9.5 1.5 Ukraine 44.0 65.0 4.0% 1.0 1.4 121m²Uzbekistan 57.0 2.0
OTHER COUNTRIES Georgia 2.9 1.2 0.7 0.3 Turkey 858.1 363.1 8.4 7.7
Data are mostly from 2010-11 but in a few cases are older. “Euroconstruct” countries = 17 EU countries + Switzerland + Norway
Sources: National Statistical Offices; Euroconstruct; BuildEcon; UNECE country profiles; HFH/IIBW survey 2012; Hegedüs, Lux & Teller 2012; national statistical offices; IIBW estimates
Housing permits total (1,000 units)
Housing completions (1,000 units)
% social dwellings of completions
Housing permits /1,000 inhab.
Housing completions / 1,000 inhab.
Ø size of completed apartments
-------------------------------------------------------------------------------------------------------------------------
-------------------------------------------------------------------------------------------------------------------------
-------------------------------------------------------------------------------------------------------------------------
-------------------------------------------------------------------------------------------------------------------------
47
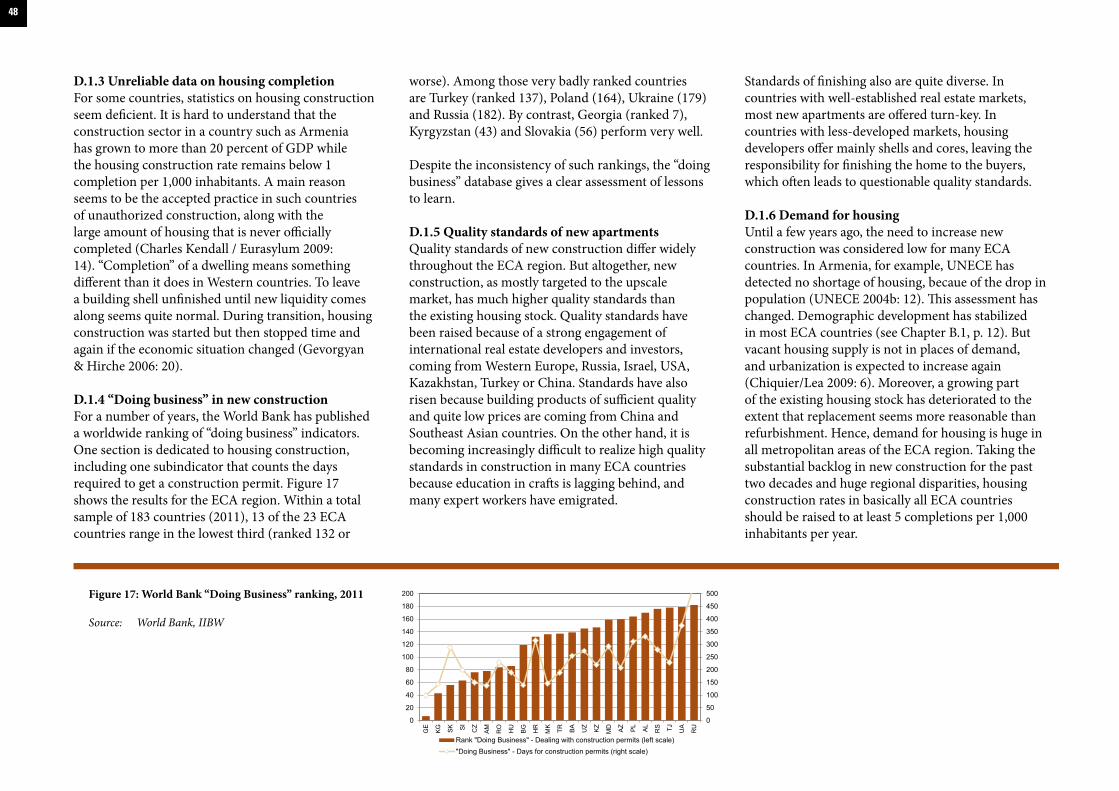
45
D.1.3 Unreliable data on housing completionFor some countries, statistics on housing construction seem deficient. It is hard to understand that the construction sector in a country such as Armenia has grown to more than 20 percent of GDP while the housing construction rate remains below 1 completion per 1,000 inhabitants. A main reason seems to be the accepted practice in such countries of unauthorized construction, along with the large amount of housing that is never officially completed (Charles Kendall / Eurasylum 2009: 14). “Completion” of a dwelling means something different than it does in Western countries. To leave a building shell unfinished until new liquidity comes along seems quite normal. During transition, housing construction was started but then stopped time and again if the economic situation changed (Gevorgyan & Hirche 2006: 20).
D.1.4 “Doing business” in new constructionFor a number of years, the World Bank has published a worldwide ranking of “doing business” indicators. One section is dedicated to housing construction, including one subindicator that counts the days required to get a construction permit. Figure 17 shows the results for the ECA region. Within a total sample of 183 countries (2011), 13 of the 23 ECA countries range in the lowest third (ranked 132 or
worse). Among those very badly ranked countries are Turkey (ranked 137), Poland (164), Ukraine (179) and Russia (182). By contrast, Georgia (ranked 7), Kyrgyzstan (43) and Slovakia (56) perform very well.
Despite the inconsistency of such rankings, the “doing business” database gives a clear assessment of lessons to learn.
D.1.5 Quality standards of new apartmentsQuality standards of new construction differ widely throughout the ECA region. But altogether, new construction, as mostly targeted to the upscale market, has much higher quality standards than the existing housing stock. Quality standards have been raised because of a strong engagement of international real estate developers and investors, coming from Western Europe, Russia, Israel, USA, Kazakhstan, Turkey or China. Standards have also risen because building products of sufficient quality and quite low prices are coming from China and Southeast Asian countries. On the other hand, it is becoming increasingly difficult to realize high quality standards in construction in many ECA countries because education in crafts is lagging behind, and many expert workers have emigrated.
Standards of finishing also are quite diverse. In countries with well-established real estate markets, most new apartments are offered turn-key. In countries with less-developed markets, housing developers offer mainly shells and cores, leaving the responsibility for finishing the home to the buyers, which often leads to questionable quality standards.
D.1.6 Demand for housingUntil a few years ago, the need to increase new construction was considered low for many ECA countries. In Armenia, for example, UNECE has detected no shortage of housing, becaue of the drop in population (UNECE 2004b: 12). This assessment has changed. Demographic development has stabilized in most ECA countries (see Chapter B.1, p. 12). But vacant housing supply is not in places of demand, and urbanization is expected to increase again (Chiquier/Lea 2009: 6). Moreover, a growing part of the existing housing stock has deteriorated to the extent that replacement seems more reasonable than refurbishment. Hence, demand for housing is huge in all metropolitan areas of the ECA region. Taking the substantial backlog in new construction for the past two decades and huge regional disparities, housing construction rates in basically all ECA countries should be raised to at least 5 completions per 1,000 inhabitants per year.
48
Source: World Bank, IIBW
Figure 17: World Bank “Doing Business” ranking, 2011
0
50
100
150
200
250
300
350
400
450
500
0
20
40
60
80
100
120
140
160
180
200
GE
KG SK SI CZ
AM RO HU
BG HR
MK
TR BA UZ KZ MD AZ PL AL RS TJ UA
RU
Rank "Doing Business" - Dealing with construction permits (left scale)"Doing Business" - Days for construction permits (right scale)

D.2 SOCIAL HOUSING CONSTRUCTION
Housing policy in the ECA region has headed quite clearly for market housing construction. Nevertheless, social housing construction has begun to recover in several countries. Even though social housing in most countries does not have the significance it has in some Western European countries, it seems to be reviving. Whereas in some Western countries social affordable housing accounts for more than 50 percent of multiapartment construction (for example, in Austria), the level is still rather low in most ECA countries. As seen in Figure 18, social housing accounts for about 7 percent of new construction in the weighted average of the CEE countries, with no less than 20 percent in the Czech Republic and 12 percent each in Slovenia and Slovakia. The SEE countries generally have lower levels. In CIS countries the share of social housing construction differs a lot,
with almost 15 percent in Azerbaijan and more than 10 percent in Russia. For the whole ECA region, the weighted average is 8.9 percent.
The data on social housing construction as documented in Figure 18 are not quite consistent. The years of survey are less current than in most other figures. There is no clear definition of social housing, neither regarding the target groups (only vulnerable households or including moderate income groups) nor tenure. In many cases, public authorities targeting social issues are reluctant to produce social rental housing but prefer to provide low-cost owner-occupied housing. But these data are a starting point for further investigation.
For many ECA countries, a paradox applies: Today, public housing is still privatized at below market prizes, whereas at the same time substantial
public funds are invested in new public housing construction. This is the case for Slovakia, Czech Republic, Romania and Russia. Nevertheless, the existing programs for new public housing construction are in most cases too small to substantially increase the share of affordable rental housing over time (see Table 8, p. 23) (Amann & Mundt 2011: 95).
Social housing construction in the ECA region relies mostly on municipal housing and housing organised by state housing agencies or funds. Such housing agencies are in place in Albania (Enti Kombetar i Banesave), Croatia, Moldova and Romania (ANL - Agenţia Naţională pentru Locuinţe) (Amann & Springler 2010; Tsenkova 2011: 34).
New approaches in affordable rental housing construction are described in Chapter E.3.9, p. 61.
Most recent year, mostly 2009 to 2011. In a few cases, the data are older.
Source: Hegedüs, Lux & Teller 2012; UNECE country profiles; Housing Statistics in the EU 2010; HFH/IIBW survey; national statistical offices; IIBW
Figure 18: Social housing construction, percent of total construction
8.9%
7.1%
20.0%
1.0%
4.0%
12.0%12.5%
2.0%
3.9%
6.5% 6.3%
0.9%
14.6%
2.1%
10.1%
4.0%
0%
5%
10%
15%
20%
EC
A 2
3
∑ C
EE CZ
HU PL
SK SI
AL
BG
HR
RO RS AZ
KG
RU UA
49
47
D.3 HOUSING MARKETS
D.3.1 Market developmentBetween the early 2000s and the global financial crisis in 2008, the favourable macroeconomic conditions fueled demand for housing in all ECA countries. Coupled with effective mortgage legislation, moderate interest rates and the willingness of banks to accept very high loan-to-value ratios, many people could afford a mortgage loan. Growing demand not only stimulated production capacities, but also inflated the price of housing (Roy, 2008: 152; Amann 2009: 25).
The slump in the housing market in 2008 has been described in harsh words. As expected, prices could not rise indefinitely. The “biggest bubble in history” was foreseen, but little or nothing was done by governments to prevent the crisis (U.N. Special Rapporteur 2009: para. 41; The Economist, 16 June 2005).
Meanwhile, housing markets have stabilized. In some countries, such as Russia or Turkey, they already exceed the pre-crisis level. In other regions, such as in most SEE countries, prices have stabilised on a much lower level. But in many cases, affordability has hardly improved, because the financing conditions of banks have been tightened. This is not so much the level of interest rates, but the requirement of much lower loan-to-value ratios. Substantial owner equity is a precondition to getting a mortgage loan today. D.3.2 Owner-occupied apartmentsDuring the 2000s, market prices in metropolitan regions of all ECA countries skyrocketed, in most cases reaching a peak in early 2008. Prices for new condominium dwellings rose in cities like Bratislava, Kyiv, Ljubljana, Prague, Warsaw or Moscow to levels
above Western European capital cities, despite much lower incomes of domestic customers and often lower standards of fixtures and fittings. In some capital cities, the prices of used apartments even exceeded those of newly built ones, mainly because of the better location and appreciated construction quality of old buildings.
The current price development for several capital cities shows stable prices for new condominium dwellings but falling prices for used apartments. In several markets, the price dynamic has revived. The capital cities in the ECA region show the following situation for new apartments:
CEE capital cities:Prague (Czech Republic):Price level at peak (2008): 3,130 €/m² Following slump to lowest level: -18% Current development: Dynamics reviving (REAS, IIBW)- - -Budapest (Hungary):Price level at peak (2007): 1,660 €/m² Following slump to lowest level: -21% Current development: Still depressed (REAS, IIBW)- - -Warsaw (Poland):Price level at peak (2008): 2,560 €/m² Following slump to lowest level: -22% Current development: Dynamics reviving (REAS, IIBW)- - -Bratislava (Slovakia):Price level at peak (2008): 1,970 €/m² Following slump to lowest level: -14% Current development: Stable (REAS, IIBW)Ljubljana (Slovenia):
Price level at peak (2008): 2,890 €/m² Following slump to lowest level: -6% Current development: Under pressure (REAS, IIBW)
SEE capital cities:Sofia (Bulgaria):Price level at peak (2008): 1,280 €/m² Following slump to lowest level: -38% Current development: Still depressed (REAS, BuildEcon, IIBW)- - -Zagreb (Croatia):Price level at peak (2008): 2,050 €/m² Following slump to lowest level: -10% Current development: Stable (REAS, IIBW)- - -Skopje (Macedonia):Price level 2010: 1,040 €/m² Current development: Still depressed (National statistical office, IIBW)- - -Bucharest (Romania):Price level at peak (2008): 1,420 €/m² Following slump to lowest level: -19%Current development: Still depressed (REAS, IIBW)- - -Belgrade (Serbia):Price level at peak (2008): 2,380 €/m² Following slump to lowest level: -9% Current development: Stable (BuildEcon, IIBW)
CIS capital cities:Yerevan (Armenia):Price level at peak (2008): 1,590 €/m²Following slump to lowest level: -24%Current development: Still depressed (Armstat, IIBW)- - -
50

Baku (Azerbaijan):Price level in 2008: 800-2,000€/m² (UNECE 2010)- - -Astana (Kazakhstan): Price level at peak (2009): 1,140 €/m² Following slump to lowest level: -23%Current development: Dynamics reviving (CBRE, IIBW);- - -Bishkek (Kyrgyzstan): Price level 2009: 690€/m² (Global invest)- - -Moscow (Russia):Price level at peak (2010): 4,000 €/m²Following slump to lowest level: -10%Current development: Dynamics reviving (IIBW)- - -Duschanbe (Tajikistan):Price level 2010: 1,200€/m² (HFH/IIBW survey 2012)- - -Kiev (Ukraine): Price level at peak (2008): 2,310 €/m² Following slump to lowest level: -45%Current development: Stable at low level (REAS, 2bgroup, IIBW)- - -Tbilisi (Georgia): Price level 2007: 1,300€/m² (Zhvania 2010, Deloitte & Touche, IIBW)
For a limited number of countries, data on house prices are available on a national level. They are generally significantly below the capital cities, but with similar dynamics. For the CEE region, average house prices are currently at €930 per square meter in Poland and €1,320 per square meter in Slovakia (2011). They differ even more within the SEE region, with only €460 per square meter in Bulgaria, around
€800 per square meter in Bosnia-Herzegovina and Macedonia, and even €1,500 per square meter in Croatia. For the CIS region, house prices are at €1,210 per square meter in Kazakhstan and €1,190 per square meter in Russia (National Statistical Office).
D.3.3 Rental housing marketsRental markets in all transition countries are not very transparent (see Chapter C.5.2, p. 37). Hardly any reliable statistics are available, particularly for the informal rental sector. But rent levels obviously follow market conditions. Upscale market apartments with rents on the level of Western European capital cities are available in many prosperous cities in ECA. But only in major cities of some CEE countries and Russia are the mainstream markets on this rent level. In most urban areas, there is a substantial supply of much cheaper informal rental apartments, often in privatized private dwellings. For many less-developed cities in Albania, Bulgaria and many CIS countries, the mainstream rental market is on a level of €1.50 per square meter per month or below (IIBW 2010).
D.3.4 House prices to income ratioFor Western countries, this ratio is often used to assess the effectiveness of housing markets. But it requires reliable data on both incomes and house prices. Income statistics are hardly reliable because of the substantial informal labour market in most ECA countries. Even less reliable are data on house prices.
In many Western European countries, the ratio of average house prices to incomes is 4 or 5. That is to say that an average condominium dwelling costs four to five average yearly gross incomes. In many ECA countries, this ratio was above 10 before the global financial crisis, and in some cases even at 20. With the crisis, market prices dropped — in many cases
significantly. In some countries, prices are again at a pre-crisis level. Hence, affordability has only temporarily improved, but at the same time financing conditions have tightened.
D.4 HOUSING FINANCE
D.4.1 Banking systemThe banking sector has expanded very strongly in all ECA countries. In CEE and most SEE countries, the prospect of becoming a member of the European Union has exerted strong leverage to implement the necessary, though painful, reforms. This prospect has also facilitated the market entry of international banks (mostly Italian and Austrian), coupled with low proximity to new markets with quasi-identical roots and culture (Roy, 2008: 151).
The three most common types of institutions are specialized mortgage banks, commercial banks and contract-savings programs modeled after the German and Austrian “Bausparkassen” system. That system proved to be the most visible institutional innovation in housing finance in transition countries in the 1990s. By 2003, several countries had introduced some version of this scheme, most prominently the Czech Republic, Slovakia, Romania and Croatia (UNECE, 2005; Amann, Hegedüs, Lux & Springler 2012).
The Bausparkassen contract savings scheme involves the formation of savings groups that self-finance mortgages.
51
49
The effectiveness of contract saving is in question in some countries. Drawbacks include high public costs, insufficient social targeting and only limited effects on new construction, as saving is subsidized rather than spending for construction. Pros include education of people to save for future benefits in housing provision; building up a credit history of people, which eases future financing; and the establishment of national financing circuits, which reduces dependence from international financing markets. Altogether, contract saving can be understood as a well-tested tool of microfinancing in housing construction and refurbishment (HFH 2005: 35; Amann & Mundt 2011: 97). About 75 percent of CEE and SEE banking sector assets are owned by foreign banks (Roy 2008: 156). This share is much lower in the CIS countries.
D.4.2 Development of mortgage financingIn most ECA countries, retail financing products first appeared in the early 2000s. They were responsible for a boom in new construction of housing in all metropolitan areas of the region. In the years before the global financial crisis, financing conditions became more and more favourable in most countries, not only in terms of decreasing interest rates, but also regarding ever-growing loan-to-value ratios, which in some cases exceeded 100 percent of the market value of the premises.
Housing affordability improved despite the fact that house prices increased more quickly than household income. Decreasing interest rates after 2000 made mortgages affordable for the upper 40 percent of the households, thus relaxing the pressure on social housing. On the other hand, it was particularly the availability of attractive financing products that heated up house price inflation (Hegedüs et al. 2012: 22; Amann 2009: 26).
The banking industry competed intensively for market shares, particularly in the new markets, knowing that the market leader would have a privileged position in long-term business performance. As such, plenty of insufficiently securitized loans were accepted. With the economic downturn, this practice resulted in big volumes of bad debts and a fundamental change of business conduct.
The crisis produced gridlock in housing finance in the entire ECA region. For some time, almost any project was stopped because of insecure financing. Since then, housing finance has recovered, but conditions for mortgage financing have changed from scratch. Banks require more owner equity and higher down payments than before. They also require extensive securities and charge higher interest rates.
a) Construction financingResidential construction in the ECA region is financed mainly from prepayments of the future owners. Thus, housing developers have to finance only part of the construction costs. Multiapartment housing construction for sale has developed into a favoured investment opportunity for wealthy local people. This is particularly the case for less-developed countries with limited alternative investment opportunities. Thus, a substantial part of construction activities in those countries works with only minor mortgage indebtedness. This was helpful in overcoming the financial crisis.
b) Retail financingAccess to mortgage loans for puchasers differs depending on the stage of development of local financial markets (see Figure 20, p. 54) and of course their individual credit rating. In less-developed CIS and SEE countries, the main source for investment in housing is still the buyers’ savings and family credits,
in a few cases through their participation in housing construction cooperatives, as in Azerbaijan (UNECE 2010b: 39). In more-developed countries, mortgage financing is well-established.
In 2009, even the best-performing Western countries suffered from a credit crunch, as the financing sector refused to provide liquidity. This was followed by a period of restrictive financing conditions. In many Western countries, this only meant a closer assessment of the credit history of the borrower and lower loan-to-value ratios. Representative mortgage rates in highly rated Euro countries increased from below 4 percent in 2006 to not more than 5.5 percent in 2008. Since then, mortgage rates have decreased again to below 3 percent (Hypostat). In most transition countries, the reaction of the financing industry to the crisis was much fiercer, with in some cases prohibitively high interest rates and loan-to-value ratios below 50 percent. As such, credit lending decreased dramatically.
As documented in Figure 19, the situation has since relieved. Representative interest rates are in many ECA countries again on an attractive level. In most CEE countries, housing financing was cheaper in 2010 than in 2006, at, for example, 3.2 percent in Slovenia, 4.2 percent in the Czech Republic, or 5 percent in Slovakia. Because of the policy of the individual national banks, mortgage rates are still on a high level in Poland (6.6 percent in 2010) and Hungary (9.4 percent). Romania and Bulgaria have representative interest rates in a similar scope as Poland and Hungary, with 6.4 percent and 8.5 percent, respectively. Other SEE countries, such as Serbia, have financing conditions closer to the CIS region (15 percent).
52

Interest rates in the CIS region are contrasting to this situation, with representative interest rates of more than 12 percent throughout. With interest rates on such a level, it is obviously impossible to finance anything but owner-occupied housing at short-term maturities.
c) Foreign currency financingForeign currency (euro and Swiss franc denominated) loans were popular throughout the region, particularly in Croatia, Hungary, Poland, Romania and Ukraine (Hegedüs et al. 2012: 22; Amann 2009: 24). In many cases, they caused serious hardship to borrowers in the wake of the global financial crisis, leading to devaluation of local currencies, a downturn in property values, and insecurity of employment. In some cases, such as in Hungary, national governments forced banks to convert foreign currency loans at fixed rates into local currency, which caused
substantial losses to the finance industry and shook the public’s confidence in political reliability. Because of the difficult economic environment, commercial banks in some ECA countries face excessively high rates of bad loans.
d) Rental housing financeReluctance to develop rental housing schemes is caused mainly by insufficiencies of financing products with interest rates that are too high, unavailability of long-term maturities, and lack of assessment tools for such investments (OECD 2005, UNECE 2005b). Altogether, the state of economic development correlates with trust in long-term financial obligations. In less-developed ECA countries, investors are basically interested in quick returns. This conflicts with rental housing development.
D.4.3 Social housing financeIn socialist times, state housing investments were financed through budgetary resources and through the state bank system, which operated under the control of central planning. The banks issued loans at the price and in magnitude set by the central planning agencies. After 1990, the socialist housing finance system collapsed. The fiscal pressure on the state budgets forced the governments to cut housing subsidies drastically. In most transition countries, public housing investments were practically stopped. In parallel, subsidies to bank-financed schemes (such as cooperative or subsidized owner-occupied housing) had been cut severely or withdrawn totally (Amann, Hegedüs, Lux & Springler 2012).
Mortgage financing of housing purchase is promoted in many ECA countries with a bundle of subsidy tools.
Interest rate of a representative mortgage loan in local currency.Most recent years, mostly 2010/11.
Source:Hypostat/EMF, BuildEcon, ADB (2012), div. literature, HFH/IIBW survey 2012, IIBW
Figure 19: Typical financing conditions (interest rates)
53
4.2%
9.4%
6.6%5.0%
3.2%
9%
6%
15%
13%
19%
15-18%16-20%
12% 12%
25%
13%14%
0%
5%
10%
15%
20%
25%
CZ
HU PL
SK SI
BG
RO RS
AM AZ
KZ
KG
MD
RU TJ UA UZ

51
D.4.4 Housing agencies, housing funds and mortgage agenciesSeveral ECA countries have established housing agencies, housing funds or mortgage agencies to manage social rental investment programs. Such social housing programs mostly target municipalities in their responsibility for social policy (see Chapter D.2, p. 49).
Housing agencies are in place in Albania (Enti Kombetar i Banesave), Croatia, Moldova, Hungary and Romania (ANL, or Agenţia Naţională pentru Locuinţe). National housing funds are in place in Czech Republic, Slovenia and Slovakia. In other countries (such as Poland), special state-owned banks follow similar agendas. In Russia, an Agency on Housing Mortgage Lending, or AHML, following the model of Fannie Mae in the U.S., was introduced in 1997 (HFH 2005: 35; Amann & Springler 2010; Amann, Hegedüs, Lux & Springler 2012; Tsenkova 2011: 60).
D.4.5 Outstanding mortgage loansWith new mortgage finance products, the volume of outstanding loans increased dramatically in all transition countries after 2000. In the Czech Republic, Croatia and Poland, the volume went from barely above zero to close to 20 percent of GDP (Amann, Hegedüs, Lux & Springler 2012).
Compared with Western Europe, outstanding mortgage loans are still on a low level in the ECA region, but despite the recent global financial crisis, their numbers are rapidly growing. With an EU average of 52.4 percent of GDP, some member countries have housing loans exceeding 100 percent of the individual GDP, such as the Netherlands or Denmark. The five CEE countries documented in this report have a weighted average of 18.5 percent (Figure 20), ranging from 13 percent in the Czech Republic to 25 percent in Hungary. At the turn of the century, all of these countries had housing loans close to zero.
Housing was financed by sources other than the capital market.
The SEE region has housing loans in weighted average of only 9 percent of GDP, i.e., only half the level of the CEE region. This ranges from only 1 percent in Bosnia-Herzegovina to 19 percent in Croatia. The level of housing loans in the CIS region is much lower, with only 3.3 percent in weighted average, ranging from 0.5 percent in Kyrgyzstan to 8.5 percent in Ukraine.
Mortgage financing is a very powerful instrument to fuel the economic development of countries. But, as seen in the context of the recent global financial crisis, dependency on and integration into international capital markets also bear substantial risks.
54
Outstanding housing loans in percentage of the Gross Domestic Product.Most recent years, mostly 2010/11.Sums weighted with GDP.
Source: Hypostat/EMF, HFH Global Housing Index, UNECE, Eurasylum (2009), Unicredit (2011), IIBW
Figure 20: Housing loans to GDP (percentage)
52.4%
8.3%
18.5%
12.8%
25.2%
19.6%
17.7%
13.7%
9.1%6.7%
1.1%
13.3%
19.3%
6.2%5.8%3.3%
3.0%1.0%
2.3% 2.9%
8.5%
0%
10%
20%
30%
40%
50%E
U 2
7
EC
A 2
3
∑ C
EE CZ
HU PL
SK SI
∑ S
EE AL
BA
BG
HR
RO RS
∑ C
IS AM AZ
KG
RU UA
E.1 UNITED NATIONS STRATEGIC DOCUMENTS
The U.N.’s Millenium Development Goals only implicitly address housing issues. Goal no. 7, “Ensure Environmental Sustainability” includes better access to safe drinking water, basic sanitation and improvements in the lives of slum dwellers.
Different U.N. organisations, particularly the UNECE, UN-HABITAT and the U.N. High Commissioner for Human Rights, have developed and published a comprehensive set of documents concerning basic principles of housing provision and housing policy. Amongst them are the regular reports of the Special Rapporteur on adequate housing; publications on the right to adequate housing (e.g., UN-HABITAT 2009); the “Pinheiro Principles” on restitution, refugees and IDPs (see Chapter E.3.15, p. 64); and various publications on sustainable urban development.
In line with the above-mentioned, UN-HABITAT is developing a “Global Housing Strategy” to provide adequate housing for all and improve access to housing in general and the living conditions of slum dwellers in particular. Its main objective is to assist member states to realize the right to adequate housing. It also represents a very important change from the output-based targets to the results-based startegy. There is a general trend to shift focus from housing policies to urban development and inclusive cities. An important coming milestone is the Habitat III conference in 2016.
UNECE is currently developing a “Strategy for sustainable housing and land management until 2020.” It aims to create green, inclusive, compact and resilient cities. This strategy defines objectives and sets targets for the three streams: sustainable housing and real estate, sustainable urban development, and land administration and management.
E.2 IMPACT OF EU HOUSING POLICY
The trend in Western Europe and in many other market economies toward reducing the state’s role in housing provision and focusing on market solutions was highly influential in shaping the housing policy options pursued in transition countries over the past 20 years.
Issues related to housing are not an EU competence but are in the authority of individual member states. However, a growing number of EU regulations concern housing. This includes competition law; capital market regulations; and rulings on social cohesion, building products, energy efficiency and use of renewable energy. EU subsidy schemes target urban renewal, social cohesion and innovation. Therefore, EU integration plays a major role in the growing coherence of housing policy schemes in the CEE and SEE regions, and even for CIS countries by orientation to European best practices.
Quite important is the EU ruling on Services of General Economic Interest, or SGEI, which includes social housing. The general rule was determined through the “Altmark Case” (ECR I –7747 2003) and further specified through several decisions about
competition law (Mundt 2006). A legislative attempt is noticeable in the opening of the Regional Fund for housing, or ERDF, and recent financing programs by the European Investment Bank. Nevertheless, the EU is clearly committed to liberal market principles and shows difficulties in esteeming existing social housing schemes that are time-tested in several Western member states. Altogether, there is no explicit support for the development of housing policy schemes that include legal regulations or the implementation of best practices. Housing Europe (formerly “CECODHAS”), the interest group of social housing providers in Europe, embraces social housing umbrella organizations at the national level. As the new member and candidate states practically have no working social housing sectors, they are not represented at the European level. This is hardly supportive of the development of efficient social housing sectors in the ECA region based on European best practices (Amann 2009: 26; Dübel et al. 2006).
Many new EU member and candidate countries seem to be reluctant to design housing subsidy schemes. In some cases, the EU state aid ban seems to be an excuse to introduce social housing models similar to those of Western European countries. But allowing the Directorate-General for Competition to judge the implementation of such new programs is “to trust the cat to keep the cream.” Most Western European countries insist on having their own authority on housing policy to protect their established schemes and introduce new ones.
HOUSING POLICYE.
55
53
New member and candidate states should also insist on their own authority in this field of policy. An important aspect is protection of welfare models from fiscal threats. The economic design of subsidies has a big impact on this. State subsidies may be designed in such a way that they are not classified as state expenditures according to the Maastricht-Criteria. This is the case if state subsidies are repayable (low-interest loans, repayable interest grants, etc.), notwithstanding interest rates below market level.
The European Union has communicated quite plainly its support for the establishment of social housing sectors in the new member states. Social landlords fulfill public service obligations and may be compensated for these obligations without interfering with EU regulations on competition (EC 2005/179; EC 2005/842).
E.2.1 Increasing significance of energy efficiencyThe 1997 Kyoto Protocol was signed by 193 countries worldwide (2011). It aimed to reduce worldwide greenhouse gas emissions by 5.2 percent for the 2008 to 2012 period, compared with 1990. Despite several attempts, the world community did not agree on a follow-up contract with binding emission targets. Nevertheless, the Kyoto Protocol had increased awareness of the necessity to reduce greenhouse gas emissions.
In 2008, the EU agreed on a climate and energy package, including a set of measures known as “20-20-20” targets with the aim of transforming the EU into an energy-efficient and low-carbon economy. By 2020, greenhouse gases shall be reduced by 20 percent compared with 1990 levels, the use of renewable energy sources shall be increased to 20 percent of total EU energy consumption,
and energy consumption shall be reduced by 20 percent compared with projected levels through improvements in energy efficiency. All of these targets have strong implications for the housing sector. The 20-20-20 goals are to be implemented through a number of EU directives, including the Energy Performance of Buildings Directive (EPBD recast, 2010/31/EU), with the following regulations (UNECE 2012):By 2020, all new buildings must apply a nearly zero energy standard (calculated on primary energy consumption), to be achieved with ambitious energy standards and utilization of local renewable energy sources. - - -Obligation for thermal refurbishment: If structural measures concern more than 25 percent of the building envelope or more than 25 percent of the building value, then strict thermal standards and other requirements have to be met. - - -Thermal requirements at optimal cost: Obligatory cost comparison (benchmarks) have to be applied. Different refurbishment alternatives have to be compared based on their life-cycle costs. This measure is intended to increase the quality standards of refurbishments, because life-cycle assessment favours refurbishment strategies with high investment costs and low future energy consumption costs. - - -A system of sanctions has to be introduced. The kind of sanctions must be defined at the national level.- - -Energy efficiency indicators have to be published in all sale or lease advertisements.
E.2.2 Impact on social inclusion and cohesionOver the past six years, the EU has expressed and developed its goal to “end social exclusion” within membership countries. The joint competence of the EU and member states in the social policy field was reaffirmed by the 1999 Treaty of Amsterdam. This treaty also established a legal foundation for the EU’s involvement in fighting social exclusion (see Articles 136 and 137 of the Treaty of Amsterdam) (HFH 2005: 35; Edgar, Doherty & Meert 2002).
E.3 HOUSING POLICY TARGETS
E.3.1 Housing policy priorities during transitionFollowing Tsenkova (2011: 23/25), in the transition period of the 1990s and 2000s, housing policy in most ECA countries was characterized by the following mainstream action:Housing stopped being an important element of the welfare state.- - -Housing markets were deregulated, strengthening market forces.- - -State intervention and public expenditures on housing were reduced.- - -The role of private-sector institutions increased.- - -Public assets — public housing and state construction enterprises — were privatized. Privatization was the flagship of housing reforms.- - -
The second phase of the transition has lasted to the present and can be characterized by the following mainstream action:
56
Sustained liberalisation of housing markets.- - -Decentralisation and devolution in housing policy. - - -Development of adequate legal and institutional framework.- - -Reform of housing finance. - - -New subsidy programs and rent reforms (Tsenkova 2011: 23/25).
E.3.2 Housing policy typesHegedüs describes an Eastern European housing model that had a consistent type of housing policy before transition, characterized by single-party political control over the housing sector, a subordinate role of market mechanisms and market competition, broad control over the allocation of housing, and huge, nontransparent subsidies (Hegedüs, Lux and Teller 2012: 3). After transition, the situation changed drastically, with an erosion of social policy, mass privatisation of the existing social housing stock, discontinuation of new construction, and disintegration of social housing organisations. There is no unified opinion whether the further development of former socialist countries was characterized more by convergence or divergence. Social science today highlights “path dependence” of the development in different countries. This concept is about the relevance of past events on present decisions, even though past circumstances might no longer be material.
The most influential classification of housing policy schemes goes back to Gøsta Esping-Andersen, who identified three welfare schemes: the conservative-corporatist (e.g., Austria or Germany), the liberal
(Anglophone countries) and the social democratic scheme (formerly Scandinavia) (Esping-Andersen 1990). This classification was later complemented with the rudimentary welfare scheme, which is characterized by a withdrawal of the state from many social policy issues. Housing policy in most transition countries may be classified both as liberal and rudimentary, with only small means-tested programs (Tsenkova, 2009).
E.3.3 Role of the stateAll ECA states have modest budgets, not only because gross domestic products are below the average of Western European countries, but also because tax quotas are much lower. A number of these states have introduced flat-tax regimes. As low-taxation countries, they have much less fiscal scope for welfare programs in the housing sector compared with Western countries. In the course of transition, the role of the state changed from scratch. It was redimensioned and redirected. Welfare schemes melted off, serving only residual parts of the population.
Hegedüs (et al. 2012:24) observes weakness in governments in many countries of the region. These governments are under the influence of private interests interlocked with banks and entrepreneurs and have little capacity to balance among the different social groups. Fiscal pressure on the budget and the damaged integrity of the public sector due to frequent cases of corruption prevent governments from championing policy reform. Decentralization has led to the creation of a public administration that is quite responsive to local interests but has made the public sector as a whole fragmented and inefficient. Other authors describe a “hollowing out” of state authority in terms of housing policy, involving a transfer of
state resources upward to supranational organizations such as the EU, downward to local governments, and outward to the private sector (Edgar, Doherty and Meert 2002: 25).
There was a movement in government policy away from focusing on housing as shelter and toward focusing on housing as an investment. Under socialism, housing was usually considered a residential facility to which every person was entitled. As market economies have taken hold, the perceived value of housing has shifted toward that of a form of household wealth — an individual economic asset (HFH, 2005: 9).
The withdrawal of the state as a housing provider seemed justified because of the esteemed capacities of markets to provide sufficient and adequate supply (U.N. Special Rapporteur 2009: para. 20). But of course this expectation failed even before the global financial crisis. The markets produced sufficient housing only in the upscale, owner-occupied market in the big cities. They proved unable to provide sufficient quantities of affordable housing and rental housing in less-developed regions.
Acting on the belief that markets could regulate the production of housing, the state withdrew to set legal regulations for functional housing markets, such as on condominiums or mortgage financing (see Chapter C.5, p. 35), often following international models. But it missed an opportunity to act as a market regulator that could steer supply according to the needs of the population while maintaining affordability.
The present perception of the role of the state in most ECA countries oscillates between paternalism and elementary distrust.
57
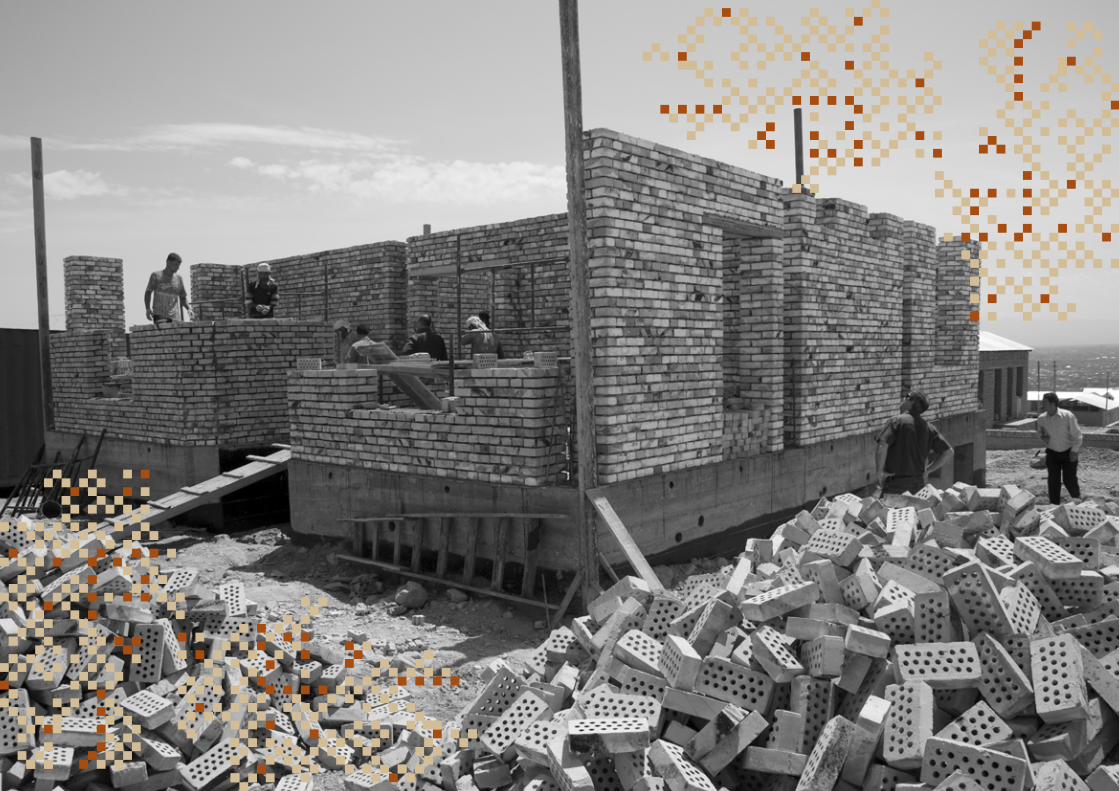
55 58

Only a few CEE countries have established a functioning new order with stable new construction close to demand, a reliable legal framework and effective institutions. More commonly, one sees disappointment toward the state. On the other hand, in some CIS countries, Soviet practices of social citizenship have left a strong impact. Present welfare regimes are widely perceived as insufficient compared with the Soviet past. The claim that the state has to provide housing, maintenance and repair is still present in many CIS countries.
Meanwhile, social obligations of the state in terms of residual housing have revived. Most countries have re-established limited programs for young households, key workers or vulnerable people. In many cases, housing funds or agencies have been established. Municipalities started again with social housing construction.
But unlike many Western countries, states in the ECA region still do not apply housing policy in a comprehensive way. Housing policy can do much more than provide accommodation. It has very high potential for leveraging social and societal development, integration, economic development, environmental protection and regional planning.
E.3.4 Housing rightsAdequate housing is a universal right recognised by international and European declarations, treaties and national constitutions. The revised European Social Charter contains specific provisions on the right to housing (Council of Europe, 1996). Recommendations on the implementation of this right were issued by the Council of Europe, specifying that an adequate dwelling must be structurally and legally secure, safe from a sanitation and health point
of view, and in possession of all basic amenities. Housing conditions should also comply with requirements on size, surroundings, and the location of the dwelling in relation to work, school and social services (Council of Europe, 2009) (Molnár et al. 2012: 7).
Many countries in the ECA region provide a constitutional right to housing. But evidence shows that such a right is difficult to uphold. Several countries without such a constitutional right have a better performance in housing provision. Nevertheless, housing rights became an international standard and therefore a precept for housing policy development in ECA countries.
E.3.5 Poverty reductionPoverty has strongly increased in several ECA countries (see Chapter B.2.5, p. 18). Particularly humiliating is the heavy rise of extreme poverty in several CIS countries.
There is a close relationship between poverty and housing. Housing usually does not cause poverty (see the considerations on housing as a poverty trap, Chapter C.6.1, p. 38), but it is one of the most efficient policy areas to fight against. This is even more important for ECA countries, as social protection is altogether on a low level. Even the new EU member states with the highest social spending — Slovenia, Hungary, Poland and the Czech Republic — spend a lower percentage of GDP on social protection than the EU-15 average (Aidukaite 2011: 213).
The most disadvantaged groups in regard to affordability and access to adequate housing are listed in Chapter C.6 (p. 38), focusing on unemployment, ethnicity (such as the Roma population), gender
and age of households, plus refugees and internally displaced populations. These population groups are the focal point of strategies to combat housing poverty.
Inadequate housing conditions affect social, political and economic stability on many levels. Shelter conditions are a critical component of human well-being. When people live in housing that is decrepit, overcrowded, lacking access to basic utilities, without legal tenure, or located far from transportation to necessary services and employment opportunities, their physical, emotional and mental health suffers. Their ability to contribute positively to society also diminishes. Adequate shelter, on the other hand, fosters human dignity, self-esteem and social respect (U.N. Special Rapporteur on Housing 2005; Edgar, Doherty and Meert 2002:16).
The significance of housing in poverty-reduction strategies is widely acknowledged, particularly in urban areas (see, e.g., CPRC 2011: 21, 45). The main issues are:Avoidance of homelessness and provision of shelter for the homeless.- - -Affordable housing options for those who are insufficiently served by the markets.- - - Security of tenure.- - -Housing allowance schemes and housing assistance.- - -The link between housing and home businesses.
All together, it is about the opportunity for those in need to live in dignity.
59

57
E.3.6 Economic empowerment of homeownersA striking fact of housing provision in ECA countries is the high ownership rate, coupled with very low indebtedness with housing loans. Accordingly, households in the region enjoy considerable housing wealth (Tsenkova, 2011). This issue is mostly neglected in political debates of housing policy reform.
With the following measures, the opportunity of asset wealth, combined with income poverty, may be tapped:Enforcement of owners’ associations, which leads to better self-organisation of multiapartment buildings, keeping them in sufficient condition.- - -Introduction of housing promotion schemes to stimulate thermal refurbishment of owner-occupied buildings.- - -Enforcement of mortgage legislation, combined with a supply of soft loans for business investments and housing repair (not for consumer credits).- - -Measures to facilitate housing mobility from economically less-developed regions to places with jobs; the lower value of the previous apartment may suffice for an up-front payment for a right-to-buy apartment in the desired area.- - -Introduction of the financial instrument of reverse mortgages may be considered; in some countries, they are important for safeguarding incomes after retirement.
E.3.7 Social cohesionMany transition countries are still characterised by low segregation as an inheritance of socialist
urban policy. But segregation is proceeding, with wealthier households leaving the old prefab districts and moving to upscale locations, often to gated communities.
Policymakers should be aware that this development creates disadvantages not only for those who cannot afford the fancy new apartments, but also for those who are well off. Socially integrated cities suffer from less crime and devastation. They provide better opportunities in life to bigger parts of the population. A comparison of metropolitan areas shows that the economic performance of integrated urban areas is significantly better than that of highly segregated cities.
The European Committee for Social Cohesion recommends designing new housing policies — and evaluating existing policies — from the perspective of social cohesion. The importance of social cohesion should be acknowledged among all stakeholders (CDCS 2007).
Effective measures to increase social cohesion include: Dignified accommodation for all (see previous chapters).- - -Social/affordable housing units in all parts of the city, even in upscale neighbourhoods.- - -Public traffic that is sufficiently attractive for all groups of the population.- - -Attractive public space that is accessible for all.- - -An environment of security.
E.3.8 Sound legal environmentProclaiming legal regulations and enforcing them are different things. It can be observed in many transition countries that housing regulations are decided but poorly implemented. Better laws are created when:
They derive from civil society, as agreed upon in a structured stakeholder process.- - -Their budgetary implications are tested.- - -They are evaluated and, if necessary, amended.- - -They provide a clear division of authority (between ministries, between federal and municipal levels, etc.).- - -They refer to international best practices but re-create them on the basis of national legal traditions.
Several housing-related issues, such as mortgage or condominium legislation, are properly regulated in most ECA countries, (Chapter C.5.1, p. 35). With condominium legislation, most CIS countries still allow the voluntary establishment of owners’ associations. This seems to be a serious deficit, as it leaves the households within one building sharing common infrastructure — structural parts, facades, staircases, elevators, roofs — without a legal relation to each other.
Regulations on housing management and maintenance are mostly in place but poorly implemented. Deficits are seen, for example, in the empowerment of the management body, in the collection of fees for maintenance and repair, and in the handling of payment arrears from the individual owner to the owners’ association.
60

Rent regulations (see Chapter C.5.2, p. 37) are barely in place in transition countries, even though their significance is highlighted by many experts, including the European Committee for Social Cohesion (CDCS, 2007; Lux and Puzanov, 2012: 79). A major task of rent regulations is of course protection of tenants against eviction, terms of contract, limitation of contract, termination of tenancy, etc. But sound rent regulations also benefit landlords, because they are a precondition for the establishment of a regular market. One core measure seems to be the protection of formal markets against informal renting. Informal renting of (privatised) private apartments often outperforms regular business models and hence prevents new construction of rental housing. This is even the case with affordable housing initiatives. An effective countermeasure would be to give tenants a means of exposing their landlords’ informal rents, with the consequence that tenancy will be formalised by force with an unlimited term of lease at constant payment conditions (IIBW, 2008).
Cooperative housing legislation is in place in many ECA countries, but it is often outdated, going back to the cooperative business model of socialist times without considering the opportunities of modern housing cooperatives.
E.3.9 Affordable housingAffordability remains the fastest-growing and most pervasive housing challenge in the region (Tsenkova 2011: 15).
Affordability concerns both owner-occupied and rental housing, and it affects public, public-private and commercial housing. Most ECA countries have underdeveloped owner-occupied housing sectors, resulting in house-price-to-income-ratios far above
the level of Western countries. Private markets are targeted primarily at upscale demand. The price decline or stabilisation after the financial crisis of 2008 relieved the ratio somewhat, but financing conditions were tightened at the same time. As a result, for most countries, new owner-occupied housing remains out of reach for the majority of households.
There is an observable shift toward affordable rental housing policy. Although it was of virtually no significance until recently (see for example UNECE 2010b: 40), several countries have introduced rental housing policies. For now, they are based only on public rental housing. But in many countries, the public sector still tries to avoid being involved once more in housing construction, because it disposed of owners’ obligations by privatising big parts of the rental stock (Hegedüs, 2007). Western European countries provide best practices in affordable rental housing in both the private-sector (e.g., Germany) and public-private models.
E.3.10 Public-private partnership models of affordable housing provisionThe space between public and private housing provision is filled with quite different models. In some Western European countries, public or private social landlords, nonprofit or limited-profit housing associations, and cooperatives are responsible for a major part of multiapartment housing construction and hold up to 30 percent of the total housing stock (for example, Netherlands and Austria; see Chapter C.8.4, p. 45).
Public-private partnership housing, or PPP, has been described as one strategy for establishing a new business sector targeting affordable housing, particularly rental housing. But such organisations
also qualify to fill the deficit in housing management (UNECE, 2005a; UNECE, 2005b: 60-67; Amann, 2009: 29; Amann, Bejan and Mundt 2012; Amann, Lawson, Mundt, 2009; Amann, Hegedüs, Lux and Springler, 2012; CDCS, 2007; Dübel et al., 2006; Lux, 2006).
PPP models are working not only for prosperous Western European countries, but also for transition countries. For many SEE and CIS countries, lower construction costs, lower legally defined maintenance fees and higher inflation rates allow for rents of €1.50-2.50 per square meter per month, which fits the much lower incomes in those countries (Amann, 2009).
The establishment of PPP housing sectors is quite challenging. The following issues should be considered:The operation of PPP housing organisations should be defined by law, as building up assets is promoted by public funding.- - -Management should occur on a private market basis.- - -Financing schemes should allow for affordable rents without leaving the paths of market-based operations; thus, affordable housing may become a bankable product.- - -There should be no politically defined rents, but cost rents or rents as a defined ratio to market level.- - -A low-risk institutional setting (strong market position, owner equity, low vacancy, implicit or explicit state guarantees, etc.) should be established, resulting in low costs for capital market financing.- - -
61

59
There should be effective schemes for audit and control. Such schemes reduce risks and contribute to know-how transfer. Thorough public supervision has effects on the capital market similar to a public guarantee.- - -The treatment of profits and assets should be strictly regulated. Profits should be made, but they must be reinvested in housing.- - -Additional housing allowance schemes should be available for the most vulnerable households.- - -Additional rent regulations should exist to protect such a sector from informal renting of private owners.- - -Cooperation with successful Western social landlords will lead to twinning partners.
Within a comprehensive legal scheme of checks and balances, ownership of such specialised housing organisations might not be limited to municipalities, funds or charity organisations. Instead, it may be open to individuals, to the financing sector or to real estate companies. Housing cooperatives may also function within such a framework. In CIS countries, the remains of the Soviet zheks may be upgraded and transformed into PPP organisations. The EU ruling on Services of General Economic Interest, or SGEI, provides an effective framework. PPP housing is less costly to the state than public housing. At the same time, a well-designed PPP housing scheme may become an important tool for executing state housing policy. It seems to provide great potential for new business cases between the state and the market.
E.3.11 Establishment of rental marketsRental housing is a burdened topic in public debate in many ECA countries. High rental shares in socialist
times were abolished by mass privatization. To backpedal seems difficult for various reasons.
Today, rental housing in ECA countries is difficult to access because of quantitative restrictions (social rental), unaffordability (formal market rental) or legal uncertainty (informal rents). From another point of view, many existing rent contracts were protected by law, so that even maintenance was not covered by rent incomes. For public housing, such regulations strongly encouraged privatization. For the private housing stock, such rent regulations were a major burden to developing regular housing markets. In some countries, such as the Czech Republic, such restrictions have been abolished (Amann and Mundt 2011: 96).
Debate has not yet really started about what share of rental housing is reasonable for the social and economic development of a country. Owner-occupied housing has several limitations, such as:
Restricted access for large parts of the population.- - -Impeding the mobility of the workforce.- - -Difficulty of managing owner-occupied multiapartment buildings compared with rental apartments in terms of maintenance, (thermal) refurbishment and preservation of intrinsic value. - - -Rental housing may be a rational choice for consumers only if it is economically advantageous. This requires specific preconditions regarding the legal environment, state commitment, financing and an institutional setting.
A benchmark for a “natural” equilibrium of tenure may be seen in average rental housing quotas not only in the EU, but also in liberal markets such as the USA or Australia, where it is around 30 percent of the total housing stock. The European Committee for Social Cohesion sets a threshold of 20 percent to define countries with low levels of rental housing (CDCS 2007). As a matter of fact, the rental housing share in almost all ECA countries is far below that (see Table 8, p. 23).
Housing privatization reduced the rental markets close to zero in many countries. It frequently was argued that people in CEE countries prefer owning property to rental housing, but consumer choice was misdirected because of insufficient supply of affordable options. Public housing never was able to close the gap, and in many cases it was disregarded because of high public expenditure, frequent misuse of allocation and the threat of creating future ghettos (Dübel et al. 2006). Rental housing should be an option in housing markets, particularly for young households and domestic migrants.
Rental housing did not establish a business case of substantial quantity in any of the ECA countries. Present preconditions (financing, institutional setting) do not allow for affordable rents for middle-income groups. For investors, rental housing still has low attractiveness, because of low (although long-term) returns and perceived high risk of state intervention. Making rental housing construction a business case again seems to be one of the major challenges in housing policy in the decades to come. This probably requires the introduction of PPP regulations (see Chapter E.3.9, p. 61) levelling tax advantages of owner-occupied housing and protection from the informal rental sector (see Chapter C.5.2, p. 37).
62
Supplying sufficient rental housing has comprehensive social and economic rationales; it is not only to accommodate those who cannot afford to own property. Transparently allocating social assistance is definitely easier in rental apartments than in owner-occupied property. Rental housing fosters labour mobility and adequate accommodation at different stages of the life cycle. In mature economic environments, it may be economically rational for tenants to rent rather than buy. Rental housing is an important investment opportunity for institutional and private investors and is hence an important asset class. Rental housing is much easier to manage, maintain and refurbish than owner-occupied housing. It therefore has advantages in terms of the sustainable development of our built environment.
E.3.12 Transparency of marketsA market economy is superior to other economic models only under distinct criteria such as transparency of markets, equal information and equality of market power. The self-regulation of markets works fine under these preconditions. But markets do not by themselves produce the perfect conditions for their functioning. It is essential to have a regulator, which is usually the state.
For housing, the paradigm of liberal markets is even more difficult to apply, because housing is a special good. It cannot be substituted by an alternative; nonconsumption is no option. Market power is usually quite uneven.
Nevertheless, housing and construction markets can be developed to effective allocation mechanisms if high market transparency is provided. Reliable tools to increase transparency in housing markets include rent comparison lists and published statistics. Statistics are also an established tool to make
construction markets more transparent. In this area, data from a regulated sector such as PPP housing might be beneficial for other market sectors.
E.3.13 Thermal refurbishmentThermal refurbishment of the existing housing stock is essential not only to achieve independence from fossil energy, but also for social reasons. Facing similar prices but much lower incomes, energy poverty is of much higher significance in transition countries than in Western Europe (see Chapter B.2.5, p. 20. Thermal refurbishment is a difficult policy challenge. In no European country is the refurbishment rate close to the benchmark of 3 percent of the total building stock per year.
Several obstacles are similar everywhere: low awareness of owners, poor funding, no cost coverage of measures by later energy savings, deficient decision-making processes of owners, insufficient fiscal scope for subsidy programs. In most ECA countries, improving the thermal standard of the existing housing stock is possible at much lower costs than in the West because of higher initial energy consumption and lower construction costs. On the other hand, funding is much more difficult because owners have little equity, there are many “poor owners,” and banks are reluctant to approve financing. State programs mostly have quite limited volumes, and the enforcement of owners’ associations is lagging behind.
One major driver of mass housing privatization in the 1990s was the public’s expectation of getting rid of ownership obligations in maintenance and repair. This obviously didn’t prove true. It is rare that major repairs in the housing sector work without financial incentives from the public. There is even a debate, particularly in CIS countries, whether housing should
be seen as a “social asset,” a view that includes state obligations in housing refurbishment (U.N. Special Rapporteur 2011: para. 49).
But aside from financial incentives, there are a lot of nonfinancial measures to enforce thermal refurbishment, particularly sound laws; clearly defined obligations of owners’ associations, combined with effective tools; measures to improve the creditworthiness of owners’ associations; and measures to raise awareness.
It proves important to define comprehensive bundles of policy measures — legal, financial, communication — distinguished by sectors. Owners of single-family homes have quite different motivations than private or social landlords or owners in multiapartment buildings.
E.3.14 Informal settlement upgradeInformal housing is of widely varied significance in the ECA countries. In some SEE countries, close to one-third of the housing stock has been built on an informal basis, whereas the topic is almost unknown in many CIS countries (see Chapter C.1.5, p. 25).
In many cases, the challenge was met only on the level of the individual plot of land or building. But generally, informal housing cannot be solved by legalisation of ownership titles alone. In almost all cases, the settlements require fundamental renewal; an upgrade of road and technical infrastructure such as water, electricity and sewerage; and the establishment of public space and public transport. Existing footpaths should be legalised. In many cases, demolition of parts of the buildings will be inevitable. This requires affordable housing alternatives (see Amann and Tsenkova, 2011).
63

61
E.3.15 Handling refugees and internally displaced personsWars caused severe damage in the ECA region within the previous two decades, creating a huge number of refugees and internally displaced persons (IDPs; see Chapter C.6.4, p. 40). In most SEE and Caucasus countries, the situation has since considerably improved. But in many cases, even decades after ending the wars, the affected population still is left behind in intolerable living conditions.
The 2005 Principles on Housing and Property Restitution for Refugees and Displaced Persons, or Pinheiro Principles, recognize a distinct “right to restitution” covering housing, land and other property for refugees and the displaced (U.N. Special Rapporteur 2011; COHRE 2005: 3).
In several countries, specific programs for the internally displaced and refugees were launched, such as the currently running Regional Housing Program for the Western Balkans (UNECE 2010a: 34).
Even if Steven Pinker is correct in saying the trend of declining violence over time is likely to continue (Pinker, 2011), it is wise for states to prepare their population for worst cases such as natural and man-made disasters. A stable housing system with a sound legal framework and solid housing provision is a first-class shock absorber both for individual citizens and nations.
E.3.16 Facing natural and man-made disastersBesides wars, people provoke manifold disasters directly or indirectly, including nuclear disasters, droughts, famines, salinity and — probably of increasing hazardousness — rising sea levels. Many natural disasters, including earthquakes, tsunamis, landslides and floods, have worse consequences today
because of higher population density and insufficient foresight. The housing sector is linked in many ways to natural and man-made disasters. The quality of construction and infrastructure is mainly responsible for the degree of damage after such events. The stability of institutions and legal regulations are greatly responsible for quick recovery.
Substandard construction and placement of housing in environmentally dangerous areas is a most lethal man-made default. This is especially true when housing construction falls outside of the formal sector, or when regulations within the formal sector are not enforced (HFH 2005: 40). Over and over, it can be observed that people in informal settlements are particularly affected by disasters. In Turkey, for example, many of those who were killed when their houses collapsed in the 1999 Ankara earthquake lived in the informal housing sector. In Armenia, almost every building is considered to be below current safety requirements for earthquakes, a fact that cost dearly in homes and lives in the 1988 Spitak earthquake (UNDP 1997: 70).
Deficient housing policy schemes can aggravate the effects of natural or man-made disasters. But housing can also be a shock absorber.
E.3.17 Inconsistency of targets and executionThe large number of housing policy targets described in the previous chapters is not a complete list, but it helps to show the scope of policy interventions in the housing sector. Many of these targets are on the political agenda in ECA countries. But the devolution of housing policy to municipalities, capacity constraints, frequent political changes and unfunded mandates are still significant constraints for housing
policy implementation (Tsenkova 2011: 25).Most countries have adopted more or less ambitious strategies on housing issues. But in almost all cases, realisation is lagging behind. One reason is insufficient coverage of those targets with public budgets. Other reasons include inconsistent legislation and deficient political continuity. During the past two decades, most elections in transition countries resulted in a change of government. At the same time, weak administrations were not able to provide continuity (Amann and Mundt 2011: 97).
A closer multilateral coordination and mutual support seems promising to abolish housing policy deficits and mobilise the huge potentials of sound, comprehensive housing policy systems.
64
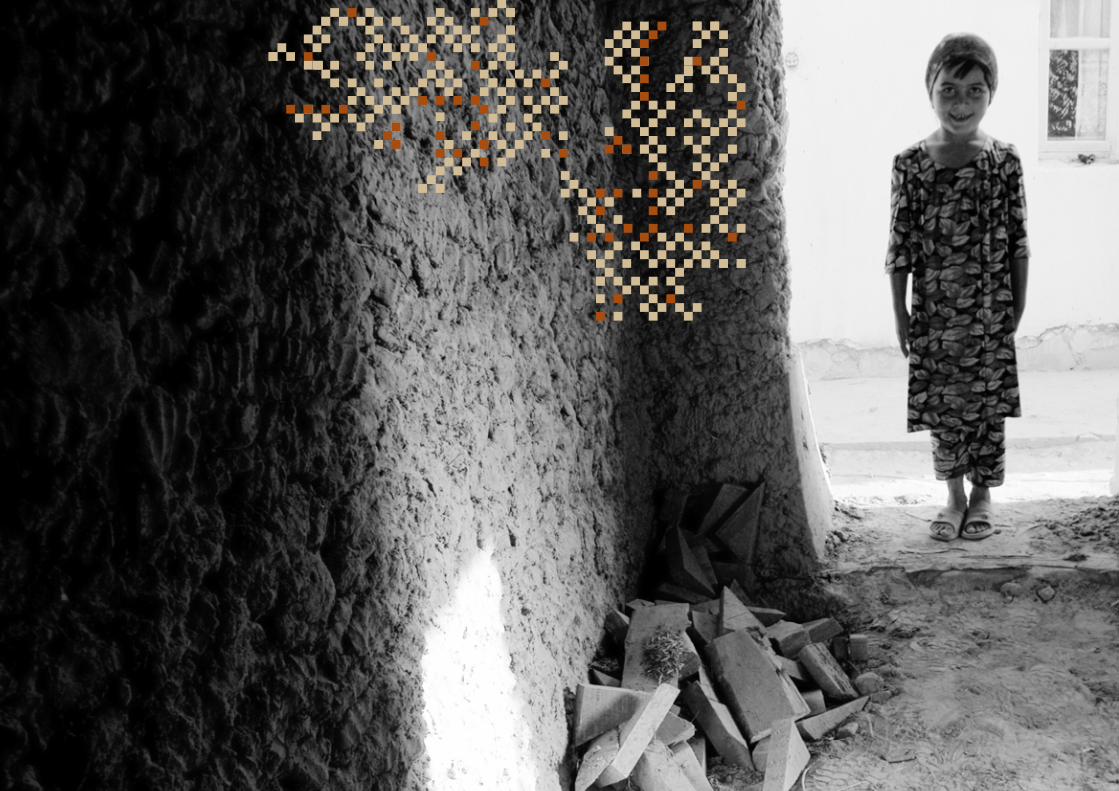
65
63 66
F.1 HFH/IIBW HOUSING SURVEY ECA REGION 2012
The following experts responded to the survey:
Central Eastern European countriesCzech Republic: Consultant from Slovakia (Bratislava)Hungary: Habitat for Humanity HungaryPoland: Habitat for Humanity PolandSlovakia: Habitat for Humanity Europe and Central Asia
Southeastern European countriesAlbania: Local consultant with the help of Dr. Dorina Pojani, Epoka University, Tirana, AlbaniaBosnia and Herzegovina: Local consultant with the help of LOK Microfinance institutionBulgaria: Habitat for Humanity BulgariaCroatia: Local consultant from Comenius UniversityMacedonia: Habitat MacedoniaRomania: Andreea Cismaru, Habitat for Humanity RomaniaSerbia: Housing Center in Serbia
Commonwealth of Independent StatesArmenia: Habitat for Humanity ArmeniaAzerbaijan: Local consultant from Comenius UniversityKyrgyzstan: Habitat for Humanity KyrgyzstanMoldova: Local consultant from Comenius University Russia: Habitat for HumanityTajikistan: Habitat for Humanity TajikistanUkraine: Hope UkraineUzbekistan: Local consultant from Comenius University
Other ECA countriesGeorgia: Local consultant from Comenius UniversityTurkey: Local consultant from Comenius University
ANNEXF.
F.2 REFERENCES
ADB (2012): Key indicators for Asia and the Pacific 2012, 43rd edition (Mandaluyong City, Philippines: Asian Development Bank)Aidukaite, J. (2011): Welfare reforms and socio-economic trends in the 10 new EU member states of Central and Eastern Europe. In: Communist and Post-Communist Studies, Vol. 44, pp. 211–219.Amann, W. (2009): New policies to facilitate affordable housing in CEE. In: The Housing Finance International Journal, December 2009.Amann, W. (2010): Housing conditions and new construction in Kyrgyzstan. In: Country Profiles on the Housing Sector Kyrgyzstan (Geneve, United Nations Economic Commission for Europe).Amann, W. (2012): Public investment in affordable housing. In: The Housing Finance International Journal, Spring 2012.Amann, W., Bejan, I., Mundt, A. (2012): Contry Profile Romania. In: Hegedüs, J., Lux, M. (2012): Social Housing in Transition Countries: Trends, Impacts and Policies (Routledge, Taylor and Francis).Amann, W., Hegedüs, J., Lux, M., Springler, E. (2012): Financing Social Housing. In: Hegedüs, J., Lux, M. (2012): Social Housing in Transition Countries: Trends, Impacts and Policies (Routledge, Taylor and Francis).Amann, W., Komendantova, N. (2010): Armenia: Renovating and Securing Multi-Apartment Housing Stock (Vienna: IIBW, prepared for the World Bank).Amann, W., Lawson, J. (2012): Limited-profit models for affordable rental housing – markets by design (paper presented at ENHR conference in July 2012 in Lillehammer).Amann, W., Lawson, J., Mundt, A. (2009): Structured financing allows for affordable rental housing in Austria. In: The Housing Finance International Journal, June 2009.Amann, W., Mundt, A. (2010a): Institutions: Housing Developers - developed world. In: Housing Encyclopedia, MS 442.Amann, W., Mundt, A. (2010b): Designing a new rental housing law for Romania. In: IJLBE - International Journal of Law in the Built Environment 4/2010.Amann, W., Mundt, A. (2011): Berichtstandard Wohnbauförderung 2011 (Wien: IIBW, im Auftrag des Landes Wien).Amann, W., Springler, E. (2010): Housing Finance Institutions: Transition societies. In: Housing Encyclopedia, MS 408.Amann, W., Tsenkova, S. (2011): Upgrading of Informal Settlements Pobrdje / Rutke and Canj Municipality of Bar / Montenegro (prepared for the Municipality of Bar/Montenegro).Andrews, D., Caldera Sánchez, A. and Johansson, Å. (2011): Housing Markets and Structural Policies in OECD Countries (OECD Publishing).Angel, S. (2000) Housing Policy Matters: A Global Analysis, Oxford University Press.Banerjee, A., Duflo, E. (2011): Poor Economics. A Radical Rethinking of the Way to fight Global Poverty (Philadelphia: PublicAffairs).Balchin, P. (ed.) (1997): Housing Policy in Europe (London, Routledge).Berescu, C., Petrović, M., Teller, N. (2012): Housing Exclusion of the Roma. In: Hegedüs, J., Lux, M. (2012): Social Housing in Transition Countries: Trends, Impacts and Policies (Routledge, Taylor and Francis).Bežovan, G. (2012): Croatia: The Social Housing Search Delayed by Postwar Reconstruction. In: Hegedüs, J., Lux, M. (2012): Social Housing in Transition Countries: Trends, Impacts and Policies (Routledge, Taylor and Francis).Bouzarovski, S. et al. (2012): Energy poverty policies in the EU. A critical perspective. EnergyPolicy (2012).CDCS (2007): Guidelines on access to housing for vulnerable groups (Council of Europe, European Committee for Social Cohesion). Cecodhas (2012): Housing Europe Review. The nuts and bolts of European social housing systems (Brussels, Cecodhas Housing Europe).Charles Kendall / Eurasylum (2009): Need of social housing in Bosnia-Herzegovina (EU Delegation to Bosnia-Herzegovina).Chiquier, L., Lea, M. (2009): Housing Finance Policy in Emerging Markets (Washington, The World Bank).Cirman, A., Mandič, S. (2012): Slovenia – The Social Housing Sector in Search of an Identity. In: Hegedüs, J., Lux, M. (2012): Social Housing in Transition Countries: Trends, Impacts and Policies (Routledge, Taylor and Francis).COHRE (2005): The Pinheiro Principles. United Nations Principles on Housing and Property Restitution for Refugees and Displaced Persons (UN Centre on Housing Rights and Evictions).Council of Europe (2002): Access to Housing for Disadvantaged Categories of Persons: Selected Examples of National Housing Policy Approaches and Policy Measures of Some Council of Europe Members and Observer States.Council of Europe Development Bank, The World Bank (2004): Housing in South Eastern Europe. Solving a puzzle of challenges. Proceedings of the Ministerial Housing Conference, Paris, April 2003 (Paris, CEB).CPRC (2005): The Chronic Poverty Report 2004–05 (Manchester, Chronic Poverty Research Centre).CPRC (2009): The Chronic Poverty Report 2008-09 (University of Manchester, The Chronic Poverty Research Centre).CPRC (2011): Tackling chronic poverty. The policy implications of research on chronic poverty and poverty dynamics (Manchester, Chronic Poverty Research Centre).Czichke, D. (2009): Managing Social Rental Housing in the EU: A Comparative Study. In: European Journal of Housing Policy, Vol. 7 (2), pp. 121-51.
67
65 68
Diamantopoulou, A. (2003): Answer on behalf of the EU commission to the question of Rodi Kratsa-Tsagaropoulou (PPE-DE) on homelessness in the EU (Official Journal 192 E , 14/08/2003 P. 0216 - 0217). Donner, C. (2006): Wohnungspolitiken in Mittelosteuropa (Vienna, Selbstverlag).Dübel, H.-J., Brzeski, W.J., & Hamilton, E. (2006) Rental Choice and Housing Policy Realignment in Transition, Post-Privatization Challenges in the Europe and Central Asia Region, The World Bank, Washington.EC (2011): Communication from the Commission “A Roadmap for moving to a competitive low carbon economy in 2050” COM(2011) 112.Ecorys Hungary (2005): Housing Sector Study in Central Eastern and South Eastern Europe (Luxembourg, European Investment Bank).Edgar, B., J. Doherty and H. Meert (2002) Access to Housing: Homelessness and Vulnerability in Europe, The Policy Press.EMF (2012): Mortgage Info. 4/2012 (European Mortgage Federation).ERRC (2010): Factsheet: Roma Housing in Albania, Bosnia and Herzegovina, Macedonia, Montenegro, Serbia, Slovakia and Romania (European Roma Rights Center).Esping-Andersen, G. (1990): The Three Worlds of Welfare Capitalism (Cambridge: Polity Press).EU Committee of the Regions (2011): Discussion Paper towards a European Agenda for Social Hosuing, 8th meeting of the Commission for Economic and Social Policy, 12 April 2011, Rapporteur: Mr Alain Hutchinson (CdR 71/2011).Eurocities (2009): Eurocities Position Paper on Affordable Housing. Final Version, December 2009.Gevorgyan, K., Hirche, W. (2006): Promoting Housing Finance Market Development in Armenia, Housing Finance International, Dec. 2006, pp. 19-25.Gojko Bežovan (2012): Public rental housing as viable social innovation (paper presented at the ENHR conference in Lillehammer, 24-27 June 2012).IDMC (2011): Internal displacement in Europe, the Caucasus and Central Asia. In: Global Overview 2011 (IDMC – Internal Displacement Monitoring Center, Norwegian Refugee Council).Hegedüs, J. (2007) Social Housing in Transition Countries. In: Whitehead, C. & Scanlon, K. (Eds.) Social Housing in Europe. London: LSE, pp. 165-177..Hegedüs, J. (2012): Hungary, in: Hegedüs, J.; Lux, M. & Teller, N. (Hgs.): Social Housing in Transition Countries: Trends, Impacts and Policies, London u.a.: Routledge.Hegedüs, J., Teller, N. (2003): Management of the Housing Stock in South-Eastern Europe (Metropolitan Research Institute, prepared for the Council of Europe). Hegedüs, J.; Lux, M. & Teller, N. (Ed.) (2012): Social Housing in Transition Countries: Trends, Impacts and Policies, London: Routledge.HFH (2005): From Budapest to Bishkek: Mapping the Root of Poverty Housing An analysis of the conditions and causes of poverty housing in Central and Eastern Europe and Central Asia. Researcher/Writer: Jennifer Duncan (Bratislava, Habitat for Humanity).HFH Global Housing Index Armenia (2011), prepared by Armen Varosyan and Hayastan Stepanyan (Habitat for Humanity, unpublished).HFH Global Housing Index Kyrgyz Republic (2012), prepared by Meerkan Karbozova (Habitat for Humanity, unpublished).HFH Global Housing Index Macedonia (2008), prepared by Aleksdandar Stamboliev (Habitat for Humanity, unpublished).HFH Global Housing Index Romania (2009), prepared by Sorin Ionita (Habitat for Humanity, unpublished). HFH Global Housing Index Ukraine (2009), prepared by Andrii Podobulkin (Habitat for Humanity, unpublished). IIBW (2008): Implementation of European Standards in Romanian Housing Legislation (Vienna: IIBW, commissioned by the Romanian Ministry of Development, Public Works and Housing).IIBW (2010): Establishment of a PPP Housing Sector in Albania. Feasibility Study (Vienna/Shkodra: IIBW, in cooperation with the Albanian Ministry of Public Works, Transportation and Telecommunication, the Municipality of Shkodra, the Albanian National Housing Agency and the Austrian social landlord “Wien-Süd”, financed by the Austrian Development Agency).IIBW (Ed.) (2007) Implementation of European Standards in Romanian Housing Legislation. Final Report. Research study commissioned by the Romanian Ministry of Development, Public Works and Housing (Vienna, IIBW).Kemeny, J., Kersloot, J., Thalmann, P. (2005): Non-profit Housing Influencing, Leading and Dominating the Unitary Rental Market: Three Case Studies, Housing Studies, Vol. 20, No. 6, pp. 855-872.Kosareva, N. (2005): Housing market in Russia: current and perspective view (Moscow, Institute for Urban Economics).Lujanen, M. (2010): Legal Challenges in Ensuring Regular Maintenance and Repairs of Common Parts of Owner-Occupied Apartment Buildings. ASCE - Journal of Legal Affairs and Dispute Resolution in Engineering and Construction, February 2010.Lux, M., Puzanov, A. (2012): Rent Regulation and Housing Alowances. In: Hegedüs, J., Lux, M. (2012): Social Housing in Transition Countries: Trends, Impacts and Policies (Routledge, Taylor and Francis).Lux, M., Sunega, P. (2012): New Social Housing Strategies in Post-Socialist States: Effectiveness, Efficiency, and Sustainability. In: Hegedüs, J., Lux, M. (2012): Social Housing in Transition Countries: Trends, Impacts and Policies (Routledge, Taylor and Francis).Lux, M. (2006): Gemeinnütziges Wohnen: Eine Herausforderung für Mittel-Ost- und Südost-Europa. In: Lugger/Amann et al. (2006), pp. 77-91.
Mashkina, O., Heliste, P., Kosonen, R. (2007): Emerging Mortgage Market in Russia: An overview with Local and Foreign Perspectives (Helsinki School of Economics).MHRR (2006): Housing and Urban Profile of Bosnia and Herzegovina (Ministry for Human Rights and Refugees).Molnár, A. et al. (2012): Health impact assessment of Roma housing policies in Central and Eastern Europe: A comparative analysis. Environmental Impact Assessment Review 33 (2012) 7–14. Nieboer, N., Gruis, V., Tsenkova, S., van Hal, A. (2012): Energy Efficiency in Housing Management (Earthscan).OECD (2011): Development in Eastern Europe and the South Caucasus. Armenia, Azerbaijan, Georgia, Republic of Moldova and Ukraine (OECD publishing).Petrović, M. (2012): Serbia – A Patchwork of Local Options. In: Hegedüs, J., Lux, M. (2012): Social Housing in Transition Countries: Trends, Impacts and Policies (Routledge, Taylor and Francis).Pinker, S. (2011): The Better Angels of Our Nature: Why Violence Has Declined (Viking Adult).PRC Bouwcentrum International (2005): Sustainable Refurbishment of High-Rise Residential Buildings and Restructuring of Surrounding Areas in Europe. Report for European Housing Ministers’ Conference held in Prague, 14-15 March 2005 (The Netherlands, PRC).Puzanov, A. (2012): Russia: The Persistence of the Socialist Legacy? In: Hegedüs, J., Lux, M. (2012): Social Housing in Transition Countries: Trends, Impacts and Policies (Routledge, Taylor and Francis).Rabenhorst, C.S., Mihalache, N.L. (2007): Moldova: Guiding Mortgage Market Development Through Legal Reform. Housing Finance International, March 2007, pp. 26-32.RAXEN CZ (2009): Thematic Study Housing Conditions of Roma and Travellers (RAcism and XEnophobia Network).Roy, F. (2008): Mortgage Markets in Central and Eastern Europe – A Review of Past Experiences and Future Perspectives, International Journal of Housing Policy, 8:2, 133-160.Scanlon, K.; Whitehead, C. (Ed.) (2007): Social Housing in Eurpe. A review of policies and outcomes (London: London School of Economics).Slabkowicz, Z. (2000) Role of Social Housing Associations in Supporting Transformation of the Polish Economy. In: Lux (2001) (Ed.): Social Housing in Europe 2000 (Prague, Institute of Sociology of the Academy of Sciences of the Czech Republic).State Committee of Ukraine on Construction, Architecture and Housing Policy (1999): Role of the Private Sector in Housing Development and Ecologically Oriented Construction Practices.Stepanyan, H., Varosyan, A. (2011): Armenia Housing Study (Habitat for Humanity).Stephens, M. 2005. “A Critical Analysis of Housing Finance Reform in a ‘Super’ Home-Ownership State: The Case of Armenia.” Urban Studies 42 (10): 1795–1815.Struyk, R. (2000) Homeownership and Housing Finance Policy in the Former Soviet Block: Costly Populism (the Urban Institute).The World Bank (2003) Meeting the Environment Millennium Development Goal in Europe and Central Asia, Degraded Housing Target, Report for Kyrgyz Republic (Draft).Tsenkova, S. (2005): Trends and Progress in Housing Reforms in South Eastern Europe (Paris, CEB).Tsenkova, S. (2009): Housing Policy Reforms in Post-Socialist Europe. Lost in Transition (Heidelberg, Physica).Tsenkova, S. (2011): Housing Reforms. Implementation Challenges and Opportunities in Housing Policy and Practice in the UNECE Region (Geneve, UNECE).Tsenkova, S.; Poutsou, C.; Badina, A. (2009): Self-made Cities. In Search of Sustainable Solutions for Informal Settlements. United Nations Economic Commission for Europe Region (Geneve, United Nations Economic Commission for Europe).UN Commission on Human Rights (2005): Economic, social and cultural rights. Annual Report 2005 of the Special Rapporteur on adequate housing as a component of the right to an adequate standard of living, with a focus on homelessness (New York, United Nations Human Rights).UN Human Rights Council (2007): Adequate housing as a component of the right to an adequate standard of living. Resolution 6/27 (United Nations General Assembly).UN Special Rapporteur (2005): Report of the Special Rapporteur on adequate housing as a component of the right to an adequate standard of living, Miloon Kothari (United Nations General Assembly).UN Special Rapporteur (2009): Report of the Special Rapporteur on adequate housing as a component of the right to an adequate standard of living, and on the right to non-discrimination in this context, Raquel Rolnik: Promotion and protection of all human rights, civil, political, economic, social and cultural rights, including the right to development (United Nations General Assembly).UN Special Rapporteur (2010): Report of the Special Rapporteur on adequate housing as a component of the right to an adequate standard of living (United Nations General Assembly).UN Special Rapporteur (2011): Report of the Special Rapporteur on adequate housing as a component of the right to an adequate standard of living (United Nations General Assembly).UNDP (1997) Human Settlements Under Transition: The Case of Eastern Europe and the CIS.UNECE (2001): Romania: Country Profile on the Housing Sector (Geneve, United Nations Economic Commission for Europe).UNECE (2002): Country Profiles on the Housing Sector Albania (Geneva, UNECE).UNECE (2003) Sustainable Development of Human Settlements in the UNECE Region: Progress and Challenges (Geneve, United Nations Economic Commission for Europe).UNECE (2004): Country Profiles on the Housing Sector Armenia (Geneva, UNECE).De Soto, H. (1993): The Mystery of Capital: Why Capitalism Triumphs in the West and Fails Everywhere Else (London, Black Swan).UNECE (2004a): Economic Survey of Europe, 2004 No. 1.UNECE (2004b): Russia: Country Profile on the Housing Sector (Geneve, United Nations Economic Commission for Europe).
69

67 70
UNECE (2005a): Guidelines on Social Housing (Geneva, UNECE).UNECE (2005b): Housing Finance Systems for Countries in Transition. Principles and Examples (Geneva, United Nations Publications).UNECE (2007): Country Profile Georgia (Genova, United Nations Publications).UNECE (2010a): Azerbaijan. Country Profiles on the Housing Sector (Genova, United Nations Publications).UNECE (2010b): Country Profile Kyrgyzstan (Genova, United Nations Publications).UNECE (2011): Country Profile Tajikistan (Genova, United Nations Publications).UNECE (2012): National Action Plan of Montenegro for Energy Efficiency Measures in the Residential Sector. Prepared by Amann, W. et al. (Geneve, United Nations Economic Commission for Europe).UNECE, 2011. Action Plan for Energy-Efficient Housing in the UNECE Region (Geneva, United Nations Publications).UNECE, Real Estate Market Advisory Group (REM) (2010): Key Components of Real Estate Markets Framework. Policy principles and guidance for the development of a country’s real estate market for social and economic benefits (Geneve, United Nations Economic Commission for Europe).UN-HABITAT (2005): Housing and Property Rights in Bosnia and Herzegovina, Croatia and Serbia and Montenegro (United Nations Human Settlements Programme)Uzbekistan Ministry of Finance et al. (2009): International Conference The Global Financial-Economic Crisis, Ways and Measures to overcome it in the Conditions of Uzbekistan (Ministries of Finance, of Economy, for Foreign Economic Relations, Investment and Trade, Institute of Forecasting and Macroeconomic Research).Unicredit (2011): CEE Household wealth and debt monitor (Milano, Unicredit).World Bank (2003): Meeting the Environment Millennium Development Goal in Europe and Central Asia (Washington, World Bank).World Bank (2006): Poland housing finance policy note (Washington, World Bank).World Bank (2011): The Kyrgyz Republic: Poverty Profile and Overview of Living Conditions.Yemtsov, R. (2007): Housing Privatization and Household Wealth in Transition (United Nations University, Research Paper No. 2007/02).Zapatrina, I. (2012): The Ukraine – Waiting Lists without Housing. In: Hegedüs, J., Lux, M. (2012): Social Housing in Transition Countries: Trends, Impacts and Policies (Routledge, Taylor and Francis).

71
F.3 LIST OF FIGURES
Table 1: Demographic situation in ECA countries ................................................................................................................. 13Table 3: Economic indicators for ECA countries 2011 ................................................................................................................. 17Figure 2: Consumer prices ................................................................................................................. 16Table 4: Living conditions 2011 (incomes, equality, poverty) ................................................................................................................. 20Figure 5: Housing stock per 1,000 inhabitants ................................................................................................................. 21Figure 6: Average usable floorspace per capita (square meters) ................................................................................................................. 22Table 8: Housing stock in the ECA region 2011 ................................................................................................................. 23Figure 7: Average usable floorspace per apartment (square meters) ................................................................................................................. 22Figure 9: Housing privatization in the ECA region ................................................................................................................. 28Table 10: Housing costs in the ECA region 2010/11 ................................................................................................................. 33Figure 11: Housing completions per 1,000 inhabitants in ECA countries ................................................................................................................. 45Figure 12: Housing completions per 1,000 inhabitants in CEE countries ................................................................................................................. 46Figure 13: Housing completions per 1,000 inhabitants in SEE countries ................................................................................................................. 46Figure 14: Housing completions per 1,000 inhabitants in CIS countries ................................................................................................................. 46Figure 15: Housing completions per 1,000 inhabitants, 2011 ................................................................................................................. 46Table 16: Housing construction in the ECA region 2011 ................................................................................................................. 47Figure 17: World Bank “Doing Business” Ranking, 2011 ................................................................................................................. 48Figure 18: Social housing construction, percent of total construction ................................................................................................................. 49 Figure 19: Typical financing conditions (interest rates) ................................................................................................................. 53Figure 20: Housing loans to GDP (percentage) ................................................................................................................. 54
HABITAT FOR HUMANITY INTERNATIONAL I EUROPE, MIDDLE EAST AND AFRICA Zochova, 6 – 8, 811 03 Bratislava, Slovakia Phone: +421-2-336-690-00 email: [email protected] habitat.org