housing nyc: rents, markets & trends 2009 index components.... ... o ther l osh u i g s ck .90...
TRANSCRIPT

Board Members
Staff Members
Chair:Marvin Markus
Public Members:Betty Phillips Adams
Jonathan L. Kimmel, Esq.Risa A. Levine, Esq.
David H. Wenk
Owner Members:Magda L. Cruz, Esq.Steven J. Schleider
Tenant Members:Adriene L. Holder, Esq.
Ronald S. Languedoc, Esq.
New York City Rent Guidelines Board
Housing NYC:Rents, Markets & Trends 2009
Executive Director:Andrew McLaughlin
Research Associates:Brian HobermanDanielle Burger
Office Manager:Leon Klein
Public Information:Charmaine Superville
PIOC Temp Manager:Shirley Alexander


Chairman’s Acknowledgments.............................7Executive Director’s Acknowledgments ...............9
INCOME AND EXPENSEPrice Index of Operating Costs
Introduction..................................................13Summary ......................................................14Price Index Components...............................15Rent Stabilized Hotels...................................18Rent Stabilized Lofts .....................................19The Core PIOC .............................................19PIOC Projections for 2010 ............................20Commensurate Rent Adjustment ...................21Methodology ................................................23Acknowledgments ........................................24
Income and Expense StudyIntroduction..................................................27Local Law 63 ................................................27Cross-Sectional Study
Rents and Income...................................28Comparing Rent Measurements ..............29Operating Costs ......................................30“Distressed” Buildings ............................31Net Operating Income............................31Operating Cost Ratios .............................32Net Operating Income After Inflation......33
Longitudinal StudyRents and Income...................................35Operating Costs ......................................36RPIE Expenses and the PIOC...................37Operating Cost Ratios .............................37Net Operating Income............................38
Conclusion ...................................................38Methodology ................................................38
Mortgage Survey ReportIntroduction..................................................43Summary ......................................................43Survey Respondents ......................................44Cross-Sectional Analysis
Financing Availability and Terms.............44Underwriting Criteria..............................46Non-Performing Loans & Foreclosures ....47Characteristics of RentStabilized Buildings ................................47Loan Expectations...................................48
Longitudinal AnalysisFinancing Availability and Terms.............49Underwriting Criteria andLoan Performance...................................49
Sales Data AnalysisBuilding Sales Prices...............................50Building Sales Volume ............................50
Conclusion ...................................................51
INCOME AND AFFORDABILITYIncome and Affordability Study
Introduction ....................................................55Summary ........................................................55Economic Conditions ......................................56New York City Renters ....................................59
Income ....................................................60Rent..........................................................60Affordability of Rental Housing ................61
Cash Assistance Programs ..............................63Housing Policy................................................63Evictions & Homelessness
Homelessness & Emergency Assistance ....64Housing Court ..........................................64
Conclusion......................................................65
HOUSING SUPPLYHousing Supply Report
Introduction ....................................................71NYC’s Housing Inventory ................................71Changes in the Housing Inventory
New Additions..........................................72Tax Incentive Programs ............................75Conversions and Subdivisions ..................77Co-op and Condo Activity ........................77Rehabilitation ..........................................78
Tax-Delinquent PropertyIn Rem Housing........................................79Anti-Abandonment Strategies....................79
Demolitions ....................................................80Conclusion......................................................81
Changes to the Rent Stabilized Housing Stock inNew York City
Introduction ....................................................85Additions to the Rent Regulated Housing Stock
Section 421-a and J-51 ............................85Mitchell-Lama Buyouts ............................86Loft Units..................................................86Other Additions to the Housing Stock ......86Changes in Regulatory Status ....................87
Subtractions from the Rent RegulatedHousing Stock
High Rent /High Income Decontrol ..........87High Rent/Vacancy Decontrol ..................88Co-op and Condo Conversions ................89Expiration of Section 421-a and J-51 ........89Substantial Rehabilitation ........................89Commercial or Professional Status ............90Other Losses to the Housing Stock............90
Summary ........................................................90
Appendices ..........................................................93Glossary ............................................................156Index ..............................................................164
Housing NYC: Rents, Markets and Trends 2009 • 3
Table of Contents
Table of Contents


Appendix A: Guidelines Adopted by the Board
A.1 Apartments & Lofts—Order #41.....................95
A.2 Hotel Units—Order #39 ................................95
Appendix B: Price Index of Operating Costs
B.1 PIOC Sample, Number of Price Quotesper Item, 2008 vs. 2009.................................96
B.2 Expenditure Weights, Price Relatives,Percent Changes and Standard Errors,All Apartments, 2009 .....................................97
B.3 Price Relative by Building Type,Apartments, 2009 ..........................................98
B.4 Price Relative by Hotel Type, 2009 ................98
B.5 Percentage Change in Real Estate Tax Sampleby Borough and Source of Change,Apartments and Hotels, 2009 ........................99
B.6 Tax Change by Borough and CommunityBoard, Apartments, 2009 ...............................99
B.7 Expenditure Weights, Price Relatives,Percent Changes and Standard Errors,All Hotels, 2009 ..........................................100
B.8 Expenditure Weights and Price Relatives,Lofts, 2009...................................................101
B.9 Changes in the Price Index of OperatingCosts, Expenditure Weights and PriceRelatives, Apartments, 1999-2009................102
Appendix C: Income and Expense Study
C.1 Cross-Sectional Income and ExpenseStudy,Estimated Average Operating &Maintenance Cost (2007) per Apartmentper Month by Building Size and Location,Structures Built Before 1947 ........................104
C.2 Cross-Sectional Income and ExpenseStudy,Estimated Average Operating &Maintenance Cost (2007) per Apartmentper Month by Building Size and Location,Structures Built After 1946 ...........................105
C.3 Cross-Sectional Income and Expense Study,Estimated Average Rent, Income and Costs(2007) per Apartment per Month byBuilding Size and Location ..........................106
C.4 Cross-Sectional Income and Expense Study,Estimated Median Rent, Income and Costs(2007) per Apartment per Month byBuilding Size and Location ..........................107
C.5 Cross-Sectional Income and Expense Study,Net Operating Income in 2007 perApartment per Month by Building Sizeand Location................................................108
C.6 Cross-Sectional Distribution of OperatingCosts in 2007, by Building Size and Age .....108
C.7 Cross-Sectional Distribution of “Distressed”Buildings, 2007 RPIE Filings.........................109
C.8 Cross-Sectional Sample, 2007 RPIE Filings ..109
C.9 Longitudinal Income and Expense Study,Estimated Average Rent, Income and CostsChanges (2006-2007) by Building Size andLocation.......................................................110
C.10 Longitudinal Income and Expense Study,Estimated Median Rent, Income and CostsChanges (2006-2007) per Apartment perMonth by Building Size and Location ..........111
C.11 Longitudinal Income and Expense Study,Net Operating Income Changes (2006-2007)by Building Size and Location .....................112
C.12 Longitudinal Sample,2006 & 2007 RPIE Filings ............................113
Appendix D: 2008 Housing and Vacancy Survey,Summary Tables
D.1 Occupancy Status........................................114
D.2 Economic Characteristics.............................118
D.3 Demographic Characteristics .......................126
D.4 Housing/NeighborhoodQuality Characteristics.................................130
Appendix E: Mortgage Survey Report
E.1 Interest Rates and Terms for New andRefinanced Mortgages, 2009 .......................134
E.2 Typical Characteristics of Rent StabilizedBuildings, 2009............................................134
E.3 Interest Rates and Terms for New Financing,Longitudinal Study, 2008-2009 ....................135
E.4 Interest Rates and Terms for RefinancedLoans, Longitudinal Study, 2008-2009 .........135
E.5 Lending Standards and Relinquished RentalIncome, Longitudinal Study, 2008-2009 ......136
(continued, next page)
Housing NYC: Rents, Markets and Trends 2009 • 5
List of Appendices
List of Appendices

List of Appendices
E.6 Retrospective of NYC’s Housing Market,1982-2009...................................................136
E.7 2009 Survey of Mortgage Financing forMultifamily Properties..................................137
E.8 Rent Stabilized Building Median Price andSales Volume, by Borough and BuildingSize, and Percent Change, 2007-2008 .........138
Appendix F: Income and Affordability Study
F.1 Average Annual Employment Statisticsby Area, 1997-2008 ....................................139
F.2 Average Payroll Employment by Industryfor NYC, 1999-2008 (in thousands) ............139
F.3 Average Real Wage Rates by Industryfor NYC, 2000-2007 (2007 Dollars) ............140
F.4 Average Nominal Wage Rates byIndustry for NYC, 2000-2007 .....................140
F.5 NYC Population Statistics, 1900-2008 .........141
F.6 Consumer Price Index for All UrbanConsumers, New York-NortheasternNew Jersey, 1998-2008................................141
F.7 Housing Court Actions, 1987-2008 .............142
F.8 Homeless Statistics, 1982-2008 ...................142
F.9 Housing and Vacancy Survey Data, RentStabilized Apartments, 2005 and 2008 ........143
Appendix G: Housing Supply Report
G.1 Permits Issued for Housing Units inNew York City, 1960-2009...........................144
G.2 Permits Issued by Building Size & Borough,(In Percentages), 2000-2008 ........................145
G.3 New Dwelling Units Completed inNew York City, 1960-2008...........................146
G.4 Number of Residential Co-op and CondoPlans Accepted for Filing by the NYSAttorney General’s Office, 2003-2008 .........147
G.5 Number of Units in Co-op and CondoPlans Accepted for Filing by the NYSAttorney General’s Office, 1982-2008 .........147
G.6 Tax Incentive Programs, 2006-2008 .............148
G.7 Tax Incentive Programs — Units ReceivingInitial Benefits, 1981-2008...........................148
G.8 City-Owned Properties, FY’s 1988-2008 ......149
G.9 Building Demolitions inNew York City, 1988-2008...........................149
Appendix H: Changes in the Rent StabilizedHousing Stock
H.1 Additions to the Stabilized Housing Stock,1994-2008...................................................150
H.2 Additions to the Stabilized HousingStock by Borough, 2008 ..............................151
H.3 Subtractions from the Stabilized HousingStock due to High Rent/High IncomeDecontrol by Borough, 1994-2008 ..............151
H.4 Subtractions from the Stabilized HousingStock due to High Rent/Vacancy Decontrolby Borough, 1994-2008...............................152
H.5 Subtractions from the Stabilized HousingStock, 1994-2008 ........................................152
H.6 Subtractions from the Stabilized HousingStock by Borough, 2008 ..............................153
6 • List of Appendices

As chair of the NYC Rent Guidelines Board, I am proud to present this year’s installment of the Board’s annualcompilation of research, Housing NYC: Rents, Markets and Trends 2009. The members of the RGB use the researchprepared by the staff to help determine the annual guidelines for one million rent stabilized apartments, lofts andhotels in New York City. In addition, the research serves as a useful tool to members of the public, press andgovernment officials, searching for information on NYC’s housing market relating to operating costs, changes tothe composition of the housing stock, affordability of housing and much more.
The research reports presented in this book are the work of an outstanding team of RGB staff members, each ofwhom does an excellent job, and without whom this board would be unable to do its job. I am honored to havesuch dedicated group of professionals working for the Rent Guidelines Board.
Finally, I must express my deep gratitude to all the board members with whom I have been privileged to have atmy side during each board meeting. Their dedication to such a difficult task, in the face of pressure from differingsides in the debate, is commendable.
Marvin MarkusChairman
Housing NYC: Rents, Markets and Trends 2009 • 7
Chairman’s Acknowledgements


It is with pride that the Rent Guidelines Board (RGB) releases the latest issue of our annual compendium ofhousing research: Housing NYC: Rents, Markets and Trends 2009. This publication includes six staff reports usedby the nine members of the board to promulgate renewal lease adjustments for rent stabilized apartments, lofts,and hotels in New York City. These reports contain information and data from many different sources and theywould not be complete without the contributions of many housing professionals and government agencies. Ourgratitude goes out to all those who contributed their time and effort in helping us produce these reports. It is oursincere hope that you find the information contained within these pages a valuable tool in your understanding ofthe complex issues surrounding the NYC rental housing market.
The RGB is fortunate to have a seasoned research staff that provides comprehensive data to the board members.Brian Hoberman, the RGB’s senior research associate, authored the 2009 Income and Expense Study, 2009Mortgage Survey and Changes to the Rent Stabilized Housing Stock in New York City in 2008. In addition to hisexemplary work on these reports, Brian has contributed his computer skills to upgrade and maintain software andhardware used by the staff. Danielle Burger, another key member to our dedicated and experienced research staff,used her superb research skills to complete the 2009 Income and Affordability Study and the 2009 HousingSupply Report and was significant contributor to this year’s Price Index of Operating Costs. Both Brian andDanielle maintain and contribute content to the Board’s website, housingnyc.com.
The Price Index of Operating Cost (PIOC), which measures changes in operating and maintenance costs in rentstabilized buildings, is the most time consuming report undertaken by RGB’s staff. Each member of the RGB staffcontributes to this report, which is conducted throughout the year. In addition to the permanent RGB staff, theBoard hires a temporary staff to help collect prices for insurance, non-union labor, contractors, building supplies,and replacement items. Shirley Alexander served her sixteenth year as the head of the PIOC temporary researchstaff. Her understanding of the nuances of collecting this data, along with her dedication to this project, makeher a vital part of the PIOC. We look forward to her return each year and our gratitude is palpable. In additionto Ms. Alexander, our temporary staff was bolstered by the return of Ann Sheriff. Her hard work was muchappreciated. Finally we would like to extend our sincere thanks to James Hudson for his oversight of the PIOCspreadsheets and statistical expertise. His twenty-plus years of experience working on this annual project helpsto ensure that the data presented in this report is accurate.
Although the reports contained in Housing NYC are written and compiled by our research team, our efforts wouldnot be possible without the RGB’s administrative staff. Leon Klein, our office manager, is celebrating his twenty-fifth year with the board. His dedication to his job and his conscientious attention to his work helps to ensurethat all members of the board and staff, as well as our bills, are paid in a timely manner. Leon’s long tenurebrings with it an institutional knowledge of the Board’s finances, budgets and staff benefits that helps to maintainan efficient office. Our public information officer, Charmaine Superville, is our primary point person in answeringthe thousands of phone calls the RGB receives each year. Over the years she has accumulated a vast knowledgeof rent stabilization and housing issues in NYC, which she delivers to our callers with patience and kindness. Sheis also an integral part of the PIOC helping to collect data from owners, managing agents and fuel companies andshe helps to organize the Board’s public meetings.
Each year I am always struck by the dedication and hard work that the members of the board put toward settingthe renewal lease guidelines. It is a pleasure and an honor to work with such a diligent group. I would be remissif I did not extend my gratitude to Chairman Marvin Markus for his continued support of the RGB staff. He is
Housing NYC: Rents, Markets and Trends 2009 • 9
Executive Director’s Acknowledgements

always available to listen and deal with our concerns and is a staunch defender of our research. His vastknowledge of the issues that face the Board each year makes my job that much easier.
Although RGB reports are produced entirely “in-house,” our research efforts would not be possible without assistancefrom many others. For both the information and expertise they provided, our gratitude goes out to: Bill Sears at theDepartment of City Planning, for data on new housing completions; Farid Heydarpour at the NYC Comptroller'sOffice, who provides labor force data; Angela Orridge at the Department of Buildings, for city-wide demolition data;Floralba Paulino at the Bureau of City Marshals, for information on evictions and possessions; Juanita France at theNYS Attorney General's Office; Norma Gomez at the NYC Department of Housing Preservation and Development(HPD), for information regarding cooperative and condominium developments; Ernesto Belzaguy and Carol Alt at theNYC Civil Court, for data on housing court proceedings; Paul Ligresti of the NYC Human Resources Administrationfor gathering information on Cash Assistance applications; and George Sweeting of the Independent Budget Office(IBO), for lending his expertise on real estate taxes. At DHCR we would like to thank Deputy Commissioner LeslieTorres, as well as Michael Berrios andTracey Stock, for their assistance and expertise regarding owner registration data.In addition, our thanks goes out to the following staff members of HPD: Joe Rosenberg, Deputy Commissioner forIntergovernmental Affairs, for facilitating the collection of additional city-sponsored housing construction and salesdata; Charles Winkler of the Tax Incentives Program, who provided data on tax benefit programs; Christopher Simi,of the Inclusionary Housing/421-a Affordable Program; and Julie Walpert, Assistant Commissioner, Office of HousingOperations, who provides information regarding Mitchell-Lama units. We would like to thank the staff of NYCDepartment of Finance, in particular Leonard Linder, Director of Operations Research, Property Division and thefollowing members of his staff: Ramon Castillo, Andreen McDonald, and Wendy Chong.
Our appreciation is extended to the numerous agencies that provided useful data throughout the year. At the nationallevel: the U.S. Census Bureau, Residential Construction branch; the Bureau of Labor Statistics; the Federal DepositInsurance Corporation; and the Department of Housing and Urban Development, Economic and Market AnalysisDivision. Agencies at the state level include: the Real Estate Financing Bureau of the Attorney General’s Office; theDivision of Housing and Community Renewal; and the Department of Labor’s Research and Statistics Division. Locallevel sources include: the Department of Finance; the Department of Buildings; the Department of City Planning; theMayor’s Office of Operations; the Comptroller's Office; the Office of Management and Budget; Corporation Counsel;the Bureau of City Marshals; and the Department of Housing Preservation and Development, Office of Development.
Since the inception of the board’s staff in 1980, we have always had a strong working relationship with HPD. Thisyear was no exception. We would like to thank Commissioner Rafael Cestero, Joseph Rosenberg, Moon Wha Lee,and Sheree West for their efforts on behalf of the RGB. Their swift response to the needs of the RGB and theirsupport in administrative matters are greatly appreciated. I look forward with work with these dedicatedprofessionals in the future. We would also like to thank Robert Goldrich, the Board’s liaison to the Office of theDeputy Mayor for Economic Development and Rebuilding. Mr. Goldrich is our conduit from which issuesconcerning the RGB are relayed to City Hall. His continued dedication to the Board is much appreciated.
Finally, we give special thanks to those who testified at RGB meetings this year: from HPD, Joseph Rosenberg,Deputy Commissioner for Intergovernmental Affairs; from the New York City Housing Authority (NYCHA), GregoryKern, Director for Leased Housing; Michael Edelman from Freddie Mac; Scott Swerdlin from Capital One; and fromDHCR’s Office of Rent Administration, Assistant Commissioner Michael Rosenblatt and Chief Economist Guy Alba.
Andrew McLaughlinExecutive Director
10 • Executive Director’s Letter

New York City Rent Guidelines Board
Income & Expense
2009 Price Index of Operating Costs ........ pg. 132009 Income and Expense Study ..............pg. 272009 Mortgage Survey Report ..................pg. 43


New York City Rent Guidelines Board
2009 Price Index Of Operating Costs
! The Price Index ofOperating Costs forRent StabilizedApartment Buildings(PIOC) increased4.0% this year.
! Costs in pre-warbuildings increased 3.4%and costs in post-warbuildings rose 3.9%.
! The “core” PIOC, whichexcludes the erraticchanges in fuel oilprices, natural gas, andelectricity costs, is usefulfor analyzing inflationarytrends. The core rose by6.5% this year.
! Fuel oil costs decreased10.1%.
! Real estate taxes rose11.7% due to a rise inassessments and taxrate for Class Twoproperties.
! Labor Costs rose 2.9%.
! The Utilities componentincreased by 10.9% dueprimarily to an increasein water and sewercosts.
! Insurance Costsdecreased by 2.9%.
! The Price Index ofOperating Costs for RentStabilized ApartmentBuildings is projected toincrease 2.2% next year.
IntroductionThe Price Index of Operating Costs (PIOC) measures the price change in amarket basket of goods and services used in the operation and maintenanceof rent stabilized apartment buildings in New York City. The goods andservices which make up the market basket were originally selected on thebasis of the findings of a study of 1969 expenditure patterns by owners of rentstabilized apartment buildings. Minor changes in the specification of some ofthese goods and services have been carried out over time to maintain therepresentativeness of the market basket. The relative importance of the variousgoods and services in the market basket was updated in 1983 by means of astudy of expenditure patterns of owners of rent stabilized apartment buildings.
The PIOC measures changes in the cost of purchasing a specifiedset of goods and services, which must remain constant both in termsof quantity and quality from one year to the next. The need to exclude the
effect of any alterations in thequality of services providedrequires that very carefulspecifications of the goodsand services priced must bedeveloped and applied. Thepricing specifications mustpermit the measurement ofchanges in prices paid for
carefully defined pricing units with specific terms of sale, such as cash, volumeor trade discounts. For certain items, such as real estate taxes, the price paidis determined administratively, through information collected fromCity records.
Changes in the overall PIOC result from changes in the prices of individualgoods and services, each weighted by its relative importance as a percentageof total operating and maintenance (O&M) expenditures. Because the marketbasket is fixed in the sense that the quantities of goods and services of eachkind remain constant, the relative importance of the various goods and serviceswill change when their prices increase either more quickly or more slowlythan average. Thus, the relative importance, or weight, attached to each goodor service changes from year to year to reflect the different rates of pricechange among the various index items. The expenditure weights used in theconstruction of the 2009 Price Index are based upon the 1983 ExpenditureStudy and are revised on the basis of annually measured price changes from1982-2008.
The importance of each index component is shown by its “expenditureweight” (see Appendix B.2). The measured 2008-09 price changes in eachindex component are also presented in this appendix. The expenditure
The Price Index ofOperating Costs for
Rent StabilizedApartment
Buildings rose ... 4.0%
What’s New
Housing NYC: Rents, Markets and Trends 2009 • 13

Change In Costs forRent Stabilized ApartmentBuildings, April 2008
to April 2009
Taxes 11.7%Labor Costs 2.9%Fuel -10.1%Utilities 10.9%Contractor Services 2.8%Administrative Costs 4.1%Insurance Costs -2.9%Parts and Supplies 2.6%Replacement Costs 6.1%
All Costs 4.0%
2009 Price Index Of Operating Costs
weights and the 2008-09 price changes are then combined to provide theoverall change in the PIOC over the period from 2008-09.
The 1983 Expenditure Study provides a basis for calculating separatesets of expenditure weights for buildings constructed before 1947 andfor buildings constructed in 1947 or later (post-1946). Typically,buildings constructed before 1947 incur a lower percentage of operatingand maintenance costs for property taxes, but their fuel costs represent asignificantly higher percentage of total operating and maintenance coststhan do the fuel costs of the post-1946 buildings. The differencesbetween the pre-1947 and post-1946 expenditure patterns for buildingsare combined in the construction of the overall PIOC. It is neverthelesspossible to develop separate price indices for the pre-1947 and post-1946 buildings. In addition, there are separate price indices forgas-heated, oil-heated and master-metered buildings. Although theexpenditure weights for all rent stabilized buildings and for each of thefive subcategories of buildings differ, the price changes are the same foreach of the six indices. (See Appendices B.2 and B.3)
The PIOC consists of nine cost components, each designed tomeasure changes in a category of costs such as fuel, insurance, utilities,etc. The methodology for each component is described in the finalsection of this report.
SummaryThis year, the PIOC for rent stabilized apartment buildings increased by4.0%, nearly 4 percentage points less than the PIOC percentage changefrom the year before (7.8% in 2008). The PIOC was driven upward bysignificant increases in real estate taxes (11.7%) and utility (10.9%)costs. More moderate increases were seen in administrative costs (4.1%),labor (2.9%), contractor services (2.8%), parts and supplies (2.6%) andreplacement costs (6.1%). These increases were offset by declines in thecost of fuel oil of 10.1% and insurance of 2.9%. The growth in theConsumer Price Index (CPI) of 3.5% was just half a percentage pointlower than the PIOC.1 See the adjacent table and Appendix B.2 forchanges in costs and prices for all rent stabilized apartment buildingsfrom 2008-09.
The “core” PIOC, which excludes erratic changes in fuel oil, naturalgas and electricity costs, is useful for analyzing long-term inflationarytrends. The core PIOC rose by 6.5% this year, higher than the overallPIOC due to the exclusion of declining fuel oil prices.
Price Index - the measure ofprice change in a market basketof goods and services.
Component - categories ofgoods and services, such asLabor Costs or Taxes, thatcomprise the market basket of aprice index.
Item - representative individualgoods and services within acomponent, such as Pushbroom,Plumbing, Faucet or Roof Repair.
Price Relative - the ratio ofcurrent and prior year’s prices.
Expenditure Weight - the relativeimportance of the change in costsof different goods and services.
Specification - defined pricingunits with specific terms of sale,such as cash, volume or tradediscounts.
Terms and Definitions
Apartments
14 • Income and Expense

2009 Price Index Of Operating Costs
Price Index Components
Taxes
The Tax component of the PIOC isbased entirely on real estate taxes.The change in tax cost is estimated bycomparing aggregate taxes levied onrent stabilized apartment houses in
Fiscal Year (FY) 2008 and FY 2009. The tax data wasobtained from the New York City Departmentof Finance.
Real estate taxes rose this year by 11.7%, asignificantly higher rise than the 0.3% increase seenlast year and the highest increase in taxes since 2004when tax costs increased 16.2%. The change in taxeswas due to a rise in assessments and two increases inthe tax rate in FY 2009. Abatements and exemptionshad a minor impact on the rise in taxes this year.
Tax Levy — The total tax levy for all properties in theCity (commercial and residential) increased by 10.8%from FY 2008 to FY 2009. The Class Two property levyrose more than that of the City as a whole, at a rate of
12.3%. The distribution of the levy among propertyclasses tends to shift from year to year. From FY 2008to FY 2009, the levy share for Class Two propertiesincreased, by 0.5 percentage points, from 36.7% to37.2% of the total tax burden. The Class Twoproportion of the levy share is the highest since theinception of the four-class system in 1983 when theshare was 26.3%.
Tax Rate — The FY 2008 Class Two tax rate of 11.928increased by 5.6%, resulting in a new annualized rateof 12.596 for FY 2009. The annualized tax rate for thefirst and second quarters of FY2 009 was 12.139, justa 1.8% increase over FY 2008. However, in Decemberof 2008 the City Council approved to reinstate a 7%increase in the citywide tax rate, resulting in a newannualized rate for Class Two of 13.053 whichincreased the tax bills for the second half of FY 2009.The 12.596 is an average annualized rate for allof FY 2009.
This increase in the Class Two tax rate follows asignificant decrease in the tax rate of 6.4% in FY 2008.Increases in the tax rate of 2.8% and 1.5% werewitnessed in FY 2007 and FY 2006, while a decrease
11.7%
Percent Change in Taxes due to Assessments and Exemptions/Abatements/Tax Rate 1989-2009
20091989 1990 1991 1992 1993 1994 1995 1996 1997 1998 1999 2000 2001 2002 2003 2004 2005 2006 2007 2008
20%
15%
5%
-5%
-10%
0%
10%
Assessments Exemptions, Abatements and Tax Rate Overall Tax Change
Assessments and the Tax Rate Rise in 2009
Source: New York City Department of Finance
Housing NYC: Rents, Markets and Trends 2009 • 15

2009 Price Index Of Operating Costs
was seen in FY 2005 when the rate declined 3.2%.Significant increases in the tax rate for Class Twoproperties were seen in FY 2004 and FY 2003 of 9.3%and 7.3% respectively.
Assessments — Assessed valuations of rentstabilized properties rose by 4.8% citywide in FY2009. This rise in assessments was less than last year’sincrease (7.8%) and the lowest rise in assessmentssince 2007 (2.9%). All five boroughs showed increasesin assessments. The highest percentage increase inassessments was in the Bronx (7.4%) followed byManhattan (4.8%), Brooklyn (4.1%), Queens (4.0%)and Staten Island (0.2%).
The change in assessed valuations of rentstabilized buildings in New York City has fluctuatedfollowing the cycles in the real estate market.Assessments rose dramatically from the late 1980sthrough 1991, increasing 8% or more each year (seegraph on the previous page). In FY 1992 and FY 1993,the increase in valuations for stabilized buildingsslowed to 2% per year. The impact of the recessionwas finally reflected in tax bills the following two years— valuations dropped 4.7% in FY 1994 and 1.3% inFY 1995. Smaller decreases occurred in the next twoyears. From FY 1998 to FY 2003, assessmentsincreased each year at a higher rate than the previousyear. Increases in assessed valuations were not as highas the year before in both FY 2004 and FY 2005.Since 2005, increases in assessments have beenbetween 2.9% and 7.8%.
Abatements and Exemptions — This year, thenumber of rent stabilized buildings with abatementsdecreased by 5.5%. However, the average benefitvalue of the typical tax abatement increased, by 1.4%,from FY 2008 to FY 2009. The net impact of thedecrease in the number of abatements and in the risein the average abatement value was a negligibleincrease in the tax liability for rent stabilized buildingsof 0.1%.
In FY 2009, the value of the average tax exemptiondecreased. However, 1.0% more rent stabilizedbuildings benefited from tax exemptions. The rise inthe number of buildings receiving exemptions wasoffset by decreases in the value of tax exemptions
resulting in owners' tax bills actually rising by 0.8%.(See Appendices B.5 and B.6)
Labor Costs
The Price Index measure of laborcosts includes union and non-unionsalaries and benefits, in addition toSocial Security and unemploymentinsurance. The cost of unionized
labor makes up nearly two-thirds of the Labor Costscomponent. The entire Labor Costs componentcomprises 13.5% of the overall Price Index.
Labor Costs rose 2.9%, a lower increase than inlast year’s PIOC (4.0%). The rise in Labor Costs wasdue to increases in union and non-union wages aswell as rises in healthcare and pension contributions.Unemployment insurance costs rose slightly,increasing 0.2%.
Wages comprise three-quarters of the Labor Costscomponent. For the past sixteen years the growth innon-union labor pay has outpaced union labor wages.Non-union pay increased by 3.1%, which was two anda half percentage points lower than increases seen inthe 2008 price index (5.6%). Unionized wages as agroup increased by 1.7%, 1.1 percentage points lowerthan last year’s increase of 2.8%.
Fuel
The Fuel component comprisesroughly 15% of this year’s PriceIndex. The change in cost measured inthis component considers both thechange in weather and the change inprices for the three types of heating oil
used to heat multi-family buildings in New York City.First, the PIOC measures fuel prices from May to Apriland then compares them to the same months from theprevious year. Over the past 12 months, fuel oil pricesdecreased by 16.9%. The price for #2 oil, whichcomprises more than half of this component, declined13.4%. Prices for #4 and #6 fuel oil declined morethan #2 oil, decreasing 22.0% and 21.7%, respectively.
Second, along with measuring price, the PIOC alsotakes into account the effect of weather on the demand
-10.1%
2.9%
16 • Income and Expense

2009 Price Index Of Operating Costs
for fuel oil, especially during the heating season whenthe large majority of the fuel is burned. Since this yearwas colder than last year, weather increased the demandfor fuel. The combination of the decline in heating oilprices and an increase in demand resulted in a decreasein the cost for heating buildings with oil by 10.1%.2
Changes in the Fuel component have been themost variable of any component in the Price Index overthe past eight years. From 2005 to 2008, the cost offuel oil rose more than 20% in each year but 2007,which saw a smaller increase of 0.5%. In 2002 and2004, fuel costs actually declined by 36.1% and 2.8%respectively, yet in 2003 costs rose 66.9%.
Over the past ten years the average prices pergallon for all fuel grades, which are pure prices that donot factor in weather, have risen substantially. Theaverage price for all grades of fuel oil in 2008 was$3.52 a gallon. Adjusted for inflation, the average pricein 1998 was $1.19. This is an annual rate of increase inthe price of fuel of nearly 12% above the general rateof inflation. (See graph on this page)
Utilities
The Utilities component consistsprimarily of electricity, natural gas,and water and sewer charges. In fact,water and sewer costs account forhalf of the Utilities component.
Telephone and steam costs are a small part of thiscomponent. In the case of most Utilities items,changes in costs are measured using the PIOCspecifications (i.e. the quantity of electricity, steam, etc.being purchased) and the changes in rate schedules.Water and sewer costs are based on the rateestablished by the New York City Water Board.
This year Utilities increased 10.9%, which ishigher than last year’s increase of 8.9%. Substantialincreases were seen in gas (14.8%) and water andsewer costs (14.5%), which make up over 80% of theUtilities component. Electricity costs decreased 9.6%,somewhat offsetting the larger increases in gas andwater and sewer costs.3
Contractor Services
The Contractor Services componentrose 2.8%, the lowest increase in thiscomponent since 1998 (2.7%) andnearly two percentage point lowerthan last year’s growth of 4.6%. In
contrast, the last six years showed growth in thiscomponent of more than four percent annually.Previously, Contractor Services costs rose above fourpercent only once from 1992 through 2002.
The most important items in this component byweight are repainting and plumbing rates, whichcomprise nearly two-thirds of the Contractor Servicescomponent. Painters’ rates rose by 3.0%, down fromlast year’s increase of 4.5%. Rates charged by plumbersincreased by 2.8%, a lower increase than last year’sgrowth of 4.8%. Painters and plumbers reported thatincreases in the cost of labor and materials were theprimary factors that led to an increase in their rates.
Due to a continued rise in the cost of oil-basedmaterials, the rates charged by roofers increased morethan six percent for the fourth consecutive year, rising6.1%, the highest increase of any item in this
2.8%
10.9%
$0.50
$1.00
$1.50
$2.00
$2.50
$3.00
$3.50
$4.00
'08'07'06'05'04'03'02'01'00'99'98
#6 Fuel Oil#2 Fuel Oil #4 Fuel Oil
Note: Prices are in constant 2008 dollarsSource: Price Indices of Operating Costs, 1998-2009
Average Fuel Oil Prices HaveRisen Over the Past Ten Years
Average Inflation Adjusted Fuel OilPrices per Gallon, 1998-2008
Housing NYC: Rents, Markets and Trends 2009 • 17

2009 Price Index Of Operating Costs
component. All other component items had pricerelatives ranging from 0.0%-4.9%. (See Appendix B.2)
Administrative Costs
Administrative Costs rose 4.1%, thefirst time in the past four years theincrease in this component wasbelow 5%. From 2001-2005, thiscomponent’s cost rose each year
between 4.0% and 5.4%. Increases in AdministrativeCosts did not exceed four percent from 1991 through2000. Fees paid to management companies,accountants, and attorneys make up nearly this entirecomponent.
A large portion of the growth in the AdministrativeCosts component can be attributed to a rise inmanagement company fees (4.4%) that comprisenearly three-quarters of this component. Managementfees are often tied to apartment buildings’ rentalincome and are affected by changes in rents andvacancies. This year’s growth is lower than last year’s(5.5%), indicating that management companies raisedtheir fees and/or rents increased at a lower rate thanlast year and there were more vacancies in thebuildings they manage. The growth in managementfees is about half of that seen in 2007 (8.2%).
Accounting fees increased in this year’s PIOC by4.0%, 3.1 percentage points lower than last year’s riseof 7.1%. Attorney fees rose 1.7%, lower than the prioryear’s increase of 2.1%.
Insurance Costs
Insurance Costs decreased this yearby 2.9%, the first time since 1998there was a decrease in thiscomponent and the largest decline inthe history of the PIOC. The increasesseen in this component in the three
previous years, 1.9%-2.5%, were more moderatecompared to the period between 2002-2005, whenescalating insurance costs rose a cumulative 104%.Changes in this component in the fourteen-year periodprior to 2002 fluctuated from a decrease of 1.5% to anincrease of 5.2%.
Changes in insurance costs for owners varied bywhen the policy was renewed and the amount of thepolicy. Policies renewed from December 2008through April 2009 saw an increase in insurance costsof 4.6%. Meanwhile, policies renewed prior toDecember 2008 witnessed a decrease of 3.0%.Furthermore, policies that cost more than $5,000,which are nearly half of all insurance quotes verified,saw an average decline in cost of 4.2% upon renewal.Smaller buildings with policies under $5,000 saw anincrease of 3.8%.
Parts and Supplies
The Parts and Supplies componentaccounts for less than two percent ofthe entire Price Index. The overallincrease in the Parts and Suppliescomponent was 2.6%, 0.3 percentage
points higher than last year’s increase of 2.3%.
Replacement Costs
The Replacement Costs componenthas the lowest weight of anycomponent, with its weight being lessthan 1/100th of the PIOC. This yearReplacement Costs rose 6.1%, the
highest increase in this component since 1982 and thefourth year out of the last five in which prices rosemore than three percent.
Rent Stabilized HotelsThe Hotel Price Index includes separate indices foreach of three categories of rent stabilized hotels (dueto their dissimilar operating cost profiles) and ageneral index for all stabilized Hotels. The threecategories of hotels are: 1) “traditional” hotels — amultiple dwelling which has amenities such as frontdesk, maid or linen service; 2) Rooming Houses — amultiple dwelling other than a hotel with thirty orfewer sleeping rooms; and 3) single room occupancyhotels (SROs) — a multiple dwelling in which one ortwo persons occupy a single room residing separatelyand independently of other occupants.
6.1%
2.6%
-2.9%
4.1%
18 • Income and Expense

2009 Price Index Of Operating Costs
The Price Index for all stabilized Hotels increased 3.5% this year, lessthan half of the 7.4% increase witnessed the year before. The Price Indexfor Hotels was just 0.5 percentage points lower overall than the increasein costs measured in the Apartment Price Index. Significant disparitiesbetween the Hotel Index and the Apartment Index were seen in theUtilities and Tax components. The increase in Utilities for all types ofHotels was 2.0% versus 10.9% in apartment buildings. This differencewas due to a double digit increase in water and sewer costs having moreweight in the Apartment Index, and declining electricity costs having moreweight in the Hotel Index. In addition, Taxes increased 14.1% for Hotelsversus the 11.7% increase for apartments. These disparities resulted in aHotel Index that was lower than that for apartments.
Prices and costs in all other components in the Hotel Index had similarchanges in rates to the same components in the Apartment Index. See thetable on this page for changes in costs and prices for all rent stabilizedhotels from 2008-09.
Among the different categories of Hotels, the index for “traditional”hotels increased 5.2%, which was significantly higher than increases forboth Rooming Houses (1.2%) and SROs (1.6%). The differencesbetween these indices are primarily due to the increased weight placedon the Tax component for “traditional” hotels. Furthermore, there weredisparities among the three hotel types in Fuel and Utilities, withRooming Houses showing a decrease in the cost for both of thesecomponents. (See Appendices B.4 and B.7)
Rent Stabilized LoftsThe increase in the Loft Index this year was 2.8%, 1.2 percentage pointslower than the increase for apartments. This difference is explained by thefact that Attorney fees, which rose 1.7%, and Insurance Costs, whichdeclined 2.9%, carry much more weight for lofts than for apartments.More weight put on these components placed more downward pressure onthe Loft Index. See the table on this page and Appendix B.8 for changesin costs and prices for all rent stabilized lofts from 2008-09.
The Core PIOCThe Core PIOC, which measures long-term local trends by factoring outshifts in fuel costs, gas, and electricity rates, rose 6.5% in 2009. The risein the 2009 Core was 2.5 percentage points higher than the ApartmentIndex (4.0%). Since declining fuel costs were excluded from the CorePIOC calculation, the Core rose by the greatest proportion since 2004(9.2%) when Fuel Costs declined 2.8%. (See graph on next page)
The Core rose at a slower rate than projected due primarily to areduction in insurance costs that was not reflected in last year’s Coreprojection. Insurance was projected to rise 6.8% but instead declined
Change In Costs forRent Stabilized HotelBuildings, April 2008
to April 2009
Taxes 14.1%Labor Costs 3.0%Fuel -9.2%Utilities 2.0%Contractor Services 3.2%Administrative Costs 3.9%Insurance Costs -2.9%Parts and Supplies 2.0%Replacement Costs 4.0%
All Costs 3.5%
Hotels
Change In Costs forRent Stabilized LoftBuildings, April 2008
to April 2009
Taxes 11.7%Labor Costs 3.0%Fuel -12.7%Utilities 10.4%Contractor Services 2.8%Admin Costs, Legal 1.7%Admin Costs, Other 4.3%Insurance Costs -2.9%Parts and Supplies 2.6%Replacement Costs 6.1%
All Costs 2.8%
Lofts
Housing NYC: Rents, Markets and Trends 2009 • 19

2009 Price Index Of Operating Costs
2.9%. Furthermore, both Contractor Services andAdministrative Costs rose less than projected.Contractor Services rose 2.8% versus the 5.4%projection, while Administrative Costs rose 4.1%versus the predicted rise of 6.2%. Replacement Costs,which have very little weight in the Core Index, rose6.1% versus the projection of 1.5%. All of theremaining changes in the core components in the 2009projected Core and the 2009 actual Core showagreement within 1.4 percentage points.
PIOC Projections for 2010Section 26-510 of the Rent Stabilization Law requiresthe Board to consider prevailing and projectedoperating and maintenance costs. Projections forcomponents of the PIOC are performed to provide theRent Guidelines Board with an estimate of how muchcosts are expected to rise in the year following thecurrent Price Index. The PIOC Projection is used in
correlation with the old ‘traditional’ commensuraterent adjustment formula only. Before the newcommensurate formulas were devised, the projectionwas used to assist the Board in setting guidelines fortenants choosing two- or three-year leases.
It is important to note that changes in costs andprices after April 2009, the last month covered by thisstudy, will be measured in next year’s Price Index. ThePIOC Projection is not used in the calculation of the‘Net Revenue’ and ‘CPI-Adjusted NOI’ commensurateformulas (see the “Commensurate Rent Adjustment”section on next page), which calculate one- and two-year guidelines that will compensate owners for themost recent change in costs measured by the PriceIndex. The PIOC Projection should not be consideredin combination with these newer formulas inestablishing guidelines.
Projecting changes in the PIOC has become morechallenging in recent years. Energy prices — whichaffect about one-fifth of the market basket of operating
Percent Change in the Price Index of Operating Costs and the Core PIOC, 1990-2010
6.7%
7.3%
10.1%
3.8% 2.2%2.4% 3.1% 3.0%
2.3%
2.5% 3.8%
4.0%
16.9%
6.9%
3.7%
-1.6%
4.0%
6.0%
10.9%
4.7%
2.0%
6.0%
2.4%
Apartment PIOCCore PIOC
'91'90 '92 '93 '94 '95 '96 '97 '98 '99 '00 '01 '02 '03 '04 '05 '06 '07 '08 '09 '10*
6%7%8%
9%10%
11%12%
13%14%
15%16%17%
0%-1%-2%
1%2%3%4%5%
0.1% 0.03%
5.4%
10.6%
9.2%
5.8%
7.8%
4.0%
2.2%
5.1%
7.8%
6.1%
3.4%
6.5%
9.1%
5.3%
7.8%
8.7%
0.1%
The “Core” PIOC Rose More than the Apartment Index in 2009
*Note: The percent change for 2010 is estimated.Source: Price Indices of Operating Costs, 1990-2009, PIOC and Core PIOC projections for 2010
20 • Income and Expense

2009 Price Index Of Operating Costs
costs measured in the index — have becomeincreasingly volatile. Unpredictable geo-politicalevents, the current worldwide recession and changingweather patterns are some of the forces behind largechanges in fuel-related costs (heating fuel, electricity,gas and steam) that have in turn hindered the accuracyof the PIOC projections in recent studies. The taxcomponent, which accounts for one-quarter of theentire Price Index, has also become harder to projectdue to changes in tax policy, such as tax ratereductions, after the period covered in this Price Index.
This year, operating costs in rent stabilizedapartment buildings increased by 4.0% versus last year’sprojected PIOC increase of 7.3%. The components thatshowed the most variance between actual changes incosts versus projected changes were Fuel and Insurance.Fuel, a historically volatile component, was projectedto rise 4.7%, but actually declined 10.1% due to a fallin fuel oil prices during the heating season. Insurancecosts, which almost always increase, declined by 2.9%in 2009 versus the expected increase of 6.8%, adifference of nearly 10 percentage points. Theunexpected declines in the Fuel and Insurancecomponents resulted in an overall apartment index thatwas lower than projected.
Meanwhile, Administrative Costs rose 4.1%,compared to the projected increase of 6.2%, whileContractor Services were projected to increase 5.4%but only rose 2.8%. Replacement Costs were projected
to rise 1.5% but actually rose 6.1%. The remaining four2009 projected components of the PIOC were within1.4 percentage points of the actual measured changes.
Overall, the PIOC is expected to grow by 2.2%from 2009 to 2010. Fuel, the most volatile PIOCcomponent, is expected to decline 24.5%.Conversely, Taxes are projected to increase 15.2% dueto an increase in billable assessments, levy share andthe tax rate for Class Two properties. Insurance Costsand Utilities are projected to rise 6.1% and 0.8%respectively. Contractor Services are expected to rise4.3%, Administrative Costs 5.4%, and Labor Costs areprojected to increase by 4.1%. The table on this pageshows predicted changes in PIOC components for2010. The core PIOC is projected to rise 9.1%, asignificantly higher rate than the overall PIOC.
Commensurate RentAdjustmentThroughout its history, the Rent Guidelines Board hasused a formula, known as the commensurate rentadjustment, to help determine annual rent guidelinesfor rent stabilized apartments. In essence, the“commensurate” combines various data concerningoperating costs, revenues, and inflation into a singlemeasure indicating how much rents would have tochange for net operating income (NOI) in stabilizedbuildings to remain constant. The different types of“commensurate” adjustments described below areprimarily meant to provide a foundation for discussionconcerning prospective guidelines.
In its simplest form, the commensurate rentadjustment is the amount of rent change needed tomaintain landlords’ current dollar NOI at a constantlevel. In other words, the formula provides a set ofone- and two-year renewal rent increases or guidelinesthat will compensate owners for the change in pricesmeasured by the PIOC and keep net operating income“whole.”
The first commensurate method is called the “NetRevenue” approach. While this formula takes intoconsideration the types of leases actually signed bytenants, it does not adjust landlords’ NOI for inflation.The “Net Revenue” formula is presented in two ways,first adjusting for the mix of lease terms and second,
Projected Change In Costs for RentStabilized Apartment Buildings,
April 2009 to April 2010
Taxes 15.2%Labor Costs 4.1%Fuel -24.5%Utilities 0.8%Contractor Services 4.3%Administrative Costs 5.4%Insurance Costs 6.1%Parts and Supplies 1.8%Replacement Costs 1.8%
All Projected Costs 2.2%
2010 Projections
Housing NYC: Rents, Markets and Trends 2009 • 21

2009 Price Index Of Operating Costs
adding an assumption for stabilized apartment turnover and the impactof revenue from vacancy increases. Under the “Net Revenue” formula,a guideline that would preserve NOI in the face of this year’s 4.0%increase in the PIOC is 3.5% for a one-year lease and 5.5% for a two-year lease. Guidelines using this formula and adding assumptions forthe impact of vacancy increases on revenues when apartmentsexperience turnover are 1.75% for one-year leases and 2.5% for two-year leases.
The second commensurate method considers the mix of lease termswhile adjusting NOI upward to reflect general inflation, keeping bothoperating and maintenance (O&M) and NOI constant. This is commonlycalled the “CPI-Adjusted NOI” formula. A guideline that would preserveNOI in the face of the 3.5% increase in the Consumer Price Index (seeEndnote 1) and the 4.0% increase in the PIOC is 5.0% for a one-yearlease and 8.0% for a two-year lease. Guidelines using this formula andadding the estimated impact of vacancy increases are 3.25% for one-year leases and 5.0% for two-year leases.4
The original formula that has been in use since the inception of theRent Guidelines Board is called the “traditional” commensurateadjustment. The “traditional” commensurate yields 2.7% for a one-yearlease and 3.5% for a two-year lease, given the increase in operating costsof 4.0% found in the 2009 PIOC and the projection of a 2.2% increasenext year.5
As a means of compensating for cost changes, this “traditional”commensurate rent adjustment has two major flaws. First, although theformula is supposed to keep landlords’ current dollar income constant,the formula does not consider the mix of one- and two-year leaserenewals. Since only about three-fifths of leases are renewed in any givenyear, with a preponderance of leases having a two-year duration, theformula does not necessarily accurately estimate the amount of incomeneeded to compensate landlords for O&M cost changes.
A second flaw of the “traditional” commensurate formula is that itdoes not consider the erosion of landlords’ income by inflation. Bymaintaining current dollar NOI at a constant level, adherence to theformula may cause profitability to decline over time. However, suchdegradation is not an inevitable consequence of using the “traditional”commensurate formula.6
All of these methods have their limitations. The “traditional”commensurate formula is artificial and does not consider the impact oflease terms or inflation on landlords’ income. The “Net Revenue”formula does not attempt to adjust NOI based on changes in interest ratesor deflation of landlord profits. The “CPI-Adjusted NOI” formula inflatesthe debt service portion of NOI, even though interest rates have beengenerally falling, rather than rising, over recent years. Including aconsideration of the amount of income owners receive on vacancyassumes that turnover rates are constant across the City.
"Net Revenue"Commensurate Adjustment
1-Year Lease 2-Year Lease
3.5% 5.5%
"Net Revenue"Commensurate Adjustmentwith Vacancy Increase
1-Year Lease 2-Year Lease
1.75% 2.5%
"CPI-Adjusted NOI"Commensurate Adjustment
1-Year Lease 2-Year Lease
5.0% 8.0%
"CPI-Adjusted NOI"Commensurate Adjustmentwith Vacancy Increase
1-Year Lease 2-Year Lease
3.25% 5.0%
"Traditional"Commensurate Adjustment
1-Year Lease 2-Year Lease
2.7% 3.5%
Commensurates
22 • Income and Expense

2009 Price Index Of Operating Costs
Finally, it is important to note that only the“traditional” commensurate formula uses the PIOCprojection and that this projection is not used inconjunction with or as part of the “Net Revenue” and“CPI-Adjusted NOI” formulas. As stated previously, allthree formulas attempt to compensate owners for theadjustment in their operating and maintenance costsmeasured each year in the PIOC. The “Net Revenue”and the “CPI-Adjusted NOI” formulas attempt tocompensate owners for the adjustment in O&M costsby using only the known PIOC change in costs (4.0%).The traditional method differs from the other formulasin that it uses both the PIOC’s actual change in costs aswell as the projected change in costs (2.2%). If thechange in projected costs, which may not be anaccurate estimate of owner’s costs, is added to the “NetRevenue” and “CPI-Adjusted NOI” formulas, theresulting guidelines will likely over- or under-compensate for the change in costs.
Each of these formulae may be best thought of asa starting point for deliberations. The other RentGuidelines Board annual research reports (e.g. theMortgage Survey Report and the Income and ExpenseStudy) and testimony to the Board can be used tomodify the various estimates depending on these otherconsiderations.
Methodology
Owner Survey
The Owner Survey gathers information on managementfees, insurance, and non-union labor from buildingmanagers and owners. Survey questionnaires,accompanied by a letter describing the purpose of thePIOC, were mailed to the owners or managing agentsof stabilized buildings.
If the returned questionnaire was not complete, aninterviewer contacted the owner/manager and themissing information was gathered. All of the priceinformation given by the owner/managing agent wasthen confirmed by calling the relevant insurance andmanagement companies and non-union employees.
The sample frame for the Owner Survey includedover 41,000 stabilized buildings registered with theNew York State Division of Housing and Community
Renewal (DHCR). A random sampling scheme wasused to choose 5,100 addresses from this pool for theowner mailing. The number of buildings chosen ineach borough was nearly proportional to the share ofstabilized buildings in that borough. Three successivemailings were sent at timed intervals to the owner ormanaging agent of each property selected in thesurvey sample.
Over 15% of the questionnaires mailed out werereturned to the RGB. A total of 717 returned surveyscontained usable information, from which quotes ofowners’ annual insurance costs (648), non-union laborquotes (134) and management fees (93) werevalidated. The number of verified prices in 2008 and2009 for the Owner Survey is shown in Appendix B.1.
Fuel Oil Vendor Survey
Fuel price information is gathered on a monthly basisvia a telephone survey. A monthly survey makes itpossible to keep in touch with fuel vendors and to gatherthe data on a consistent basis (i.e. on the same day of themonth for each vendor). Vendors are called each monthto minimize the likelihood of misreporting and also toreduce the reporting burden for the companies that donot care to look up a year’s worth of prices. The numberof fuel quotes gathered this year are similar to last yearand are contained in Appendix B.1.
To calculate changes in fuel oil costs, monthlyprice data is weighted using a degree-day formula toaccount for changes in the weather. The number ofHeating Degree Days (see Endnote 2) is a measure ofheating requirements.
Real Estate Tax Computations
The sample of buildings used to compute the 2009tax price relative was drawn by providing a list of rentstabilized properties registered with DHCR to theDepartment of Finance. Finance “matched” this listagainst its records to provide data on assessed value,tax exemptions, and tax abatements for over 34,000buildings in FY 2008 and FY 2009. This data wasused to compute a tax bill for each stabilizedbuilding in FY 2008 and FY 2009. The changecomputed for the PIOC is simply the percentage
Housing NYC: Rents, Markets and Trends 2009 • 23

2009 Price Index Of Operating Costs
increase in aggregate tax bills for these buildingsfrom FY 2008 to FY 2009.
Vendor Survey
The Vendor Survey is used to gather price quotes forContractor Services (e.g. painting), AdministrativeCosts (e.g. accountant and attorney fees), Parts andSupplies (e.g. mops), and Replacement Costs (e.g.refrigerators). As in prior years, the vendor databasewas updated by adding new vendors and by deletingthose who no longer carry the products or perform theservices outlined in the Vendor Survey itemspecifications. All vendor quotes were obtained overthe telephone. The telephone interview proceduresused for gathering price quotes were unchanged fromprior years. A total of 675 recorded price quotes weregathered. For a description of the items priced andthe number of price quotations obtained for each item,refer to Appendix B.1.
Other Items
In addition to the items previously discussed, a numberof other pieces of information are needed to completethe PIOC, including labor union contract and benefitinformation, Social Security rates, unemploymentinsurance rates, Heating Degree Days, and telephoneand utility rate schedules. These items are used incomputing some of the labor components, changes inutility costs for electricity, gas, steam, and telephone,and the cost-weighted change in fuel prices. Finally, tomeasure the change in water and sewer costs for rentstabilized buildings, staff used the Water BoardFY 2009 increase of 14.5%.7
Price Index Projections
The PIOC Projections are estimated by using data fromfederal, state and local agencies; estimates from relatedindustry experts and trend forecasting using three-yearor long-term averages.
Taxes were projected by using data from theDepartment of Finance’s tentative assessment roll forFY 2010 and the amended and restated City Counciltax-fixing resolution to estimate (for Class Two
properties) the change in class levy share andassessments, the tax rate and the impact of exemptionsand abatements in the coming fiscal year. Theseestimates produce a projected tax cost for the ownersof rental properties. Labor costs are projected byanalyzing labor contract terms supplied by apartmentworkers union Local 32-BJ and a ten-year geometricaverage of all other Labor items. Fuel costs areprojected by using data and information from the U.S.Energy Information Administration’s (EIA) current“Short-Term Energy Outlook” report, which includesassumptions about changes in usage according to aprojected return to the average temperature over thelast five years. Utility costs are projected by obtainingrate projections for the coming year from the New YorkCity Water Board and EIA projections. Natural gas rateprojections are combined with assumptions aboutusage if the coming year’s weather had the five-yearaverage number of Heating Degree Days.8
The other components — Administrative Costs,Contractor Services, Insurance Costs, Parts andSupplies, and Replacement Costs — are projected byusing three-year or sixteen-year geometric averages ofthe component price relatives.
AcknowledgmentsThe Rent Guidelines Board would like to acknowledgethe following individuals for their assistance inpreparing the Price Index of Operating Costs this year:Dr. James F. Hudson for technical assistance andmethodology and report review; Shirley Alexander forsupervising the data collectors for the owner andvendor surveys and Ann Sheriff and CharmaineSuperville for collecting owner and vendorinformation. "
24 • Income and Expense

2009 Price Index Of Operating Costs
Endnotes1. The average CPI for All Urban Consumers, New York-Northeastern
New Jersey for the year from March 2007 to February 2008 (228.3)compared to the average for the year from March 2008 to February2009 (236.4) rose by 3.55%. This is the latest available CPI dataand is roughly analogous to the ‘PIOC year’, which for the majorityof components compare the most recent point-to-point figures fromApril to April, monthly cost-weighted figures from May to April, or thetwo most recent fiscal year bills.
2. The May 2008 to April 2009 year was 7.4% colder than the mostrecent 5-year average “normal” year and 10.9% colder than theyear before. “Normal” weather refers to the typical number ofHeating Degree Days measured at Central Park, New York City,over a given period. A Heating Degree Day is defined as, for oneday, the number of degrees that the average temperature for thatday is below 65 degrees Fahrenheit. The most recent five-yearaverage “normal” temperature refers to the total number of averageannual Heating Degree Days from “PIOC” years, May 2004 to April2009, measured in Central Park by the National Weather Service.
3. Note that the electricity items are calculated on a point-to-pointbasis. In this case, the electricity increase represents a comparisonof the price for electricity in April 2008 to the price in April 2009. Ifwe were to calculate electricity on a monthly basis, with costweights for heating use, the change for the twelve-month periodfrom May 2008 to April 2009 would be a 4.6% increase.
4. The following assumptions were used in the computation of thecommensurates: (1) the required change in landlord revenue is67.9% of the 2009 PIOC increase of 4.0%, or 2.7%. The 67.9%figure is the most recent ratio of average operating costs to averageincome in stabilized buildings; (2) for the “CPI-Adjusted NOI”commensurate, the increase in revenue due to the impact ofinflation on NOI is 32.1% times the latest 12-month increase in theCPI ending February 2009 (3.5%) or 1.1%; (3) these lease termsare only illustrative—other combinations of one- and two-yearguidelines could produce the adjustment in revenue; (4)assumptions regarding lease renewals and turnover were derivedfrom the 2008 Housing and Vacancy Survey; (5) for thecommensurate formulae, including a vacancy assumption, the11.13% median increase in vacancy leases found in the rentstabilized apartments that reported a vacancy lease in the 2008apartment registration file from the Division of Housing andCommunity Renewal was used; and (6) the collectability of thesecommensurate adjustments are assumed.
5. Calculating the “traditional” commensurate rent adjustment requiresan assumption about next year’s PIOC. In this case, the 2.2%PIOC projection for 2010 is used.
6. Whether profits will actually decline depends on the level ofinflation, the composition of NOI (i.e. how much is debt service andhow much is profit), and changes in tax law and interest rates.
7. “Public Information Regarding Water and Wastewater Rates,” NewYork City Water Board, April 2008.
8. Source: “Short-Term Energy Outlook,” March 2009. U.S. EnergyInformation Administration, Department of Energy.
Housing NYC: Rents, Markets and Trends 2009 • 25


Housing NYC: Rents, Markets and Trends 2009 • 27
New York City Rent Guidelines Board
2009 Income and Expense Study
From 2006 to 2007,increases in rental and totalincome outpaced a smallerincrease in operating costs.Because operating costsgrew less than the increasein income, net operatingincome (revenue remainingafter operating expensesare paid) increased.
On average, in stabilizedbuildings, from 2006-2007:
! Rental incomeincreased by 6.5%.
! Total income roseby 6.5%.
! Operating costsincreased by 5.2%.
! Net operating income(NOI) grew by 9.3%.
IntroductionAs required by the Rent Stabilization Law, the Rent Guidelines Board (RGB)has analyzed the cost of operating and maintaining rental housing in NewYork City since 1969, as part of the process of establishing rent adjustments forstabilized apartments. Historically, the Board’s primary instrument formeasuring changes in prices and costs has been the Price Index of OperatingCosts (PIOC), a survey of prices and costs for various goods and servicesrequired to operate and maintain rent stabilized apartment buildings.
In 1990, the RGB acquired a new data source that enabled researchers tocompare PIOC-measured prices and costs with those reported by owners: RealProperty Income and Expense (RPIE) statements from rent stabilized buildingscollected by the NYC Department of Finance. These Income and Expense(I&E) statements, filed annually by property owners, provide detailedinformation on the revenues and costs of income-producing properties. Theaddition of I&E statements has greatly expanded the information base used inthe rent setting process. I&E statements not only describe conditions in rentstabilized housing in a given year, but also depict changes in conditions overa two-year period. Most importantly, I&E data encompasses both revenuesand expenses, allowing the Board to more accurately gauge the overalleconomic condition of New York City’s rent stabilized housing stock.
These findings examine the conditions that existed in New York’s rentstabilized housing market in 2007, the year for which the most recent data isavailable, and also the extent by which these conditions changed from 2006.
Local Law 63The income and expense data for stabilized properties originates from Local Law63, enacted by the New York City Council in 1986. This statute requires ownersof apartment buildings and other properties to file RPIE statements with theDepartment of Finance annually. While certain types of properties are exemptfrom filing RPIE forms (cooperatives, condominiums, buildings with fewer than11 units or with an assessed value under $40,000), the mandate producesdetailed financial records on thousands of rent stabilized buildings. Althoughinformation on individual properties is strictly confidential, the Department ofFinance is allowed to release summary statistics of the data to the RGB.
Since 1990, the RGB has received data on samples of rent stabilizedproperties that file RPIE forms. Samples in the first two studies (data for 1988and 1989) were limited to 500 buildings, because RPIE files were notautomated. Upon computerization of I&E filings in 1992 (for cross-sectionaldata from 1990 and longitudinal data from 1989-90), the size of the samplesused in RGB I&E studies has grown to more than 13,200 properties containingover 620,000 units.
What’s New

Cross-Sectional Study
Rents and Income1
In 2007, rent stabilized property owners collectedmonthly rent averaging $974 per unit. As in prioryears, units in pre-war buildings rented for less onaverage ($924 per month) than those in post-warbuildings ($1,088 per month).2 At the borough level,monthly rents in stabilized buildings were $1,322 inManhattan, $884 in Queens, $795 in Brooklyn and$718 in the Bronx (as noted in the Methodology,figures for Staten Island were not included throughoutthe analysis due to the small number of buildings inthe data sets). Examining median figures, the medianrent citywide was $827. At the borough level, medianmonthly rent was $1,101 in Manhattan, $866 inQueens, $753 in Brooklyn and $699 in the Bronx.
Many owners of stabilized buildings augmentincome from their apartment rents by selling servicesto their tenants as well as by renting commercial space.
Current RPIE filings show an average monthly grossincome of $1,088 per rent stabilized unit in 2007, withpre-war buildings earning $1,039 per unit and those inpost-war properties earning $1,200 per unit. Grossincome was highest in Core Manhattan at $1,874 perunit per month, and lowest in the Bronx at $775.Monthly income per unit in the City, excluding CoreManhattan, was $870. These gross income figuresencompass rent from stabilized apartments as well asthe sale of services (e.g. laundry, vending, parking) andcommercial income. Such proceeds accounted for a10.4% share of the total income earned by buildingowners in 2007, higher than the prior year’s 10.1%share. By borough, income earned from the sale ofservices was 15.0% in Manhattan (15.9% in CoreManhattan and 12.2% in Upper Manhattan); 5.2% inQueens; 5.3% in Brooklyn; and 7.3% in the Bronx. Thegraph on this page shows the average rent and incomecollected in 2007 by borough, and for the City as awhole. Median citywide income in 2007 was $884. Atthe borough level, Manhattan had the highest median
Average Monthly Collected Rent/Income per Dwelling Unit by Borough*
$0 $200 $400 $600 $800 $1000 $1200 $1400 $1600
NYC w/out Core Manhattan
NYC
Bronx
Brooklyn
Queens
Upper Manhattan
Core Manhattan$1,874
$1,575
$1,016
$892
$932
$884
$840
$795
$775$718
$1,088$974
$870
$808
RentIncome
$1800
Stabilized Rent and Income Were Highest in Manhattan in 2007
* See Endnote 1Note: Core Manhattan represents the area south of W 110th and E 96th Streets.Upper Manhattan is the remainder of the borough.Source: NYC Department of Finance, 2007 RPIE Filings
28 • Income and Expense
2009 Income and Expense Study

income, at $1,275, followed by Queens at $895,Brooklyn at $788 and the Bronx at $746. (For rent andincome averages and medians by borough and buildingage and size, see Appendices C.3 and C.4.)
Comparing Rent Measurements
Another data source, NYS Division of Housing andCommunity Renewal (DHCR) annual registration data,provides important comparative rent data to thecollected rents stated in RPIE filings. A comparison ofthe collected RPIE rents to the DHCR rents is a goodindicator of the overall rental market and reflects bothhow well owners are able to collect the rent roll andthe prevalence of vacancies.
Rents included in RPIE filings are different thanDHCR figures primarily because of differences in howaverage rents are computed. RPIE data reflects actualrent collections that account for vacancies or non-payment of rent. By contrast, DHCR data consists oflegal rents registered annually with the agency. SinceDHCR rent data does not include vacancy andcollection losses, in most years these rents aregenerally higher than RPIE rent collections data.Furthermore, RPIE information includes unregulatedapartments in buildings containing rent stabilizedunits. Also, the RPIE information reflects rentscollected over a 12-month period while DHCR datareflects rents registered on April 1, 2007. In sum,despite the anomalies between the two rent indicators,the difference between RPIE rents and DHCR rents is agood estimate of vacancy and collection lossesincurred by building owners, and the relative change inthe gap is one way of estimating the change in suchlosses from year to year.
In comparing annual RPIE and DHCR averagerents from 1991 to 2001, the gap between the twocontracted steadily during that time period. In fact,from 1991-2001, the difference between RPIE andDHCR rents decreased by almost two-thirds, from adifference of 15% between the two in 1991 to adifference of 5.6% in 2001. However, since that time,the gap has grown almost every year, to as much as13.9% in last year’s Income and Expense Study, but itdropped to 13.6% this year, as indicated by the averageI&E rent of $974 and DHCR’s mean stabilized rent of
0%
80%
84%
88%
92%
96%
100%
'07'06'05'04'03'02'01'00'99'98'97'96'95'94'93'92'91'90
Source: DHCR Annual Rent Registrations;NYC Department of Finance, 1990-2007 RPIE Filings
Percentage of Legal RentCollected Increases in 2007
Average Monthly Citywide Collected Rentsas a Share of Average Monthly DHCR
Legal Registered Rents, 1990-2007
RPIE Rent Growth Grew Faster thanBoth RGB Rent Index and DHCR Rent
RPIE DHCR RGBRent Rent Rent
Growth Growth Index(Adjusted)§ (Adjusted)Ø
90-91 3.4% 4.1% 4.1%91-92 3.5% 3.0% 3.7%92-93 3.8% 3.0% 3.1%93-94 4.5% 2.4% 2.9%94-95 4.3% 3.1% 3.1%95-96 4.1% 4.1% 4.5%96-97 5.4% 4.6% 5.2%97-98 5.5% 3.3% 3.7%98-99 5.5% 3.7% 3.8%99-00 6.2% 4.4% 4.2%00-01 4.9% 5.3% 5.0%01-02 4.0% 4.4% 4.5%02-03 3.6% 6.9% 4.1%03-04‡ - 1.6% 5.5%04-05 4.6% 5.8% 4.6%05-06 5.6% 7.2% 4.3%06-07 6.5% 6.0% 4.2%1990 to2007* 108.8% 103.7% 99.0%
* Not adjusted for inflation§ See endnote 3 Ø See endnote 5‡ See endnote 6Source: DHCR Annual Rent Registrations; NYCDepartment of Finance, 1990-2007 RPIE Filings
Rent Comparisons, 1990-2007
2009 Income and Expense Study
Housing NYC: Rents, Markets and Trends 2009 • 29

$1,127.3 This gap between collected and legal rentindicates that building owners are not collecting thefull amount of their legal rent rolls (see graph onprevious page).
At the borough level, the gap between collectedand legal rent varies widely. In 2007, Manhattanproperty owners collected an average rent of $1,322,9.0% lower than DHCR’s average legal rent of $1,453for Manhattan. In the other boroughs, the differenceswere greater, with collected average rents that were17.0% lower than legal rents in Queens; 17.8% lowerin Brooklyn; and 21.1% lower in the Bronx. At leastpart of this differential in the boroughs is due topreferential rents, usually offered when the legalstabilized rent exceeds the market rate for the area.4
Another benchmark that can help place RPIE rentdata in context is the RGB Rent Index, which measuresthe overall effect of the board’s annual rent increaseson contract rents each year. As the tableon the previous page shows, during the1990’s, average rent collection increaseswere more often higher than therenewal lease increases allowed by theRGB’s guidelines, while in the early2000’s, the RGB Rent Index was insteadhigher than rent collection increases.However, in the last two years, thetrend reversed itself and rent collectionshave now grown at a faster rate than theRGB Rent Index, with a 6.5% increasein rent collections from 2006 to 2007versus a 4.2% increase in the RGB RentIndex during the same period (adjustedto a calendar year).5 There are a numberof ways in which rents may be raisedbeyond the RGB’s guidelines, includingthe deregulation of apartment units aswell as through individual apartmentand building-wide improvements. Alonger view of the three indices showsthat overall, collected rents have grownfaster than either DHCR legal rents orRGB rent guidelines from 1990 to 2007.During that period, RPIE collected rentsincreased 108.8%, the adjusted RGBRent Index increased 99.0%, and
DHCR adjusted legal rents increased 103.7% (thesefigures are not adjusted for inflation).6
Operating Costs
Rent stabilized apartment buildings incur several typesof expenses in order to operate efficiently. RPIE filingsinclude data on eight categories of operating andmaintenance (O&M) costs: taxes; labor; utilities;fuel; insurance; maintenance; administrative; andmiscellaneous costs. However, in contrast to revenues,this data does not distinguish between expenses forcommercial space and those for apartments, makingthe calculation of “pure” residential operating andmaintenance costs impossible, except in a smallersample of residential buildings. Thus, the operatingcosts reported are comparatively high because theyinclude maintenance costs for commercial space.
2009 Income and Expense Study
30 • Income and Expense
Post-46 Bldgs. Pre-47 Bldgs. All Stabilized
$0 $50 $100 $150 $200 $250
Insur.
Fuel
Misc.
Utilities
Admin.
Labor
Maint.
Taxes$159
$178$221
$122$118
$109$70
$85$121
$80$81$85
$69$72
$78$63$64$65
$102$97
$85$45
$43$39
Source: NYC Department of Finance, 2007 RPIE Filings
Taxes Are the Largest Expense in 2007
Average Monthly Expense perDwelling Unit per Month

Housing NYC: Rents, Markets and Trends 2009 • 31
2009 Income and Expense Study
The average monthly operating cost for stabilizedunits was $738 in 2007. Costs were lower in units inpre-war structures ($710), and considerably higheramong post-war buildings ($803). Geographically,average costs were lowest in the Bronx ($592),Brooklyn ($603) and Queens ($645) and highest inManhattan ($981). Looking more closely at Manhattanbuildings, costs for units located in Core Manhattanaveraged $1,115 a month while the costs in UpperManhattan were $753. The average monthly operatingcosts for stabilized building owners in New York City,excluding Core Manhattan, reduces the City averageto $634. Median citywide expenses in 2007 were$637. By borough, Manhattan had the highest mediancosts, at $790; followed by Queens at $612; the Bronxat $560; and Brooklyn at $559. The graph on theprevious page details average monthly expenses bycost category and building age for 2007. As the graphshows, taxes make up the largest share of expenses.(See Appendices C.1, C.2 and C.3 for a breakdown ofaverage costs by borough and building age. AppendixC.4 details median costs.)
In 1992, Department of Finance and RGB stafftested RPIE expense data for accuracy. Initialexaminations found that most “miscellaneous” costswere actually administrative or maintenance costs,while 15% were not valid business expenses. Furtheraudits on the revenues and expenses of 46 rentstabilized properties discovered that O&M costs statedin RPIE filings were generally exaggerated by 8%. Coststended to be less accurate in small (11-19 units)properties and most precise for large (100+ units)buildings. However, these results are somewhatinconclusive since several owners of large stabilizedproperties refused to cooperate with the Department ofFinance’s assessors. Adjustment of the 2007 RPIE O&Mcost ($738) by the results of the 1992 audits results in anaverage monthly O&M cost of $678 citywide.
Just as buildings without commercial space typicallygenerate less revenue than stabilized properties withcommercial space, operating expenses in thesebuildings tend to be lower on average than in buildingswith a mixture of uses. This year, unaudited averageO&M costs for “residential-only” buildings were $690per month, while average audited O&M costs for unitsin “residential-only” buildings were $633 per month.
"Distressed" Buildings
Buildings that have operating and maintenance costsgreater than gross income are considered distressed.Among the properties that filed 2008 RPIE forms, 1,363buildings, or 10.3% of the cross-sectional sample, hadO&M costs in excess of gross income, down from10.7% found the prior year. In 2007, only 93 (6.8%)of these distressed buildings were built after 1946. After1990, when 13.9% of the sample of stabilizedproperties were considered distressed, the proportionof distressed buildings declined each year until 1999,reaching a low of 6.1%. Since then, the proportiongenerally increased until 2004, after which it has gonedown for the last three years (see graph on this page).Most distressed stabilized properties are mid-sized (20to 99 units), pre-war and are located in Manhattan,Brooklyn and the Bronx. (See Appendix C.7 for abreakdown of distressed buildings by borough,building size and building age.)
Net Operating Income
In most stabilized buildings, revenues exceed operatingcosts, yielding funds that can be used for mortgagepayments, improvements and/or pre-tax profit. Theamount of income remaining after all operating andmaintenance (O&M) expenses are paid is typically
0%
3%
6%
9%
12%
15%
'07'05'03'01'99'97'95'93'91
Source: NYC Department of Finance, 1990-2007 RPIE Filings
Share of Distressed PropertiesDecreased in 2007
Percent of Distressed Properties inCross-Sectional Samples 1990-2007

referred to as “Net Operating Income” (NOI). Whilefinancing costs, income taxes and appreciationdetermine the ultimate value of a property, NOI is agood indicator of its basic financial condition.Moreover, changes in NOI are easier to track on anaggregated basis than changes in profitability, whichrequire an individualized examination of return oncapital placed at risk.
On average, apartments in rent stabilized buildingsgenerated $349 of net income per month in 2007, withunits in post-war buildings earning more ($397 permonth) than those in pre-war buildings ($329 permonth). Average monthly NOI tended to beconsiderably greater for stabilized properties inManhattan ($575) than for those in the other boroughs:$182 per unit per month in the Bronx, $236 inBrooklyn and $288 in Queens. There was a significantdifference when looking at NOI on a sub-boroughlevel in Manhattan. Core Manhattan properties earnedon average $760 per unit per month in NOI, whileproperties in Upper Manhattan had an NOI of $263.The monthly NOI average calculated citywide,excluding Core Manhattan, was $236. Looking at theNOI using audited expense figures, the citywide NOIin 2007 was $410. Average monthly NOI in“residential-only” properties citywide was $318 perunit in 2007, 9.0% lower than the mean for allstabilized buildings.
NOI reflects the revenue available after paymentof operating costs, that is, the money owners have forfinancing their buildings, making improvements, andfor pre-income tax profits. While NOI should not bethe only criteria to determine the ultimate profitabilityof a particular property, it is a useful exercise tocalculate the annual NOI for a hypothetical “averagestabilized building” with 11 units or more. Multiplyingthe average unaudited monthly NOI of $349 perstabilized unit by the typical size of buildings in thisyear’s cross-sectional sample (47 units) yields anestimated mean annual NOI of about $197,000in 2007.
Operating Cost Ratios
Another way to evaluate the profitability of New YorkCity’s rent stabilized housing is by measuring the ratio
of expenses to revenues. Traditionally, the RGB hasused O&M Cost-to-Income and O&M Cost-to-Rentratios to assess the overall health of the stabilizedhousing stock, presuming that buildings are better offby spending a lower percentage of revenue onexpenses. The graph on this page shows how over theperiod from 1990-2007, the proportion of totalincome and rent collections spent on auditedoperating costs has fluctuated. The Cost-to-Incomeratio in 2007 is 62.3%, a decrease of one percentagepoint from the prior year’s 63.3%. This means that onaverage, owners of rent stabilized properties spentabout 62 cents out of every dollar of revenue onoperating and maintenance costs in 2007. Looking atunaudited expenses, the cost-to-income ratio in 2007was 67.9%. The audited median cost-to-income ratiowas 66.2% in 2007.
Examining the ratio of costs to rent collections,audited operating costs in 2007 were 69.6% ofrevenues from rent, a decrease of 0.8 percentage pointsfrom the prior year. Using unaudited expenses, thecost-to-rent ratio in 2007 was 75.8%. Looking at theaudited median cost-to-rent ratio, it was 70.7%in 2007.
Rents, income and costs per unit were on averagehighest in Core Manhattan in 2007 (see map andgraphs on the next page). When looking at the city
2009 Income and Expense Study
32 • Income and Expense
50%
55%
60%
65%
70%
75%
O&M to Rent O&M to Income
'07'05'03'01'99'97'95'93'91
Source: NYC Dept. of Finance, 1990-2007 RPIE Filings
Cost-to-Income and Cost-to-RentRatios Decline for Past Two Years
Ratios of Citywide Average MonthlyAudited O&M Costs to Average Monthly
Gross Income and Rent 1990-2007

Housing NYC: Rents, Markets and Trends 2009 • 33
2009 Income and Expense Study
with core Manhattan excluded, the average revenueand costs figures are generally lower, resulting inexpense to revenue ratios that are different. The Cost-to-Income Ratio for the rest of the City was 66.9%,considerably higher than the Cost-to-Income Ratio forstabilized buildings in Manhattan’s Core (54.6%).These figures indicate that on average, owners ofstabilized properties outside of Core Manhattan spendabout twelve cents more of every dollar of revenue onexpenses compared to their counterparts in CoreManhattan.
In an attempt to capture the financial health ofsmall rent stabilized buildings, this year staff analyzedincome and expense data for buildings with fewer than11 units. As stated earlier, owners of rent stabilizedbuildings with less than 11 units are not required to fileRPIE forms. However, they can voluntarily file an RPIEEZ form with the Department of Finance. Theinformation on this form is limited, containing onlygross income and expense for each building. Rent isnot reported separately so a cost to rent ratio could notbe calculated. In addition, the summary data obtained
by Finance is building-wide. Therefore the cost-to-income ratios reported are not per unit but rather perbuilding. A total of 514 buildings with fewer thaneleven units were examined.
Citywide, the average cost to income ratio for rentstabilized buildings with fewer than 11 units was66.1% in 2007, with an unaudited ratio of 72.0%. Themedian cost to income ratio was 65.9% while theunaudited median ratio was 71.7%.
Net Operating Income After Inflation
The amount of net operating income is a function ofthe level of expense and the level of revenue in a givenyear (revenues minus operating expenses equals netoperating income). Adjusting NOI as well as rent,income and costs figures for inflation (in constant 2007dollars) and comparing different base years to the latestdata available is a useful way to assess the health of thestabilized housing stock and how well revenues havebeen meeting or exceeding expenses without erosionby inflation.
Average Monthly Rent, Income, Operating Costs and Net Operating Income perDwelling Unit and Cost-to-Income Ratios, Core Manhattan and the Rest of the City, 2007
Core Manhattan NYC without
Core Manhattan
Cost-to-Income Ratio*
54.6%Cost-to-Income Ratio*
66.9%
$0$250$500$750
$1000$1250$1500$1750$2000
NOICostsIncomeRent$0
$250$500$750
$$1250$1500$1750$2000
NOICostsIncomeRent
$1000
Cost-to-Income Ratio Lower in Core Manhattan in 2007
*Note: Ratios use audited costs.Source: NYC Department of Finance, 2007 RPIE Filings

Converting income and expense figures intoconstant 2007 dollars helps to analyze how much NOIhas grown in real terms since the RGB began collectingRPIE data from a significant number of buildings. Point-to-point comparisons of average monthly figures showthat from 1990 to 2007, after adjusting for inflation,NOI (the surrogate measure for profit) has increased17.2% (see graph on this page). This indicates thatrevenues have outpaced expenses to the extent thataverage monthly NOI was worth 17.2% more in 2007than it was in 1990, after adjusting for inflation.7
Another way to look at how rent, income, costsand NOI have changed absent the effect of inflation isto graph inflation-adjusted monthly figures for each ofthe four components measured in the I&E studies.During the 1990 to 2007 period, inflation-adjusted rentincreased a cumulative 18.0%, income by 17.7%,costs by 18.0% and NOI by 17.2%.
Since 1990, the ratio of NOI to income varied.From 1990-96 the ratio of NOI/income averaged 33%;while from 1997-2002, NOI’s share of incomeaveraged 39%. In the last five years, the average ratioof NOI/income was about 31%.
While the citywide graph of inflation-adjustedrevenue, expense and NOI figures is useful fordemonstrating the overall stabilized rental housingmarket, disaggregating the same figures by boroughshows how the market can differ from area to area(see graphs on next page). Looking at each of theboroughs individually, from 1990 to 2007,Manhattan, Brooklyn and Queens all saw double-digit increases in their net income, with Brooklynseeing the largest increase, 24%, followed closely byManhattan, up 23%, and Queens, up 20%, while theBronx saw a more modest 3% increase in NOI overthe same period.
34 • Income and Expense
2009 Income and Expense Study
Citywide Income, Rents, Costs andNOI After Inflation, 1990-2007
$0
$100
$200
$300
$400
$500
$600
$700
$800
$900
$1000
$1100
'07'06'05'04'03'02'01'00'99'98'97'96'95'94'93'92'91'90
RentIncome Costs NOI
Costs18.0%
NOI17.2%
Income17.7%
!!
Rents18.0%!
!
After Inflation, NOI Up Since 1990(Average Monthly Income, Rent, Operating Costs and NetOperating Income per Dwelling Unit in Constant 2007 Dollars)
Note: Percent changes are point-to-point measurements and should not be considered cumulatively.Source: RGB Income and Expense Studies, 1992-2009. NYC Department of Finance, 1990-2007 RPIE Filings

Longitudinal StudyThe longitudinal section of this study measureschanges in rent, income, costs, net operating income,operating cost ratios, and net operating income thatoccurred in the same set of buildings from 2006to 2007.
Rents and Income
Rent collections increase for many reasons, includingincreases allowed under RGB renewal guidelines,vacancy allowances of 17-20% allowed under the RentRegulation Reform Act of 1997 and investments inapartment and building-wide improvements.
Income, Rents, Costs and NOI After Inflation per Borough, 1990-2007
$0
$200
$400
$600
$800
$1000
$1200
$1400
$1600
'07'05'03'01'99'97'95'93'91
Manhattan 1990-2007
Costs19%
NOI23%
Income21% ! !! Rents
22%!
Bronx 1990-2007
Costs21%
NOI3%
Income16% !Rents
13%
Costs20%
NOI24%
Income21% ! !! Rents
20%!
Brooklyn 1990-2007
Queens 1990-2007
Costs17%
NOI20%
Income18% ! !! Rents
18%!
$0
$200
$400
$600
$800
$1000
$1200
$1400
$1600
$0
$200
$400
$600
$800
$1000
$1200
$1400
$1600
$0
$200
$400
$600
$800
$1000
$1200
$1400
$1600
'07'05'03'01'99'97'95'93'91
'07'05'03'01'99'97'95'93'91
'07'05'03'01'99'97'95'93'91
! ! !
Since 1990, Inflation-Adjusted NOI Rises in All Boroughs(Average Monthly Income, Rent, Operating Costs and Net Operating Incomeper Dwelling Unit in Constant 2007 Dollars)
Note: Percent changes are point-to-point measurements and should not be considered cumulatively.Source: RGB Income and Expense Studies, 1992-2008. NYC Department of Finance, 1990-2007 RPIE Filings
2009 Income and Expense Study
Housing NYC: Rents, Markets and Trends 2009 • 35

Average rent collections in stabilized buildingsrose by 6.5% in 2007. Rent collections in post-warbuildings grew at a lesser rate, up 5.8%, than pre-war buildings, which increased by 6.8%. Rentcollections for stabilized units increased by 7.3%,6.4% and 6.3% for small (11-19 unit), medium (20-99 unit) and large (100+ unit) buildings respectively.Examining rent collections by borough, Manhattansaw the largest increase, up 7.2%, with UpperManhattan seeing rent growth of 6.2% and CoreManhattan seeing a 7.6% increase. The otherboroughs also saw increased rent collections, up6.0% in both Brooklyn and Queens, and up 5.5% inthe Bronx. The median growth in rent citywidewas 5.9%.
Looking at rent collections throughout New YorkCity, every community district but one saw increasesfrom 2006 to 2007.8 Six out of eleven neighborhoodsin Manhattan saw average rent growth that was 7.3% orhigher, with Chelsea/Clinton seeing the highest rentgrowth (11.5%); followed by Greenwich Village, up
8.8%; and the Lower East Side/Chinatown, up 8.3%.Districts outside Manhattan also seeing high rentgrowth include Williamsburg/Greenpoint, Brooklyn, up9.3%; Jamaica, Queens, up 8.4%; Astoria, Queens, up8.3% and South Crown Heights, Brooklyn, up 8.2%.The district with the highest rent growth in the Bronxwas Pelham Parkway, up 7.3%. By contrast, onlyBayside/Little Neck in Queens saw a decline in averagerent, down 0.2% from 2006 to 2007. Districts with lowrent increases include the North Shore of Staten Island,up 0.9%; Coney Island, Brooklyn, up 2.6%; andHillcrest/Fresh Meadows, Queens, up 2.9%. TheManhattan district seeing the lowest rent growth wasWashington Heights/Inwood, up 5.4%. See the map onthis page for a breakdown of rent increases bycommunity districts throughout New York City.
The total income collected in rent stabilizedbuildings, comprising apartment rents, commercialrents and sales of services, increased by 6.5% from2006 to 2007. Revenues rose faster in pre-warbuildings, up 6.8% than in post-war buildings, up5.8%. Manhattan saw the highest growth in income,rising 7.1%, followed by Brooklyn, up 6.2%, and bothQueens and the Bronx, up 5.8%. The gross income ofCore Manhattan properties grew by 7.2%, while UpperManhattan income grew 6.6%. The median growth inincome citywide was 6.4%.
Operating Costs
Expenses in stabilized buildings rose 5.2%, a lowerrate of increase than in both rents and total incomefrom 2006 to 2007. Operating costs went up more inolder, pre-war buildings, up 5.7%, than in post-warbuildings, which rose 4.2%. While I&E studies havefound that rent and income revenues tend to rise atrates similar to one another, operating cost increasesare much more variable, often the result of volatilechanges in the cost of fuel, maintenance, insurance orutilities. This year costs rose most rapidly in the Bronx,up 5.9%; Brooklyn, up 5.4%; and Manhattan, up5.2%. Queens saw the smallest increase in expenses,up 3.9%. The median citywide increase in expenseswas 5.1%. For a detailed breakdown of the changes inrent, income and costs by building size age andlocation, see Appendices C.9 and C.10.
36 • Income and Expense
2009 Income and Expense Study
7.3% or more
6.3% — 7.2%
5.2% — 6.1%
5.0% or less
Not Applicable
Source: NYC Department of Finance, 2006-07 RPIE Filings
Rent Increases Vary byCommunity Districts
Changes in Rents by CommunityDistricts, 2006-2007

RPIE Expenses and the PIOC
Data from the RPIE and the RGB’s long-running survey,the Price Index of Operating Costs (PIOC), eachprovide a form of independent verification for theexpense findings in the other. However, comparison ofI&E and PIOC data is somewhat distorted due todifferences in the way each instrument defines costsand time periods. For example, there is a differencebetween when expenses are incurred and actually paidby owners as reported in the RPIE, versus the pricequotes obtained from vendors for specific periods assurveyed in the PIOC. In addition, the PIOC primarilymeasures prices on an April-to-April basis, while mostRPIE statements filed by landlords are based on thecalendar year. (See endnote 3.) To compare the two,weighted averages of each must be calculated, whichmay cause a loss in accuracy. Finally, the PIOCmeasures a hybrid of costs, cost-weighted prices andpure prices, whereas the RPIE provides unaudited
owner-reported costs. The PIOC rose 7.1% from 2006to 2007, the same period as the 5.2% increase in I&Ecosts, a 1.9 percentage point difference. (See graph onthis page.)
From 1990-91 to 2006-07, cumulative growth inthe two indices seem to confirm the accuracy of oneanother in measuring expense changes for rentstabilized properties. Overall nominal costs measuredin the PIOC grew by 112.8% and in the I&E Studies by106.9% over this period.9
Operating Cost Ratios
Between 2006 and 2007, the proportion of grossincome spent on audited expenses (the O&M Cost-to-Income ratio) decreased by 0.8 percentage points. Theproportion of rental income used for audited expenses(the O&M Cost-to-Rent ratio) also decreased, down by0.9 percentage points. This is the second year that both
Change in Operating & Maintenance Costs, I&E and the PIOC, 1990 to 2007
0%
2%
4%
6%
8%
10%
12%
14%
'07'06'05'04'03'02'01'00'99'98'97'96'95'94'93'92'91'90
7.2%
7.1%
5.4% 5.
9%
0.6% 3.
5%
0.1%3.
3%
2.5%
4.8%
6.9%
12.3
%
0.7%
7.3%
PIOC (adjusted) Income & Expense
1.0%1.
5%4.5%
2.5%
4.5%
3.4% 4.
5%4.
2%2.
7%
8.5%
8.4% 9.
4%12
.5%
6.0%
5.8%
4.1%
2.1%
1.9%
6.1% 7.
1%5.
2%
In 2007, the PIOC Increased at a Greater Rate thanOwner-Reported RPIE Costs
*Longitudinal income and expense data for 2003-04 is unavailable (see endnote 6).Note: Beginning with the 2008 I&E Study, the PIOC increase was adjusted from the April-to-April to theJanuary-to-December calendar year. This was a revision from prior I&E Studies.Source: NYC Department of Finance, 1990-2007 RPIE Filings; PIOC 1990-2007
2009 Income and Expense Study
Housing NYC: Rents, Markets and Trends 2009 • 37

O&M Cost-to-Income and O&M Cost-to-Rent ratiosfell, after increases in each of the previous five years.
Net Operating Income
Since revenues grew faster than average operatingcosts during 2007, citywide net operating income inrent stabilized buildings increased by 9.3%. Asdiscussed earlier, NOI refers to the earnings thatremain after operating and maintenance (O&M)expenses are paid, but before payments of income taxand debt service.
The change in NOI from 2006-07 differed amongthe boroughs. Manhattan and Queens saw the largestincreases in NOI, up 10.3% and 10.2%, respectively;while Brooklyn’s NOI rose 8.2% and the Bronx saw anincrease of 5.5%. Both sections of Manhattan sawincreases in NOI, up 10.6% in Core Manhattan and9.1% in Upper Manhattan.
The map on this page shows that change in NOIvaried across New York City. Among each of the
boroughs, the Bronx saw significantly varying changesin NOI, with two districts (Throgs Neck/Co-op City andPelham Parkway) seeing NOI growth of over twentypercent, while five districts saw declines in NOIranging from -0.7% to -14.4%. Other districts seeingNOI growth of over 20% include Bedford-Stuyvesant,Brooklyn and Jamaica, Queens. Meanwhile, onedistrict in Queens (Kew Gardens/Woodhaven) and twodistricts in Brooklyn (Brownsville/Ocean Hill and EastNew York/Starett City) also saw declines in NOI. InManhattan, six districts saw double-digit increases inNOI, while the smallest increase in NOI in Manhattanoccurred in Washington Heights/Inwood, up 6.5%.(See endnote 8.)
ConclusionThe RPIE filings from over 13,200 rent stabilizedbuildings containing more than 620,700 units in thecross-sectional sample, and over 11,200 buildingscontaining over 537,900 units in the longitudinalsample, illustrate growing Net Operating Income.Increases in income outpaced smaller increases inexpenses in 2007. Citywide, revenue collectionsincreased 6.5%, while costs increased by 5.2%.Because of the greater increase in revenues from 2006to 2007, NOI citywide increased by 9.3%. In addition,all the boroughs saw an increase in NOI, and thenumber of distressed properties also fell from 2006 to2007, down 0.4 percentage points.
MethodologyThe information in this report was generated byanalyzing data derived from RPIE forms filed with theNYC Department of Finance in 2008 by owners ofapartment buildings with primarily eleven or moredwelling units. The data in these forms, which reflectsfinancial conditions in stabilized buildings for the year2007, was made available to RGB research staff inMarch, 2009 for analysis. Unit averages contained inthis analysis were computed by the Department ofFinance. The averages were then weighted by the RGBusing data from the 2005 NYC Housing and VacancySurvey to calculate means that are representative of thepopulation of residential buildings in New York City.
38 • Income and Expense
2009 Income and Expense Study
13.0% or more
8.3% — 12.9%
4.9% — 7.9%
1.2% or less
Not Applicable
Source: NYC Department of Finance, 2006-07 RPIE Filings
Net Operating Income ChangesVary by Community District
Change in NOI by CommunityDistrict, 2006-07

In addition, medians were calculated and included inthis report. The medians derived from the sample wereproduced by the Department of Finance and areunweighted.
As in past studies, two types of summarized data,cross-sectional and longitudinal, were obtained forstabilized buildings. Cross-sectional data, whichprovides a “snapshot” or “moment-in-time” view,comes from properties that filed 2007 RPIE oralternatively, TCIE (Tax Commission Income &Expense) forms. Data from the forms was used tocompute average and median rents, operating costs,etc., that were typical of the year 2007. Longitudinaldata, which provides a direct comparison of identicalelements over time, encompasses properties that filedRPIE/TCIE forms for the years 2006 and 2007. The
longitudinal data describes changing conditions inaverage rents, operating costs, etc., by comparingforms from the same buildings over two years. Thus,cross-sectional data in this report measures conditionsin effect throughout 2007, while longitudinal datameasures changes in conditions that occurred from2006 to 2007.
This year, 13,201 rent stabilized apartmentbuildings were analyzed in the cross-sectional studyand 11,265 stabilized properties were examined in thelongitudinal study. The sample of buildings was createdby matching a list of properties registered with theDHCR against building data found in 2007 RPIE orTCIE statements (or 2006 and 2007 statements for thelongitudinal sample). A building is considered rentstabilized if it contains at least one rent stabilized unit.
Growth in Income Outpaces Increases in Expenses from 2006-2007
Avg. Rent Growth Avg. Income Growth Avg. Cost Growth Avg. NOI Growth
90-91 3.4% 3.2% 3.4% 2.8%91-92 3.5% 3.1% 4.2% 1.2%92-93 3.8% 3.4% 2.1% 6.3%93-94 4.5% 4.7% 2.5% 9.3%94-95 4.3% 4.4% 2.5% 8.0%95-96 4.1% 4.3% 5.4% 2.3%96-97 5.4% 5.2% 1.9% 11.4%97-98 5.5% 5.3% 1.5% 11.8%98-99 5.5% 5.5% 3.5% 8.7%99-00 6.2% 6.5% 8.4% 3.5%00-01 4.9% 5.2% 4.8% 5.9%01-02 4.0% 4.1% 6.9% -0.1%02-03 3.6% 4.5% 12.5% -8.7%03-04 - - - -04-05 4.6% 4.7% 6.0% 1.6%05-06 5.6% 5.5% 4.1% 8.8%06-07 6.5% 6.5% 5.2% 9.3%
Source: NYC Department of Finance, 1990-2007 RPIE FilingsNote: Longitudinal data from 2003-04 is unavailable. See endnote 6.
Changes in Average Monthly Rents, Income, Operating Costs andNet Operating Income per Dwelling Unit, 1990-2007
2009 Income and Expense Study
Housing NYC: Rents, Markets and Trends 2009 • 39

2009 Income and Expense Study
Once the two samples were drawn, properties thatmet the following criteria were removed:
• Buildings containing fewer than 11 units. Owners ofbuildings with fewer than 11 apartments (withoutcommercial units) are not required to file RPIE forms;
• Owners did not file a 2007 RPIE or TCIE form for thecross-sectional study, or a 2006 and a 2007 RPIE orTCIE form for the longitudinal study;
• No unit count could be found in RPIE/TCIE records;and
• No apartment rent or income figures were recordedon the RPIE or TCIE forms. In these cases, forms wereimproperly completed or the building was vacant.
Three additional methods were used to screen thesamples so properties with inaccurate buildinginformation could be removed to protect the integrityof the samples:
• In early I&E studies, the Department of Finance usedthe total number of units from their Real PropertyAssessment Data (RPAD) files to classify buildings bysize and location. RGB researchers found thatsometimes the unit counts on RPIE forms weredifferent than those on the RPAD file, andconsequently deemed the residential counts from theRPIE form more reliable;
• Average monthly rents for each building werecompared to rent intervals for each borough toimprove data quality. Properties with average rentsoutside of the borough rent ranges were removedfrom all samples. Such screening for outliers iscritical since such deviations may reflect data entryerrors and thus could skew the analysis; and
• Buildings in which operating costs exceeded incomeby more than 300% as well as buildings above the99th percentile or below the 1st percentile wereexcluded from both samples.
As in prior studies, after compiling both samples,the Department of Finance categorized sample datareflecting particular types of buildings throughout thefive boroughs (e.g. structures with 20-99 units). "
Endnotes1. RPIE rent figures include money collected for apartments, owner-
occupied or related space and government subsidies. Incomeencompasses all revenue from rents, sales of services, such aslaundry, valet and vending, and all other operating income.
2. Pre-war buildings refer to those built before 1947; post-warbuildings refer to those built after 1946.
3. According to the NYC Department of Finance, over 90% of ownersfiling RPIE’s report income and expense data by calendar year. Inprevious reports, adjusted DHCR data was calculated on a July-to-June fiscal year. Beginning with the 2008 Income and ExpenseStudy, adjustment of DHCR data was calculated on the January-to-December calendar year, so figures differ from that reported in prioryears. Further, the DHCR mean rent was revised for 2005-06.
4. Preferential rents refer to actual rent paid, which is lower than the“legal rent,” or the maximum amount the owner is entitled to charge.Owners often offer preferential rents when the current marketcannot bear the legal rent.
5. In previous reports, the adjusted RGB Rent Index was calculatedon a July-to-June fiscal year. Beginning with the 2008 Income andExpense Study, adjustment of the RGB Rent Index was calculatedon the January-to-December calendar year. Also see Endnote 3.
6. Longitudinal data from 2003-04 is excluded from this study becauseno longitudinal sample was available for 2003-04. Therefore, thegrowth in RPIE collected rents is understated.
7. In previous I&E Studies the analysis of inflation adjusted numbersused 1989 as the base year. In the 2008 Income and ExpenseStudy, the RGB began using 1990 as the base year for comparisonbecause that is when data from a significant number of buildingsbecame available due to the computerization of income andexpense data filings. In 1989, there were 500 buildings in thecross-sectional sample, of which 250 were pre-war and 250 post-war. This small sample size did not accurately represent theuniverse of predominantly pre-war rent stabilized buildings. Butbeginning in 1990, there were over fourteen thousand buildings.
8. Eight Community Districts were excluded from this analysisbecause they contained too few buildings for the data to be reliable.Unlike Citywide and borough level rent and expense data, averageCD rents and expenses are unweighted and do not necessarilyrepresent the population of buildings in these Community Districts.All averages were computed by the Department of Finance.
9. Due to the unavailability of RPIE longitudinal data for 2003-04,PIOC data from the same period is excluded from this comparison.
40 • Income and Expense


Housing NYC: Rents, Markets and Trends 2009 • 43
New York City Rent Guidelines Board
2009 Mortgage Survey Report
IntroductionSection 26-510 (b)(iii) of the Rent Stabilization Law requires the RentGuidelines Board to consider the “costs and availability of financing(including effective rates of interest)” in its deliberations. To assist the Boardin meeting this obligation, each winter the RGB research staff surveys lendinginstitutions that underwrite mortgages for multifamily rent stabilizedproperties in New York City. (See Appendix E.7 for a reproduction of thesurvey.) The survey provides details about NewYork City’s multifamily lendingmarket during the 2008 calendar year as well as the first few months of 2009.
The survey is organized into three sections: financing availability andterms for rent stabilized buildings; underwriting criteria; and additionalmortgage questions, including vacancy and collection losses, operating andmaintenance expenses, and portfolio performance information. In addition tothe survey analysis, a section added last year, rent stabilized building salesdata, is again included in this report.
SummaryThe 2009 Mortgage Survey revealed a more cautious lending market. Whilelending standards changed little from last year, some institutions are limitedby constraints on availability of capital, while others remain relativelyunaffected. Despite intensive efforts by the Federal Reserve Board to free upcapital, both the average interest rate in 2008 and the current (as of February2009) interest rate showed increases over the prior year. The lending marketwas minimally impacted by seven decreases in the Federal Reserve Board’sfederal funds rate and eight decreases in the discount rate during 2008.1
Furthermore, both new loan and refinanced loan volume declined in 2008.Average up-front fees, called points, increased again this year after fallingtwo years ago to their lowest level in the history of the survey. However,despite increasing rates of defaults among private homeowners, lendersreported few non-performing loans or foreclosures among their rent stabilizedportfolios. Our follow-up analysis of rent stabilized building sales datashowed an overall decline in both rent stabilized building sale prices andvolume citywide from 2007 to 2008, with some variation among theboroughs and building sizes.
This report will more fully detail these issues by beginning with adiscussion of the characteristics of the survey respondents, followed by botha cross-sectional and longitudinal analysis of financing availability and terms,underwriting criteria, portfolio performance and an overview of lenders’expectations and the characteristics of typical buildings in their portfolios.
! Average interest ratesfor new multifamilymortgages increased0.35 percentage points,or 5.8%, to 6.46%.
! Refinancing interest ratesgrew by 0.39 percentagepoints to 6.50%.
! Average points for newloans rose 0.18 points, to0.62 points.
! New loan volume fell23%, while refinancedloan volume dropped31%.
! Vacancy and collectionlosses increased to4.38%, up from 3.69%the prior year.
! Average maximum loan-to-value ratios droppedto 74.3% in 2008, downfrom 76.7% the prioryear.
! In 2008, 1,021 buildingscontaining rent stabilizedunits were sold citywide,down 31% from the prioryear.
What’s New

Survey RespondentsSixteen financial institutions responded to this year’ssurvey, two fewer than last year.2 The number ofeligible lenders continues to decline primarily due tothe merger of some previous survey respondents. Inrecent years, the merger of financial institutions hasresulted in fewer remaining lenders that are eligible tocomplete the survey. The survey sample is regularlyupdated to include only those institutions offeringloans to multiple dwelling, rent stabilized properties inNewYork City. This year’s respondents include a varietyof traditional lending institutions, such as savings andcommercial banks, as well as non-traditional lenders.Among the respondents, all but one also responded tolast year’s survey.
Institutions holding deposits insured by the FDICsupply details about their holdings on a quarterly basis,including their multifamily real estate holdings, whichvary considerably among this year’s respondents.
Thirteen survey respondents report their multifamilyreal estate holdings to the FDIC, with values rangingbetween $17.2 million and $7.7 billion.3 Six of thisyear’s institutions reported multifamily holdings of overone billion dollars, while three institutions had holdingsof less than $100 million. Compared with last year, theaverage multifamily real estate portfolio of our surveyrespondents decreased by 9.1%, to $1.68 billion.
Cross-Sectional Analysis
Financing Availability and Terms
As of February 2009, this year’s average interest rate of6.46% for new multifamily mortgages increased 0.35percentage points, or 5.8%, from the previous February(see graph on this page and Appendix E.1).
Reflecting the fact that interest rates increased asthe year progressed, the average rate reported for all of
Average Interest Rates for New Loans to Rent Stabilized Buildings, 1981-2009
0%
5%
6%
7%
8%
9%
10%
11%
12%
13%
14%
15%
16%
17%
2009
2008
2007
2006
2005
2004
2003
2002
2001
2000
1999
1998
1997
1996
1995
1994
1993
1992
1991
1990
1989
1988
1987
1986
1985
1984
1983
1982
1981
Multifamily Mortgage Interest Rates Increase Over Prior Year
Note: 2008 figures have been slightly revised due to the removal of one lender. See endnote 2.Source: Rent Guidelines Board, annual Mortgage Surveys.
44 • Income and Expense
2009 Mortgage Survey Report

2008 was 6.26%, lower than current reported rates, and a 0.21percentage point (or 3.5%) increase from 2007.
As in prior years, a small number of large lenders provided a largeshare of the total volume of new and refinanced mortgages. Of allrespondents, four provided 82% of the total volume of new mortgages.Adjusting for the varying share of loan volume among the respondinginstitutions, the weighted interest rate for 2008 was 6.10% for neworiginations, lower than the overall average interest rate of 6.26%. Theweighted interest rate takes loan volume into account, so the interestrates of larger lenders count more than those lenders with fewer loans.
Average interest rates increased during the year among theinstitutions surveyed despite numerous decreases in the federal funds anddiscount rates by the Federal Reserve Board throughout 2008. The Fedlowered the Discount Rate — the interest rate at which depositoryinstitutions borrow from the Federal Reserve Bank of New York — eighttimes during 2008, to reach 0.50%, and the Federal Funds Rate — theinterest rate at which depository institutions lend balances at the FederalReserve to other depository institutions — seven times to a range of zeroto 0.25% by the end of 2008. The Fed continued to lower rates in 2008as a reaction to a significant slowdown in the U.S. economy, but thisyear’s survey results seem to indicate the limited ability of the Fed toinfluence the economy and lending practices of institutions. The Fedbegan cutting both rates in the summer of 2007. By the end of 2008,with rate cuts having limited impact, the Fed announced that they wouldpump out vast amounts of money to businesses and consumers in anattempt to stimulate the economy.4
Surveying institutions regarding their refinanced mortgages foundthat most of them offered identical or similar terms to those for newloans. The average current rate charged for refinanced mortgages as ofFebruary 2009, 6.50%, was just 0.035 percentage points higher than theaverage current rate charged on new originations and 0.39 percentagepoints higher than last February. (See Appendix E.1) At 6.30%, average2008 refinancing rates were 0.22 percentage points higher than the prioryear’s refinancing rates.
Like interest rates, points (up-front service fees) that were charged fornew and refinanced loans increased from the prior year. Among surveyrespondents, they ranged from zero to two points, with six surveyedlenders charging no points on either new or refinanced loans.
The average service fee charged on new loans by lenders was 0.62points, a 0.18 point increase from last year’s average of 0.43. Average feesreported in the survey have remained around or below one point for morethan a decade (see graph on next page). Average points for refinancedmortgages were the same (0.62) as that charged on new originations.
Despite the ongoing economic challenges facing the bankingindustry, surveyed lenders, for the most part, remained flexible in theloan terms they offered their borrowers. Since survey respondents
Actual LTV - the typical loan-to-value ratio of buildings inlenders’ portfolios
Debt Service - the repaymentof loan principal and interest
Debt Service Ratio - netoperating income divided by thedebt service; measures the riskassociated with a loan; thehigher the ratio, the less moneyan institution is willing to lend
Loan-to-Value Ratio (LTV) -the dollar amount institutionsare willing to lend based on abuilding’s value; the lower theLTV, the lower the risk to thelender
Maximum LTV - the loan-to-value ratio set by the lenders aspart of their underwriting criteria
Points - up-front service feescharged by lenders as a directcost to the borrowers
Terms - the amount of time theborrower has to repay the loan;generally, the term should notexceed the remaining economiclife of the building
Terms andDefinitions
2009 Mortgage Survey Report
Housing NYC: Rents, Markets and Trends 2009 • 45

typically provide a wide range of terms rather than asingle number, it is difficult to give a precise average forthe range of terms offered by institutions, but theyremained similar to those offered in recent years.Mortgage terms reported by respondents fell within awide 3- to 30-year range. Seven lenders offered termsas long as 30 years, while just two offered a maximumof five years. This continued mortgage term flexibilityover recent years is in great contrast to terms found inthe surveys of the early- to mid-1990s, when close tohalf of respondents offered maximum loan maturitiesof just five years.
New loan volume decreased in 2008, the third yearin a row that volume declined. An average of 46 newloans per institution were financed this past year, down23% from 60 in 2007. While average loan volumedropped, not all lenders saw declines. In fact, while38% reported no change, 19% reported declines, and44% actually reported an increase in loan volume. Forthose institutions that saw loan volume increase, mostattribute it to an increase in loan applications, and a fewto an increased rate of approvals. These lenders, each
reporting no more than 60 new loans,represent just 23% of the total newloan volume this year. In addition,lenders were asked this year about theongoing financial crisis. One largeinstitution reportedly undergoingsevere financial hardship stated that ithas severly hampered their ability tomake loans, while several smalllenders suggested that the financialcrisis has made them more competitivein the lending marketplace.
While loan volume is stillgreater than in the late nineties, when,for instance, the 1998 MortgageSurvey showed an average of 37 newmortgages per lender, volume is downsignificantly from half a decade ago.For example, the 2004 MortgageSurvey measured an average new loanvolume of 160. As with new loans, theaverage number of refinanced loansdecreased as well, down 31% fromlast year, to 51 in this year’s survey. By
comparison, in the 2004 Survey, the average surveyedinstitution refinanced 173 loans.
Underwriting Criteria
For more than a decade, there has been a prolongedperiod of low delinquencies and defaults, suggestingthat institutions are willing to provide ample loanavailability and provide less stringent underwritingpolicies. This year’s survey reveals the implementationof tougher standards in lending practices among somesurveyed institutions.
For all institutions, the typical maximum LTV ratio— the maximum dollar amount respondents werewilling to lend based on a building’s value — rangedfrom 65% to 80%. The average was 74.3%, lower than2007’s 76.7% (see graph on next page).
Another important lending criterion is the debtservice ratio — an investment’s ability to covermortgage payments using its net operating income(NOI). The higher the debt service coveragerequirements, the less money a lender is willing to loan
0.0
0.2
0.4
0.6
0.8
1.0
1.2
1.4
1.6
1.8
2.0
2.2
2.4
2.6
2005
2004
2003
2002
2001
2000
1999
1998
1997
1996
1995
1994
1993
1992
1991
1990
1989
1988
1987
1986
1985
1984
1983
1982
1981
2006
2007
2008
2009
2.8
Note: 2008 figures have been slightly revised due to the removal of one lender.See endnote 2.
Source: Rent Guidelines Board, annual Mortgage Surveys.
Service Fees Increase Over Prior Year
Service Fees for New Loans to RentStabilized Buildings, 1981-2009
46 • Income and Expense
2009 Mortgage Survey Report

given constant net income. The debt service ratio (orNOI divided by the debt service) increased slightly thisyear, with an average debt service requirement of 1.23,up from 1.21 last year. Because the average debtservice ratio changed little, most lenders have notchanged the amount of money they are willing to lendin relation to the net operating income of buildings.(See Appendix E.2)
Half the lenders reported that they changed theirunderwriting standards since last year. The mostcommonly cited change were declines in themaximum loan-to-value ratio (LTV), reported by 38%of the lenders; an increase in monitoring requirements(31%); and higher points (25%).
In addition to changes in the aforementionedunderwriting standards, lenders cited additionalstandards that remain similar to recent years whenevaluating loan applications. The most commonlycited standard is good building maintenance, withalmost two-thirds of lenders indicating itsimportance. Also important is the number of units inthe building, with more than a third indicating thatbuildings should contain a certain number of units(typically specifying five or more units).
Our survey asked lenders whether their lendingstandards differ for rent stabilized buildings as opposedto non-stabilized multifamily properties. Respondentswere asked whether their new financing rates,refinancing rates, loan-to-value ratios, and debt servicecoverage requirements for rent stabilized propertieswere higher, lower, or the same as for other properties.The vast majority (86%) reported that standards wereno different for stabilized buildings.
Non-Performing Loans &Foreclosures
More lenders reported that they had non-performingloans this year, and those with non-performers sawthem make up a higher proportion in their portfolios.Five lenders reported having non-performing loansover the past year (up from three in 2007).
Similarly, more institutions reported that they hadforeclosures in 2008, though as a percentage of theirportfolios, that number remained the same. Fourlenders reported that they had foreclosures this year, andamong those institutions, one half of one percent of theirportfolios were in foreclosure, the same percentage asthe prior year. Of the lenders with non-performing loans,two reported default rates as high as 3%.
Characteristics of Rent StabilizedBuildings
Lenders surveyed about the average size of rentstabilized buildings in their portfolios reported that themost common building size is 20-49 units, with fivelenders reporting this as typical. The second mostcommon sized building is 50-99 units (four lenders);while buildings with fewer than ten units or 11-19 unitbuildings each represented the most commonly sizedbuildings for three lenders each in 2008. This year’sfindings were similar to last year.
Vacancy and collection (V&C) losses increased in2008, up to 4.38%, from 3.69% the prior year, and thehighest since 1999. (See graph on next page.) A similarproportion of lenders, 44%, reported losses of 5% ormore both this year and last.
Average operating and maintenance (O&M)expenses decreased 1.2%, to $537 per unit per month.
0%
60%
66%
72%
78%
'09'08'07'06'05'04'03'02'01'00'99'98'97'96
Note: 2008 figures have been slightly revised due to theremoval of one lender. See endnote 2.Source: Rent Guidelines Board, annual Mortgage Surveys.
Maximum Loan-to-Value Ratios Fall
1996-2009 Cross-Sectional AverageLoan-to-Value Standards
2009 Mortgage Survey Report
Housing NYC: Rents, Markets and Trends 2009 • 47

Meanwhile, average rents, as reported by this year’slenders, increased 5.2%, to $995. (See Appendix E.2)Because average rents rose while average expenses fell,the average O&M cost-to-rent ratio decreased to54.0%, down from 57.4% in the prior year.5
The Rent Guidelines Board, in our annual Incomeand Expense (I&E) Study, also examines the averageO&M cost-to-rent ratio. However, its findings shouldnot be compared to the cost-to-rent ratio reported inthis Mortgage Survey because both the sources andsample sizes are very different and the data studied ineach report are from different time periods. In the 2008I&E Study, which reported on data from the year 2006,the average O&M cost-to-rent ratio was 76.7%.6
The survey also asks lenders whether they retaintheir mortgages or sell them to secondary markets.Among the lenders, more than two-thirds ofrespondents (68.8%) retain all their mortgages, 18.8%sell all their mortgages, and 12.5% sell some of theirmortgages to secondary markets. These results aresimilar to that found in previous year. Of those
institutions that sell their mortgages, Freddie Mac andFannie Mae are the most commonly cited purchasers.
Lenders are asked whether the rent stabilizedbuildings which are offered mortgage financingcontain commercial space. This is helpful so as tounderstand the extent of income for owners fromsources other than residential tenants. Like the prioryear, all the lenders in this year’s survey report thatbuildings in their portfolio contain commercialspace, though the average amount varies dependingon the lender. Among the lenders, buildingscontaining commercial space represent, on average,23% of their lending portfolio, up from 21% in theprior survey.
Loan Expectations
The survey asks lenders about their portfolio’sperformance, compared with expectations at the timeof initial loan origination, with regard to net operatingincome (NOI), debt service coverage, and O&M
Average Vacancy and Collection Losses, 1996-2009
0% 3.0% 3.5% 4.0% 4.5%
1996
1997
1998
1999
2000
2001
2002
2003
2004
2005
2006
2007
2008
2009
Vacancy and Collection Losses Increased From Prior Year
Note: 2008 figures have been slightly revised due to the removal of one lender. See endnote 2.Source: Rent Guidelines Board, annual Mortgage Surveys.
48 • Income and Expense
2009 Mortgage Survey Report

expenses. This year, the vast majority of lenders (80%)felt that expectations in all three areas had been met fortheir rent stabilized portfolio, while 13% felt that someexpectations were exceeded and 7% reported at leastone expectation was not met in 2008.
In particular, 87% of lenders who responded to theNOI question felt that the income of their rentstabilized portfolio performed to expectations at thetime of initial loan origination, while 13% felt itoutperformed expectations, and none felt it fell short.Responses for debt service coverage and O&Mexpenses were similar to the NOI findings. (See graphon this page).
Longitudinal AnalysisInformation regarding rent stabilized buildings can beanalyzed longitudinally to more accurately measurechanges in the lending market, since a number ofrespondents reply to the Mortgage Survey in at leasttwo consecutive years. This longitudinal comparisonhelps to ascertain whether changes highlighted in thecross-sectional analysis reflect genuine fluctuations in
the lending market or simply the presence of a differentgroup of lenders from year to year. In this section,responses from the fifteen lenders who replied tosurveys both last and this year (the longitudinal group)were compared to underscore changes between 2008and 2009.
Financing Availability and Terms
This year’s longitudinal analysis reveals data that is verysimilar to this year’s cross-sectional sample.7 This year’saverage interest rate among the longitudinal group fornew financing, as of February 2009, was 6.42%, upfrom last year’s longitudinal group, which had anaverage interest rate of 6.11%. The average refinancingrate was likewise very close to that found among thecross-sectional group, at 6.46% as of February 2009,an increase from 6.11% a year earlier. (See AppendicesE.3 and E.4)
Among the longitudinal group, average pointsoffered by lenders changed little for both new andrefinanced loans. This sample reports an average of0.52 points for new loans, up from last year’s 0.50.Points on refinanced loans rose a little more, up fromlast year’s 0.46 to this year’s 0.52.
Like the cross-sectional group of lenders, thelongitudinal group saw loan volume decrease, falling19.5% from last year. Likewise, there was a 27.4%drop in refinanced loan volume.
Underwriting Criteria and LoanPerformance
The average maximum loan-to-value (LTV) ratio fell to74.8% among the longitudinal group, down from lastyear’s 76.5%. The average debt service ratio increased,up to 1.24 from 1.20 the prior year. (See Appendix E.5)Like the cross-sectional group, vacancy and collection(V&C) losses in the longitudinal group increased, goingfrom 4.00% last year to 4.40% this year.
Examining the rate of delinquencies among thelongitudinal group, an uptick in non-performing loanswas reported, while foreclosure remained about thesame. For additional comparisons between the cross-sectional and longitudinal groups, see table onnext page.
2009 Mortgage Survey Report
Housing NYC: Rents, Markets and Trends 2009 • 49
0%
10%
20%
30%
40%
50%
60%
70%
80%
90%
O&M ExpensesNet OperatingIncome
LowerHigherSame
Debt ServiceCoverage
Source: Rent Guidelines Board, annual Mortgage Surveys.
Lenders Report that Loans Meetor Exceed Most Expectations
2009 Performance of Rent StabilizedLoans as Compared to Expectations

Sales Data Analysis
In 2007, the NYC Department of Finance madeavailable to the public easily accessible property salesinformation for the five boroughs going back severalyears. Using this data, an analysis of rent stabilizedbuilding sales was contained in last year’s mortgagereport. This year, we follow-up with a look at the datafrom 2008, and compare it to 2007.
Building Sales Prices
In 2008, 1,021 buildings containing rent stabilizedunits were sold in New York City. The median,citywide sales price was $1,951,000, with the highestmedian sales price in Manhattan at $3,850,000followed by the Bronx ($2,435,000), Queens($1,626,304), and Brooklyn ($977,500). [Staten Islandwas not included in this analysis because there weretoo few rent stabilized building sales.]8
In order to compare sales prices from one year tothe next, staff examined sales by building size as wellas borough. This analysis attempts to control forlocation and size of the building that was sold. It doesnot take into account the condition of the buildingbeing sold, an important factor that cannot be studiedusing this data set. However, this analysis does revealthe general trends in building sale prices citywide andthroughout the boroughs from 2007 to 2008.
Among the smallest building size, 6-10 units,
median sales prices changed moderately. Citywide, inBrooklyn and in the Bronx, prices among the smallest-sized buildings increased as much as 9%, while pricesfell 4% in Queens and 3% in Manhattan from 2007 to2008. Among 11-19 unit buildings, price changes weremostly negative, down 10% citywide and as much as18% in Manhattan. Only the Bronx saw an increase inits sales price, up 7.5%.
Among 20-49 unit buildings, from 2007 to 2008,price changes ranged from as much as a 24% decline inManhattan to a 1% decline in the Bronx, with an overall19% decline in prices citywide. Looking at 50-99 unitbuildings, prices rose 15% citywide, and in each of theboroughs, rose in the Bronx (16%), Manhattan (14%)and Queens (13%) but fell 21% in Brooklyn. Because ofthe small number of 100+ unit buildings sold each year,we did not analyze the sales data for these buildings.See Appendix E.8 for the median sales prices in eachborough as well as the change from the prior yearamong different sized buildings.
Building Sales Volume
In 2008, 1,021 rent stabilized buildings were soldcitywide, down 31% from 1,474 sold in 2007. InManhattan, the number of sales fell the greatestpercentage, down 48%, followed closely by the Bronx,down 46%. Sales fell 18% in Brooklyn. Meanwhile,only in Queens was there an increase in the number ofbuildings sold, up 10% from 2007. It is interesting to
Changes in Average Interest Rates, Loan Volume, Points, Loan-to-Value Ratios,Debt Service Coverage, and Vacancy & Collection Losses
(Averages)NF
InterestRate
RFInterest
Rate
NFLoan
Volume
RFLoan
Volume
NFPoints
RFPoints
MaxLTV
Ratio
DebtService
V&CLosses
2009 Cross-Sectional Data 6.46% 6.50% 46 51 .62 .62 74.3% 1.23 4.38%
2009 Longitudinal Data 6.42% 6.46% 50 55 .52 .52 74.8% 1.24 4.40%
NF= New Financing RF= Refinancing LTV=Loan-to-Value V&C=Vacancy and CollectionSource: Rent Guidelines Board, Annual Mortgage Surveys
Selected 2009 Cross-Sectional Data Compared to 2009 Longitudinal Data
50 • Income and Expense
2009 Mortgage Survey Report

2009 Mortgage Survey Report
Housing NYC: Rents, Markets and Trends 2009 • 51
note that a substantial proportion of building sales arereported by those institutions responding to ourmortgage survey. In total, 1,021 buildings were sold in2008, while the mortgage survey respondents reporteda total of 599 new loans, representing at least 59% ofbuildings sold. A few surveyed lenders were unable toprovide the number of loans made to rent stabilizedbuildings, so our survey actually captures anindeterminable number of additional sales. AppendixE.8 shows the number of buildings sold citywide, byborough and by building size for 2007 and 2008.
In light of the current financial crisis thataccelerated throughout 2008, and the tightening of thelending market revealed in our 2009 Mortgage Survey,we compared sales data from the fourth quarter of2007 to the same quarter of 2008. When analyzingrent stabilized building sales in the fourth quarters of2007 and 2008, the number of buildings sold felluniversally, down 50% citywide; 76% in the Bronx;69% in Manhattan; 27% in Brooklyn; and 24% inQueens.9 See table on this page.
ConclusionThe year 2008 saw a significant upheaval in thenational economy. Though borrowers continue to seegenerally favorable lending terms, some financiallyunstable lenders are finding themselves limited in their
ability to make loans, while other, more stable andusually smaller institutions maintain their lendingvolume. Both new and refinance loan volumedecreased, interest rates and points increased, andunderwriting standards toughened. The decrease inloan volume was reflected in the 31% decline in thenumber of rent stabilized buildings sold in 2008.
Endnotes1. Federal Reserve websites:
http://www.federalreserve.gov/fomc/fundsrate.htm andhttp://www.frbdiscountwindow.org
2. Note that the total number of respondents and some figuresoriginally derived from the 2008 Mortgage Survey differ from whatwas previously reported because one lender was removed. Thislender is a city agency that offered mortgages at lending termssignificantly different from the marketplace.
3. Most recent data derived from the FDIC website. World Wide WebPage <http://www.fdic.gov> (accessed March 10, 2009).
4. “Fed Cuts Key Rate to a Record Low,” by Edmund L. Andrews andJackie Calmes, New York Times. December 17, 2008.
5. The per unit, per month O&M expense and rent figures reported inthe Mortgage Survey reflect a very small, non-random sample ofthe City’s regulated stock and are included for informationalpurposes only. The rent and expense figures in the RentGuidelines Board’s Income and Expense Study are derived from amuch larger sample of stabilized buildings and can be viewed asmore authoritative.
6. The O&M cost-to-rent ratio from the 2009 Mortgage Survey reflectsestimates by lenders of expenses and rents for rent stabilizedbuildings as of approximately February 2009. The average ratio iscalculated from just 16 respondents. The latest available O&M cost-to-rent ratio from the Income and Expense Study (I&E), in whichaverage rent was $907 and average unaudited cost was $695,reflects rents and expenses reported by owners for calendar year2006. Average monthly costs per unit in the Mortgage Survey thisyear are lower than those reported in the I&E. This may be due todifferences in the two data sources: Lenders’ estimated average ofbuildings in an institution’s portfolio vs. a weighted average of alarge sample of owner-reported data; the large variance betweenthe two sample sizes; and the difference between the buildingsstudied in each analysis. (Buildings required to file Real PropertyIncome and Expense (RPIE) forms must have an assessed valuegreater than $40,000 and eleven or more units, while the MortgageSurvey does not exclude these buildings).
7. The cross-sectional and longitudinal groups are very similarbecause all but one lender responded both years.
8. The data reflects sales prices for buildings that are registered withDHCR as containing rent stabilized units. It excludes thosebuildings where the sales price was listed as less than $1000. Italso excludes those buildings listed as co-ops. Further, StatenIsland is excluded from all analysis due to the small number ofbuildings sold.
9. Due to the small number of buildings sold in the fourth quarter of2008, we were unable to compare sale price data from 2007 to2008.
Comparison of Building Sales in4th Quarter of 2007 vs. 2008
2007 2008 Change
Bronx 50 12 -76%Brooklyn 77 56 -27%Manhattan 67 21 -69%Queens 29 22 -24%
Citywide 223 111 -50%
Sales Fall in the Fourth Quarterof 2008
Note: Citywide figures exclude Staten IslandSource: NYC Department of Finance


New York City Rent Guidelines Board
Income and Affordability
2009 Income and Affordability Study........ pg. 55


Housing NYC: Rents, Markets and Trends 2009 • 55
New York City Rent Guidelines Board
2009 Income and Affordability Study
IntroductionSection 26-510(b) of the Rent Stabilization Law requires the Rent GuidelinesBoard (RGB) to consider “relevant data from the current and projected costof living indices” and permits consideration of other measures of housingaffordability in its deliberations. To assist the Board in meeting this obligation,the RGB research staff produces an annual Income and Affordability Study,which reports on housing affordability and tenant income in New York City’srental market. The study highlights year-to-year changes in many of the majoreconomic factors affecting New York City’s tenant population and takes intoconsideration a broad range of market forces and public policies affectinghousing affordability. Such factors include New York City’s overall economiccondition — unemployment rate, wages, Consumer Price Index and GrossCity Product — as well as the number of eviction proceedings and the impactof welfare reform and federal housing policies on rents and incomes.
SummaryFor the first time in five years, New York City’s economy did not generallyimprove as compared with the preceding year, with mixed economicindicators, including rising unemployment rates and stagnant Gross CityProduct, but rising employment levels and declining homeless levels.Citywide unemployment rates (on an annual basis) increased to 5.5% during2008, after falling for the previous four years. And while the City’s GrossCity Product increased for the fifth consecutive year, the rate of growthannually fell to almost zero, and fell in the last three quarters of 2008. Inaddition, although cash assistance levels dropped, applications rose for thethird consecutive year, increasing by more than 8%. The number of foodstamp recipients is also on the rise, with rates increasing each month sinceMarch, as compared to the previous month. And for the third straight year, thenumber of evictions grew, by 1.3% despite less housing court filings.
However, there were indicators tracked in the I&A Study that showed apositive trend during 2008. Homeless levels were down on average in 2008,with the total number of individuals decreasing by 2.2%, and families by3.5%. Real wages (which have a long lag time in reporting) increasedsignificantly between 2006 and 2007, rising 6.3%. Preliminary findings fromthe 2008 Housing and Vacancy Survey show that in real terms, the incomeof rent stabilized tenants increased 1.4% between 2004 and 2007, afterdropping 8.6% between 2001 and 2004. In addition, cash assistance casesfell for the fourth year in a row, dropping more than 5% between 2007 and2008. Average employment levels also rose during 2008, by 1.2%. Inaddition, housing court filings fell for the third consecutive year, falling bymore than 2%.
! New York City’seconomy grew by 0.3%in 2008, compared to a3.3% increase during2007.
! The City gained anaverage of 46,400 jobsin 2008, a 1.2% increasefrom 2007 in totalemployment levels.
! The unemployment raterose to an average of5.5% last year, up from4.9% in 2007.
! Inflation averaged 3.9%in the metro area in2008, up from 2.8% inthe prior year.
! Inflation-adjusted wagesincreased 6.3% in 2007,compared to a 4.1%increase in 2006.
! In 2008, an average of34,354 homeless peoplewere staying in Cityshelters, down 2.2%from 2007.
! The average number offamilies temporarilysheltered each nightdecreased 3.5%, to8,971 in 2008, comparedto 9,296 a year earlier.
! The number of non-payment filings in HousingCourt decreased 2.1% in2008, to 246,147, whilethe number of evictionsrose 1.3%.
What’s New

But while on an annual basis, there were manypositive indicators in 2008, some of these took anegative turn as the year progressed. For instance,homeless levels declined at a slower pace during thefourth quarter of 2008 (but nevertheless declined), andemployment levels dropped during the same timeperiod. And real wages during the second quarter of2008 (the latest available figures), declined by 3.9%.
Economic ConditionsWhile posting minimal positive gains during 2008, theCity’s economic growth was nevertheless much slowerthan during the previous year. New York City’s GrossCity Product (GCP), which measures the total value ofgoods and services produced, increased by 0.3%during 2008 as compared to a 3.3% increase duringthe preceding year.1 Growth began slowing during thesecond quarter of 2007 and has fallen every quartersince, including negative growth in the second, third,
and fourth quarters of 2008 when GCP fell 0.6%,2.3%, and 4.6% respectively. The fourth quarterdecrease of 4.6% is the largest decline since the fourthquarter of 2001, when GCP fell 6.4%.2 Forcomparison, GCP increased at an annualized rate of6.0% from 1994 through 2000. The analogousnational number, United States Gross DomesticProduct (GDP), has increased annually since 1992,including a 1.1% increase during 2008.3 However, inthe fourth quarter of 2008, GDP did decrease by thelargest proportion in more than a quarter century,falling 6.3%, with experts predicting negative growthinto at least the first half of 2009.4
The Consumer Price Index (CPI), which measuresthe change in the cost of typical household goods,increased 3.9% during 2008 versus 2.8% during 2007in the NYC metropolitan area, signifying a more rapidrise in the rate of inflation. This is the highest rate since1991 and follows a slowing in the rate of inflation in2006 and 2007.5 The U.S. CPI for urban consumers
NYC and U.S. Unemployment Rates, 1994-2008
0%
1%
2%
3%
4%
5%
6%
7%
8%
9%
20041994 1995 1996 1997 1998 1999 2000 2001 2002 20037.1% 5.0% 9.4%8.8%8.2%8.8% 6.9% 7.9%
4.5%4.9%5.4%5.6%6.1% 4.6%5.5%4.2%
NYC
US
5.8%
4.0%
6.1%
4.7%
8.0% 8.3%
5.8% 6.0%
20055.8%
5.1%
20064.9%
4.6%
5.5%
5.8%
2007 2008
NYC and U.S. Unemployment Rates Rise in 2008
Source: U.S. Bureau of Labor Statistics and NYS Dept. of Labor
56 • Income and Affordability
2009 Income and Affordability Study

also increased at a faster rate between 2007 and 2008,up to 3.8% in 2008 versus an increase of 2.8% in 2007.This is the second consecutive year that the New Yorkand U.S. inflation rates have been virtually identical.
For the first time since 2003, NYC’s unemploymentrate increased over the prior year, rising six-tenths of apercentage point to 5.5% in 2008.6 The U.S.unemployment rate rose at an even greater pace in2008, climbing from 4.6% in 2007 to 5.8% in 2008.7
(See graph on previous page and Appendix F.1)Comparing unemployment rates since 1976 (the firstyear the RGB has access to), there have been only threeyears in which the NYC unemployment rate has beenlower than that of that nation as a whole, including2008. And the gap between the local and nationalunemployment rates is also at one of its lowest levels,0.3 percentage points compared to a high of 4.5percentage points in 1997. The 33-year averageabsolute difference between the two rates is 1.8percentage points.
While unemployment rates rose only modestly forall of 2008, sharper increases occurred in the latter partof the year. Unemployment rates were the same orhigher in 11 of 12 months in 2008 as compared to thesame month in 2007. But the largest increases wereseen in October, November and December, when ratesrose 1.4, 1.9 and 2.4 percentage points respectively,with the year’s highest unemployment rate of 7.2% inDecember of 2008.
During the early months of 2009, unemploymentrates in New York City and the nation continued toclimb. The City jobless rate stood at 7.3% in January2009 and 8.4% in February, approximately two tothree percentage points higher than the 2008 averagerate of 5.5%. The national unemployment rate was8.5% in January and 8.9% in February of this year,higher than the 2008 national average of 5.8%.
At the local level, unemployment rates rose inevery borough over the past year, by 0.5-0.8percentage points on average. Manhattan, Queens,and Staten Island all had virtually identicalunemployment rates in 2008, at 4.9% for Manhattanand Queens, and 5.0% for Staten Island. Brooklyn hadthe second-highest unemployment rate, at 5.9%, whilethe Bronx once again had the highest rate of theboroughs, 7.4%. Unemployment rates in Queens rose
0.5 percentage points over 2007 levels, and rose 0.6percentage points in Brooklyn and Staten Island. Theyalso rose 0.7 percentage points in Manhattan, and 0.8percentage points in the Bronx. Citywideunemployment rates are still at one of the lowest levelsin at least 33 years (with only three years, including2006 and 2007 recording lower annual unemploymentrates). And rates are still significantly lower than thoseseen during the recession year of 1992, when Citywideunemployment was at 11.1% and Citywide andborough rates were approximately twice what theywere in 2008.
Two other employment indices increased slightlyin 2008. The New York City labor force participationrate — which measures the proportion of all non-institutionalized people, aged 16 and over, who areemployed or actively looking for work — increased in2008, to 60.0%, up from 59.5% in 2007.8 Thisremained lower than the U.S. rate, which remained at66.0% for each of the two years.
In addition, the New York City employment/population ratio — which measures the proportion ofthose who are actually employed as a ratio of all non-institutionalized people age 16 or over — alsoincreased, to 56.7% in 2008, up 0.2 percentage pointsfrom 2007. The U.S. employment/population ratiodecreased over the same period, down from 63.0% in2007 to 62.2% in 2008.
Despite increasing rates of unemployment, thenumber of persons employed in NewYork City actuallyrose over the year (see graph on next page), the fifthconsecutive yearly increase in employment rates.Overall, among both city residents as well as thosecommuting into the city, New York City gained 46,400jobs in 2008, a 1.2% increase from 2007.9 However,employment levels began dropping as the yearprogressed, and continued into 2009. Totalemployment levels between the fourth quarter of 2007and 2008 fell by 0.3%, with a 1.5% decline fromJanuary 2008 to January of 2009 and 2.1% fromFebruary to February. Most of these job losses were inthe goods-producing sector, which accounts for only6% of jobs in New York City, but declined by almost11% in January and February of 2009 as compared tothe same period of 2008. The service-producing sectordeclined 1.2% during this time period.
2009 Income and Affordability Study
Housing NYC: Rents, Markets and Trends 2009 • 57

Overall, almost all industries tracked in the I&AStudy saw increases in employment, while just two sawa decrease in total employment levels. Themanufacturing sector was the only sector to lose asignificant amount of jobs in 2008, down 5.8%, or5,900 jobs. With the exception of 1997, manufacturinglevels have decreased each year since at least 1990 (thefirst year for which data is available), dropping 170,100jobs in the 18-year period, a decline of 64%. FinancialActivities employment also decreased slightly, falling0.5% during 2008, the first decline since 2003.
The largest increase in employment during 2008was in Leisure and Hospitality, which rose 3.5% andgained 10,500 jobs to reach its highest historic level.The Construction, Natural Resources, and Miningsector also rose for the fourth straight year, gaining4,200 jobs, a 3.3% increase. Other sectors saw moremodest increases, such as Other Services, which rose2.3%; Educational and Health Services, which rose2.0%; and Professional and Business Services, whichalso rose 2.0%. The other sectors rose anywhere
between 0.6% and 1.3%. See Appendix F.2 for acomplete breakdown by industry.
During the first two months of 2009, employmentlevels in most sectors declined as compared to the firsttwo months of 2008. Manufacturing fell by the greatestproportion, 12.3%, while Construction fell by 9.9%,and Financial Activities by 4.7%. Other sectors fellbetween 3.1% and 0.3%. Three sectors rose inemployment levels over this time period, includingProfessional and Business Services, rising 3.2%, andboth Educational and Health Services and OtherServices rising by 1.8%.
This report also examines wage data of employeesworking in New York City (regardless of where theylive), though the analysis is limited by the fact thatthere is a one-year lag in the reporting of income data.The most recent numbers, which cover the 2007calendar year, reveal an increase in both real andnominal wages. Real wages rose for the fourth straightyear, and at the fastest pace in the last 15 years. Realwages climbed 6.3% in 2007, rising from $75,340 (in
Average Annual Payroll Employment, NYC, 1994-2008
3,000
3,200
3,400
3,600
3,800
2008200720062005200420032002200120001999199819971996199519940
Thou
sand
s
NYC Employment Levels Rise for Fifth Consecutive Year
Source: U.S. Bureau of Labor Statistics
58 • Income and Affordability
2009 Income and Affordability Study

2007 dollars) to $80,071.10 Nominal wages (wages incurrent dollars) increased by 9.3% over the same timeperiod. These are the largest increases seen since1992, when real wages rose by 7.5% and nominalwages rose by 11.3%. Between the second quarter of2007 and the second quarter of 2008 (the mostrecently available data), nominal wages Citywide roseby 1.4%, while real wages declined 3.9%.
Of the sectors tracked in this report, all but one hadincreases in real wages during 2007, and increaseswere in all cases larger than in the previous year. Themost significant increase in real income was in the FIRE(Finance, Insurance, and Real Estate) sector, which rosein real terms by 13.5% over the year to reach $227,889.Significant gains were also seen in Manufacturing,which rose 5.7%. Smaller increases were also seen inall but the Government sector, including a rise of 3.5%in Construction wages, 3.3% in Transportation, 2.3%among the Service sector, and 1.6% in Information.Government wages, which rose 2.5% in nominal terms,decreased in real terms by 0.3%.
For the first time, staff examined bankruptcy filingsfor New York City residents from 2000-2008. Between20,000 and 30,000 persons filed for personalbankruptcy annually between 2000-2004, the numbersteadily rising each year, by 16.5% in 2001, 7.4% in2002, 8.5% in 2003, and 7.4% in 2004. In April of2005, major changes to the bankruptcy filing processwere signed into law, to be effective beginning October17, 2005. As a result, there was a rush to file forbankruptcy before the law changed, and in 2005,42,852 New Yorkers filed for bankruptcy, a 44.6%increase. In the following year, with new laws in placemaking it more difficult to file for bankruptcy, only7,961 persons filed for personal bankruptcy, an 81.4%decline. Filings increased in both 2007 and 2008, by35.5% and 23.5% respectively, rising to 13,319 filingsin 2008, approximately half the level of the first half ofthe decade. For the United States as a whole, filingsincreased by 37.6% in 2007 and 30.6% in 2008, bothmore rapid increases than that seen in New York City.11
The Census Bureau reports that the New York Citypoverty rate for all individuals was 18.5% in 2007, adecline from 19.2% in 2006. This compares to 13.0%for the nation as a whole.12 They also report that thepoverty rate for persons under the age of 18 in New
York City was 27.3% in 2007, while it was 15.4% forindividuals 18 to 64, and 18.4% for persons 65 yearsand over. Furthermore, 15.6% of all families were livingunder the poverty line in 2007, the same rate as theprior year. For families with related children under theage of 18, this figure rises to 22.3%, while for married-couple families the overall poverty rate is 9.0%, and forfemale-headed families it is 29.3%. According toCommunity Service Society reports, overall rates wereas high as 26.4% in the mid-nineties.13
New York City RentersPreliminary results from the 2008 Housing andVacancy Survey (HVS) were released in February ofthis year, and they reveal the continuation of a verytight New York City housing market.14 This triennialsurvey of the housing and demographic characteristicsof the City’s residents found that the citywide vacancyrate was 2.88% in 2008, well below the 5% thresholdrequired for rent regulation to continue under state law.Brooklyn had the lowest vacancy rate in the city, at2.34%, translating into the availability of just 15,530rentals in a borough with more than 663,000 rental
2009 Income and Affordability Study
Housing NYC: Rents, Markets and Trends 2009 • 59
$2,500 or more
$1,750-$2,499
$1,250-$1,749
$1,000-$1,249
$800-$999
$500-$799
0% 1% 2% 3% 4% 5% 6% 7% 8%
7.2%
4.0%
4.5%
3.9%
2.1%
1.5%
Source: 2008 NYC Housing and Vacancy Survey
Vacancy Rates Increase withMonthly Asking Rent Levels
Vacancy Rate by MonthlyAsking Rent Level, 2008

apartments. Queens, by contrast, had the highestvacancy rate in 2008, at 3.32%. Of the remainingboroughs, the Bronx had a vacancy rate of 3.07%,Manhattan was 2.70%, and the small sample size inStaten Island made the rate too inaccurate to report.
The HVS found vacancy rates varying significantlyamong different asking rents. As might be expected,apartments renting for the least had the lowest vacancyrates, while those apartments renting at the high endhad substantially higher vacancy rates. Apartmentswith an asking rent of between $500 and $799 had avacancy rate of just 1.47%, while those renting for atleast $2,500 had a vacancy rate of 7.18%. (See graphon previous page for a further breakdown.)
Income
According to the 2008 HVS, which reflects householdincome for 2007, the median income for rentalhouseholds was $36,000, in real terms a 1.4% increasefrom 2004 levels.15 Owner households earnedsubstantially higher income, which in 2007 was$70,000, double the average income of renters.
The 2008 HVS found different income levels amongthose living in units that were rent controlled, rentstabilized, or unregulated. Rent controlled tenantscontinued to have the lowest household income,earning a median of $24,000 in 2007, a decrease in realterms of 2.4%. Tenants living in stabilized buildingsbuilt prior to 1947 (“pre-war”) had a median income of$35,000 (a decrease of 1.4%), and post-46 (“post-war”)tenants earned a median income level of $38,000 (adecrease of 1.6%). Stabilized tenants on the whole hada median income of $36,000, an increase of 1.4%.Those tenants in unregulated apartments earned amedian of $50,000 in 2007, a 7.5% increase, whichhelped increase all renter incomes by 1.4%.
Rent
The HVS also examines rent levels, and it revealed thatin 2008, the median monthly contract rent, whichexcludes any additional tenant payments for fuel andutilities, for all rental units was $950 (an 11.8%nominal increase from 2005 and a 1.6% real dollarincrease). Rent stabilized tenants paid, on average, less
than the typical rental tenant, with a median contractrent of $925 for all rent stabilized tenants in 2008 (a0.4% real decrease), $900 for pre-war rent stabilizedapartments (a 1.0% real increase), and $980 for post-war rent stabilized apartments (a 0.9% real decrease).Rent controlled tenants paid the least in contract rent,a median of $721 (a 19.0% real increase), and tenantsliving in private nonregulated rentals paid $1,200 (a9.1% real increase).16
Median gross rent, which includes fuel and utilitypayments, was $1,054 for all renters (a 14.6% nominalincrease and a 4.2% real dollar increase). Rentstabilized tenants on the whole paid a median gross rentof $1,027 in 2008 (a 2.2% real increase), $1,010 for pre-war rent stabilized apartments (a 2.0% real increase),and $1,060 for post-war rent stabilized apartments (a1.4% real increase). Rent controlled tenants also paidthe least in gross rent, a median of $813 (a 14.0% realincrease), and tenants living in private nonregulatedrentals paid $1,350 (a 9.0% real increase).17
The HVS also breaks down the distribution ofrenter occupied housing by gross rent level. Of the2.08 million rental units in New York City that reportcash rent, 10.9% rent for less than $500, while 55.8%rent for over $1,000, including 21.8% that rent formore than $1,500. A third (33.3%) of all rental units
60 • Income and Affordability
2009 Income and Affordability Study
Less Than$500
$500-$799
$800-$999
$1,000-$1,499
$1,500 or more
10.9%
16.0%
17.3%34.0%
21.8%
Source: 2008 NYC Housing and Vacancy Survey
Wide Range of ApartmentRents in NYC
Gross Rent Levels of Apartments, 2008

rent for between $500-$999.18 (See graph on previouspage for a further breakdown.)
Affordability of Rental Housing
Examining affordability of rental housing, the 2008HVS reported that the median gross rent-to-incomeratio for all renters was 31.5%, meaning that half of allhouseholds residing in rental housing pay more than31.5% of their income in gross rent, and half pay less.Furthermore, more than a quarter (29.4%) of rentalhouseholds pay more than 50% of their householdincome in gross rent. Generally, housing is consideredaffordable when a household pays no more than 30%of their income in rent.19 Both the overall gross rent-to-income ratio and the proportion of householdspaying more than 50% of income towards rentincreased from the 2005 HVS, which reportedproportions of 31.2% and 28.8% respectively.
Rent controlled tenants are the tenants facing thehighest financial burden, with a median gross rent-to-income ratio of 35.5%, meaning a majority of rentcontrolled tenants are not able to afford theirapartments, based on the HUD benchmark for housingaffordability. Unregulated tenants had the secondhighest gross rent-to-income ratio, 31.9%, and rentstabilized tenants as a whole had a median of 31.6%,with pre-war tenants at 31.7% and post-war at 31.5%.For rent stabilized tenants on the whole, this ratiodecreased between 2005 and 2008, by 0.3 percentagepoints. It also decreased 0.5 percentage points in pre-war apartments, but increased 1.0 percentage pointsin post-war apartments.
Despite ongoing efforts by a number ofgovernment agencies and non-profit groups, housingaffordability remains an issue in a city ranked 11thhighest in the nationwide 2007 American CommunitySurvey of monthly rental costs ($985), but only 24thhighest in median household income ($48,631).20 Thissurvey also reports that between 2006 and 2007,median rents for all apartments in New York Cityincreased 4.2%, but the median gross rent-to-incomeratio fell, from 30.5% to 29.9%. The percentage ofhouseholds paying more than 50% of their incometowards rent in 2007 fell to 26.6% from 27.9% in theprevious two years.
The survey also provides mean household incomefor cities in quintiles. In New York City the top quintilein mean household income makes 23.78 times morethan the lowest quintile, the fourth highest ratio amongbig cities (cities with more than 250,000 persons). Thelowest disparity is in Virginia Beach, Virginia with aratio of 8.75. New York’s ratio is only behind Atlanta,Boston, and Washington D.C., which have ratios of30.79, 26.90, and 26.66 respectively. Other majorcities, such as Los Angeles (20.54), Chicago (20.56),Houston (19.84), and Philadelphia (18.86), all havesmaller differentials between income levels. While theratio between the upper and lower quintiles was 23.78for all of New York City, it was 39.83 in Manhattanwhere the top quintile makes $375,000 more annuallythan the lowest quintile. These figures are fairlycomparable with the prior year.
For the the second year, staff also calculatedelectricity costs for a typical rental household.Assuming usage of 300 kWh and supply via ConEdison, the average renter's bill would have increasedby an average of 5.4% over the year beginning in Aprilof 2008 as compared with the year beginning in Aprilof 2007. The increase in the prior year was 8.2%.21
In an October 2008 report, the Working PoorFamilies Project analyzed 2006 Census data for all fiftystates. They found that while NewYork State ranked nearthe top nationwide in some areas (i.e. 25% of workingfamilies have no health insurance, the seventh beststatistic in the nation, and 17.9% of jobs pay below thepoverty line, the 15th best in the nation), NewYork Stateranks near the bottom in other areas. New York rankslast in income inequality, with the top quintile of earnersmaking 11.5 times more than the bottom quintile. Inaddition, 69% of low-income working families spendmore than 1/3 of their income on housing costs, a higherpercentage than 39 other states.22
In February of 2009, the Center for an Urban Futurereleased “Reviving the City of Aspiration: A study of thechallenges facing New York City’s middle class.”23 Thereport details some of the challenges facing NewYorkers and explores reasons that the middle class isleaving the City. Among the findings, the study reportsthat between 2003 and 2007 real wages in the city rose,but primarily for Manhattan workers (wage data isreported by place of work, not place of residence).
2009 Income and Affordability Study
Housing NYC: Rents, Markets and Trends 2009 • 61

They found that while wages rose 21.8% in Manhattan,they rose only 0.4% in Staten Island, 0.6% in Brooklyn,1.4% in Queens, and 2.5% in the Bronx. Between1975 and 2007, inflation adjusted wages almostdoubled in Manhattan, while rising in the single digitsin the other boroughs. It is important to note thatapproximately two-thirds of all of New York Cityemployment is located in Manhattan.24
Looking towards the future, the report also foundthat of the 10 occupations that are expected to havethe largest number of annual job openings through2014, only two have median wages higher than$28,000 a year.
The Center for an Urban Future report alsoanalyzes the ACCRA Cost of Living Index, which tracksthe cost of living in many urban areas, includingManhattan and Queens. ACCRA data found thatManhattan is the most expensive urban area in theUnited States, with a cost of living index of 224.2,more than double the national average of 100.Queens, with an index score of 156.2, was the fifthmost expensive urban area. For comparison, someonemoving from Houston to Manhattan who makes$50,000 a year would need to make $123,322 toachieve the same standard of living, while paying 68%more for groceries, 447% more for housing, and 54%more for utilities. Electricity bills and groceries in NewYork City are second highest in the nation, behind onlyHonolulu; and telephone rates, the fourth highest inthe nation, rose 36% between 2000 and 2006. Taxesare also the highest in the nation, approximately 50%more than the average in other large cities. And in thethird quarter of 2008, 10.6% of housing in the metroarea was considered affordable to people earning themedian area income, the lowest share nationwide.However, according to a recent news story, this ratioincreased to 13.9% in the fourth quarter of 2008,although it was still the lowest ratio in the nation.25
Every year the National Low Income HousingCoalition (NLIHC) issues a study to determine whetherrents are affordable to the lowest wage earners. The2009 study has not been released at the time ofpublication, but using the NLICHC’s methodology,26 inorder to afford a two-bedroom apartment at the City’sFair Market Rent ($1,313 a month27), as determined bythe U.S. Department of Housing and Urban
Development, a full-time worker must earn $25.25 perhour, or $52,520 a year. Alternately, those who earnminimum wage would have to work the equivalent of141 hours a week (or two people residing togetherwould each have to work 70.5 hours a week) to be ableto afford a two-bedroom unit priced at Fair Market Rent.
In August of 2008, the Community Service Societyreleased “Unheard Third 2008: Economic Insecurityand Federal Priorities,”28 a survey of 1,523 New YorkCity residents conducted in June 2008, approximatelyone-third of whom are considered “poor” (making lessthan 100% of the poverty line), another one-third whoare “near-poor” (earning between 100% and 200% ofthe poverty line), and the last one-third who are“middle-income and high-income,” who make morethan 200% of the poverty line. The federal poverty lineis currently $14,000 for a family of two, $17,600 for afamily of three, and $21,200 for a family of four.29
When asked if it was harder to make “ends meet”over the past five years, 80% of poor, near poor, andmiddle-income households responded that it washarder, with 61% responding that it was a “lot harder.”When asked to choose one issue they were mostworried about, 23% of low-income respondents chose“keeping up with housing costs or losing your home,”the highest rate among the choices. In comparison,among the group making 400% or more of the povertyguidelines, only 7% chose this as their greatest worry.In addition, 29% of poor respondents, and 19% ofnear-poor respondents, reported that they had fallenbehind on their rent or mortgage in the past year, whilethis figure rises to 40% for low-income workingfamilies with children.
Following increased funding in 2007 to theSection 8 housing voucher program (which allowsrecipients to live in privately owned housing, paying30% of their income towards rent), the New York CityHousing Authority opened the waiting list for the firsttime since 1994.30 These increased funding levels ledto a 111% increase in the number of families placedin Section 8 housing between Fiscal Years 2006 and2007, and another 129% increase between 2007 and2008. But while the waiting list decreased from126,000 persons in FY 2006 to 100,000 in FY 2007,it increased to 136,000 in FY 2008. There were alsoless applicants placed in Section 8 housing in the first
62 • Income and Affordability
2009 Income and Affordability Study

four months of FY 2009 as comparedto FY 2008, a 3.4% drop. However,there are now 8,000 more Section 8units than in 2007.31
Cash AssistanceProgramsFor the fourth consecutive year, thetotal number of cash assistance cases(formerly known as public assistance)decreased, falling by more than 5%between 2007 and 2008.32 Cashassistance caseloads declined by anaverage of 5.3% over the year, almostthree percentage points slower thanthe 8.2% rate of decline in the prioryear (see graph on this page).However, the rate of decline was lessrapid in the latter part of 2008. Whilethe number of recipients declined by6.9% in the first quarter of 2008 ascompared to the same period of2007, they declined by 3.6% in thefourth quarter. And comparingDecember of 2007 and 2008,caseloads fell by 1.9%. Over the last14 years the number of cash assistance recipients hasdropped significantly, falling 70.4% since March 1995,when the City’s welfare reform initiative began and1,161,000 recipients were on the rolls.
While the number of cash assistance recipientswent down during 2008, the number of applicationsfor cash assistance increased for the third consecutiveyear, rising by 8.1%. During the last quarter of 2008,applications rose 11.6% over the corresponding periodof 2007.33 For the second consecutive year, thenumber of reported job placements among cashassistance recipients (excluding placements throughthe Workforce Investment Act) increased, withplacements rising 3.9% in 2008. However,placements are still almost 5% lower than in 2005.34
Because of a change in the way that food stamprecipients are being calculated beginning in January of2008, data from 2008 is not comparable to prior years.Comparing the first quarter of 2008 with the fourth
quarter of 2008 shows an 11.0% increase in thenumber of recipients, reaching a high of 1.35 millionin December of 2008. On a monthly basis, in eachmonth since March of 2008 caseloads have risen overthe prior month’s levels.35
Housing PolicyNew York City receives funding for a variety of housingprograms from the U.S. Department of Housing andUrban Development (HUD). In the 2008 calendaryear, New York City received $812.2 million fromfederally funded programs. These programs included$276.9 million in a Community Development BlockGrant (CDBG), which funds housing and communitydevelopment programs; $112.0 million for the HOMEInvestment Partnership Program, which helps preserveexisting housing stock; $8.0 million for the EmergencyShelter Grant (ESG) program, which is used for
2009 Income and Affordability Study
Housing NYC: Rents, Markets and Trends 2009 • 63
0
100
200
300
400
500
600
700
2008200720062005200420032002200120001999
88.689.497.3116.1130.6121.4---
92.8112.1 103.091.885.683.0 108.7
192.2201.2202.4227.1409.8480.3556.2
SNA
FAP 179.2
116.7
160.2
111.5
151.7
101.4
FAP-SNA ------
Thou
sand
s
130.6
Source: Human Resources Administration websiteNote: FAP-SNA refers to welfare recipients who were converted from the FamilyAssistance Program to the Safety Net Assistance Program
Cash Assistance Caseloads Decline
Cash Assistance Programs, 1999-2008, in Thousands
homeless programs; and $56.8 million for HousingOpportunities for Persons with AIDS (HOPWA). In2009, the City expects to receive $776.4 million forfederally funded programs, which represents a 4.4%nominal decrease over 2008 levels, and a 5.9%decrease in inflation-adjusted dollars.36 Funding levelsfor 2009 represent the sixth consecutive decrease infederal housing aid for New York City, with levels since2003 declining by 18% in nominal terms and 31% inreal terms.
Evictions & Homelessness
Homelessness & EmergencyAssistance
Homelessness in the City, based on visits to Cityshelters, decreased during 2008, following largeincreases the prior year.37 Each night, an average of34,354 persons stayed in City shelters during 2008,down 770 persons, or 2.2%, from a year earlier, but stillup considerably from the average of 20,000-25,000found in the 1990s. The subcategory of number offamilies sheltered each night also declined on averageduring 2008, falling 3.5% over the year. This includeda 4.7% decline in the number of adults in families, buta 0.2% increase in the number of children in families.Homeless levels continue to decline in the last quarterof 2008, although at a slower pace than in the earliermonths of the year, falling 1.0% in the fourth quarter of2008 versus an annual rate of decline of 2.2% and2.6% in the first three quarters of 2008.
The number of families relocated to permanenthousing increased dramatically in 2008, to a total of8,145, 29.6% higher than during 2007. Much of thisincrease was due to the various Advantage programs,the placements of which increased by almost 200%over 2007 levels. This program replaces the HousingStability Plus program (which had no placements in2008, compared to more than 1,800 in 2007).Consisting of separate programs for homelessindividuals who work at least part-time; who havechildren and active Administration for Children’sServices cases; and those receiving Social Securitydisability insurance, the program pays most or all ofrecipient’s rents for up to two years.38 Two-thirds of all
permanent housing placements for families in 2008were through Advantage programs. The number ofsingle adults placed in permanent housing alsoincreased, but at a slower pace than families, rising10.0% during 2008 to 10,679.
The average number of days families spent intemporary housing decreased in 2008, by an averageof 15 less days, to an average of 46.6 weeks. Thenumber of days single adults spent in temporaryhousing, 22 days on average, remained the same from2007 levels. However, after falling last year, thenumber of individuals entering the Department ofHomeless Services shelter system for the first timeincreased, by 9.0% between 2007 and 2008, to anannual total of 17,728 persons, or an average of 1,477new persons per month.
In 2004 Mayor Bloomberg announced that througha number of initiatives, including expanded drop-incenters and coordination of City services, they hopedto cut the number of homeless people in shelters by25,000 persons by 2009.39 As of December, 2008,levels were only 1,281 persons less than in September,2004, when the initiative was announced.
Housing Court
Another useful way to assess the impact of economicconditions on New York City’s renters is to examinehousing court data. Specifically, Housing Courtactions are reviewed to determine the proportion oftenants who are unable to meet their rental payments.To measure the number of households experiencingthe most severe affordability problems, evictions arealso tracked.
For the fifth time in six years, the number of non-payment filings in Housing Court fell, declining by 2.1%in 2008, to reach 246,147.40 Of note, approximately aquarter of all non-payment filings are against tenants inNew York City Housing Authority buildings.41 Whilecourt filings decreased in 2008, the proportion of casesresulting in an actual court appointment (“calendared”)increased slightly, up to 48.9% from 48.4% last year, thehighest proportion the RGB has ever recorded (seegraph on next page and Appendix F.7). During the mid-to-late 1980s, an average of 27.1% of non-paymentfilings were calendared.
64 • Income and Affordability
2009 Income and Affordability Study

The proportion of non-payment proceedingscitywide that resulted in an eviction/possession rulingin 2008 increased for the fifth consecutive year. It isnow at its highest level in eleven years, up from 20.3%in 2007 to 20.8% in 2008. This translates to 25,027court decisions ruled for the tenant’s evictionfrom a total of 120,420 non-payment proceedingscalendared.42 The increase was due to a 1.3% increasein the number of evictions/possessions in 2008, despitea decrease of 1.1% in the number of calendared cases.This proportion remains lower than that found in themid- to late-1980s, when typically a quarter to a thirdof cases reaching court resulted in an order of evictionor possession.
ConclusionIn 2008, New York City had mixed economicindicators, including increased unemployment rates,stagnant Gross City Product, and rising bankruptcy
filings and food stamp levels. But total employmentincreased, and homeless levels fell, as did cashassistance cases and housing court filings. And 2008HVS data, released earlier this year, showed thatbetween 2005 and 2008, rent stabilized tenants hadmodest growth in real income and a decline ininflation-adjusted contract rent.
Looking forward, on March 9th of this year theNewYork City Comptroller’s Office released a report onthe City’s budget and financial plan, including forecastsabout New York City’s economy.43 The Comptrollerestimated that in 2009, GCP will decline by 4.6%,more than 120,000 jobs will be lost, wages will declineby 5.8% and the unemployment rate will reach 8.8%.They predict modest improvements in 2010, with anestimated GCP decline of 2.9%, job losses of more than80,000, and the unemployment rate declining to 8.5%.The Independent Budget Office, also on March 9,testified that they predict a job loss of 270,000 throughthe second quarter of 2010.44 "
Endnotes1. Quarterly data from the NYC Comptroller’s Office as of February,
2009.
2. GCP figures are adjusted annually by the New York City Comptroller’sOffice. The figures in this report are the latest available estimate fromthat office, based on inflation adjusted 2000 chained dollars.
3. Bureau of Economic Analysis. http://www.bea.gov/national/index.htm#gdp
4. “Jobless claims set new record; GDP down more in 4Q,” AssociatedPress, March 26, 2009.
5. Bureau of Labor Statistics; http://www.bls.gov; Data accessed Feb ‘09
6. NYS Dept. of Labor; http://www.labor.state.ny.us; Data accessedMarch 2009. Data is revised annually and may not match datareported in prior years. In the 2008 I&A Study, 2007 Citywideunemployment was reported to be 5.0% and was revised to 4.9%this year.
7. Bureau of Labor Statistics; http://www.bls.gov; Data accessed Feb ‘09.
8. The NYC labor force participation rate and employment/populationratio are derived from unpublished data from the U.S. Bureau ofLabor Statistics. Note that prior years’ data are annually revised,and may differ from figures reported in prior years’ Income andAffordability Studies.
9. New York State Dept. of Labor; http://www.labor.state.ny.us; Dataaccessed March 2009.
10. New York State Dept. of Labor; http://www.labor.state.ny.us; Dataaccessed March 2009.
2009 Income and Affordability Study
Housing NYC: Rents, Markets and Trends 2009 • 65
10%
20%
30%
40%
50%
2008
2006
2004
2002
2000
1998
1996
1994
1992
1990
1988
1986
1984
Proportion of Calendared that Result in Eviction/Possession
Proportion of Filingsthat are Calendared
Source: Civil Court of NYC and NYC Dept. of Investigations
Over Time, Non-Payment CasesHeard Increase, but Proportion ofEvictions Decrease
Housing Court Statistics, 1983-2008

66 • Income and Affordability
11. Data obtained from The Administrative Office of the U.S. Courts inearly 2009.
12. Poverty statistics were researched on the Census Bureau’sFactfinder Site: http://factfinder.census.gov in February of 2009.
13. The Community Service Society of New York uses Census Data tocompute their own poverty statistics. Studies average twoconsecutive years of census data in calculating poverty rates.
14. The New York City Housing and Vacancy survey (HVS) issponsored by the NYC Department of Housing Preservation andDevelopment (HPD) and conducted by the U.S. Census Bureau. AllHVS data reported herein is from “Selected Initial Findings of the2008 New York City Housing and Vacancy Survey,” prepared by Dr.Moon Wha Lee of HPD.
15. Total household income in the HVS includes wages, salaries, andtips; self-employment income; interest dividends; pensions; andother transfers and in-kind payments.
16. Private non-regulated units consist of units which were never rentcontrolled or rent stabilized, units which were decontrolled, andunregulated rentals in cooperatives or condominium buildings.
17. Gross rent statistics were not reported in “Selected Initial Findingsof the 2008 New York City Housing and Vacancy Survey.” (seeEndnote 14). Data was run in March of 2009 from 2008 HVS rawdata, and was converted into “current” dollar figures using the samemethodology as in the “Selected Initial Findings” report.
18. There were 35,644 units which did not report a cash rent.
19. The HUD benchmark for housing affordability is a 30% rent-to-income ratio. Source: Basic Laws on Housing and CommunityDevelopment, Subcommittee on Housing and CommunityDevelopment of the Committee on Banking Finance and UrbanAffairs, revised through December 31, 1994, Section 3.(a)(2)
20. 2007 American Community Survey, U.S. Census Bureau.http://factfinder.census.gov (Based on places with a population ofmore than 250,000).
21. A typical bill was calculated using rate schedules published on theCon Edison website at http://www.coned.com/rates. The rates usedwere for Service Classification #1, Residential and Religious, at ausage rate of 300kWh, per averages stated by a representativefrom Con Edison. The year to year increase was based on yearsbeginning in April through March of the following year.
22. "Still Working Hard, Still Falling Short.” The Working Poor FamiliesProject, October 2008. Per the report a low-income working familyis defined as, “a family earning less than 200 percent of the povertyincome threshold as defined by the U.S. Census Bureau for 2006,which was $41,228 for a family of four.”
23. “Reviving the City of Aspiration: A study of the challenges facingNew York City’s middle class.” Center for An Urban Future,February 2009.
24. According to NYS Dept. of Labor Statistics, in 2007 64.8% of NewYork City’s 3,640,055 employees worked in Manhattan. In 1975, thisfigure was 63.3%. The report also relies on national inflation figuresto adjust wages, while the RGB adjusts wages based on inflation inthe New York City area. For comparison, had NYC-area inflationdata been used to adjust for real wages, the increase in wages forManhattan workers between 2003 and 2007 would have been19.8% instead of the reported 21.8%. In Staten Island, the ratewould have dropped from 0.4% to -1.5%; in Brooklyn, a drop from0.6% to -1.1%; in Queens, a drop from 1.4% to -0.3%; and in theBronx, a drop from the reported 2.5% to 0.8%.
25. “Most affordable city in the nation,” CNNMoney.com, February 19,2009.
26. The methodology that the National Low Income Housing Coalitionuses is at: http://nlihc.org/oor/oor2008/appendixa.pdf
27. Fair Market Rents are published annually by the U.S. Dept. ofHousing and Urban Development.http://www.huduser.org/datasets/fmr.html
28. “Unheard Third 2008: Economic Insecurity and Federal Priorities.”Community Service Society. August 21, 2008.
29. 2008 Federal Poverty Guidelines can be found at:http://aspe.hhs.gov/poverty/08poverty.shtml
30 Press Release, Mayor’s Office. “Mayor Bloomberg and NYCHAChairman Hernandez Announce that Section 8 Voucher List WillOpen For First Time in Twelve Years,” January 29, 2007.
31. Preliminary FY 2009 Mayor’s Management Report.
32. New York City Human Resources Administration. Cash AssistanceRecipients Trend Chart:http://www.nyc.gov/html/hra/html/statistics/trend_charts.shtml
33. Data directly from the Human Resource Administration's Office ofLegal Affairs. March 2, 2009.
34. New York City Human Resources Administration. Job Placements(FA & SNA) Trend Chart:http://www.nyc.gov/html/hra/html/statistics/trend_charts.shtml
35. New York City Human Resources Administration. Food StampRecipients Trend Chart:http://www.nyc.gov/html/hra/html/statistics/trend_charts.shtml
36. Consolidated Plan 2008 and Consolidated Plan 2009, NYC Dept. ofCity Planning.
37. Source: NYC Dept. of Homeless Services, Critical Activity Reports.http://www.nyc.gov/html/dhs/html/statistics/statistics.shtml
38. Program description on Dept. of Homeless Services website:http://www.nyc.gov/html/dhs/html/rent/rentprog.shtml.
39. “Bloomberg Sets Detailed Plan to Cut Number of Homeless,” TheNew York Times, Leslie Kaufman. September 23, 2004.
40. Civil Court of the City of New York data.
41. The New York City Housing Authority is required by law to beginnon-payment proceedings 14 days after the rent due date whenrent goes unpaid.
42. NYC Department of Investigation, Bureau of Auditors data.
43. “The Comptroller’s Comments on the Preliminary Budge for FY2010 and the Financial Plan for FYs 2009-2013.” Office of the NYCComptroller, March 2009.
44. “Testimony of Ronnie Lowenstein To the New York City CouncilFinance Committee On the 2010 Preliminary Budget and Four-YearFinancial Plan.” The City of New York Independent Budget Office,March 9, 2009.
2009 Income and Affordability Study


New York City Rent Guidelines Board
Housing Supply
2009 Housing Supply Report .................... pg. 71
Changes to the Rent Stabilized HousingStock in New York City in 2008..................pg. 85


Housing NYC: Rents, Markets and Trends 2009 • 71
New York City Rent Guidelines Board
2009 Housing Supply Report
IntroductionOver the past year there was a 6.3% increase in the number of permits issuedfor new dwelling units, rising to 33,911, the most since 1972. However thenumber of completed housing units fell, declining 7.7% from 2007 levels.This growth in development has been prompted by the tight housing market,with a citywide rental vacancy rate of 2.88% and 10.2% of all rental housingconsidered overcrowded. There was also a 32.9% decrease in the numberof units in cooperative and condominium plans accepted for conversion ornew construction (the second consecutive year of decline), while the numberof city-owned vacant and occupied buildings continued to fall throughvarious disposition programs, declining more than 15% during the 2008fiscal year. During 2008, housing starts under the 421-a Affordable HousingProgram decreased 12.5%, and completions decreased by 31.3%. The Cityalso saw a decrease in demolitions during 2008, falling 18.4%. Andrehabilitation of residential units under the J-51 tax abatement and exemptionprogram during 2008 increased for the first time since 2004, rising 15.8%,while the number of market-rate 421-a units rose 7.3% over 2007 levels.
New York City’s Housing InventoryIn contrast to the rest of the country, most NewYorkers do not own the homesin which they live. According to the 2008 Housing and Vacancy Survey(HVS),1 rental units comprised 67.2% of New York City’s available housingstock in 2008, twice as many rental units as the nation as a whole.2 NewYork City in 2008 had a total of 3,328,648 housing units, the largest housingstock since the first HVS was conducted in 1965. New York City’s housingis dominated by the size of its rental housing stock and unlike most cities, thebulk of rental units are rent regulated. Of the 2,144,652 occupied and vacantrental units reported in the most recent HVS, more than a third (35.7%) wereunregulated, or “free market.” The majority are either pre-war (pre-47) rentstabilized (33.8%) or post-war (post-46) rent stabilized (14.1%), and the restare rent controlled (1.9%) or part of various other3 types of regulatedapartment programs (14.5%). (See pie chart on following page)
The HVS also indicated that New York City’s housing market remainstight, finding a citywide vacancy rate of 2.88% in 2008, below the 5%threshold required for rent regulation to continue under state law. Brooklynhad the lowest vacancy rate in the city, at 2.34%, while Queens had thehighest, 3.32%. Of the other boroughs, Manhattan was 2.70%, the Bronxwas 3.07%, and the small sample size of vacant apartments in Staten Islandmade calculation of a vacancy rate in that borough too inaccurate to report.4
Vacancy rates also vary by rent regulation status. The tightest market wasfound among post-war stabilized units, with a vacancy rate of 1.64% in 2008.
! Permits for 33,911 newdwelling units wereissued in New York Cityin 2008, the most since1972, and a 6.3%increase over the prioryear.
! The number of newhousing units completedin 2008 decreased 7.7%over the prior year, to24,381.
! The citywide vacancyrate was 2.88% in2008.
! City-sponsoredresidential constructionspurred 16,779 newhousing starts, morethan 60% of which wererehabilitations.
! The city-owned in remhousing stock continuedto decline, with a 15.6%decline in housing unitsduring FY 2008.
! The number of housingunits newly receiving421-a exemptionsincreased 7.3% in2008, to 4,521.
! The number of housingunits newly receivingJ-51 abatements andexemptions increased15.8% in 2008, to64,478.
! The Attorney General’soffice reported a 32.9%decrease in the numberof co-op or condo unitsaccepted in 2008, to526 plans containing16,951 units.
! Demolitions, as reportedby the New York CityDept. of Buildings,were down in 2008,decreasing by 18.4% to2,680 buildings.
What’s New

Pre-war stabilized units also maintained a low vacancyrate, at 2.35%, while private, non-regulated units werevacant at a 4.70% rate.
The frequency of crowding also varies by rentregulation status. Overall, 10.2% of all rental housingin NewYork City is overcrowded (defined as more thanone person per room, on average) and 4.0% is severelyovercrowded (defined as an average of more than 1.5persons per room). Pre-war stabilized housing is mostcrowded, with 12.3% of units overcrowded and 4.9%severely overcrowded, while 10.0% of post-war unitsare overcrowded, and 4.6% of units are severelyovercrowded. Overall, 11.6% of rent stabilizedhousing is overcrowded and 4.8% is severelyovercrowded. In non-regulated housing, 10.1% isovercrowded and 3.8% severely overcrowded.
Changes in the HousingInventory
New Additions
Housing supply grows in a variety of ways: newconstruction, substantial rehabilitation of deteriorated
buildings, and conversions from non-residentialbuildings into residential use. The number of permitsauthorized for new construction is a measure of howmany new dwelling units will be completed and readyfor occupancy, typically within three years, dependingon the type of housing structure.
For the second consecutive year, the City in 2008issued more housing permits for single- and multi-family buildings than the year prior. In 2008, permitswere issued for 33,911 units of new housing, anincrease of 6.3% over the 31,902 units in 2007 (seegraph on following page). While still below the 1960’saverage of 37,000 new units per year, 2007 saw thehighest level in the number of permits since 1972,when 36,061 were issued.5
Permits issued Citywide in 2008 increased, despitedecreases in permits issued in the Bronx and nearly flatgrowth in Manhattan and Queens. Proportionally,Staten Island increased the most, up 69.8% to 1,255.Brooklyn also increased significantly, rising by 16.6%to reach 12,744. Manhattan and Queens rose by 1.9%and 1.4% respectively, to 9,700 in Manhattan and7,730 in Queens. The Bronx was the only boroughwhere permits dropped on an annual basis, falling
Number of Renter and Owner Units
ConventionalHomes
639,935
Co-Op314,912
Condo91,106
Homeowners
Renters
StabilizedPost-'46301,503
RentControlled40,480
StabilizedPre-'47
725,337
OtherRegulated311,934
Non-Regulated765,399
New York City’s Housing Stock Is Predominantly Renter-Occupied
Source: U.S. Bureau of the Census, 2008 New York City Housing and Vacancy SurveyNote: Above figures exclude vacant units that are not available for sale or rent.
72 • Housing Supply
2009 Housing Supply Report

19.6% to 2.482. (See Appendix G.1 and the map onnext page) While permits went up annually, atypicallythe vast majority of permits were issued during thesecond quarter of 2008, which saw an increase of149.1% as compared to the second quarter of 2007,while levels dropped in every other quarter, by asmuch as 71.2%. More than two-thirds of all permitsissued during 2008 were in the second quarter.
While permits issued increased between 2007 and2008, the number of permits issued in early 2009 hasdecreased significantly. The number of permits issuedin New York City decreased from 3,893 in the firstquarter of 2008 to 1,077 during the same period of2009, a 72.3% decrease. Permits issued declined inevery borough, by the greatest proportion in Brooklyn,falling 91.5%, followed by declines in the Bronx of81.0%, 68.9% in Manhattan, 50.8% in Staten Island,and 27.9% in Queens.
Permit data can also be analyzed by the reportedsize of the buildings applying for permits. In 2008, atotal of 2,434 buildings received permits (containinga total of 33,911 housing units). Citywide, 20.1% ofthese buildings were single-family, 30.0% were two-family, 14.3% were three- or four-family structures,
and 35.7% were five-family or greater buildings.While the number of buildings receiving permits in2008 was 37.8% lower than in 2007, the number offive-family or greater buildings increased by morethan 40%, resulting in the increase in permitsdescribed in this report. More than 90% of all permitsCitywide were for units in five-family or greaterbuildings, with the average five-family or greaterbuilding containing 36 units for the City as a whole,and 65 units in Manhattan. As the chart on thefollowing page illustrates, almost all building permitsin Manhattan were for the largest buildings, while inStaten Island virtually all permits were for either one-or two-family buildings. Building size was moreevenly distributed in the other boroughs. (SeeAppendix G.2)
This report also examines the number of unitscompleted in the City each year, illustrating whathousing actually enters the market in a particular year.6
In 2008, approximately 24,381 new housing unitswere completed, a 7.7% decrease over 2007.7
Completions were down in all boroughs but Brooklyn,which rose by 3.3%, to 7,306. Proportionally,completions were down by the greatest amount in
Units Issued New Housing Permits, 1989-2008, in Thousands
02468
10121416182022242628303234
'08'07'06'05'04'03'02'01'00'99'98'97'96'95'94'93'92'91'90'89
Thou
sand
s
Continued Increase in Growth of Number of Permits Issued forNew Construction of Residential Units
Source: U.S. Bureau of the Census, Manufacturing and Construction Division Building Permits Branch
2009 Housing Supply Report
Housing NYC: Rents, Markets and Trends 2009 • 73

2,482
7,730
12,744
1,255
9,700(+2%)
(-20%)
(+1%)
(+17%)
(+70%)
Staten Island, which fell 29.6%, to 1,021, followed byManhattan which fell 18.3% to 6,141. Smallerdecreases were seen in the Bronx, which fell 4.6% to4,241 and Queens, which fell by 4.5%, to 5,672. (SeeAppendix G.3 for historical breakdown)
Housing is also created through publicly fundedsources, including programs sponsored by the NYCDepartment of Housing Preservation andDevelopment (HPD) and the New York City HousingDevelopment Corporation (HDC). HPD’s Office ofDevelopment operates a number of programs thatdevelop affordable housing for low- and moderate-income New Yorkers. Programs include theCornerstone program, which is HPD’s multi-familynew construction housing initiative, financedprincipally through private sources; the NeighborhoodRedevelopment Program, which gives City-ownedbuildings to non-profits to rehabilitate and operate asaffordable housing; and the Mixed Income RentalProgram, which helps finance affordable housing, 30%of which is set aside for homeless families. HDCoperates such programs as 80/20, which requiresdevelopers to set aside 20% of units for moderate-income families, and the New Housing OpportunitiesProgram, which helps finance housing for middle-income New Yorkers.
HPD- and HDC-sponsored programs spurred atotal of 16,779 reported housing starts8 in FY 2008, adecrease of 7.8% over the prior year. Of the 16,779total starts this year, 10,097 were rehabilitation starts,and 6,682 were new construction starts. HPD andHDC collectively expect to start an additional 12,697units of new construction and rehabilitation in FY2009, and 13,725 in FY 2010. During the first fourmonths of FY 2009 there were 1,186 starts by HPDand HDC, a 52.0% decline over the correspondingperiod of the previous year. Slightly less than 60% ofthese units were rehabilitations.9
In February 2006, Mayor Michael R. Bloombergannounced the expansion of his New HousingMarketplace Plan. The original five-year, $3 billioncommitment of 65,000 units is now an 11-yearcommitment to build and preserve 165,000 units ofaffordable housing by 2014. This $7.5 billion plan willultimately provide affordable homes for 500,000 NewYorkers. As of March 2009, HPD and HDC have
0%
20%
40%
60%
80%
100%
Staten IslandQueensManhattanBrooklynBronx
5 or More Family
3/4 Family
2 Family
1 Family
Source: U.S. Bureau of the Census, Manufacturingand Construction Division - Building Permits Branch
Permits by Building Size:Most New Buildings in Manhattan areFive Family or More, in Staten Island Oneand Two Family Homes Predominate
Residential Building Permits, 2008
Source: U.S. Bureau of the Census, Manufacturing andConstruction Division - Building Permits Branch
Total Number of Permits Issuedin 2008 and Percentage ChangeFrom 2007 by Borough
74 • Housing Supply
2009 Housing Supply Report

created or preserved 85,089 units of housing under theNew Housing Marketplace Plan, more than half of thetotal planned. These units are fairly evenly dispersedthroughout the Bronx, Brooklyn, and Manhattan, withonly 9% of units in Queens and Staten Island. As partof this program the City is focusing on preservation ofexisting affordable homes, identifying new sources ofland and funding sources, and making changes toregulations in the private market, such as 421-a reformsand new inclusionary zoning initiatives.10
A new initiative was announced in February of thisyear for a plan for the City to buy vacant, unsold unitsin new developments for use as middle-incomehousing. Details have not been announced yet, but itis expected that those qualifying for the program wouldneed to make between 80 and 150% of the areamedian income to qualify for these subsidizedapartments.11 Another City initiative will partner HPDwith NYU’s Furman Center to track affordable housingthat is at risk for conversion to market-rate rents, andimplement preservation strategies.12 HPD is alsoworking with the New York City Housing Authority(NYCHA) to build affordable housing on NYCHAgrounds. More than 1,000 units will be built onvarious sites in the Bronx and will generate $29 millionin revenue for NYCHA.13 The City also received $24million from the federal government to rehabilitate andresell 115 foreclosed homes.14
Tax Incentive Programs
The City helps promote development of new housingby offering various tax incentive programs. One suchprogram for new renter- and owner-occupiedmultifamily properties containing three or more rentalunits is the 421-a tax incentive program. The programallows for a reduction in the taxable assessed value ofeligible properties. That is, owners are exempt frompaying additional real estate taxes due to the increasedvalue of the property resulting from the improvementsmade. Eligible projects must be new construction ofmultiple dwellings on lots that were vacant,predominantly vacant, or improved with a non-conforming use three or more years before the newconstruction commences. Rental apartments built with421-a tax exemptions are subject to the provisions of
the Rent Stabilization Laws during the exemptionperiod. Thus, 421-a tenants share the same tenancyprotection as stabilized tenants, and initial rentsapproved by HPD are then confined to increasesestablished by the Rent Guidelines Board.
A variety of factors are used to establish the leveland period of 421-a benefits, and properties are alsosubject to construction guidelines. Properties receivean exemption for 10 to 25 years depending onlocation, the number of units reserved for low- andmoderate-income tenants, and whether they arelocated in a neighborhood preservation area. Longerexemption periods apply in northern Manhattan andboroughs outside Manhattan, and to projects thatreceive governmental assistance or contain 20% low-income units.15
Last year’s Housing Supply Report outlined majorchanges in the 421-a program which had been set tobegin on December 28, 2007. However, in early 2008the Governor extended the start date of many of thesechanges to July 1, 2008, including a major expansionof the Geographic Exclusion area (the area whichrequires 20% of units to be set aside for affordablehousing), new limits on the amount of assessed valuethat is exempt from taxes, and on-site affordabilityrequirements extended to a length of 35 years.
2009 Housing Supply Report
Housing NYC: Rents, Markets and Trends 2009 • 75
0
1
2
3
4
5
6
7
'08'07'06'05'04'03'02'01'00'99'98'97'96'95'94'93'92
Thou
sand
s
Source: NYC Department of Housing Preservationand Development
7% Increase in Number of Units NewlyIssued 421-a Certificates in 2008
Units Newly Receiving 421-a Certificates,1992-2008, in Thousands

Through the market-rate 421-a program, thenumber of housing units newly receiving 421-aexemptions increased for the second consecutive year,up 7.3%, to 4,521 (see graph on previous page),including increases in every borough but Manhattan.While the number of units decreased 36.2% inManhattan, it increased 50.4% in Brooklyn, 49.1% inthe Bronx, 20.6% in Queens, and rose from zero to sixunits in Staten Island. In a departure from the norm, thelargest proportion of units receiving benefits in 2008were in buildings located in Bronx, which contained33.6% of the total units in the City. Brooklyn andManhattan each had virtually the same number of unitsnewly receiving 421-a benefits, each with 27.4% of thetotal number of units Citywide (although the averagesize of buildings in Manhattan were much larger, asthere were 26 buildings receiving benefits in Manhattan,and 80 in Brooklyn). Building in Queens had 11.4% ofthe share of units Citywide, and Staten Island, with onlysix units, had 0.1%.16 (See Appendices G.6 and G.7)
Historically, tax-incentive housing has also beendeveloped through the 421-a Affordable HousingProgram, which allowed developers to build withinManhattan’s “Exclusion Zone” as long as theyprovided either 20% of housing on-site to beaffordable, or they financed affordable housingelsewhere in the City (at the rate of one affordable unitfor every five units built in Manhattan). With changesto the 421-a program that now require all developersin the newly expanded Exclusion Zone to buildingaffordable housing on-site, the 421-a AffordableHousing Program is being phased out and will mostlikely not record any new units after 2008.
Housing starts under the 421-a Affordable HousingProgram declined during 2008, falling 12.5% from 2007levels, for a total of 600 units. When all the units begunin 2008 are completed, these 600 new affordable unitswill create approximately 3,065 certificates eligible tobe sold for market-rate housing within the ExclusionZone. While construction starts under the 421-aAffordable Housing Program were down, housing unitscompleted under the Affordable Housing program in2008 fell at even faster rate. In 2008, 784 newaffordable units, producing approximately 3,979certificates for market-rate housing, were completed, a31.3% decline from last year.17
Another program that has offered affordablehousing, the NewYork State Mitchell-Lama program, islosing residential units as market rents rise andlandlords choose to opt out of the program. Theprogram, which was created in 1955 as a means ofproviding affordable rental and cooperative housing tomoderate- and middle-income families, granted low-cost mortgages and tax breaks to landlords whodeveloped low- and middle-income housing. Thereare approximately 96,000 Mitchell-Lama units in theCity today (and up to 18,000 elsewhere in the state),and the last Mitchell-Lama project opened in 1978.18
After twenty years, landlords may leave theprogram, and in recent years, some have done so by“buying out” of the program. In New York Cityapproximately 42,000 units in Mitchell-Lama buildingshave been lost due to buyouts since 1985 (see graph onthis page). After averaging more than 5,000 buyoutsannually between 2004 and 2007, the pace slowedsignificantly in 2008 with only three buildings,containing 834 units, leaving the program.19
As more and more Mitchell-Lama apartmentsleave the program, new legislation and policies areincreasingly being proposed to clarify the lawsregarding rents in buildings opting out. In Novemberof 2007, the New York State Division of Housing andCommunity Renewal (DHCR) issued a new policy on
95
100
105
110
115
120
125
130
135
140
'07'05'03'01'99'97'95'93'91'89'87'85
Thou
sand
s
Source: NYC Comptroller’s Office and NYC Dept. ofHousing Preservation and Development
30% Decrease in Number of NYCMitchell-Lama Units Since 1985
Units in the Mitchell-Lama Program,1985-2008, in Thousands
76 • Housing Supply
2009 Housing Supply Report

“unique and peculiar” circumstances, a policy thathad allowed buildings leaving Mitchell-Lama andbuilt before 1974 to apply to have apartment rents setat market rates instead of lower, current rents whenentering rent stabilization. The new policy requires allMitchell-Lama buildings built before 1974 to enterrent stabilization at current rents, preserving affordablerent levels for thousands of renters.20 Anotherproposed bill would require all buildings leavingMitchell-Lama or Section 8 to become rent stabilized,and would apply retroactively to buildings that havealready left the system.21
Conversions and Subdivisions
New housing units are also brought onto the marketthrough subdivisions and conversions. Subdivisionsinvolve the division of existing residential space into alarger number of units. Non-residential spaces, such asoffices or other commercial spaces, can also beconverted for residential use. As chronicled in priorHousing Supply Reports, in the past few years, with atight housing market and high demand for luxuryapartments, there were an increasing number ofconversions in neighborhoods citywide, includingfacilities as diverse as hospitals, recording studios,power plants, office buildings, and churches.
One indicator of conversions is the number of non-residential buildings newly receiving J-51 benefits forconversion to residential use. In 2008, 15 formerlynon-residential buildings containing 765 units receivedJ-51 benefits for conversion. Almost all were condoand co-op units. This is a sharp increased from 2007,when a total of nine buildings and 263 units receivedthe same J-51 benefits (evenly split among rental andco-op/condo units). But it is still less than 2006, when15 buildings containing 830 units converted with J-51benefits, again almost all cop-ops/condos. But whilethe number of non-residential units converting with J-51 benefits tripled in 2008, the number ofnon-residential units in Lower Manhattan whichconverted with the aid of 421-g benefits declined in2008, down 36% to 1,143 units.22
Conversion of single room occupancy (SRO)buildings also continued over the past year. SROowners may convert SRO housing to other uses after
obtaining a “Certificate of No Harassment” from HPD.Certificates are down for the fourth consecutive year,falling to 127 in 2008, down from 182 in 2007 andmore than 200 in each year from 2004-2006.23
Cooperative and CondominiumActivity
Developers planning to build new co-op or condobuildings, and owners wishing to convert their rentalbuildings to co-ops or condos, must file plans with,and receive acceptance from, the New York StateAttorney General’s Office. In 2008, the AttorneyGeneral accepted 526 co-op and condo plans, a20.7% decrease over the number accepted in 2007.These 526 plans encompassed 16,951 housing units,32.9% less than in 2007. The majority of plans, 273,were accepted for buildings located in Brooklyn;150 were located in Manhattan; 74 plans wereaccepted for Queens; the Bronx had 20 plans; andthere were nine in Staten Island. However, whilethere were almost twice as many buildings inBrooklyn, the average building in Manhattan islarger, so almost as many units were located inManhattan (6,409) than in Brooklyn (6,605).24 (SeeAppendices G.4 and G.5)
Almost all of the plans accepted citywide in 2008were for new construction, comprising 454 of 526plans, and a total of 13,998 of 16,951 units. This issimilar to the prior year, when new constructionaccounted for 573 of the 663 accepted plans. In 2008,50 plans and 2,582 units were non-evictionconversions. An additional 18 plans, containing 241units, were eviction plan conversions, all sponsored bythe New York City Dept. of Housing Preservation andDevelopment. In addition, four plans and 130 unitswere rehabilitation conversions.
While the conversion of rental housing into co-op and condo units increases the housing inventoryfor sale, it simultaneously reduces the total numberof housing units for rent. Conversions represented16.7% of the total number of units in 2008 co-op andcondo plans. Conversions held in the 70-90% rangefor all of the 1980s, before beginning to fall in the1990s. Because most conversion plans are non-eviction plans (including all private plans in 2008),
2009 Housing Supply Report
Housing NYC: Rents, Markets and Trends 2009 • 77

only when the original rental tenant moves out doesthe apartment become owner-occupied. When thathappens, the unit is then removed from the rentaluniverse, thereby reducing the number of rentalapartments available.
Rehabilitation
Another method for adding residential units to theCity’s housing stock is through rehabilitation of oldbuildings. As buildings age, they must undergorenovation and rehabilitation to remain in habitablecondition. This is particularly relevant to NYC’s rentalhousing stock, of which almost 62% of units are inbuildings constructed prior to 1946.25 Through taxabatement and exemption subsidy programs offered bythe City for rehabilitation, units are able to remain in,or be readmitted to, the City’s housing stock. The J-51tax abatement and exemption program is intended toencourage the periodic renovation of New York City’sstock of both renter- and owner-occupied housing. In
the late 1980s and early 1990s, the number of unitsapproved for initial J-51 tax abatements andexemptions each year was frequently above 100,000.In the mid-1990s, rehabilitation activity declined tojust under 70,000 units per year. But in 1997,coinciding with the improving NYC economy, thenumber of units receiving J-51 benefits increasedsharply, with over 145,000 additional units receivingthis tax incentive. Levels have decreased significantlyfrom that high, mostly remaining under 100,000 unitssince then.
In 2008, 64,478 units newly received J-51 benefits,an increase of 15.8% from the previous year (see graphon this page). These units were contained in 1,451buildings, an increase of 51.6% from 2007 levels. Thelocation of the units newly receiving benefits rangedfrom 40.5% located in Manhattan; to 23.8% inQueens; 23.0% in Brooklyn; 12.0% in the Bronx; and0.6% in Staten Island. Buildings were distributedthrough the boroughs in roughly the same way unitswere distributed.26
Units Receiving Initial J-51 Benefits, 1989-2008, in Thousands
0
50
60
70
80
90
100
110
120
130
140
150
'08'07'06'05'04'03'02'01'00'99'98'97'96'95'94'93'92'91'90'89
Thou
sand
s
2008 Saw Increase in Number of Units Receiving J-51 Certificates
Source: NYC Department of Housing Preservation and Development
78 • Housing Supply
2009 Housing Supply Report

The J-51 tax relief program is similar to the 421-aprogram in that it requires that rental units be subjectto rent regulation for the extent of the benefits.Apartment units in many high-rent neighborhoods arenot allowed to enter the program because theapartment unit tax assessment generally cannot exceed$38,000-$40,000 after completion. Rehabilitationactivities that are eligible for tax abatements andexemptions include Major Capital Improvements(MCI’s), substantial rehabilitation, conversion fromnon-residential uses, and moderate rehabilitation,which requires significant improvement to at least onemajor building-wide system. Enriched exemption andabatement benefits are also available for conversion toClass A multiple dwellings (which are permanentresidential dwellings) and rehabilitation of Class Abuildings that are not entirely vacant.27
In Fiscal Year 2009, the J-51 tax program will costthe City $243.4 million for all housing types, includingmore than 440,000 rental units.28 Most of these unitswill remain stabilized after the benefit period, becausemost units receiving J-51 benefits would ordinarily beunder the jurisdiction of rent stabilization laws evenwithout tax abatements. However, rental apartmentsnot stabilized prior to receiving tax benefits will not besubject to the City’s rent regulations once their benefitsend. (See Appendices G.6 and G.7)
Tax-Delinquent Property
In Rem Housing
For two decades, the City foreclosed on thousands oftax-delinquent residential properties, becoming theowner and manager of these buildings. By its peak in1986, the city owned and managed 4,000 occupiedbuildings containing 40,000 units of housing (seegraph on next page). Most of these buildings weredilapidated multi-families occupied by apredominantly low-income population. To counterthis trend, HPD has developed multiple dispositionprograms over time to manage, rehabilitate and sellmany of these so-called in rem buildings. HPD’sAlternative Management Programs began in 1994 withthe goal of returning city-owned properties to privateowners and stimulating neighborhood development.
The programs enable local entrepreneurs, communitynot-for-profit housing organizations, and groups oftenants to own and manage these buildings. Many ofthese programs include funds for rehabilitation anduse the proceeds of federal tax credits to keep rentsaffordable.
HPD has successfully reduced the number ofoccupied in rem units in central management to 442through October 2008, a 98.5% decline since FY1994.29 HPD transfers buildings into alternativemanagement programs before returning them to privateownership. During FY 2008, 66 buildings with 869units were sold through these programs.
The number of units in vacant city-ownedbuildings also fell significantly over the same period, to325 units by the end of October 2008, a 97.6% declinesince FY 1994. During FY 2008, the total number ofbuildings operated by HPD, including both occupiedand vacant, fell 15.6%, and the number of units inthese buildings also fell by 15.6%, as compared to FY2007. (See Appendix G.8) While the number ofvacant units and buildings continued to fall during theearly months of FY 2009, occupied buildings and unitsrose, increasing by 12.2% and 6.5% respectively.
Anti-Abandonment Strategies
The City has also been able to significantly reduce itsshare of in rem buildings by identifying buildings at riskand helping owners. Key initiatives to preventabandonment include the Third Party Transfer Program,which targets distressed and other buildings with taxarrears, and a Housing Education Program, whichteaches owners and superintendents basicmanagement, maintenance, and finance skills toimprove their properties.30
Since the mid-1990’s, the City has not taken title(i.e., vesting) of properties that are tax delinquent.Instead, the City has developed a comprehensive anti-abandonment strategy. First, tax liens for propertiesthat are not distressed are sold in bulk to privateinvestors. After the lien is sold, the lien holder isentitled to collect the entire lien amount, plus otherinterest and charges, from the property owner. Inaddition, the property owner must continue to paycurrent taxes to the City. If the owner has not paid the
2009 Housing Supply Report
Housing NYC: Rents, Markets and Trends 2009 • 79

lien or entered into a payment plan, the lien holder canfile for foreclosure on the property.31
An additional facet of the City’s anti-abandonmentstrategy is third party transfer. For buildings that aredistressed and in tax arrears, the City can initiate an inrem tax foreclosure action against property owners.The policy, authorized under Local Law 37, transfersthe title of in rem properties directly to new owners(qualified third parties) without the City ever taking titleitself. The properties are temporarily transferred toNeighborhood Restore, a nonprofit corporation, andupon the judgment of the court, are transferred to aqualified third party.32 Since beginning in 1996, theprogram has collected $350 million in back taxes, and438 buildings have been transferred to responsible for-profit and non-profit owners.33
Another anti-abandonment strategy involves theidentification of buildings that are at risk ofabandonment and helping these owners achieve fiscaland structural soundness for their properties through
housing education, counseling, subsidized loans, andvoluntary repair agreements, to preserve housing andavoid in rem actions entirely.
DemolitionsWhile in the early 1990’s relatively few residentialbuildings in New York City were demolished, thisbegan to change in 1996, the same year that thenumber of building permits issued began to increasesignificantly. In fact, the number of buildingsdemolished between 2005 and 2007 alone was almosttriple the number demolished in all the years from1990 to 1999 combined. But for the secondconsecutive year, demolitions in New York City fell ascompared to the prior year. A total of 2,680 buildingswere demolished in 2008, an 18.4% decrease over theprior year, following an 8.0% decline in 2007. Thiswas still the fifth highest total since 1985, when theRGB began collecting this data. Queens accounted for
Units in HPD Central Management Stock, FY 1986-FY 2008, in Thousands
0
10
20
30
40
50
60
'08'07'06'05'04'03'02'01'00'99'98'97'96'95'94'93'92'91'90'89'88'87'86
Occupied UnitsVacant Units
Thou
sand
s
Continued Decline in City In Rem Housing Stock in FY 2008
Source: NYC Dept. of Housing Preservation and Development
80 • Housing Supply
2009 Housing Supply Report

40.4% of all the buildings demolished in 2008,Brooklyn had 34.5%, Manhattan had 9.4%, StatenIsland had 8.0%, and the Bronx had the lowestproportion, 7.7%. Demolitions fell in every borough,declining by 31.8% in the Bronx, 30.2% in StatenIsland, 23.1% in Queens, 10.6% in Manhattan, and6.0% in Brooklyn.34 (See Appendix G.9)
ConclusionHousing permits remained at high levels, with thehighest number of permits issued in 2008 than in anyyear since 1972, while the number of completedhousing units decreased by 7.7%. The City alsocontinued to reduce its share of city-owned vacant andoccupied housing units, seeing a 15.6% decline duringthe most recent fiscal year. The number of new unitsreceiving 421-a tax benefits increased 7.3% in 2008,while J-51 tax abatements and exemptions increased15.8%. Rental housing availability remains tight, witha citywide vacancy rate of just 2.88% in 2008, andovercrowding remains a problem. Mayor Bloomberg’sten-year housing initiative has begun development/construction on more than 85,000 units, helping toreduce the affordable housing shortage. !
Endnotes1. The New York City Housing and Vacancy Survey (HVS) is done
triennially, sponsored by the NYC Department of HousingPreservation and Development (HPD) and conducted by the U.S.Census Bureau.
2. The U.S. housing stock was comprised of 33% renter-occupiedunits, according to the 2007 American Community Survey,conducted by the U.S. Census Bureau. To calculate the ratio ofrenter-occupied units in New York City, staff did not include vacantunits that are not for sale or for rent in the total number of housingunits.
3. Other units include public housing, Mitchell-Lama, In Rem, HUD-regulated, Article 4 and Loft Board units.
4. Since the number of vacant units available for rent in Staten Islandis small, and the HVS is a sample survey, the sampling error of thevacancy rate is likely to be large, and thus, the Census Bureaucould not calculate an accurate vacancy rate.
5. U.S. Census Bureau web site. World Wide Web page<http://www.census.gov/const/www/permitsindex.html>.
6. NYC Dept. of City Planning data. Note that the data is continuallyupdated and is subject to change, including data from prior years.
7. Beginning with the 2006 Housing Supply Report, the RGB defines ahousing completion as any unit receiving either a permanent or atemporary Certificate of Occupancy in the stated year. TheDepartment of City Planning provided this information for the 2004calendar year and beyond, and believes it is a more accuraterepresentation of new housing in New York City than previousmethodologies which only counted final Certificates of Occupancy.
8. Starts refer to the number of units beginning construction orrehabilitation in a given period.
9. Mayor’s Management Reports, Fiscal Year 2008 and PreliminaryFiscal Year 2009.
10. “Mayor Bloomberg’s Affordable Housing Plan,” May 2009.http://nyc.gov/html/hpd/downloads/pdf/New-Housing-Market-Place-Plan.pdf
11. “Condo buyout plan building up support with builders,” HeatherMurray. Chelsea Now, Volume 3, Number 17 (March 13-26, 2009).
12. “NYU’s Furman Center and the NYC Department of HousingPreservation and Development Launch Initiative to Track AffordableHousing in Danger of Converting to Market Rate Rentals,” NYCDept. of Housing Preservation and Development Press Release.April 7, 2009.
13. “Developers Tabbed for South Bronx MF,” Paul Bubny.GlobeSt.com, February 2, 2009.
14. “City has Plan to Resell Foreclosed Homes,” Manny Fermandez.The New York Times, January 14, 2009.
15. Program information available at: http://nyc.gov/html/hpd/html/developers/421a.shtml
16 NYC Department of Housing Preservation and Development, TaxIncentives Program data.
17. Data obtained from the NYC Dept. of Housing Preservation andDevelopment, Inclusionary Housing/421a Affordable HousingProgram. Each affordable housing unit financed or built under theAffordable Housing Program creates between four and sixcertificates for market rate housing.
18. “2007 Annual Report: Mitchell-Lama Housing Companies in NYS.”NYS Division of Housing and Community Renewal. January 15, 2008.
19. The number of Mitchell-Lama buyouts were provided most recentlythrough the NYC Dept. of Housing Preservation and Development,and in previous years through other sources, such as the report“Affordable No More: An Update” by the Office of the New York CityComptroller, Office of Policy Management.on May 25, 2006.
20. “Albany Bars Rent Rise for Thousands.” Manny Fernandez, TheNew York Times, November 26, 2007.
21. NYS Senate Bill S3326.
22. NYC Department of Housing Preservation and Development, TaxIncentives Program data.
23. Historic data obtained from the West Side SRO Law Project,reporting NYC Department of Housing Preservation andDevelopment (HPD) data and 2008 data obtained directly fromHPD.
24. NYS Attorney General’s Office, Real Estate Financing Bureau data.and the NYC Dept. of Housing Preservation and Development,Sales Unit.
25. 2008 NYC Housing and Vacancy Survey, U.S. Census Bureau.
2009 Housing Supply Report
Housing NYC: Rents, Markets and Trends 2009 • 81

26. NYC Dept. of Housing Preservation and Development, TaxIncentives Program data. Note that, similar to the 421–a program,J-51 provides tax abatements and incentives to newly built renter-and owner-occupied units, which are included in the figures given inthis report.
27. Landlord Information/Tax Incentives: J-51, NYC Department ofHousing Preservation and Development web site.http://www.nyc.gov/html/hpd/html/developers/j51.shtml.
28. “Annual Report on Tax Expenditures,” NYC Dept. of Financepublication, February, 2009.
29. Fiscal Year 2008 Mayor’s Management Report and the NYC Dept.of Housing Preservation and Development..
30. NYC Department of Housing Preservation and Developmentwebsite. http://www.nyc.gov/html/hpd/html/buyers/small_prop.shtml.
31. NYC Department of Finance, General Information on the City’s TaxLien Sale Process. http://www.nyc.gov/html/dof/html/property/property_bill_taxlien.shtml#general.
32. “New York City Case Study: Third Party Transfer Initiative: ASolution To Property Abandonment,” by Lisa Mueller, LocalInitiative Support Corporation report, January 14, 2003.http://www.lisc.org/content/publications/detail/794/.
33. Most recent figures obtained from NYC Dept. of HousingPreservation and Development, May, 2009.
34. NYC Department of Buildings (DOB) data. Note that demolitionstatistics include both residential as well as commercial buildings,as the DOB does not specify the type of building in its data.
82 • Housing Supply
2009 Housing Supply Report


New York City Rent Guidelines Board
Changes to the Rent Stabilized HousingStock in New York City in 2008
IntroductionRent regulation has been a fixture in New York City’s housing market for over65 years, although the laws that govern rent regulated housing have beensubstantially changed and/or modified over time. In addition to legislativechanges, the existing laws allow for dynamic changes in the regulatory statusof a significant portion of the rent regulated housing stock in any given year.Units enter, exit or change status within the regulatory system.
The figures in this study represent additions and subtractions of dwellingunits to and from the rent regulation system in 2008. These statistics aregathered from various city and state agencies.
This report is an update of previous studies done annually since 2003,when an analysis was done of the changes in New York City’s rent stabilizedhousing stock from 1994 to 2002. The total number of additions andsubtractions to the rent stabilized housing stock since 1994 is contained inthe appendices of this report. These totals do not represent every unit that hasbeen added or subtracted from the rent stabilized stock since 1994, but ratherthose that have been recorded or registered by various city and stateagencies. They represent a ‘floor,’ or minimum count, of the actual numberof newly regulated and deregulated units in these years.
Additions to the Rent RegulatedHousing StockSince newly constructed or substantially rehabilitated units are exempt fromrent regulation, increases to the regulated housing stock are frequently aresult of owners “voluntarily” placing these new units under rent stabilizationin exchange for tax benefits. These owners choose to place units under rentstabilization because of cost/benefit analyses concluding that short-termregulation with tax benefits is more profitable than free market rents withouttax benefits. Events that lead to the addition of stabilized units include:
• Section 421-a Program• J-51 Program• Mitchell-Lama buyouts• Lofts converted to rent stabilized units• Other Additions• Rent controlled apartments converting to rent stabilization
Section 421-a and J-51 Programs
The New York City Department of Housing Preservation and Development(HPD) administers programs to increase the supply of rental housing. Two of
! The study finds a netestimated loss of 8,267rent stabilized units in2008, over 3,000 moreunits lost than in 2007(5,088).
! Nearly all of theadditions to the rentstabilized stock in2008 were in fourcategories: 420-cunits, 421-a units,421-g units and rentcontrolled units.
! In 2008, high rent/vacancy decontrolmakes up thelargest category ofsubtractions from thestabilized stock,accounting for 76% ofthe subtractions.
What’s New
Housing NYC: Rents, Markets and Trends 2009 • 85

these programs have a significant impact on theinventory of stabilized housing: the Section 421-aProgram and the J-51 Program. Under Section 421-aof the Real Property Tax Law, newly constructeddwellings in New York City can elect to receive realestate tax exemptions. For the duration of the benefits,at least, the newly built apartments are subject to rentstabilization. In 2008, an estimated total of 1,856 unitswere added to the rent stabilized stock through the421-a program, nearly a thousand fewer units than in2007 (2,838). The largest number of units were inManhattan (538), followed by the Bronx (523),Brooklyn (450), Queens (342), and the remaining threeunits were on Staten Island.
The J-51 Program provides real estate taxexemptions and abatements to existing residentialbuildings which are renovated or rehabilitated. Thisprogram also provides these benefits to residentialbuildings converted from commercial structures. Inconsideration of receiving these benefits, owners ofthese buildings agree to place under rent stabilizationthose apartments which otherwise would not besubject to regulation. The apartments remainstabilized, at a minimum, until the benefits expire. TheJ-51 program added 55 units to the rent stabilized stockin 2008, less than half the number added in 2007(135). These newly renovated units were located intwo buildings in Brooklyn (26 units), one building inManhattan (21 units) and one building in Queens(8 units). (See Appendices H.1 and H.2)
Mitchell-Lama Buyouts
Where rents in a building are regulated directly by theFederal, State or City government, these apartments areexempt from rent stabilization and control laws.However, when these government-aided developmentsare no longer directly administered by a governmentalentity, they may become subject to the rentstabilization laws. These federally regulated projectsinclude Section 236 financed buildings and project-based Section 8 buildings.
Mitchell-Lama developments were constructedunder the provisions of Article 2 of the Private HousingFinance Law (PHFL). This program was primarilydesigned to increase the supply of housing affordable
to middle-income households. Approximately 75,000rental apartments and 50,000 cooperative units wereconstructed under the program from the 1950’sthrough the 1970’s. For these units to be affordable,the State or City provided low interest mortgages andreal estate tax abatements, and the owners agreed tolimit their return on equity.
While the State and City mortgages are generallyfor a term of 40 or 50 years, the PHFL allows ownersto “buy-out” of the program after 20 years. If an ownerof a rental development buys-out of the program andthe development was occupied prior to January1,1974, the apartments may become subject to rentstabilization.
A total of 101 units in one former Mitchell-Lamarental development in the Bronx became rentstabilized in 2008. This number is dramatically lessthan the number seen in 2007 and 2006 when 2,517and 3,040 units were added respectively, and thefewest units since 2001 when there were no Mitchell-Lama rental apartments converted. Since 1994, 9,882rental units have left the Mitchell-Lama system andbecome a part of the rent stabilized housing stock. (SeeAppendices H.1 and H.2)
Loft Units
The New York City Loft Board, under Article 7-C of theMultiple Dwelling Law, regulates rents in buildingsoriginally intended as commercial loft space that havebeen converted to residential housing. When the unitsare brought up to code standard, they becomestabilized. A total of 35 loft units entered the rentstabilization system in 2008, the same number of loftunits added in 2007. (See Appendix H.1)
Other Additions to the StabilizedHousing Stock
Additionally, several other events can increase the rentstabilized housing stock: tax incentive programs suchas 421-g and 420-c, “deconversion,” returned losses,and the sub-division of large units into two or moresmaller units. At least 5,632 units were added to therent stabilized stock from these programs in 2008. (SeeAppendix H.1)
86 • Housing Supply
Changes to the Rent Stabilized Housing Stock

The 421-g tax incentive program is designed forconversion of units in Lower Manhattan from non-residential to residential use. The 421-g program added865 rent stabilized units to the housing stock in 2008,nearly double the amount seen in 2007 (441 units).1
The 420-c program, a tax exemption program forlow income housing projects that are developed inconjunction with the Low Income Housing Tax Creditprogram, also added units to the rent stabilized stock.An estimated 4,767 units were added to the rentstabilized stock in 2008 through the 420-c program, an86% increase over the number added in 2007. Of thetotal 420-c units that were added, over half (2,399) werelocated in Brooklyn. Of the remaining units, 1,252 werein Manhattan, 815 in the Bronx and 301 were located inQueens. There were no projects built on Staten Island.2
Deconversion occurs when a building convertedto cooperative status reverts to rental status because offinancial difficulties. Returned losses includeabandoned buildings that are returned to habitablestatus without being substantially rehabilitated, or City-owned in rem buildings being returned to privateownership. These latter events do not generally add asignificant number of units to the rent stabilized stockand were not quantified in this study.
Changes in Regulatory Status
Chapter 371 of the Laws of 1971 provided for thedecontrol of rent controlled units that were voluntarilyvacated on or after July 1, 1971. Since the enactmentof vacancy decontrol, the number of rent controlledunits has fallen from over one million to roughly40,000.3 When a rent controlled unit is vacated iteither becomes rent stabilized or leaves the regulatorysystem. If the vacated unit is in a rental building withsix or more units and the incoming tenant pays lessthan $2,000 per month, the apartment becomesstabilized. This process results in a diminution of thecontrolled stock and an increase in the stabilized stock.
According to rent registration filings with the NYSDivision of Housing and Community Renewal (DHCR),887 units in 2008 were decontrolled and became rentstabilized. This number is up from 592 units in 2007and totaled over 10% of the additions to the rentstabilization stock.4 (See Appendix H.1)
Subtractions from the RentRegulated Housing Stock
Deregulation of rent controlled and stabilized unitsoccur because of statutory requirements or because ofphysical changes to the residential dwellings. Eventsthat lead to the removal of stabilized units include thefollowing:
• High Rent/High Income Decontrol• High Rent/Vacancy Decontrol• Cooperative/Condominium Conversions• Expiration of 421-a Benefits• Expiration of J-51 Benefits• Substantial Rehabilitation• Conversion to Commercial or Professional Status• Other Losses to the Housing Stock – Demolitions,
Condemnations, Mergers, etc.
High Rent/High Income Decontrol
The Rent Regulation Reform Act (RRRA) of 1993permitted the deregulation of occupied apartmentsrenting for $2,000 or more in which the tenants inoccupancy had a combined household income inexcess of $250,000 in each of the immediately twopreceding years. The 1997 RRRA reduced the incomethreshold to $175,000. Deregulation would occurupon application by the owner and upon theexpiration of the rent stabilized lease. This income-based decontrol process, which is administered byDHCR, relies upon data furnished to the NYSDepartment of Taxation and Finance as part of theverification process. Please note that both the rentlevel and household income criteria have to be met fordecontrol to take place. If households earning at least$175,000 paid less than $2,000 per month, rentregulation would remain in effect. Also note that theowner must apply to DHCR in order to decontrol theunit. If the owner did not submit a decontrolapplication, the occupying tenant would remainregulated regardless of rent level and householdincome. Because DHCR has to approve the orders ofderegulation, an exact accounting exists of unitsleaving regulation as a result of High Rent/HighIncome decontrol.
Changes to the Rent Stabilized Housing Stock
Housing NYC: Rents, Markets and Trends 2009 • 87

Based on DHCR processing records, HighRent/High Income decontrol affected a total of 278apartments in 2008, 10% less than the number of unitsderegulated in 2007.5 Since 1994, 4,501 units havebeen deregulated due to High Rent/High Incomedecontrol, of which 93% have been located inManhattan. However, just 71% of these units in 2008were located in Manhattan. (See graph above andAppendix H.3)
High Rent/Vacancy Decontrol
In the 1993 RRRA, the New York State legislaturereinstituted High Rent/Vacancy decontrol.6 This initialstatute has since been changed several times. First, the1993 RRRA decontrolled vacant apartments andoccupied regulated apartments that subsequently werevacated and rented for $2,000 or more per monthbetween July 7 and October 1, 1993. Second, theNew York City Council allowed for the deregulation ofapartments upon vacancy on or after April 1, 1994 ifthese units rented for $2,000 or more. Thus, theoriginal dates in the RRRA of 1993 establishing the
parameters for decontrol were no longer applicable.DHCR interpreted the $2,000 rent threshold as follows:if upon vacancy, the owner undertook individualapartment improvements that increased the legalregulated rent to $2,000 or more, and the incomingtenant agreed to pay $2,000 or more, the unit wouldbe deregulated.
In a third stage, in early 1997, the City Councilamended the Rent Stabilization Law to only allow forvacancy deregulation of the apartment if the vacatingtenant’s legal regulated rent was $2,000 or more.Finally, in June of 1997, with the passage of the RRRA,the state overrode the new City regulation. Thedetermining factor was no longer the outgoing tenant’slegal regulated rent but the incoming tenant’s calculatedlegal regulated rent. Owners, upon a vacancy, couldnow apply a combination of allowable increases toreach the $2,000 deregulation level: standard vacancy
0
2,000
4,000
6,000
8,000
10,000
12,000
14,000
'08'07'06'05'04'03'02'01'00'99'98'97'96'95'94
Note: Registration of deregulated units with DHCR wasvoluntary and not required from 1994-2000. These totalsrepresent a ‘floor’ or minimum count of the actual number ofderegulated units in these years. The NYC City Councilrequired proof of registration with DHCR of the unit as exemptto be sent to the tenant beginning in March 2000(see Endnote 7).
Source: NYS Division of Housing and Community Renewalannual registration data.
Continued Increase in Number of UnitsDeregulated due to High Rent/Vacancy
High Rent/Vacancy Decontrol, 1994-20080
200
400
600
800
1,000
'08'07'06'05'04'03'02'01'00'99'98'97'96'95'94
Source: NYS Division of Housing and CommunityRenewal annual registration data.
Number of Units Deregulated due toHigh Rent/Income Decreases in 2008
High Rent/High Income Decontrol,1994-2008
88 • Housing Supply
Changes to the Rent Stabilized Housing Stock

increases, special vacancy increases and individualapartment improvement increases. This calculated rentfor a hypothetical incoming tenant was the determiningfactor, not the rent the incoming tenant actually paid. Infact, after a stabilized unit is deregulated by thiscalculation, the actual deregulated rent the new tenantpays can be less than $2,000 per month.
According to DHCR rent registration records,12,800 units were deregulated in 2008 under the HighRent/Vacancy decontrol provisions of the RRRA, up24% from 10,342 in 2007, the largest increase since2003. From the period of 1994-2008, a total of 83,827units were registered with the DHCR as beingderegulated due to High Rent/Vacancy decontrol, 80%of which have been located in Manhattan. Since 2001,the first year owners were required to file highrent/vacancy decontrol registrations, the rate at whichthey have increased over the prior year has varied. From2001 to 2002, high rent/vacancy registrations increasedby 23%, and from 2002 to 2003, they increased by34%. However, from the period between 2004 to 2007the rate of increase was between 4-8% each year. (Seegraph on previous page and Appendices H.4-H.6)
Co-operative & CondominiumConversions
When rent regulated housing is converted to ownershipstatus, there is a small immediate decrease in the rentalstock, but over time there is a significantly largerdecrease. Tenants that choose to purchase theirapartments after a cooperative or condominium plan isapproved by the New York State Attorney General’sOffice are immediately removed from rent regulation.These units are no longer rentals. In evictionconversion plans, non-purchasing tenants may continuein residence until the expiration of their lease. In non-eviction plans (which are the overwhelming majority ofapproved plans) the regulated tenants have the right toremain in occupancy until they voluntarily leave theirapartments. When a tenant leaves a regulated unit, theapartment in many cases becomes deregulated,regardless if the incoming tenant purchases or rents.8
In 2008, 1,405 units located in co-ops or condosleft the stabilized housing stock, 3% fewer than left thesystem in 2007. An estimated total of 41,817 co-op or
condo units have left the stabilized stock since 1994.(See Appendices H.5 and H.6)
Expiration of Section 421-a andJ-51 Benefits
As stated in the “Additions” section of this report,buildings receiving Section 421-a and J-51 benefitsremain stabilized, at least until the benefits expire.Therefore, these units enter the stabilized system for aprescribed time period and then exit the system. Thenumber of units leaving the stabilization system isdirectly dependent upon those units previouslyentering the system.
In 2008, expiration of 421-a benefits has resulted ina total of 376 units removed from rent stabilizationsystem, more than double the amount (161) in 2007.Conversely, the expiration of J-51 benefits has resulted ina total of 176 units removed, a 35% reduction from theprior year when 270 units were removed from rentstabilization. Since 1994, 17,683 421-a units have leftthe rent stabilization system while 13,878 J-51 units areno longer rent regulated. (See Appendices H.5 and H.6)
Substantial Rehabilitation
The Emergency Tenant Protection Act (ETPA) of 1974exempts apartments from rent regulation in buildingsthat have been substantially rehabilitated on or afterJanuary 1, 1974. DHCR processes applications byowners seeking exemption from rent regulation basedon the substantial rehabilitation of their properties.Owners must replace at least 75% of building-wideand apartment systems (i.e., plumbing, heating,electrical wiring, windows, floors, kitchens,bathrooms, etc.). In general, buildings that aresubstantially rehabilitated have been vacated andtended to have been stabilized properties. Therefore,when these buildings are substantially rehabilitated,the apartments are no longer subject to regulation andare considered new construction. This counts as asubtraction from the regulated stock. Notably, theseproperties do not receive J-51 tax incentives forrehabilitation.
During 2008, 421 units were removed fromstabilization through substantial rehabilitation, up
Changes to the Rent Stabilized Housing Stock
Housing NYC: Rents, Markets and Trends 2009 • 89

from 297 units lost in 2007. A total of 6,859 unitshave been removed from the rent stabilization systemthrough substantial rehabilitation since 1994. (SeeAppendix H.5)
Conversion to Commercial orProfessional Status
Space converted from residential to nonresidential useis no longer subject to rent regulation. In 2008, 56units were converted to nonresidential use, down from66 in 2007. For the period 1994-2008, 2,034residential units have been converted to nonresidentialuse. (See Appendix H.5)
Other Losses to the Housing Stock
Owners may register units as permanently exemptwhen smaller units are merged into larger ones, orwhen the building is condemned, demolished orboarded-up/burnt-out. DHCR annual registration datashows that 1,321 units were removed from thestabilized housing stock in 2008 due to these reasons,just 1% more than in 2007. (See Appendix H.5)
SummaryA minimum of 16,833 housing units left rentstabilization, while approximately 8,566 units initiallyentered the stabilization system in 2008. The built-influidity of the system resulted in a net loss of anestimated 8,267 units to the rent stabilized housingstock, an increase of over 3,000 units from 2007, whenrent stabilization saw a net estimated loss 5,088 units.9
(See Summary Table on next page.)The vast majority of additions to the stabilized stock
in 2008 were the result of tax incentive programs. Thecreation of 420-c units resulted in over half of theadditions (56%) while 421-a and 421-g units equaled22% and 10% of the total respectively. Brooklynwitnessed the most additions (2,875) followed byManhattan (2,711), the Bronx (1,439), Queens (651)and Staten Island (3). (See Appendix H.2)
Meanwhile, high rent/vacancy decontrol was thelargest source of subtractions from the rent stabilizedhousing stock in 2008, accounting for 76% of the total
number of subtractions. Over 60% of all units leavingrent stabilization in 2008 were located in Manhattan,a total of 10,277 units. Brooklyn witnessed 2,869subtractions, Queens 2,635 subtractions, the Bronxsaw 956 subtractions and in Staten Island 96 units leftrent stabilization. (See Appendix H.6) !
Endnotes1. The 421-g tax incentive program provides 14-year tax exemption
and abatement benefits for the conversion of commercial buildingsto multiple dwellings in Downtown Manhattan. All rental units in theproject become subject to rent stabilization for the duration of thebenefits. These units are subject to High Rent/Vacancy decontrol ifthe initial rent level is $2,000 or more. In 2008, none of theconverted units had initial rent levels above $2,000. Also, anadditional 278 condo units were created under this tax incentiveprogram in 2008.
2. The 420-c tax incentive program provides a complete exemptionfrom real estate taxes for the term of the regulatory agreement (upto 30 years). Eligible projects are owned or controlled by a not-for-profit Housing Development Fund Company, subject to an HPDregulatory agreement which requires use as low-income housingand are financed in part with a loan from the City or State inconjunction with federal low-income housing tax credits.
3. The 2008 Housing and Vacancy Survey reported a total of 40,480rent controlled units in New York City.
4. In previous years the units leaving rent control and entering rentstabilization were reported citywide and by borough. Borough leveldata was not provided to the Rent Guidelines Board this year.
5. The final count for petitions for High Rent/High Income decontrolmay be slightly reduced as they are subject to appeal or in somecases, to review by a court of competent jurisdiction.
6. Decontrol of certain high rent apartments was instituted in New YorkCity twice before, in 1964 and in 1968.
7. In March 2000, the City Council passed Local Law Intro No. 669-A,which amended the administrative code of the City of New York, inrelation to extending the rent stabilization laws with certainamendments to such laws and the rent control law.
8. A court decision affecting units in Brooklyn and Queens ruled thatapartments in buildings that have converted to co-op/condo statusmay remain rent stabilized for a new rental tenant even after astabilized tenant vacates the apartment.
9. Almost the entire number of the estimated net loss of units to therent stabilized housing stock will remain as housing units in NewYork City. These units would convert from rent stabilization to eitherforms of ownership or to non-regulated rental units unless they aredemolished.
90 • Housing Supply
Changes to the Rent Stabilized Housing Stock

Program Number of Units
ADDITIONS421-a + 1,856
J-51 conversions + 55
Mitchell-Lama buyouts + 101
Loft conversions + 35
Other Additions + 5,632
CHANGESRent control to rent stabilization + 887
Subtotal Additions & Changes + 8,566
SUBTRACTIONSCo-op and Condo subtractions - 1,405
High Rent/Vacancy Decontrol - 12,800
High Rent/High Income Decontrol - 278
421-a Expiration - 376
J-51 Expiration - 176
Substantial Rehabilitation - 421
Commercial/Professional conversion - 56
Other Subtractions - 1,321
Subtotal Subtractions - 16,833
NET TOTALNet Estimated Loss - 8,267
Summary Table of Additions and Subtractions to theRent Stabilized Housing Stock in 2008
Sources: Department of Housing Preservation and Development (HPD), Tax Incentive Programs and Division of Housing Supervision(Mitchell-Lama Developments); NYS Division of Housing and Community Renewal (DHCR), Office of Rent Administration and Office ofHousing Operations; and NYC Loft Board.
Changes to the Rent Stabilized Housing Stock
Housing NYC: Rents, Markets and Trends 2009 • 91


Appendix A: Guidelines Adopted by the Board.....pg. 95
Appendix B: Price Index of Operating Costs ........pg. 96
Appendix C: Income and Expense Study ............pg. 104
Appendix D: 2008 HVS Summary Tables ............pg. 114
Appendix E: Mortgage Survey Report .................pg. 134
Appendix F: Income and Affordability Study ......pg. 139
Appendix G: Housing Supply Report ...................pg. 144
Appendix H: Changes to the Rent StabilizedHousing Stock in NYC in 2008........pg. 150
New York City Rent Guidelines Board
Appendices


A.1 Apartments & Lofts - Order #41On June 23, 2009, the Rent Guidelines Board (RGB)set the following maximum rent increases for leasescommencing or being renewed on or after October 1,2009 and on or before September 30, 2010 for rentstabilized apartments:
Where heat is provided at no cost to the tenant:One-Year Lease Two-Year Lease
3.0% 6.0%
Where the most recent vacancy lease was executedsix years or more prior to the date of the renewallease under this Order:
One-Year Lease Two-Year Lease3.0% or $30 6.0% or $60
(whichever is greater) (whichever is greater)
Where heat is not provided at no cost to the tenant:One-Year Lease Two-Year Lease
2.5% 5.0%
Where the most recent vacancy lease was executedsix years or more prior to the date of the renewallease under this Order:
One-Year Lease Two-Year Lease2.5% or $25 5.0% or $50
(whichever is greater) (whichever is greater)
In the event of a sublease governed by subdivision(e) of section 2525.6 of the Rent Stabilization Code,the allowance authorized by such subdivision shall be10%.
No vacancy allowance is permitted except asprovided by sections 19 and 20 of the Rent RegulationReform Act of 1997.
For Loft units that are covered under Article 7-C ofthe Multiple Dwelling Law, the Board established thefollowing maximum rent increases for increase periodscommencing on or after October 1, 2009 and on orbefore September 30, 2010:
One-Year Two-YearIncrease Period Increase Period
3.0% 6.0%
Leases for units subject to rent control onSeptember 30, 2009, which subsequently becomevacant and then enter the stabilization system, are notsubject to the above adjustments. The rents for thesenewly stabilized units are subject to review by theNew York State Division of Housing and CommunityRenewal (DHCR). In order to aid DHCR in this review,the RGB has set a special guideline. For rent controlledunits which become vacant after September 30, 2009,the special guideline shall be the greater of thefollowing:(1) 50% above the maximum base rent or(2) The Fair Market Rent for existing housing as
established by the United States Department ofHousing and Urban Development (HUD) for theNew York City Primary Metropolitan StatisticalArea pursuant to Section 8(c) (1) of the UnitedStates Housing Act of 1937 (42 U.S.C. section1437f [c] [1]) and 24 C.F.R. Part 888, with suchFair Market Rents to be adjusted based uponwhether the tenant pays his or her own gas and/orelectric charges as part of his or her rent as suchgas and/or electric charges are accounted for bythe New York City Housing Authority.
Such HUD-determined Fair Market Rents will bepublished in the Federal Register, to take effect onOctober 1, 2009.
A.2 Hotel Units - Order #39
On June 23, 2009, the Rent Guidelines Board (RGB)set the following maximum rent increases for leasescommencing or being renewed on or after October 1,2009 and on or before September 30, 2010 for rentstabilized hotels:
Single Room Occupancy Buildings (SRO) 0%Lodging Houses 0%Class A Hotels 0%Class B Hotels 0%Rooming Houses 0%
Appendix A: Guidelines Adopted by the Board
Appendix A: Guidelines Adopted by the Board
Housing NYC: Rents, Markets and Trends 2009 • 95
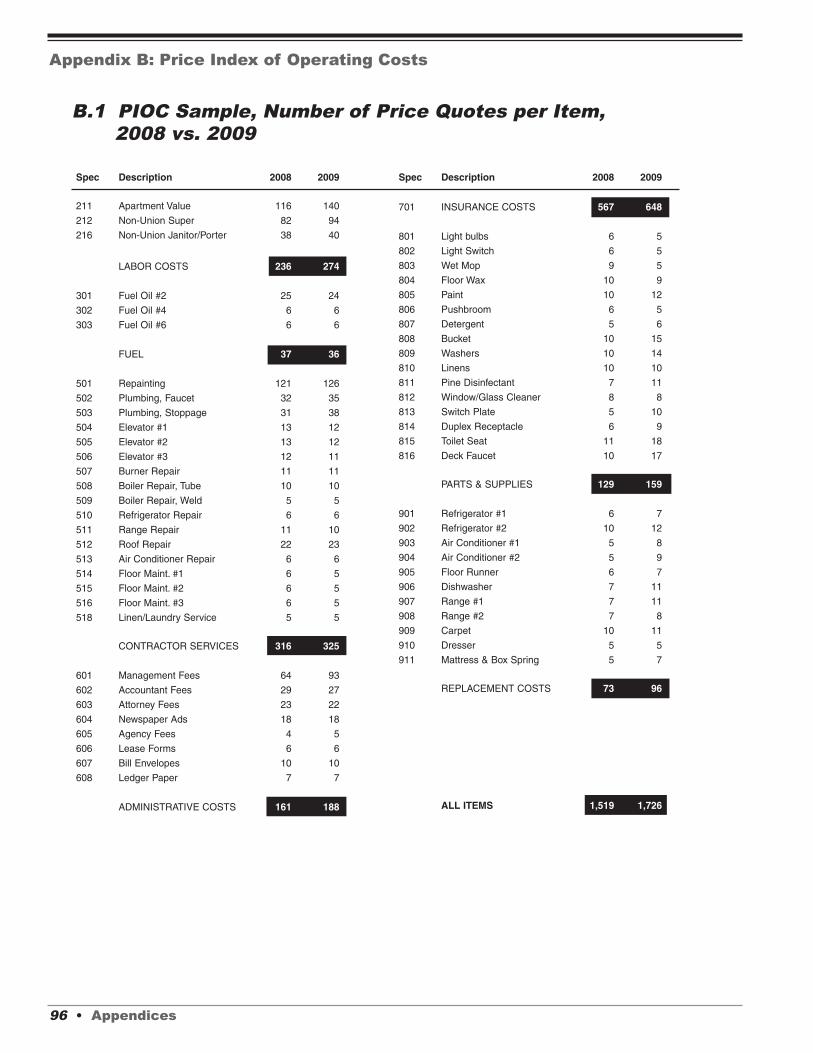
Appendix B: Price Index of Operating Costs
B.1 PIOC Sample, Number of Price Quotes per Item,2008 vs. 2009
96 • Appendices
Spec Description 2008 2009
211 Apartment Value 116 140212 Non-Union Super 82 94216 Non-Union Janitor/Porter 38 40
LABOR COSTS 236 274
301 Fuel Oil #2 25 24302 Fuel Oil #4 6 6303 Fuel Oil #6 6 6
FUEL 37 36
501 Repainting 121 126502 Plumbing, Faucet 32 35503 Plumbing, Stoppage 31 38504 Elevator #1 13 12505 Elevator #2 13 12506 Elevator #3 12 11507 Burner Repair 11 11508 Boiler Repair, Tube 10 10509 Boiler Repair, Weld 5 5510 Refrigerator Repair 6 6511 Range Repair 11 10512 Roof Repair 22 23513 Air Conditioner Repair 6 6514 Floor Maint. #1 6 5515 Floor Maint. #2 6 5516 Floor Maint. #3 6 5518 Linen/Laundry Service 5 5
CONTRACTOR SERVICES 316 325
601 Management Fees 64 93602 Accountant Fees 29 27603 Attorney Fees 23 22604 Newspaper Ads 18 18605 Agency Fees 4 5606 Lease Forms 6 6607 Bill Envelopes 10 10608 Ledger Paper 7 7
ADMINISTRATIVE COSTS 161 188
Spec Description 2008 2009
701 INSURANCE COSTS 567 648
801 Light bulbs 6 5802 Light Switch 6 5803 Wet Mop 9 5804 Floor Wax 10 9805 Paint 10 12806 Pushbroom 6 5807 Detergent 5 6808 Bucket 10 15809 Washers 10 14810 Linens 10 10811 Pine Disinfectant 7 11812 Window/Glass Cleaner 8 8813 Switch Plate 5 10814 Duplex Receptacle 6 9815 Toilet Seat 11 18816 Deck Faucet 10 17
PARTS & SUPPLIES 129 159
901 Refrigerator #1 6 7902 Refrigerator #2 10 12903 Air Conditioner #1 5 8904 Air Conditioner #2 5 9905 Floor Runner 6 7906 Dishwasher 7 11907 Range #1 7 11908 Range #2 7 8909 Carpet 10 11910 Dresser 5 5911 Mattress & Box Spring 5 7
REPLACEMENT COSTS 73 96
ALL ITEMS 1,519 1,726

B.2 Expenditure Weights, Price Relatives, Percent Changes andStandard Errors, All Apartments, 2009
Appendix B: Price Index of Operating Costs
Housing NYC: Rents, Markets and Trends 2009 • 97
Spec Expenditure Price % Standard# Item Description Weights Relative Change Error
101 TAXES, FEES, & PERMITS 0.2539 1.1172 11.72% 0.1002
201 Payroll, Bronx, All 0.1042 1.0295 2.95% 0.0000202 Payroll, Other, Union, Supts. 0.1044 1.0148 1.48% 0.0000203 Payroll, Other, Union, Other 0.2594 1.0135 1.35% 0.0000204 Payroll, Other, Non-Union, All 0.2940 1.0305 3.05% 0.4586205 Social Security Insurance 0.0440 1.0225 2.25% 0.0000206 Unemployment Insurance 0.0059 1.0023 0.23% 0.0000207 Private Health & Welfare 0.1881 1.0571 5.71% 0.0000
LABOR COSTS 0.1353 1.0288 2.88% 0.1348
301 Fuel Oil #2 0.5802 0.9379 -6.21% 1.1363302 Fuel Oil #4 0.1576 0.8424 -15.76% 0.9932303 Fuel Oil #6 0.2622 0.8463 -15.37% 0.8808
FUEL 0.1543 0.8988 -10.12% 0.7158
401 Electricity #1, 2,500 KWH 0.0101 0.8743 -12.57% 0.0000402 Electricity #2, 15,000 KWH 0.1282 0.9058 -9.42% 0.0000403 Electricity #3, 82,000 KWH 0.0000 0.8876 -11.24% 0.0000404 Gas #1, 12,000 therms 0.0054 0.8546 -14.54% 0.0000405 Gas #2, 65,000 therms 0.0590 1.1566 15.66% 0.0000406 Gas #3, 214,000 therms 0.2625 1.1520 15.20% 0.0000407 Steam #1, 1.2m lbs 0.0178 1.0439 4.39% 0.0000408 Steam #2, 2.6m lbs 0.0070 0.9866 -1.34% 0.0000409 Telephone 0.0077 1.0812 8.12% 0.0000410 Water & Sewer 0.5023 1.1450 14.50% 0.0000
UTILITIES 0.1533 1.1091 10.91% 0.0000
501 Repainting 0.3868 1.0300 3.00% 0.7329502 Plumbing, Faucet 0.1404 1.0242 2.42% 1.0359503 Plumbing, Stoppage 0.1242 1.0334 3.34% 1.1123504 Elevator #1, 6 fl., 1 e. 0.0558 1.0093 0.93% 0.6822505 Elevator #2, 13 fl., 2 e. 0.0362 1.0197 1.97% 1.6948506 Elevator #3, 19 fl., 3 e. 0.0204 1.0032 0.32% 0.3229507 Burner Repair 0.0388 1.0380 3.80% 1.4438508 Boiler Repair, Tube 0.0522 1.0180 1.80% 1.2485509 Boiler Repair, Weld 0.0442 1.0000 0.00% 0.0000510 Refrigerator Repair 0.0115 1.0293 2.93% 1.5635511 Range Repair 0.0111 1.0086 0.86% 2.8969512 Roof Repair 0.0655 1.0612 6.12% 1.7266513 Air Conditioner Repair 0.0080 1.0488 4.88% 2.2375514 Floor Maint. #1, Studio 0.0003 1.0000 0.00% 0.0000515 Floor Maint. #2, 1 Br. 0.0005 1.0000 0.00% 0.0000516 Floor Maint. #3, 2 Br. 0.0043 1.0000 0.00% 0.0000
CONTRACTOR SERVICES 0.1259 1.0277 2.77% 0.3843
Spec Expenditure Price % Standard# Item Description Weights Relative Change Error
601 Management Fees 0.7237 1.0439 4.39% 1.3853602 Accountant Fees 0.1370 1.0402 4.02% 1.5437603 Attorney Fees 0.1052 1.0169 1.69% 0.7869604 Newspaper Ads 0.0040 1.0220 2.20% 0.8239605 Agency Fees 0.0053 1.0812 8.12% 5.1240606 Lease Forms 0.0089 1.0000 0.00% 0.0000607 Bill Envelopes 0.0085 1.0803 8.03% 3.3248608 Ledger Paper 0.0075 1.0331 3.31% 2.5094
ADMINISTRATIVE COSTS 0.0734 1.0405 4.05% 1.0289
701 INSURANCE COSTS 0.0823 0.9710 -2.90% 0.6528
801 Light Bulbs 0.0359 1.0000 0.00% 0.0000802 Light Switch 0.0428 1.0000 0.00% 0.0000803 Wet Mop 0.0384 1.0000 0.00% 0.0000804 Floor Wax 0.0464 1.0328 3.28% 2.5990805 Paint 0.2299 1.0252 2.52% 1.2225806 Pushbroom 0.0337 1.0000 0.00% 0.0000807 Detergent 0.0358 1.0000 0.00% 0.0000808 Bucket 0.0376 1.0102 1.02% 0.9755809 Washers 0.0963 1.0332 3.32% 1.9330811 Pine Disinfectant 0.0547 1.0394 3.94% 3.1603812 Window/Glass Cleaner 0.0500 1.0706 7.06% 4.0066813 Switch Plate 0.0458 1.0000 0.00% 0.0000814 Duplex Receptacle 0.0328 1.0000 0.00% 0.0000815 Toilet Seat 0.0965 1.0256 2.56% 2.1257816 Deck Faucet 0.1235 1.0600 6.00% 2.1232
PARTS AND SUPPLIES 0.0151 1.0265 2.65% 0.5571
901 Refrigerator #1 0.0934 1.0995 9.95% 2.2775902 Refrigerator #2 0.4720 1.0503 5.03% 1.5354903 Air Conditioner #1 0.0166 1.0350 3.50% 2.6129904 Air Conditioner #2 0.0204 1.0633 6.33% 3.2701905 Floor Runner 0.0922 1.0191 1.91% 1.7844906 Dishwasher 0.0479 1.0881 8.81% 2.3185907 Range #1 0.0480 1.0692 6.92% 2.6690908 Range #2 0.2095 1.0785 7.85% 2.0964
REPLACEMENT COSTS 0.0064 1.0607 6.07% 0.9085
ALL ITEMS 1.0000 1.0396 3.96% 0.1556

Appendix B: Price Index of Operating Costs
B.3 Price Relative by Building Type, Apartments, 2009
B.4 Price Relative by Hotel Type, 2009
Spec# Item Description Hotel Rooming House SRO
101 TAXES 1.1481 1.1147 1.1492205-206, 208-216 LABOR COSTS 1.0328 1.0203 1.0263301-302 FUEL 0.9124 0.9379 0.8716401-407, 409-410 UTILITIES 1.0305 0.9346 1.0483501-516 CONTRACTOR SERVICES 1.0353 1.0316 1.0233601-608 ADMINISTRATIVE COSTS 1.0395 1.0391 1.0386701 INSURANCE COSTS 0.9710 0.9710 0.9710801-816 PARTS AND SUPPLIES 1.0145 1.0269 1.0292901-904, 907-911 REPLACEMENT COSTS 1.0374 1.0452 1.0465
ALL ITEMS 1.0520 1.0123 1.0161
98 • Appendices
MASTERSpec Pre- Post- Gas Oil METERED# Item Description 1947 1946 Heated Heated BLDGS
101 TAXES, FEES, & PERMITS 1.1288 1.0996 1.1172 1.1172 1.1172201-207 LABOR COSTS 1.0298 1.0277 1.0271 1.0293 1.0263301-303 FUEL 0.9053 0.8733 0.9373 0.8975 0.9361401-410 UTILITIES 1.1207 1.0940 1.1305 1.0936 1.0606501-516 CONTRACTOR SERVICES 1.0280 1.0269 1.0282 1.0275 1.0277601-608 ADMINISTRATIVE COSTS 1.0396 1.0416 1.0387 1.0408 1.0396701 INSURANCE COSTS 0.9710 0.9710 0.9710 0.9710 0.9710801-816 PARTS AND SUPPLIES 1.0269 1.0254 1.0279 1.0259 1.0237
901-908 REPLACEMENT COSTS 1.0614 1.0589 1.0657 1.0595 1.0536
ALL ITEMS 1.0342 1.0388 1.0695 1.0204 1.0506

Appendix B: Price Index of Operating Costs
B.6 Tax Change by Borough and Community Board,Apartments, 2009
Note: No Community Board could be assigned to the following number of buildings for each borough: Manhattan (6), Bronx (24), Brooklyn (8),Queens (76), Staten Island (1). The number of buildings in the category “All” for each borough includes these buildings which could not beassigned a Community Board. Core and Upper Manhattan building totals are defined by block count and cannot be calculated by usingCommunity Board numbers alone.
% Change % Change % Change % Change % ChangeDue to Due to Due to Due to Due to Total
Assessments Exemptions Abatements Tax Rates Interactions % Change
APARTMENTS
Manhattan 4.83% 1.63% -0.07% 5.71% 0.36% 12.46%Bronx 7.37% -0.61% -0.04% 6.04% 0.38% 13.15%Brooklyn 4.06% -0.49% 0.14% 5.83% 0.20% 9.74%Queens 3.96% -0.31% 0.27% 5.73% 0.20% 9.86%Staten Island 0.19% 1.84% -0.82% 5.95% 0.11% 7.27%
All Apts. 4.75% 0.83% 0.10% 5.72% 0.31% 11.72%
HOTELS
Hotel 9.74% 0.35% 0.10% 4.27% 0.35% 14.81%RH 5.87% -0.17% 0.00% 5.48% 0.30% 11.47%SRO 8.61% 0.08% 0.44% 5.38% 0.42% 14.92%
All Hotels 8.34% 0.10% 0.25% 5.09% 0.38% 14.14%
Note: Totals may not add due to rounding.
B.5 Percentage Change in Real Estate Tax Sample by Boroughand Source of Change, Apartments and Hotels, 2009
Housing NYC: Rents, Markets and Trends 2009 • 99
Community Number of TaxBorough Board Buildings Relative
Manhattan 11,944 12.46%1 58 22.79%2 1,056 12.27%3 1,506 16.00%4 953 10.71%5 271 10.24%6 807 11.45%7 1,793 13.50%8 2,030 11.21%9 681 17.03%10 863 24.81%11 563 26.73%12 1,357 13.14%
Lower 7,967 11.84%
Upper 3,977 16.76%
Bronx 4,937 13.15%
1 301 13.09%2 225 10.00%3 281 39.44%4 662 20.59%5 622 16.39%6 444 14.88%
Community Number of TaxBorough Board Buildings Relative
7 913 14.07%8 339 7.49%9 279 16.76%10 179 11.34%11 291 6.37%12 377 12.24%
Brooklyn 11,248 9.74%
1 1,373 16.43%2 575 12.74%3 687 13.78%4 1,111 11.48%5 307 12.05%6 860 14.98%7 774 13.24%8 831 10.69%9 498 13.23%10 727 8.10%11 678 8.24%12 580 6.89%13 156 10.43%14 834 6.80%15 360 8.42%16 274 -31.25%
Community Number of TaxBorough Board Buildings Relative
17 546 10.31%18 69 10.73%
Queens 5,836 9.86%
1 1,663 8.57%2 786 8.70%3 371 3.47%4 350 11.53%5 1,118 12.92%6 307 12.81%7 357 9.13%8 179 10.75%9 191 6.64%10 50 -4.81%11 114 8.77%12 145 9.18%13 44 11.60%14 85 14.41%
Staten Is. 157 7.27%
1 106 6.05%2 27 -2.93%3 23 15.41%
All 34,122 11.72%

Appendix B: Price Index of Operating Costs
100 • Appendices
B.7 Expenditure Weights, Price Relatives, Percent Changes andStandard Errors, All Hotels, 2009
Spec Expenditure Price % Standard# Item Description Weights Relative Change Error
101 TAXES, FEES, & PERMITS 0.2652 1.1414 14.14% 0.7540
205 Social Security Insurance 0.0521 1.0225 2.25% 0.0000206 Unemployment Insurance 0.0123 1.0023 0.23% 0.0000208 Hotel Private Health/Welfare 0.0489 1.0358 3.58% 0.0000209 Hotel Union Labor 0.3093 1.0400 4.00% 0.0000210 SRO Union Labor 0.0120 1.0400 4.00% 0.0000211 Apartment Value 0.1254 1.0074 0.74% 0.7156212 Non-Union Superintendent 0.3104 1.0324 3.24% 0.5582213 Non-Union Maid 0.0000 0.0000 NA 0.0000214 Non-Union Desk Clerk 0.0000 0.0000 NA 0.0000215 Non-Union Maint. Worker 0.0000 0.0000 NA 0.0000216 Non-Union Janitor/Porter 0.1295 1.0254 2.54% 0.7650
LABOR COSTS 0.1554 1.0301 3.01% 0.2188
301 Fuel Oil #2 0.6736 0.9379 -6.21% 1.1363302 Fuel Oil #4 0.0161 0.8424 -15.76% 0.9932303 Fuel Oil #6 0.3103 0.8463 -15.37% 0.8808
FUEL 0.1715 0.9080 -9.20% 0.8129
401 Electricity #1, 2,500 KWH 0.0704 0.8743 -12.57% 0.0000402 Electricity #2, 15,000 KWH 0.0757 0.9058 -9.42% 0.0000403 Electricity #3, 82,000 KWH 0.2481 0.8876 -11.24% 0.0000404 Gas #1, 12,000 therms 0.0589 0.8546 -14.54% 0.0000405 Gas #2, 65,000 therms 0.0450 1.1566 15.66% 0.0000406 Gas #3, 214,000 therms 0.2066 1.1520 15.20% 0.0000407 Steam #1, 1.2m lbs 0.0003 1.0439 4.39% 0.0000409 Telephone 0.1403 1.0812 8.12% 0.0000410 Water & Sewer 0.1549 1.1450 14.50% 0.0000
UTILITIES 0.1491 1.0199 1.99% 0.0000
501 Repainting 0.2188 1.0300 3.00% 0.7329502 Plumbing, Faucet 0.0902 1.0242 2.42% 1.0359503 Plumbing, Stoppage 0.0844 1.0334 3.34% 1.1123504 Elevator #1, 6 fl., 1 e. 0.0388 1.0093 0.93% 0.6822505 Elevator #2, 13 fl., 2 e. 0.0347 1.0197 1.97% 1.6948506 Elevator #3, 19 fl., 3 e. 0.0320 1.0032 0.32% 0.3229507 Burner Repair 0.0288 1.0380 3.80% 1.4438508 Boiler Repair, Tube 0.0349 1.0180 1.80% 1.2485509 Boiler Repair, Weld 0.0349 1.0000 0.00% 1.5635511 Range Repair 0.1321 1.0086 0.86% 2.8969512 Roof Repair 0.0300 1.0612 6.12% 1.7266513 Air Conditioner Repair 0.0417 1.0488 4.88% 2.2375514 Floor Maint. #1, Studio 0.0009 1.0000 0.00% 0.0000515 Floor Maint. #2, 1 Br. 0.0018 1.0000 0.00% 0.0000516 Floor Maint. #3, 2 Br. 0.0166 1.0000 0.00% 0.0000518 Linen/Laundry Service 0.1793 1.0705 7.05% 4.5099
CONTRACTOR SERVICES 0.0768 1.0321 3.21% 0.9288
Spec Expenditure Price % Standard# Item Description Weights Relative Change Error
601 Management Fees 0.6600 1.0439 4.39% 1.3853602 Accountant Fees 0.0804 1.0402 4.02% 1.5437603 Attorney Fees 0.1109 1.0169 1.69% 0.7869604 Newspaper Ads 0.0948 1.0220 2.20% 0.8239605 Agency Fees 0.0235 1.0812 8.12% 5.1240606 Lease Forms 0.0101 1.0000 0.00% 0.0000607 Bill Envelopes 0.0116 1.0803 8.03% 3.3248608 Ledger Paper 0.0087 1.0331 3.31% 2.5094
ADMINISTRATIVE COSTS 0.0810 1.0393 3.93% 0.9389
701 INSURANCE COSTS 0.0460 0.9710 -2.90% 0.6528
801 Light Bulbs 0.0152 1.0000 0.00% 0.0000802 Light Switch 0.0166 1.0000 0.00% 0.0000803 Wet Mop 0.0467 1.0000 0.00% 0.0000804 Floor Wax 0.0594 1.0328 3.28% 2.5990805 Paint 0.1299 1.0252 2.52% 1.2225806 Pushbroom 0.0395 1.0000 0.00% 0.0000807 Detergent 0.0493 1.0000 0.00% 0.0000808 Bucket 0.0472 1.0102 1.02% 0.9755809 Washers 0.0495 1.0332 3.32% 1.9330810 Linens 0.2954 1.0167 1.67% 1.3388811 Pine Disinfectant 0.0220 1.0394 3.94% 3.1603812 Window/Glass Cleaner 0.0199 1.0706 7.06% 4.0066813 Switch Plate 0.0558 1.0000 0.00% 0.0000814 Duplex Receptacle 0.0406 1.0000 0.00% 0.0000815 Toilet Seat 0.0495 1.0256 2.56% 2.1257816 Deck Faucet 0.0635 1.0600 6.00% 2.1232
PARTS AND SUPPLIES 0.0390 1.0196 1.96% 0.5072
901 Refrigerator #1 0.0205 1.0995 9.95% 2.2775902 Refrigerator #2 0.1030 1.0503 5.03% 1.5354903 Air Conditioner #1 0.0608 1.0350 3.50% 2.6129904 Air Conditioner #2 0.0709 1.0633 6.33% 3.2701907 Range #1 0.0093 1.0692 6.92% 2.6690908 Range #2 0.0415 1.0785 7.85% 2.0964909 Carpet 0.3416 1.0378 3.78% 2.2248910 Dresser 0.1829 1.0069 0.69% 0.7874911 Mattress & Box Spring 0.1695 1.0496 4.96% 3.0896
REPLACEMENT COSTS 0.0159 1.0403 4.03% 0.9934
ALL ITEMS 1.0000 1.0351 3.51% 0.2702

B.8 Expenditure Weights and Price Relatives, Lofts, 2009
Appendix B: Price Index of Operating Costs
Housing NYC: Rents, Markets and Trends 2009 • 101
Spec Price# Item Description Weights Relative
101 TAXES 0.2486 1.1172
201 Payroll, Bronx, All 0.0000 1.0295
202 Payroll, Other, Union, Supts. 0.2527 1.0148
203 Payroll, Other, Union, Other 0.0000 1.0135
204 Payroll, Other, Non-Union, All 0.5416 1.0305
205 Social Security Insurance 0.0421 1.0225
206 Unemployment Insurance 0.0063 1.0023
207 Private Health & Welfare 0.1573 1.0571
LABOR COSTS 0.0903 1.0302
301 Fuel Oil #2 0.3116 0.9379
302 Fuel Oil #4 0.5746 0.8424
303 Fuel Oil #6 0.1138 0.8463
FUEL 0.1126 0.8726
401 Electricity #1, 2,500 KWH 0.0112 0.8743
402 Electricity #2, 15,000 KWH 0.1426 0.9058
403 Electricity #3, 82,000 KWH” 0.0000 0.8876
404 Gas #1, 12,000 therms 0.0060 0.8546
405 Gas #2, 65,000 therms 0.0651 1.1566
406 Gas #3, 214,000 therms 0.1845 1.1520
407 Steam #1, 1.2m lbs 0.0196 1.0439
408 Steam #2, 2.6m lbs 0.0076 0.9866
409 Telephone 0.0085 1.0812
410 Water & Sewer - Frontage 0.5549 1.1450
UTILITIES 0.0782 1.1044
501 Repainting 0.3867 1.0300
502 Plumbing, Faucet 0.1404 1.0242
503 Plumbing, Stoppage 0.1242 1.0334
504 Elevator #1, 6 fl., 1 e. 0.0558 1.0093
505 Elevator #2, 13 fl., 2 e. 0.0363 1.0197
506 Elevator #3, 19 fl., 3 e. 0.0204 1.0032
507 Burner Repair 0.0388 1.0380
508 Boiler Repair, Tube 0.0522 1.0180
509 Boiler Repair, Weld 0.0443 1.0000
510 Refrigerator Repair 0.0114 1.0293
511 Range Repair 0.0111 1.0086
512 Roof Repair 0.0654 1.0612
513 Air Conditioner Repair 0.0080 1.0488
514 Floor Maint. #1, Studio 0.0003 1.0000
515 Floor Maint. #2, 1 Br. 0.0005 1.0000
516 Floor Maint. #3, 2 Br. 0.0043 1.0000
CONTRACTOR SERVICES 0.0691 1.0277
Spec Price# Item Description Weights Relative
ADMINISTRATIVE COSTS, LEGAL 0.0747 1.0169
601 Management Fees 0.8171 1.0439
602 Accountant Fees 0.1428 1.0402
604 Newspaper Ads 0.0047 1.0220
605 Agency Fees 0.0062 1.0812
606 Lease Forms 0.0094 1.0000
607 Bill Envelopes 0.0106 1.0803
608 Ledger Paper 0.0092 1.0331
ADMINISTRATIVE COSTS - OTHER 0.0937 1.0434
701 INSURANCE COSTS 0.2041 0.9710
801 Light Bulbs 0.0359 1.0000
802 Light Switch 0.0427 1.0000
803 Wet Mop 0.0384 1.0000
804 Floor Wax 0.0464 1.0328
805 Paint 0.2299 1.0252
806 Pushbroom 0.0337 1.0000
807 Detergent 0.0358 1.0000
808 Bucket 0.0376 1.0102
809 Washers 0.0963 1.0332
811 Pine Disinfectant 0.0546 1.0394
812 Window/Glass Cleaner 0.0501 1.0706
813 Switch Plate 0.0458 1.0000
814 Duplex Receptacle 0.0328 1.0000
815 Toilet Seat 0.0964 1.0256
816 Deck Faucet 0.1236 1.0600
PARTS AND SUPPLIES 0.0161 1.0265
901 Refrigerator #1 0.0934 1.0995
902 Refrigerator #2 0.4719 1.0503
903 Air Conditioner #1 0.0167 1.0350
904 Air Conditioner #2 0.0204 1.0633
905 Floor Runner 0.0921 1.0191
906 Dishwasher 0.0479 1.0881
907 Range #1 0.0479 1.0692
908 Range #2 0.2096 1.0785
REPLACEMENT COSTS 0.0127 1.0607
ALL ITEMS 1.0000 1.0282

Appendix B: Price Index of Operating Costs
B.9 Changes in the Price Index of Operating Costs, ExpenditureWeights and Price Relatives, Apartments, 1999-2009
102 • Appendices
1999 2000 2001 2002 2003Item Price Item Price Item Price Item Price Item Price
Weight Relative Weight Relative Weight Relative Weight Relative Weight Relative
Taxes 0.258 0.4% 0.259 5.2% 0.253 5.5% 0.245 6.6% 0.266 14.8%Labor Costs 0.171 3.4% 0.176 2.6% 0.168 4.0% 0.160 4.0% 0.170 3.5%Fuel 0.090 -18.4% 0.073 54.8% 0.095 33.3% 0.116 -36.1% 0.076 66.9%Utilities 0.147 -0.4% 0.147 5.7% 0.154 15.0% 0.163 -9.9% 0.149 21.7%Contractor Services 0.151 3.5% 0.156 4.6% 0.152 3.6% 0.145 3.9% 0.153 4.8%Administrative Costs 0.086 2.9% 0.089 4.0% 0.085 4.1% 0.082 4.6% 0.087 5.4%Insurance Costs 0.064 3.5% 0.067 0.7% 0.062 4.9% 0.060 16.5% 0.071 40.5%Parts and Supplies 0.023 2.2% 0.023 1.9% 0.022 0.8% 0.021 0.9% 0.021 0.4%Replacement Costs 0.010 1.7% 0.010 0.8% 0.010 1.0% 0.009 -0.6% 0.009 1.4%
All Items 0.03% 7.8% 8.7% -1.6% 16.9%
Pre ‘47
Taxes 0.178 0.4% 0.180 5.2% 0.174 5.5% 0.166 6.6% 0.183 14.8%Labor Costs 0.150 3.8% 0.156 2.7% 0.147 4.1% 0.139 4.4% 0.150 3.6%Fuel 0.126 -17.9% 0.104 52.9% 0.118 33.1% 0.143 -35.4% 0.095 64.3%Utilities 0.151 0.1% 0.152 5.0% 0.174 18.9% 0.188 -11.4% 0.172 22.2%Contractor Services 0.185 3.6% 0.192 4.5% 0.185 3.7% 0.174 3.9% 0.187 4.9%Administrative Costs 0.083 1.5% 0.084 2.6% 0.080 2.7% 0.074 4.4% 0.080 5.2%Insurance Costs 0.086 3.5% 0.089 0.7% 0.082 4.9% 0.078 16.5% 0.094 40.5%Parts and Supplies 0.027 2.2% 0.028 2.0% 0.026 0.8% 0.024 0.9% 0.025 0.4%Replacement Costs 0.016 1.5% 0.016 0.8% 0.015 1.0% 0.013 -0.6% 0.014 1.4%
All Items -0.4% 8.8% 10.1% -3.2% 18.4%
Post ‘46
Taxes 0.335 0.4% 0.336 5.2% 0.330 5.5% 0.322 6.6% 0.345 14.8%Labor Costs 0.206 2.9% 0.212 2.5% 0.203 3.9% 0.195 3.6% 0.203 3.3%Fuel 0.065 -20.0% 0.052 60.7% 0.073 34.1% 0.091 -38.8% 0.056 77.7%Utilities 0.124 -1.5% 0.122 7.1% 0.127 14.5% 0.135 -10.5% 0.121 24.9%Contractor Services 0.103 3.2% 0.107 4.7% 0.104 3.4% 0.100 3.6% 0.104 4.7%Administrative Costs 0.097 2.5% 0.100 3.6% 0.096 3.8% 0.092 4.9% 0.098 5.7%Insurance Costs 0.044 3.5% 0.045 0.7% 0.043 4.9% 0.041 16.5% 0.048 40.5%Parts and Supplies 0.018 2.2% 0.019 1.9% 0.018 0.8% 0.017 1.0% 0.017 0.4%Replacement Costs 0.008 2.0% 0.008 0.7% 0.008 1.0% 0.007 -0.7% 0.007 1.4%
All Items 0.02% 7.2% 7.9% -0.6% 16.2%

Appendix B: Price Index of Operating Costs
Housing NYC: Rents, Markets and Trends 2009 • 103
2004 2005 2006 2007 2008 2009Item Price Item Price Item Price Item Price Item Price Item Price
Weight Relative Weight Relative Weight Relative Weight Relative Weight Relative Weight Relative
0.261 16.2% 0.283 1.2% 0.271 7.8% 0.271 5.8% 0.273 0.3% 0.254 11.7%0.150 4.5% 0.147 3.5% 0.144 2.5% 0.136 8.1% 0.140 4.0% 0.135 2.9%0.108 -2.8% 0.098 20.0% 0.111 22.8% 0.127 0.5% 0.121 37.4% 0.154 -10.1%0.155 0.8% 0.146 8.4% 0.150 7.9% 0.150 6.3% 0.152 8.9% 0.153 10.9%0.137 4.1% 0.133 4.5% 0.132 5.9% 0.129 5.6% 0.130 4.6% 0.126 2.8%0.078 4.0% 0.076 4.0% 0.075 6.5% 0.074 6.9% 0.075 5.3% 0.073 4.1%0.085 14.7% 0.091 8.9% 0.094 2.5% 0.089 1.9% 0.087 2.3% 0.083 -2.9%0.018 1.2% 0.017 2.6% 0.017 5.5% 0.016 3.0% 0.016 2.3% 0.015 2.6%0.008 1.0% 0.007 3.1% 0.007 4.5% 0.007 1.6% 0.007 4.0% 0.006 6.1%
6.9% 5.8% 7.8% 5.1% 7.8% 4.0%
0.178 16.8% 0.195 1.3% 0.185 8.6% 0.185 6.1% 0.188 1.7% 0.175 12.9%0.131 4.7% 0.129 3.5% 0.125 2.5% 0.118 7.3% 0.121 4.2% 0.116 3.0%0.132 -2.3% 0.122 20.9% 0.138 21.9% 0.155 1.3% 0.150 36.0% 0.187 -9.5%0.177 2.4% 0.171 8.4% 0.173 9.6% 0.175 5.3% 0.176 8.1% 0.175 12.1%0.166 4.1% 0.162 4.5% 0.159 5.9% 0.155 5.7% 0.156 4.7% 0.150 2.8%0.071 3.9% 0.070 3.8% 0.068 6.1% 0.066 6.6% 0.067 5.2% 0.065 4.0%0.112 14.7% 0.121 8.9% 0.123 2.5% 0.116 1.9% 0.113 2.3% 0.106 -2.9%0.021 1.2% 0.020 2.6% 0.019 5.4% 0.019 3.1% 0.018 2.3% 0.017 2.7%0.012 1.0% 0.011 3.1% 0.011 4.6% 0.010 1.5% 0.010 4.0% 0.010 6.1%
6.4% 6.8% 8.4% 4.7% 9.1% 3.4%
0.341 15.2% 0.368 1.1% 0.355 6.6% 0.353 5.4% 0.353 -1.7% 0.327 10.0%0.181 4.3% 0.177 3.5% 0.175 2.5% 0.167 9.0% 0.173 3.7% 0.169 2.8%0.085 -5.0% 0.076 16.3% 0.084 26.2% 0.099 -2.8% 0.092 43.1% 0.123 -12.7%0.131 -1.7% 0.120 8.9% 0.124 7.8% 0.125 6.3% 0.127 9.3% 0.130 9.4%0.094 3.9% 0.091 4.3% 0.091 5.9% 0.089 5.4% 0.090 4.5% 0.088 2.7%0.089 4.0% 0.087 4.2% 0.086 6.9% 0.086 7.3% 0.087 5.4% 0.087 4.2%0.059 14.7% 0.063 8.9% 0.065 2.5% 0.062 1.9% 0.060 2.3% 0.058 -2.9%0.015 1.2% 0.014 2.6% 0.014 5.6% 0.013 3.0% 0.013 2.2% 0.012 2.5%0.006 1.0% 0.006 3.0% 0.006 4.3% 0.006 1.7% 0.005 3.9% 0.005 5.9%
6.9% 4.7% 7.4% 5.2% 6.2% 3.9%

Appendix C: Income and Expense Study
C.1 Cross-Sectional Income and Expense Study, EstimatedAverage Operating & Maintenance Cost (2007) perApartment per Month by Building Size and Location,Structures Built Before 1947
Taxes Labor Fuel Water/Sewer Light & Power Maint. Admin. Insurance Misc. Total
Citywide $159 $70 $102 $43 $26 $122 $80 $45 $63 $71011-19 units $177 $59 $111 $44 $29 $130 $88 $50 $77 $76620-99 units $141 $59 $103 $43 $24 $118 $74 $45 $59 $666100+ units $280 $181 $75 $37 $39 $144 $106 $38 $70 $971
Bronx $86 $55 $109 $46 $23 $110 $62 $47 $47 $58511-19 units $85 $63 $127 $46 $27 $117 $61 $52 $64 $64220-99 units $86 $54 $109 $46 $22 $109 $62 $47 $46 $580100+ units $91 $67 $89 $45 $25 $131 $63 $42 $35 $588
Brooklyn $116 $48 $104 $41 $22 $104 $61 $43 $49 $58811-19 units $115 $47 $107 $41 $22 $115 $66 $46 $55 $61420-99 units $114 $46 $104 $42 $21 $99 $59 $43 $49 $576100+ units $142 $74 $95 $41 $21 $110 $65 $38 $35 $620
Manhattan $242 $99 $99 $42 $33 $148 $109 $47 $83 $90111-19 units $256 $69 $112 $47 $38 $148 $120 $55 $99 $94420-99 units $207 $76 $101 $42 $28 $144 $100 $46 $76 $822100+ units $379 $249 $64 $34 $50 $163 $134 $37 $91 $1,201
Queens $143 $54 $94 $41 $19 $105 $62 $39 $61 $62011-19 units $130 $51 $102 $38 $17 $109 $52 $40 $61 $60020-99 units $144 $50 $93 $42 $19 $105 $64 $39 $62 $618100+ units $170 $106 $90 $39 $21 $104 $62 $40 $50 $681
Core Man $316 $116 $86 $38 $36 $152 $125 $45 $94 $1,00911-19 units $301 $68 $104 $45 $36 $153 $128 $55 $112 $1,00320-99 units $289 $81 $87 $37 $30 $145 $117 $44 $85 $915100+ units $398 $259 $63 $33 $52 $167 $140 $37 $93 $1,241
Upper Man $132 $74 $117 $48 $29 $142 $86 $49 $67 $74411-19 units $133 $71 $134 $53 $43 $135 $96 $55 $64 $78520-99 units $130 $72 $116 $47 $26 $144 $84 $49 $68 $736100+ units $174 $147 $77 $40 $33 $128 $78 $37 $67 $781
City w/o Core $114 $57 $107 $44 $23 $114 $66 $45 $54 $62311-19 units $116 $54 $114 $43 $26 $118 $68 $47 $60 $64820-99 units $112 $55 $106 $44 $22 $113 $66 $45 $54 $617100+ units $137 $87 $90 $41 $23 $117 $65 $39 $42 $643
104 • Appendices
Notes: The sum of the lines may not equal the total due to rounding. Totals in this table may not match those in Appendix Table C.3 due to rounding.Data in this table are NOT adjusted for the results of the 1992 Department of Finance audit on I&E reported operating costs. The category “Utilities”used in the I&E Study is the sum of “Water & Sewer” and “Light & Power.” The number of Pre-47 rent stabilized buildings in Staten Island were too smallto calculate reliable statistics. Due to changes in the RPIE form, owners are no longer required to report tax expenses; therefore, tax figures used inthis report were calculated by the Dept. of Finance.
Source: NYC Department of Finance, RPIE Filings.

C.2 Cross-Sectional Income and Expense Study, EstimatedAverage Operating & Maintenance Cost (2007) perApartment per Month by Building Size and Location,Structures Built After 1946
Appendix C: Income and Expense Study
Taxes Labor Fuel Water/Sewer Light & Power Maint. Admin. Insurance Misc. Total
Citywide $221 $121 $85 $39 $40 $109 $85 $39 $65 $80311-19 units $164 $68 $93 $41 $33 $116 $92 $44 $58 $70920-99 units $159 $71 $86 $40 $32 $101 $70 $38 $55 $652100+ units $293 $181 $83 $37 $48 $116 $101 $39 $76 $974
Bronx $122 $75 $91 $43 $37 $97 $64 $41 $47 $61811-19 units - - - - - - - - - -20-99 units $118 $63 $91 $43 $32 $96 $61 $43 $50 $596100+ units $133 $100 $90 $42 $45 $99 $72 $38 $40 $659
Brooklyn $144 $80 $87 $39 $31 $97 $65 $39 $59 $64111-19 units - - - - - - - - - -20-99 units $142 $63 $90 $40 $29 $95 $67 $39 $66 $632100+ units $151 $115 $81 $36 $34 $99 $62 $39 $49 $666
Manhattan $432 $223 $86 $35 $54 $141 $138 $42 $93 $1,24411-19 units $340 $69 $106 $45 $38 $184 $151 $56 $83 $1,07220-99 units $270 $86 $84 $33 $35 $135 $107 $40 $53 $844100+ units $496 $280 $85 $35 $62 $141 $149 $42 $108 $1,397
Queens $162 $92 $80 $39 $36 $97 $70 $34 $58 $66811-19 units $154 $73 $92 $41 $32 $109 $101 $43 $62 $70620-99 units $158 $77 $79 $40 $34 $95 $63 $34 $51 $631100+ units $168 $116 $79 $38 $40 $98 $72 $32 $66 $711
St. Island $154 $99 $79 $30 $23 $92 $51 $39 $42 $610
Core Man $520 $253 $85 $34 $55 $149 $156 $43 $97 $1,39211-19 units - - - - - - - - - -20-99 units $347 $100 $73 $29 $36 $141 $128 $38 $59 $950100+ units $569 $300 $87 $35 $60 $149 $162 $44 $108 $1,515
Upper Man $168 $134 $88 $38 $54 $118 $85 $39 $81 $80411-19 units - - - - - - - - - -20-99 units $169 $68 $99 $39 $33 $129 $80 $43 $45 $705100+ units - - - - - - - - - -
City w/o Core $148 $88 $85 $40 $36 $99 $68 $38 $57 $65811-19 units $138 $67 $90 $40 $33 $106 $83 $43 $56 $65620-99 units $143 $68 $87 $41 $32 $98 $64 $39 $55 $626100+ units $157 $122 $82 $38 $42 $99 $70 $36 $61 $707
Housing NYC: Rents, Markets and Trends 2009 • 105
Notes: The sum of the lines may not equal the total due to rounding. Totals in this table may not match those in Appendix Table C.3 due to rounding.Data in this table are NOT adjusted for the results of the 1992 Department of Finance audit on I&E reported operating costs. The category “Utilities”used in the I&E Study is the sum of “Water & Sewer” and “Light & Power.” The number of Post-46 rent stabilized buildings with 11-19 units in the Bronx,Brooklyn, Staten Island, Core and Upper Manhattan, as well as 20-99 buildings on Staten Island and 100+ unit buildings on Staten Island and in UpperManhattan were too small to calculate reliable statistics. Due to changes in the RPIE form, owners are no longer required to report tax expenses;therefore, tax figures used in this report were calculated by the Dept. of Finance.
Source: NYC Department of Finance, RPIE Filings.

Appendix C: Income and Expense Study
C.3 Cross-Sectional Income and Expense Study, EstimatedAverage Rent, Income and Costs (2007) per Apartment perMonth by Building Size and Location
Post-46 Pre-47 All
Rent Income Costs Rent Income Costs Rent Income Costs
Citywide $1,088 $1,200 $803 $924 $1,039 $710 $974 $1,088 $73811-19 units $923 $1,041 $709 $944 $1,127 $766 $942 $1,118 $76020-99 units $894 $952 $652 $868 $957 $666 $874 $956 $662100+ units $1,312 $1,482 $974 $1,343 $1,542 $971 $1,322 $1,501 $973
Bronx $811 $850 $618 $690 $751 $585 $718 $775 $59211-19 units - - - $653 $740 $642 $647 $737 $64220-99 units $793 $825 $596 $690 $750 $580 $709 $764 $583100+ units $857 $908 $659 $748 $800 $588 $824 $876 $638
Brooklyn $841 $896 $641 $776 $816 $588 $795 $840 $60311-19 units - - - $788 $838 $614 $786 $834 $61020-99 units $830 $875 $632 $764 $799 $576 $782 $819 $591100+ units $870 $944 $666 $860 $915 $620 $867 $935 $651
Manhattan $1,726 $2,003 $1,244 $1,200 $1,420 $901 $1,322 $1,556 $98111-19 units $1,416 $1,890 $1,072 $1,162 $1,498 $944 $1,169 $1,509 $94820-99 units $1,219 $1,365 $844 $1,106 $1,276 $822 $1,119 $1,286 $824100+ units $1,923 $2,244 $1,397 $1,674 $1,969 $1,201 $1,823 $2,134 $1,318
Queens $909 $967 $668 $856 $895 $620 $884 $932 $64511-19 units $930 $1,005 $706 $797 $841 $600 $844 $899 $63820-99 units $890 $940 $631 $860 $896 $618 $873 $915 $624100+ units $930 $996 $711 $943 $1,001 $681 $932 $997 $707
St. Island $797 $866 $610 - - - $788 $856 $61820-99 units - - - - - - $723 $763 $570
Core Man $1,975 $2,309 $1,392 $1,423 $1,708 $1,009 $1,575 $1,874 $1,11511-19 units - - - $1,263 $1,662 $1,003 $1,272 $1,675 $1,00720-99 units $1,470 $1,651 $950 $1,365 $1,587 $915 $1,378 $1,595 $919100+ units $2,121 $2,489 $1,515 $1,737 $2,050 $1,241 $1,956 $2,300 $1,397
Upper Man $986 $1,095 $804 $874 $1,001 $744 $892 $1,016 $75311-19 units - - - $887 $1,052 $785 $884 $1,048 $78320-99 units $890 $988 $705 $867 $989 $736 $869 $989 $733100+ units - - - $1,022 $1,122 $781 $1,062 $1,176 $866
City w/o Core $871 $928 $658 $779 $844 $623 $808 $870 $63411-19 units $849 $915 $656 $785 $861 $648 $793 $868 $64920-99 units $844 $890 $626 $773 $835 $617 $790 $849 $619100+ units $913 $985 $707 $865 $925 $643 $902 $971 $692
Notes: City, borough totals and building size categories are weighted. Cost figures in this table are NOT adjusted for the results of the 1992Department of Finance audit on I&E reported operating costs. The number of Post-46 rent stabilized buildings with 11-19 units in the Bronx,Brooklyn, Staten Island, Core and Upper Manhattan, as well as 20-99 unit Pre-47 buildings on Staten Island and 100+ unit buildings onStaten Island and in Upper Manhattan were too small to calculate reliable statistics. In addition, the number of Pre-47 rent stabilized buildingsin Staten Island were too small to calculate reliable statistics.
Source: NYC Department of Finance, RPIE Filings.
106 • Appendices

C.4 Cross-Sectional Income and Expense Study, EstimatedMedian Rent, Income and Costs (2007) per Apartment perMonth by Building Size and Location
Post-46 Pre-47 All
Rent Income Costs Rent Income Costs Rent Income Costs
Citywide $898 $952 $666 $814 $870 $633 $827 $884 $63711-19 units $853 $919 $650 $883 $1,018 $717 $881 $1,014 $71520-99 units $857 $900 $621 $795 $842 $611 $803 $848 $612100+ units $967 $1,042 $769 $934 $1,029 $692 $958 $1,040 $747
Bronx $787 $806 $578 $688 $740 $559 $699 $746 $56011-19 units - - - $639 $717 $625 $638 $715 $62420-99 units $787 $806 $565 $691 $740 $554 $700 $746 $555100+ units $824 $863 $640 $761 $818 $574 $793 $840 $596
Brooklyn $825 $884 $595 $745 $776 $554 $753 $788 $55911-19 units - - - $732 $765 $572 $734 $765 $57220-99 units $816 $862 $586 $746 $776 $548 $753 $785 $552100+ units $876 $964 $636 $833 $876 $587 $853 $917 $614
Manhattan $1,480 $1,682 $1,037 $1,078 $1,249 $775 $1,101 $1,275 $79011-19 units $1,220 $1,565 $898 $1,126 $1,376 $844 $1,127 $1,383 $84520-99 units $1,310 $1,377 $817 $1,043 $1,160 $740 $1,057 $1,176 $744100+ units $1,924 $2,181 $1,428 $1,385 $1,584 $1,048 $1,665 $1,973 $1,264
Queens $901 $944 $647 $846 $867 $591 $866 $895 $61211-19 units $879 $953 $659 $799 $822 $560 $808 $831 $56520-99 units $877 $917 $612 $857 $872 $595 $864 $884 $600100+ units $920 $961 $697 $934 $984 $658 $921 $962 $691
St. Island $766 $785 $569 - - - $762 $785 $57720-99 units - - - - - - $758 $773 $548
Core Man $1,637 $1,943 $1,162 $1,287 $1,479 $844 $1,310 $1,512 $86311-19 units - - - $1,224 $1,521 $892 $1,225 $1,525 $89420-99 units $1,409 $1,531 $863 $1,310 $1,438 $806 $1,321 $1,448 $810100+ units $2,001 $2,327 $1,503 $1,677 $1,964 $1,239 $1,860 $2,177 $1,372
Upper Man $879 $974 $742 $798 $881 $677 $801 $885 $67811-19 units - - - $798 $911 $730 $796 $911 $72820-99 units $816 $961 $666 $795 $874 $666 $799 $875 $666100+ units - - - $916 $1,085 $673 $915 $1,048 $745
City w/o Core $855 $903 $624 $749 $792 $583 $762 $804 $58811-19 units $777 $816 $593 $743 $795 $605 $745 $796 $60520-99 units $831 $867 $593 $747 $789 $577 $756 $797 $579100+ units $907 $958 $683 $839 $884 $618 $883 $935 $659
Notes: Cost figures in this table are NOT adjusted for the results of the 1992 Department of Finance audit on I&E reported operatingcosts. The number of Post-46 rent stabilized buildings with 11-19 units in the Bronx, Brooklyn, Staten Island, Core and UpperManhattan, as well as 20-99 buildings on Staten Island and 100+ unit buildings on Staten Island and in Upper Manhattan were toosmall to calculate reliable statistics. In addition, the number of Pre-47 rent stabilized buildings in Staten Island were too small tocalculate reliable statistics.
Source: NYC Department of Finance, RPIE Filings.
Appendix C: Income and Expense Study
Housing NYC: Rents, Markets and Trends 2009 • 107

Appendix C: Income and Expense Study
108 • Appendices
C.5 Cross-Sectional Income and Expense Study, Net OperatingIncome in 2007 per Apartment per Month by Building Sizeand Location
C.6 Cross-Sectional Distribution of Operating Costs in 2007, byBuilding Size and Age
Post-46 Pre-47 All Post-46 Pre-47 All
Citywide $397 $329 $349 Core Man $917 $699 $76011-19 units $332 $361 $358 11-19 units - $659 $66820-99 units $300 $291 $293 20-99 units $701 $672 $676100+ units $508 $571 $528 100+ units $974 $809 $903
Bronx $233 $167 $182 Upper Man $291 $258 $26311-19 units - $98 $95 11-19 units - $267 $26520-99 units $229 $170 $181 20-99 units $283 $253 $256100+ units $249 $212 $238 100+ units - $341 $310
Brooklyn $255 $228 $236 City w/o Core $270 $221 $23611-19 units - $224 $225 11-19 units $259 $213 $21920-99 units $243 $223 $228 20-99 units $265 $218 $229100+ units $278 $295 $284 100+ units $278 $283 $279
Manhattan $759 $519 $57511-19 units $817 $553 $56120-99 units $520 $454 $462100+ units $847 $768 $815
Queens $299 $275 $28811-19 units $299 $241 $26220-99 units $309 $278 $291100+ units $285 $320 $290
St. Island $257 - $239
Notes: City, borough totals and building size categories are weighted. Cost figures in this table are NOT adjusted for the results of the1992 Department of Finance audit on I&E reported operating costs. The number of Post-46 rent stabilized buildings with 11-19 units inthe Bronx, Brooklyn, Staten Island, Core and Upper Manhattan, as well as 20-99 buildings on Staten Island and 100+ unit buildings onStaten Island and in Upper Manhattan were too small to calculate reliable statistics. In addition, the number of Pre-47 rent stabilizedbuildings in Staten Island were too small to calculate reliable statistics.
Source: NYC Department of Finance, RPIE Filings.
Taxes Maint. Labor Admin. Utilities Fuel Misc. Insurance Total
Pre-47 22.4% 17.2% 9.9% 11.2% 9.7% 14.4% 8.9% 6.4% 100.0%11-19 units 23.1% 16.9% 7.7% 11.5% 9.6% 14.5% 10.1% 6.5% 100.0%20-99 units 21.1% 17.7% 8.9% 11.2% 10.0% 15.5% 8.8% 6.7% 100.0%100+ units 28.9% 14.8% 18.7% 10.9% 7.8% 7.8% 7.2% 3.9% 100.0%
Post-46 27.5% 13.5% 15.0% 10.6% 9.8% 10.6% 8.1% 4.8% 100.0%11-19 units 23.1% 16.3% 9.5% 12.9% 10.5% 13.1% 8.2% 6.3% 100.0%20-99 units 24.5% 15.5% 10.8% 10.7% 11.0% 13.2% 8.4% 5.9% 100.0%100+ units 30.1% 11.9% 18.5% 10.4% 8.7% 8.6% 7.8% 4.0% 100.0%
All Bldgs. 24.1% 16.0% 11.5% 11.0% 9.7% 13.2% 8.6% 5.9% 100.0%11-19 units 23.1% 16.9% 7.9% 11.6% 9.6% 14.4% 9.9% 6.5% 100.0%20-99 units 21.9% 17.2% 9.3% 11.1% 10.3% 15.0% 8.7% 6.5% 100.0%100+ units 29.7% 12.8% 18.6% 10.5% 8.5% 8.3% 7.6% 3.9% 100.0%
Source: NYC Department of Finance, RPIE Filings.

Housing NYC: Rents, Markets and Trends 2009 • 109
Appendix C: Income and Expense Study
C.7 Cross-Sectional Distribution of “Distressed” Buildings,2007 RPIE Filings
C.8 Cross-Sectional Sample, 2007 RPIE FilingsPost-46 Pre-47 All
Bldgs. DU’s Bldgs. DU’s Bldgs. DU’s
Citywide 1,583 177,109 11,615 443,619 13,201 620,78311-19 units 105 1,545 2,964 44,864 3,071 46,44120-99 units 909 53,352 8,292 334,486 9,202 387,861100+ units 569 122,212 359 64,269 928 186,481
Bronx 246 20,243 2,444 105,534 2,690 125,77711-19 units 10 145 276 4,149 286 4,29420-99 units 190 11,494 2,108 93,297 2,298 104,791100+ units 46 8,604 60 8,088 106 16,692
Brooklyn 302 30,327 2,615 99,700 2,920 130,08211-19 units 12 171 664 10,015 678 10,21820-99 units 199 12,886 1,893 82,512 2,093 95,421100+ units 91 17,270 58 7,173 149 24,443
Manhattan 417 63,614 5,365 189,275 5,782 252,88911-19 units 35 539 1,730 26,094 1,765 26,63320-99 units 177 8,886 3,455 122,723 3,632 131,609100+ units 205 54,189 180 40,458 385 94,647
Queens 566 59,014 1,173 48,364 1,739 107,37811-19 units 35 508 288 4,505 323 5,01320-99 units 317 18,901 826 35,530 1,143 54,431100+ units 214 39,605 59 8,329 273 47,934
St. Island 52 3,911 18 746 70 4,65711-19 units 13 182 6 101 19 28320-99 units 26 1,185 10 424 36 1,609100+ units 13 2,544 2 221 15 2,765
Core Man 347 53,570 3,352 113,219 3,699 166,78911-19 units 30 465 1,313 19,704 1,343 20,16920-99 units 134 6,698 1,911 60,991 2,045 67,689100+ units 183 46,407 128 32,524 311 78,931
Upper Man 70 10,044 2,013 76,056 2,083 86,10011-19 units 5 74 417 6,390 422 6,46420-99 units 43 2,188 1,544 61,732 1,587 63,920100+ units 22 7,782 52 7,934 74 15,716
Source: NYC Department of Finance, RPIE Filings.
Citywide Bronx Brooklyn Manhattan Queens St. Island Core Man Upper Man
Pre-4711-19 units 441 91 99 218 29 - 128 9020-99 units 813 264 149 342 58 - 102 240100+ units 16 4 1 8 3 - 4 4All 1,270 359 249 568 90 - 234 334
Post-4611-19 units 11 - - 4 2 - - -20-99 units 53 12 13 10 15 - 6 4100+ units 29 4 3 10 12 - 10 -All 93 20 17 24 29 3 18 6
All Bldgs.11-19 units 452 95 100 222 31 - 130 9220-99 units 866 276 162 352 73 3 108 244100+ units 45 8 4 18 15 - 14 4All 1,363 379 266 592 119 7 252 340
Source: NYC Department of Finance, RPIE Filings.

Appendix C: Income and Expense Study
C.9 Longitudinal Income and Expense Study, Estimated AverageRent, Income and Costs Changes (2006-2007) by BuildingSize and Location
Post-46 Pre-47 All
Rent Income Costs Rent Income Costs Rent Income Costs
Citywide 5.8% 5.8% 4.2% 6.8% 6.8% 5.7% 6.5% 6.5% 5.2%11-19 units 7.7% 7.1% 6.6% 7.2% 7.2% 6.3% 7.3% 7.2% 6.3%20-99 units 5.4% 5.4% 2.9% 6.7% 6.8% 5.7% 6.4% 6.5% 5.1%100+ units 5.9% 6.0% 5.0% 7.0% 6.6% 4.4% 6.3% 6.2% 4.8%
Bronx 5.6% 6.0% 4.7% 5.4% 5.7% 6.2% 5.5% 5.8% 5.9%11-19 units - - - 3.7% 3.3% 6.1% 3.4% 3.3% 5.8%20-99 units 5.5% 5.7% 4.0% 5.5% 5.9% 6.4% 5.5% 5.9% 5.9%100+ units 6.1% 6.5% 6.0% 6.4% 5.3% 3.5% 6.2% 6.2% 5.3%
Brooklyn 5.2% 5.3% 4.6% 6.4% 6.6% 5.8% 6.0% 6.2% 5.4%11-19 units - - - 6.8% 7.0% 6.8% 6.5% 6.8% 6.5%20-99 units 5.8% 5.6% 3.9% 6.2% 6.5% 5.5% 6.1% 6.2% 5.0%100+ units 4.4% 5.1% 6.0% 6.1% 6.5% 5.4% 5.0% 5.5% 5.8%
Manhattan 6.6% 6.5% 4.6% 7.5% 7.3% 5.5% 7.2% 7.1% 5.2%11-19 units - - - 7.8% 7.8% 6.1% 7.9% 7.8% 5.8%20-99 units 6.4% 6.5% 1.7% 7.4% 7.3% 5.7% 7.3% 7.2% 5.2%100+ units 6.6% 6.5% 5.4% 7.3% 6.7% 4.2% 6.9% 6.6% 5.0%
Queens 4.9% 4.8% 3.1% 7.2% 7.0% 4.9% 6.0% 5.8% 3.9%11-19 units - - - 7.4% 7.0% 5.6% 8.1% 7.7% 8.1%20-99 units 4.7% 4.6% 1.9% 7.3% 7.1% 4.7% 6.2% 6.0% 3.5%100+ units 4.4% 4.3% 2.9% 6.0% 6.1% 4.9% 4.6% 4.6% 3.2%
Staten Island 3.7% 4.5% 0.5% - - - 4.6% 5.1% 3.7%
Core Manhattan 7.0% 6.8% 4.7% 7.9% 7.5% 5.2% 7.6% 7.2% 5.0%11-19 units - - - 8.1% 8.0% 5.8% 8.2% 8.0% 5.4%20-99 units 8.6% 8.2% 2.2% 8.1% 7.6% 5.4% 8.1% 7.7% 5.0%100+ units 6.6% 6.5% 5.3% 7.4% 6.8% 4.3% 6.9% 6.6% 4.9%
Upper Manhattan 4.7% 5.0% 4.3% 6.6% 6.9% 6.0% 6.2% 6.6% 5.7%11-19 units - - - 6.8% 7.0% 7.0% 6.8% 7.0% 7.1%20-99 units 1.9% 2.9% 0.9% 6.6% 7.0% 5.9% 6.1% 6.6% 5.4%100+ units - - - - - - 6.6% 6.3% 5.9%
All City w/o Core 5.1% 5.2% 3.9% 6.3% 6.5% 5.9% 5.9% 6.0% 5.2%11-19 units 7.2% 7.2% 9.0% 6.5% 6.5% 6.7% 6.6% 6.6% 7.0%20-99 units 4.9% 5.0% 3.0% 6.2% 6.5% 5.8% 5.9% 6.1% 5.1%100+ units 5.2% 5.3% 4.6% 6.1% 6.0% 4.5% 5.4% 5.5% 4.6%
Notes: City, borough totals and building size categories are weighted. Cost figures in this table are NOT adjusted for the results of the 1992Department of Finance audit on I&E reported operating costs. The number of Post-46 rent stabilized buildings with 11-19 units in the Bronx,Brooklyn, Staten Island, Core and Upper Manhattan, as well as 20-99 buildings on Staten Island and 100+ unit buildings on Staten Islandand in Upper Manhattan were too small to calculate reliable statistics. In addition, the number of Pre-47 rent stabilized buildings in StatenIsland were too small to calculate reliable statistics.
Source: NYC Department of Finance, RPIE Filings.
110 • Appendices

Housing NYC: Rents, Markets and Trends 2009 • 111
C.10 Longitudinal Income and Expense Study, EstimatedMedian Rent, Income and Costs Changes (2006-2007)by Building Size and Location
Post-46 Pre-47 All
Rent Income Costs Rent Income Costs Rent Income Costs
Citywide 4.8% 4.9% 2.1% 6.0% 6.3% 5.3% 5.9% 6.4% 5.1%11-19 units 6.5% 4.1% 2.4% 7.4% 8.1% 6.0% 7.5% 8.1% 5.8%20-99 units 4.6% 5.4% 1.8% 5.5% 6.0% 4.9% 5.4% 5.8% 4.8%100+ units 4.7% 4.2% 3.1% 5.4% 5.4% 1.9% 4.9% 4.9% 4.2%
Bronx 4.2% 4.4% 4.1% 5.1% 5.7% 4.9% 5.2% 5.8% 4.6%11-19 units 4.9% 2.1% -13.4% 2.6% 2.4% 4.2% 2.6% 2.3% 4.1%20-99 units 3.7% 3.8% 2.7% 5.1% 5.8% 4.8% 5.4% 5.9% 4.7%100+ units 1.1% 5.7% 7.0% 6.8% 3.5% 9.0% 6.2% 5.8% 8.8%
Brooklyn 5.5% 5.6% 2.6% 5.8% 6.0% 4.9% 5.4% 5.9% 5.1%11-19 units 2.0% 1.8% 8.0% 6.3% 6.3% 5.9% 6.7% 6.0% 5.9%20-99 units 4.3% 4.7% 2.4% 5.8% 5.8% 5.1% 5.3% 5.6% 5.1%100+ units 6.9% 4.6% 4.5% 9.6% 6.2% 1.4% 4.8% 5.3% 5.6%
Manhattan 8.7% 8.2% 4.8% 7.5% 7.7% 5.2% 7.5% 7.7% 5.2%11-19 units 5.2% 3.8% 1.5% 5.9% 6.4% 5.8% 5.8% 6.7% 5.2%20-99 units 8.6% 10.2% -1.3% 8.3% 7.3% 5.4% 8.1% 7.0% 5.3%100+ units 5.8% 5.4% 6.1% 5.6% 5.4% 6.7% 5.6% 7.4% 6.2%
Queens 4.5% 4.5% 1.9% 7.0% 6.7% 5.5% 5.9% 6.3% 3.9%11-19 units 4.1% 8.2% 17.0% 7.5% 6.9% 6.0% 7.0% 7.3% 5.7%20-99 units 4.1% 4.2% 0.5% 7.3% 6.5% 5.8% 5.8% 6.2% 3.6%100+ units 4.6% 3.8% 5.9% 6.6% 5.6% 9.5% 5.0% 4.7% 5.6%
Staten Island 4.2% 4.7% 3.0% 0.0% 9.9% 19.1% 1.2% 5.2% 3.8%
Core Manhattan 7.1% 7.1% 4.5% 7.6% 8.1% 5.4% 7.5% 8.3% 5.0%11-19 units 9.7% -1.2% 8.0% 6.8% 7.2% 5.0% 6.7% 7.2% 4.9%20-99 units 9.8% 5.7% -0.8% 7.8% 8.7% 5.5% 8.1% 8.8% 5.3%100+ units 4.6% 6.1% 6.4% 8.8% 10.3% 8.0% 6.7% 5.2% 6.4%
Upper Manhattan 6.6% 4.9% 5.0% 5.6% 7.9% 7.1% 5.6% 7.7% 7.1%11-19 units 14.0% 5.9% 12.7% 8.5% 9.3% 7.7% 8.2% 9.4% 8.3%20-99 units 8.1% 3.5% 5.0% 5.5% 7.6% 6.8% 5.6% 7.2% 6.6%100+ units 7.2% 4.0% 3.8% 6.9% 12.1% 5.9% 6.8% 5.5% -2.8%
All City w/o Core 4.6% 4.8% 2.5% 5.4% 6.0% 5.2% 5.3% 5.7% 4.8%11-19 units 6.4% 4.2% 10.9% 6.1% 6.8% 6.2% 6.0% 6.6% 6.3%20-99 units 5.0% 4.5% 2.1% 5.4% 6.0% 5.1% 5.1% 5.9% 4.9%100+ units 5.0% 4.8% 4.7% 3.8% 5.9% 5.7% 5.0% 5.0% 4.4%
Notes: Cost figures in this table are NOT adjusted for the results of the 1992 Department of Finance audit on I&E reported operating costs. The numberof Post-46 rent stabilized buildings with 11-19 units in the Bronx, Brooklyn, Staten Island, Core and Upper Manhattan, as well as 20-99 buildings onStaten Island and 100+ unit buildings on Staten Island and in Upper Manhattan were too small to calculate reliable statistics. In addition, the numberof Pre-47 rent stabilized buildings in Staten Island were too small to calculate reliable statistics.
Source: NYC Department of Finance, RPIE Filings.
Appendix C: Income and Expense Study

C.11 Longitudinal Income and Expense Study, Net OperatingIncome Changes (2006-2007) by Building Size and Location
Post-46 Pre-47 All Post-46 Pre-47 All
Citywide 9.1% 9.5% 9.3% Core Manhattan 10.0% 10.9% 10.6%11-19 units - 9.2% 9.1% 11-19 units - 11.5% 12.0%20-99 units 11.1% 9.3% 9.7% 20-99 units 17.1% 10.6% 11.4%100+ units 7.9% 10.5% 8.8% 100+ units 8.4% 10.9% 9.3%
Bronx 9.4% 3.8% 5.5% Upper Manhattan 6.8% 9.5% 9.1%11-19 units - -12.6% -11.4% 11-19 units - 7.1% 6.7%20-99 units 10.1% 4.2% 5.6% 20-99 units - 9.9% 9.7%100+ units 7.9% 10.2% 8.5% 100+ units - - 7.5%
Brooklyn 7.0% 8.8% 8.2% All City w/o Core 8.3% 8.2% 8.3%11-19 units - 7.7% 7.3% 11-19 units 3.3% 6.0% 5.5%20-99 units 10.1% 9.2% 9.4% 20-99 units 9.8% 8.5% 8.9%100+ units 3.1% 9.0% 4.9% 100+ units 7.0% 9.4% 7.6%
Manhattan 9.7% 10.6% 10.3%11-19 units - 10.9% 11.2%20-99 units 14.7% 10.4% 10.9%100+ units 8.3% 10.8% 9.2%
Queens 8.6% 12.2% 10.2%11-19 units - 10.6% 6.7%20-99 units 10.2% 12.9% 11.6%100+ units 7.9% 8.7% 8.0%
St. Island 15.1% - 8.8%
Notes: City, borough totals and building size categories are weighted. Cost figures in this table are NOT adjusted for the results of the 1992Department of Finance audit on I&E reported operating costs. The number of Post-46 rent stabilized buildings with 11-19 units in the Bronx,Brooklyn, Staten Island, Core and Upper Manhattan, as well as 20-99 buildings on Staten Island and 100+ unit buildings on Staten Island andin Upper Manhattan were too small to calculate reliable statistics. In addition, the number of Pre-47 rent stabilized buildings in Staten Islandwere too small to calculate reliable statistics.
Source: NYC Department of Finance, RPIE Filings.
112 • Appendices
Appendix C: Income and Expense Study

C.12 Longitudinal Sample, 2006 & 2007 RPIE Filings
Post-46 Pre-47 All
Bldgs. DU’s Bldgs. DU’s Bldgs. DU’s
Citywide 1,370 153,896 9,893 384,000 11,265 537,93511-19 units 86 1,264 2,414 36,587 2,501 37,86720-99 units 791 46,236 7,160 289,438 7,952 335,697100+ units 493 106,396 319 57,975 812 164,371
Bronx 203 15,572 2,014 89,072 2,217 104,64411-19 units 8 115 200 2,999 208 3,11420-99 units 159 9,591 1,760 79,224 1,919 88,815100+ units 36 5,866 54 6,849 90 12,715
Brooklyn 266 25,804 2,233 85,850 2,501 111,69311-19 units 12 171 532 8,063 545 8,25020-99 units 178 11,466 1,652 71,902 1,831 83,391100+ units 76 14,167 49 5,885 125 20,052
Manhattan 358 55,149 4,633 167,117 4,991 222,26611-19 units 30 459 1,440 21,720 1,470 22,17920-99 units 155 7,733 3,031 107,864 3,186 115,597100+ units 173 46,957 162 37,533 335 84,490
Queens 499 53,747 1,000 41,326 1,499 95,07311-19 units 25 365 239 3,753 264 4,11820-99 units 279 16,520 709 30,086 988 46,606100+ units 195 36,862 52 7,487 247 44,349
St. Island 44 3,624 13 635 57 4,25911-19 units 11 154 3 52 14 20620-99 units 20 926 8 362 28 1,288100+ units 13 2,544 2 221 15 2,765
Core Manhattan 302 47,527 3,002 103,801 3,304 151,32811-19 units 26 400 1,147 17,227 1,173 17,62720-99 units 119 5,941 1,736 55,679 1,855 61,620100+ units 157 41,186 119 30,895 276 72,081
Upper Manhattan 56 7,622 1,631 63,316 1,687 70,93811-19 units 4 59 293 4,493 297 4,55220-99 units 36 1,792 1,295 52,185 1,331 53,977100+ units 16 5,771 43 6,638 59 12,409
Source: NYC Department of Finance, RPIE Filings.
Appendix C: Income and Expense Study
Housing NYC: Rents, Markets and Trends 2009 • 113

D.1 Occupancy Status
ALL UNITS Owner Units Renter Units Stabilized
Total Number of Units 3,327,078@
(occupied, vacant available, and vacant not available)
Number of Units 3,190,272 1,045,818 2,144,454 1,023,248(occupied and vacant, available)
Occupied Units 3,101,300 1,019,345 2,081,955 1,001,216
Bronx 479,991 106,583 373,408 218,799Brooklyn 904,188 255,938 648,250 273,844Manhattan 761,554 183,036 578,518 296,829Queens 791,037 361,713 429,324 203,371Staten Island 164,530 112,075 52,455 8,373
Vacant Units 225,778
Vacant, for rent or sale 88,972 26,473 62,499 22,032
Bronx 14,627 2,583 12,044 7,485Brooklyn 23,520 7,919 15,601 4,907Manhattan 22,492 6,089 16,403 4,146Queens 22,058 7,328 14,730 5,345Staten Island 6,275 2,554 3,721 149
Asking Rent<$600 - - 3,556 1,709$600-799 - - 4,278 1,964$800-999 - - 8,795 4,109$1000-1199 - - 10,750 6,234$1200-1399 - - 9,564 3,797$1400-1599 - - 6,905 2,365$1600-1799 - - 4,036 1,105$1800-1999 - - 2,326 193$2000+ - - 12,287 554
Vacant, not for rent or sale 136,806 - - -
Bronx 14,352 - - -Brooklyn 34,836 - - -Manhattan 54,481 - - -Queens 25,618 - - -Staten Island 7,519 - - -
Rented-Not Yet Occupied 8,507 - - -Sold-Not Yet Occupied 6,674 - - -Undergoing Renovation 30,562 - - -Awaiting Renovation 19,701 - - -Non-Residential Use 1,969 - - -Legal Dispute 14,692 - - -Awaiting Conversion 1,205 - - -Held for Occasional Use 37,589 - - -Unable to Rent or Sell 9,818 - - -Held Pending Sale of Building 1,975 - - -Held for Planned Demolition 187 - - -Held for Other Reasons 2,610 - - -(Not Reported) 1,317 - - -
@ All housing units, including owner-occupied, renter-occupied, vacant for rent, vacant for sale, and vacant unavailable.
114 • Appendices
Appendix D: 2008 Housing and Vacancy Survey, Summary Tables

Appendix D: 2008 Housing and Vacancy Survey, Summary Tables
Rent Stabilized Units Rent Mitchell- Public Other OtherPre-1947 Post-1946 Controlled Lama Housing Regulated* Rentals**
Total Number of Units
717,472 305,776 39,901 60,887 185,339 62,937 772,651 Number of Units(occupied and vacant, available)
700,555 300,661 39,901 58,979 183,809 62,108 735,942 Occupied Units
163,486 55,313 3,860 13,529 43,475 18,978 74,767 Bronx205,247 68,597 10,328 20,439 61,092 17,588 264,959 Brooklyn230,024 66,805 20,354 14,265 59,597 18,809 168,664 Manhattan99,867 103,504 5,359 9,585 16,943 6,066 188,000 Queens1,931 6,442 0 1,161 2,702 667 39,552 Staten Island
Vacant Units
16,917 5,115 0 1,908 1,530 829 36,709 Vacant, for rent or sale
5,982 1,503 0 616 0 201 3,891 Bronx4,472 435 0 737 597 575 8,941 Brooklyn3,636 510 0 204 179 53 12,025 Manhattan2,678 2,667 0 0 469 0 8,916 Queens149 0 0 351 285 0 2,936 Staten Island
Asking Rent1,709 0 - 0 915 447 485 <$6001,191 773 - 0 285 166 1,863 $600-7993,106 1,003 - 679 151 8 3,848 $800-9995,046 1,188 - 351 0 193 3,972 $1000-11992,805 992 - 187 0 0 5,580 $1200-13991,739 626 - 0 0 7 4,533 $1400-1599912 193 - 0 0 0 2,931 $1600-1799193 0 - 182 179 7 1,765 $1800-1999216 338 - 0 0 0 11,733 $2000+
- - - - - - - Vacant, not for rent or sale
- - - - - - - Bronx- - - - - - - Brooklyn- - - - - - - Manhattan- - - - - - - Queens- - - - - - - Staten Island
- - - - - - - Rented-Not Yet Occupied- - - - - - - Sold-Not Yet Occupied- - - - - - - Undergoing Renovation- - - - - - - Awaiting Renovation- - - - - - - Non-Residential Use- - - - - - - Legal Dispute- - - - - - - Awaiting Conversion- - - - - - - Held for Occasional Use- - - - - - - Unable to Rent or Sell- - - - - - - Held Pending Sale of Building- - - - - - - Held for Planned Demolition- - - - - - - Held for Other Reasons- - - - - - - (Not Reported)
* Other Regulated Rentals encompasses In Rem units, as well as those regulated by HUD, Article 4 or 5, and the New York City Loft Board.** Other Rentals encompasses dwellings which have never been regulated, units which have been deregulated (including those in buildings with
fewer than 6 apartments) and unregulated rentals in cooperatives or condominiums.
Housing NYC: Rents, Markets and Trends 2009 • 115

Appendix D: 2008 Housing and Vacancy Survey, Summary Tables
D.1 Occupancy Status (continued)
ALL UNITS Owner Units Renter Units Stabilized
Total Number of Units 3,327,078@
(occupied, vacant available, and vacant not available)
Number of Units 3,190,272 32.8% 67.2% 47.7%(occupied and vacant, available)
Occupied Units 3,101,300 32.9% 67.1% 48.1%
Bronx 15.5% 10.5% 17.9% 21.9%Brooklyn 29.2% 25.1% 31.1% 27.4%Manhattan 24.6% 18.0% 27.8% 29.6%Queens 25.5% 35.5% 20.6% 20.3%Staten Island 5.3% 11.0% 2.5% 0.8%
Vacant Units 225,778
Vacant, for rent or sale 88,972 29.8% 70.2% 35.3%
Bronx 16.4% 9.8% 19.3% 34.0%Brooklyn 26.4% 29.9% 25.0% 22.3%Manhattan 25.3% 23.0% 26.2% 18.8%Queens 24.8% 27.7% 23.6% 24.3%Staten Island 7.1% 9.6% 6.0% 0.7%
Asking Rent<$600 - - 5.7% 7.8%$600-799 - - 6.8% 8.9%$800-999 - - 14.1% 18.7%$1000-1199 - - 17.2% 28.3%$1200-1399 - - 15.3% 17.2%$1400-1599 - - 11.0% 10.7%$1600-1799 - - 6.5% 5.0%$1800-1999 - - 3.7% 0.9%$2000+ - - 19.7% 2.5%
Vacant, not for rent or sale 136,806
Bronx 10.5% - - -Brooklyn 25.5% - - -Manhattan 39.8% - - -Queens 18.7% - - -Staten Island 5.5% - - -
Rented-Not Yet Occupied 6.2% - - -Sold-Not Yet Occupied 4.9% - - -Undergoing Renovation 22.3% - - -Awaiting Renovation 14.4% - - -Non-Residential Use 1.4% - - -Legal Dispute 10.7% - - -Awaiting Conversion 0.9% - - -Held for Occasional Use 27.5% - - -Unable to Rent or Sell 7.2% - - -Held Pending Sale of Building 1.4% - - -Held for Planned Demolition 0.1% - - -Held for Other Reasons 1.9% - - -(Not Reported) 1.0% - - -
@ All housing units, including owner-occupied, renter-occupied, vacant for rent, vacant for sale, and vacant unavailable.
116 • Appendices

Appendix D: 2008 Housing and Vacancy Survey, Summary Tables
Rent Stabilized Units Rent Mitchell- Public Other OtherPre-1947 Post-1946 Controlled Lama Housing Regulated* Rentals**
Total Number of Units
70.1% 29.9% 1.9% 1.9% 8.6% 2.9% 36.0% Number of Units(occupied and vacant, available)
70.0% 30.0% 1.9% 1.9% 8.8% 3.0% 35.3% Occupied Units
23.3% 18.4% 9.7% 22.9% 23.7% 30.6% 10.2% Bronx29.3% 22.8% 25.9% 34.7% 33.2% 28.3% 36.0% Brooklyn32.8% 22.2% 51.0% 24.2% 32.4% 30.3% 22.9% Manhattan14.3% 34.4% 13.4% 16.3% 9.2% 9.8% 25.5% Queens0.3% 2.1% 0.0% 2.0% 1.5% 1.1% 5.4% Staten Island
Vacant Units
76.8% 23.2% 0.0% 2.1% 2.4% 1.3% 58.7% Vacant, for rent or sale
35.4% 29.4% 0.0% 32.3% 0.0% 24.2% 10.6% Bronx26.4% 8.5% 0.0% 38.6% 39.0% 69.4% 24.4% Brooklyn21.5% 10.0% 0.0% 10.7% 11.7% 6.4% 32.8% Manhattan15.8% 52.1% 0.0% 0.0% 30.7% 0.0% 24.3% Queens0.9% 0.0% 0.0% 18.4% 18.6% 0.0% 8.0% Staten Island
Asking Rent10.1% 0.0% - 0.0% 59.8% 54.0% 1.3% <$6007.0% 15.1% - 0.0% 18.6% 20.0% 5.1% $600-79918.4% 19.6% - 48.5% 9.9% 1.0% 10.5% $800-99929.8% 23.2% - 25.1% 0.0% 23.3% 10.8% $1000-119916.6% 19.4% - 13.4% 0.0% 0.0% 15.2% $1200-139910.3% 12.2% - 0.0% 0.0% 0.8% 12.3% $1400-15995.4% 3.8% - 0.0% 0.0% 0.0% 8.0% $1600-17991.1% 0.0% - 13.0% 11.7% 0.8% 4.8% $1800-19991.3% 6.6% - 0.0% 0.0% 0.0% 32.0% $2000+
Vacant, not for rent or sale
- - - - - - - Bronx- - - - - - - Brooklyn- - - - - - - Manhattan- - - - - - - Queens- - - - - - - Staten Island
- - - - - - - Rented-Not Yet Occupied- - - - - - - Sold-Not Yet Occupied- - - - - - - Undergoing Renovation- - - - - - - Awaiting Renovation- - - - - - - Non-Residential Use- - - - - - - Legal Dispute- - - - - - - Awaiting Conversion- - - - - - - Held for Occasional Use- - - - - - - Unable to Rent or Sell- - - - - - - Held Pending Sale of Building- - - - - - - Held for Planned Demolition- - - - - - - Held for Other Reasons- - - - - - - (Not Reported)
* Other Regulated Rentals encompasses In Rem units, as well as those regulated by HUD, Article 4 or 5, and the New York City Loft Board.** Other Rentals encompasses dwellings which have never been regulated, units which have been deregulated (including those in buildings with
fewer than 6 apartments) and unregulated rentals in cooperatives or condominiums.
Housing NYC: Rents, Markets and Trends 2009 • 117

Appendix D: 2008 Housing and Vacancy Survey, Summary Tables
Owner RenterAll Households@ Households Households Stabilized
Monthly Contract Rent$0-$199 - - 44,287 5,767$200-$299 - - 78,603 12,527$300-$399 - - 66,661 21,872$400-$499 - - 71,022 30,868$500-$599 - - 108,620 48,814$600-$699 - - 146,252 94,628$700-$799 - - 163,556 101,296$800-$899 - - 186,638 119,910$900-$999 - - 214,542 138,616$1000-$1249 - - 394,171 207,590$1250-$1499 - - 184,293 90,533$1500-$1749 - - 134,731 56,845$1750+ - - 253,176 58,924(No Cash Rent) - - (35,402) (13,027)
Mean - - $1,119 $1,008Mean/Room - - $377 $371Median - - $950 $925Median/Room - - $280 $292
Monthly Cost of ElectricityMean $104 $139 $83 $80Median $80 $100 $70 $70
Monthly Cost of Utility GasMean $118 $200 $51 $38Median $50 $150 $30 $30
Monthly Cost of Water/SewerMean $67 $68 $55 -Median $52 $52 $50 -
Monthly Cost of Other FuelsMean $245 $253 $138 -Median $208 $233 $94 -
Monthly Mortgage PaymentsMean - $2,802 - -Median - $1,750 - -
Monthly Insurance PaymentsMean - $100 - -Median - $75 - -
Monthly Property TaxesMean - $268 - -Median - $233 - -
@ All households, including owners and renters.
D.2 Economic Characteristics
118 • Appendices

Appendix D: 2008 Housing and Vacancy Survey, Summary Tables
Rent Stabilized Units Rent Mitchell- Public Other OtherPre-1947 Post-1946 Controlled Lama Housing Regulated* Rentals**
Monthly Contract Rent3,667 2,100 1,876 681 23,693 12,269º $0-$1998,487 4,041 4,315 3,627 42,490 15,644º $200-$29917,751 4,121 3,228 3,526 26,938 11,098º $300-$39924,351 6,517 2,527 4,179 24,356 9,092º $400-$49938,895 9,919 2,811 5,312 32,656 19,027º $500-$59970,218 24,409 3,782 3,750 17,480 26,612º $600-$69972,993 28,303 3,086 7,973 8,382 42,820º $700-$79988,867 31,043 2,550 7,697 4,198 52,283º $800-$89996,883 41,733 2,297 4,515 1,633 67,482º $900-$999139,568 68,022 7,004 11,898 720 166,960º $1000-$124957,501 33,032 1,212 3,228 182 89,139º $1250-$149935,971 20,873 1,309 1,290 152 75,137º $1500-$174935,465 23,459 2,848 1,134 773 189,497º $1750+(9,939) (3,088) (1,057) (169) (159) (20,990)º (No Cash Rent)
$970 $1,096 $833 $817 $424 $1,461º Mean$358 $402 $253 $265 $123 $457º Mean/Room$900 $985 $721 $800 $387 $1,200º Median$282 $309 $200 $218 $105 $300º Median/Room
Monthly Cost of Electricity$80 $79 $80 $76 $76 $72 $86 Mean$70 $70 $65 $70 $65 $60 $74 Median
Monthly Cost of Utility Gas$38 $42 $34 $35 $22 $66 $67 Mean$30 $30 $27 $25 $20 $30 $40 Median
Monthly Cost of Water/Sewer- - - - - - - Mean- - - - - - - Median
Monthly Cost of Other Fuels- - - - - - - Mean- - - - - - - Median
Monthly Mortgage Payments- - - - - - - Mean- - - - - - - Median
Monthly Insurance Payments- - - - - - - Mean- - - - - - - Median
Monthly Property Taxes- - - - - - - Mean- - - - - - - Median
* Other Regulated Rentals encompass In Rem units, as well as those regulated by HUD, Article 4 or 5, and the New York City Loft Board.** Other Rentals encompass dwellings which have never been regulated, units which have been deregulated (including those in buildings with
fewer than 6 apartments) and unregulated rentals in cooperatives or condominiums.º Separate contract rent figures cannot be run for “Other Regulated” and “Other Rentals” households. The households receiving assistance for these
two categories are reported together.
Housing NYC: Rents, Markets and Trends 2009 • 119
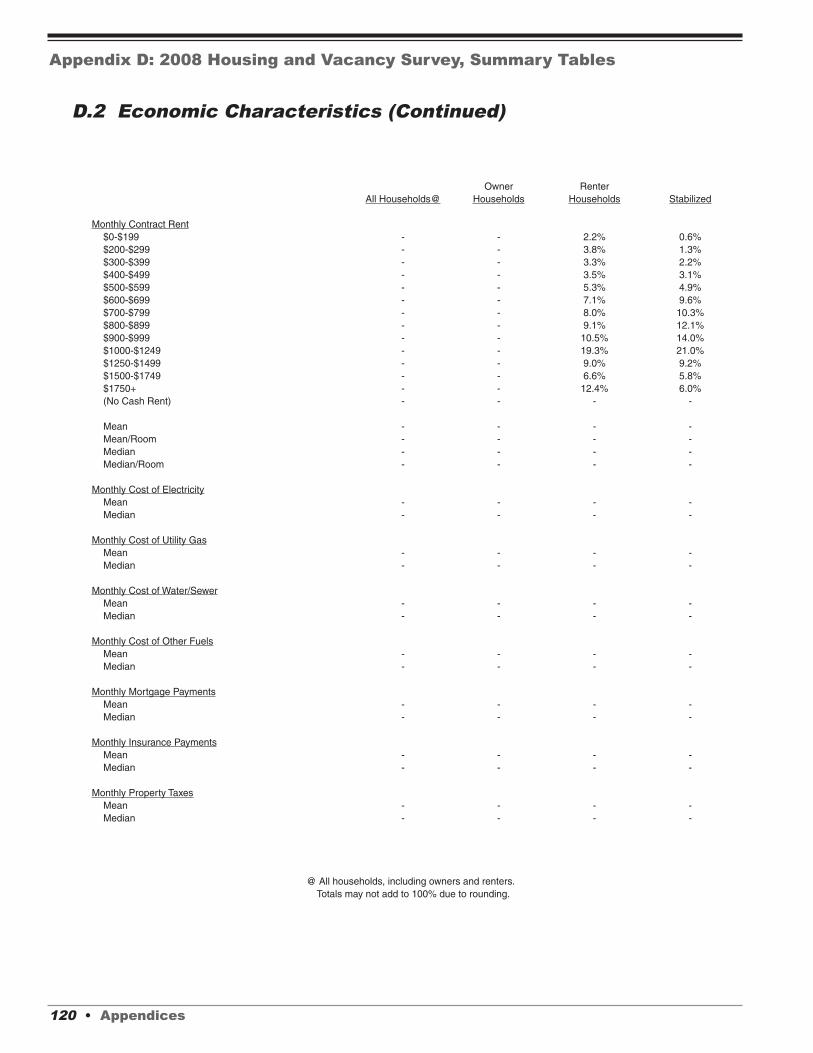
Appendix D: 2008 Housing and Vacancy Survey, Summary Tables
D.2 Economic Characteristics (Continued)
Owner RenterAll Households@ Households Households Stabilized
Monthly Contract Rent$0-$199 - - 2.2% 0.6%$200-$299 - - 3.8% 1.3%$300-$399 - - 3.3% 2.2%$400-$499 - - 3.5% 3.1%$500-$599 - - 5.3% 4.9%$600-$699 - - 7.1% 9.6%$700-$799 - - 8.0% 10.3%$800-$899 - - 9.1% 12.1%$900-$999 - - 10.5% 14.0%$1000-$1249 - - 19.3% 21.0%$1250-$1499 - - 9.0% 9.2%$1500-$1749 - - 6.6% 5.8%$1750+ - - 12.4% 6.0%(No Cash Rent) - - - -
Mean - - - -Mean/Room - - - -Median - - - -Median/Room - - - -
Monthly Cost of ElectricityMean - - - -Median - - - -
Monthly Cost of Utility GasMean - - - -Median - - - -
Monthly Cost of Water/SewerMean - - - -Median - - - -
Monthly Cost of Other FuelsMean - - - -Median - - - -
Monthly Mortgage PaymentsMean - - - -Median - - - -
Monthly Insurance PaymentsMean - - - -Median - - - -
Monthly Property TaxesMean - - - -Median - - - -
@ All households, including owners and renters.Totals may not add to 100% due to rounding.
120 • Appendices

Appendix D: 2008 Housing and Vacancy Survey, Summary Tables
Rent Stabilized Units Rent Mitchell- Public Other OtherPre-1947 Post-1946 Controlled Lama Housing Regulated* Rentals**
Monthly Contract Rent0.5% 0.7% 4.8% 1.2% 12.9% 1.6%º $0-$1991.2% 1.4% 11.1% 6.2% 23.1% 2.0%º $200-$2992.6% 1.4% 8.3% 6.0% 14.7% 1.4%º $300-$3993.5% 2.2% 6.5% 7.1% 13.3% 1.2%º $400-$4995.6% 3.3% 7.2% 9.0% 17.8% 2.4%º $500-$59910.2% 8.2% 9.7% 6.4% 9.5% 3.4%º $600-$69910.6% 9.5% 7.9% 13.6% 4.6% 5.5%º $700-$79912.9% 10.4% 6.6% 13.1% 2.3% 6.7%º $800-$89914.0% 14.0% 5.9% 7.7% 0.9% 8.7%º $900-$99920.2% 22.9% 18.0% 20.2% 0.4% 21.5%º $1000-$12498.3% 11.1% 3.1% 5.5% 0.1% 11.5%º $1250-$14995.2% 7.0% 3.4% 2.2% 0.1% 9.7%º $1500-$17495.1% 7.9% 7.3% 1.9% 0.4% 24.4%º $1750+
- - - - - - (No Cash Rent)
- - - - - - Mean- - - - - - Mean/Room- - - - - - Median- - - - - - Median/Room
Monthly Cost of Electricity- - - - - - - Mean- - - - - - - Median
Monthly Cost of Utility Gas- - - - - - - Mean- - - - - - - Median
Monthly Cost of Water/Sewer- - - - - - - Mean- - - - - - - Median
Monthly Cost of Other Fuels- - - - - - - Mean- - - - - - - Median
Monthly Mortgage Payments- - - - - - - Mean- - - - - - - Median
Monthly Insurance Payments- - - - - - - Mean- - - - - - - Median
Monthly Property Taxes- - - - - - - Mean- - - - - - - Median
* Other Regulated Rentals encompass In Rem units, as well as those regulated by HUD, Article 4 or 5, and the New York City Loft Board.** Other Rentals encompass dwellings which have never been regulated, units which have been deregulated (including those in buildings with
fewer than 6 apartments) and unregulated rentals in cooperatives or condominiums.º Separate contract rent figures cannot be run for “Other Regulated” and “Other Rentals” households. The households receiving assistance for these
two categories are reported together.
Totals may not add to 100% due to rounding.
Housing NYC: Rents, Markets and Trends 2009 • 121

Appendix D: 2008 Housing and Vacancy Survey, Summary Tables
D.2 Economic Characteristics (Continued)
Owner RenterAll Households@ Households Households Stabilized
2007 Total Household IncomeLoss, no income or<$5000 227,732 55,478 172,254 81,160$5000-$9999 206,017 22,307 183,710 75,931$10,000-$19,999 349,069 73,514 275,555 137,978$20,000-$29,999 320,461 75,783 244,678 125,911$30,000-$39,999 281,268 65,871 215,398 105,445$40,000-$49,999 255,650 62,442 193,208 97,563$50,000-$59,999 228,198 76,983 151,216 74,875$60,000-$69,999 194,598 70,479 124,119 65,464$70,000-$79,999 161,834 58,163 103,670 52,232$80,000-$89,999 143,576 59,916 83,660 39,009$90,000-$99,999 99,021 47,414 51,607 24,526$100,000-$124,999 220,377 108,179 112,197 53,799$125,000-$149,999 125,769 72,352 53,417 25,154$150,000+ 287,728 170,465 117,263 42,166
Mean $73,735 $107,479 $57,213 $52,157Median $45,000 $70,000 $36,300 $36,000
Contract Rent to Income Ratio<10% - - 138,534 71,80410%-19% - - 446,303 225,05820%-29% - - 426,932 192,22330%-39% - - 255,816 112,45040%-49% - - 163,655 79,43750%-59% - - 106,358 54,78060%-69% - - 81,105 38,97670%+ - - 318,861 160,270(Not Computed) - - 144,388 66,218
Mean - - 38.8% 39.0%Median - - 28.7% 28.5%
Households in PovertyHouseholds Below 100% of Poverty Level 572,996 96,563 476,433 214,834Households at or Above 100% of Poverty Level 2,528,302 922,783 1,605,520 786,381
Households Below 125% of Poverty Level 722,240 127,580 594,660 274,853Households at or Above 125% of Poverty Level 2,379,058 891,765 1,487,293 726,362
Households Receiving Public Assistance¥ 323,482 34,666 288,816 126,695Households Not Receiving Public Assistance 2,148,433 772,429 1,376,004 666,266(Do Not Know/Not Reported) (629,380) (212,250) (417,130) (208,253)
Households Receiving TANF/FAP§ 78,619 2,753 75,866 38,516Households Receiving Safety Net 16,343 1,166 15,177 9,017Households Receiving SSI 192,515 26,623 165,892 68,484Households Receiving Other Public Assistance 94,120 7,631 86,489 36,239
Households Receiving Rent SubsidyHouseholds Receiving Section 8 Certif./Voucher - - 114,023 58,712Households Receiving Shelter Allowance - - 48,244 23,614Households Receiving SCRIE! - - 23,581 15,541Households Receiving Jiggets - - 4,784 3,836Households Receiving EIHP† - - 1,856 1,280Households Receiving a Homeless Assistance Subsidy - - 3,728 2,543Households Receiving Another Federal Housing Subsidy - - 16,411 2,767Households Receiving Another State/City Housing Subsidy - - 48,833 22,953
§Temporary Assistance for Needy Families/Family Assistance Program; !Senior Citizens Rent Increase Exemption;†Employee Incentive Housing Program
@ All households, including owners and renters
122 • Appendices

Appendix D: 2008 Housing and Vacancy Survey, Summary Tables
Rent Stabilized Units Rent Mitchell- Public Other OtherPre-1947 Post-1946 Controlled Lama Housing Regulated* Rentals**
2007 Total Household Income56,726 24,434 4,156 5,849 31,719 49,371º Loss, no income or<$500056,589 19,342 4,757 7,949 44,032 51,040º $5000-$999996,156 41,822 8,240 11,236 39,608 78,495º $10,000-$19,99990,309 35,603 6,041 10,837 23,044 78,844º $20,000-$29,99973,709 31,736 3,793 4,867 18,065 83,230º $30,000-$39,99967,391 30,172 1,883 5,260 9,362 79,140º $40,000-$49,99953,193 21,682 3,186 2,485 4,732 65,938º $50,000-$59,99946,351 19,113 1,659 2,364 4,683 49,950º $60,000-$69,99935,845 16,387 1,078 1,706 2,416 46,238º $70,000-$79,99925,985 13,024 767 1,587 3,027 39,270º $80,000-$89,99916,113 8,413 1,138 1,100 783 24,059º $90,000-$99,99936,076 17,723 932 1,218 1,764 54,484º $100,000-$124,99917,294 7,860 917 1,025 574 25,747º $125,000-$149,99928,817 13,350 1,355 1,498 0 72,244º $150,000+
$51,672 $53,288 $55,445 $61,719 $21,189 $71,610º Mean$35,000 $38,000 $24,000 $24,036 $12,920 $46,000º Median
Contract Rent to Income Ratio53,239 18,565 4,865 4,318 15,407 42,140º <10%155,125 69,933 7,326 9,986 40,387 163,547º 10%-19%136,080 56,143 6,013 9,199 42,819 176,679º 20%-29%77,187 35,263 3,679 8,746 27,201 103,740º 30%-39%56,680 22,757 3,746 3,861 7,927 68,684º 40%-49%38,326 16,453 1,962 4,158 6,111 39,348º 50%-59%25,706 13,270 1,828 2,416 5,851 32,032º 60%-69%113,053 47,217 7,285 13,027 19,459 118,820º 70%+45,158 21,060 3,197 3,267 18,647 53,059º (Not Computed)
38.9% 39.1% 40.4% 44.5% 34.0% 39.1%º Mean28.2% 28.9% 30.0% 33.0% 27.1% 29.2%º Median
Households in Poverty159,591 55,243 10,276 18,763 93,500 139,061º Households Below 100% of Poverty Level540,963 245,418 29,625 40,216 90,310 658,989º Households at or Above 100% of Poverty Level
200,365 74,488 13,395 24,210 110,376 171,826º Households Below 125% of Poverty Level500,189 226,173 26,506 34,769 73,433 626,223º Households at or Above 125% of Poverty Level
99,319 27,376 4,115 13,125 70,797 22,988 51,096 Households Receiving Public Assistance¥459,924 206,342 27,619 33,995 89,720 32,896 525,508 Households Not Receiving Public Assistance(141,311) (66,942) (8,167) (11,858) (23,292) (6,224) (159,336) (Do Not Know/Not Reported)
31,637 6,879 672 2,440 18,062 3,548 12,628 Households Receiving TANF/FAP§7,439 1,578 0 779 2,383 296 2,702 Households Receiving Safety Net52,854 15,630 3,098 8,501 46,639 14,129 25,041 Households Receiving SSI27,916 8,323 770 4,038 14,811 9,275 21,356 Households Receiving Other Public Assistance
Households Receiving Rent Subsidy43,846 14,866 436 10,189 5,627 15,195 23,864 Households Receiving Section 8 Certif./Voucher19,901 3,713 450 924 10,106 2,332 10,818 Households Receiving Shelter Allowance9,346 6,195 2,834 2,063 785 1,802 556 Households Receiving SCRIE!3,747 89 - - 193 - 755 Households Receiving Jiggets1,280 - - 199 206 - 171 Households Receiving EIHP†2,370 173 - 149 - - 1,036 Households Receiving a Homeless Assistance Subsidy1,946 821 - 3,451 4,008 3,742 2,443 Households Receiving Another Federal Housing Subsidy16,722 6,231 1,108 3,480 6,112 2,349 12,831 Households Receiving Another State/City Housing Subsidy
º Separate household income, contract rent-to-income ratios, and poverty figures cannot be run for “Other Regulated” and “Other Rentals” households. Thehouseholds receiving assistance for these two categories are reported together.
¥ Because households can receive more than one type of public assistance, the sum of the households receiving each category of assistance(TANF, Safety Net, etc.) exceed the total households receiving public assistance.
Housing NYC: Rents, Markets and Trends 2009 • 123

Appendix D: 2008 Housing and Vacancy Survey, Summary Tables
D.2 Economic Characteristics (Continued)
Owner RenterAll Households@ Households Households Stabilized
2007 Total Household IncomeLoss, no income or<$5000 7.3% 5.4% 8.3% 8.1%$5000-$9999 6.6% 2.2% 8.8% 7.6%$10,000-$19,999 11.3% 7.2% 13.2% 13.8%$20,000-$29,999 10.3% 7.4% 11.8% 12.6%$30,000-$39,999 9.1% 6.5% 10.3% 10.5%$40,000-$49,999 8.2% 6.1% 9.3% 9.7%$50,000-$59,999 7.4% 7.6% 7.3% 7.5%$60,000-$69,999 6.3% 6.9% 6.0% 6.5%$70,000-$79,999 5.2% 5.7% 5.0% 5.2%$80,000-$89,999 4.6% 5.9% 4.0% 3.9%$90,000-$99,999 3.2% 4.7% 2.5% 2.4%$100,000-$124,999 7.1% 10.6% 5.4% 5.4%$125,000-$149,999 4.1% 7.1% 2.6% 2.5%$150,000+ 9.3% 16.7% 5.6% 4.2%
Mean - - - -Median - - - -
Contract Rent to Income Ratio<10% - - 7.1% 7.7%10%-19% - - 23.0% 24.1%20%-29% - - 22.0% 20.6%30%-39% - - 13.2% 12.0%40%-49% - - 8.4% 8.5%50%-59% - - 5.5% 5.9%60%-69% - - 4.2% 4.2%70%+ - - 16.5% 17.1%(Not Computed) - - - -
Mean - - - -Median - - - -
Households in PovertyHouseholds Below 100% of Poverty Level 18.5% 9.5% 22.9% 21.5%Households at or Above 100% of Poverty Level 81.5% 90.5% 77.1% 78.5%
Households Below 125% of Poverty Level 23.3% 12.5% 28.6% 27.5%Households at or Above 125% of Poverty Level 76.7% 87.5% 71.4% 72.5%
Households Receiving Public Assistance¥ 13.1% 4.3% 17.3% 16.0%Households Not Receiving Public Assistance 86.9% 95.7% 82.7% 84.0%(Not Reported) - - - -
Households Receiving TANF/FAP§ 3.2% 0.3% 4.5% 4.8%Households Receiving Safety Net 0.7% 0.1% 0.9% 1.1%Households Receiving SSI 7.7% 3.3% 9.9% 8.6%Households Receiving Other Public Assistance 3.8% 0.9% 5.3% 4.6%
Households Receiving Rent SubsidyHouseholds Receiving Section 8 Certif./Voucher - - 7.5% 8.1%Households Receiving Shelter Allowance - - 3.2% 3.3%Households Receiving SCRIE! - - 8.1% 11.3%Households Receiving Jiggets - - 0.3% 0.5%Households Receiving EIHP† - - 0.1% 0.2%Households Receiving a Homeless Assistance Subsidy - - 0.2% 0.4%Households Receiving Another Federal Housing Subsidy - - 1.1% 0.4%Households Receiving Another State/City Housing Subsidy - - 3.2% 3.2%
§Temporary Assistance for Needy Families/Family Assistance Program; !Senior Citizens Rent Increase Exemption;†Employee Incentive Housing Program
@ All households, including owners and renters
124 • Appendices

Appendix D: 2008 Housing and Vacancy Survey, Summary Tables
Rent Stabilized Units Rent Mitchell- Public Other OtherPre-1947 Post-1946 Controlled Lama Housing Regulated* Rentals**
2007 Total Household Income8.1% 8.1% 10.4% 9.9% 17.3% 6.2%º Loss, no income or<$50008.1% 6.4% 11.9% 13.5% 24.0% 6.4%º $5000-$999913.7% 13.9% 20.7% 19.1% 21.5% 9.8%º $10,000-$19,99912.9% 11.8% 15.1% 18.4% 12.5% 9.9%º $20,000-$29,99910.5% 10.6% 9.5% 8.3% 9.8% 10.4%º $30,000-$39,9999.6% 10.0% 4.7% 8.9% 5.1% 9.9%º $40,000-$49,9997.6% 7.2% 8.0% 4.2% 2.6% 8.3%º $50,000-$59,9996.6% 6.4% 4.2% 4.0% 2.5% 6.3%º $60,000-$69,9995.1% 5.5% 2.7% 2.9% 1.3% 5.8%º $70,000-$79,9993.7% 4.3% 1.9% 2.7% 1.6% 4.9%º $80,000-$89,9992.3% 2.8% 2.9% 1.9% 0.4% 3.0%º $90,000-$99,9995.1% 5.9% 2.3% 2.1% 1.0% 6.8%º $100,000-$124,9992.5% 2.6% 2.3% 1.7% 0.3% 3.2%º $125,000-$149,9994.1% 4.4% 3.4% 2.5% 0.0% 9.1%º $150,000+
- - - - - - Mean- - - - - - Median
Contract Rent to Income Ratio8.1% 6.6% 13.3% 7.8% 9.3% 5.7%º <10%23.7% 25.0% 20.0% 17.9% 24.5% 22.0%º 10%-19%20.8% 20.1% 16.4% 16.5% 25.9% 23.7%º 20%-29%11.8% 12.6% 10.0% 15.7% 16.5% 13.9%º 30%-39%8.6% 8.1% 10.2% 6.9% 4.8% 9.2%º 40%-49%5.8% 5.9% 5.3% 7.5% 3.7% 5.3%º 50%-59%3.9% 4.7% 5.0% 4.3% 3.5% 4.3%º 60%-69%17.2% 16.9% 19.8% 23.4% 11.8% 15.9%º 70%+
- - - - - - (Not Computed)
- - - - - - Mean- - - - - - Median
Households in Poverty22.8% 18.4% 25.8% 31.8% 50.9% 17.4%º Households Below 100% of Poverty Level77.2% 81.6% 74.2% 68.2% 49.1% 82.6%º Households at or Above 100% of Poverty Level
28.6% 24.8% 33.6% 41.0% 60.0% 21.5%º Households Below 125% of Poverty Level71.4% 75.2% 66.4% 59.0% 40.0% 78.5%º Households at or Above 125% of Poverty Level
17.8% 11.7% 13.0% 27.9% 44.1% 41.1% 8.9% Households Receiving Public Assistance¥82.2% 88.3% 87.0% 72.1% 55.9% 58.9% 91.1% Households Not Receiving Public Assistance
- - - - - - - (Not Reported)
5.6% 2.9% 2.1% 5.2% 11.3% 6.4% 2.2% Households Receiving TANF/FAP§1.3% 0.7% 0.0% 1.7% 1.5% 0.5% 0.5% Households Receiving Safety Net9.4% 6.6% 9.8% 18.1% 29.2% 25.2% 4.3% Households Receiving SSI5.0% 3.6% 2.5% 8.8% 9.5% 16.8% 3.7% Households Receiving Other Public Assistance
Households Receiving Rent Subsidy8.6% 6.9% 1.5% 24.3% 4.0% 31.7% 4.5% Households Receiving Section 8 Certif./Voucher3.9% 1.7% 1.5% 2.2% 7.2% 4.8% 2.0% Households Receiving Shelter Allowance11.5% 11.0% 13.5% 12.7% 1.9% 7.9% 1.0% Households Receiving SCRIE!0.7% 0.0% - - 0.1% - 0.1% Households Receiving Jiggets0.3% - - 0.5% 0.1% - 0.0% Households Receiving EIHP†0.5% 0.1% - 0.4% - - 0.2% Households Receiving a Homeless Assistance Subsid0.4% 0.4% 0.0% 8.3% 2.9% 7.8% 0.5% Households Receiving Another Federal Housing Subsidy3.3% 2.9% 3.7% 8.5% 4.4% 4.9% 2.4% Households Receiving Another State/City Housing Subsidy
º Separate household income, contract rent-to-income ratios, and poverty figures cannot be run for “Other Regulated” and “Other Rentals” households. Thehouseholds receiving assistance for these two categories are reported together.
¥ Because households can receive more than one type of public assistance, the sum of the households receiving each category of assistance(TANF, Safety Net, etc.) exceed the total households receiving public assistance.
Housing NYC: Rents, Markets and Trends 2009 • 125

Appendix D: 2008 Housing and Vacancy Survey, Summary Tables
Owner RenterAll Households@ Households Households Stabilized
Year Moved Into Current Dwelling2006-2008 739,215 116,227 622,988 258,8172003-2005 586,834 168,206 418,628 185,9461999-2002 478,740 156,249 322,491 159,7481996-1998 252,084 98,947 153,137 81,8891993-1995 180,477 72,879 107,598 63,6371990-1992 140,600 59,009 81,591 48,5441987-1989 125,325 61,191 64,134 34,0901984-1986 85,368 42,910 42,458 23,5261981-1983 81,588 33,113 48,475 27,0741971-1980 251,384 109,680 141,704 88,289Prior to 1971 179,684 100,933 78,751 29,657
Household Composition
Married Couples 1,199,032 545,292 653,740 313,381Children <18 Years of Age 418,253 174,703 243,550 116,022w/o Children <18 Years of Age 174,812 95,998 78,814 39,798Other Household Members 142,764 68,550 74,214 31,742w/o Other Household Members 463,203 206,041 257,162 125,819(Not Reported) - - - -
Female Householder 1,175,734 300,217 875,517 416,471Children <18 Years of Age 171,187 18,682 152,505 66,732w/o Children <18 Years of Age 274,214 80,671 193,543 89,632Other Household Members 132,120 26,860 105,260 45,299w/o Other Household Members 598,213 174,004 424,209 214,808(Not Reported) - - - -
Male Householder 726,531 173,836 552,695 271,361Children <18 Years of Age 18,577 3,378 15,199 6,746w/o Children <18 Years of Age 215,104 53,359 161,745 70,520Other Household Members 37,225 11,454 25,771 13,031w/o Other Household Members 455,625 105,645 349,980 181,064(Not Reported) - - - -
Race of Householder
White, non-Hispanic 1,340,085 572,327 767,758 361,326Black, non-Hispanic 695,800 188,684 507,116 224,542Puerto Rican 274,004 42,553 231,451 104,150Other Spanish/Hispanic 449,198 80,595 368,603 218,400Asian/Pacific Islander 328,017 129,870 198,147 88,991American/Aleut/Eskimo 6,987 3,108 3,879 1,401Two or more races 7,206 2,208 4,998 2,405(Not Reported) - - - -
Age of Householder
Under 25 years 111,056 10,749 100,307 42,08825-34 604,313 103,917 500,396 226,87735-44 706,439 205,929 500,510 239,42445-54 645,946 245,956 399,990 206,03755-61 341,423 147,598 193,825 104,12862-64 118,289 53,814 64,475 35,08065-74 306,661 132,994 173,667 83,80975-84 193,708 84,754 108,954 48,69585 or more years 73,464 33,634 39,830 15,077(Not Reported) - - - -
Mean 48 53 46 46Median 46 52 43 44
@ All households, including owners and renters.
D.3 Demographic Characteristics
126 • Appendices

Appendix D: 2008 Housing and Vacancy Survey, Summary Tables
Rent Stabilized Units Rent Mitchell- Public Other OtherPre-1947 Post-1946 Controlled Lama Housing Regulated* Rentals**
Year Moved Into Current Dwelling181,000 77,817 2,192 8,709 27,017 8,162 318,091 2006-2008129,834 56,112 2,986 8,626 25,685 11,029 184,356 2003-2005112,086 47,662 1,968 9,584 27,516 12,051 111,624 1999-200259,777 22,112 1,643 6,462 15,583 7,493 40,067 1996-199947,917 15,720 906 4,697 10,818 5,124 22,416 1993-199535,177 13,367 - 3,639 9,967 3,370 16,071 1990-199224,739 9,351 798 2,413 10,924 3,950 11,959 1987-198918,080 5,446 203 1,588 9,881 2,600 4,660 1984-198619,146 7,928 788 3,183 7,569 3,950 5,911 1981-198359,410 28,879 4,634 8,547 22,575 3,270 14,389 1971-198013,390 16,267 23,783 1,531 16,274 1,109 6,397 Prior to 1971
Household Composition
211,785 101,596 9,756 15,116 33,492 11,864 270,131 Married Couples81,147 34,875 2,228 3,975 10,016 3,616 107,693 Children <18 Years of Age27,202 12,596 1,576 3,548 5,595 1,387 26,910 w/o Children <18 Years of Age23,024 8,718 464 1,489 5,177 297 35,045 Other Household Members80,412 45,407 5,488 6,104 12,704 6,564 100,483 w/o Other Household Members
- - - - - - - (Not Reported)
292,857 123,614 16,849 32,975 118,933 35,891 254,398 Female Householder50,600 16,132 986 5,741 31,589 5,169 42,288 Children <18 Years of Age66,177 23,455 2,420 3,379 19,916 4,713 73,483 w/o Children <18 Years of Age33,377 11,922 366 3,829 17,584 3,906 34,276 Other Household Members142,703 72,105 13,077 20,026 49,844 22,103 104,351 w/o Other Household Members
- - - - - - - (Not Reported)
195,911 75,450 13,297 10,887 31,385 14,353 211,412 Male Householder4,819 1,927 0 812 1,686 239 5,716 Children <18 Years of Age53,933 16,587 2,596 1,730 4,520 2,292 80,087 w/o Children <18 Years of Age9,439 3,592 0 215 2,901 281 9,343 Other Household Members
127,720 53,344 10,701 8,130 22,278 11,541 116,266 w/o Other Household Members- - - - - - - (Not Reported)
Race of Householder
237,107 124,219 23,034 19,207 13,786 11,810 338,595 White, non-Hispanic157,834 66,708 5,748 23,585 86,572 15,758 150,911 Black, non-Hispanic79,691 24,459 3,800 6,581 51,222 16,869 48,829 Puerto Rican164,672 53,728 4,987 4,864 25,990 11,869 102,493 Other Hispanic58,995 29,996 2,170 4,495 5,516 5,793 91,182 Asian/Pacific Islander
767 634 546 9 1,923 American/Aleut/Eskimo1,489 916 162 246 177 0 2,008 Two or more races
- - - - - - - (Not Reported)
Age of Householder
31,743 10,345 162 1,596 5,612 1,828 49,021 Under 25 years172,354 54,523 2,819 8,555 23,519 7,038 231,588 25-34168,988 70,436 4,096 9,830 37,681 8,581 200,898 35-44147,310 58,727 3,656 11,132 40,598 9,757 128,810 45-5471,998 32,130 2,777 6,010 22,890 5,454 52,566 55-6124,251 10,829 2,646 3,025 7,482 2,493 13,749 62-6452,305 31,504 9,714 9,527 24,922 10,536 35,159 65-7425,705 22,990 8,874 6,403 16,276 12,417 16,289 75-845,901 9,176 5,157 2,901 4,829 4,005 7,861 85 or more years
- - - - - - - (Not Reported)
45 49 65 54 52 58 41 Mean43 46 68 52 50 59 38 Median
* Other Regulated Rentals encompass In Rem units, as well as those regulated by HUD, Article 4 or 5, and the New York City Loft Board.** Other Rentals encompass dwellings which have never been regulated, units which have been deregulated (including those in buildings with
fewer than 6 apartments) and unregulated rentals in cooperatives or condominiums.
Housing NYC: Rents, Markets and Trends 2009 • 127

Appendix D: 2008 Housing and Vacancy Survey, Summary Tables
Owner RenterAll Households@ Households Households Stabilized
Year Moved Into Current Dwelling2006-2008 23.8% 11.4% 29.9% 25.9%2003-2005 18.9% 16.5% 20.1% 18.6%1999-2002 15.4% 15.3% 15.5% 16.0%1996-1998 8.1% 9.7% 7.4% 8.2%1993-1995 5.8% 7.1% 5.2% 6.4%1990-1992 4.5% 5.8% 3.9% 4.8%1987-1989 4.0% 6.0% 3.1% 3.4%1984-1986 2.8% 4.2% 2.0% 2.3%1981-1983 2.6% 3.2% 2.3% 2.7%1971-1980 8.1% 10.8% 6.8% 8.8%Prior to 1971 5.8% 9.9% 3.8% 3.0%
Household Composition
Married Couples 38.7% 53.5% 31.4% 31.3%Children <18 Years of Age 13.5% 17.1% 11.7% 11.6%w/o Children <18 Years of Age 5.6% 9.4% 3.8% 4.0%Other Household Members 4.6% 6.7% 3.6% 3.2%w/o Other Household Members 14.9% 20.2% 12.4% 12.6%(Not Reported) - - - -
Female Householder 37.9% 29.5% 42.1% 41.6%Children <18 Years of Age 5.5% 1.8% 7.3% 6.7%w/o Children <18 Years of Age 8.8% 7.9% 9.3% 9.0%Other Household Members 4.3% 2.6% 5.1% 4.5%w/o Other Household Members 19.3% 17.1% 20.4% 21.5%(Not Reported) - - - -
Male Householder 23.4% 17.1% 26.5% 27.1%Children <18 Years of Age 0.6% 0.3% 0.7% 0.7%w/o Children <18 Years of Age 6.9% 5.2% 7.8% 7.0%Other Household Members 1.2% 1.1% 1.2% 1.3%w/o Other Household Members 14.7% 10.4% 16.8% 18.1%(Not Reported) - - - -
Race of Householder
White, non-Hispanic 43.2% 56.1% 36.9% 36.1%Black, non-Hispanic 22.4% 18.5% 24.4% 22.4%Puerto Rican 8.8% 4.2% 11.1% 10.4%Other Hispanic 14.5% 7.9% 17.7% 21.8%Asian/Pacific Islander 10.6% 12.7% 9.5% 8.9%American/Aleut/Eskimo 0.2% 0.3% 0.2% 0.1%2 or more races 0.2% 0.2% 0.2% 0.2%(Not Reported) - - - -
Age of Householder
Under 25 years 3.6% 1.1% 4.8% 4.2%25-34 19.5% 10.2% 24.0% 22.7%35-44 22.8% 20.2% 24.0% 23.9%45-54 20.8% 24.1% 19.2% 20.6%55-61 11.0% 14.5% 9.3% 10.4%62-64 3.8% 5.3% 3.1% 3.5%65-74 9.9% 13.0% 8.3% 8.4%75-84 6.2% 8.3% 5.2% 4.9%85 or more years 2.4% 3.3% 1.9% 1.5%(Not Reported) - - - -
Mean - - - -Median - - - -
@ All households, including owners and renters. Totals may not add to 100% due to rounding. Totals may not add to 100% due to rounding.
D.3 Demographic Characteristics (Continued)
128 • Appendices

Appendix D: 2008 Housing and Vacancy Survey, Summary Tables
Rent Stabilized Units Rent Mitchell- Public Other OtherPre-1947 Post-1946 Controlled Lama Housing Regulated* Rentals**
Year Moved Into Current Dwelling25.8% 25.9% 5.5% 14.8% 14.7% 13.1% 43.2% 2006-200818.5% 18.7% 7.5% 14.6% 14.0% 17.8% 25.1% 2003-200516.0% 15.9% 4.9% 16.2% 15.0% 19.4% 15.2% 1999-20028.5% 7.4% 4.1% 11.0% 8.5% 12.1% 5.4% 1996-19986.8% 5.2% 2.3% 8.0% 5.9% 8.3% 3.0% 1993-19955.0% 4.4% 0.0% 6.2% 5.4% 5.4% 2.2% 1990-19923.5% 3.1% 2.0% 4.1% 5.9% 6.4% 1.6% 1987-19892.6% 1.8% 0.5% 2.7% 5.4% 4.2% 0.6% 1984-19862.7% 2.6% 2.0% 5.4% 4.1% 6.4% 0.8% 1981-19838.5% 9.6% 11.6% 14.5% 12.3% 5.3% 2.0% 1971-19801.9% 5.4% 59.6% 2.6% 8.9% 1.8% 0.9% Prior to 1971
Household Composition
30.2% 33.8% 24.4% 25.6% 18.2% 19.1% 36.7%% Married Couples11.6% 11.6% 5.6% 6.7% 5.4% 5.8% 14.6% Children <18 Years of Age3.9% 4.2% 3.9% 6.0% 3.0% 2.2% 3.7% w/o Children <18 Years of Age3.3% 2.9% 1.2% 2.5% 2.8% 0.5% 4.8% Other Household Members11.5% 15.1% 13.8% 10.3% 6.9% 10.6% 13.7% w/o Other Household Members
- - - - - - - (Not Reported)
41.8% 41.1% 42.2% 55.9% 64.7% 57.8% 34.6% Female Householder7.2% 5.4% 2.5% 9.7% 17.2% 8.3% 5.7% Children <18 Years of Age9.4% 7.8% 6.1% 5.7% 10.8% 7.6% 10.0% w/o Children <18 Years of Age4.8% 4.0% 0.9% 6.5% 9.6% 6.3% 4.7% Other Household Members20.4% 24.0% 32.8% 34.0% 27.1% 35.6% 14.2% w/o Other Household Members
- - - - - - - (Not Reported)
28.0% 25.1% 33.3% 18.5% 17.1% 23.1% 28.7% Male Householder0.7% 0.6% 0.0% 1.4% 0.9% 0.4% 0.8% Children <18 Years of Age7.7% 5.5% 6.5% 2.9% 2.5% 3.7% 10.9% w/o Children <18 Years of Age1.3% 1.2% 0.0% 0.4% 1.6% 0.5% 1.3% Other Household Members18.2% 17.7% 26.8% 13.8% 12.1% 18.6% 15.8% w/o Other Household Members
- - - - - - - (Not Reported)
Race of Householder
33.8% 41.3% 57.7% 32.6% 7.5% 19.0% 46.0% White, non-Hispanic22.5% 22.2% 14.4% 40.0% 47.1% 25.4% 20.5% Black, non-Hispanic11.4% 8.1% 9.5% 11.2% 27.9% 27.2% 6.6% Puerto Rican23.5% 17.9% 12.5% 8.2% 14.1% 19.1% 13.9% Other Hispanic8.4% 10.0% 5.4% 7.6% 3.0% 9.3% 12.4% Asian/Pacific Islander0.1% 0.2% 0.0% 0.0% 0.3% 0.0% 0.3% American/Aleut/Eskimo0.2% 0.3% 0.4% 0.4% 0.1% 0.0% 0.3% 2 or more races
- - - - - - - (Not Reported)
Age of Householder
4.5% 3.4% 0.4% 2.7% 3.1% 2.9% 6.7% Under 25 years24.6% 18.1% 7.1% 14.5% 12.8% 11.3% 31.5% 25-3424.1% 23.4% 10.3% 16.7% 20.5% 13.8% 27.3% 35-4421.0% 19.5% 9.2% 18.9% 22.1% 15.7% 17.5% 45-5410.3% 10.7% 7.0% 10.2% 12.5% 8.8% 7.1% 55-613.5% 3.6% 6.6% 5.1% 4.1% 4.0% 1.9% 62-647.5% 10.5% 24.3% 16.2% 13.6% 17.0% 4.8% 65-743.7% 7.6% 22.2% 10.9% 8.9% 20.0% 2.2% 75-840.8% 3.1% 12.9% 4.9% 2.6% 6.4% 1.1% 85 or more years
- - - - - - - (Not Reported)
- - - - - - - Mean- - - - - - - Median
* Other Regulated Rentals encompass In Rem units, as well as those regulated by HUD, Article 4 or 5, and the New York City Loft Board.** Other Rentals encompass dwellings which have never been regulated, units which have been deregulated (including those in buildings
with fewer than 6 apartments) and unregulated rentals in cooperatives or condominiums.
Housing NYC: Rents, Markets and Trends 2009 • 129

Appendix D: 2008 Housing and Vacancy Survey, Summary Tables
D.4 Housing / Neighborhood Quality Characteristics
All Units@ Owner Units Renter Units Stabilized
Maintenance Quality(Units Experiencing:)
Additional Heating Required 320,130 57,271 262,859 136,146Additional Heating Not Required 1,838,033 647,178 1,190,855 550,794(Not Reported) (943,135) (314,896) (628,239) (314,276)
Heating Breakdowns 248,084 36,413 211,671 120,048No Breakdowns 1,893,655 664,398 1,229,257 562,691(Not Reported) (959,559) (318,534) (641,025) (318,477)
Broken Plaster/Peeling Paint 266,313 38,726 227,587 131,488No Broken Plaster/Peeling Paint 1,883,773 663,904 1,219,869 552,760(Not Reported) (951,211) (316,715) (634,496) (316,967)
Cracked Interior Walls or Ceilings 248,819 27,067 221,752 132,764No Cracked Interior Walls or Ceilings 1,911,501 676,866 1,234,635 556,322(Not Reported) (940,976) (315,411) (625,565) (312,130)
Holes in Floor 129,765 9,550 120,215 76,998No Holes in Floor 2,018,582 691,990 1,326,592 606,502(Not Reported) (952,951) (317,805) (635,146) (317,716)
Rodent Infestation 471,125 67,825 403,300 239,888No Infestation 1,690,770 637,201 1,053,569 448,908(Not Reported) (939,406) (314,319) (625,087) (312,420)
Cockroach Infestation 607,138 68,894 538,244 303,384No Infestation 1,520,349 627,401 892,948 373,196(Not Reported) (973,811) (323,050) (650,761) (324,635)
Toilet Breakdown 258,047 63,851 194,196 98,946No Toilet Breakdown/No Facilities 1,887,958 635,356 1,252,602 587,868(Not Reported) (955,292) (320,138) (635,154) (314,399)
Water Leakage Inside Unit 361,281 78,627 282,654 166,073No Water Leakage 1,797,411 624,804 1,172,607 522,591(Not Reported) (942,609) (315,915) (626,694) (312,552)
Units in Buildings w. No Maintenance Defects 1,079,182 452,186 626,996 250,101Units in Buildings w. 1 Maintenance Defect 477,085 149,266 327,819 158,490Units in Buildings w. 2 Maintenance Defects 223,126 51,593 171,533 91,307Units in Buildings w. 3 Maintenance Defects 132,086 16,796 115,290 63,696Units in Buildings w. 4 Maintenance Defects 70,633 4,530 66,103 44,821Units in Buildings w. 5+ Maintenance Defects 61,623 2,136 59,487 36,742(Not Reported) (1,057,562) (342,839) (714,723) (356,058)
Condition of Neighboring Buildings
Excellent 485,596 248,965 236,631 96,234Good 1,192,236 384,888 807,348 373,532Fair 396,041 64,021 332,020 178,255Poor Quality 83,001 5,543 77,458 39,063(Not Reported) (944,423) (315,928) (628,495) (314,130)
Boarded Up/Broken Windows in Neighborhood 134,696 32,300 102,396 51,096No Boarded Up/Broken Windows in Neighborhood 2,854,400 953,439 1,900,961 907,140(Not Reported) (112,202) (33,606) (78,596) (42,979)
@ All housing units, including owners and renters.
130 • Appendices

Appendix D: 2008 Housing and Vacancy Survey, Summary Tables
Rent Stabilized Units Rent Mitchell- Public Other OtherPre-1947 Post-1946 Controlled Lama Housing Regulated* Rentals**
Maintenance Quality(Units Experiencing:)
98,607 37,539 3,949 7,343 32,994 9,460 72,967 Additional Heating Required383,601 167,193 25,117 34,061 104,146 39,268 437,469 Additional Heating Not Required
(218,347) (95,929) (10,835) (17,574) (46,669) (13,380) (225,505) (Not Reported)90,472 29,576 4,498 3,773 25,147 6,538 51,667 Heating Breakdowns388,126 174,565 24,524 36,782 110,602 40,916 453,742 No Breakdowns
(221,957) (96,520) (10,879) (18,423) (48,060) (14,654) (230,532) (Not Reported)101,691 29,797 6,880 5,441 30,261 5,309 48,208 Broken Plaster/Peeling Paint378,734 174,026 21,783 36,421 105,803 42,814 460,288 No Broken Plaster/Peeling Paint
(220,129) (96,838) (11,238) (17,116) (47,745) (13,985) (227,445) (Not Reported)110,891 21,873 6,138 4,737 28,488 6,393 43,232 Cracked Interior Walls or Ceilings373,087 183,235 23,467 37,087 108,321 42,371 467,067 No Cracked Interior Walls or Ceilings
(216,577) (95,553) (10,296) (17,154) (47,000) (13,344) (225,641) (Not Reported)67,839 9,159 3,353 1,538 9,747 3,451 25,128 Holes in Floor411,541 194,961 25,941 40,105 126,918 44,718 482,408 No Holes in Floor
(221,175) (96,541) (10,606) (17,335) (47,144) (13,940) (228,405) (Not Reported)189,365 50,523 9,115 10,458 42,202 17,733 83,904 Rodent Infestation294,215 154,693 20,336 31,367 95,010 30,873 427,075 No Infestation
(216,975) (95,445) (10,450) (17,154) (46,598) (13,503) (224,962) (Not Reported)224,455 78,929 10,446 15,029 84,419 18,685 106,281 Cockroach Infestation251,005 122,191 17,888 26,193 49,396 28,557 397,718 No Infestation(225,095) (99,540) (11,567) (17,757) (49,995) (14,866) (231,941) (Not Reported)71,397 27,549 3,103 7,268 25,080 7,634 52,165 Toilet Breakdown411,604 176,264 25,880 34,516 109,650 40,220 454,468 No Toilet Breakdown/No Facilities
(217,552) (96,847) (10,918) (17,195) (49,079) (14,254) (229,309) (Not Reported)129,829 36,244 7,017 5,823 29,210 9,572 64,959 Water Leakage Inside Unit353,661 168,930 22,235 36,019 107,315 39,188 445,259 No Water Leakage
(217,065) (95,487) (10,649) (17,137) (47,284) (13,349) (225,723) (Not Reported)
158,600 91,501 11,039 19,133 44,666 18,536 283,521 Units in Buildings w. No Maintenance Defects109,084 49,406 6,484 8,299 33,883 12,869 107,794 Units in Buildings w. 1 Maintenance Defect66,718 24,589 4,055 6,716 19,040 4,387 46,028 Units in Buildings w. 2 Maintenance Defects49,750 13,946 2,874 2,757 15,309 3,913 26,741 Units in Buildings w. 3 Maintenance Defects35,907 8,914 777 910 7,944 2,829 8,822 Units in Buildings w. 4 Maintenance Defects31,373 5,369 1,477 993 7,048 2,108 11,119 Units in Buildings w. 5+ Maintenance Defects
(249,122) (106,936) (13,194) (20,172) (55,918) (17,465) (251,916) (Not Reported)
Condition of Neighboring Buildings
58,009 38,225 5,672 8,995 4,957 6,904 113,869 Excellent254,585 118,947 15,833 21,544 64,144 26,110 306,185 Good137,551 40,704 6,096 9,515 48,779 11,756 77,619 Fair32,759 6,304 1,464 1,975 18,278 3,997 12,681 Poor Quality
(217,650) (96,480) (10,837) (16,949) (47,651) (13,342) (225,586) (Not Reported)
44,512 6,584 2,698 1,535 7,566 1,961 37,540 Boarded Up/Broken Windows in Neighborhood627,318 279,822 36,173 56,025 169,858 56,787 674,978 No Boarded Up/Broken Windows in Neighborhood(28,725) (14,254) (1,030) (1,418) (6,386) (3,360) (23,423) (Not Reported)
* Other Regulated Rentals encompass In Rem units, as well as those regulated by HUD, Article 4 or 5, and the New York City Loft Board.** Other Rentals encompass dwellings which have never been regulated, units which have been deregulated (including those in buildings with
fewer than 6 apartments) and unregulated rentals in cooperatives or condominiums.
Housing NYC: Rents, Markets and Trends 2009 • 131

Appendix D: 2008 Housing and Vacancy Survey, Summary Tables
D.4 Housing/Neighborhood Quality Characteristics (Continued)
All Dwellings@ Owner Units Rental Units Stabilized
Maintenance Quality(Units Experiencing:)
Additional Heating Required 14.8% 8.1% 18.1% 19.8%Additional Heating Not Required 85.2% 91.9% 81.9% 80.2%(Not Reported) - - - -
Heating Breakdowns 11.6% 5.2% 14.7% 17.6%No Breakdowns 88.4% 94.8% 85.3% 82.4%(Not Reported) - - - -
Broken Plaster/Peeling Paint 12.4% 5.5% 15.7% 19.2%No Broken Plaster/Peeling Paint 87.6% 94.5% 84.3% 80.8%(Not Reported) - - - -
Cracked Interior Walls or Ceilings 11.5% 3.8% 15.2% 19.3%No Cracked Interior Walls or Ceilings 88.5% 96.2% 84.8% 80.7%(Not Reported) - - - -
Holes in Floor 6.0% 1.4% 8.3% 11.3%No Holes in Floor 94.0% 98.6% 91.7% 88.7%(Not Reported) - - - -
Rodent Infestation 21.8% 9.6% 27.7% 34.8%No Infestation 78.2% 90.4% 72.3% 65.2%(Not Reported) - - - -
Cockroach Infestation 28.5% 9.9% 37.6% 44.8%No Infestation 71.5% 90.1% 62.4% 55.2%(Not Reported) - - - -
Toilet Breakdown 12.0% 9.1% 13.4% 14.4%No Toilet Breakdown 88.0% 90.9% 86.6% 85.6%(Not Reported) - - - -
Water Leakage Inside Unit 16.7% 11.2% 19.4% 24.1%No Water Leakage 83.3% 88.8% 80.6% 75.9%(Not Reported) - - - -
Units in Buildings w. No Maintenance Defects 52.8% 66.8% 45.9% 38.8%Units in Buildings w. 1 Maintenance Defect 23.3% 22.1% 24.0% 24.6%Units in Buildings w. 2 Maintenance Defects 10.9% 7.6% 12.5% 14.2%Units in Buildings w. 3 Maintenance Defects 6.5% 2.5% 8.4% 9.9%Units in Buildings w. 4 Maintenance Defects 3.5% 0.7% 4.8% 6.9%Units in Buildings w. 5+ Maintenance Defects 3.0% 0.3% 4.4% 5.7%(Not Reported) - - - -
Condition of Neighboring Buildings
Excellent 22.5% 35.4% 16.3% 14.0%Good 55.3% 54.7% 55.5% 54.4%Fair 18.4% 9.1% 22.8% 25.9%Poor Quality 3.8% 0.8% 5.3% 5.7%(Not Reported) - - - -
Boarded Up/Broken Windows in Neighborhood 4.5% 3.3% 5.1% 5.3%No Boarded Up/Broken Windows in Neighborhood 95.5% 96.7% 94.9% 94.7%(Not Reported) - - - -
@ All housing units, including owners and renters.
Totals may not add to 100% due to rounding.
132 • Appendices

Appendix D: 2008 Housing and Vacancy Survey, Summary Tables
Rent Stabilized Units Rent Mitchell- Public Other OtherPre-1947 Post-1946 Controlled Lama Housing Regulated* Rentals**
Maintenance Quality(Units Experiencing:)
20.4% 18.3% 13.6% 17.7% 24.1% 19.4% 14.3% Additional Heating Required79.6% 81.7% 86.4% 82.3% 75.9% 80.6% 85.7% Additional Heating Not Required- - - - - - - (Not Reported)18.9% 14.5% 15.5% 9.3% 18.5% 13.8% 10.2% Heating Breakdowns81.1% 85.5% 84.5% 90.7% 81.5% 86.2% 89.8% No Breakdowns- - - - - - - (Not Reported)21.2% 14.6% 24.0% 13.0% 22.2% 11.0% 9.5% Broken Plaster/Peeling Paint78.8% 85.4% 76.0% 87.0% 77.8% 89.0% 90.5% No Broken Plaster/Peeling Paint- - - - - - - (Not Reported)22.9% 10.7% 20.7% 11.3% 20.8% 13.1% 8.5% Cracked Interior Walls or Ceilings77.1% 89.3% 79.3% 88.7% 79.2% 86.9% 91.5% No Cracked Interior Walls or Ceilings- - - - - - - (Not Reported)14.2% 4.5% 11.4% 3.7% 7.1% 7.2% 5.0% Holes in Floor85.8% 95.5% 88.6% 96.3% 92.9% 92.8% 95.0% No Holes in Floor- - - - - - - (Not Reported)39.2% 24.6% 30.9% 25.0% 30.8% 36.5% 16.4% Rodent Infestation60.8% 75.4% 69.1% 75.0% 69.2% 63.5% 83.6% No Infestation- - - - - - - (Not Reported)47.2% 39.2% 36.9% 36.5% 63.1% 39.6% 21.1% Cockroach Infestation52.8% 60.8% 63.1% 63.5% 36.9% 60.4% 78.9% No Infestation- - - - - - - (Not Reported)14.8% 13.5% 10.7% 17.4% 18.6% 16.0% 10.3% Toilet Breakdown85.2% 86.5% 89.3% 82.6% 81.4% 84.0% 89.7% No Toilet Breakdown- - - - - - - (Not Reported)26.9% 17.7% 24.0% 13.9% 21.4% 19.6% 12.7% Water Leakage Inside Unit73.1% 82.3% 76.0% 86.1% 78.6% 80.4% 87.3% No Water Leakage- - - - - - - (Not Reported)
35.1% 47.2% 41.3% 49.3% 34.9% 41.5% 58.6% Units in Buildings w. No Maintenance Defects24.2% 25.5% 24.3% 21.4% 26.5% 28.8% 22.3% Units in Buildings w. 1 Maintenance Defect14.8% 12.7% 15.2% 17.3% 14.9% 9.8% 9.5% Units in Buildings w. 2 Maintenance Defects11.0% 7.2% 10.8% 7.1% 12.0% 8.8% 5.5% Units in Buildings w. 3 Maintenance Defects8.0% 4.6% 2.9% 2.3% 6.2% 6.3% 1.8% Units in Buildings w. 4 Maintenance Defects6.9% 2.8% 5.5% 2.6% 5.5% 4.7% 2.3% Units in Buildings w. 5+ Maintenance Defects- - - - - - - (Not Reported)
Condition of Neighboring Buildings
12.0% 18.7% 19.5% 21.4% 3.6% 14.2% 22.3% Excellent52.7% 58.3% 54.5% 51.3% 47.1% 53.5% 60.0% Good28.5% 19.9% 21.0% 22.6% 35.8% 24.1% 15.2% Fair6.8% 3.1% 5.0% 4.7% 13.4% 8.2% 2.5% Poor Quality- - - - - - - (Not Reported)
6.6% 2.3% 6.9% 2.7% 4.3% 3.3% 5.3% Boarded Up/Broken Windows in Neighborhood93.4% 97.7% 93.1% 97.3% 95.7% 96.7% 94.7% No Boarded Up/Broken Windows in Neighborhood- - - - - - - (Not Reported)
* Other Regulated Rentals encompass In Rem units, as well as those regulated by HUD, Article 4 or 5, and the New York City Loft Board.** Other Rentals encompass dwellings which have never been regulated, units which have been deregulated (including those in buildings with
fewer than 6 apartments) and unregulated rentals in cooperatives or condominiums.
Totals may not add to 100% due to rounding.
Housing NYC: Rents, Markets and Trends 2009 • 133
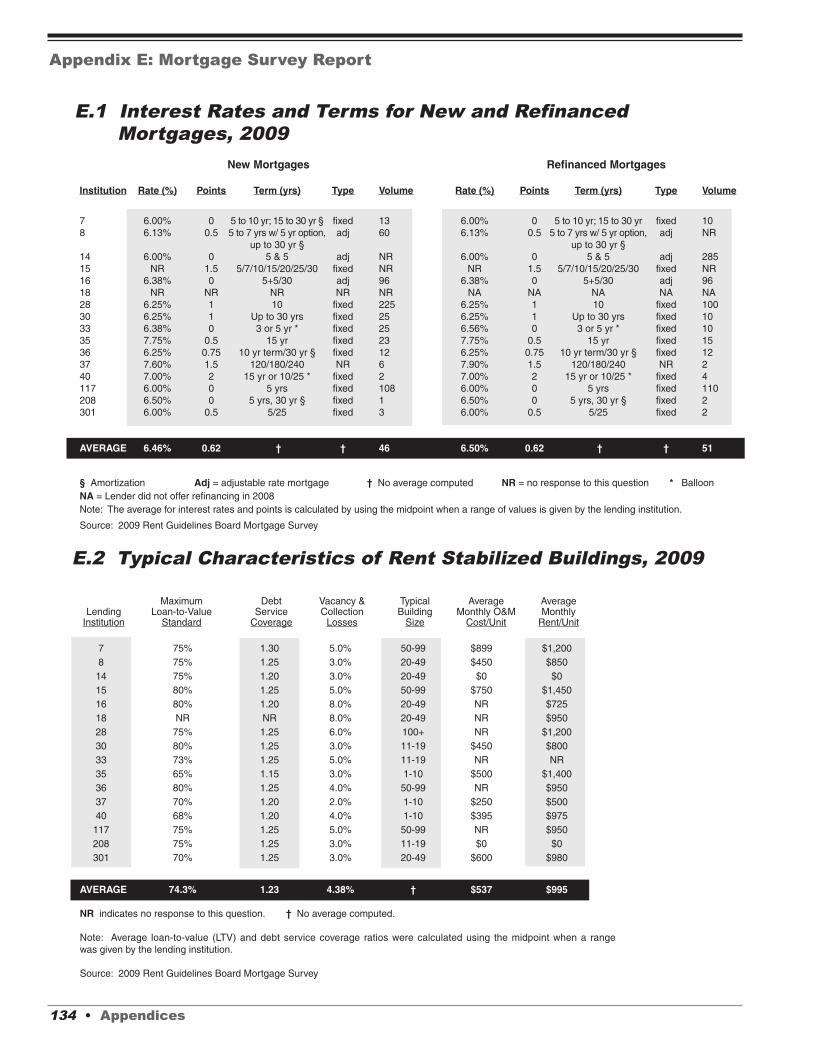
E.2 Typical Characteristics of Rent Stabilized Buildings, 2009
Appendix E: Mortgage Survey Report
E.1 Interest Rates and Terms for New and RefinancedMortgages, 2009
134 • Appendices
New Mortgages Refinanced Mortgages
Institution Rate (%) Points Term (yrs) Type Volume Rate (%) Points Term (yrs) Type Volume
7 6.00% 0 5 to 10 yr; 15 to 30 yr § fixed 13 6.00% 0 5 to 10 yr; 15 to 30 yr fixed 108 6.13% 0.5 5 to 7 yrs w/ 5 yr option, adj 60 6.13% 0.5 5 to 7 yrs w/ 5 yr option, adj NR
up to 30 yr § up to 30 yr §14 6.00% 0 5 & 5 adj NR 6.00% 0 5 & 5 adj 28515 NR 1.5 5/7/10/15/20/25/30 fixed NR NR 1.5 5/7/10/15/20/25/30 fixed NR16 6.38% 0 5+5/30 adj 96 6.38% 0 5+5/30 adj 9618 NR NR NR NR NR NA NA NA NA NA28 6.25% 1 10 fixed 225 6.25% 1 10 fixed 10030 6.25% 1 Up to 30 yrs fixed 25 6.25% 1 Up to 30 yrs fixed 1033 6.38% 0 3 or 5 yr * fixed 25 6.56% 0 3 or 5 yr * fixed 1035 7.75% 0.5 15 yr fixed 23 7.75% 0.5 15 yr fixed 1536 6.25% 0.75 10 yr term/30 yr § fixed 12 6.25% 0.75 10 yr term/30 yr § fixed 1237 7.60% 1.5 120/180/240 NR 6 7.90% 1.5 120/180/240 NR 240 7.00% 2 15 yr or 10/25 * fixed 2 7.00% 2 15 yr or 10/25 * fixed 4117 6.00% 0 5 yrs fixed 108 6.00% 0 5 yrs fixed 110208 6.50% 0 5 yrs, 30 yr § fixed 1 6.50% 0 5 yrs, 30 yr § fixed 2301 6.00% 0.5 5/25 fixed 3 6.00% 0.5 5/25 fixed 2
AVERAGE 6.46% 0.62 † † 46 6.50% 0.62 † † 51
§ Amortization Adj = adjustable rate mortgage † No average computed NR = no response to this question * BalloonNA = Lender did not offer refinancing in 2008Note: The average for interest rates and points is calculated by using the midpoint when a range of values is given by the lending institution.
Source: 2009 Rent Guidelines Board Mortgage Survey
Maximum Debt Vacancy & Typical Average AverageLending Loan-to-Value Service Collection Building Monthly O&M Monthly
Institution Standard Coverage Losses Size Cost/Unit Rent/Unit
7 75% 1.30 5.0% 50-99 $899 $1,2008 75% 1.25 3.0% 20-49 $450 $85014 75% 1.20 3.0% 20-49 $0 $015 80% 1.25 5.0% 50-99 $750 $1,45016 80% 1.20 8.0% 20-49 NR $72518 NR NR 8.0% 20-49 NR $95028 75% 1.25 6.0% 100+ NR $1,20030 80% 1.25 3.0% 11-19 $450 $80033 73% 1.25 5.0% 11-19 NR NR35 65% 1.15 3.0% 1-10 $500 $1,40036 80% 1.25 4.0% 50-99 NR $95037 70% 1.20 2.0% 1-10 $250 $50040 68% 1.20 4.0% 1-10 $395 $975117 75% 1.25 5.0% 50-99 NR $950208 75% 1.25 3.0% 11-19 $0 $0301 70% 1.25 3.0% 20-49 $600 $980
AVERAGE 74.3% 1.23 4.38% † $537 $995
NR indicates no response to this question. † No average computed.
Note: Average loan-to-value (LTV) and debt service coverage ratios were calculated using the midpoint when a rangewas given by the lending institution.
Source: 2009 Rent Guidelines Board Mortgage Survey

Appendix E: Mortgage Survey Report
Interest Rates Points Term Type
Lending Inst. 2009 2008 2009 2008 2009 2008 2009 2008
7 6.00% 6.00% 0.0 0.5 5 to 10 yr; 15 to 30 yr § 5 to 10 yrs; fixed fixed15 to 20 yrs §
8 6.13% 5.63% 0.5 0.5 5 to 7 yrs w/ 5 yr option, 5-15 yrs; adj adjup to 30 yr § 15-30 §
14 6.00% 5.63% 0.0 0.0 5 & 5 5 & 5 adj adj15 NR NR 1.5 0.5 5/7/10/15/20/25/30 5/7/10/15/20/25/30 fixed both16 6.38% 5.75% 0.0 0.0 5+5/30 5+5/30 adj adj18 NR 5.85% NR 0.0 NR 5 yr fixed/30 yr * NR fixed28 6.25% 5.75% 1.0 1.0 10 10 yrs fixed fixed30 6.25% 6.25% 1.0 1.0 Up to 30 yrs 30 yr fixed fixed33 6.38% 6.00% 0.0 0.0 3 or 5 yr * 5 fixed fixed35 7.75% 6.50% 0.5 0.5 15 yr 15 yrs fixed fixed36 6.25% 6.02% 0.8 1.0 10 yr term/30 yr § 10/9.5/30 fixed fixed37 7.60% 8.00% 1.5 1.0 120/180/240 120/180/240 NR fixed117 6.00% 6.00% 0.0 NR 5 yrs 5 fixed fixed208 6.50% NR 0.0 NR 5 yrs, 30 yr § NR fixed NR301 6.00% 6.00% 0.5 0.5 5/25 10 yr fixed fixed
AVERAGE 6.42% 6.11% 0.52 0.50 † † † †
NR indicates no response to this question. † No average computed § Amortization * Balloon
Adj = adjustable rate mortgage
Note: Averages for interest rates and points are calculated by using the midpoint when a range of values is given by the lending institution.
Source: 2008 and 2009 Rent Guidelines Board Mortgage Surveys
E.3 Interest Rates and Terms for New Financing,Longitudinal Study, 2008-2009
Interest Rates Points Term Type
Lending Inst. 2009 2008 2009 2008 2009 2008 2009 2008
7 6.00% 6.25% 0.0 0.0 5 to 10 yr; 5 to 10 yrs; fixed fixed15 to 30 yr 15 to 20 yrs §
8 6.13% 5.63% 0.5 0.5 5 to 7 yrs w/ 5 yr option, 5-15 yrs; adj adjup to 30 yr § 15-30 §
14 6.00% 5.63% 0.0 0.0 5 & 5 5 & 5 adj adj15 0.00% 0.00% 1.5 0.5 5/7/10/15/20/25/30 5/7/10/15/20/25/30 fixed both16 6.38% 5.75% 0.0 0.0 5+5/30 5+5/30 adj adj18 NA 5.85% NA 0.0 NA 5 yr fixed/30 yr * NA fixed28 6.25% 5.75% 1.0 1.0 10 10 years fixed fixed30 6.25% 6.25% 1.0 1.0 Up to 30 yrs 30 yr fixed fixed33 6.56% 6.00% 0.0 0.0 3 or 5 yr * 5 fixed fixed35 7.75% 6.50% 0.5 0.5 15 yr 15 yrs fixed fixed36 6.25% 6.02% 0.8 1.0 10 yr term/30 yr § 10/9.5/30 fixed fixed37 7.90% 7.75% 1.5 1.0 120/180/240 120/180/240 NR fixed117 6.00% 6.00% 0.0 NR 5 yrs 5 yrs fixed fixed208 6.50% 0.00% 0.0 NR 5 yrs, 30 yr § NR fixed NR301 6.00% 6.00% 0.5 0.5 5/25 10 yrs fixed fixed
AVERAGE 6.46% 6.11% 0.52 0.46 † † † †
NR indicates no response to this question. † No average computed § Amortization * BalloonNA = Lender did not offer refinancing in 2008 Adj = adjustable rate mortgage
Note: Averages for interest rates and points are calculated by using the midpoint when a range of values were given by the lending institution.
Source: 2008 and 2009 Rent Guidelines Board Mortgage Surveys
E.4 Interest Rates and Terms for Refinanced Loans,Longitudinal Study, 2008-2009
Housing NYC: Rents, Markets and Trends 2009 • 135

E.6 Retrospective of New York City’s Housing Market, 1982-2009
Appendix E: Mortgage Survey Report
136 • Appendices
Max Loan-to-Value Debt Service Coverage V&C LossesLending Inst. 2009 2008 2009 2008 2009 2008
7 75% 75% 1.30 1.25 5.0% 5.0%8 75% NR 1.25 NR 3.0% 2.0%14 75% 80% 1.20 1.15 3.0% 3.0%15 80% 80% 1.25 1.20 5.0% 5.0%16 80% 80% 1.20 1.20 8.0% 5.0%18 0% 75% 0.00 1.20 8.0% 5.0%28 75% 80% 1.25 1.20 6.0% 4.0%30 80% 80% 1.25 1.25 3.0% 5.0%33 73% 75% 1.25 1.25 5.0% 5.0%35 65% 65% 1.15 1.15 3.0% 4.0%36 80% 80% 1.25 1.15 4.0% 5.0%37 70% 70% 1.20 1.20 2.0% 2.0%117 75% 75% 1.25 1.20 5.0% 4.0%208 75% NR 1.25 NR 3.0% 0.0%301 70% 80% 1.25 1.15 3.0% 2.0%
AVERAGE 74.8% 76.5% 1.24 1.20 4.4% 4.0%
Note: Average loan-to-value and debt service coverage ratios are calculated using the midpoint when a range is given by the lending institution.
Source: 2008 and 2009 Rent Guidelines Board Mortgage Surveys
E.5 Lending Standards and Relinquished Rental Income,Longitudinal Study, 2008-2009
Permits for Permits forInterest Rates for New Housing Units in New Housing Units
Year New Mortgages NYC and northern suburbs in NYC only
1982 16.3% 11,598 b 7,6491983 13.0% 17,249 b 11,7951984 13.5% 15,961 11,5661985 12.9% 25,504 20,3321986 10.5% 15,298 9,7821987 10.2% 18,659 13,7641988 10.8% 13,486 9,8971989 12.0% 13,896 11,5461990 11.2% 9,076 6,8581991 10.7% 6,406 4,6991992 10.1% 5,694 3,8821993 9.2% 7,314 5,1731994 8.6% 6,553 4,0101995 10.1% 7,296 5,1351996 8.6% 11,457 8,6521997 8.8% 11,619 8,9871998 8.5% 13,532 10,3871999 7.8% 15,326 12,4212000 8.7% 18,077 15,0502001 8.4% 19,636 16,8562002 7.4% 21,423 18,5002003 6.2% 23,778 21,2182004 5.8% 27,695 25,2082005 5.5% 33,606 31,5992006 6.3% 32,609 30,9272007 6.3% 34,514 31,9022008 6.1%* 34,260 Ø 33,911 Ø2009 6.5% • •
b Prior to 1984, Bergen Co., NJ permit figures are included. Ø Figures are preliminary.
* The 2008 figure has been revised from the prior year due to the exclusion of one government lender
Notes: Interest rate data was collected in January-February and represents a 12-month average of the preceding year. Permit data is for theentire 12-month period of the shown year. The northern suburbs include Putnam, Rockland, and Westchester counties.
Sources: Rent Guidelines Board, Annual Mortgage Surveys; U.S. Bureau of the Census, Manufacturing & Construction Division,Residential Construction Branch.

Appendix E: Mortgage Survey Report
Housing NYC: Rents, Markets and Trends 2009 • 137
I. Financing Availability and Terms for Multifamily Buildings
1a. Do you currently offer new permanent financing Interest rate : ____________ % ____________ %(i.e., loans secured by a property not previously (current) (12 mo. average for 2008)mortgaged by your institution) for rent stabilizedbuildings? Points : __________
! Yes. (Indicate typical terms and conditions at right.) Terms : __________
! No. Type: Fixed / Adjustable (circle one)
Special conditions: ________________________
1b. How many loans were made by your institution in 2008for new permanent financing of rent stabilized buildings? Number of loans: ______________________
2a. Do you currently offer refinancing of Interest rate : ____________ % ____________ %mortgages on rent stabilized buildings? (current) (12 mo. average for 2008)
Points : ____________! Yes. (Indicate typical terms and conditions at right.)
Terms : ____________! No. (Skip to question 4a if you do not offer refinancing.)
Type: Fixed / Adjustable (circle one)
Special conditions: ________________________(if any)
2b. How many loans did your institution refinance in 2008for rent stabilized buildings? Number of loans: ______________________
3a. In the past year, has the total volume of new and ! Yes, we have experienced a significantrefinanced loans underwritten by your institution ______________ of about ________ %.changed significantly (by at least 5%)? (increase / decrease )
! No, it is about the same. (Please skip Question 3b).
3b. If loan volume has changed significantly, is the ! A significant _________________ in the volume ofchange attributable to: (increase / decrease )
loan applications of about ________ %.(Please check and fill in all applicable choices.)
! A significant _________________ in the rate of(increase / decrease )
application approvals of about ________ %.
Are there any trends related to financing availability and terms on which you wish to comment?
__________________________________________________________________________________________________
__________________________________________________________________________________________________
__________________________________________________________________________________________________
__________________________________________________________________________________________________
CONFIDENTIAL 1
II. Underwriting Criteria for Rent Stabilized BuildingsN.A.
4a. What standards does your institution employ when Loan-to-Value Ratio: __________________ !assessing loan applications for rent stabilizedbuildings? Debt Service Coverage: _______________ !
(Provide the maximum criteria.) Appraised Value of Building: _____________ !
4b. Please provide any other standards your institution N.A.employs when assessing loan applications.If you do not employ the standard given, Number of Units in Building: ___________ !place an “X” in the “N.A.” column.
Building Age: ________________________ !(Indicate an average, minimum, or maximum criteria.)
Borrower Lives in Building: ____________ !
Overall Building Maintenance: __________ !
Co-op / Condo Conversion !Potential: ____________
Other (Please Specify): ________________ !
5. Did your institution change its underwriting ! Yes.practices for financing or refinancing rentstabilized buildings over the past year? ! No. (If no, please skip to Question 7).
6. Yes, we changed our underwriting practices ! Use ___________ stringent approvals.for rent stabilized buildings to: ( more / less )
(Please check and fill in all applicable choices.) ! Require __________ fees ( i.e., points or fees).( higher / lower )
! __________________ loan-to-value ratio.( Increase / Decrease )
! __________________ monitoring requirements.( Increase / Decrease )
! _____________________ lending to rent stabilized( Discontinue / Reduce / Expand ) buildings.
! Other : ____________________________________
III. Additional Mortgage Questions
7. How many dwelling units are contained in the average ! 1 -10 ! 11 - 19 ! 20 - 49rent stabilized building financed by your institution? ! 50 - 99 ! 100 or more(Please check only one.)
8. Which of the following best describes the average ! < 1% ! 1% ! 2%vacancy and collection loss for rent stabilized buildings ! 3% ! 4% ! 5%during the past year? (Please check only one.) ! 6% ! 7% ! > 7%
9. Approximately what percentage of your loans to ! Nonerent stabilized buildings are currently non-performing? ! Approximately ________ %.
CONFIDENTIAL 2
10. Approximately what percentage of your loans to ! Nonerent stabilized buildings are currently in foreclosure? ! Approximately ________ %.
11a. Does your institution retain the mortgages you offer ! We retain all the mortgages sold. (If so, please skipor do you sell any to secondary markets? to question 12.)
! We sell all our mortgages to secondary markets.! We sell _____% of our mortgages to secondary markets.
11b. To whom do you sell your mortgages? ! Fannie Mae(Please check and fill in all applicable choices.) ! Freddie Mac
! Other: ______________________________________
______________________________________
______________________________________
12. In your sector, who are your major competitors in multi-family lending?
__________________________________________________________________________________________________
__________________________________________________________________________________________________
13. Do the mortgages offered to rent stabilized buildings ! Noinclude any commercial space? ! Yes. Approximately what percentage of buildings in your
portfolio have commercial space? ________%
14. What is your best estimate of average operatingand maintenance costs per unit per month in the $ per unit per monthrent stabilized buildings financed by your institution?
(Include the following operating and maintenance costs in your estimate: Real Estate & Other Taxes, Labor, Fuel, Utilities, ContractorServices, Administration — including Legal, Management and other costs — Insurance, Parts & Supplies, and Replacement Costs.)
15. What is your best estimate of average rentper unit per month in the rent stabilized buildings $ per unit per monthfinanced by your institution?
16. Do any of your lending or underwriting standards New Financing Rates: ! Higher ! Lower ! Samediffer for rent stabilized buildings as opposed to Refinancing Rates: ! Higher ! Lower ! Samenon-stabilized multifamily properties? Loan-to-Value Ratio: ! Higher ! Lower ! Same(Please check all that apply) Debt Service Coverage: ! Higher ! Lower ! Same
17. On average, how does your portfolio of rent stabilized Net Operating Income: ! Better ! Worse ! Samebuildings perform as compared with expectations Debt Service Coverage: ! Better ! Worse ! Sameat the time of the initial loan originations? O&M Expenses: ! Better ! Worse ! Same(Please check all that apply)
CONFIDENTIAL 3
18. Please estimate, on average, what percentage of Net Operating Income goes towards payment of debt service?
_____________%.
19. Please estimate the average mortgage loan payment per unit per month for a typical building in your portfolio:
_____________.
20. Has the nationwide mortgage-related credit crunch impacted your rent stabilized mortgage lending in any way? If so, how?Are there any additional trends relating to underwriting criteria, non-performing loans & foreclosure, or the mortgagemarket in general on which you wish to comment?
__________________________________________________________________________________________________
__________________________________________________________________________________________________
__________________________________________________________________________________________________
__________________________________________________________________________________________________
Thank you for taking the time to complete the survey.
CONFIDENTIAL 4
E.7 2009 Survey of Mortgage Financing for Multifamily Properties

Appendix E: Mortgage Survey Report
138 • Appendices
E.8 Rent Stabilized Building Median Sales Price and SalesVolume, by Borough and Building Size, and Percent Change,2007-2008
2007 2008 Percent Change 2007 2008 Percent ChangeMedian Sale Price Median Sale Price from 2007-08 # of Sales # of Sales from 2007-08
CitywideAll buildings* $2,255,000 $1,951,000 - 1,474 1,021 -30.7%6-10 units $800,000 $828,500 3.6% 612 416 -32.0%11-19 units $2,090,000 $1,875,000 -10.3% 223 141 -36.8%20-49 units $3,550,000 $2,874,411 -19.0% 409 294 -28.1%50-99 units $6,000,000 $6,875,000 14.6% 176 134 -23.9%
BronxAll buildings* $2,400,000 $2,435,000 - 319 171 -46.4%6-10 units $700,000 $750,000 7.1% 45 31 -31.1%11-19 units $1,005,000 $1,080,000 7.5% 55 20 -63.6%20-49 units $2,392,500 $2,370,000 -0.9% 130 70 -46.2%50-99 units $5,182,325 $6,000,000 15.8% 80 47 -41.3%
BrooklynAll buildings* $882,500 $977,500 - 520 426 -18.1%6-10 units $700,000 $765,000 9.3% 350 253 -27.7%11-19 units $1,606,250 $1,350,000 -16.0% 50 37 -26.0%20-49 units $3,292,500 $3,000,000 -8.9% 68 89 30.9%50-99 units $7,000,000 $5,546,386 -20.8% 41 38 -7.3%
ManhattanAll buildings* $4,508,653 $3,850,000 - 470 243 -48.3%6-10 units $3,500,000 $3,390,552 -3.1% 119 63 -47.1%11-19 units $3,942,500 $3,250,000 -17.6% 104 57 -45.2%20-49 units $5,036,300 $3,820,000 -24.2% 192 81 -57.8%50-99 units $10,509,000 $11,925,000 13.5% 36 21 -41.7%
QueensAll buildings* $1,070,000 $1,626,304 - 165 181 9.7%6-10 units $834,000 $800,000 -4.1% 98 69 -29.6%11-19 units $2,030,000 $1,875,000 -7.6% 19 27 42.1%20-49 units $3,600,000 $3,105,000 -13.8% 19 54 184.2%50-99 units $8,500,000 $9,620,000 13.2% 19 28 47.4%
Notes: The percent change in median sales price citywide and by borough were not calculated due to the variation in the median buildingsize from year to year. Staten Island data, as well as 100+ unit buildings, are excluded due to the small number of buildings sold.
* “All buildings” totals include buildings with 100 or more units. Therefore, these figures do not equal the sum of their subsets. In addition,citywide figures do not contain Staten Island building sales.
Source: NYC Department of Finance

Appendix F: Income & Affordability Study
Unemployment Rate 1997 1998 1999 2000 2001 2002 2003 2004 2005 2006 2007 2008
Bronx 11.7% 9.9% 8.2% 7.2% 7.4% 9.8% 10.0% 9.2% 7.5% 6.7% 6.9% 7.4%Brooklyn 10.7% 9.3% 8.0% 6.4% 6.6% 8.7% 9.0% 7.6% 6.2% 5.4% 5.5% 5.9%Manhattan 7.8% 6.7% 5.9% 5.1% 5.7% 7.7% 7.5% 6.2% 5.0% 4.3% 4.4% 4.9%Queens 8.5% 6.9% 6.1% 5.3% 5.4% 7.2% 7.4% 6.3% 5.2% 4.5% 4.5% 4.9%Staten Island 8.4% 6.9% 5.8% 5.1% 5.2% 7.0% 7.4% 6.4% 5.2% 4.5% 4.6% 5.0%
NYC 9.4% 7.9% 6.9% 5.8% 6.1% 8.0% 8.3% 7.1% 5.8% 5.0% 4.9% 5.5%
U.S. 4.9% 4.5% 4.2% 4.0% 4.7% 5.8% 6.0% 5.5% 5.1% 4.6% 4.6% 5.8%
Labor Force Participation RateNYC " 58.6% 58.7% 59.0% 59.0% 58.7% 59.3% 58.8% 58.5% 58.7% 59.0% 59.5% 60.0%U.S. 67.1% 67.1% 67.1% 67.1% 66.8% 66.6% 66.2% 66.0% 66.0% 66.2% 66.0% 66.0%
Employment-Population RatioNYC " 53.1% 54.0% 54.9% 55.6% 55.2% 54.6% 54.0% 54.3% 55.3% 56.1% 56.5% 56.7%U.S. 63.8% 64.1% 64.3% 64.4% 63.7% 62.7% 62.3% 62.3% 62.7% 63.1% 63.0% 62.2%
Gross City Product (NYC)(billions, in 2000 $) 370.3 394.7 415.3 437.8 431.8 415.4 405.3 415.9 431.3 446.6 461.05 462.18% Change 5.35% 6.59% 5.22% 5.42% -1.37% -3.80% -2.43% 2.62% 3.70% 3.55% 3.24% 0.25%
Gross Domestic Product (U.S.)(billions, in 2000 $) 8,703.5 9,066.9 9,470.3 9,817.0 9,890.7 10,048.8 10,301.0 10,675.8 10,989.5 11,294.8 11,523.9 11,652.7% Change 4.50% 4.17% 4.45% 3.66% 0.75% 1.60% 2.51% 3.64% 2.9% 2.8% 2.0% 1.1%
Notes: The New York City Comptroller’s Office revises the Gross City Product periodically. The GCP & GDP figures presented here may not be the same asthose reported in prior years. Note that GCP and GDP figures are preliminary.
Sources: U.S. Bureau of Labor Statistics; U.S. Bureau of Economic Analysis, U.S. Dept. of Commerce; NYS Dept. of Labor; NYC Comptroller’s Office.
"" Unpublished data from the Bureau of Labor Statistics. These figures are revised periodically.
F.1 Average Annual Employment Statistics by Area, 1997-2008
Housing NYC: Rents, Markets and Trends 2009 • 139
2007-2008Industry Employment 1999 2000 2001 2002 2003 2004 2005 2006 2007 2008 Change
Manufacturing 186.8 176.8 155.5 139.4 126.6 120.8 113.9 106.1 101.0 95.1 -5.8%Construction, Natural Resources & Mining " 112.5 120.5 122.1 115.8 112.7 111.8 113.3 118.5 127.3 131.5 3.3%Trade, Transport & Utilities 556.3 569.6 557.4 536.5 533.6 539.3 547.5 558.3 569.7 573.2 0.6%Leisure & Hospitality 243.7 256.7 260.1 255.3 260.3 270.1 276.7 284.9 297.8 308.3 3.5%Financial Activities 481.0 488.8 473.6 445.1 433.6 435.5 445.1 458.3 467.6 465.1 -0.5%Information 172.8 187.3 200.4 176.9 163.9 160.2 162.8 164.6 165.5 167.7 1.3%Professional & Business Svcs. 552.9 586.5 581.9 550.4 536.6 541.6 555.6 571.8 593.2 605.0 2.0%Educational & Health Svcs. 604.4 615.2 627.1 646.0 658.2 665.3 678.8 694.7 705.1 719.3 2.0%Other Services 141.5 147.4 148.7 149.7 149.1 150.5 153.2 154.3 157.7 161.4 2.3%
Total Private Sector 3,051.9 3,148.8 3,126.7 3,015.0 2,974.5 2,995.0 3,046.9 3,111.4 3,184.8 3,226.6 1.3%
Government ‡ 567.0 568.9 562.4 566.2 556.6 554.4 555.6 555.2 559.0 563.6 0.8%City of New York 453.3 451.8 450.8 456.2 448.3 447.9 449.8 450.4 453.9 458.1 0.9%
Total 3,618.8 3,717.7 3,689.1 3,581.1 3,531.1 3,549.4 3,602.5 3,666.6 3,743.8 3,790.2 1.2%
Notes: Totals may not add up due to rounding. Categories and figures have been revised from prior years due to new classification system used by the
US Bureau of Labor Statistics and the NYS Department of Labor. Total excludes farm employment but includes unclassified jobs.
" Beginning in 2005, Construction and Natural Resources & Mining are no longer two separate employment sectors. Prior year figures reflect that change.
‡ Government includes federal, state, and local (City of New York) jobs located in New York City. Local government figures have been revised from prioryears to include those employed by the City of New York as well as city-based public corporations such as the HHC (Health and Hospitals Corporation) and the MTA.
Source: NYS Department of Labor
F.2 Average Payroll Employment by Industry for NYC, 1999-2008(in thousands)

Appendix F: Income & Affordability Study
F.3 Average Real Wage Rates by Industry for NYC, 2000-2007(2007 dollars)
140 • Appendices
SICSYSTEM NAICS CLASSIFICATION SYSTEM
2006-07Industry 2001 2000 2001 2002 2003 2004 2005 2006 2007 % Change
Construction $58,001 $64,861 $67,147 $66,326 $66,079 $63,376 $62,218 $62,800 $64,976 3.5%Manufacturing $64,990 $44,411 $46,288 $47,767 $49,019 $49,933 $51,551 $49,834 $52,687 5.7%Transportation $59,129 $48,093 $49,462 $49,700 $48,568 $47,430 $45,616 $45,418 $46,924 3.3%Trade $37,465 $48,043 $48,261 $48,068 $47,820 $47,485 $47,566 $47,594 $48,553 2.0%FIRE $161,388 $177,554 $180,325 $160,120 $155,204 $173,945 $178,907 $200,765 $227,889 13.5%Services $50,000 $53,352 $53,051 $52,051 $52,260 $52,867 $53,018 $53,552 $54,758 2.3%Information # $93,478 $95,409 $92,600 $96,739 $98,559 $99,228 $100,733 $102,383 1.6%
Private Sector $67,306 $76,545 $77,221 $72,997 $71,690 $74,626 $75,576 $79,235 $84,753 7.0%Government $49,240 $56,510 $56,494 $56,269 $56,432 $57,009 $55,193 $53,753 $53,581 -0.3%
Total Industries $74,045 $73,495 $74,044 $70,318 $69,258 $71,843 $72,401 $75,340 $80,071 6.3%
Note: The New York State Department of Labor revises the statistics annually. Real wages reflect 2007 dollars and differ from those found in this table inprior years.
# Statistic not available. These categories were created when the NYS Dept. of Labor began tracking wages with the NAICS Classification System in 2000.
Source: New York State Department of Labor, Research and Statistics Division.
SICSYSTEM NAICS CLASSIFICATION SYSTEM
2006-07Industry 2001 2000 2001 2002 2003 2004 2005 2006 2007 % Change
Construction $54,863 $52,160 $55,359 $56,085 $57,594 $57,193 $58,314 $61,073 $64,976 6.4%Manufacturing $61,474 $35,714 $38,162 $40,392 $42,725 $45,062 $48,316 $48,464 $52,687 8.7%Transportation $55,930 $38,675 $40,779 $42,026 $42,332 $42,803 $42,754 $44,169 $46,924 6.2%Trade $35,438 $38,635 $39,789 $40,646 $41,680 $42,852 $44,581 $46,285 $48,553 4.9%FIRE $152,658 $142,785 $148,668 $135,397 $135,275 $156,975 $167,681 $195,245 $227,889 16.7%Services $47,295 $42,904 $43,738 $44,014 $45,549 $47,710 $49,691 $52,080 $54,758 5.1%Information # $75,173 $78,660 $78,302 $84,317 $88,944 $93,002 $97,963 $102,383 4.5%
Private Sector $63,665 $61,556 $63,665 $61,726 $62,485 $67,346 $70,834 $77,056 $84,753 10.0%Government $46,576 $45,444 $46,576 $47,581 $49,186 $51,447 $51,730 $52,275 $53,581 2.5%
Total Industries $61,046 $59,103 $61,045 $59,461 $60,365 $64,834 $67,858 $73,268 $80,071 9.3%
Note: The New York State Department of Labor revises the statistics annually.
# Statistic not available. These categories were created when the NYS Dept. of Labor began tracking wages with the NAICS Classification System in 2000.
Source: New York State Department of Labor, Research and Statistics Division.
F.4 Average Nominal Wage Rates by Industry for NYC, 2000-2007

Appendix F: Income & Affordability Study
Citywide Change fromYear Bronx Brooklyn Manhattan Queens Staten Island Citywide Prior Decade
1900 200,507 1,166,582 1,850,093 152,999 67,021 3,437,202 --1910 430,980 1,634,351 2,331,542 284,041 85,969 4,766,883 38.7%1920 732,016 2,018,356 2,284,103 469,042 116,531 5,620,048 17.9%1930 1,265,258 2,560,401 1,867,312 1,079,129 158,346 6,930,446 23.3%1940 1,394,711 2,698,285 1,889,924 1,297,634 174,441 7,454,995 7.6%1950 1,451,277 2,738,175 1,960,101 1,550,849 191,555 7,891,957 5.9%1960 1,424,815 2,627,319 1,698,281 1,809,578 221,991 7,781,984 -1.4%1970 1,471,701 2,602,012 1,539,233 1,986,473 295,443 7,894,862 1.5%1980 1,168,972 2,230,936 1,428,285 1,891,325 352,121 7,071,639 -10.4%1990 1,203,789 2,300,664 1,487,536 1,951,598 378,977 7,322,564 3.5%2000 1,334,381 2,466,952 1,539,610 2,231,845 445,562 8,018,350 9.5%2008 1,391,903 2,556,598 1,634,795 2,293,007 487,407 8,363,710 4.3%""
Note: 1900-1990 figures as of April 1 of each year. 2000-2008 figures is of July 1 of that year. Percent population change between 1990 and 2000 hasnot been adjusted to take into account the increased number of households surveyed for the 2000 Census.
" Percentage change is from 2000-2008. Source: U.S. Census Bureau, Population Division
F.5 New York City Population Statistics, 1900-2008
Housing NYC: Rents, Markets and Trends 2009 • 141
1998 1999 2000 2001 2002 2003 2004 2005 2006 2007 2008
March 173.0 175.5 181.5 186.4 191.1 197.1 203.4 212.4 218.2 224.6 233.1June 173.1 176.8 182.0 188.3 191.5 196.9 206.0 210.7 222.6 228.3 238.6September 174.4 178.2 184.4 188.0 193.3 199.6 205.9 215.8 222.9 228.3 240.1December 174.7 178.6 184.2 187.3 193.1 199.3 206.8 214.2 221.3 229.4 233.0
Quarterly Average 173.8 177.3 183.0 187.5 192.3 198.2 205.5 213.3 221.3 227.6 236.2Yearly Average 173.6 177.0 182.5 187.1 191.9 197.8 204.8 212.7 220.7 226.9 235.8
12-month percentage change in the CPI1998 1999 2000 2001 2002 2003 2004 2005 2006 2007 2008
March 1.35% 1.45% 3.42% 2.70% 2.52% 3.14% 3.20% 4.42% 2.73% 2.91% 3.82%June 1.64% 2.14% 2.94% 3.46% 1.70% 2.82% 4.62% 2.28% 5.65% 2.54% 4.52%September 1.57% 2.18% 3.48% 1.95% 2.82% 3.26% 3.16% 4.81% 3.29% 2.43% 5.16%December 1.63% 2.23% 3.14% 1.68% 3.10% 3.21% 3.76% 3.58% 3.31% 3.66% 1.58%
Quarterly Average 1.55% 2.00% 3.24% 2.45% 2.53% 3.11% 3.68% 3.77% 3.74% 2.88% 3.77%Yearly Average 1.64% 1.96% 3.11% 2.52% 2.57% 3.07% 3.54% 3.86% 3.76% 2.83% 3.90%
Source: U.S. Bureau of Labor Statistics; Base Period: 1982-1984=100
F.6 Consumer Price Index for All Urban Consumers, NY-Northeastern NJ, 1998-2008

Appendix F: Income & Affordability Study
142 • Appendices
F.8 Homeless Statistics, 1982-2008
Families Year Single Adults Children (inc. children) Total Individuals
1982 3,786 2,507 1,005 7,5841983 5,061 4,887 1,960 12,4681984 6,228 7,432 2,981 17,4911985 7,217 9,196 3,688 21,1541986 8,890 10,493 4,286 24,8961987 9,628 11,163 4,986 27,2251988 9,675 11,401 5,091 27,6461989 9,342 8,614 4,105 23,2541990 8,535 6,966 3,591 20,1311991 7,689 8,867 4,581 22,4981992 6,922 9,607 5,270 23,4941993 6,413 9,760 5,626 23,7481994 6,235 9,610 5,629 23,4311995 6,532 9,927 5,627 23,9501996 7,020 9,945 5,692 24,5541997 7,090 8,437 4,793 22,1451998 6,875 8,054 4,558 21,2771999 6,778 8,826 4,965 22,5752000 6,934 9,290 5,192 23,7122001 7,479 11,427 6,154 27,7992002 7,750 14,952 8,071 34,5762003 8,199 16,705 9,203 38,3102004 8,612 15,705 8,922 37,3192005 8,174 13,534 8,194 33,6872006 7,662 12,597 8,339 32,4302007 6,988 14,559 9,296 35,1242008 6,809 14,595 8,971 34,354
Note: Data presented are the annual averages of the homeless shelter population. Street homelessness is not quantified in this data.
Source: New York City Department of Homeless Services
Note: “Filings” reflect non-payment proceedings initiated by rental property owners, while “Calendared” reflect those non-payment proceedingsresulting in a court appearance. “Filings” and “Calendared” figures prior to 1998 were rounded to the nearest thousand. *Note: 2001 Evictionsand Possessions data is incomplete as it excludes the work of one city marshal who died in May 2001 and whose statistics are unavailable.
Sources: NYC Civil Court, First Deputy Chief Clerk for Housing; NYC Department of Investigations, Bureau of City Marshals.
Evictions &Year Filings Calendared Possessions
1987 301,000 77,000 25,7611988 299,000 92,000 24,2301989 299,000 99,000 25,1881990 297,000 101,000 23,5781991 302,000 114,000 20,4321992 289,000 122,000 22,0981993 295,000 124,000 21,9371994 294,000 123,000 23,9701995 266,000 112,000 22,8061996 278,000 113,000 24,3701997 274,000 111,000 24,995
Evictions &Year Filings Calendared Possessions
1998 278,156 127,851 23,4541999 276,142 123,399 22,6762000 276,159 125,787 23,8302001* 277,440 130,897 21,369*2002 331,309 132,148 23,6972003 318,077 133,074 23,2362004 261,085 121,999 22,0102005 261,457 119,265 21,9452006 256,747 122,379 23,6692007 251,390 121,793 24,6962008 246,147 120,420 25,027
F.7 Housing Court Actions, 1987-2008

Housing NYC: Rents, Markets and Trends 2009 • 143
Appendix F: Income & Affordability Study
20051 20082
Number Percent Number Percent
Household Income<$5,000/Loss/No Income 64,525 6.4% 81,160 8.1%$5,000 to $9,999 90,279 8.9% 75,931 7.6%$10,000 to $14,999 85,943 8.5% 72,875 7.3%$15,000 to $19,999 81,219 8.0% 65,103 6.5%$20,000 to $24,999 76,142 7.5% 69,779 7.0%$25,000 to $29,999 61,208 6.0% 56,132 5.6%$30,000 to $34,999 70,502 6.9% 56,129 5.6%$35,000 to $39,999 54,090 5.3% 49,316 4.9%$40,000 to $49,999 105,567 10.4% 97,563 9.7%$50,000 to $59,999 72,804 7.2% 74,875 7.5%$60,000 to $69,999 56,074 5.5% 65,464 6.5%$70,000 to $79,999 48,053 4.7% 52,232 5.2%$80,000 to $89,999 37,982 3.7% 39,009 3.9%$90,000 to $99,999 23,909 2.4% 24,526 2.4%$100,000 to $124,999 35,698 3.5% 53,799 5.4%$125,000 or More 51,660 5.1% 67,320 6.7%Median $32,000 - $36,000 -Mean $45,836 - $52,157 -
Contract Rent<$100 1,801 0.2% 172 0.0%$100 to $199 11,648 1.2% 5,595 0.6%$200 to $299 16,542 1.7% 12,527 1.3%$300 to $399 17,631 1.8% 21,872 2.2%$400 to $499 38,865 3.9% 30,868 3.1%$500 to $599 88,030 8.8% 48,814 4.9%$600 to $699 128,376 12.8% 94,628 9.6%$700 to $799 129,635 13.0% 101,296 10.3%$800 to $899 143,463 14.4% 119,910 12.1%$900 to $999 112,047 11.2% 138,616 14.0%$1,000 to $1,249 155,349 15.5% 207,590 21.0%$1,250 to $1,499 70,229 7.0% 90,533 9.2%$1,500 to $1,749 45,334 4.5% 56,845 5.8%$1,750 or More 40,734 4.1% 58,924 6.0%No Cash Rent 15,970 - 13,027 -Median $844 - $925 -Mean $908 - $1,008 -
Contract-Rent-to-Income Ratio<10% 67,976 7.0% 71,804 7.7%10% to 14% 115,289 11.9% 106,782 11.4%15% to 19% 115,896 12.0% 118,275 12.6%20% to 24% 107,210 11.1% 110,665 11.8%25% to 29% 88,068 9.1% 81,558 8.7%30% to 34% 70,089 7.3% 64,091 6.9%35% to 39% 55,636 5.8% 48,359 5.2%40% to 49% 80,600 8.4% 79,437 8.5%50% to 59% 50,537 5.2% 54,780 5.9%60% to 69% 45,330 4.7% 38,976 4.2%70% to 79% 27,339 2.8% 27,405 2.9%80% or More 140,892 14.6% 132,865 14.2%Not Computed 50,791 - 66,218 -Median 29.1% - 28.5% -Mean 37.5% - 39.0% -
1. 2005 HVS reflects 2004 incomes.2. 2008 HVS reflects 2007 incomes.
Note: 2005 and 2008 data values are imputed.
Source: 2005 and 2008 New York City Housing and Vacancy Survey Tables, U.S. Bureau of the Census.
F.9 Housing and Vacancy Survey Data, RentStabilized Apartments, 2005 and 2008

Year Bronx Brooklyn Manhattan Queens Staten Island Total
1960 -- -- -- -- -- 46,7921961 -- -- -- -- -- 70,6061962 -- -- -- -- -- 70,6861963 -- -- -- -- -- 49,8981964 -- -- -- -- -- 20,5941965 -- -- -- -- -- 25,7151966 -- -- -- -- -- 23,1421967 -- -- -- -- -- 22,1741968 -- -- -- -- -- 22,0621969 -- -- -- -- -- 17,0311970 -- -- -- -- -- 22,3651971 -- -- -- -- -- 32,2541972 -- -- -- -- -- 36,0611973 -- -- -- -- -- 22,4171974 -- -- -- -- -- 15,7431975 -- -- -- -- -- 3,8101976 -- -- -- -- -- 5,4351977 -- -- -- -- -- 7,6391978 -- -- -- -- -- 11,0961979 -- -- -- -- -- 14,5241980 -- -- -- -- -- 7,8001981 -- -- -- -- -- 11,0601982 -- -- -- -- -- 7,6491983 -- -- -- -- -- 11,7951984 -- -- -- -- -- 11,5661985 1,263 1,068 12,079 2,211 3,711 20,3321986 920 1,278 1,622 2,180 3,782 9,7821987 931 1,650 3,811 3,182 4,190 13,7641988 967 1,629 2,460 2,506 2,335 9,8971989 1,643 1,775 2,986 2,339 2,803 11,5461990 1,182 1,634 2,398 704 940 6,8581991 1,093 1,024 756 602 1,224 4,6991992 1,257 646 373 351 1,255 3,8821993 1,293 1,015 1,150 530 1,185 5,1731994 846 911 428 560 1,265 4,0101995 853 943 1,129 738 1,472 5,1351996 885 942 3,369 1,301 2,155 8,6521997 1,161 1,063 3,762 1,144 1,857 8,9871998 1,309 1,787 3,823 1,446 2,022 10,3871999 1,153 2,894 3,791 2,169 2,414 12,4212000 1,646 2,904 5,110 2,723 2,667 15,0502001 2,216 2,973 6,109 3,264 2,294 16,8562002 2,626 5,247 5,407 3,464 1,756 18,5002003 2,935 6,054 5,232 4,399 2,598 21,2182004 4,924 6,825 4,555 6,853 2,051 25,2082005 4,937 9,028 8,493 7,269 1,872 31,5992006 4,658 9,191 8,790 7,252 1,036 30,9272007 3,088 10,930 9,520 7,625 739 31,9022008 2,482 12,744 9,700 7,730 1,255 33,911
2009 (1st Qtr)# 164 (862) 137 (1,603) 151 (485) 508 (705) 117 (238) 1,077 (3,893)
# First three months of 2009. The number of permits issued in the first three months of 2008 is in parenthesis.
Source: U.S. Bureau of the Census, Manufacturing and Construction Division, Building Permits Branch.
G.1 Permits Issued For Housing Units in New York City, 1960-2009
144 • Appendices
Appendix G: Housing Supply Report

Year/Borough 1-Family 2-Family 3/4 Family 5 or More-Family Total Buildings
2000Bronx 7.7% 67.8% 22.5% 1.9% 466Brooklyn 15.9% 50.7% 23.5% 9.9% 837Manhattan 0.0% 13.8% 43.1% 43.1% 109Queens 10.9% 58.4% 25.0% 5.7% 801Staten Island 71.8% 27.9% 0.0% 0.3% 1,895Citywide 39.4% 42.6% 13.4% 4.6% 4,108
2001Bronx 3.7% 59.7% 31.9% 4.8% 543Brooklyn 22.3% 44.6% 24.1% 9.0% 1,028Manhattan 2.8% 3.5% 56.3% 37.3% 142Queens 14.1% 58.8% 23.5% 3.6% 1,007Staten Island 72.6% 27.3% 0.1% 0.0% 1,799Citywide 37.6% 41.4% 16.4% 4.6% 4,519
2002Bronx 2.7% 57.4% 35.4% 4.6% 676Brooklyn 15.8% 41.9% 27.5% 14.8% 1,197Manhattan 4.1% 4.1% 24.3% 67.6% 74Queens 17.7% 53.8% 23.8% 4.7% 1,210Staten Island 69.3% 29.4% 1.1% 0.2% 1,317Citywide 29.9% 43.2% 19.9% 7.1% 4,474
2003Bronx 9.2% 50.3% 30.5% 9.9% 596Brooklyn 8.2% 46.1% 31.5% 14.2% 1,446Manhattan 1.3% 8.8% 2.5% 87.5% 80Queens 12.1% 54.2% 28.6% 5.2% 1,335Staten Island 64.8% 34.6% 0.5% 0.1% 1,887Citywide 29.1% 44.0% 19.3% 7.6% 5,344
2004Bronx 4.1% 40.2% 46.9% 8.9% 813Brooklyn 8.0% 31.3% 43.6% 17.1% 1,407Manhattan 1.1% 3.3% 16.7% 78.9% 90Queens 13.3% 55.5% 25.9% 5.2% 1,986Staten Island 46.2% 53.3% 0.2% 0.3% 1,308Citywide 18.1% 45.9% 27.3% 8.7% 5,604
2005Bronx 3.5% 29.9% 54.9% 11.6% 825Brooklyn 6.4% 28.3% 45.3% 20.0% 1,638Manhattan 2.6% 0.9% 6.1% 90.4% 115Queens 17.5% 47.5% 27.1% 7.8% 1,912Staten Island 63.9% 34.6% 1.0% 0.5% 1,297Citywide 22.5% 35.8% 30.0% 11.8% 5,787
2006Bronx 7.7% 33.6% 51.4% 7.3% 959Brooklyn 8.1% 23.2% 45.7% 23.0% 1,389Manhattan 1.8% 3.5% 5.3% 89.4% 113Queens 14.3% 49.7% 29.0% 7.1% 2,014Staten Island 62.7% 36.2% 0.0% 1.1% 697Citywide 17.7% 36.7% 33.2% 12.4% 5,172
2007Bronx 6.8% 43.7% 41.7% 7.8% 643Brooklyn 0.0% 18.3% 51.7% 30.0% 1,079Manhattan 5.0% 1.7% 5.8% 87.6% 121Queens 17.1% 53.1% 21.3% 8.6% 1,562Staten Island 60.7% 38.6% 0.2% 0.6% 511Citywide 16.0% 38.5% 29.8% 15.8% 3,916
2008Bronx 43.4% 17.7% 23.1% 15.8% 373Brooklyn 0.0% 25.0% 18.7% 56.3% 787Manhattan 2.0% 0.0% 0.0% 98.0% 152Queens 18.5% 42.3% 14.8% 24.4% 755Staten Island 50.4% 40.1% 0.5% 9.0% 367Citywide 20.1% 30.0% 14.3% 35.7% 2,434
Source: U.S. Bureau of the Census, Manufacturing and Construction Division, Building Permits Branch.
G.2 Permits Issued by Building Size & Borough (In Percentages), 2000-2008
Appendix G: Housing Supply Report
Housing NYC: Rents, Markets and Trends 2009 • 145

Year Bronx Brooklyn Manhattan Queens Staten Island Total
1960 4,970 9,860 5,018 14,108 1,292 35,2481961 4,424 8,380 10,539 10,632 1,152 35,1271962 6,458 10,595 12,094 15,480 2,677 47,3041963 8,780 12,264 19,398 17,166 2,423 60,0311964 9,503 13,555 15,833 10,846 2,182 51,9191965 6,247 10,084 14,699 16,103 2,319 49,4521966 7,174 6,926 8,854 6,935 2,242 32,1311967 4,038 3,195 7,108 5,626 3,069 23,0361968 3,138 4,158 2,707 4,209 3,030 17,2421969 1,313 2,371 6,570 3,447 3,768 17,4691970 1,652 1,695 3,155 4,230 3,602 14,3341971 7,169 2,102 4,708 2,576 2,909 19,4641972 11,923 2,593 1,931 3,021 3,199 22,6671973 6,294 4,340 2,918 3,415 3,969 20,9361974 3,380 4,379 6,418 3,406 2,756 20,3391975 4,469 3,084 9,171 2,146 2,524 21,3941976 1,373 10,782 6,760 3,364 1,638 23,9171977 721 3,621 2,547 1,350 1,984 10,2231978 464 345 3,845 697 1,717 7,0681979 405 1,566 4,060 1,042 2,642 9,7151980 1,709 708 3,306 783 2,380 8,8861981 396 454 4,416 1,152 2,316 8,7341982 997 332 1,812 2,451 1,657 7,2491983 757 1,526 2,558 2,926 1,254 9,0211984 242 1,975 3,500 2,291 2,277 10,2851985 557 1,301 1,739 1,871 1,939 7,4071986 968 2,398 4,266 1,776 2,715 12,1231987 1,177 1,735 4,197 2,347 3,301 12,7571988 1,248 1,631 5,548 2,100 2,693 13,2201989 847 2,098 5,979 3,560 2,201 14,6851990 872 929 7,260 2,327 1,384 12,7721991 656 764 2,608 1,956 1,627 7,6111992 802 1,337 3,750 1,498 1,136 8,5231993 886 616 1,810 801 1,466 5,5791994 891 1,035 1,927 1,527 1,573 6,9531995 1,166 1,647 2,798 1,013 1,268 7,8921996 1,075 1,583 1,582 1,152 1,726 7,1181997 1,391 1,369 816 1,578 1,791 6,9451998 575 1,333 5,175 1,263 1,751 10,0971999 1,228 1,025 2,341 2,119 2,264 8,9772000 1,385 1,353 6,064 2,096 1,896 12,7942001 1,617 2,404 6,036 1,225 2,198 13,4802002 1,220 2,248 8,326 1,981 2,453 16,2282003 1,473 2,575 3,798 2,344 2,589 12,7792004 $ 3,326 4,512 6,150 3,087 2,291 19,3662005 $ 3,012 5,007 5,006 4,526 1,942 19,4932006 $ 4,311 6,418 5,199 5,940 1,900 23,7682007 $ 4,445 7,073 7,521 5,940 1,450 26,4292008 $$ 4,241 7,306 6,141 5,672 1,021 24,381
Note: Dwelling unit count is based on the number of Certificates of Occupancy issued by NYC Department of Buildings, or equivalent action bythe Empire State Development Corporation or NYS Dormitory Authority. Prior year’s data may be adjusted and may not match prior reports.
$ Data from 2004-2008 now includes Final Certificates of Occupancies (as with all other years) as well as Temporary Certificates ofOccupancy data for the first time. Data will be updated every year to reflect the most current estimates.
Source: New York City Department of City Planning, Certificates of Occupancy issued in Newly Constructed Buildings.
G.3 New Dwelling Units Completed in New York City, 1960-2008
146 • Appendices
Appendix G: Housing Supply Report

2003 2004 2005 2006 2007 2008
Plans (Units) Plans (Units) Plans (Units) Plans (Units) Plans (Units) Plans (Units)Private Plans
New Construction 190 (4,870) 268 (6,018) 361 (12,210) 644 (19,780) 573 (19,511) 454 (13,998)Rehabilitation 18 (418) 18 (334) 6 (223) 0 8 (71) 4 (130)Conversion (Non-Eviction) 10 (639) 16 (1,550) 24 (2,356) 53 (6,331) 66 (5,441) 50 (2,582)Conversion (Eviction) 0 0 0 0 0 0Private Total 218 (5,927) 302 (7,902) 391 (14,789) 697 (26,201) 647 (25,023) 508 (16,710)
Plans (Units) Plans (Units) Plans (Units) Plans (Units) Plans (Units) Plans (Units)HPD Sponsored Plans
New Construction 0 0 0 0 0 0Rehabilitation 0 0 0 0 0 0Conversion (Non-Eviction) 0 0 0 0 0 0Conversion (Eviction) 0 15 (274) 18 (269) 13 (273) 16 (248) 18 (241)HPD Total 0 15 (274) 18 (269) 13 (273) 16 (248) 18 (241)
Grand Total 218 (5,927) 317 (8,176) 409 (15,058) 710 (26,474) 663 (25,271) 526 (16,951)
Note: Figures exclude “Homeowner” and “Commercial” plans/units. Source: New York State Attorney General’s Office, Real Estate Financing Bureau.
G.4 Number of Residential Co-op and Condo Plans Accepted forFiling By the NYS Attorney General’s Office, 2003-2008
TotalNew Conversion Conversion New Construction Units in HPD
Year Construction Eviction Non-Eviction Rehabilitation Conversion & Rehab Sponsored Plans
1982 6,096 26,469 16,439 -- 49,004 1,9481983 4,865 18,009 19,678 -- 42,552 9061984 4,663 7,432 25,873 -- 37,968 5191985 9,391 2,276 30,277 -- 41,944 9351986 11,684 687 39,874 -- 52,245 1951987 8,460 1,064 35,574 -- 45,098 1,1751988 9,899 1,006 32,283 -- 43,188 1,1591989 6,153 137 25,459 -- 31,749 9451990 4,203 364 14,640 -- 19,207 1,1751991 1,111 173 1,757 -- 3,041 2,4591992 793 0 566 -- 1,359 1,6741993 775 41 134 -- 950 4551994 393 283 176 807 1,659 9011995 614 426 201 1,258 2,499 9351996 21 0 149 271 441 01997 1,417 26 131 852 2,426 5331998 3,225 0 386 826 4,437 1901999 1,123 343 359 1,029 2,854 2952000 1,911 203 738 220 3,072 1792001 3,833 22 1,053 124 5,032 222002 2,576 260 1,974 348 5,158 2602003 4,870 0 639 418 5,927 02004 6,018 274 1,550 334 8,176 2742005 12,210 269 2,356 223 15,058 2692006 19,870 273 6,331 0 26,474 2732007 19,511 248 5,441 71 25,271 2482008 13,998 241 2,582 130 16,951 241
Note: Rehabilitated units were tabulated separately beginning in 1994. HPD Plans are a subset of all plans. Some numbers were revised from prior years.
Source: New York State Attorney General’s Office, Real Estate Financing Bureau.
G.5 Number of Units in Co-op and Condo Plans Accepted forFiling By the NYS Attorney General’s Office, 1982-2008
Appendix G: Housing Supply Report
Housing NYC: Rents, Markets and Trends 2009 • 147

Buildings Receiving Certificates for 421-a Exemptions, 2006-2008
2006 2007 2008
Certificates Units Certificates Units Certificates Units
Bronx 10 114 24 1,020 34 1,521Brooklyn 57 736 50 825 55 1,241Manhattan 32 2,375 24 1,939 26 1,237Queens 52 650 44 428 49 516Staten Island 0 0 0 0 1 6
TOTAL 151 3,875 142 4,212 165 4,521
Buildings Receiving J-51 Tax Abatements and Exemptions, 2006-2008
2006 2007 2008Certified Certified Certified
Buildings Units Cost ($1,000s) Buildings Units Cost ($1,000s) Buildings Units Cost ($1,000s)
Bronx 279 13,766 35,979 153 7,381 16,757 248 7,767 18,203Brooklyn 249 13,167 28,300 283 12,470 24,575 312 14,858 29,858Manhattan 271 21,884 27,969 208 12,348 24,302 369 26,110 26,720Queens 287 17,106 12,600 309 23,148 15,487 431 15,340 10,193Staten Island 4 87 43 4 334 158 91 403 805
TOTAL 1,090 66,010 104,891 957 55,681 81,278 1,451 64,478 85,779
Source: New York City Department of Housing Preservation and Development, Office of Development, Tax Incentive Programs.
G.6 Tax Incentive Programs, 2006-2008
148 • Appendices
Appendix G: Housing Supply Report
Year 421-a J-51
1981 3,505 --1982 3,620 --1983 2,088 --1984 5,820 --1985 5,478 --1986 8,569 --1987 8,286 --1988 10,079 109,3671989 5,342 64,3921990 980 113,0091991 3,323 115,0311992 2,650 143,5931993 914 122,0001994 627 60,8741995 2,284 77,0721996 1,085 70,4311997 2,099 145,3161998 2,118 103,5271999 6,123 82,1212000 2,828 83,9252001 4,870 81,3212002 4,953 70,1452003 3,782 74,0052004 6,738 117,5032005 5,062 66,3702006 3,875 66,0102007 4,212 55,6812008 4,521 64,478
Source: New York City Department of Housing Preservation and Development, Office of Development, TaxIncentive Programs.
G.7 Tax Incentive Programs – Units ReceivingInitial Benefits, 1981-2008

Central Alternative BuildingsManagement Management Vestings Sold
Occupied Occupied Vacant VacantFiscal Year Units Buildings Units Buildings Units Buildings Units Buildings Buildings
1988 37,355 3,628 37,734 3,972 14,494 624 -- -- 58 +1989 32,377 3,359 45,724 3,542 17,621 780 -- -- 721990 33,851 3,303 37,951 3,110 14,800 705 3,323 292 1121991 32,783 3,234 30,534 2,796 12,695 615 2,288 273 1401992 32,801 3,206 22,854 2,368 -- -- 1,462 197 --1993 32,078 3,098 17,265 2,085 9,237 470 2,455 211 1621994 30,358 2,992 13,675 1,763 8,606 436 715 69 811995 27,922 2,885 11,190 1,521 7,903 433 240 17 1701996 24,503 2,684 9,971 1,349 6,915 393 49 2 3861997 22,298 2,484 8,177 1,139 5,380 289 0 0 2531998 19,084 2,232 7,511 1,021 6,086 305 0 0 2061999 15,333 1,905 6,664 869 6,640 401 0 0 2512000 13,613 1,730 6,295 805 6,282 382 0 0 136 2001 8,299 1,203 4,979 633 7,973 504 0 0 3212002 5,715 919 3,762 524 7,756 477 0 0 3022003 4,049 610 2,370 367 7,064 441 0 0 1842004 1,970 373 1,806 275 7,348 466 0 0 2172005 1,114 235 1,294 221 6,516 451 0 0 1692006 727 175 826 155 5,582 373 0 0 1712007 466 133 517 92 5,039 316 0 0 1052008 415 115 415 75 4,242 259 0 0 66
Note: HPD could not confirm vestings data prior to FY 1990.Source: NYC Department of Housing Preservation and Development.
G.8 City-Owned Properties, Fiscal Years 1988-2008
G.9 Building Demolitions in New York City, 1988-2008Bronx Brooklyn Manhattan Queens Staten Island Total
5+ 5+ 5+ 5+ 5+ 5+Year Units Total Units Total Units Total Units Total Units Total Units Total
1988 3 34 2 169 25 44 2 269 0 160 32 6761989 6 48 8 160 20 38 3 219 0 109 37 5741990 4 29 3 133 20 28 5 119 0 71 32 3801991 10 33 15 95 9 14 1 68 0 32 35 2421992 12 51 6 63 2 5 1 41 0 33 21 1931993 0 17 4 94 0 1 3 51 0 5 7 1681994 3 14 4 83 5 5 2 42 0 8 14 1521995 2 18 0 81 0 0 2 37 0 17 4 1531996 -- 30 -- 123 -- 25 -- 118 -- 84 -- 3801997 -- 29 -- 127 -- 51 -- 168 -- 119 -- 4941998 -- 71 -- 226 -- 103 -- 275 -- 164 -- 8391999 -- 67 -- 211 -- 53 -- 227 -- 159 -- 7172000 -- 64 -- 499 -- 101 -- 529 -- 307 -- 1,5002001 -- 96 -- 421 -- 160 -- 519 -- 291 -- 1,4872002 -- 126 -- 500 -- 89 -- 600 -- 456 -- 1,7712003 -- 161 -- 560 -- 100 -- 865 -- 564 -- 2,2502004 -- 238 -- 691 -- 141 -- 1128 -- 547 -- 2,7452005 -- 245 -- 1,080 -- 145 -- 1,545 -- 477 -- 3,4922006 -- 334 -- 1,109 -- 259 -- 1,485 -- 381 -- 3,5682007 -- 302 -- 984 -- 282 -- 1,407 -- 308 -- 3,2832008 -- 206 -- 925 -- 252 -- 1,082 -- 215 -- 2,680
Note: The Census Bureau discontinued collecting demolition statistics in December, 1995. The New York City Department of Buildings began supplying thetotal number of buildings demolished from 1996 forward, and cannot specify whether buildings are residential, nor if they have 5+ units. Demolition statisticsfrom 1985 though 1995 are solely residential buildings.
Source: U.S. Bureau of the Census, Manufacturing and Construction Division, Building Permits Branch; New York City Department of Buildings.
Appendix G: Housing Supply Report
Housing NYC: Rents, Markets and Trends 2009 • 149

H.1 Additions to the Stabilized Housing Stock, 1994-2008
Mitchell-Lama Buyouts FormerlyYear 421-a J-51 State City Lofts 421-g 420-c Controlled Total
1994 - 114 0 0 - - - - 114
1995 - 88 306 0 - - - - 394
1996 - 8 0 0 - - - - 8
1997 - 38 323 0 - - - - 361
1998 - 135 574 1,263 64 - - - 2,036
1999 - 33 286 0 71 - - - 390
2000 - 224 0 0 96 - - - 320
2001 - 494 0 0 56 - - - 550
2002 - 260 0 232 16 - - - 508
1994-2002 20,240 1,394 1,489 1,495 303 865 5,500 31,159 62,445
2003 1,929 171 0 279 20 41 1,781 916 5,137
2004 4,941 142 0 229 129 188 1,973 706 8,308
2005 3,380 25 251 481 66 79 1,664 721 6,667
2006 2,264 130 285 2,755 81 5 1,798 634 7,952
2007 2,838 135 2,227 290 35 441 2,558 592 9,116
2008 1,856 55 0 101 35 865 4,767 887 8,566
Total 37,448 2,052 4,252 5,630 669 2,484 20,041 35,615 108,191
421-a Notes: Between 1994-2002, a count of 26,987 421-a units includes co-op and condo units that were created under the 421-a program.Analysis of the RPAD database shows that on average from 1994 to 2002, 25% of 421-a units were owner units and 75% were rental units. Thereforean estimated 20,240 units were added to the rent stabilized stock. In 2003, 51% of 421-a units were rental units, therefore, of the 3,782 units createdunder the 421-a program in 2003, 1,929 were rentals that are rent stabilized. In 2004, 72% of 421-a units were rental units, therefore, of the 6,862units created under the 421-a program in 2004, 4,941 were rentals that are rent stabilized. In 2005, 67% of new 421-a units were rentals, 3,380 of atotal of 5,062 units. In 2006, 58% of new 421-a units were rentals, 2,264 of a total of 3,875. In 2007, 67% of new 421-a units were rentals, 2,838 of atotal of 4,212. In 2008, 41% of new 421-a units were rentals, 1,856 of a total of 4,521.
J-51 Notes: The numbers represent units that were not rent stabilized prior to entering the J-51 Program. Most units participating in the J-51 Programwere rent stabilized prior to their J-51 status and therefore are not considered additions to the rent stabilized stock.
Loft Notes: Loft conversion counts are not available from 1994 to 1997.
421-g, 420-c and Rent Controlled Notes: Counts for each year between 1994 and 2002 are not available; only an aggregate is available.
Sources: Department of Housing Preservation and Development (HPD), Tax Incentive Programs and Division of Housing Supervision (Mitchell-LamaDevelopments); NYS Division of Housing and Community Renewal (DHCR), Office of Rent Administration, annual registration data, and Office ofHousing Operations; and NYC Loft Board.
150 • Appendices
Appendix H: Changes to the Rent Stabilized Housing Stock in 2008

Year Bronx Brooklyn Manhattan Queens S.I. Total
1994 0 0 904 0 0 904
1995 0 0 346 0 0 346
1996 1 0 180 4 0 185
1997 1 0 157 2 0 160
1998 3 0 366 3 0 372
1999 2 1 279 1 0 283
2000 2 1 227 0 0 230
2001 3 0 209 2 0 214
2002 1 1 258 2 0 262
2003 2 13 177 6 0 198
2004 0 13 173 8 0 194
2005 4 30 220 11 0 265
2006 8 28 244 21 0 301
2007 9 45 241 14 0 309
2008 10 50 198 20 0 278
Total 46 182 4,179 94 0 4,501
Source: NYS Division of Housing and Community Renewal (DHCR), Office of Rent Administration, annual registration data, grants by year of filing petition cycle.
H.3 Subtractions from the Stabilized Housing Stock Due to High Rent/High Income Decontrol by Borough, 1994-2008
Bronx Brooklyn Manhattan Queens S.I. Total
421-a 523 450 538 342 3 1,856
421-g 0 0 865 0 0 865
420-c 815 2,399 1,252 301 0 4,767
J-51 0 26 21 8 0 55
Mitchell-Lama Buyouts (City & State) 101 0 0 0 0 101
Lofts 0 0 35 0 0 35
Total* 1,439 2,875 2,711 651 3 7,679
*Note: The totals for each borough and citywide do not include formally rent controlled units since borough level data was not provided to theRent Guidelines Board this year.
Sources: Department of Housing Preservation and Development (HPD), Tax Incentive Programs and Division of Housing Supervision (Mitchell-Lama Developments); NYS Division of Housing and Community Renewal (DHCR), Office of Rent Administration, annual registration data, andOffice of Housing Operations; and NYC Loft Board.
H.2 Additions to the Stabilized Housing Stock by Borough, 2008
Appendix H: Changes to the Rent Stabilized Housing Stock in 2008
Housing NYC: Rents, Markets and Trends 2009 • 151

H.5 Subtractions from the Stabilized Housing Stock, 1994-2008
High Rent/ High Rent/ Commercial/High Income Vacancy Co-op/Condo 421-a J-51 Substantial Professional
Year Decontrol Decontrol Conversion Expiration Expiration Rehab Conversion Other Total
1994 904 565 5,584 2,005 1,345 332 139 1,904 12,778
1995 346 1,047 4,784 990 1,440 334 113 1,670 10,724
1996 185 1,325 4,733 693 1,393 601 117 1,341 10,388
1997 160 1,204 3,723 1,483 1,340 368 109 1,365 9,752
1998 372 2,384 3,940 2,150 1,412 713 78 1,916 12,965
1999 283 3,785 2,822 3,514 1,227 760 110 1,335 13,836
2000 230 2,934 3,147 3,030 884 476 729 1,372 12,802
2001 214 4,982 2,153 770 1,066 399 88 1,083 10,755
2002 262 6,144 1,774 653 1,081 508 45 954 11,421
2003 198 8,204 1,474 651 854 340 59 912 12,692
2004 194 8,856 1,564 493 609 268 79 954 13,017
2005 265 9,272 1,692 451 545 692 111 1,017 14,045
2006 301 9,983 1,567 263 236 350 135 1,139 13,974
2007 309 10,342 1,455 161 270 297 66 1,304 14,204
2008 278 12,800 1,405 376 176 421 56 1,321 16,833
Total 4,501 83,827 41,817 17,683 13,878 6,859 2,034 19,587 190,186
Co-op/Condo Note: Subtractions from the stabilized stock in co-ops and condos are due to two factors: (1) stabilized tenants vacating rental units in previously converted buildings and (2) new conversions of stabilized rental units to ownership.
High Rent/Vacancy Decontrol Note: See Appendix 4 note.
Source: NYS Division of Housing and Community Renewal (DHCR), Office of Rent Administration, annual registration data.
H.4 Subtractions from the Stabilized Housing Stock Due to High Rent/Vacancy Decontrol by Borough, 1994-2008
Year Bronx Brooklyn Manhattan Queens S.I. Total
1994 3 9 544 9 0 565
1995 1 111 927 8 0 1,047
1996 10 106 1,203 6 0 1,325
1997 6 77 1,121 0 0 1,204
1998 7 116 2,247 14 0 2,384
1999 11 151 3,586 37 0 3,785
2000 7 279 2,586 62 0 2,934
2001 53 294 4,490 145 0 4,982
2002 64 391 5,431 251 7 6,144
2003 83 640 7,048 416 17 8,204
2004 101 758 7,271 697 29 8,856
2005 184 852 7,303 904 29 9,272
2006 217 1,408 7,187 1,106 65 9,983
2007 375 1,409 7,114 1,380 64 10,342
2008 447 1,884 8,600 1,787 82 12,800
Total 1,569 8,485 66,658 6,822 293 83,827
Note: Registration of deregulated units with DHCR was voluntary and not required from 1994-2000. These totals represent a‘floor’ or minimum count of the actual number of deregulated units in these years. The NYC City Council required proof ofregistration with DHCR of the unit as exempt to be sent to the tenant beginning in March 2000 (see Endnote 7).
Source: NYS Division of Housing and Community Renewal (DHCR), Office of Rent Administration, annual registration data.
152 • Appendices
Appendix H: Changes to the Rent Stabilized Housing Stock in 2008

H.6 Subtractions from the Stabilized Housing Stock by Borough, 2008
Bronx Brooklyn Manhattan Queens S.I. Total
High Rent/High Income Decontrol 10 50 198 20 0 278
High Rent/Vacancy Decontrol 447 1,884 8,600 1,787 82 12,800
Co-op/Condo Conversion 289 243 347 518 8 1,405
421-a Expirations 2 13 198 161 2 376
J-51 Expirations 0 56 115 5 0 176
Substantial Rehabilitation 22 234 138 27 0 421
Commercial/Professional Conversion 15 19 13 8 1 56
Other 171 370 668 109 3 1,321
Total 956 2,869 10,277 2,635 96 16,833
Source: NYS Division of Housing and Community Renewal (DHCR), Office of Rent Administration, annual registration data.
Appendix H: Changes to the Rent Stabilized Housing Stock in 2008
Housing NYC: Rents, Markets and Trends 2009 • 153


New York City Rent Guidelines Board
Glossary & Index
Glossary of Rent Regulation....................pg. 156
Index ........................................................pg. 164

Glossary
1/40th Increase: See "Individual ApartmentImprovements“
421-a Tax Incentive Program: Created in 1970. Offerstax exemptions to qualifying new multifamily propertiescontaining three or more rental units. Apartments builtwith 421-a tax exemptions are subject to the provisionsof the Rent Stabilization Laws during the exemptionperiod. Thus, 421-a tenants share the same tenancyprotections as stabilized tenants and initial rentsapproved by HPD are then confined to increasesestablished by the Rent Guidelines Board.
Adjustable Rate Mortgage (ARM): Similar to a variablerate mortgage except that interest rate adjustments arecapped in order to protect lenders and borrowers fromsudden upturns or downturns in a market index.
Affordable Housing: As defined by the United StatesDepartment of Housing and Urban Development, anyhousing accommodation for which a tenant householdpays 30% or less of its income for shelter.
Balloon Loan: A type of loan that is partially amortized,which means that principal is partially paid throughoutthe term of the loan. At maturity, the borrower still has asubstantial sum (balloon) that must be repaid orrefinanced.
Class A Multiple Dwelling: As defined under theMultiple Dwelling Law, a multiple dwelling building whichis generally occupied as a permanent residence. Theclass includes such buildings as apartment houses,apartment hotels, maisonette apartments, and all othermultiple dwellings except Class B dwellings.
Class B Multiple Dwelling: A multiple dwelling which isoccupied, as a rule, transiently, as the more or lesstemporary abode of individuals or families. This classincludes such buildings as hotels, lodging houses,rooming houses, boarding schools, furnished roomhouses, college and school dormitories.
Condominium: A form of property ownership in whichunits are individually owned and the owners acquire sharesin an association that owns and cares for common areas.
Cooperative: A form of property ownership in which abuilding or complex is owned by a corporation. Sharesin the corporation are allocated per apartment and the
owners of those shares, who are called proprietarylessees, may either live in the apartment for which theshares are allocated or rent that apartment to a sub-tenant.
Core Manhattan: The area of Manhattan south of 96thStreet on the East Side and 110th Street on the WestSide. See also “Upper Manhattan.”
Cross-sectional: The type of analysis that provides a"snapshot" view of data as it appears in a singularmoment or period of time.
Debt Service: Repayment of loan principal and interest;the projected debt service is the determining factor insetting the amount of the loan itself.
Debt Service Ratio: The net operating income dividedby the debt service; it measures a borrower’s ability tocover mortgage payments using a building’s netoperating income.
Decontrol: See "Deregulation."
Department of Housing Preservation andDevelopment (HPD): The New York City agency withprimary responsibility for promulgating and enforcinghousing policy and laws in the City. (Also see DHCR)
Deregulation: Also known as “Decontrol” or“Destabilization.” Deregulation occurs by action of theowner when an apartment under either rent control orrent stabilization legally meets the criteria for leavingregulation. When an apartment is deregulated, the rentmay be set at ‘market rate.’ There are two types ofderegulation, commonly referred to as Luxury Decontrol(a.k.a. High-Income High-Rent Decontrol) and VacancyDecontrol (a.k.a High-Rent Decontrol). See these termsfor details.
Destabilization: See "Deregulation."
DHCR: See "Division of Housing and CommunityRenewal."
Disability Rent Increase Exemption (DRIE): Aprogram which freezes the rent of a New York Citytenant or tenant’s spouse who is disabled (defined asreceiving either Federal Supplemental Security Income,Federal Social Security Disability Insurance, US
Glossary of Rent Regulation
156 • Glossary & Index

Department of Veterans Affairs disability pension orcompensation, or Disability-related Medicaid) and livingin a rent regulated apartment. To currently qualify forthis benefit, a single person household must make nomore than $19,284 per year and a two- or more-personhousehold must make a combined household income nomore than $27,780 per year, as well as paying at least1/3 of their income toward their rent,
Discount Rate: The interest rate Federal ReserveBanks charge for loans to depository institutions.
Distressed Buildings: Buildings that have operatingand maintenance expenses greater than gross incomeare considered distressed.
Division of Housing and Community Renewal(DHCR): The New York State agency with primaryresponsibility for formulating New York State housingpolicy, and monitoring and enforcing the provisions of the state’s residential rent regulation laws.
Emergency Tenant Protection Act of 1974 (ETPA):Chapter 576 Laws of 1974: In Nassau, Rockland andWestchester counties, rent stabilization applies to non-rent controlled apartments in buildings of six or moreunits built before January 1, 1974 in localities that havedeclared an emergency and adopted ETPA. In order forrents to be placed under regulation, there has to be arental vacancy rate of less than 5% for all or any class orclasses of rental housing accommodations. Somemunicipalities limit ETPA to buildings of a specific size, forinstance, buildings with 20 or more units. Eachmunicipality declaring an emergency and adopting locallegislation pays the cost of administering ETPA (in eitherNassau, Rockland or Westchester County). In turn, eachmunicipality can charge the owners of subject housingaccommodations a fee (up to $10 per unit per year).
Eviction: An action by a building owner in a court ofcompetent jurisdiction to obtain possession of a tenant’shousing accommodation.
Fair Market Rents (FMR): In New York City, when atenant voluntarily vacates a rent controlled apartment,the apartment becomes decontrolled. If that apartmentis in a building containing six or more units, theapartment becomes rent stabilized. The owner maycharge the first stabilized tenant a fair market rent. Allfuture rent increases are subject to limitations under theRent Stabilization Law, whether the same tenant renewsthe lease or the apartment is rented to another tenant.
The Rent Stabilization Law permits the first stabilizedtenant after decontrol to challenge the first rent chargedafter decontrol, through a Fair Market Rent Appeal, if thetenant believes that the rent set by the owner exceedsthe fair market rent for the apartment. The Appeal isdecided taking into consideration the Fair Market RentSpecial Guideline and rents for comparable apartments.
Family Assistance Program (FAP): NY State’s TANFprogram. See “Temporary Assistance to NeedyFamilies.”
Federal Deposit Insurance Corporation (FDIC):Established by the federal government in 1950 to insurethe deposits of member banks and savings associations.
Federal Reserve Board: The central bank of the UnitedStates founded by Congress in 1913 to provide thenation with a safer, more flexible, and more stablemonetary and financial system.
Federal Funds Rate: Set by the Federal Reserve, thisis the rate banks charge each other for overnight loans.
Fixed Rate Mortgage (FRM): The interest rate isconstant for the term of a mortgage.
Fuel Cost Adjustment: The New York City RentControl Law allows separate adjustments based on thechanges, up or down, in the price of various types ofheating fuels. The adjustment will be based on fuel pricechanges between the beginning and end of the prioryear. Only tenants in rent controlled apartments locatedin New York City are subject to this fuel cost adjustment.Early rent stabilized New York City Rent GuidelinesBoard orders also contained supplementary guidelinesadjustments denominating fuel cost adjustments.
Gross City Product (GCP): The dollar measurement ofthe total citywide production of goods and services in agiven year.
Guideline Rent Increases: The percentage increase ofthe Legal Regulated Rent that is allowed when a new orrenewal lease is signed. This percentage is determinedby the New York City Rent Guidelines Board for renewalleases signed between October 1 of the current year andSeptember 30 of the following year. The percentageincrease allowed is dependent on the term of the leaseand whether the lease is a renewal or vacancy lease(see ‘Vacancy Allowance’). Although in the past theRGB customarily set increases for vacancy leases, it has
Glossary
Housing NYC: Rents, Markets and Trends 2009 • 157

Glossary
not done so since the passage of the Rent RegulationReform Act of 1997, which established statutory vacancyincreases. Sometimes additional factors, such as theamount of the rent, whether or not electricity is includedin the rent and the past rental history, have also resultedin varying adjustments.
Home Relief: See "Safety Net Assistance."
Hotel: Under rent stabilization, a multiple dwelling thatprovides all of the following services included in the rent: (1) Maid service, consisting of general house cleaning at
a frequency of at least once a week; (2) Linen service, consisting of providing clean linens at
a frequency of at least once a week; (3) Furniture and furnishings, including at a minimum a
bed, lamp, storage facilities for clothing, chair andmirror in a bedroom; such furniture to be maintainedby the hotel owner in reasonable condition; and
(4) Lobby staffed 24 hours a day, seven days a week byat least one employee.
Housing Maintenance Code: The code, enforced bythe New York City Department of Housing Preservationand Development, provides for protection of the healthand safety of apartment dwellers by setting standards forthe operation, preservation and condition of buildings.
Housing and Vacancy Survey (HVS): A triennialsurvey of approximately 17,000 households conductedby the United States Census Bureau data. The survey isused, inter alia, to determine the vacancy rate forresidential units in New York City, and gather otherinformation necessary for HPD, RGB, DHCR and otherhousing officials to formulate policy.
HPD: See "Department of Housing Preservation andDevelopment."
HUD: The United States Department of Housing andUrban Development, which is the federal agencyprimarily responsible for promulgating and enforcingfederal housing policy and laws.
HVS: See "Housing and Vacancy Survey."
I&E: Refers to the annual Income and Expense Studyperformed by the Rent Guidelines Board drawn fromsummarized data on RPIE forms, the income andexpense statements filed annually by owners ofstabilized buildings with the New York City Department of Finance.
Individual Apartment Improvements (IAI or "1/40th"):An increase in rent based on increased services, newequipment, or improvements. This increase is a NYSpolicy and is in addition to the regular annual RentGuidelines Board increases for rent stabilized apartmentsand Maximum Base Rent increases for rent controlledapartments. If owners add new services, improvements,or new equipment to an occupied rent regulatedapartment, owners of rent regulated units can add 1/40thor 2.5% of the cost of qualifying improvements to the legalrent of those units excluding finance charges. E.g., (1) ifan apartment’s legal rent were $500, and (2) the landlordmade $4,000 of qualifying improvements, then (3) thelandlord thereafter could add 1/40th of the cost of thoseimprovements—in this example, $100—to the apartment’sexisting legal monthly rent for a resulting new legal rent of$600. The 1/40th increase remains permanently in themonthly rent, even after the cost of the improvement isrecouped. Owners must get the tenant’s written consentto pay the increase and an order from DHCR is notrequired. If any apartment is vacant, the owner does nothave to get written consent of a tenant to make theimprovement and pass-on the 1/40th increase.
Initial Legal Registered Rent: Under rent stabilization,the lawful rent for the use and occupancy of housingaccommodations under the Rent Stabilization Law or theEmergency Tenant Protection Act, as first registered withthe DHCR, which has not been challenged pursuant toregulation, or if challenged, has been determined by the DHCR.
In Rem: In Rem units include those located instructures owned by the City of New York as a result ofan in rem proceeding initiated by the City after the ownerfailed to pay tax on the property for one or more years.Though many of these units in multiple dwellings hadpreviously been subject to either rent control or rentstabilization, they are exempt from both regulatorysystems during the period of city ownership.
J-51 Tax Incentive Program: A New York City programunder which, in order to encourage development andrehabilitation, property tax abatements and exemptionsare granted. In consideration of receiving these taxabatements, and at least for the duration of theabatements, the owner of these buildings agree to placeunder rent stabilization those apartments which wouldnot otherwise be subject to rent stabilization Thisprogram provides real estate tax exemptions andabatements to existing residential buildings that arerenovated or rehabilitated in ways that conform to the
158 • Glossary & Index
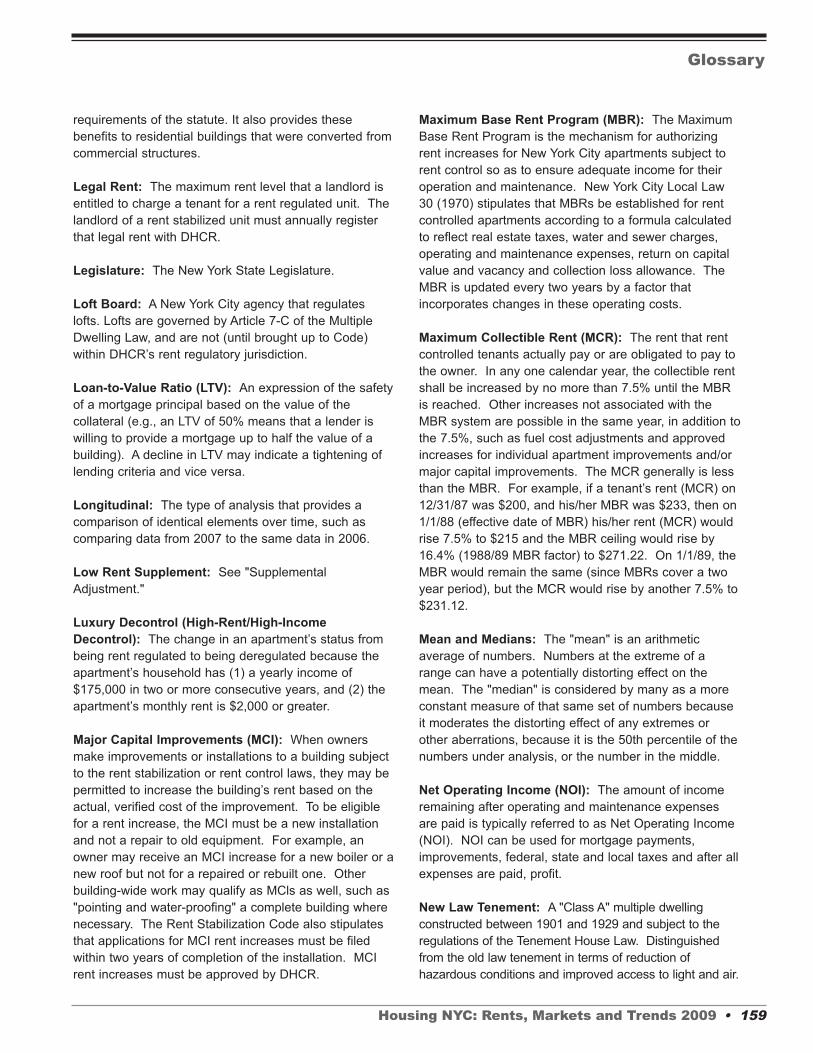
Glossary
requirements of the statute. It also provides thesebenefits to residential buildings that were converted fromcommercial structures.
Legal Rent: The maximum rent level that a landlord isentitled to charge a tenant for a rent regulated unit. Thelandlord of a rent stabilized unit must annually registerthat legal rent with DHCR.
Legislature: The New York State Legislature.
Loft Board: A New York City agency that regulateslofts. Lofts are governed by Article 7-C of the MultipleDwelling Law, and are not (until brought up to Code)within DHCR’s rent regulatory jurisdiction.
Loan-to-Value Ratio (LTV): An expression of the safetyof a mortgage principal based on the value of thecollateral (e.g., an LTV of 50% means that a lender iswilling to provide a mortgage up to half the value of abuilding). A decline in LTV may indicate a tightening oflending criteria and vice versa.
Longitudinal: The type of analysis that provides acomparison of identical elements over time, such ascomparing data from 2007 to the same data in 2006.
Low Rent Supplement: See "SupplementalAdjustment."
Luxury Decontrol (High-Rent/High-IncomeDecontrol): The change in an apartment’s status frombeing rent regulated to being deregulated because theapartment’s household has (1) a yearly income of$175,000 in two or more consecutive years, and (2) theapartment’s monthly rent is $2,000 or greater.
Major Capital Improvements (MCI): When ownersmake improvements or installations to a building subjectto the rent stabilization or rent control laws, they may bepermitted to increase the building’s rent based on theactual, verified cost of the improvement. To be eligiblefor a rent increase, the MCI must be a new installationand not a repair to old equipment. For example, anowner may receive an MCI increase for a new boiler or anew roof but not for a repaired or rebuilt one. Otherbuilding-wide work may qualify as MCls as well, such as"pointing and water-proofing" a complete building wherenecessary. The Rent Stabilization Code also stipulatesthat applications for MCI rent increases must be filedwithin two years of completion of the installation. MCIrent increases must be approved by DHCR.
Maximum Base Rent Program (MBR): The MaximumBase Rent Program is the mechanism for authorizingrent increases for New York City apartments subject torent control so as to ensure adequate income for theiroperation and maintenance. New York City Local Law30 (1970) stipulates that MBRs be established for rentcontrolled apartments according to a formula calculatedto reflect real estate taxes, water and sewer charges,operating and maintenance expenses, return on capitalvalue and vacancy and collection loss allowance. TheMBR is updated every two years by a factor thatincorporates changes in these operating costs.
Maximum Collectible Rent (MCR): The rent that rentcontrolled tenants actually pay or are obligated to pay tothe owner. In any one calendar year, the collectible rentshall be increased by no more than 7.5% until the MBRis reached. Other increases not associated with theMBR system are possible in the same year, in addition tothe 7.5%, such as fuel cost adjustments and approvedincreases for individual apartment improvements and/ormajor capital improvements. The MCR generally is lessthan the MBR. For example, if a tenant’s rent (MCR) on12/31/87 was $200, and his/her MBR was $233, then on1/1/88 (effective date of MBR) his/her rent (MCR) wouldrise 7.5% to $215 and the MBR ceiling would rise by16.4% (1988/89 MBR factor) to $271.22. On 1/1/89, theMBR would remain the same (since MBRs cover a twoyear period), but the MCR would rise by another 7.5% to$231.12.
Mean and Medians: The "mean" is an arithmeticaverage of numbers. Numbers at the extreme of arange can have a potentially distorting effect on themean. The "median" is considered by many as a moreconstant measure of that same set of numbers becauseit moderates the distorting effect of any extremes orother aberrations, because it is the 50th percentile of thenumbers under analysis, or the number in the middle.
Net Operating Income (NOI): The amount of incomeremaining after operating and maintenance expensesare paid is typically referred to as Net Operating Income(NOI). NOI can be used for mortgage payments,improvements, federal, state and local taxes and after allexpenses are paid, profit.
New Law Tenement: A "Class A" multiple dwellingconstructed between 1901 and 1929 and subject to theregulations of the Tenement House Law. Distinguishedfrom the old law tenement in terms of reduction ofhazardous conditions and improved access to light and air.
Housing NYC: Rents, Markets and Trends 2009 • 159

Glossary
New York City Housing Authority (NYCHA): The NewYork City agency that administers public housing andrental assistance programs.
New York City Rent Guidelines Board: See "RentGuidelines Board."
Nominal Dollars: Dollars not adjusted to take inflationinto account. See also “Real Dollars.”
Old Law Tenement: A "Class A" multiple dwellingconstructed before 1901 and subject to the regulations ofthe Tenement House Law.
O&M: Refers to the operating and maintenanceexpenses in buildings.
Operating Cost Ratio: The "cost-to-income" ratio, orthe percentage of income spent on O&M expenses, istraditionally used by the RGB to evaluate estimatedprofitability of stabilized housing, presuming thatbuildings are better off by spending a lower percentageof revenue on expenses.
Orders: See “Rent Guideline Orders.”
Outer Boroughs: Queens, Brooklyn, the Bronx andStaten Island, or the boroughs of New York City notincluding Manhattan. These boroughs are often groupedtogether for purposes of analysis because theireconomic and demographic attributes are more similar toeach other than those found in Manhattan.
PIOC: Price Index of Operating Costs. The majorresearch instrument performed by the RGB staff todetermine the annual change in prices for a marketbasket of goods and services used by owners to operateand maintain rent stabilized buildings.
Points: Up-front service fees charged by lenders.
Post-46 or Post-war: A common classification ofresidential buildings used by City agencies to describebuildings built after World War II. Buildings with six ormore residential units constructed between 1947 and1973, or after 1974 if the units received a tax abatementsuch as 421-a or J-51, are generally stabilized.
Preferential Rent: A rent charged by an owner to atenant that is less than the established legal regulatedrent. Owners are not necessarily required to baserenewal lease increases on the preferential rent.
Pre-47 or Pre-war: A common classification ofresidential buildings used by City agencies to describebuildings built before the World War II. Buildings with sixor more units constructed before February 1, 1947 aregenerally stabilized when the current tenant moved in onor after July 1, 1971.
Real Dollars: Dollars adjusted to take inflation intoaccount. Real dollar figures offer a comparison betweenyears that are pegged to the value of a dollar in a givenyear. See also “Nominal Dollars.”
Registration: Owners are required to register all rentstabilized apartments with DHCR by filing an AnnualApartment Registration Form which lists rents andtenancy information as of April 1st of each year.
Renewal Lease: The lease of a tenant in occupancyrenewing the terms of a prior lease entered into betweenthe tenant and owner for an additional term. Tenants inrent stabilized apartments have the right to select alease renewal for a one- or two-year term. The renewallease must be on the same terms and conditions as theexpiring lease unless a change is necessary to complywith a specific law or regulation or is otherwiseauthorized by the rent regulation. The owner maycharge the tenant a Rent Guidelines Board authorizedincrease based on the length of the renewal lease termselected by the tenant. The law permits the owner toraise the rent during the lease term if the RentGuidelines rate was not finalized when the tenant signedthe lease renewal offer. A renewal lease should go intoeffect on or after the date that it is signed and returnedto the tenant as well as on the day following expiration ofthe prior lease. In general, the lease and any rentincrease may not begin retroactively. Penalties may beimposed when an owner does not timely offer the tenanta renewal lease or timely return to the tenant anexecuted copy thereof.
Rent Control: The rent regulation program whichgenerally applies to residential buildings constructedbefore February, 1947 in municipalities for which an endto the postwar rental housing emergency has not beendeclared. For an apartment to be under rent control, thetenant must generally have been living therecontinuously since before July 1, 1971 or for less time asa successor to a rent controlled tenant. When a rentcontrolled apartment becomes vacant, it either becomesrent stabilized or is removed from regulation, generallybecoming stabilized if the building has six or more unitsand if the community has adopted Emergency Tenant
160 • Glossary & Index

Glossary
Protection Act. Formerly controlled apartments mayhave been decontrolled on various other grounds. Rentcontrol limits the rent an owner may charge for anapartment and restricts the right of an owner to evicttenants. It also obligates the owner to provide essentialservices and equipment. In New York City, rentincreases are governed by the MBR system.
Rent Guidelines Board (RGB): The New York Cityagency responsible for setting the yearly rent-rateadjustments for the City’s rent stabilized apartments, andalso the agency which produced this publication. TheBoard is appointed by the Mayor and consists of twomembers who represent tenants, two members whorepresent the real estate industry and five publicmembers.
RGB Rent Index: An index that measures the overalleffect of the Board’s annual rent increases on contractrents.
RGB: See "Rent Guidelines Board."
Rent Guideline Orders: Rent guideline orders areissued by the rent guidelines boards annually, usuallybefore July 1. For the most part, they establish thepercentage increases that may be given to rentstabilized/ETPA apartments upon lease renewal and fornew leases. These increases are based on the reviewof operating expenses and other cost of living data.
RPIE Forms: Owners of stabilized buildings are requiredby Local Law 63 to file Real Property Income andExpense (RPIE) forms annually with the New York CityDepartment of Finance. RPIE forms contain detailedfinancial information regarding the revenues earned andthe costs accrued in the operation and maintenance ofstabilized buildings. Buildings with fewer than 11 units,an assessed value of $40,000 or less, or exclusivelyresidential cooperatives or condominiums are exemptfrom filing. RPIE forms are also known as I&E forms.
Rent Regulation Reform Act of 1997 (RRRA-97): Thelaw passed by the New York State Legislature in June,1997 which promulgated several new provisions for rentregulated units. See "Luxury Decontrol", "Special LowRent Increase", "Vacancy Allowance", "Vacancy Bonus"and "Vacancy Decontrol". Also known as the ‘Rent Act.’
Rent Stabilization: In New York City, rent stabilizedapartments are generally those apartments in buildings ofsix or more units built between February 1, 1947 and
January 1, 1974. Tenants in buildings built beforeFebruary 1, 1947, who moved in after June 30, 1971 arealso covered by rent stabilization. A third category of rentstabilized apartments covers buildings subject toregulation by virtue of various governmental supervisionor tax benefit programs. Generally, these buildings arestabilized only while the tax benefits or governmentalsuspension continues. In some cases, a building with asfew as three units may be stabilized. Similar to rentcontrol, stabilization provides other protections to tenantsbesides regulation of rental amounts. Tenants areentitled to receive required services, to have their leasesrenewed, and not to be evicted except on groundsallowed by law. Leases may be entered into and renewedfor one or two year terms, at the tenant’s choice.
Rent Stabilization Code: The Rent Stabilization Codeis the body of regulations used by DHCR to implementthe Rent Stabilization Law and Emergency TenantProtection Act in New York City. These regulations affectnearly 1 million rent stabilized apartments in New YorkCity. Chapter 888 of the Laws of 1985 authorized DHCRto amend the Rent Stabilization Code for New York City.The current Rent Stabilization Code became effective onMay 1, 1987, with subsequent revision in 2000. Apending revision was also proposed in 2008.
Rental Vacancy Rate: The percentage of the totalrental units in an area that are vacant and available foroccupancy. The vacancy rate for New York City isdetermined every three years by the Housing andVacancy Survey.
Rooming House: Under rent regulation, in addition toits customary usage, a building or portion of a building,other than an apartment rented for single-roomoccupancy, in which housing accommodations arerented, on a short-term basis of daily, weekly or monthlyoccupancy, to more than two occupants for whom rent ispaid, not members of the landlord’s immediate family.The term shall include boarding houses, dormitories,trailers not a part of a motor court, residence clubs,tourist homes and all other establishments of a similarnature, except a hotel or a motor court.
Safety Net Assistance (SNA): An income assistanceprogram set up under the New York State WelfareReform Act of 1997 to replace Home Relief (HR).
Section 8 Vouchers: A federally-funded housingassistance program that pays participating owners onbehalf of eligible tenants to provide decent, safe, and
Housing NYC: Rents, Markets and Trends 2009 • 161

Glossary
sanitary housing for very low income families at rentsthey can afford. Housing assistance payments aregenerally the difference between the local paymentstandard and 30% of the family’s adjusted income. Thefamily has to pay at least 10% of gross monthly incomefor rent. In NYC, the program is administered byNYCHA.
Section 8 Certificates: A federally-funded housingassistance program that provides housing assistancepayments to participating owners on behalf of eligibletenants to provide decent, safe and sanitary housing forlow income families in private market rental units at rentsthey can afford. This is primarily a tenant-based rentalassistance program through which participants areassisted in rental units of their choice; however, a publichousing agency may also attach up to 15% of its certificatefunding to rehabilitated or newly constructed units under aproject-based component of the program. All assistedunits must meet program guidelines. Housing assistancepayments are used to make up the difference between theapproved rent due to the owner for the dwelling unit andthe family’s required contribution towards rent. Assistedfamilies must pay the highest of 30% of the monthlyadjusted family income, 10% of gross monthly familyincome, or the portion of welfare assistance designated forthe monthly housing cost of the family.
Senior Citizens’ Rent Increase Exemption (SCRIE):If a New York City tenant or tenant’s spouse is 62 yearsof age or over (living in a rent regulated apartment), andthe combined household income is currently $29,000per year or less and they are paying at least 1/3 of theirincome toward their rent, the tenant may apply for theSenior Citizen Rent Increase Exemption (SCRIE). InNew York City, the Department of Finance (DOF)administers the SCRIE program. Outside of New YorkCity, Senior Citizen Rent Increase Exemption is a localoption, and communities have different income eligibilitylimits and regulations. If a New York City tenantqualifies for this program, the tenant is exempt fromfuture rent guidelines increases, Maximum Base Rentincreases, fuel cost adjustments, MCI increases, andincreases based on the owner’s economic hardship.New York City senior citizen tenants may also carry thisexemption from one apartment to another upon moving,upon the proper application being made to theDepartment of Finance.
Shelter Allowance: A rental grant provided tohouseholds receiving public assistance under the FamilyAssistance Program (FAP).
Single-Room Occupancy Housing (SRO): Residentialproperties in which some or all dwelling units do notcontain bathroom or kitchen facilities. Under rentregulation, the occupancy by one or two persons of asingle room, or of two or more rooms which are joinedtogether, separated from all other rooms within anapartment in a multiple dwelling, so that the occupant oroccupants thereof reside separately and independently ofthe other occupant or occupants of the same apartment.
Special Guideline: The New York City Rent GuidelinesBoard is obligated to promulgate special guidelines to aidthe State Division of Housing and Community Renewal inits determination of initial legal regulated rents for housingaccommodations previously subject to rent control. Thisis determined each year by the RGB as applicable to thedetermination of Fair Market Rent Appeals.
Special Low Rent Increase: This provision of the 1997Rent Regulation Reform Act permits the landlords of unitswhich rent for less than $300 to charge those vacancyallowances otherwise permitted (including the "vacancybonus") plus $100. Moreover, if an apartment rented forbetween $300 and $500, this same provision of the RentAct provides that "in no event shall the total increasepursuant to this [vacancy allowance provision of the RentAct] be less than one hundred dollars per month."
Special Vacancy Allowance: See "Vacancy Bonus."
Statutory Vacancy Allowance: See "VacancyAllowance."
Sublet: The temporary transfer of a tenant’s legalinterest in an apartment to another person. A tenant whosublets an apartment to another person is the primetenant. The person to whom the apartment is sublet isthe subtenant. In a sublet situation, the prime tenantmust abide by the rent stabilization rules that govern thebuilding owner.
Supplemental Adjustment: A rent increase that hasbeen allowed in certain years in addition to a regularGuideline Rent increases for apartments. Thesupplementary adjustment amount is established for thatguideline year by the New York City or County RentGuidelines Boards based upon the date the lease wassigned, the term of the lease and the county. Alsoknown as the "Low Rent Supplement."
Surcharge: An added charge which is paid by thetenant but not included in the legal regulated rent and is
162 • Glossary & Index

Glossary
not compounded by guidelines adjustments. Examplesof surcharges are: the $5.00 a month charge for an airconditioner that protrudes beyond the window line; theelectrical charge for air conditioners in electrical inclusionbuildings; and for the installation of window guards.
Tax Commission Income and Expense Form (TCIE):An application by building owners to appeal their taxassessments.
Temporary Assistance to Needy Families (TANF): Anincome assistance program set up under the federalPersonal Responsibility and Work OpportunityReconciliation Act of 1996 to replace Aid to Families withDependent Children (AFDC). Under TANF block grantsystem, each state has the authority to determine who iseligible, the level of assistance, and how long it will last.The New York State’s TANF program is called the FamilyAssistance Program (FAP).
Term: The length of time in which a mortgage isexpected to be paid back to the lender; the shorter theterm, the faster the principal must be repaid andconsequently the higher the debt service and vice versa.
Transient Occupancy: Among the criteria that must bemet for hotel rooms, tourist homes, and motor courts tobe exempt from rent regulation is that they are used fortransient occupancy. Whether occupancy is transientdepends on a number of factors, including whetherrates are charged by the day, week, or month, and theproportions of occupants who stay for various lengthsof time.
Upper Manhattan: The area of Manhattan north of 96thStreet on the East Side and 110th Street on the WestSide. See also "Core Manhattan."
Vacancy Allowance: A provision in the Rent RegulationReform Act of 1997 allowing owners of rent stabilizedunits to raise by a certain percentage the legal rent of avacant unit. For an incoming tenant who opts for a two-year lease, the vacancy allowance is 20%. For anincoming tent who opts for a one-year lease, thevacancy allowance is 20% minus the percentagedifference between the RGB’s current guidelines for atwo-year and a one-year lease. Other factors affectthese percentages as well (see also the "VacancyBonus" and the "Special Low Rent Increase.") For the2009-2010 guideline period, the one-year vacancyguideline is 17% (17.5% if heat is provided by the owner)and the two-year guideline is 20%.
Vacancy Bonus: An additional rental increase allowedfor units that become vacant after a long-term tenant hasmoved out. If the prior tenant had been in occupancy atleast for eight years—and thus the unit had not "received"a vacancy allowance during that time—the RentRegulation Reform Act of 1997 permits the landlord tocharge an additional 0.6% for each year since the unitreceived its last vacancy allowance. For example, if (1)the incoming tenant opts for a two-year lease, after (2) theprior tenant had been in occupancy for ten years, then thelandlord can charge the incoming tenant a 20% vacancyallowance (for a two-year lease) plus another 6% (tenyears times 0.6%) for a total increase of 26% over thelegal rent which had been paid by the departing tenant.
Vacancy Decontrol (High-Rent Vacancy Decontrol):A process by which a rent regulated unit becomesderegulated if at the time it next becomes vacant, thelegal rent is $2,000 or greater. If the in-place tenant isrent regulated, vacancy decontrol cannot occur even ifthat in-place tenant’s monthly rent eventually exceeds$2,000. Such decontrol can occur only following thenext vacancy unless the unit is "luxury decontrolled"(See "Luxury Decontrol"). Further, the $2,000 level maybe reached in a variety of ways, including (1) by alreadybeing at or over $2,000 when the next vacancy occurs,(2) reaching the $2,000 level as a result of the next"vacancy allowance," or (3) reaching the $2,000 level asa result of the next "vacancy allowance" coupled withany "1/40th/individual apartment improvement" increase,MCIs or a vacancy bonus.
Vacancy Lease: When a person rents a rent stabilizedapartment for the first time, or, when a new name (notthe spouse or domestic partner) is added to an existinglease, this is a vacancy lease. This written lease is acontract between the owner and the tenant whichincludes the terms and conditions of the lease, thelength of the lease and the rights and responsibilities ofthe tenant and the owner. The Rent Stabilization Lawgives the new tenant (also called the vacancy tenant) thechoice of a one- or two-year lease term. The rent theowner can charge may not be more than the last legalregulated rent plus all increases authorized by the RentStabilization Code, including increases for improvementsto the vacant apartment.
Warranty of Habitability: Real Property Law Section235-b entitles tenants to a livable, safe and sanitaryapartment and building and remedies are specified whenthese conditions are not met.
Housing NYC: Rents, Markets and Trends 2009 • 163

Index
AAdministrative costs, 14, 18-19, 20-21, 24Affordability, 55, 61-65Affordable Housing, 62, 71, 74-77, 79, 86, 156Anti-abandonment programs, 79-80Attorney General, New York State, 71, 77-78, 89
BBillable assessments, 13, 15-16, 21, 24Bronx, 16, 28-32, 34, 36, 38, 50-51, 57, 60, 62,
71-78, 81, 86-87, 90, 160 Brooklyn, 16, 28-32, 34-36, 38, 50-51, 57, 59, 62,
71-78, 81, 86-87, 90, 160
CCalendared, aka “cases reaching trial”, 64Cash assistance, 55, 63, 65Class A multiple dwellings, 79, 95, 156, 159-160Class B multiple dwellings, 95, 156Class Two properties, 13, 15-16, 21, 24;
see also Real estate taxesCommensurate rent adjustment, 20-23;
see also Net operating incomeCommercial banks, 44Commercial income, 28, 36Commercial space, 28, 30-31, 36, 48, 77, 86, 90-91Consumer Price Index (CPI), 14, 20, 22-23, 56-57
comparison with PIOC, 14Contractor Services, 14, 17-19, 21, 24Conversion of properties, 71-72, 77-79, 86-87, 89-91Cooperatives/condominiums, 27, 71, 76-78,
86-87, 89, 91, 156, 161conversions, 71, 77-78, 87, 89, 91new construction, 71, 78RPIE, 27, 161
Cost-to-income ratio, 32-33, 37-38, 160Cost-to-rent ratio, 32, 37-38, 48Cross-sectional, 156
Income and Expense Study, 28-34Mortgage Survey, 44-48
DDebt service, 22, 38, 45-50, 156
ratio, 45-47, 156Decontrol/deregulation, 30, 85, 87-91, 156-157,
159-161, 163Demolition of properties, 71, 80-81, 90Department of Buildings (DOB), 71
Department of Finance, 15, 23-24, 27-40, 50-51, 87, 158, 161
Dept. of Housing Preservation and Development(HPD), 74-80, 85, 91, 156, 158
Discount rate, 43, 157; see also Interest ratesDistressed buildings, 31, 38, 79-80, 157Division of Housing and Community Renewal (DHCR),
23, 29-30, 39, 76, 87-91, 95, 157-162
EEmergency Tenant Protection Act (ETPA), 89, 157-158,
160-161Employment, 55-58, 62, 65; see also UnemploymentEviction Conversion Plans, 77-78, 89Evictions, 55, 64-65, 157; see also Possessions
FFair market rents, 62, 95, 157, 162Family Assistance Program (FAP) 63, 157, 162-163Federal Deposit Insurance Corporation (FDIC),
44, 157Federal Funds Rate, 43, 45, 157; see also Interest ratesFederal Reserve Board (“the Fed”), 43, 45, 157Finance, Insurance and Real Estate (FIRE) sector
employment, (financial industry), 59Fixed rate mortgages, 157421-a tax exemption program, 71, 75-76, 81, 85-
86, 89-91, 156Fuel Cost Adjustment, 157Fuel costs, 13-14, 16-17, 19, 21, 23-24, 30, 36Fuel price, 13-14, 16-17, 23-24
GGross City Product (GCP), 55-56, 65, 157Gross income (rental properties), 27-29, 31-37,
36-37, 157; see also Net Operating Income
HHomeless(ness), 55-56, 64-65High Rent/High Income Decontrol, 87-88, 91; 156
see also Luxury decontrolHigh Rent/Vacancy Decontrol, 85, 87-91;
see also Vacancy DecontrolHotel, 18-19, 77, 95, 156, 158, 161, 163; see also
Rooming house and Single room occupancyPIOC for Hotels, 18-19
Household income, 55, 58-61, 65Housing court actions, 55, 64-65
Index
164 • Glossary & Index

Index
Housing and Vacancy Survey (HVS), 38, 55, 59-61, 65, 71-72, 158, 161
Housing market, 27, 29, 34, 55, 59-60, 71, 74, 77, 85
IIn rem housing, 71, 79-80, 87, 158Income; see Household incomeIncome and Expense (I&E), 23, 27-40, 48, 158, 161Individual apartment improvements, 30, 35, 88-89,
158-159, 163; see also 1/40th increaseInflation, 13-14, 17, 21-22, 33-35, 55-57, 62,
64-65, 160Insurance costs, 13-14, 16, 18-19, 21, 23-24, 30, 36Interest rates, 22, 43-45, 49-51, 156-157
JJ-51 real estate tax benefits, 71, 77-79, 81, 85-86,
89, 91, 158
LLabor Costs, 13-14, 16-17, 19, 21, 23-24, 30Labor market, 56-59; see also EmploymentLabor unions, 16, 23-24Legal rent, 29-30, 88, 157-160, 162-163Loan-to-value ratio (LTV), 43, 45-47, 49-50, 159Lofts, 19, 86, 91, 95, 159
PIOC for lofts, 19Longitudinal, 159
Income and Expense Study, 27, 35-38Mortgage Survey, 43, 49-50
Luxury decontrol, 156, 159, 161, 163; see also High Rent/High Income Decontrol
MMajor Capital Improvement (MCI), 79, 159, 162-163Manhattan, 16, 28, 30-36, 38, 50-51, 57, 60-62,
71-78, 81, 86-90Core, 28, 31-33, 36, 38, 156Upper, 28, 31-32, 36, 38, 163Exclusion Zone, 75-76
Miscellaneous costs, 30-31Mitchell-Lama housing, 76-77, 86, 91Mortgage, 31, 43-51, 62, 76, 86, 156-157, 159, 163
financing (new originations), 43-50foreclosure, 43, 47, 49interest rates, 43-45, 49, 51refinancing, 43, 45-47, 49-50, 51terms, 44-46, 49, 163
NNet operating income (NOI), 20-23, 27, 31-35,
38-39, 45-49, 156, 159commensurate rent adjustment, 21-23
New housing construction, 71-77, 81, 86, 91;see also certificates of occupancy; coop/condo, new construction; permits for new housing
Non-payment filings, 55, 64-65Non-performing loans, 43, 47, 49
O1/40th increase, 156, 158, 163; see also Individual
apartment improvementsOperating and maintenance costs (O&M),
13-14, 20-23, 27, 30-40, 43, 47-49, 157, 159-161
Operating cost ratio, 32-33, 37-38, 48, 160; seealso Cost-to-income ratio and Cost-to-rent ratio
Outer boroughs, 160; see also Bronx; Brooklyn; Queens; Staten Island
Owner-occupied housing, 72, 75, 78
PParts and Supplies costs, 14, 18-19, 21,24Permits for new housing, 71-74, 81Possessions, 65, 157; see also EvictionsPost-war (post-46) buildings, 13-14, 28, 31-32,
36, 60-61, 71-72, 160Pre-war (pre-47) buildings, 13-14, 28, 31-32, 36
60-61, 71-72, 160Preferential rent, 30, 160Price Index of Operating Costs (PIOC), 13-25, 27,
37, 160apartments, 13-23, 27commensurate rent adjustment, 21-23comparison with income and expenses, 27, 37core PIOC, 14, 19-21Hotels, 18-19lofts, 19projections, 20-21
Profitability of rental housing, 22, 32-34, 85, 160; see also Net Operating Income (NOI)
Property taxes, 14; see also Real Estate TaxesPublic housing, 160, 162
QQueens, 16, 28-32, 34-36, 38, 43, 50-51, 57, 59,
62, 71-78, 80-81, 86-87, 90, 160
Housing NYC: Rents, Markets and Trends 2009 • 165

RReal estate taxes, 13-16, 19, 21, 23-24, 30-32, 75-76,
78-81, 85-87, 90-91, 156, 158-161, 163abatements, 15-16, 23-24, 71, 78-79, 81, 86, 158, 160arrears, 79-80assessment, 13, 15-16, 21, 23-24, 40, 75, 79, 161, 163exemptions, 15-16, 23-24, 71, 75-76, 78-79, 81, 85-87, 91, 156, 158foreclosure, 43, 47, 49, 80;
see also In rem housingReal Property Income and Expense forms (RPIE),
27-40, 158, 161Registered rents, 29-30, 158Rehabilitation, 71-72, 74-75, 77-79, 85-86, 89-91,
158, 162Rent control, 60-61, 71-72, 85, 87, 91, 95, 156-162Rent Guidelines Board (RGB), 20-24, 27-32, 34-35,
37-38, 40, 43, 48, 55, 57, 64, 75, 80, 95, 156-163Rent Guideline Orders, 95, 161RGB Rent Index, 29-30, 161Rent Regulation Reform Act (RRRA) of 1993/1997,
35, 87-89, 95, 158, 161-163Rent-to-income ratio, 61Rental market; see Housing MarketRenter-occupied housing, 72Rents, 27-30, 34-36, 39, 48, 59-61
asking rent, 59-60contract rent, 60-61gross rent, 60-61lender reported, 48owner reported, 27-30, 34-36, 39tenant reported, 60-61
Replacement costs, 14, 18-21, 24Rooming houses, 18-19, 95, 156, 161; see also
Hotels and Single Room Occupancy
SSafety Net Assistance (SNA), 63, 161Savings banks, 44, 157Section 8 certificates and vouchers, 62-64, 77, 86,
161-162Service sector employment, 59Shelter Allowance, 162Single room occupancy hotels (SRO), 18-19, 77,
95, 162; see also Hotels and Rooming housesSocial Security, 16, 24, 64, 156Staten Island, 16, 28, 36, 50, 57, 60, 62, , 71-78,
81, 86-87, 90, 160Subdivision of properties, 77, 95
Substantial rehabilitation, 72, 79, 85, 87, 89-91;see also Rehabilitation
TTax incentive programs; see 421-a and J-51Temporary Assistance to Needy Families, 162-163;
see also Family Assistance Program (FAP)UUnemployment insurance, 16, 24Unemployment rate, 55, 57, 65U.S. Department of Housing and Urban
Development (HUD), 61-63, 95, 156,158Utility costs, 13-14, 17, 19, 21, 24, 36, 61-62
VVacancy allowance/increase, 22, 35, 95, 157-158,
162-163 Vacancy and collection losses, 29-30, 43, 47-50,
159Vacancy bonus, 162-163Vacancy decontrol, 85, 87-91, 156, 163Vacancy rate, 59-60, 71-72, 81, 157-158, 161Vacancy lease, 95, 157, 163
WWages/salaries, 16, 55-56, 58-59, 61-62, 65Water/sewer costs, 13, 17, 19, 24Welfare benefits, 63; see also Cash assistanceWelfare reform, 55, 63, 161
166 • Glossary & Index
Index

