housing market update - sanjoseca.gov
TRANSCRIPT
Housing Market UpdateSecond Quarter 2021
Leigh Avenue Seniors Apartment is a transit-oriented infi ll project located at 1690 Southwest Expressway, at the intersection of Leigh Avenue and Southeast Expressway. Built by First Community Housing, the project provides 64 units of affordable senior apartments over 6,750 square
feet of commercial space. All units are reserved for chronically homeless seniors. (Image Courtesy Apartments.com)
Renters must earn $52/hour ($108,960/year) to afford the average effective monthly rent for a 2-bedroom apartment1
Buyers must earn $122/hour ($253,428/year) to afford a median-priced single-family home2
933 residential building permits issued in Q2 2021, 25% of which were for affordable apartments
141 secondary unit / ADU (Accessory Dwelling Units) permits issued in Q2 2021
Average effective rent is $2,4463, up 5.7% QoQ4; overall residential vacancy rate is 6.6%, down 2 pts QoQ
Median single family home price is $1,480,0005, up 4% QoQ
Q2 2021 San José Housing Market
1. Based on Q2 2021 Costar average effective rents; income calculation assumes rents are 30% of income, 40-hour work week and a single-income household; "effective" rents include rent concessions such as free months' rent.2. Based on SCCAOR June 2021 median prices; income calculation assumes monthly payments are 30% of income, 20% down, 2.98% interest rate, 1.1% property tax, 40-hour work week, and a single-income household.3. Based on Costar Average Effective Rents, July 12, 2021.4. QoQ – Quarter over Quarter5. Based on Santa Clara County Association of Realtors (SCCAOR), June 2021.
2San José Housing Market Update: 2021 Quarter 2
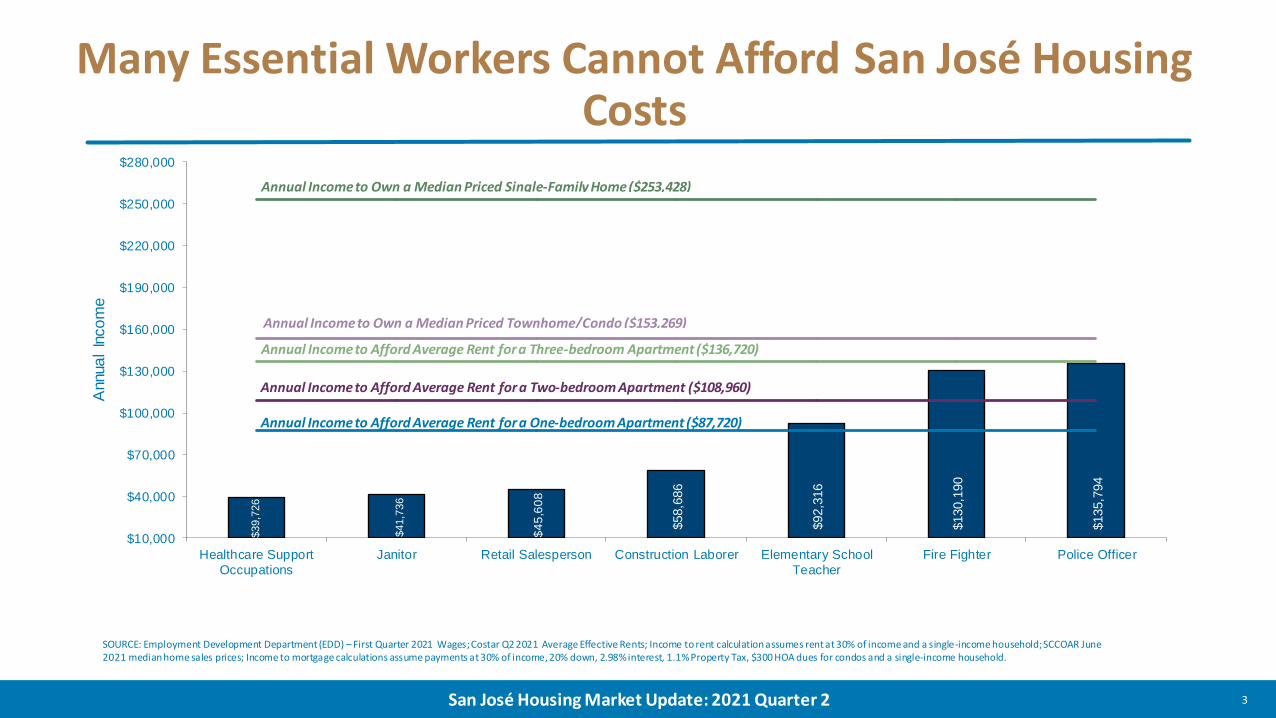
SOURCE: Employment Development Department (EDD) – First Quarter 2021 Wages; Costar Q2 2021 Average Effective Rents; Income to rent calculation assumes rent at 30% of income and a single-income household; SCCOAR June 2021 median home sales prices; Income to mortgage calculations assume payments at 30% of income, 20% down, 2.98% interest, 1.1% Property Tax, $300 HOA dues for condos and a single-income household.
3
Many Essential Workers Cannot Afford San José Housing Costs
San José Housing Market Update: 2021 Quarter 2
$39,7
26
$41,7
36
$4
5,6
08
$58,6
86
$92,3
16
$130,1
90
$135,7
94
$10,000
$40,000
$70,000
$100,000
$130,000
$160,000
$190,000
$220,000
$250,000
$280,000
Healthcare Support
Occupations
Janitor Retail Salesperson Construction Laborer Elementary School
Teacher
Fire Fighter Police Officer
Annua
l In
co
me
Annual Income to Afford Average Rent for a Two-bedroom Apartment ($108,960)
Annual Income to Afford Average Rent for a One-bedroom Apartment ($87,720)
Annual Income to Afford Average Rent for a Three-bedroom Apartment ($136,720)
Annual Income to Own a Median Priced Townhome/Condo ($153,269)
Annual Income to Own a Median Priced Single-Family Home ($253,428)
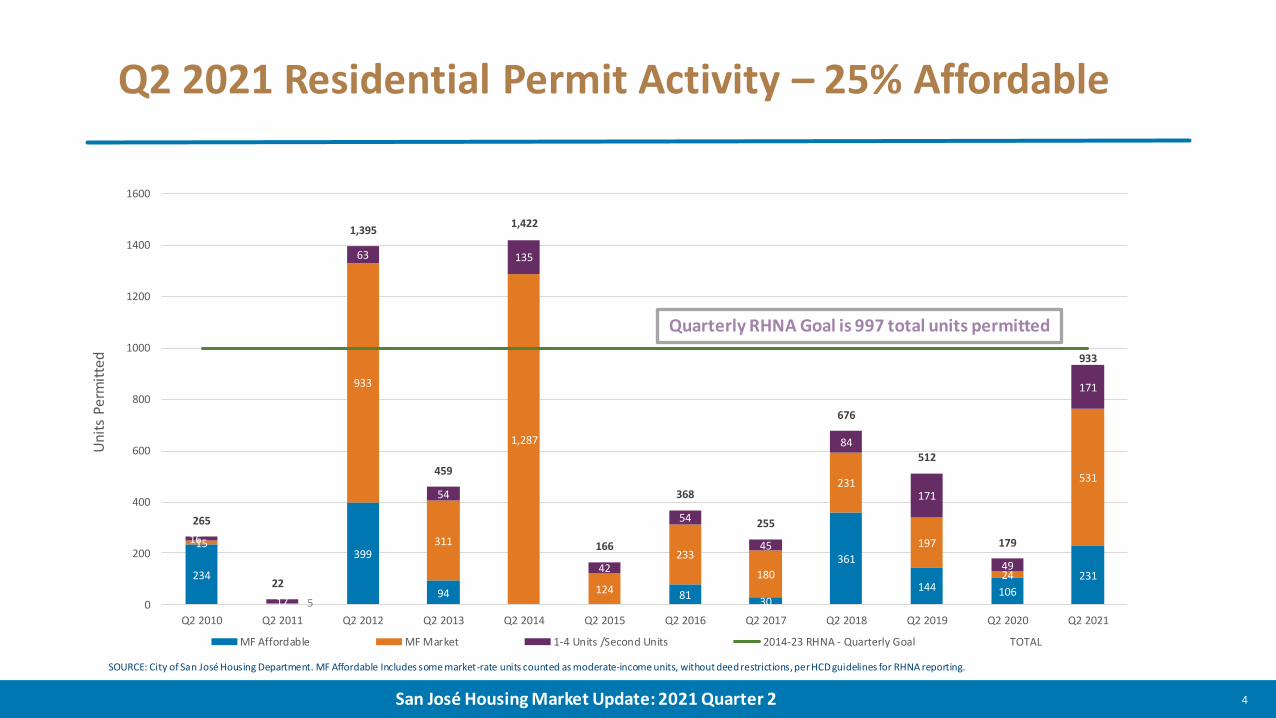
SOURCE: City of San José Housing Department. MF Affordable Includes some market-rate units counted as moderate-income units, without deed restrictions, per HCD guidelines for RHNA reporting.
Quarterly RHNA Goal is 997 total units permitted
4San José Housing Market Update: 2021 Quarter 2
Q2 2021 Residential Permit Activity – 25% Affordable
234
399
94 8130
361
144 106
231
15
5
933
311
1,287
124
233
180
231
197
24
531
16
17
63
54
135
42
54
45
84
171
49
171
265
22
1,395
459
1,422
166
368
255
676
512
179
933
0
200
400
600
800
1000
1200
1400
1600
Q2 2010 Q2 2011 Q2 2012 Q2 2013 Q2 2014 Q2 2015 Q2 2016 Q2 2017 Q2 2018 Q2 2019 Q2 2020 Q2 2021
Uni
ts P
erm
itte
d
MF Affordable MF Market 1-4 Units /Second Units 2014-23 RHNA - Quarterly Goal TOTAL
5
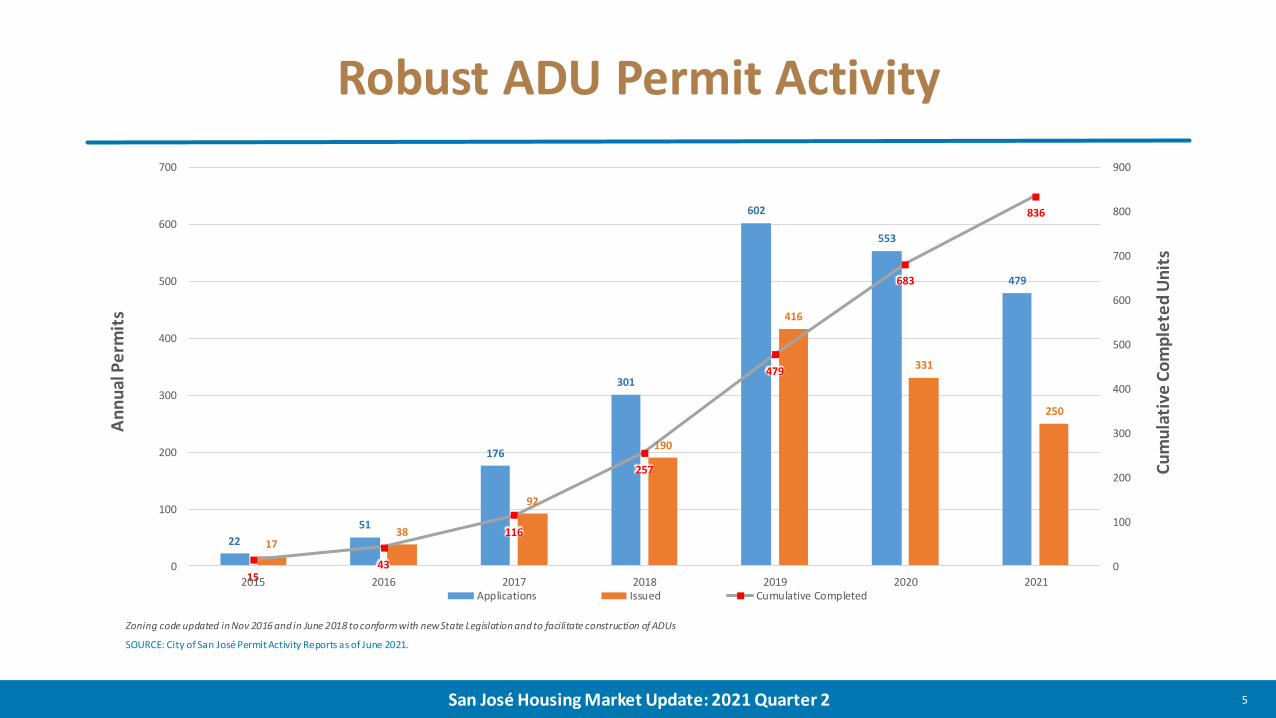
Robust ADU Permit Activity
Zoning code updated in Nov 2016 and in June 2018 to conform with new State Legislation and to facilitate construction of ADUs
SOURCE: City of San José Permit Activity Reports as of June 2021.
San José Housing Market Update: 2021 Quarter 2
22
51
176
301
602
553
479
1738
92
190
416
331
250
1543
116
257
479
683
836
0
100
200
300
400
500
600
700
800
900
0
100
200
300
400
500
600
700
2015 2016 2017 2018 2019 2020 2021
Cu
mu
lati
ve C
om
ple
ted
Un
its
An
nu
al P
erm
its
Applications Issued Cumulative Completed
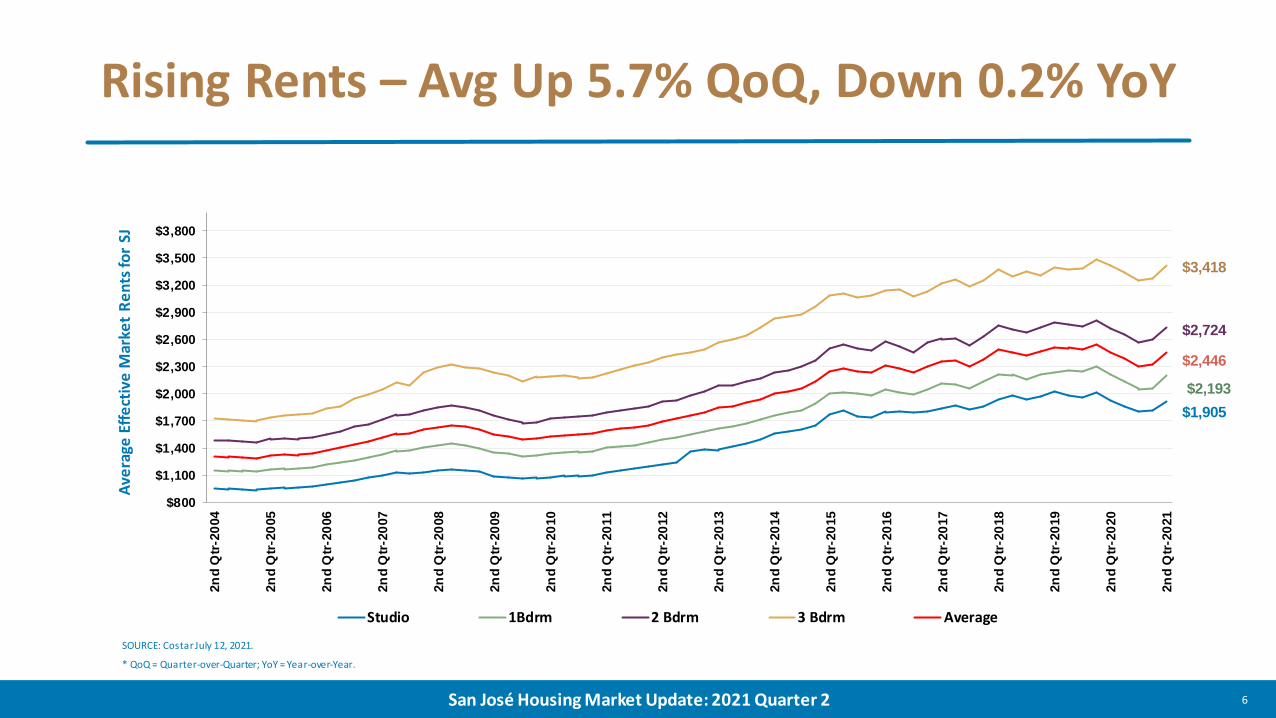
SOURCE: Costar July 12, 2021.
* QoQ = Quarter-over-Quarter; YoY = Year-over-Year.
$1,905
$2,193
$2,724
$3,418
$2,446
6
Rising Rents – Avg Up 5.7% QoQ, Down 0.2% YoY
San José Housing Market Update: 2021 Quarter 2
$800
$1,100
$1,400
$1,700
$2,000
$2,300
$2,600
$2,900
$3,200
$3,500
$3,800
2n
d Q
tr-2
004
2n
d Q
tr-2
005
2n
d Q
tr-2
006
2n
d Q
tr-2
007
2n
d Q
tr-2
008
2n
d Q
tr-2
009
2n
d Q
tr-2
010
2n
d Q
tr-2
011
2n
d Q
tr-2
012
2n
d Q
tr-2
013
2n
d Q
tr-2
014
2n
d Q
tr-2
015
2n
d Q
tr-2
016
2n
d Q
tr-2
017
2n
d Q
tr-2
018
2n
d Q
tr-2
019
2n
d Q
tr-2
020
2n
d Q
tr-2
021
Ave
rage
Eff
ect
ive
Mar
ket
Re
nts
for
SJ
Studio 1Bdrm 2 Bdrm 3 Bdrm Average
SOURCE: Costar July 12, 2021.
.
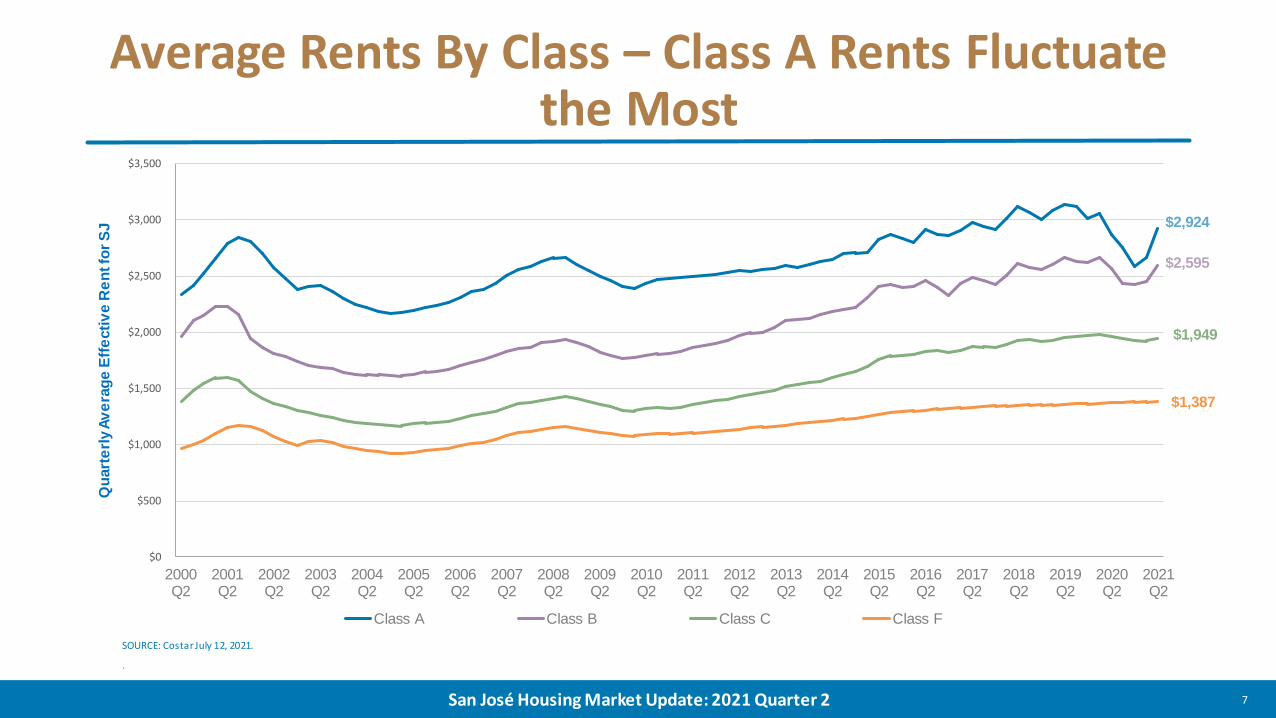
$1,387
$1,949
$2,595
$2,924
7
Average Rents By Class – Class A Rents Fluctuate the Most
San José Housing Market Update: 2021 Quarter 2
$0
$500
$1,000
$1,500
$2,000
$2,500
$3,000
$3,500
2000Q2
2001Q2
2002Q2
2003Q2
2004Q2
2005Q2
2006Q2
2007Q2
2008Q2
2009Q2
2010Q2
2011Q2
2012Q2
2013Q2
2014Q2
2015Q2
2016Q2
2017Q2
2018Q2
2019Q2
2020Q2
2021Q2
Qu
art
erl
y A
ve
rag
e E
ffe
cti
ve
Re
nt fo
r S
J
Class A Class B Class C Class F
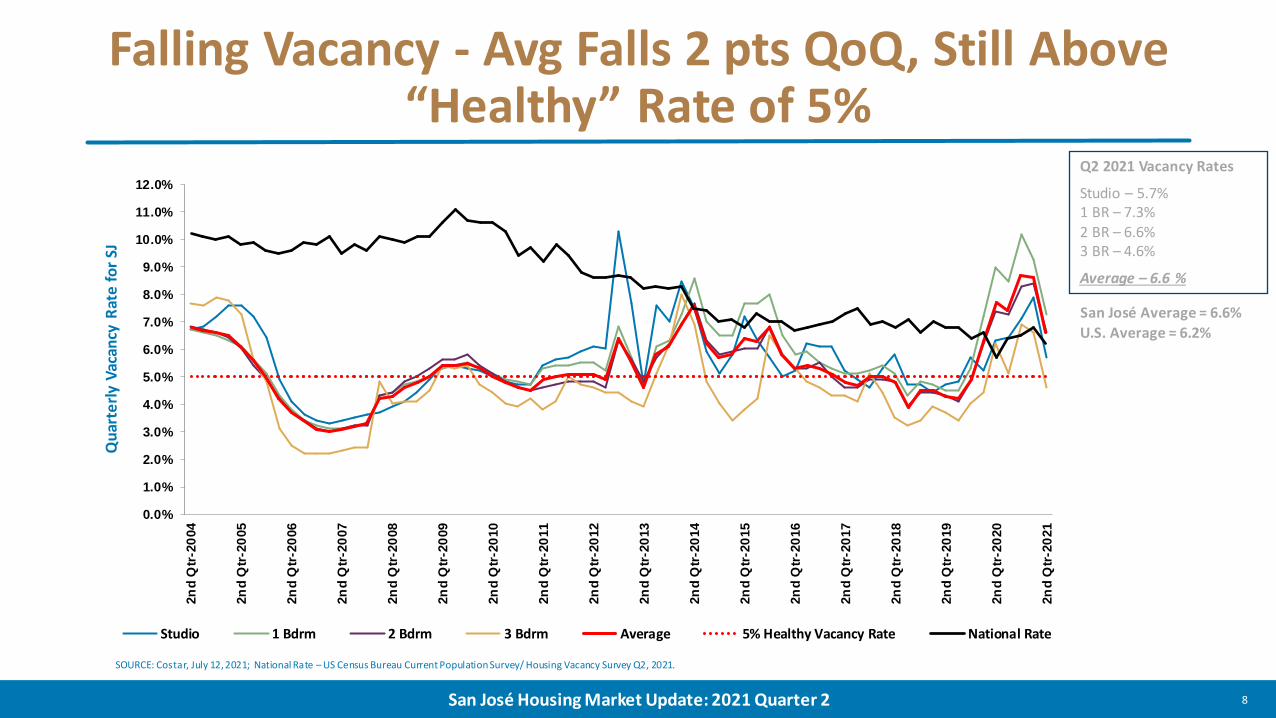
SOURCE: Costar, July 12, 2021; National Rate – US Census Bureau Current Population Survey/ Housing Vacancy Survey Q2, 2021.
Q2 2021 Vacancy Rates
Studio – 5.7%1 BR – 7.3%2 BR – 6.6%3 BR – 4.6%
Average – 6.6 %
U.S. Average = 6.2%
8
Falling Vacancy - Avg Falls 2 pts QoQ, Still Above “Healthy” Rate of 5%
San José Average = 6.6%
San José Housing Market Update: 2021 Quarter 2
0.0%
1.0%
2.0%
3.0%
4.0%
5.0%
6.0%
7.0%
8.0%
9.0%
10.0%
11.0%
12.0%2n
d Q
tr-2
004
2n
d Q
tr-2
005
2n
d Q
tr-2
006
2n
d Q
tr-2
007
2n
d Q
tr-2
008
2n
d Q
tr-2
009
2n
d Q
tr-2
010
2n
d Q
tr-2
011
2n
d Q
tr-2
012
2n
d Q
tr-2
013
2n
d Q
tr-2
014
2n
d Q
tr-2
015
2n
d Q
tr-2
016
2n
d Q
tr-2
017
2n
d Q
tr-2
018
2n
d Q
tr-2
019
2n
d Q
tr-2
020
2n
d Q
tr-2
021
Qu
arte
rly
Vac
ancy
Rat
e f
or
SJ
Studio 1 Bdrm 2 Bdrm 3 Bdrm Average 5% Healthy Vacancy Rate National Rate
SOURCE: Costar July 12, 2021
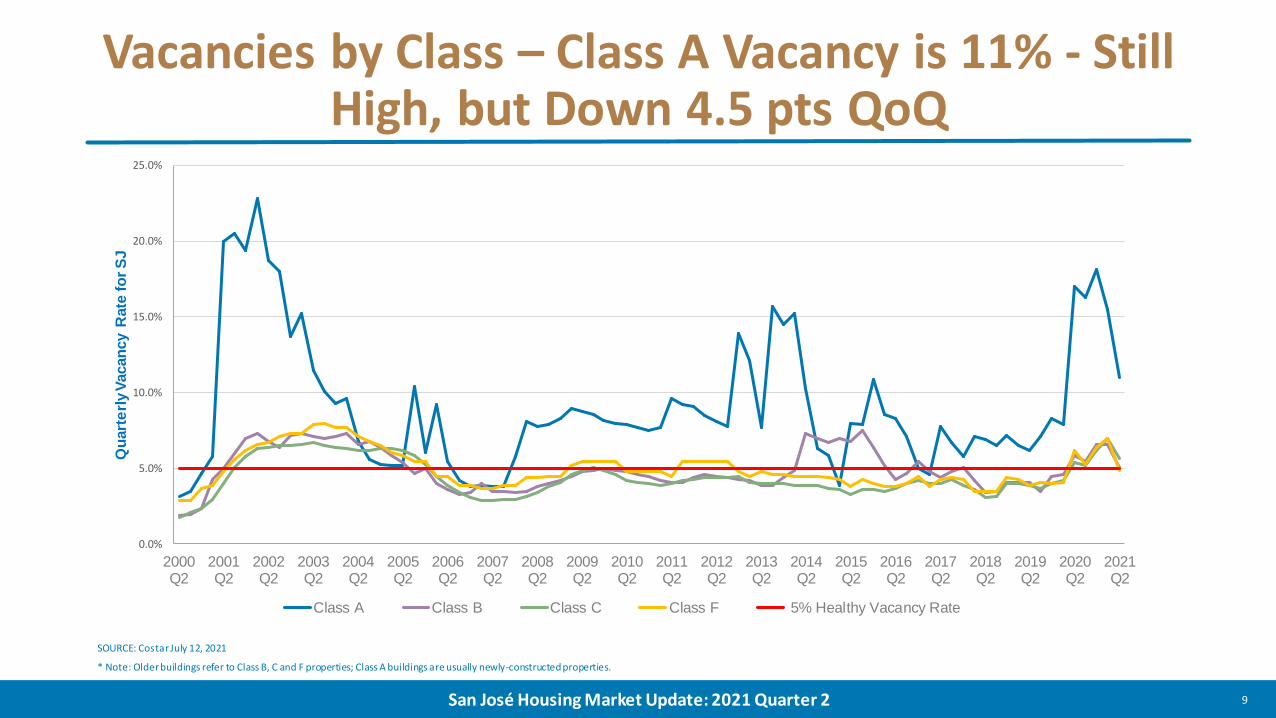
* Note: Older buildings refer to Class B, C and F properties; Class A buildings are usually newly-constructed properties.
9
Vacancies by Class – Class A Vacancy is 11% - Still High, but Down 4.5 pts QoQ
San José Housing Market Update: 2021 Quarter 2
0.0%
5.0%
10.0%
15.0%
20.0%
25.0%
2000Q2
2001Q2
2002Q2
2003Q2
2004Q2
2005Q2
2006Q2
2007Q2
2008Q2
2009Q2
2010Q2
2011Q2
2012Q2
2013Q2
2014Q2
2015Q2
2016Q2
2017Q2
2018Q2
2019Q2
2020Q2
2021Q2
Qu
art
erl
y V
acan
cy
Rate
fo
r S
J
Class A Class B Class C Class F 5% Healthy Vacancy Rate
SOURCE: Santa Clara County Association of Realtors June 2021.
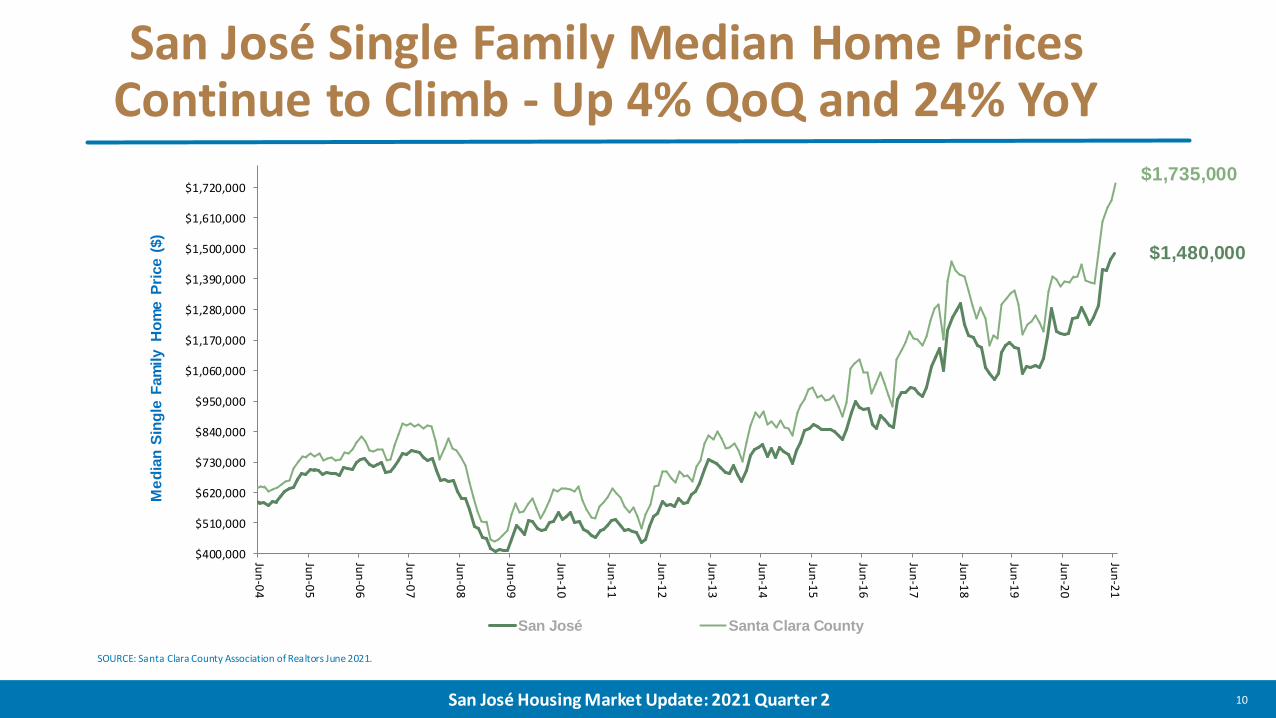
$1,735,000
$1,480,000
10
San José Single Family Median Home Prices Continue to Climb - Up 4% QoQ and 24% YoY
San José Housing Market Update: 2021 Quarter 2
$400,000
$510,000
$620,000
$730,000
$840,000
$950,000
$1,060,000
$1,170,000
$1,280,000
$1,390,000
$1,500,000
$1,610,000
$1,720,000
Jun
-04
Jun
-05
Jun
-06
Jun
-07
Jun
-08
Jun
-09
Jun
-10
Jun
-11
Jun
-12
Jun
-13
Jun
-14
Jun
-15
Jun
-16
Jun
-17
Jun
-18
Jun
-19
Jun
-20
Jun
-21
Me
dia
n S
ing
le F
am
ily
Ho
me
Pri
ce
($)
San José Santa Clara County
SOURCE: Santa Clara County Association of Realtors June 2021.
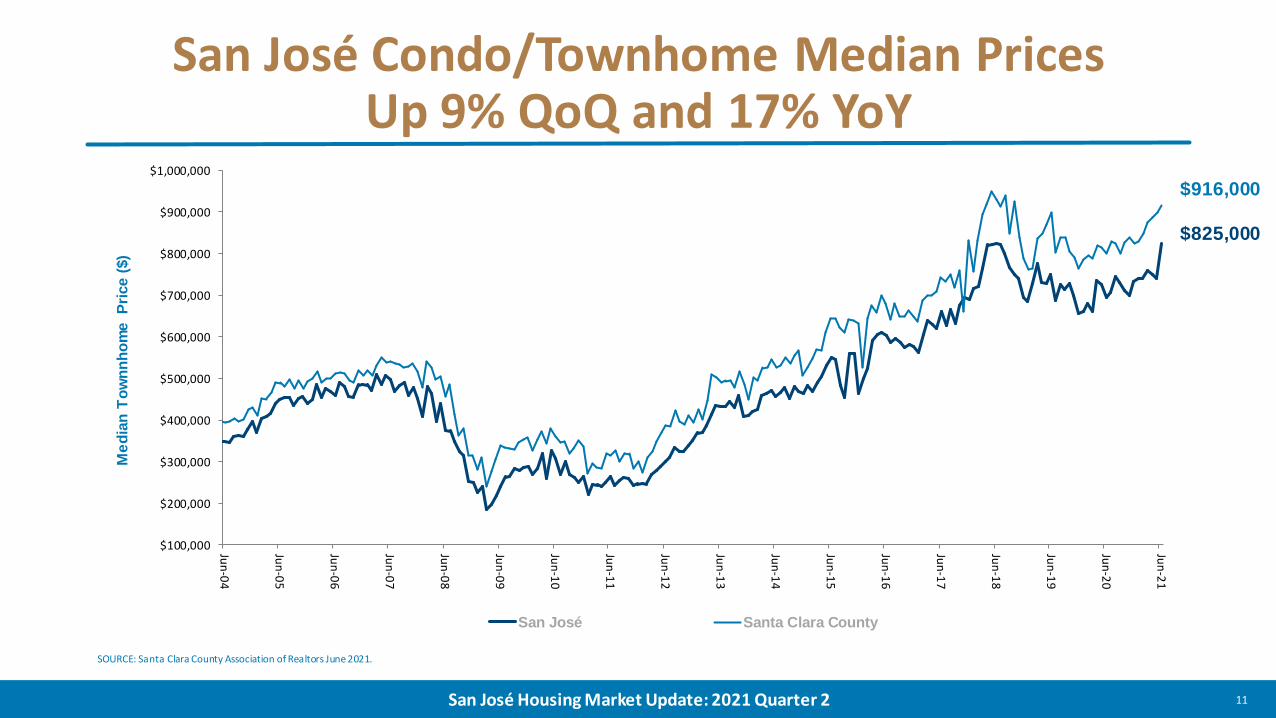
$825,000
$916,000
San José Condo/Townhome Median PricesUp 9% QoQ and 17% YoY
11San José Housing Market Update: 2021 Quarter 2
$100,000
$200,000
$300,000
$400,000
$500,000
$600,000
$700,000
$800,000
$900,000
$1,000,000
Jun
-04
Jun
-05
Jun
-06
Jun
-07
Jun
-08
Jun
-09
Jun
-10
Jun
-11
Jun
-12
Jun
-13
Jun
-14
Jun
-15
Jun
-16
Jun
-17
Jun
-18
Jun
-19
Jun
-20
Jun
-21
Me
dia
n T
ow
nn
ho
me
P
rice
($)
San José Santa Clara County
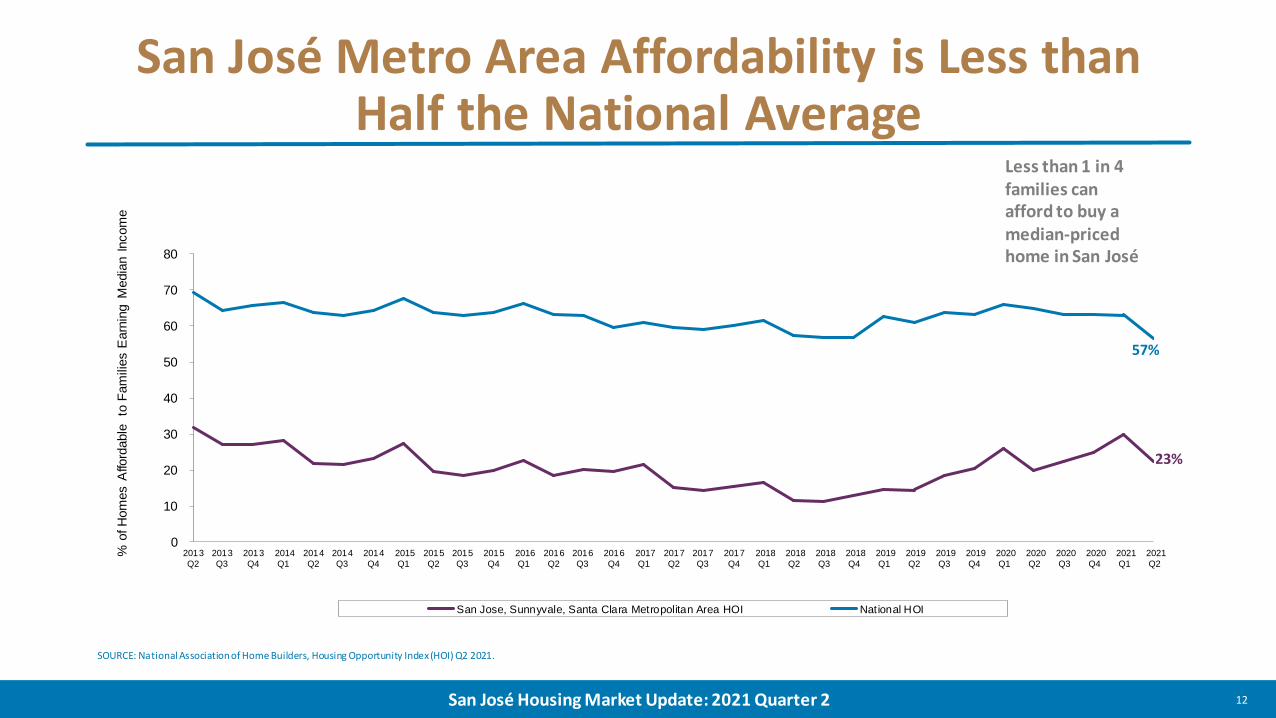
SOURCE: National Association of Home Builders, Housing Opportunity Index (HOI) Q2 2021.
San José Metro Area Affordability is Less than Half the National Average
San José Housing Market Update: 2021 Quarter 2 12
Less than 1 in 4 families can afford to buy a median-priced home in San José
57%
23%
0
10
20
30
40
50
60
70
80
2013
Q2
2013
Q3
2013
Q4
2014
Q1
2014
Q2
2014
Q3
2014
Q4
2015
Q1
2015
Q2
2015
Q3
2015
Q4
2016
Q1
2016
Q2
2016
Q3
2016
Q4
2017
Q1
2017
Q2
2017
Q3
2017
Q4
2018
Q1
2018
Q2
2018
Q3
2018
Q4
2019
Q1
2019
Q2
2019
Q3
2019
Q4
2020
Q1
2020
Q2
2020
Q3
2020
Q4
2021
Q1
2021
Q2
% o
f H
om
es A
fford
able
to
Fam
ilies E
arn
ing M
edia
n I
ncom
e
San Jose, Sunnyvale, Santa Clara Metropolitan Area HOI National HOI
SOURCE: Santa Clara County Association of Realtors June 2021.
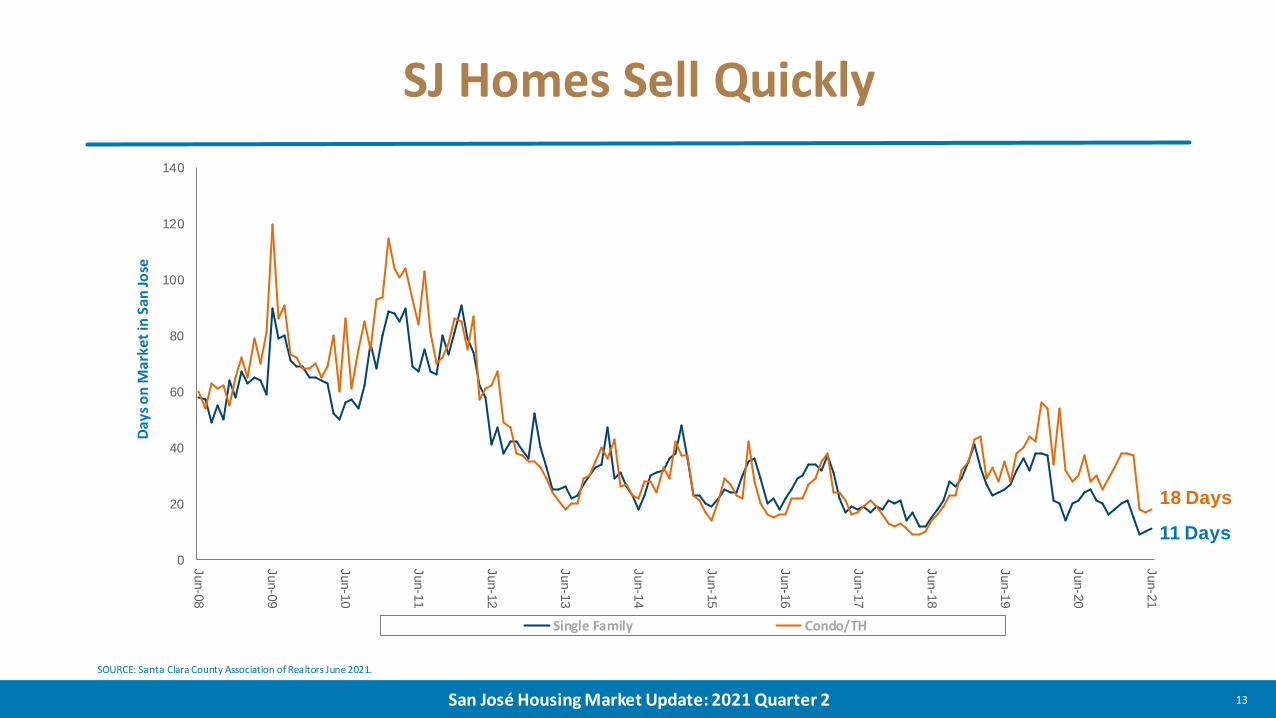
18 Days
11 Days
SJ Homes Sell Quickly
San José Housing Market Update: 2021 Quarter 2 13
0
20
40
60
80
100
120
140
Jun-0
8
Jun-0
9
Jun-1
0
Jun-1
1
Jun-1
2
Jun-1
3
Jun-1
4
Jun-1
5
Jun-1
6
Jun-1
7
Jun-1
8
Jun-1
9
Jun-2
0
Jun-2
1
Day
s o
n M
arke
t in
San
Jose
Single Family Condo/TH
SOURCE: Santa Clara County Association of Realtors June 2021
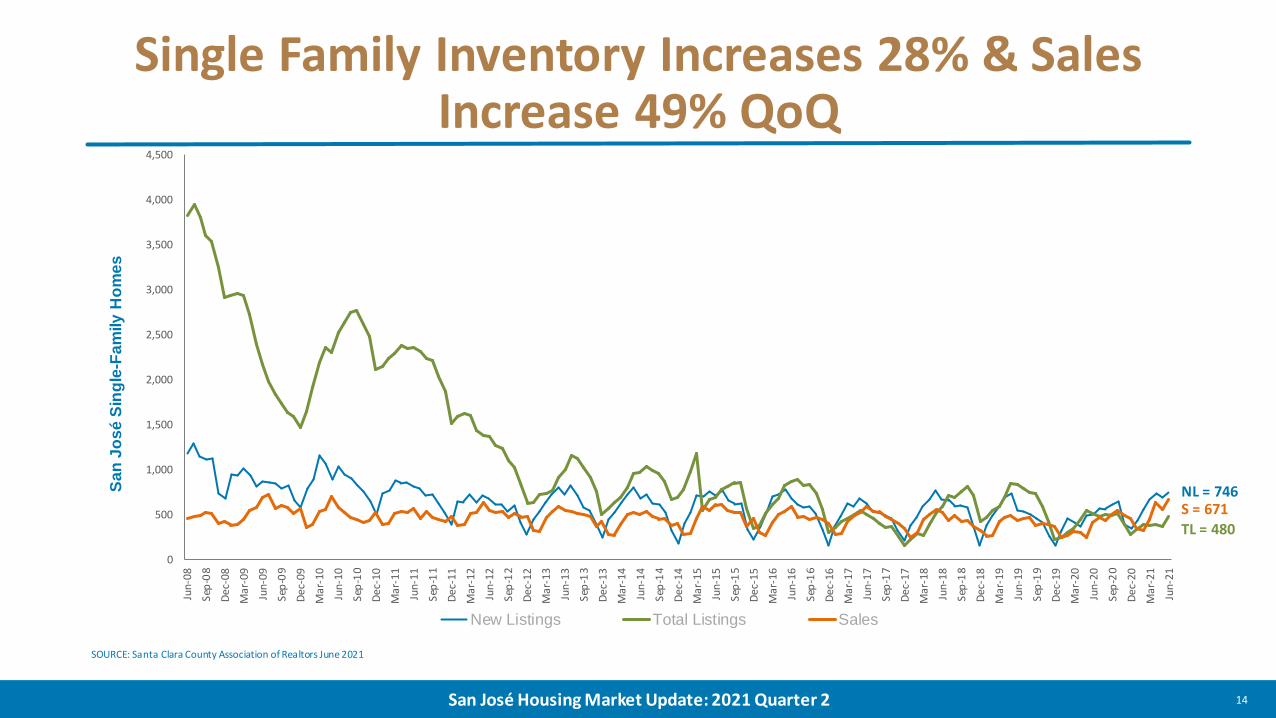
S = 671
TL = 480
NL = 746
Single Family Inventory Increases 28% & Sales Increase 49% QoQ
San José Housing Market Update: 2021 Quarter 2 14
0
500
1,000
1,500
2,000
2,500
3,000
3,500
4,000
4,500
Jun
-08
Sep
-08
Dec
-08
Mar
-09
Jun
-09
Sep
-09
Dec
-09
Mar
-10
Jun
-10
Sep
-10
Dec
-10
Mar
-11
Jun
-11
Sep
-11
Dec
-11
Mar
-12
Jun
-12
Sep
-12
Dec
-12
Mar
-13
Jun
-13
Sep
-13
Dec
-13
Mar
-14
Jun
-14
Sep
-14
Dec
-14
Mar
-15
Jun
-15
Sep
-15
Dec
-15
Mar
-16
Jun
-16
Sep
-16
Dec
-16
Mar
-17
Jun
-17
Sep
-17
Dec
-17
Mar
-18
Jun
-18
Sep
-18
Dec
-18
Mar
-19
Jun
-19
Sep
-19
Dec
-19
Mar
-20
Jun
-20
Sep
-20
Dec
-20
Mar
-21
Jun
-21
Sa
n J
os
é S
ing
le-F
am
ily
Ho
me
s
New Listings Total Listings Sales
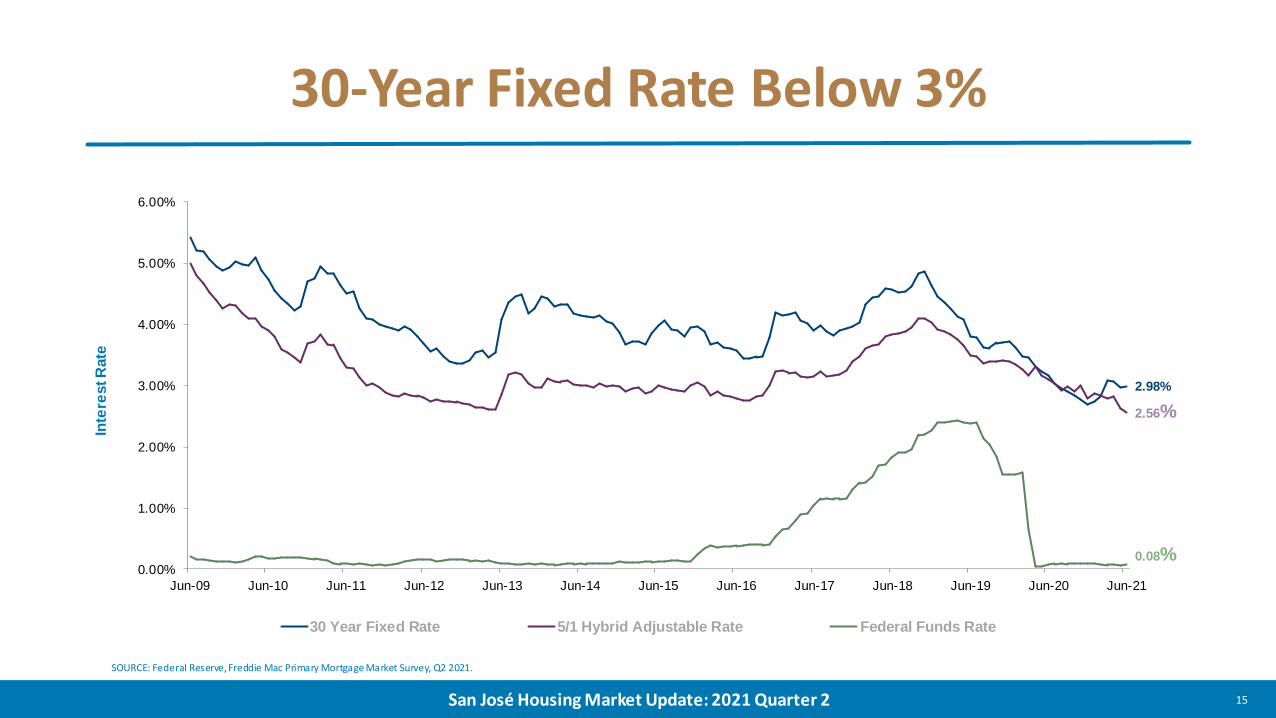
SOURCE: Federal Reserve, Freddie Mac Primary Mortgage Market Survey, Q2 2021.
2.98%
0.08%
2.56%
30-Year Fixed Rate Below 3%
San José Housing Market Update: 2021 Quarter 2 15
0.00%
1.00%
2.00%
3.00%
4.00%
5.00%
6.00%
Jun-09 Jun-10 Jun-11 Jun-12 Jun-13 Jun-14 Jun-15 Jun-16 Jun-17 Jun-18 Jun-19 Jun-20 Jun-21
Inte
rest R
ate
30 Year Fixed Rate 5/1 Hybrid Adjustable Rate Federal Funds Rate
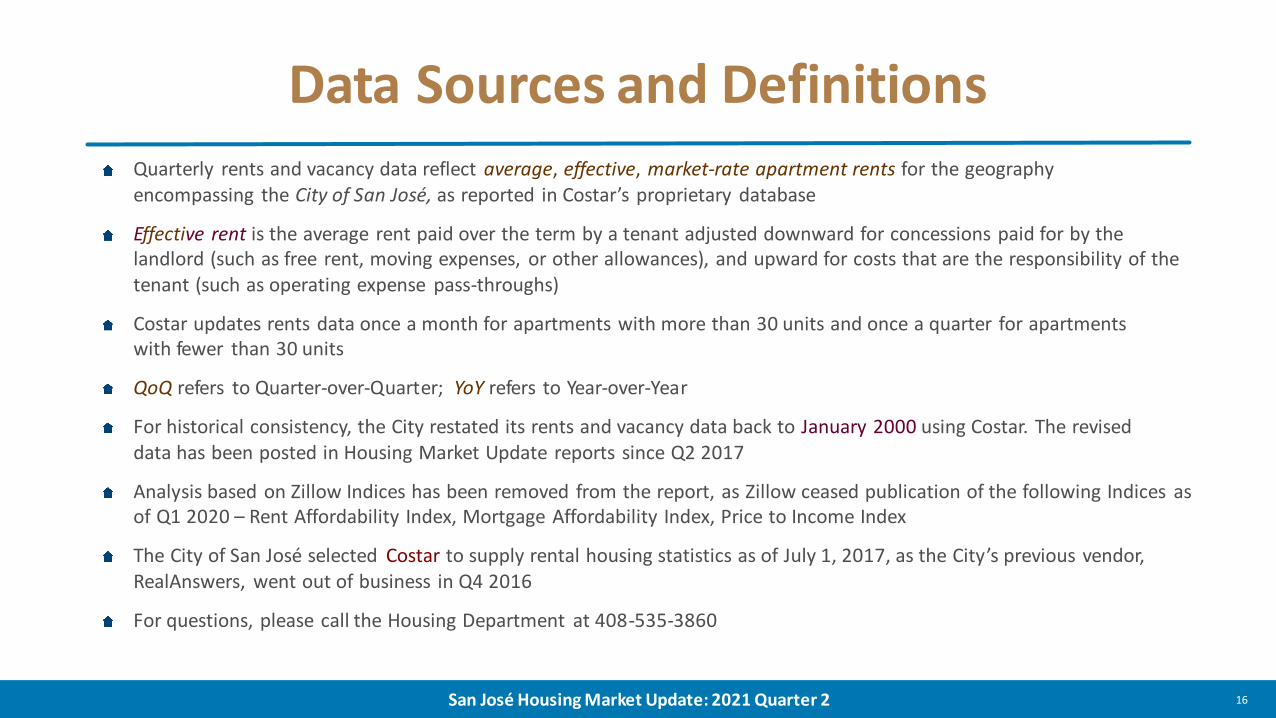
Quarterly rents and vacancy data reflect average, effective, market-rate apartment rents for the geography encompassing the City of San José, as reported in Costar’s proprietary database
Effective rent is the average rent paid over the term by a tenant adjusted downward for concessions paid for by the landlord (such as free rent, moving expenses, or other allowances), and upward for costs that are the responsibility of the tenant (such as operating expense pass-throughs)
Costar updates rents data once a month for apartments with more than 30 units and once a quarter for apartments with fewer than 30 units
QoQ refers to Quarter-over-Quarter; YoY refers to Year-over-Year
For historical consistency, the City restated its rents and vacancy data back to January 2000 using Costar. The revised data has been posted in Housing Market Update reports since Q2 2017
Analysis based on Zillow Indices has been removed from the report, as Zillow ceased publication of the following Indices as of Q1 2020 – Rent Affordability Index, Mortgage Affordability Index, Price to Income Index
The City of San José selected Costar to supply rental housing statistics as of July 1, 2017, as the City’s previous vendor, RealAnswers, went out of business in Q4 2016
For questions, please call the Housing Department at 408-535-3860
Data Sources and Definitions
San José Housing Market Update: 2021 Quarter 2 16