housing association operational efficiency
TRANSCRIPT

1
State of the Sector
Housing association operational efficiency 2008/09 to 2014/15

Housing association operational efficiency
2008/09 to 2014/15
2
ContentsExecutive summary .................................................................................................... 3
Introduction ................................................................................................................ 5
Section one: housing management ........................................................................... 8
Section two: repairs and maintenance .................................................................... 13
Section three: overhead costs ................................................................................. 20
Section four: customer satisfaction ........................................................................ 21
Conclusions ............................................................................................................... 24
Appendix ................................................................................................................... 25

Housing association operational efficiency
2008/09 to 2014/15
3
Executive summaryHousing associations reinvest any surplus they generate back into housing and housebuilding. This means that driving efficiency in their operations and delivery is critical, not for shareholder profits but rather for the delivery of their social mission through increased and ongoing long term investment in housing.
This joint research project between the National Housing Federation and HouseMark makes use of HouseMark member data of over 250 English housing associations to explore how the sector has performed across a range of efficiency measures over time. In doing so, it aims to:
1. Present robust sector performance data in order to improve transparency and understanding.
2. Support future business planning across the sector by providing aggregate performance information.
3. Widen the current efficiency debate by including a range of performance measures covering both inputs and outputs.
Operational efficiency can be defined by the relationship between inputs and outputs. Costs are key inputs but they do not capture the full efficiency picture, as it is possible to keep costs (inputs) the same and become more operationally efficient, depending on what happens to outputs such as rent arrears levels and customer satisfaction. A useful and informed discussion on efficiency can only take place when both sides of the efficiency equation are considered, and therefore this report will examine both.
Key findings
1. Overheads: overheads as a percentage of adjusted turnover have reduced steadily over the period, from 13.6% at the median in 2008/09 to 11.8% in 2014/15.
2. Housing management: between 2008/09 and 2014/15, at the median point there have been real terms reductions in the cost per property of many key housing management functions. Cost per property of total housing management reduced in real terms by 0.6% at the median.
3. Rent arrears and collection: within the context of a marginal reduction in overall housing management costs, the real terms cost per property of rent arrears and collection has increased since 2011/12, while rent arrears levels of current tenants have decreased steadily across the period. This suggests housing associations have channelled more resources into rent collection in order to prevent tenants falling into arrears.
4. Tenant satisfaction: tenant satisfaction has stayed very stable between 2011/12 and 2014/15, with one measure showing an increase in satisfaction, and the others showing minor increases and decreases.
5. Repairs and maintenance: costs per property of responsive repairs have reduced substantially in real terms between 2008/09 and 2014/15 (12.1% reduction at the median point). There has been a 3.7% decrease in the number of calendar days taken to complete repairs on behalf of tenants, and a minor decrease in tenant satisfaction with the way their provider deals with repairs from 83.2% in 2011/12 and 82.3% in 2014/15 (no data available pre-2011/12).
6. Energy efficiency: there has been an increase in the energy efficiency of housing associations’ stock across the period 2008/09 and 2014/15, as measured by housing associations’ average SAP rating, with an increase of 3.5 points at the median. There has also been a large increase over the period 2008/09 and 2014/15 in homes which meet the Decent Homes Standard, in line with the Decent Homes programme.
Housing association operational efficiency
2008/09 to 2014/15
4
Conclusions
• Long term trends in key cost areas such as responsive repairs, maintenance and housing management show that median real terms cost per property have reduced. The real terms reduction in housing management cost per property is significantly smaller in magnitude than in other aspects of housing association operations. This appears primarily driven by increased costs of rent arrears and collection, and lettings since 2011/12. The overall cost picture, when combined with continued high customer satisfaction, suggests that housing associations have maintained high service standards in their core operations while reducing many key costs.
• Comparing and contrasting the efficiency of associations across the sector is a difficult task due to the number of variables which drive performance differentials. Location is a particularly important factor to consider as the local economy, housing market and customer base will significantly influence the services required and the cost of delivery.
• There is no clear relationship between operational efficiency and organisation size. As associations continue to explore strategies for improving efficiency and capacity, it is important to consider the full range of options available, rather than a narrow focus on size and merger activity.
• Housing associations remain sensitive to changes in government policy, particularly with regards to income and regulation. Performance data indicates that they have a track record of adapting to changes in the external environment in order, while delivering positive outcomes for tenants in line with their organisational missions.

Housing association operational efficiency
2008/09 to 2014/15
5
Housing associations have a long history of combining public and private resources to meet their organisational missions, reinvesting any surplus they generate back into housing and the delivery of new homes. This means that driving efficiency in their operations is critical, not for shareholder profits but rather for the delivery of their social mission via increased and ongoing long-term investment in housing.
For a number of years a large number of English housing associations have been voluntarily submitting data to HouseMark in order to independently benchmark their performance. By doing so they are able to communicate to key stakeholders, such as tenants and lenders, how the organisation is performing across a range of performance indicators. Crucially this also allows
informed decisions to be made regarding priorities and plans for the future, as resources can be focused on areas identified as requiring improvement.
This joint research project between the National Housing Federation and HouseMark makes use of HouseMark member data of over 250 English housing associations to explore how the sector has performed across a range of efficiency measures over time. In doing so, it aims to:
1. Present robust sector performance data in order to improve transparency and understanding.
2. Support future business planning across the sector by providing aggregate performance information.
3. Widen the current efficiency debate by including a range of performance measures covering both inputs and outputs.
Introduction
The four key efficiency headings used in this report cover crucial functions of housing associations. As operational efficiency is defined by the relationship between inputs and outputs, a useful and informed discussion on efficiency can only take place when both the input and output sides of this ‘efficiency equation’ are considered. The following measures therefore examine both inputs and outputs:
Housing management is the core function of housing associations and this section includes input measures such as the cost per property of housing management alongside important output measures such as the time taken to re-let properties and the level of current tenants’ rent arrears.
Repairs and maintenance represent an area of significant cost to housing associations and are services which are of vital importance to tenants. Measures considered here range from the cost per property of responsive repairs to customer satisfaction with the repairs service provided.
Overhead costs refer to what are generally considered to be ‘back office’ functions. This includes functions such as finance, IT and HR. The right level of investment in this area is crucial to effectively support frontline activities. ‘Overheads as a percentage of adjusted turnover’ is used as it provides a common measure of activity across the whole business and between different types of organisation.
Customer satisfaction is an important way of gauging the quality of services provided to tenants and is therefore included in this report as a key output measure.
Key efficiency measures
Housing association operational efficiency
2008/09 to 2014/15
6
HouseMark are the market leaders in providing business intelligence services to housing providers, enabling them to compare key metrics with their peers to inform strategic decisions around increasing their operational efficiency and effectiveness. This means that HouseMark have an extensive database of both input and output measures for around 250 English housing associations in any given year.
Using standard activity definitions and consistent apportionment rules, the data is subject to a rigorous validation and quality assurance process
to ensure data integrity. However, it is important to be clear that like all datasets in this field, it does not cover every English housing association. For this reason, it is anticipated that trends over time rather than exact figures will be of most value, as trends are more able to provide indications as to the direction of travel of the sector as a whole.
The data used for this report runs from 2008/09 to 2014/15. Between 2008/09 and 2014/15, HouseMark received submissions from 443 English housing associations to its core benchmarking service. For the analysis of this panel data, a decision was made to use an unbalanced panel. For an explanation of what an unbalanced panel is, and the rationale for its use, please see the appendix.
Methodology
Property types covered by the key efficiency measuresResponsive repairs, void works, major works and cyclical maintenance cost per property measures cover general needs housing, housing for older people and supported housing. Housing management cost per property measures cover general needs housing and housing for older people.
Cost inflation All costs discussed in this report are in real terms, with the Consumer Price Index (CPI) used as the measure of inflation, following the lead of the Office for National Statistics (ONS). September CPI rates are used to inflate the data, as September is the midpoint of the financial year, and using this formula, costs are shown in September 2014 prices (the midpoint of 2014/15).
It is important to note that between the financial years 2008/09 and 2014/15, the measure of inflation which was used for rent setting within the English housing association sector was the Retail Price Index (RPI). While the CPI and the RPI are highly correlated, the greater growth in the RPI between 2008/09 and 2014/15 means an analysis which used the RPI as its measure of inflation would find greater real terms reductions across all of the cost measures included in this report. For instance, using the RPI as the measure of inflation would find that total housing management costs per property (including overheads) have reduced by 2.6% in real terms between 2008/09 and 2014/15, as opposed to 0.6% over the period using CPI as the measure of inflation.
Notes on data

Housing association operational efficiency
2008/09 to 2014/15
7
Variation in costsMany of the following charts around costs per property of housing activities show a significant gap between the lower and upper quartiles with regards to the total housing management cost per property. Homes and Communities Agency (HCA) research in 20121 found that some of the factors which were significant in explaining cost variability were:
• Geography
• Regional wages
• The proportion of supported housing/older people stock an organisation holds
• Whether an organisation is a recent Large Scale Voluntary Transfer (LSVT)
Stock condition, a factor without comparable data at individual housing association level, can also be expected to increase cost variation. Accounting and controlling for these very real and inherent differences between housing associations and their homes is beyond the scope of this report, but this diversity is essential to bear in mind when looking at housing association operational efficiency.
Use of the medianThe majority of the analysis is carried out using quartiles, which split the data into four parts based on the range of results. Note that this means that the median (mid-point) rather than the mean average is used. An explanation of quartiles and the difference between median and mean can be found in the appendix.
Difference between percentage changes and percentage point differencesDuring this report we use both percentage changes and percentage point differences. These are not synonymous. For an explanation of the distinction, please refer to the appendix.
ApportionmentHouseMark collects operating costs for each organisation participating in the benchmark. The operating costs submitted for benchmarking must match the operating costs noted in published accounts and/or the Annual Accounts (FVA) return. If they do not, the participant must explain why they are different. This gives HouseMark the ability to ensure that costs are accounted for in full and apportioned consistently for all housing associations. For more detail on this, please see the appendix.

Housing association operational efficiency
2008/09 to 2014/15
8
Housing managementThere are five activities which comprise housing management: antisocial behaviour (ASB), lettings, rent arrears & collection, resident involvement, tenancy management.
Costs per property of housing management (including overheads): quartilesThe median real terms cost per property of housing management (including overheads) has reduced by 0.6% between 2008/09 and 2014/15.
Section one: housing management
Cost per property - total housing management (includes overheads)
quartile 1
median
quartile 3
£300
£400
£500
£600
£700
2008/2009 2009/2010 2010/2011 2011/2012 2012/2013 2013/2014 2014/2015
£500 £497
Source: HouseMark benchmarking

Housing association operational efficiency
2008/09 to 2014/15
9
Looking at lettings and rent arrears & collection, both components saw minor reductions in real terms costs between 2008/09 and 2011/12. However, there have been real terms increases in both measures since. Real terms cost of rent arrears & collection increased by 11.9% at the median between 2011/12 and 2014/15. Real terms cost of lettings increased by 5.0% at the median over the same period.
The increased concentration of resources on the rent arrears & collection element of housing management services between 2011/12 and 2014/15 appears consistent with housing associations’ response to the challenge of welfare reform. This agenda, introduced through the
Welfare Reform Act 2012, represents a significant risk to core housing association income. With rental income central to housing associations’ business models, housing associations have sought to invest greater resource in effective mitigation strategies. This includes new processes and support systems to prepare tenants and to ensure rent collection remains strong.
Minimising void costs is an important way to maximise rental income. The increase in real terms costs of lettings between 2011/12 and 2014/15 therefore appears consistent with the above picture of associations taking steps to maintain rental income levels.
Components of housing management - median cost per property
rent arrears & collection
tenancy management
resident involvement
lettings
anti-social behaviour
2008/2009 2009/2010 2010/2011 2011/2012 2012/2013 2013/2014 2014/2015£40
£60
£80
£100
£120
£140
£160
Source: HouseMark benchmarking
Cost per property of housing management (including overheads): componentsWhen looking at the trend in real terms costs of the five components of housing management
between 2008/09 and 2014/15 (ASB, lettings, rent arrears and collection, tenancy management, resident involvement), it can be seen that the cost of two have increased (lettings and rent arrears & collection) and three have decreased (ASB, tenancy management, resident involvement).
Housing association operational efficiency
2008/09 to 2014/15
10
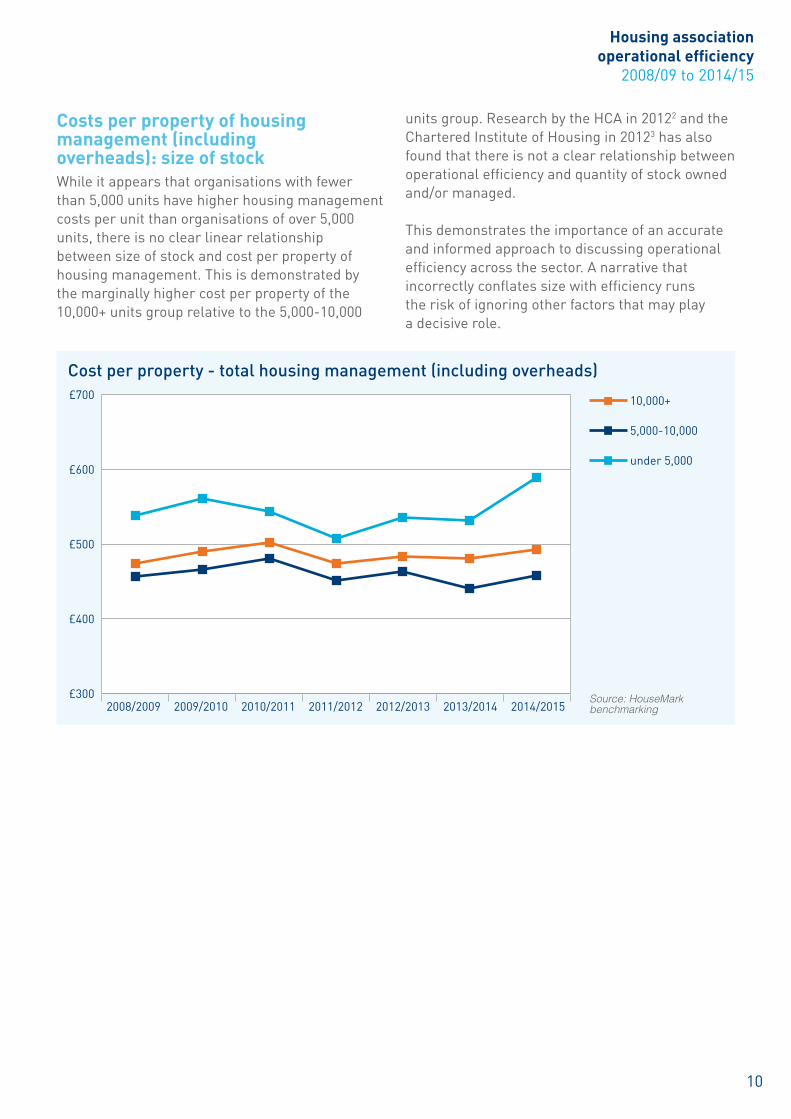
Costs per property of housing management (including overheads): size of stockWhile it appears that organisations with fewer than 5,000 units have higher housing management costs per unit than organisations of over 5,000 units, there is no clear linear relationship between size of stock and cost per property of housing management. This is demonstrated by the marginally higher cost per property of the 10,000+ units group relative to the 5,000-10,000
units group. Research by the HCA in 20122 and the Chartered Institute of Housing in 20123 has also found that there is not a clear relationship between operational efficiency and quantity of stock owned and/or managed.
This demonstrates the importance of an accurate and informed approach to discussing operational efficiency across the sector. A narrative that incorrectly conflates size with efficiency runs the risk of ignoring other factors that may play a decisive role.
Cost per property - total housing management (including overheads)
£300
£400
£500
£600
£700
2008/2009 2009/2010 2010/2011 2011/2012 2012/2013 2013/2014 2014/2015
10,000+
5,000-10,000
under 5,000
Source: HouseMark benchmarking
Housing association operational efficiency
2008/09 to 2014/15
11
Costs per property of housing management (including overheads): geographyHousing management costs per property in London are consistently £200 higher than in other parts of the country. This is a function of higher wage levels and demonstrates the importance of considering sector performance and efficiency within the context of local economies and housing markets.
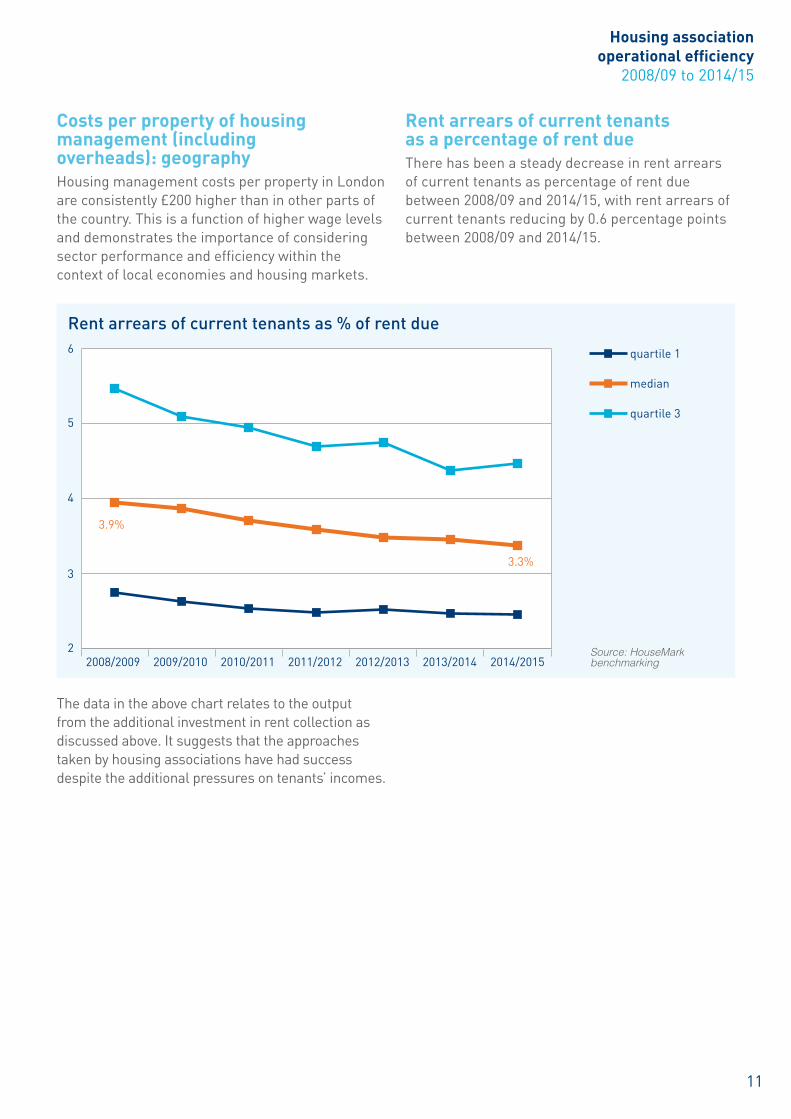
Rent arrears of current tenants as a percentage of rent due There has been a steady decrease in rent arrears of current tenants as percentage of rent due between 2008/09 and 2014/15, with rent arrears of current tenants reducing by 0.6 percentage points between 2008/09 and 2014/15.
Rent arrears of current tenants as % of rent due
quartile 1
median
quartile 3
3.9%
3.3%
Source: HouseMark benchmarking
2
3
4
5
6
2008/2009 2009/2010 2010/2011 2011/2012 2012/2013 2013/2014 2014/2015
The data in the above chart relates to the output from the additional investment in rent collection as discussed above. It suggests that the approaches taken by housing associations have had success despite the additional pressures on tenants’ incomes.

Housing association operational efficiency
2008/09 to 2014/15
12
Average re-let time in days (standard re-lets)
quartile 1
median
quartile 3
33
24
Source: HouseMark benchmarking
10
20
30
40
50
2008/2009 2009/2010 2010/2011 2011/2012 2012/2013 2013/2014 2014/2015
Average re-let time in days (standard re-lets) There has been a steady reduction over the period in the average re-let time, with a median point reduction of nine days between 2008/09 and 2014/15.
Reducing average re-let times reduces the income foregone during the void period and is also evidence of a more efficient void works process. The increased real terms letting expenditure discussed above can be matched to this output.
Housing association operational efficiency
2008/09 to 2014/15
13
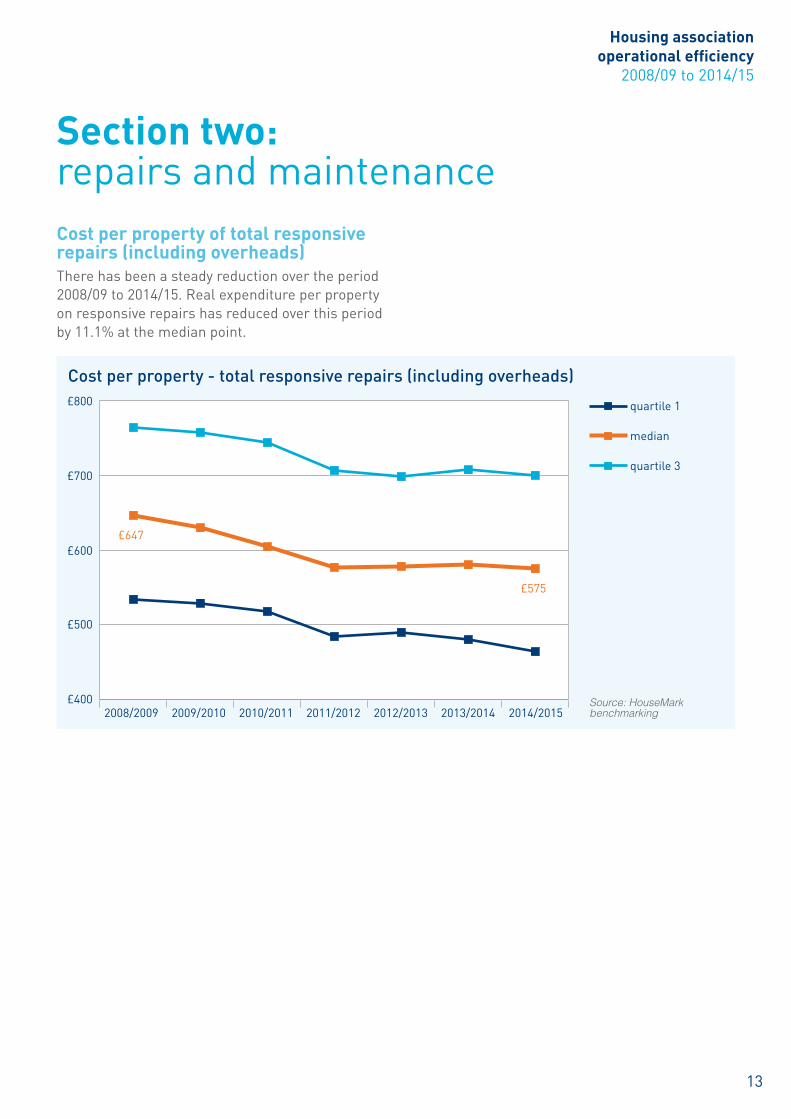
Cost per property of total responsive repairs (including overheads)There has been a steady reduction over the period 2008/09 to 2014/15. Real expenditure per property on responsive repairs has reduced over this period by 11.1% at the median point.
Section two: repairs and maintenance
Cost per property - total responsive repairs (including overheads)
quartile 1
median
quartile 3
£647
£575
£400
£500
£600
£700
£800
Source: HouseMark benchmarking2008/2009 2009/2010 2010/2011 2011/2012 2012/2013 2013/2014 2014/2015

Housing association operational efficiency
2008/09 to 2014/15
14
Average number of calendar days taken to complete repairs
quartile 1
median
quartile 3
8.58.2
Source: HouseMark benchmarking
4
6
8
10
12
2008/2009 2009/2010 2010/2011 2011/2012 2012/2013 2013/2014 2014/2015
Average number of calendar days taken to complete repairs There has been some fluctuation in this measure, with the net effect that there was a marginal decrease in the average number of calendar days taken to complete repairs between 2008/09 and 2014/15, from 8.5 days to 8.2 days at the median.
The temporary increase in the average number of calendar days taken to complete repairs following 2011/2012 coincides with the changing
regulatory environment for providers of social housing. Previous regimes were prescriptive in their requirement for repairs to be categorised as ‘emergency, urgent or routine’ with associated timescales. However, the current regulatory regime affords associations greater flexibility to respond to tenants’ actual preferences regarding the provision of repairs. The temporary increase in the average number of days may therefore be a statistical by-product of different approaches to repairs provision as opposed to evidence of poorer performance.
Housing association operational efficiency
2008/09 to 2014/15
15
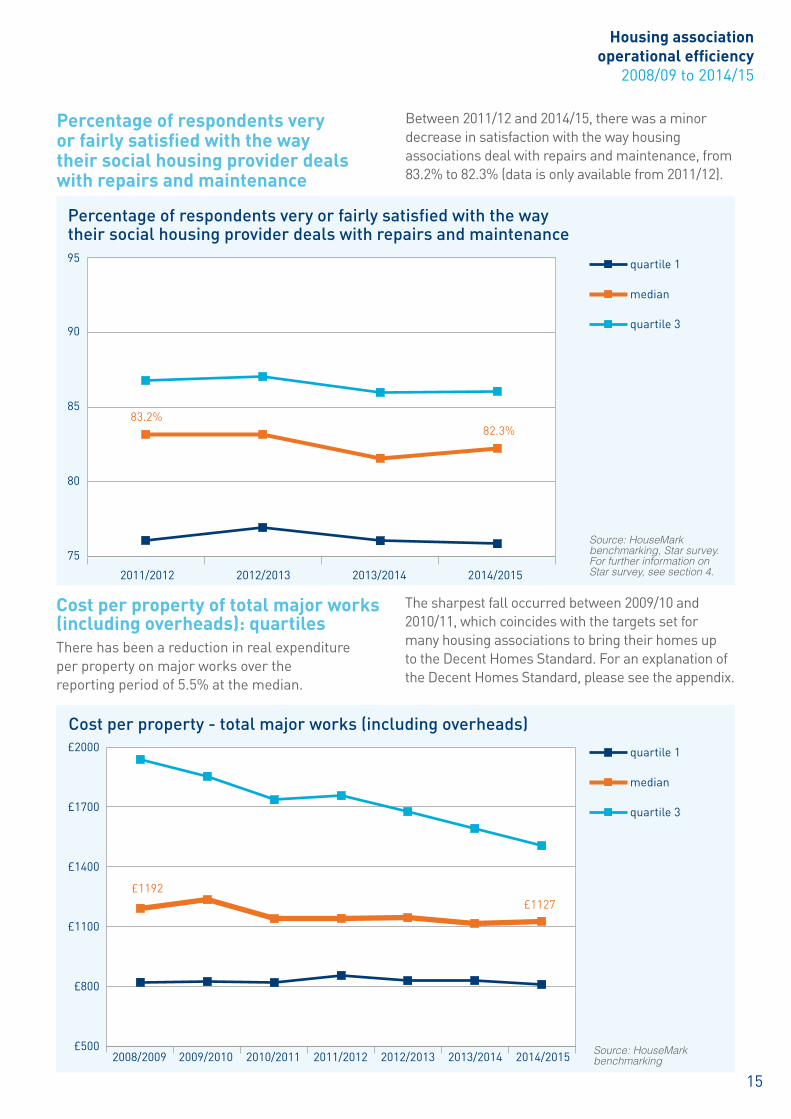
Cost per property of total major works (including overheads): quartilesThere has been a reduction in real expenditure per property on major works over the reporting period of 5.5% at the median.
The sharpest fall occurred between 2009/10 and 2010/11, which coincides with the targets set for many housing associations to bring their homes up to the Decent Homes Standard. For an explanation of the Decent Homes Standard, please see the appendix.
Cost per property - total major works (including overheads)
quartile 1
median
quartile 3
£1192£1127
£500
£800
£1100
£1400
£1700
£2000
2008/2009 2009/2010 2010/2011 2011/2012 2012/2013 2013/2014 2014/2015 Source: HouseMark benchmarking
Percentage of respondents very or fairly satisfied with the way their social housing provider deals with repairs and maintenance
quartile 1
median
quartile 3
83.2%82.3%
Source: HouseMark benchmarking, Star survey. For further information on Star survey, see section 4.
Percentage of respondents very or fairly satisfied with the way their social housing provider deals with repairs and maintenance
Between 2011/12 and 2014/15, there was a minor decrease in satisfaction with the way housing associations deal with repairs and maintenance, from 83.2% to 82.3% (data is only available from 2011/12).
2011/2012 2012/2013 2013/2014 2014/2015
75
80
85
90
95
Housing association operational efficiency
2008/09 to 2014/15
16
Cost per property of total major works (including overheads): type of organisation There is a clear difference between the major works expenditure of LSVTs and traditional housing associations (the definition of LSVT used is the same as that used by the Department for Communities and Local Government (DCLG), a fuller explanation of which is given in the appendix). LSVTs in 2014/15 spent over £300
more per property on major works than their traditional counterparts. Broadly speaking, this divergence can be explained by differences in stock profile and investment commitments. Large scale voluntary transfers often take place because the transferring local authority is unable to fund the investment required to bring the properties up to the required standards. In addition, many transfer agreements contain commitments from the new association regarding investments and improvements to be made to the stock.
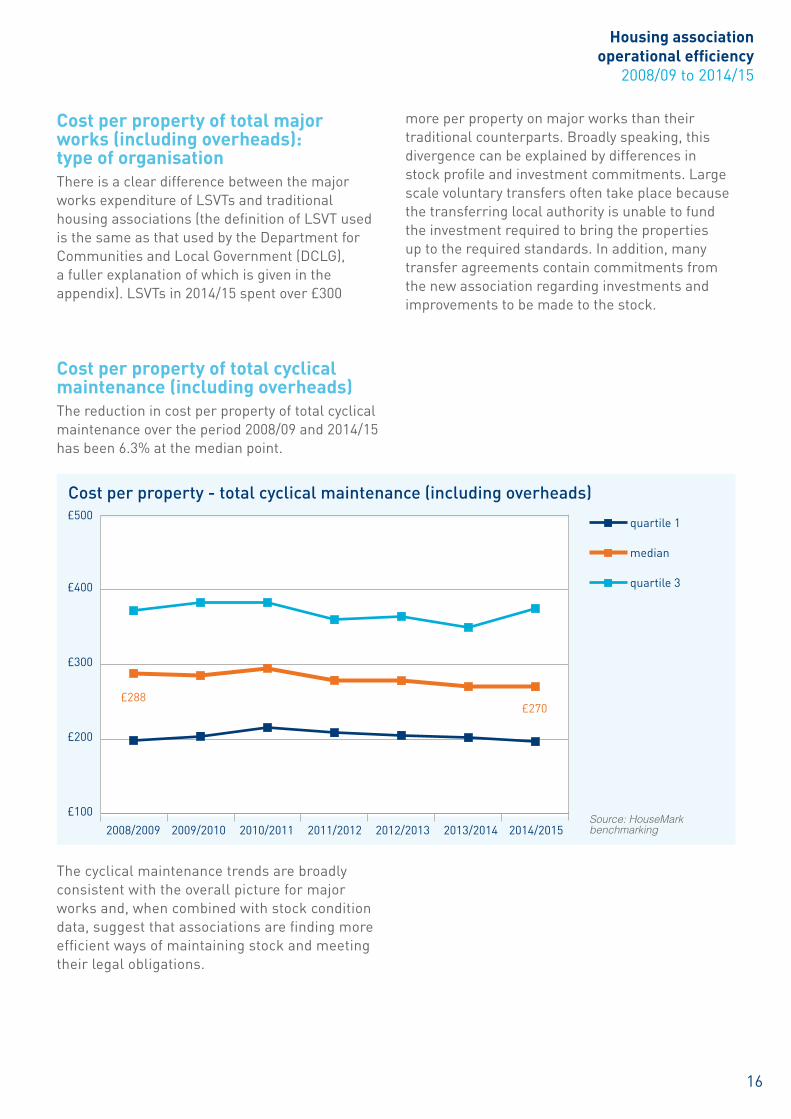
The cyclical maintenance trends are broadly consistent with the overall picture for major works and, when combined with stock condition data, suggest that associations are finding more efficient ways of maintaining stock and meeting their legal obligations.
Cost per property of total cyclical maintenance (including overheads)The reduction in cost per property of total cyclical maintenance over the period 2008/09 and 2014/15 has been 6.3% at the median point.
Cost per property - total cyclical maintenance (including overheads)
quartile 1
median
quartile 3
£288£270
Source: HouseMark benchmarking
£100
£200
£300
£400
£500

Housing association operational efficiency
2008/09 to 2014/15
17
This output measure should be considered alongside the above data on repairs and maintenance spend, including cyclical and major works, as an indication of how efficiently associations are using their resources in this area.
Percentage of respondents very or fairly satisfied with the overall quality of their home
quartile 1
median
quartile 3
86.5% 86.6%
75
80
85
90
95
Source: HouseMark benchmarking2010/2011 2011/2012 2012/2013 2013/2014 2014/2015
Percentage of respondents very or fairly satisfied with the overall quality of homeTenant satisfaction with the overall quality of their home has remained stable over the period 2010/11 to 2014/15.
Housing association operational efficiency
2008/09 to 2014/15
18
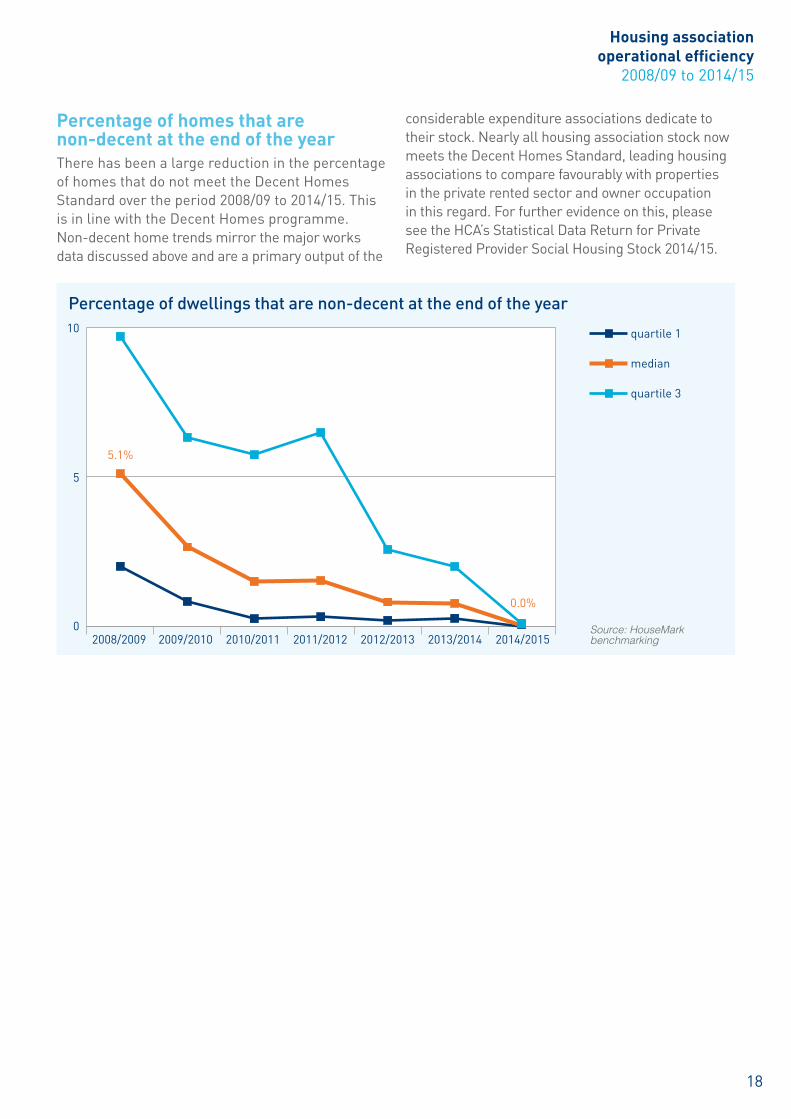
Percentage of homes that are non-decent at the end of the yearThere has been a large reduction in the percentage of homes that do not meet the Decent Homes Standard over the period 2008/09 to 2014/15. This is in line with the Decent Homes programme.Non-decent home trends mirror the major works data discussed above and are a primary output of the
considerable expenditure associations dedicate to their stock. Nearly all housing association stock now meets the Decent Homes Standard, leading housing associations to compare favourably with properties in the private rented sector and owner occupation in this regard. For further evidence on this, please see the HCA’s Statistical Data Return for Private Registered Provider Social Housing Stock 2014/15.
Percentage of dwellings that are non-decent at the end of the year
quartile 1
median
quartile 3
5.1%
0%
Source: HouseMark benchmarking
0
5
10
2008/2009 2009/2010 2010/2011 2011/2012 2012/2013 2013/2014 2014/2015
5.1%
0.0%

Housing association operational efficiency
2008/09 to 2014/15
19
Average SAP ratingThere has been an increase in the energy efficiency rating of housing associations’ stock over the period. Average SAP (Standard Assessment
Procedure for the energy rating of dwellings) rating at the median point has increased 3.5 points, from 67.0 in 2008/09 to 70.5 in 2014/15.
Energy efficiency and fuel poverty are crucial issues for housing association tenants. The consistent upward trend in average SAP rating reflects both investment in retrofitting existing properties and the
standards to which housing associations build new homes. The National Housing Federation is due to publish a report on energy efficiency and housing association stock in the coming month.
Average SAP rating of self-contained dwellings at the end of the year
quartile 1
median
quartile 3
67.0
70.5
60
65
70
75
Source: HouseMark benchmarking2008/2009 2009/2010 2010/2011 2011/2012 2012/2013 2013/2014 2014/2015

Housing association operational efficiency
2008/09 to 2014/15
20
Overhead costs as % of adjusted turnoverThere has been a steady reduction over the period in this measure at the median point, from 13.6% to 11.8%, primarily due to real term increases in adjusted turnover.
Since 2008/09 housing associations have realised significant increases in adjusted turnover, and the graph above demonstrates that this has not been accompanied by a similar increase in overhead costs. This suggests that associations have been
able to grow revenues while keeping control over expenditure on back office functions, thus creating proportionately more resources to invest in new developments and existing stock.
Section three: overhead costs
Overhead costs as a % of adjusted turnover
quartile 1
median
quartile 3
13.6%
11.8%
5
10
15
20
Source: HouseMark benchmarking2008/2009 2009/2010 2010/2011 2011/2012 2012/2013 2013/2014 2014/2015
Housing association operational efficiency
2008/09 to 2014/15
21
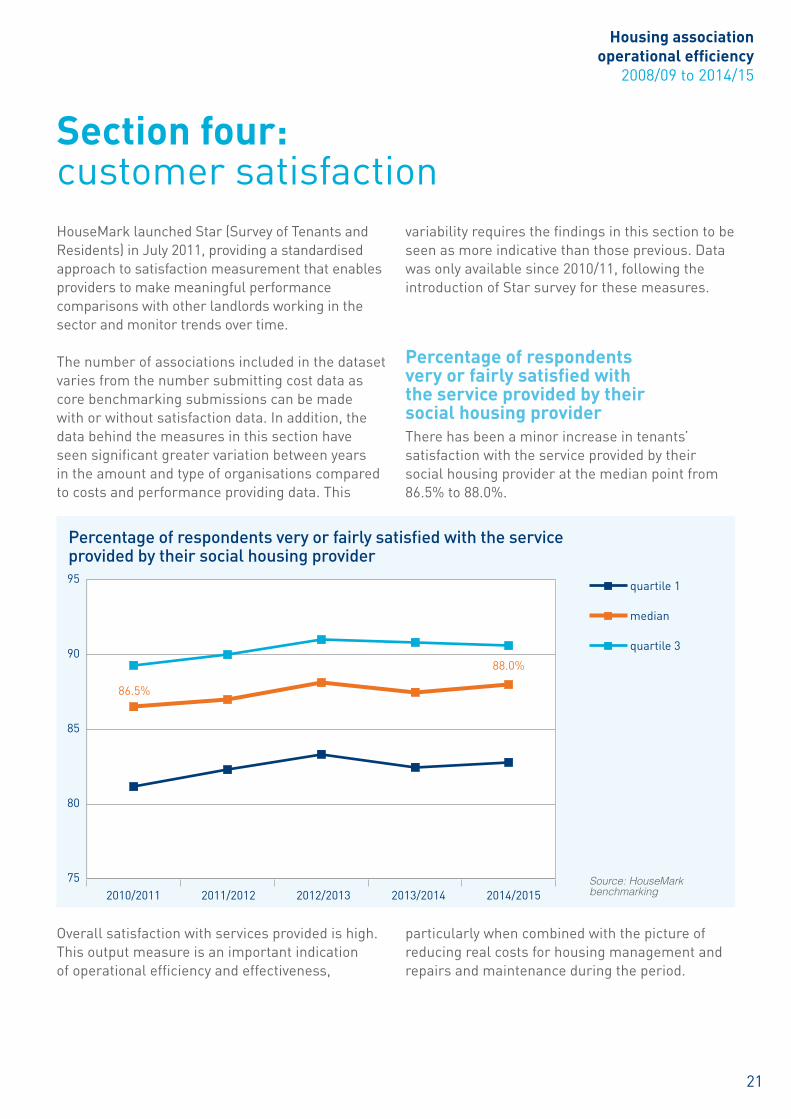
HouseMark launched Star (Survey of Tenants and Residents) in July 2011, providing a standardised approach to satisfaction measurement that enables providers to make meaningful performance comparisons with other landlords working in the sector and monitor trends over time.
The number of associations included in the dataset varies from the number submitting cost data as core benchmarking submissions can be made with or without satisfaction data. In addition, the data behind the measures in this section have seen significant greater variation between years in the amount and type of organisations compared to costs and performance providing data. This
variability requires the findings in this section to be seen as more indicative than those previous. Data was only available since 2010/11, following the introduction of Star survey for these measures.
Percentage of respondents very or fairly satisfied with the service provided by their social housing providerThere has been a minor increase in tenants’ satisfaction with the service provided by their social housing provider at the median point from 86.5% to 88.0%.
Overall satisfaction with services provided is high. This output measure is an important indication of operational efficiency and effectiveness,
particularly when combined with the picture of reducing real costs for housing management and repairs and maintenance during the period.
Section four: customer satisfaction
Percentage of respondents very or fairly satisfied with the service provided by their social housing provider
quartile 1
median
quartile 3
86.5%
88.0%
Source: HouseMark benchmarking
75
80
85
90
95
Housing association operational efficiency
2008/09 to 2014/15
22
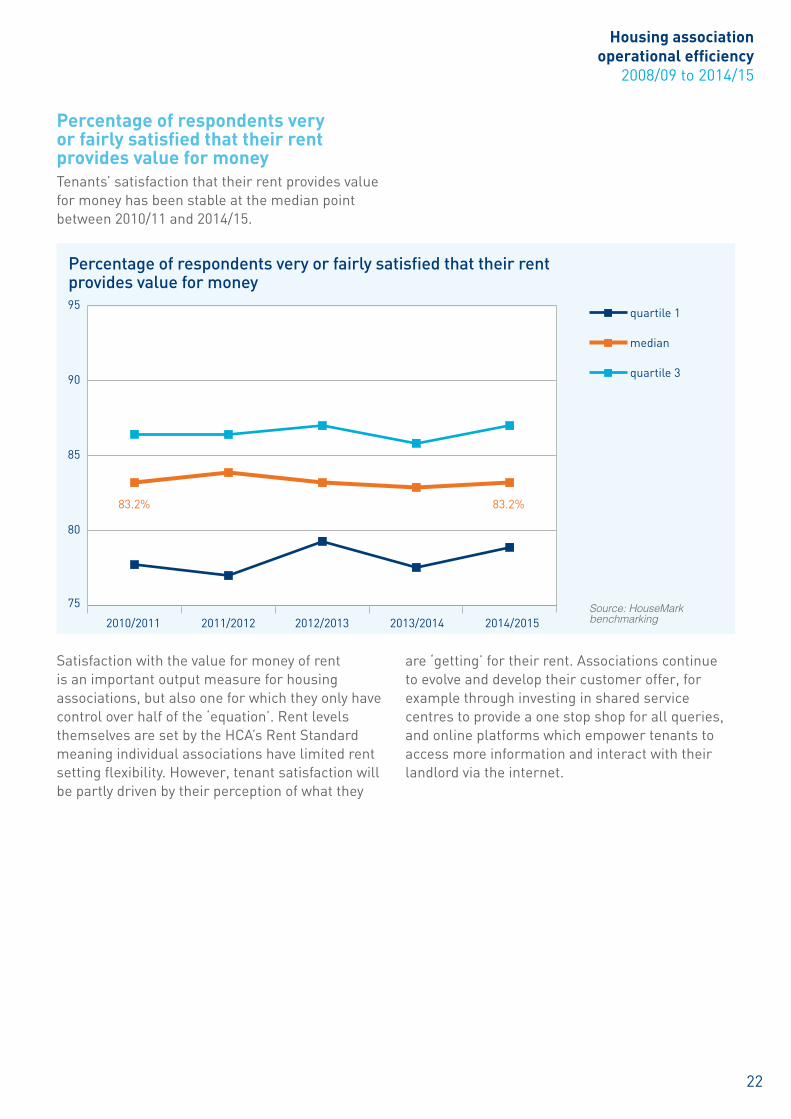
Percentage of respondents very or fairly satisfied that their rent provides value for moneyTenants’ satisfaction that their rent provides value for money has been stable at the median point between 2010/11 and 2014/15.
Percentage of respondents very or fairly satisfied that their rent provides value for money
quartile 1
median
quartile 3
83.2% 83.2%
Satisfaction with the value for money of rent is an important output measure for housing associations, but also one for which they only have control over half of the ‘equation’. Rent levels themselves are set by the HCA’s Rent Standard meaning individual associations have limited rent setting flexibility. However, tenant satisfaction will be partly driven by their perception of what they
are ‘getting’ for their rent. Associations continue to evolve and develop their customer offer, for example through investing in shared service centres to provide a one stop shop for all queries, and online platforms which empower tenants to access more information and interact with their landlord via the internet.
Source: HouseMark benchmarking
75
80
85
90
95
Housing association operational efficiency
2008/09 to 2014/15
23
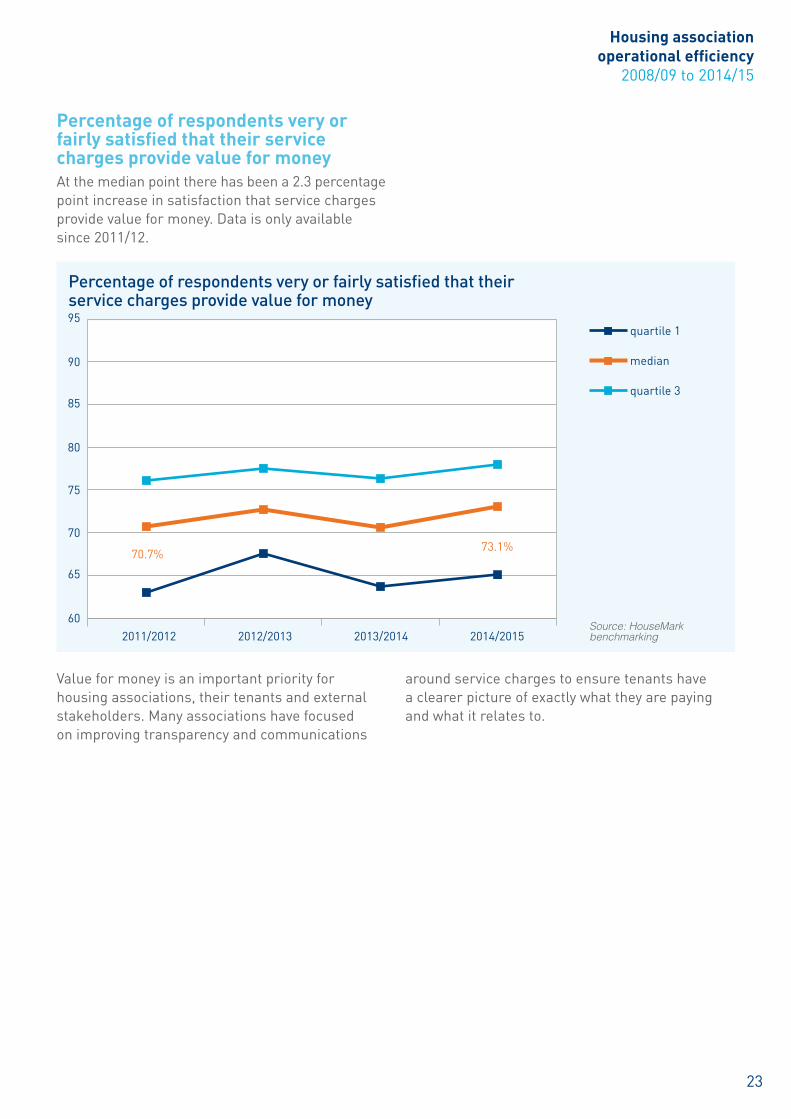
Percentage of respondents very or fairly satisfied that their service charges provide value for money
quartile 1
median
quartile 3
70.7%73.1%
Value for money is an important priority for housing associations, their tenants and external stakeholders. Many associations have focused on improving transparency and communications
around service charges to ensure tenants have a clearer picture of exactly what they are paying and what it relates to.
Percentage of respondents very or fairly satisfied that their service charges provide value for moneyAt the median point there has been a 2.3 percentage point increase in satisfaction that service charges provide value for money. Data is only available since 2011/12.
Source: HouseMark benchmarking
60
65
70
75
80
85
90
95
Housing association operational efficiency
2008/09 to 2014/15
24
This report has utilised HouseMark benchmarking data to explore sector performance across a number of input and output measures, with the intention of contributing to current discussions on operational efficiency and value for money. The use of a wide range of performance measures and trend data over a number of years allows for a more comprehensive and holistic view of operational efficiency and should be of use to individual associations, tenants and wider sector stakeholders.
A number of overall conclusions have been drawn from the data discussed above:
• Long term trends in key cost areas such as responsive repairs, maintenance and housing management show that median real terms cost per property have reduced. The real terms reduction in housing management cost per property is significantly smaller in magnitude than in other aspects of housing association operations. This appears primarily driven by increased costs of rent arrears and collection, and lettings since 2011/12. The overall cost picture, when combined with continued high customer satisfaction, suggests that housing associations have maintained high service standards in their core operations while reducing many key costs.
• Comparing and contrasting the efficiency of associations across the sector is a difficult task due to the number of variables which drive performance differentials. Location is a particularly important factor to consider as the local economy, housing market and customer base will significantly influence the services required and the cost of delivery.
• There is no clear relationship between operational efficiency and organisation size. As associations continue to explore strategies for improving efficiency and capacity, it is important to consider the full range of options available, rather than a narrow focus on size and merger activity.
• Housing associations remain sensitive to changes in government policy, particularly with regards to income and regulation. Performance data indicates that they have a track record of adapting to changes in the external environment in order, while delivering positive outcomes for tenants in line with their organisational missions.
The housing association sector has a central role to play in meeting the significant housing challenges facing England and the rest of the UK. To support ongoing transparency, innovation and improvement, the Federation and HouseMark intend to update this data on an annual basis, providing board members, executive teams, staff, tenants and other stakeholders with reliable data on inputs and outputs – and therefore a perspective on housing association sector efficiency.
Conclusions

Housing association operational efficiency
2008/09 to 2014/15
25
AppendixDefinitionsDecent Homes StandardThe Decent Homes Standard is a technical standard for public housing that was introduced into the United Kingdom in 2000 with the aim of all public housing being brought up to standard by 2010.To meet the Decent Home Standard, a council or housing association home must:
• meet the current statutory minimum safety standards for housing
• be in a reasonable state of repair
• have reasonably modern facilities and services
• have efficient heating and effective insulation
The home fails the standard if it does not meet all four criteria.
Large Scale Voluntary Transfer (LSVT)The DCLG’s definition of LSVT is, ‘the transfer of 500 or more tenanted and leasehold properties. A LSVT can include all the stock owned by a local authority or a part of it. The latter is known as a partial stock transfer’.
There is no difference between the DCLG definition of an LSVT and HouseMark’s.
SAP RatingThe Standard Assessment Procedure (SAP) is the methodology used by the Government to assess and compare the energy and environmental performance of dwellings. Dwellings are scored on a scale of 1-100. The higher the score the more energy efficient the dwelling.
Reading and understanding the dataWhat does ‘unbalanced panel’ mean?HouseMark’s extensive dataset not only covers many organisations in one year, it also covers many organisations over many years.This type of dataset is described as panel data.
As in practice not all organisations provide information for every year, a decision must be made about the method of analysis. An analysis of each measure which uses the data provided by all organisations who provided data for the relevant year, even if not all of them provided data for every year of the analysis, is described as analysis of an unbalanced panel. In an analysis of an unbalanced panel, the number and composition of each year’s sample can vary. Limiting the analysis of each measure to just those organisations who provided data for every year of the analysis period, would be described as using a balanced panel.
The decision to use an unbalanced panel was informed by an investigation of the data, which showed negligible difference between the two methods. This corresponds to the finding of the 2012 HCA Unit Costs of Housing Providers publication that the use of an unbalanced panel did not significantly change the conclusions from their regression analysis of housing association unit costs. The primary benefit of using an unbalanced panel is its ability to provide greater coverage of the sector.
Percentage point differences and percentage changeThe key difference is that percentage point differences are absolute and percentage changes are relative.
Example:If in 2013/14 the relevant percentage was 80% and in 2014/15 it becomes 90%, this can be described as a 10 percentage point increase as 90 minus 80 equals 10. It can also be described as a 12.5% percentage increase as 10 divided by 80 equals 12.5%.
Housing association operational efficiency
2008/09 to 2014/15
26
QuartilesQuartile information is used to analyse benchmarking data and is an effective way of ranking results. The following terms are used in this report:
When the data is ranked in ascending or descending order, the median is the value at the mid-point. It can be used to give organisations an idea of how close to ‘the average’ or ‘normal’ their figures are.
The upper quartile value (quartile 3) ‘cuts off’ the top 25% of the data – e.g. highest cost or highest satisfaction rate.
The lower quartile value (quartile 1) ‘cuts off’ the bottom 25% of the data – e.g. lowest cost or lowest satisfaction rate.
Median v meanMedian is a measure of the midpoint of the distribution of organisations, whereas the mean is the total divided by the number of organisations involved. It is therefore possible for the total costs from the full sample to decrease, yet the median cost to increase. Conversely it is possible for total costs to increase, yet the median decreases. This cannot mathematically occur with the mean average.
The key advantage of using the median is that it provides a clear idea of where the middle of the distribution is, and it is not sensitive to extreme values at either end. Therefore, when seeking to examine the operational efficiency of the typical housing association, the median is a better gauge than the mean.
Information on data processingApportionmentFor English housing associations, the operating costs submitted for benchmarking should match the operating costs noted in published accounts and/or the Annual Accounts (FVA) return. If they do not, the participant must provide a satisfactory explanation for any difference.
HouseMark allocates costs on an activity basis in accordance with standard definitions and subject to a robust validation process.
Employee costs are allocates to direct and overhead activities on the basis of a time apportionment exercise. Non-pay costs are allocated to activities based on the nature of the expenditure.
HouseMark classifies expenditure as either direct costs which covers expenditure on ‘front line’ activities such as housing management, maintenance, development and estate services and overheads costs which covers expenditure on ‘back office’ activities categorised as IT and communications (ITC), finance, office premises and central. Both direct and overhead costs will include a combination of employee costs and non-pay costs.
Overhead costs are apportioned to direct activities based on relevant whole time equivalent staff numbers employed on each direct activity. This creates a total cost per property which includes direct costs and allocated overheads. HouseMark’s overhead allocation is therefore carried out on a consistent basis for all benchmarked organisations.

Housing association operational efficiency
2008/09 to 2014/15
27
Performance dataHouseMark also collects data from participants on performance and satisfaction.
HouseMark seeks to align the data collection with statutory returns such as the statement of accounts, core lettings log, the Annual Accounts (FVA) and the Statistical Data Return (SDR). As well as minimising duplication, this enables HouseMark to validate submissions against information supplied to regulatory bodies. Satisfaction data needs to be supported by a report produced by
a market research company or a board report detailing the results.
Where possible, HouseMark collects data at component level. This facilitates like for like comparisons and enables more robust validation.
Data validationThe data collected in each submission is subject to a triple-layer validation and quality assurance process to ensure data integrity. This is summarised in the diagram below.
Customer review
System review
Housemark staff review
• Data submitted via the HouseMark e-form which contains online guidance
• Automatic flagging of significant variances and outliers prior to data submission
• Facility for data inputter to provide comments to accompany submission
• System generated validation reports including in depth variance analysis of components and peer group comparisons
• In depth validation including detailed check of data inputs, checks to external data, variance and peer group analysis, and data triangulation
• Secondary quality assurance check by an independent member of staff including peer group analysis and critical consideration of outputs in the wider context
Endnotes1. Homes and Communities Agency. Understanding unit costs of housing providers – regression
analysis: Summary Report (2012) https://udc.homesandcommunities.co.uk/sites/default/files/newsandevents/ras.pdf
2. Ibid.3. The Chartered Institute of Housing. Does size matter– or does culture drive value for money? (2012)
http://www.cih.org/resources/PDF/Policy%20free%20download%20pdfs/Does%20size%20matter.pdf

The National Housing Federation is the voice of affordable housing in England. We believe that everyone should have the home they need at a price they can afford.
That’s why we represent the work of housing associations and campaign for better housing. Our members provide two and a half million homes for more than five million people. And each year they invest in a diverse range of neighbourhood projects that help create strong, vibrant communities.
National Housing Federation25 Procter Street, London WC1V 6NYTel: 020 7067 1010 Email: [email protected]
www.housing.org.uk
Find us orfollow us on: