household perception and demand for better protection of
TRANSCRIPT

Household perception and demand for better protection of land rights in Ethiopia Hosaena Ghebru, Bethelhem Koru, and Alemayehu Seyoum Taffesse
February 2016
WORKING PAPER XX WORKING PAPER 83
1
TABLE OF CONTENTS
Abstract .................................................................................................................................................................................. 2
1. Introduction ....................................................................................................................................................................... 2
2. Background ....................................................................................................................................................................... 3
2.1 Land Rights Registration and Certification Process in Ethiopia ................................................................................. 3
2.2 Second-level land certification programs ................................................................................................................... 5
3. Data and Sampling............................................................................................................................................................ 5
4. Theoretical Model and Emprical methods ........................................................................................................................ 7
4.1 Theoretical Framework: .............................................................................................................................................. 7
4.2 Empirical Methods ...................................................................................................................................................... 7
5. Descriptive Analysis .......................................................................................................................................................... 8
5.1 Household and parcel level analysis of correlates of perceived land tenure insecurity ............................................. 9
5.2 Role of population pressure and relative land scarcity on tenure insecurity ............................................................ 13
5.3 Role of land use change and urbanization on tenure insecurity .............................................................................. 14
6. Modeling Results and Discussion ................................................................................................................................... 14
7. Conclusion ...................................................................................................................................................................... 19
References ........................................................................................................................................................................... 20
Appendices .......................................................................................................................................................................... 22
LIST OF TABLES
Table 5.1: Mode of acquisition and purpose of land use by region ....................................................................................... 8
Table 5.2: Means comparison: Household characteristics versus tenure insecurity indicators ............................................ 9
Table 5.3: Means comparison: mode/years of acquisition versus tenure insecurity ............................................................. 9
Table 5.4: Means comparison: parcel characteristics versus tenure insecurity indicator.................................................... 10
Table 5.5: Mean comparison: Household characteristics versus tenure insecurity indicator, percent ................................ 10
Table 5.6: Mean comparison: Parcel characteristics versus tenure insecurity, percent...................................................... 11
Table 5.7: Basic household characteristics of the sample ................................................................................................... 11
Table 5.8: Household land certification status and demand for new demarcation, percent ................................................ 12
Table 5.9: Household land tenure security variables, percent ............................................................................................. 12
Table 5.10: Parcel number and size by region .................................................................................................................... 12
Table 5.11: Means comparison at household level: Parcel characteristics by tenure insecurity ........................................ 13
Table 5.12: Means comparisons of household perceived tenure insecurity and the role of kebele-level social and economic factors ............................................................................................................................................................. 13
Table 6.1: Factors associated with household level demand for second-level land certification – logistic model .............. 15
Table 6.2: Regression results on plot level drivers of tenure insecurity using several indicators of tenure insecurity ........ 17
LIST OF FIGURES
Figure 3.1. Woredas selected for the 2013 AGP farm household survey ............................................................................. 6
APPENDICES
Appendix Table1: Proportion of households who gave uniform responses to key questions for all of their parcels, by region .............................................................................................................................................................................. 22
Appendix Table 2: Proportion of households who acquired all of their parcels exclusively from one source, percent ....... 22
2
ABSTRACT
The study assesses factors that explain households’ perceived tenure insecurity and the demand for new formalization of
land rights in Ethiopia. We use data from the 2013 Agricultural Growth Program (AGP) survey of 7,500 households from high
agricultural potential areas of Ethiopia. The results from a logistic estimation and a descriptive analysis reveal that the de-
mand for further land demarcation is positively associated with higher perception of tenure insecurity. Moreover, disaggre-
gated regression results indicate that ownership and boundary-related disputes characterize peri-urban locations and vibrant
communities, whereas perceived risk of government expropriation of land is mainly manifested in predominantly rural com-
munities and areas where administrative land redistribution is a recent practices. Hence, the rollout strategy for the recent
wave of the Second-Level Land Certification agenda should avoid a blanket approach, as it can only be considered a best fit
for those vibrant and peri-urban locations where demand for further formalization is higher and boundary and ownership-
related disputes are more common. However, focusing similar interventions in predominantly agrarian communities and
communities with recent administrative land distributions may not be advisable since expropriation risk seems to be dictating
perceived tenure insecurity of households in such locations. Rather, regulatory reforms in the form of strengthening the
depth of rights over land, such as formalization of rural land lease markets and abolishing conditional restrictions on inter-
generational land transfers via inheritance or gifting, could be considered as alternative and cost-effective intervention pack-
ages in this latter context.
Keywords: land certification, tenure insecurity, land policy, Ethiopia
1. INTRODUCTION
A new wave of land reforms has hit Africa. These efforts aim to provide more private land and to secure property rights for
those who occupy the land. Formalization of land rights are being promoted by the Commission for Legal Empowerment of
the Poor, the World Bank, UN organizations, and many donor organizations. Ethiopia surpassed expectations when it imple-
mented one of the largest, fastest, and cheapest land registration and certification reforms in Africa (Deininger et al. 2008).
While arduous in nature, there is growing evidence that land certification and registration programs have led to an increase
in investment, improved land productivity and land rental market activity (Holden et al. 2007, 2011; Deininger et al. 2011;
Bezabih et al. 2012). Positive welfare effects in the form of greater food availability and improved child nutrition have also
been identified from these programs (Hagos and Holden 2013).
Formalization of land rights is a dynamic process. As experimental or implemented land reform programs get under-
way, they require updating with improvements or need to be modified to fulfill new economic and societal needs. While evi-
dence of the positive impacts of land reforms continue to emerge in terms of increased investment, land productivity, and
land rental market activity, the government of Ethiopia has started a new second round effort to computerize the registration
of land parcels in every part of Ethiopia. The relevance of the second-level certification relies both on increasing demand for
formalization as well as decreasing demand for first-level land certification due to the deterioration of factors considered par-
amount to its success. In particular, general land parcel boundaries, such as natural structures like rivers, trees, etc., may
have been altered by natural or artificial causes. Moreover, the witnesses of parcel borders may have moved away from the
local area.
Using data from a nationally representative survey of 7,500 households from the four major agricultural regions of
Ethiopia, this study strives to answer the following research questions:
i) After receiving the first-level land certification, what is the demand for second-level land certification? What are
the factors that determine its demand?
ii) What factors determine the levels of tenure insecurity as perceived by households?
iii) How does the second-level certification improve tenure security of farm households?
The results from both the econometric and descriptive analysis reveal that the demand for further land demarcation
is positively associated with a higher perception of tenure insecurity. Our parcel-level descriptive analysis suggests a nega-
tive association between land registration and the likelihood of private land dispute. Furthermore, the results show that
households who have experienced land parcel border disputes are more likely to demand new formalization of land. The
proportion of rented-out parcels is lower where households perceive a risk of government expropriation of such parcels.
Findings also indicate that there is significant variation among regions in terms of the predominant mode of land acquisition,

3
suggesting that land policy interventions should be context-specific. Policy interventions should take into consideration varia-
tion across regions in terms of mode of acquisition and implement the certification process accordingly.
2. BACKGROUND
2.1 Land Rights Registration and Certification Process in Ethiopia
Land titles are associated with full private property rights. In land markets in Ethiopia, the ownership of these land titles can
be transferred or the titles can be used as collateral in order for the owner to obtain loans. The title is a written document
providing proof of ownership. This ownership is recorded in a publicly recognized central land registry.
The Ethiopian Ministry of Agriculture (MoA - 2013) characterizes the first-level land certification as a process of
providing farmers with simple temporary landholding certificates with no geo-referencing or mapping information of the land
parcels. The MoA website describes that 6.3 million out of 13 million households have received such certificates in the four
major agricultural regions of the country, Tigray, Amhara, Oromiya, and Southern Nations, Nationalities, and Peoples
(SNNP) regions. The stated aim of the Ministry is to provide Stage One certificates to the remaining 6.7 million households
and to scale up a land administration pilot program through which one million households are to be issued with permanent
certificates that include geo-referencing and mapping of individual land parcels. This land administrative pilot program is re-
ferred to as Stage Two of the land certification program.
Any effort to reform land governance in Ethiopia must include further formalization of land use rights, including stipu-
lations on land and land use transfer, such as through rental markets, conservation, and productivity. Elliott and Gibson
(2012) highlight the benefits of improved land rights, which take place through three main channels: collateral value, labor
mobility, and investment invectives. Ethiopia’s development partners, in alliance with the Ministry of Agriculture, have been
adamant about further formalization of individual land rights. With the end of the government’s land reallocation practices in
2005, the process to formalize rights to land gained more ground as development partners took advantage of the opportunity
to finance projects that raised awareness, increased the scale of operation, and promoted further certification of land parcels
as a measure of improving the tenure security of smallholder farmers across Ethiopia. Many lessons have been learned.
Having realized the perceived benefits of improved tenure security, the government has now committed to further collabora-
tion with development partners to improve land governance, to scale up certification programs that are more detailed, to tar-
get weaknesses in the first-level land certification, to address gender disparities in land titling, and to increase efficiency in
land rental markets (Elliott and Gibson 2012). In part, the agreement between the government of Ethiopia and the G8 alli-
ance, the G8 Cooperation Framework to Support the New Alliance for Food Security and Nutrition in Ethiopia that was
signed in December 2013 aims to support land tenure security for all. It seeks to strengthen transparency in land governance
by, for example, promoting responsible agricultural investment through a better legal framework and practices.
The supporting literature on land tenure security in Ethiopia revolves around current policy dialogues and the effec-
tiveness of the ongoing certification program. Feder and Nishio (1998) reviewed successful land registration and titling pro-
grams in Asia and Latin-America where positive investment, credit access, land productivity and land value effects, were
detected. Such effects also were found in Thailand, urban Philippines, urban Indonesia, Honduras, Paraguay, and Peru.
However, a study in rural India (Pender and Kerr 1994) found no significant positive effects on investments or credit access.
Studies in Africa in Ghana, Kenya, and Rwanda (Migot-Adholla et al.1991) found that land registration had no significant im-
pact on land productivity, land investment, or credit access. Jacoby and Minten (2007) also found no significant effects of
land titling in Madagascar. Besley (1995), however, found a positive effect of new land rights on an investment in planting
trees in one area in Ghana.
Feder and Nishio (1998) emphasize that many prerequisites have to be in place before positive economic and
productivity impacts of land registration can be achieved. If there are weaknesses in existing formal or informal tenure sys-
tems, for example, this inhibits the necessary tenure security that is essential for investment. Positive impacts on credit mar-
kets and land markets will not occur unless there is a demand for such markets. Furthermore, land cannot be used as collat-
eral by lending institutions unless there exists a well-functioning land sales market. Lawyers and land administration person-
nel who can implement the law, register the land, and create land titles in a transparent and reliable way with clear conflict
resolution systems are essential. There is a risk that the introduction of a modern registry system to replace a traditional ten-
ure system could result in land grabbing (”elite capture”) by better informed, more influential, and more wealthy stakeholders.
There are fears that this effect of formalizing land rights could increase landlessness and result in other negative effects on
the poor. Corruption within the land administration functions may also undermine the benefits of a modern land registration
4
system should the staff responsible for its implementation take advantage of their positions. For a new system to gather pop-
ularity and succeed, engaging local participation in the process, along with simple, efficient, and transparent procedures are
essential.
Both customary and statutory tenure systems have traditionally favored men over women in terms of land entitle-
ment. Land titles have typically been allocated to the head of the household, who in most cases is a man. There have been
many cases where formalization of land rights through land titling has undermined customary land rights, which often have
been ignored or otherwise not respected. The high cost of creating land titles has led many countries to establish a system of
creating titles only upon demand, which has made land titles even more costly and only available to the wealthy (Benjamin-
sen et al. 2009; Besley and Burgess 2000; Cotula et al. 2004; Deininger 2003). There is, therefore, a great need for more
low-cost, broad-scale and egalitarian systems of land registration in low income countries.
The first-level land certification in Ethiopia registered the landholdings of many farmers in the four main regions.
However, the first phase certificates poorly described the land plots, including neither a map nor any kind of spatial refer-
ence, and only provides a rough estimate of the area of the plots. None of the regions created sketches of the plots as part
of the certification process. The size of the plot was determined either by using crude measurement methods or by relying on
local estimates of the area of the plot in timads1.
Implementation of the land certification program is conducted through Land Administration Committees (LACs) at
woreda (district) level in five steps.
i) The kebele (sub-district or community) land evaluation and registration process starts with information sent to
the woreda and kebele administrations. Awareness campaigns are conducted among the local farmers. LACs
are then established, and the committee members are elected and trained.
ii) Farmers are encouraged to apply to the LAC for registration of their land by submitting their name, number of
parcels, and total area claimed. The application also contains a description of present land use and requires that
the names of the neighbors with land adjacent to each parcel be listed. The LAC verifies the information in the
field and enters the checked information onto a field datasheet.
iii) Based on the information collected, a temporary certificate will be issued to farmer and the results are publicly
displayed. The farmers will then be gathered together and all applications will be announced in order that agree-
ment may be reached.
iv) The information from the field datasheets is registered in the land registry book which is kept at the woreda of-
fice.
v) Finally, based on the information entered into the land register book, the woreda administration office issues a
land registration book for each registered household (Bezabih et al. 2014).
Land certification in Tigray began soon after the land redistribution exercise of government. The process there in-
volved the landholder and his neighbors being present at the plot when it was identified and measured. If no one was pre-
sent, the plot would not be registered. In Tigray, the process also relied heavily on information collected during the last land
distribution. In these cases where records were available, not all land was measured again. Moreover, the first-level land
certification did not consider gender balance, such that the certificate was not in the name of both parties in the case of mar-
ried couples (husband and wife), but only in that of the husband (Deininger et al. 2005).
The other three regions, Amhara, Oromia, and SNNP, continue to work towards increased tenure security. The pro-
cess has been set up relatively quickly, especially in Amhara. In Oromia, strong reliance on community work has made the
process very participatory. These efforts have been combined with well-established and supported training programs. How-
ever, the lack of simple sketch maps of plots during the first-level land certificate process has limited the impact of the pro-
cess. Moreover, in Oromia and SNNP, the record book entries are small and condensed with only one line per household,
leaving little room for any updating. Nonetheless, mainly using direct funding from the Federal Government, it is estimated
that first-level rural landholding certificates have been issued to about 13 million rural households in Oromia, SNNP, Tigray,
and Amhara (IFAD 2015)
1 A traditional form of area measurement that equals the area an ox can plough in one day, around 0.25 ha.

5
2.2 Second-level land certification programs
Many donors have been engaged in the second-level land certification process. The Ethiopia Strengthening Land Admin-
istration Program (ELAP), funded by USAID from 2008 to 2013, continued the work that began under the Ethiopian Strength-
ening Land Tenure and Administration Process (ELTAP), extending certification and survey activities to new areas, including
to Afar and Somali regions, which have considerable pastoral lands (ORGUT 2010). The components of the second-level
land certification process were designed to strengthen tenure security, to improve systems pertaining to land dispute resolu-
tion, and to improve the effectiveness of land titling and administration by standardizing rural land registration and cadastral
surveying methodologies. Finnish cooperation, another donor involved in rural economic development, is focused on the
Responsible and Innovative Land Administration in Ethiopia (REILA). This supports the Government’s land registration pro-
gram, the Ethiopia Sustainable Land Management Investment Framework (ESIF). Since August 2011, the cooperation has
been an ongoing bilateral project. REILA, which minimizes ground survey efforts by using aerial photographs and satellite
images for parcel boundary definition, is expected to continue until 2016. This intervention will assist the second-level certifi-
cation process to improve land administration and to increase capacity for investment in responsible land allocation.
Another on-going project to reform the land sector in Ethiopia is the DFID-funded Land Investment for Transfor-
mation (LIFT) program, which has been developed to improve incomes of the rural poor and to enhance economic growth
through second-level land certification (LIFT report 2014). The LIFT program is intended to work with other partners, such as
REILA, focusing primarily on raising awareness among landholders, and building capacity of senior officials at federal and
regional levels, and also at woreda and kebele levels, including LAC members. Some of the woredas included in the LIFT
program are also those included in the Agricultural Growth Program (AGP) which were selected by the Ethiopian govern-
ment due to their high potential for agricultural growth. The LIFT program intends to cover up to 14 million parcels in approxi-
mately 140 woredas. The government’s budget allocation formula was used to allocate the numbers of woreda to be se-
lected in each of the four main regions. The distribution consists of 39 woredas in Amhara, 54 in Oromia, 34 in SNNP, and
13 in Tigray. The selected woredas are grouped in clusters of AGP and SLMP (Sustainable Land Management Program)
woredas, with other selected woreda being those with ortho-photo coverage (LIFT report 2014). According to the LIFT report,
the estimated cost per registered parcel is US$5.88. This figure falls below the cost of the REILA pilot second-level certifica-
tion trials.
Implementing the second-level land certificate at country level is not cost effective and optimal for two reasons. First,
for reasons related to budget. Pilots with cadastral mapping have been undertaken mainly in Amhara, including a donor-as-
sisted (SIDA) project using advanced GPS-equipment and GIS supported mapping functionalities. Costs appear high when
scaling up this approach. Therefore, expanding the pilot program to all four regions is not envisaged under the USAID as-
sisted project (Deininger et al. 2005). Consequently, for efficiency in program implementation, identifying the households and
parcels with high tenure insecurity and less confidence to invest on their farm land should be given priority. Second, the de-
mand for the second-level land certification varies among regions.
The LIFT project is now at an early stage of implementation in some of the AGP woredas. Thus, the main contribu-
tion of this paper is to provide evidence-based insights for policy makers and donors in order to help identify the areas where
maximum benefit from second-level land certificate might be achieved.
3. DATA AND SAMPLING
Our empirical estimation is based on analysis of data from 7,500 farm households collected in the second round (2013) sur-
vey of the Agricultural Growth Program (AGP) households by the International Food Policy Research Institute (IFPRI) and
the Central Statistical Agency (CSA) of the government of Ethiopia. Increased smallholder productivity and value-addition in
the agricultural sector are core elements of the Ethiopian government’s approach to reduce poverty. The AGP is a compo-
nent of this broad effort. Launched in 2011, the AGP is a five-year program with a primary objective “to increase agricultural
productivity and market access for key crop and livestock products in targeted woredas, with increased participation of
women and youth”. The AGP focuses on agricultural growth for 93 targeted woredas in Amhara, Oromiya, SNNP, and Tigray
regions. The program identifies key commodities based on consideration of current share in production, potential marketabil-
ity, possibilities for spatial spill-over effects, and greater participation of women and young people. Figure 3.1 maps the distri-
bution of the woredas covered by the AGP survey.
The sample of farm households was chosen to represent farm households in the country’s areas of high agricultural
productivity. The AGP is aimed primarily at increasing agricultural productivity in a sustainable manner, enhancing market

6
performance, and facilitating value addition in the areas targeted by the program. The sample is divided into two-thirds
treated (AGP) woredas and one-third control (non-AGP) woredas. A total of 78 households per woreda were selected in the
sampling. Woredas covered by the Productive Safety Net Program (PSNP) were excluded from the sample for the AGP sur-
vey.
Figure 3.1. Woredas selected for the 2013 AGP farm household survey
Source: AGP survey data
The selection of households for the baseline AGP involved three steps. First, the 61 AGP woredas for the survey
were randomly selected from among the 83 woredas in which the AGP is being implements. Similarly, 32 woredas were ran-
domly selected from among non-PSNP and non-AGP woredas in the four regions within which AGP operates, Amhara, Oro-
miya, SNNP, and Tigray. Second, three EAs where randomly chosen from among all EAs in each selected woreda. Tigray is
the exception to this rule because only five EAs each from ten woredas and six EAs each from two woredas were selected.
The final step was to select 26 households from within each selected EA. This was done based on a list of households resid-
ing within each EA, and then selecting households randomly until the desired number of survey sample households was ob-
tained.
The household surveys employed similar survey instruments to that of earlier AGP baseline and midline surveys,
covering many aspects of household livelihoods, which among others, included information about access to production in-
puts and markets, availability of physical infrastructure, agricultural production and productivity, and revenues generated
from marketed outputs. A complementary community-wide survey to support the household level data was also conducted in
each EA in order to collect information on community assets, infrastructure, access to markets, and price information.
7
4. THEORETICAL MODEL AND EMPRICAL METHODS
To inform the conceptualization and empirical investigation of assessing the drivers of tenure insecurity and demand for fur-
ther formalization of land rights, a series of group mean comparison tests were conducted using the alternative indicators of
perceived tenure insecurity (both at household and parcel level) adopted in this paper. These descriptive analyses are pre-
sented in Section 5 below.
4.1 Theoretical Framework:
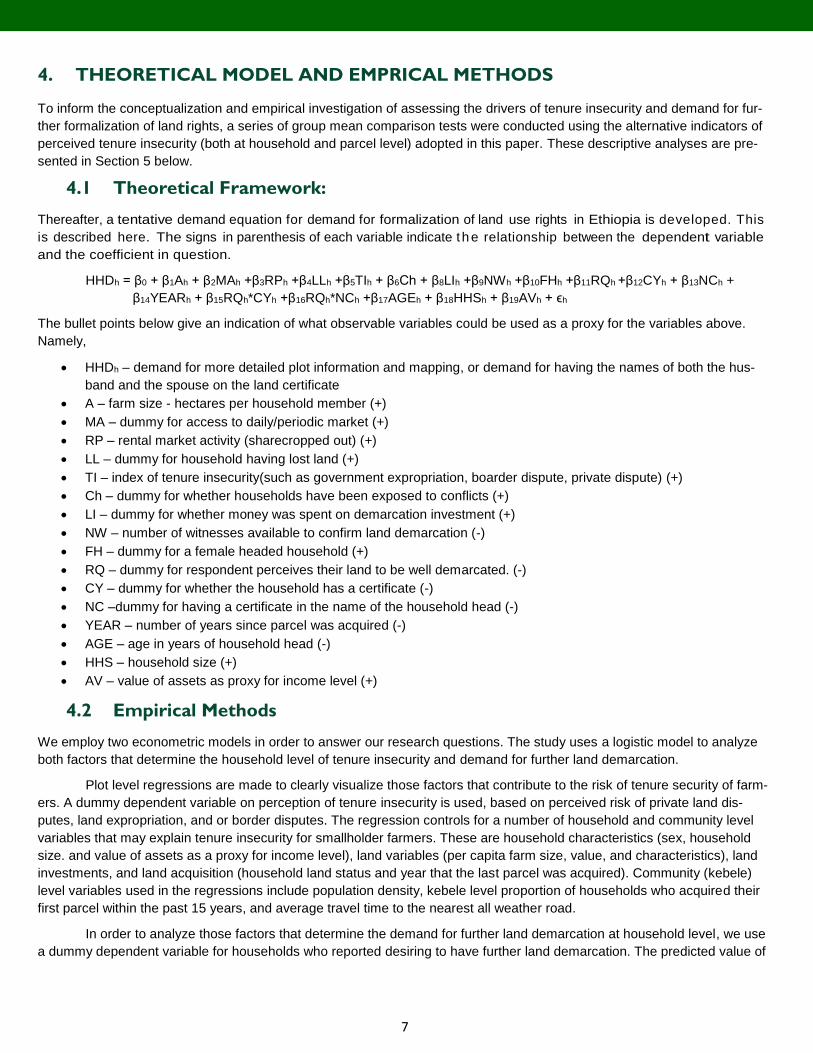
Thereafter, a tentative demand equation for demand for formalization of land use rights in Ethiopia is developed. This
is described here. The signs in parenthesis of each variable indicate th e relationship between the dependent variable
and the coefficient in question.
HHDh = β0 + β1Ah + β2MAh +β3RPh +β4LLh +β5TIh + β6Ch + β8LIh +β9NWh +β10FHh +β11RQh +β12CYh + β13NCh +
β14YEARh + β15RQh*CYh +β16RQh*NCh +β17AGEh + β18HHSh + β19AVh + ϵh
The bullet points below give an indication of what observable variables could be used as a proxy for the variables above.
Namely,
HHDh – demand for more detailed plot information and mapping, or demand for having the names of both the hus-
band and the spouse on the land certificate
A – farm size - hectares per household member (+)
MA – dummy for access to daily/periodic market (+)
RP – rental market activity (sharecropped out) (+)
LL – dummy for household having lost land (+)
TI – index of tenure insecurity(such as government expropriation, boarder dispute, private dispute) (+)
Ch – dummy for whether households have been exposed to conflicts (+)
LI – dummy for whether money was spent on demarcation investment (+)
NW – number of witnesses available to confirm land demarcation (-)
FH – dummy for a female headed household (+)
RQ – dummy for respondent perceives their land to be well demarcated. (-)
CY – dummy for whether the household has a certificate (-)
NC –dummy for having a certificate in the name of the household head (-)
YEAR – number of years since parcel was acquired (-)
AGE – age in years of household head (-)
HHS – household size (+)
AV – value of assets as proxy for income level (+)
4.2 Empirical Methods
We employ two econometric models in order to answer our research questions. The study uses a logistic model to analyze
both factors that determine the household level of tenure insecurity and demand for further land demarcation.
Plot level regressions are made to clearly visualize those factors that contribute to the risk of tenure security of farm-
ers. A dummy dependent variable on perception of tenure insecurity is used, based on perceived risk of private land dis-
putes, land expropriation, and or border disputes. The regression controls for a number of household and community level
variables that may explain tenure insecurity for smallholder farmers. These are household characteristics (sex, household
size. and value of assets as a proxy for income level), land variables (per capita farm size, value, and characteristics), land
investments, and land acquisition (household land status and year that the last parcel was acquired). Community (kebele)
level variables used in the regressions include population density, kebele level proportion of households who acquired their
first parcel within the past 15 years, and average travel time to the nearest all weather road.
In order to analyze those factors that determine the demand for further land demarcation at household level, we use
a dummy dependent variable for households who reported desiring to have further land demarcation. The predicted value of

8
the dependent variable can be interpreted as the probability of the demand for land demarcation, given the values of the in-
dependent variables. The estimation is done by clustering at enumeration area to obtain robust, sample-design corrected
standard errors for the predicted variables.
5. DESCRIPTIVE ANALYSIS
The descriptive evidence demonstrates the importance of tenure security, how tenure insecurity relates to household and
parcel level information, and how change in these arrangement could have an important impact on further land demarcation
for farmers. In order to assess the tenure insecurity of farm households, we used three main indicators. These are perceived
risk of private land dispute, perceived risk of land expropriation, and the likelihood of a border dispute.
There are four types of tenure arrangement in this dataset – community allocated, inherited, purchased, and mort-
gaged – each with different bundles of rights governing access, use, and transfer (Table 5.1). The majority of farm house-
holds obtain land through administrative based allocation from the community (Peasant Association) administration, and it is
the dominant tenure arrangement. Community allocated land is not transferable except to family members through be-
queathing. While community allocated land provides basic rights, there are emerging derivative tenure systems, such as ac-
cess to land through informal land rental markets. For the purpose of this analysis, we consider only those parcels owned by
households – that is, parcels accessed through rental market were not included in the analysis.
Table 5.1: Mode of acquisition and purpose of land use by region
Variables Tigray Amhara Oromiya SNNP
Mode of land acquisition, % of plots
Community allocated 79.0 60.2 51.1 13.1
Purchased 1.9 1.6 2.6 8.4
Inherited/Parental gift 19.0 38.1 46.1 78.5
Mortgaged 0.1 0.1 0.1 0.0
Total plots 4,757 6,803 5,781 3,508
Purpose of land use, % of plots
Owner operated 52.5 71.3 71.0 64.9
Rented out 1.9 1.5 1.5 0.4
Sharecropped out 5.7 10.1 4.7 1.0
Permanent 4.4 7.0 13.8 58.1
Fallowed 1.4 0.9 2.4 6.1
Average parcel size, ha 0.40 0.34 0.50 0.45
Households with plots with natural boundaries, % 62 58 46 21
Households with plots with clear boundary demarcation, % 82 89 92 94
Source: Author calculation from AGP dataset
Our parcel level analysis revealed that over 79 percent of parcels in Tigray are obtained through government alloca-
tion while only 19 percent are obtained through inheritance and parental gift. In striking contrast to Tigray, nearly 79 percent
of the parcels in SNNP are obtained through inheritance and parental gift, while only 13 percent are obtained through gov-
ernment allocation and 8.4 percent through purchases. In Amhara, over 60 percent of the parcels are obtained through gov-
ernment allocation, while 38 percent are obtained through inheritance and parental gift. Similar to the pattern seen in Am-
hara, over 51 percent of the parcels in Oromiya are obtained through government allocation, while 46 percent are obtained
through inheritance and parental gift (Table 5.1).
The analysis also revealed that the majority of the farm population has access to land, regardless of whether they
were in a position to be able to cultivate it. Nearly half of households in the four regions use the land for their own cultivation
of annual crops. The proportion of parcels with clear boundary demarcations is very high for all regions (Table 5.1).

9
5.1 Household and parcel level analysis of correlates of perceived land tenure
insecurity
Table 5.2 presents the means comparison test of tenure insecurity indicators on household characteristics. Per-
ceived risk of land dispute and the risk for government expropriation is positively associated with having a single, never mar-
ried status, and it is found to be statistically significant. However, when we analyzed the data at the parcel level, the analysis
did not reveal the existing statistically significant association between perceived risk of land dispute and being of single,
never married status (Table 5.2). On the other hand, the demand for further land demarcation is positively associated with
non-farm employment. Those who are engaged in non-farm businesses are the ones who demand better protection of land
rights – and exhibit a greater preference for participating in the second-level land certification process.
Table 5.2: Means comparison: Household characteristics versus tenure insecurity indicators
Variables
Perceived risk of land dispute
Perceived risk of expropriation
Demand for land demarcation
Yes No Yes No Yes No
Single, never married, 0/1 0.036 0.024** 0.030 0.026** 0.028 0.027
Widow, 0/1 0.163 0.179 0.176 0.156 0.166 0.191
Divorce, 0/1 0.052 0.033 0.040 0.039 0.041 0.026
Farming, 0/1 0.878 0.865 0.870 0.859 0.867 0.883
Domestic work, 0/1 0.076 0.093 0.082 0.108 0.089 0.080
Non-farm, 0/1 0.032 0.022 0.031 0.021 0.030 0.017***
Other, 0/1 0.014 0.020 0.018 0.012 0.015 0.020
Number of observations 2,566 3,725 5,864 1508 3,195 1,753
Source: Author calculation from AGP dataset
Table 5.3 indicates the association between the mode of land acquisition and the tenure insecurity variables. The
perceived risk of land disputes is positively associated with having the first-level land certification. Border disputes, being the
most likely dispute reported by the farmers, is positively associated with land acquisition through government allocation,
while it is negatively associated with land acquisition through inheritance. There exist a negative relationship between rela-
tive land abundance and tenure security of households. The likelihood of border disputes is positively associated with the
number of parcels and farm size of the households – households with relatively larger landholdings or number of parcels are
the ones who perceive that they face higher risks of boundary related disputes.
Table 5.3: Means comparison: mode/years of acquisition versus tenure insecurity
Variables
Perceived risk of land dispute
Most likely dispute is over borders
Perceived risk of expropriation
Demand for land demarcation
Yes No Yes No Yes No Yes No
Has certificate, 0/1 0.84 0.82* 0.85 0.79 0.82 0.80 1.00 1.00
Acquisition allocated, 0/1 0.40 0.39 0.43 0.37*** 0.40 0.39 0.40 0.44
Acquisition inherit, 0/1 0.56 0.58 0.54 0.60*** 0.57 0.58 0.56 0.55
Acquisition purchase, 0/1 0.04 0.03 0.03 0.04 0.04 0.03 0.05 0.02*
Maximum years since acquired 21.8 22.0 21.7 22.3 21.9 22.4 22.0 23.8*
Parcel distance, minutes travel time 13.0 12.4 12.0 12.6 12.1 13.0 12.1 12.7
Parcel number 3.09 2.96 3.13 2.79** 3.00 2.79 3.03 3.13
Farm size, ha 1.25 1.27 1.34 1.23** 1.26 1.36 1.35 1.38
Number of observations 2,566 3,725 3,766 3,608 7,492 7,492 3,195 1,753
Source: Author calculation form AGP dataset
Demand for further land demarcation is positively associated with land acquisition through purchases. Moreover,
consistent with the rationale for rolling out the second-level land certification, demand for second-level land certification is
negatively associated with the length of time the household takes to acquire its first farm (Table 5.3). This could be due to
lack of updates in the land registry system where parcels recently inherited or acquired could be the ones that are left without
proper documentation to protect the interest of new landholders, and thus afford higher demand for new demarcation
through the second-level certification.
10
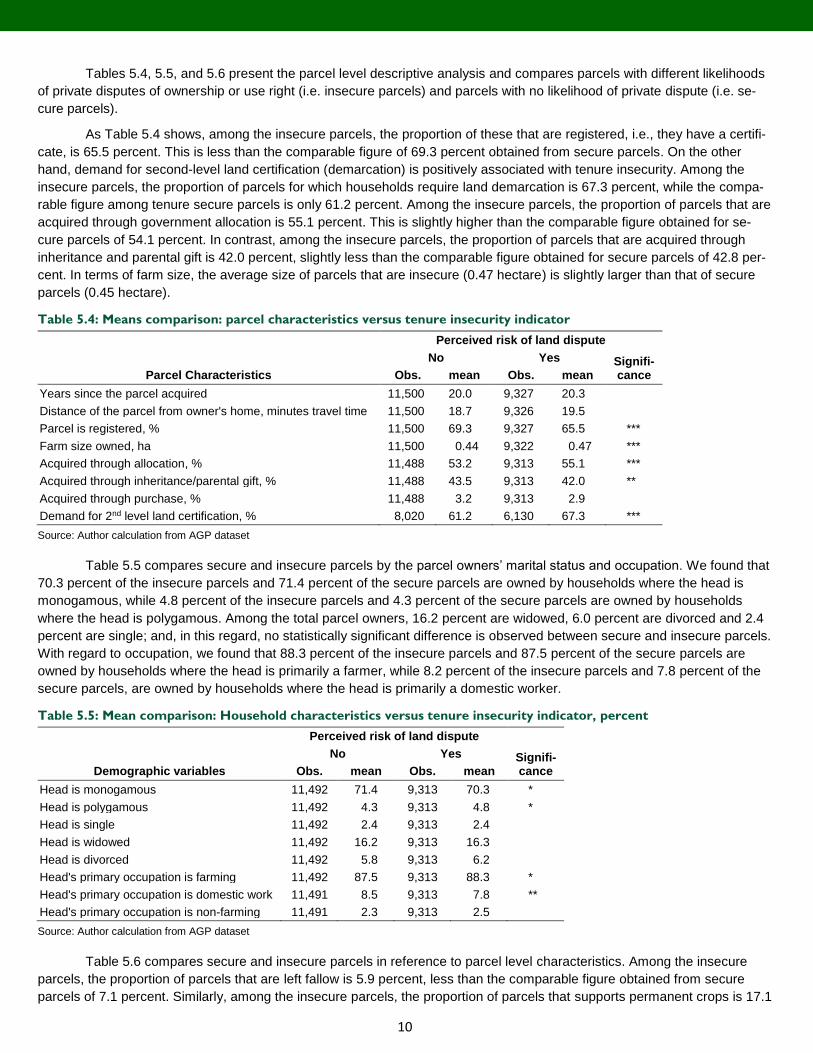
Tables 5.4, 5.5, and 5.6 present the parcel level descriptive analysis and compares parcels with different likelihoods
of private disputes of ownership or use right (i.e. insecure parcels) and parcels with no likelihood of private dispute (i.e. se-
cure parcels).
As Table 5.4 shows, among the insecure parcels, the proportion of these that are registered, i.e., they have a certifi-
cate, is 65.5 percent. This is less than the comparable figure of 69.3 percent obtained from secure parcels. On the other
hand, demand for second-level land certification (demarcation) is positively associated with tenure insecurity. Among the
insecure parcels, the proportion of parcels for which households require land demarcation is 67.3 percent, while the compa-
rable figure among tenure secure parcels is only 61.2 percent. Among the insecure parcels, the proportion of parcels that are
acquired through government allocation is 55.1 percent. This is slightly higher than the comparable figure obtained for se-
cure parcels of 54.1 percent. In contrast, among the insecure parcels, the proportion of parcels that are acquired through
inheritance and parental gift is 42.0 percent, slightly less than the comparable figure obtained for secure parcels of 42.8 per-
cent. In terms of farm size, the average size of parcels that are insecure (0.47 hectare) is slightly larger than that of secure
parcels (0.45 hectare).
Table 5.4: Means comparison: parcel characteristics versus tenure insecurity indicator
Parcel Characteristics
Perceived risk of land dispute
No Yes Signifi-cance Obs. mean Obs. mean
Years since the parcel acquired 11,500 20.0 9,327 20.3
Distance of the parcel from owner's home, minutes travel time 11,500 18.7 9,326 19.5
Parcel is registered, % 11,500 69.3 9,327 65.5 ***
Farm size owned, ha 11,500 0.44 9,322 0.47 ***
Acquired through allocation, % 11,488 53.2 9,313 55.1 ***
Acquired through inheritance/parental gift, % 11,488 43.5 9,313 42.0 **
Acquired through purchase, % 11,488 3.2 9,313 2.9
Demand for 2nd level land certification, % 8,020 61.2 6,130 67.3 ***
Source: Author calculation from AGP dataset
Table 5.5 compares secure and insecure parcels by the parcel owners’ marital status and occupation. We found that
70.3 percent of the insecure parcels and 71.4 percent of the secure parcels are owned by households where the head is
monogamous, while 4.8 percent of the insecure parcels and 4.3 percent of the secure parcels are owned by households
where the head is polygamous. Among the total parcel owners, 16.2 percent are widowed, 6.0 percent are divorced and 2.4
percent are single; and, in this regard, no statistically significant difference is observed between secure and insecure parcels.
With regard to occupation, we found that 88.3 percent of the insecure parcels and 87.5 percent of the secure parcels are
owned by households where the head is primarily a farmer, while 8.2 percent of the insecure parcels and 7.8 percent of the
secure parcels, are owned by households where the head is primarily a domestic worker.
Table 5.5: Mean comparison: Household characteristics versus tenure insecurity indicator, percent
Perceived risk of land dispute
No Yes Signifi-cance Demographic variables Obs. mean Obs. mean
Head is monogamous 11,492 71.4 9,313 70.3 *
Head is polygamous 11,492 4.3 9,313 4.8 *
Head is single 11,492 2.4 9,313 2.4
Head is widowed 11,492 16.2 9,313 16.3
Head is divorced 11,492 5.8 9,313 6.2
Head's primary occupation is farming 11,492 87.5 9,313 88.3 *
Head's primary occupation is domestic work 11,491 8.5 9,313 7.8 **
Head's primary occupation is non-farming 11,491 2.3 9,313 2.5
Source: Author calculation from AGP dataset
Table 5.6 compares secure and insecure parcels in reference to parcel level characteristics. Among the insecure
parcels, the proportion of parcels that are left fallow is 5.9 percent, less than the comparable figure obtained from secure
parcels of 7.1 percent. Similarly, among the insecure parcels, the proportion of parcels that supports permanent crops is 17.1

11
percent, higher than the comparable figure obtained from secure parcels of 19.7 percent. When we consider land rental,
among the insecure parcels, the proportion of parcels that are rented-out is 7.2 percent, which is less than the comparable
figure obtained from secure parcels of 7.9 percent. In contrast, 64.1 percent of secure parcels are owner-operated, com-
pared to only 61.0 percent of insecure parcels.
Table 5.6: Mean comparison: Parcel characteristics versus tenure insecurity, percent
Perceived risk of land dispute
No Yes Signifi-cance Obs. mean Obs. mean
Parcel has permanent crops 11,374 19.7 9,171 17.1 ***
Parcel is fallow 11374 7.1 9,171 5.9 ***
Parcel's slope is steep (gedel) 11,488 1.9 9,314 1.9
Parcel is rented-out 11,374 7.9 9,171 7.2 **
Parcel is owner operated 11,374 61.0 9,171 64.1 ***
Source: Author calculation from AGP dataset
General household characteristics of the sample are shown in Table 5.7. Average household size is about five per-
sons and is almost similar for all regions considered. Since the sampling procedure included 30 percent female-headed
households, the AGP dataset gives an opportunity to look at gender dimensions. Illiteracy is pervasive, where only 38 per-
cent of the household heads in the sample are literate with informal schooling and primary education level. The proportion of
households with no education is higher in Tigray and Amhara regions. Primary level education is higher for Oromiya and
SNNP.
Table 5.7: Basic household characteristics of the sample
Household characteristics Overall Tigray Amhara Oromiya SNNP
Household size 4.85 4.75 4.33 5.05 5.05
Male-headed households, % 69.0 68.7 69.5 69.0 70.0
Age of household head, years 45.0 45.1 45.3 44.9 43.4
Educational attainment, % of household heads
Illiterate 62.0 66.0 72.7 56.9 58.2
Informal education 4.7 6.5 12.6 1.8 1.3
Primary 29.6 25.3 13.8 36.5 34.9
Secondary 2.9 2.1 0.8 3.6 3.9
Higher education and above 0.8 0.0 0.2 1.2 0.7
Source: Author calculation from AGP dataset
Table 5.8 presents household land certification status and the demand for further land demarcation. This table
shows that about 68 percent of households have received a land certificate. The kebele level information which describes
the year in which land registration was completed shows that only 15 percent of households received land certificates before
the year 2000. This was because land registration only became widespread during 2011 and 2012 in most of the regions,
with the exception of Tigray region, where land certification first started in 2005/06. When we consider demand for the new
land demarcation, more than half of the households in the survey reported that they wanted additional delineation of the
boundaries of their plots. Some of the rationale behind further land demarcation could be related to an absence of neighbors
to serve as witnesses to the ownership of the land parcel. On the other hand, the border demarcation might become less
clear with time due to physical erosion that could destroy the natural boundary that was used for land parcel demarcation.
Questions were asked regarding the type of legal certificates that were held for each of the parcels. The survey result re-
veals that a large proportion of households have a land tax receipt as the legal document for their parcel, followed in second
place by an approved survey plan.

12
Table 5.8: Household land certification status and demand for new demarcation, percent
Land certification characteristics Percent
Households who have land certificates 68
Land certificate from before 2000 15
Land certificate from after 2000 85
Demand for new land demarcation 64
Type of land certificate
Land tax receipt 58.5
Approved survey plan 12.4
Family receipt 10.0
Green book 9.8
Registered purchase agreement 2.9
Will agreement 1.2
Unregistered purchase agreement 0.6
Building plan 0.1
Other 4.3
Source: Author calculation from AGP dataset
Table 5.9 presents the tenure security variables for each region. The perceived risk of land dispute is computed from
farmers’ perceptions about the likelihood of dispute on land ownership or land use right. The answers are summarized into
six categories. Farmers were asked to rank the likelihood of dispute as very high, high, moderate, low, very low, or not at all.
From this ranking, a dummy variable was constructed where a value of 1 was given to those respondents who indicated
some level of likelihood of dispute and a value of 0 was assigned to those who indicated there was no likelihood of dispute.
Moreover, perceived risk of land expropriation by the government in the five years following were constructed in the same
manner. Generally, parcels with perceived risk of private land dispute is high at 45 percent, while parcels with perceived risk
of government expropriation is low at 16 percent. However, the latter is relatively higher in Oromiya and SNNP regions and
low in Amhara
Table 5.9: Household land tenure security variables, percent
Tenure insecurity variables Overall Tigray Amhara Oromiya SNNP
Perceived risk of private land dispute 45 48 47 44 38
Perceived risk of land expropriation 16 18 11 20 20
Likelihood of border dispute 59 61 64 57 48
Source: Authors’ calculation from AGP dataset
Data on total farm size and parcel numbers owned by the household shows that the average household’s landhold-
ing is about 1.3 hectare, with the smallest average landholding in SNNP. Half of the households in the study overall had
landholdings which were less than one hectare. More than half of the households in Oromiya had landholdings of more than
one hectare. In terms of number of land parcels, the majority of households had on average three parcels with regional varia-
tion (Table 5.10). However, the average area of land operated per household member is quite small.
Table 5.10: Parcel number and size by region
Variables Overall Tigray Amhara Oromiya SNNP
Number of parcels, median 3 3 4 3 2
Farm size, ha 1.3 1.3 1.3 1.6 0.8
Households with overall farm size, %
Less than or equal to 1.0 ha 55.8 53.5 50.7 41.9 74.6
1.0 to 2.5 ha 32.3 32.8 38.6 38.9 20.0
More than 2.5 ha 13.0 13.6 10.7 19.1 5.3
Household size 4.8 4.7 4.3 5.0 5.0
Farm size per capita, ha/person 0.30 0.33 0.35 0.34 0.17
Source: Author calculation from AGP dataset
13
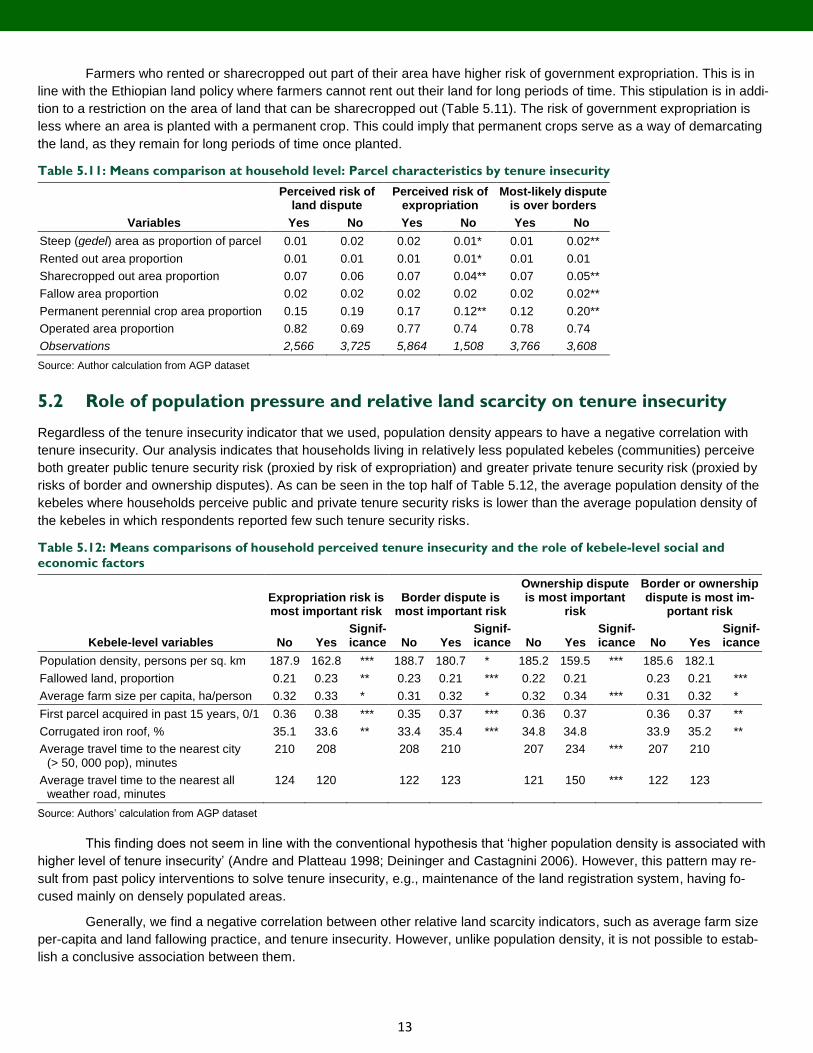
Farmers who rented or sharecropped out part of their area have higher risk of government expropriation. This is in
line with the Ethiopian land policy where farmers cannot rent out their land for long periods of time. This stipulation is in addi-
tion to a restriction on the area of land that can be sharecropped out (Table 5.11). The risk of government expropriation is
less where an area is planted with a permanent crop. This could imply that permanent crops serve as a way of demarcating
the land, as they remain for long periods of time once planted.
Table 5.11: Means comparison at household level: Parcel characteristics by tenure insecurity
Variables
Perceived risk of land dispute
Perceived risk of expropriation
Most-likely dispute is over borders
Yes No Yes No Yes No
Steep (gedel) area as proportion of parcel 0.01 0.02 0.02 0.01* 0.01 0.02**
Rented out area proportion 0.01 0.01 0.01 0.01* 0.01 0.01
Sharecropped out area proportion 0.07 0.06 0.07 0.04** 0.07 0.05**
Fallow area proportion 0.02 0.02 0.02 0.02 0.02 0.02**
Permanent perennial crop area proportion 0.15 0.19 0.17 0.12** 0.12 0.20**
Operated area proportion 0.82 0.69 0.77 0.74 0.78 0.74
Observations 2,566 3,725 5,864 1,508 3,766 3,608
Source: Author calculation from AGP dataset
5.2 Role of population pressure and relative land scarcity on tenure insecurity
Regardless of the tenure insecurity indicator that we used, population density appears to have a negative correlation with
tenure insecurity. Our analysis indicates that households living in relatively less populated kebeles (communities) perceive
both greater public tenure security risk (proxied by risk of expropriation) and greater private tenure security risk (proxied by
risks of border and ownership disputes). As can be seen in the top half of Table 5.12, the average population density of the
kebeles where households perceive public and private tenure security risks is lower than the average population density of
the kebeles in which respondents reported few such tenure security risks.
Table 5.12: Means comparisons of household perceived tenure insecurity and the role of kebele-level social and
economic factors
Expropriation risk is most important risk
Border dispute is most important risk
Ownership dispute is most important
risk
Border or ownership dispute is most im-
portant risk
Kebele-level variables No Yes Signif-icance No Yes
Signif-icance No Yes
Signif-icance No Yes
Signif-icance
Population density, persons per sq. km 187.9 162.8 *** 188.7 180.7 * 185.2 159.5 *** 185.6 182.1
Fallowed land, proportion 0.21 0.23 ** 0.23 0.21 *** 0.22 0.21 0.23 0.21 ***
Average farm size per capita, ha/person 0.32 0.33 * 0.31 0.32 * 0.32 0.34 *** 0.31 0.32 *
First parcel acquired in past 15 years, 0/1 0.36 0.38 *** 0.35 0.37 *** 0.36 0.37 0.36 0.37 **
Corrugated iron roof, % 35.1 33.6 ** 33.4 35.4 *** 34.8 34.8 33.9 35.2 **
Average travel time to the nearest city (> 50, 000 pop), minutes
210 208 208 210 207 234 *** 207 210
Average travel time to the nearest all weather road, minutes
124 120 122 123 121 150 *** 122 123
Source: Authors’ calculation from AGP dataset
This finding does not seem in line with the conventional hypothesis that ‘higher population density is associated with
higher level of tenure insecurity’ (Andre and Platteau 1998; Deininger and Castagnini 2006). However, this pattern may re-
sult from past policy interventions to solve tenure insecurity, e.g., maintenance of the land registration system, having fo-
cused mainly on densely populated areas.
Generally, we find a negative correlation between other relative land scarcity indicators, such as average farm size
per-capita and land fallowing practice, and tenure insecurity. However, unlike population density, it is not possible to estab-
lish a conclusive association between them.

14
We found average farm size per capita to be consistently positively correlated with tenure insecurity, regardless of
the category of risk, whether public tenure security risk or private tenure security risk, or the type of private tenure security
risk considered, i.e., border dispute risk versus ownership dispute risk. As shown in Table 5.12, the average farm size per-
capita of the kebeles where households who perceived public and private tenure security risks reside is higher than that of
other kebeles. This can be again due to the focus of past policy interventions in the densely populated areas.
Depending on the category of tenure security risk, i.e., whether public tenure security risk or private tenure security
risk, we used, we found mixed results when measuring the correlation between fallowing practice (the other proxy variable
we used to measure relative land scarcity) and tenure insecurity. On the one hand, our analysis suggests that fallowing prac-
tices are positively correlated with public tenure security risk, as proxied by expropriation risk. One the other hand, our analy-
sis suggests that fallowing practice is negatively correlated with private tenure security risk, regardless of the type of private
tenure security risk considered, i.e., whether border dispute risk or ownership dispute risk. From Table 5.12, the proportion of
fallowing-practicing households in the kebeles where households who perceive private tenure security risk reside is shown to
be lower than it is in the other kebeles. This suggests that it is government expropriation risk that is more of a threat to
households who practice land fallowing in Ethiopia than private tenure security risks.
5.3 Role of land use change and urbanization on tenure insecurity
Regardless of the tenure insecurity indicator we used, land use change appears to be positively correlated with ten-
ure insecurity. Our analysis indicates that households living in kebeles with higher proportions of new land holders perceive
both public tenure security risk and private tenure security risk. As can be seen in bottom half of Table 5.12, the proportion of
households that acquired their first piece of land within the past 15 years is higher in the kebeles where households perceive
public and private tenure security risks. This finding is consistent with our expectation that the 1995 decree to halt adminis-
trative land redistribution in Ethiopia has played a positive role in enhancing tenure security. Households that reside in vil-
lages with recent land redistribution programs have a higher perception of tenure insecurity, regardless of which alternative
indicator of tenure insecurity is used.
Depending on the category of tenure security risk, i.e., whether public tenure security risk or private tenure security
risk, and type of private security risk, i.e., whether border dispute risk or ownership dispute risk, we used, we found mixed
result when we measure the correlation between urbanization – being proxied by average number of houses with corrugated
roofs per kebele, average travel-time from the kebele to the nearest big city, and average travel-time from the kebele to the
nearest all-weather road – and tenure insecurity.
On the one hand, urbanization, as proxied by average number of houses with corrugated roofs per kebele, appears
to be negatively associated with public tenure security risk, as proxied by expropriation risk. On the other hand, urbanization,
as proxied by the average number of houses with corrugated roofs per kebele, appears to be positively associated with pri-
vate tenure security risk, as proxied by risk of border dispute. This finding is consistent with our assertion that there is a good
chance to see higher tenure insecurity associated with expropriation risks in remote rural areas, perhaps due to the restricted
use and transfer rights farmers have in such areas, while boundary related tenure risks are more common in urban or peri-
urban locations. This is an important finding, as policy actions to address each source of tenure insecurity may need to be
tailored depending on their significance in dictating households’ perceived tenure insecurity. Land demarcation interventions
are needed in areas where there is perception of significant boundary associated tenure risks, whereas regulatory and legis-
lative reforms could be best suited to address the situation in areas where farming households perceive significant expropria-
tion related tenure risks.
6. MODELING RESULTS AND DISCUSSION
Table 6.1 presents the household-level logistic regression outcomes on the probability of demand for second-level land certi-
fication. Descriptive results presented in Appendix 6.1 and Appendix 6.2 vindicated our approach to household-level demand
analysis, as most of the parcel-level analyses on perceived tenure insecurity indicate that there is little parcel-specific varia-
tions to responses captured at parcel-level. When we calculated the percentage of interviewed households that gave the
same responses (either as entirely “Yes” or entirely “No”) to questions which captured tenure insecurity at parcel level – such
as experience of past land related disputes; level of private land dispute risk; level of government land expropriation risk;
level of confidence about compensation in case of expropriation; clarity of parcel boundary mark; and mode of parcel acqui-
sition – the proportion of households with the same responses for all their parcels range from 81 to 98 percent. Hence, our
household-level analysis to determine factors associated with demand for second-level land certification is justifiable. The

15
first two columns (Model-1 and Model-2) in Table 6.1 show the results of the logit model without the regional clusters in-
cluded, while model-3 presents the results obtained after controlling for regional clusters, using Oromia region as a baseline.
Empirical results remain robust across the three alternative models.
Table 6.1: Factors associated with household level demand for second-level land certification – logistic model
Explanatory Variables Model - 1 Mfx/(se)
Model - 2 Mfx/(se)
Model - 3 Mfx/(se)
Perceived risk of government expropriation, 0/1 -0.011 -0.014 0.002
(0.03) (0.04) (0.04)
Perceived risk of private dispute, 0/1 0.047* 0.052* 0.062**
(0.03) (0.03) (0.03)
Made expenditures on a new house, 0/1 0.077*** 0.082*** 0.076***
(0.02) (0.03) (0.03)
Land area rented out, proportion 0.000 -0.047 -0.107*
(0.04) (0.06) (0.06)
Interaction term (Rented out * Gender) -0.131** -0.119 -0.064
(0.07) (0.09) (0.09)
Land area with natural boundary, proportion -0.001 -0.001
(0.01) (0.01)
Parcels with fertile soil, number 0.005 0.002
(0.01) (0.01)
Current head is holder of the certificate, 0/1 0.022 0.048*
(0.03) (0.03)
Years with certificate -0.005 -0.005
(0.01) (0.01)
Border dispute experience, 0/1 0.069*** 0.066***
(0.02) (0.02)
Clear border demarcation before registration, 0/1 0.123*** 0.138***
(0.04) (0.04)
Protect against encroachment, 0/1 0.153*** 0.150***
(0.03) (0.03)
Marital status (1=single) 0.005 (0.01)
(0.03) (0.03)
Age of household head (years) 0.000 -0.001
0.000 0.00
Male household head, 0/1 0.001 (0.02)
(0.02) (0.02)
Household size 0.000 0.004
(0.01) (0.01)
Farm size per capita, ha/person 0.014 0.04
(0.03) (0.03)
Land predominantly acquired via inheritance, 0/1 -0.043* -0.041*
(0.02) (0.02)
Years since first parcel acquisition -0.002** -0.002**
(0.001) (0.001)
Distance to market (km) 0.001 0.001**
(0.001) 0.000
Tigray region 0.113*
(0.06)
Amhara region 0.041
(0.05)
SNNP region -0.124***
(0.05)
Number of observations 3,936 3,377 3,377
Probability > Chi2 0.0023 0.0000 0.0000
Pseudo R2 0.0055 0.0918 0.1563
Log likelihood -3190.47 -1899.67 -1667.99
Source: Authors calculation from AGP data. Note: Figures in parentheses are standard errors. Significance levels: * 10% level, ** 5% level, *** 1% level, **** 0.1% level.

16
Consistent with the results from the descriptive analysis from Section 5, the results shown in Table 6.1 reveal that
households that experienced border disputes before the first-level land registration was implemented are more likely to be
interested in a second-level certificate. This indicates the impact that greater tenure insecurity due to past conflict experience
has on demand for certificates with clear boundary demarcations. Our empirical findings show significant perceived tenure
insecurity on household demand for more protection of land rights. Moreover, households with higher perceived risk of pri-
vate land disputes are more likely to be interested in the second-level land certificates.
We find that respondents are more likely to be interested and to have better awareness of the benefits of second-
level certification based on their expectation that this will provide better protection against encroachment. This is perhaps
because the first-level land certification used general boundaries to identify parcels which are not suitable for resolving po-
tential disputes related to encroachment of boundaries, since no parcel demarcation was done.
None of the household demographic variables, such as, age, marital status, gender of the household head, etc.,
were found to be significantly associated with demand for second-level land certification. However, other household level
variables, such as modes of land acquisition, incidences of investment in building, and the time since acquiring the first par-
cel, are strongly associated with explaining demand for the second-level land certification.
Consistent with results from our descriptive analysis, the regression results reveal that the length of time since a
household acquired its first parcel is negatively associated with an interest in obtaining a second-level certificate. This could
be because these households are likely to feel more secure with respect to their land tenure, compared to new landholders
(recent settlers) who could be victims of a neglected land registry system which characterizes the land registration process in
Ethiopia (Deininger et al. 2008). As far as the latter group is concerned, the demand for more protection of land rights
through second-level land certificates could be even higher since these groups are more likely to benefit from recent land
redistribution or inheritance, and thereby have more insecurity on their tenure rights over their parcels. Moreover, interest in
second-level land certification is significantly lower among households that predominantly acquired their parcels through
family inheritance, compared to those who acquired their parcels predominantly from government allocation or purchases2.
This could be due to frequent administrative redistribution of government allocated land in the past, which was driven by con-
siderations of equity in land distribution, causing such households to feel less secure about the perpetuity of their rights over
their land. Thereby, they demand better protection of their rights in the form of the second-level land certification.
Another interesting variable is the effect of a household’s investment in new houses or building structures. Our em-
pirical results reveal that those who built a new house or spent money to improve their house are more likely to seek clearer
demarcation of their landholdings. This could be interpreted in two ways. Firsts the variable can be taken as a proxy for the
status of the household by which the demand for further formalization of land is higher for better-off families. On the other
hand, households who invest in housing construction may be more tenure insecure, and building a new house may help en-
sure clearer boundaries.
After controlling for other factors, households in SNNP, the latest region to implement the first level land certification,
are less likely to demonstrate demand for the second-level land certification, while households from Tigray region, the first
region to implement the first level land certification almost nine years before the roll out in Oromia region (our baseline region
for the model), shows significantly higher demand for second-level land certification. This could be due to obsolete boundary
markings from the first-level land certification in Tigray, which may be less of an issue in areas where the first-level certifica-
tion process was conducted more recently, as in SNNP, or due to greater need for rights to be documented in areas where
the first level certification was administered 20 years ago, i.e., Tigray.
Second-level land certification depends also on market access, which in turn is associated with proximity to urban
settlements. Farmers residing in remote areas are more likely to demand proper land demarcation, though the effect is mar-
ginal. This could be due to the fact that those living far from a town are limited to a life of farming, and thus increasing their
tenure security might be very important to them. On the other hand, this could be also due to being near to town, which may
be dominated by informal settlers in slum areas. The landholding household may feel that in the process of further demarca-
tion by the government, this might result in having their land confiscated by the state and, hence, their demand for further
land certification decreases.
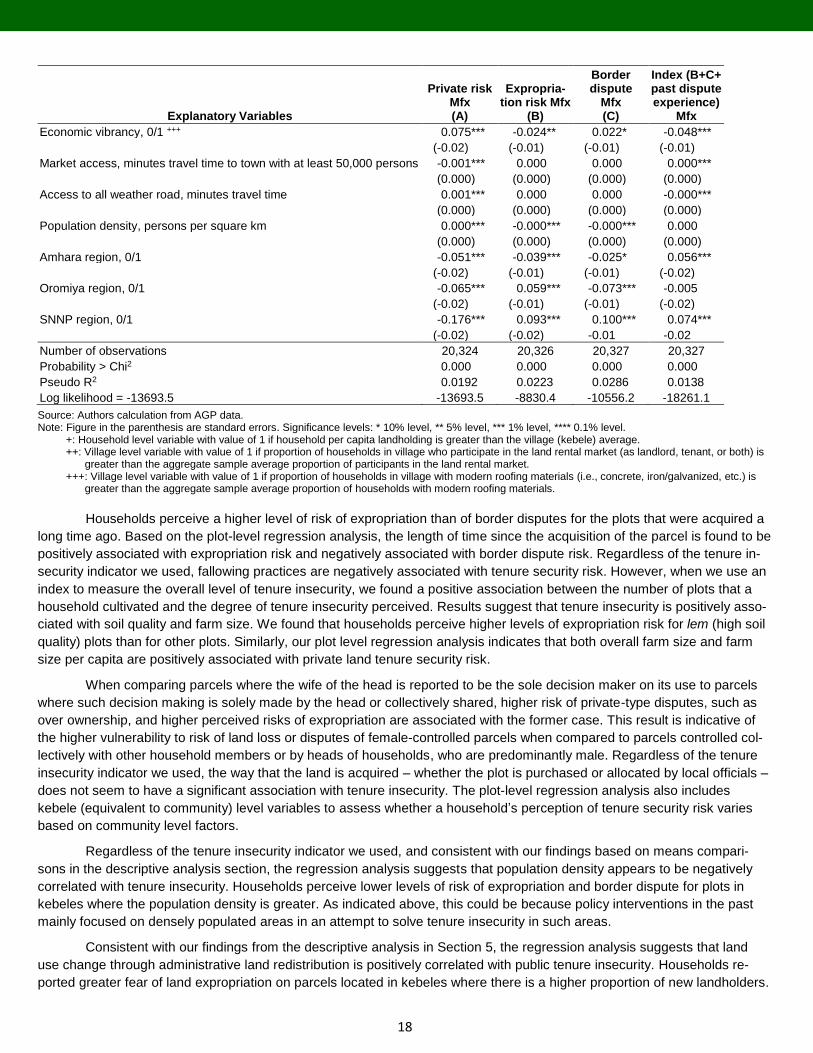
The next regression outcomes (Table 6.2) illustrate what factors determine the tenure insecurity of farm households.
Our plot-level regression analysis suggests that both public land tenure security risk, proxied by government expropriation
2 Land predominantly acquired via inheritance is equal to 1 if more than 50% of the parcels in the household are acquired via inheritance and 0 otherwise.

17
risk, and private land tenure security risk, proxied by border dispute risk, are positively associated with household-level rela-
tive land abundance, calculated as the ratio of farm size per capita to kebele average farm size per capita. This finding does
not seem to be in line with the conventional hypothesis that says ‘land scarcity is positively associated with level of tenure
insecurity’ (Andre and Platteau 1998; Deininger and Castagnini 2006). However, this also could be related to the fact that
past policy interventions that attempted to solve tenure insecurity in Ethiopia mainly focused on land-scarce areas, and could
possibly neglect parts of the country where land is abundant.
It seems that land certification tends to aggravate border dispute risk, even as it achieves its objective of curbing the
risk of expropriation. In this regard, the regression results suggest that households perceive a higher level of border dispute
risk for plots with certificates than plots without certificates. In connection to this, it is also observed that the lack of man-
made boundary demarcations seems to be positively associated with border dispute risk, as households are more fearful of
border disputes for plots that have only natural boundary demarcations.
Table 6.2: Regression results on plot level drivers of tenure insecurity using several indicators of tenure insecurity
Explanatory Variables
Private risk Mfx (A)
Expropria-tion risk Mfx
(B)
Border dispute
Mfx (C)
Index (B+C+ past dispute experience)
Mfx
Household-level relative land abundance, 0/1 + -0.001*** 0.001*** 0.000*** 0.000
(0.000) (0.000) (0.000) (0.000)
Interaction of farm size * Male household head -0.020* 0.017* -0.005 0.001
(-0.01) (-0.01) (-0.01) (-0.01)
Household rented out or sharecropped out, 0/1 0.008 -0.004 -0.023 -0.013
(-0.02) (-0.01) (-0.02) (-0.02)
Interaction rented out * Male household head -0.042 -0.027 -0.001 0.052*
(-0.03) (-0.02) (-0.02) (-0.03)
Community allocated land, 0/1 0.01 -0.002 0.009 -0.01
(-0.01) (-0.01) (-0.01) (-0.01)
Purchased land, 0/1 0.003 -0.022 0.021 0.014
(-0.02) (-0.01) (-0.02) (-0.02)
Farm size, ha 0.020** -0.013 0.000 -0.006
(-0.01) (-0.01) (-0.01) (-0.01)
Fallow plots, number -0.029** -0.022** -0.025** 0.024*
(-0.01) (-0.01) (-0.01) (-0.01)
Annually operated plots, number 0.005 0.004 0.006 -0.013***
(-0.01) (0.000) 0.000 (0.000)
Permanent plots, number -0.013** -0.005 -0.004 0.009
(-0.01) (-0.01) (-0.01) (-0.01)
Head makes decisions on land use solely, 0/1 -0.036** -0.01 0.043*** 0.042**
(-0.02) (-0.01) (-0.01) (-0.02)
Joint decisions by household member on land use, 0/1 -0.093*** -0.031** 0.035** 0.108***
(-0.02) (-0.01) (-0.01) (-0.02)
Natural boundary for border demarcation, 0/1 -0.005 -0.002 0.060*** 0.009
(-0.01) (-0.01) (-0.01) (-0.01)
Has land certificate, 0/1 -0.005 -0.022*** 0.022** 0.030***
(-0.01) (-0.01) (-0.01) (-0.01)
Age of household head, years -0.001*** 0.000 0.000 0.001***
(0.000) (0.000) (0.000) (0.000)
Male household head, 0/1 0.016 -0.003 0.009 -0.006
(-0.01) (-0.01) (-0.01) (-0.01)
Years since land acquisition 0.002*** 0.001*** -0.001** -0.002***
(0.000) (0.000) (0.000) (0.000)
Village average land size (ha) per capita 0.003*** 0.001 0.003*** -0.003***
(0.000) (0.000) (0.000) (0.000)
Village level prevalence of land markets, 0/1 ++ -0.253*** -0.009 0.243*** 0.216***
(-0.03) (-0.02) (-0.02) (-0.03)
Households which first land owned within 15 years, proportion 0.153*** 0.062*** -0.255*** -0.203***
(-0.03) (-0.02) (-0.03) (-0.03)
18
Explanatory Variables
Private risk Mfx (A)
Expropria-tion risk Mfx
(B)
Border dispute
Mfx (C)
Index (B+C+ past dispute experience)
Mfx
Economic vibrancy, 0/1 +++ 0.075*** -0.024** 0.022* -0.048***
(-0.02) (-0.01) (-0.01) (-0.01)
Market access, minutes travel time to town with at least 50,000 persons -0.001*** 0.000 0.000 0.000***
(0.000) (0.000) (0.000) (0.000)
Access to all weather road, minutes travel time 0.001*** 0.000 0.000 -0.000***
(0.000) (0.000) (0.000) (0.000)
Population density, persons per square km 0.000*** -0.000*** -0.000*** 0.000
(0.000) (0.000) (0.000) (0.000)
Amhara region, 0/1 -0.051*** -0.039*** -0.025* 0.056***
(-0.02) (-0.01) (-0.01) (-0.02)
Oromiya region, 0/1 -0.065*** 0.059*** -0.073*** -0.005
(-0.02) (-0.01) (-0.01) (-0.02)
SNNP region, 0/1 -0.176*** 0.093*** 0.100*** 0.074***
(-0.02) (-0.02) -0.01 -0.02
Number of observations 20,324 20,326 20,327 20,327
Probability > Chi2 0.000 0.000 0.000 0.000
Pseudo R2 0.0192 0.0223 0.0286 0.0138
Log likelihood = -13693.5 -13693.5 -8830.4 -10556.2 -18261.1
Source: Authors calculation from AGP data. Note: Figure in the parenthesis are standard errors. Significance levels: * 10% level, ** 5% level, *** 1% level, **** 0.1% level.
+: Household level variable with value of 1 if household per capita landholding is greater than the village (kebele) average. ++: Village level variable with value of 1 if proportion of households in village who participate in the land rental market (as landlord, tenant, or both) is
greater than the aggregate sample average proportion of participants in the land rental market. +++: Village level variable with value of 1 if proportion of households in village with modern roofing materials (i.e., concrete, iron/galvanized, etc.) is
greater than the aggregate sample average proportion of households with modern roofing materials.
Households perceive a higher level of risk of expropriation than of border disputes for the plots that were acquired a
long time ago. Based on the plot-level regression analysis, the length of time since the acquisition of the parcel is found to be
positively associated with expropriation risk and negatively associated with border dispute risk. Regardless of the tenure in-
security indicator we used, fallowing practices are negatively associated with tenure security risk. However, when we use an
index to measure the overall level of tenure insecurity, we found a positive association between the number of plots that a
household cultivated and the degree of tenure insecurity perceived. Results suggest that tenure insecurity is positively asso-
ciated with soil quality and farm size. We found that households perceive higher levels of expropriation risk for lem (high soil
quality) plots than for other plots. Similarly, our plot level regression analysis indicates that both overall farm size and farm
size per capita are positively associated with private land tenure security risk.
When comparing parcels where the wife of the head is reported to be the sole decision maker on its use to parcels
where such decision making is solely made by the head or collectively shared, higher risk of private-type disputes, such as
over ownership, and higher perceived risks of expropriation are associated with the former case. This result is indicative of
the higher vulnerability to risk of land loss or disputes of female-controlled parcels when compared to parcels controlled col-
lectively with other household members or by heads of households, who are predominantly male. Regardless of the tenure
insecurity indicator we used, the way that the land is acquired – whether the plot is purchased or allocated by local officials –
does not seem to have a significant association with tenure insecurity. The plot-level regression analysis also includes
kebele (equivalent to community) level variables to assess whether a household’s perception of tenure security risk varies
based on community level factors.
Regardless of the tenure insecurity indicator we used, and consistent with our findings based on means compari-
sons in the descriptive analysis section, the regression analysis suggests that population density appears to be negatively
correlated with tenure insecurity. Households perceive lower levels of risk of expropriation and border dispute for plots in
kebeles where the population density is greater. As indicated above, this could be because policy interventions in the past
mainly focused on densely populated areas in an attempt to solve tenure insecurity in such areas.
Consistent with our findings from the descriptive analysis in Section 5, the regression analysis suggests that land
use change through administrative land redistribution is positively correlated with public tenure insecurity. Households re-
ported greater fear of land expropriation on parcels located in kebeles where there is a higher proportion of new landholders.
19
This result suggests that the land decree of 1975 (“land to the tiller”) continues to influence households with respect to their
perceived risk of land expropriation. However, the contrary holds true for boundary-related disputes. This is consistent with
the government-claimed rationale for rolling out the second-level land certification, i.e., the need for further demarcation due
to increasing losses in the general boundary markings of a majority of parcels, especially in areas where land was re-distrib-
uted or re-allocated a long time ago.
Consistent with the earlier descriptive results, the regression analyses suggest that the degree of economic vibrancy
in an area (urbanization) is positively correlated with private tenure security risk, yet it is negatively correlated with expropria-
tion risk. Moreover, households have a higher fear of border disputes for plots in kebeles where there is higher level of eco-
nomic vibrancy, while the opposite is true for tenure risks associated with fear of government expropriation of land. Gener-
ally, as compared to Tigray, Oromiya and SNNP have higher levels of expropriation risk, while Amhara region has lower lev-
els of expropriation risk. This could possibly be related to the fact that the extent of private large and medium scale land ac-
quisitions are higher in Oromiya and SNNP than is the case in Amhara and Tigray. In contrast, as compared to Tigray,
SNNP has higher levels of border dispute risk, while Oromiya and Amhara regions have lower levels of dispute risk.
7. CONCLUSION
This study assessed the demand for further formalization of land rights in Ethiopia using household and parcel-level data
from the four major agricultural regions of the country. Overall, there is significant variation among regions in terms of the
predominant mode of land acquisition. For instance, 63.2 percent of the households in Tigray stated that they obtained all of
their parcels through government allocation, while 74.3 percent of the households in SNNP obtained all of their parcels
through inheritance and parental gift. On the other hand, nearly 45 percent of the households in Amhara obtained their par-
cels through government allocation, while nearly 42 percent of the households in Oromiya obtained all of their parcels
through inheritance and parental gift. This is consistent with the findings from the parcel-level data analysis. This suggests
that land policy interventions, including the introduction of second-level land certification, should be context specific by taking
into account regional differences in customs and norms of land transfers and administration.
Regardless of the tenure insecurity indicator we used, and based on the kebele-level descriptive analysis, population
density appears to be negatively correlated with tenure insecurity. Similarly, in line with our findings on the relation between
population density and tenure insecurity, our kebele-level descriptive analysis reveals a negative correlation between the
other relative land scarcity indicators, i.e., average farm size per-capita and land fallowing practice, with tenure insecurity.
These findings do not seem in line with the conventional hypothesis which claims ‘higher population density is associated
with higher level of tenure insecurity ’. However, this may not always be the case. Specially, there is a good chance of higher
tenure insecurity in less densely populated parts following the effects of past policies which addressed insecurity in popu-
lated areas and neglected less densely populated parts. Findings also suggest that government expropriation risk is more of
a threat to households who practice land fallowing. Moreover, descriptive findings are also consistent with our assertion that
higher tenure insecurity is associated with expropriation risks in remote rural areas, while boundary-related tenure risks are
more common in urban or peri-urban locations. This is important as policy actions to address each sources of tenure insecu-
rity may need to be tailored depending on their significance in dictating households’ perceptions of tenure insecurity. For ex-
ample, land demarcation interventions are required where there are boundary-associated tenure risks, whereas regulatory
and legislative reforms could be best suited to address expropriation-related tenure risks.
Our plot-level regression analysis suggests that both public land tenure security risk, proxied by expropriation risk,
and private land tenure security risk, proxied by border dispute risk, are positively associated with household level relative
land abundance. It also suggests that land certification tends to aggravate border dispute risk, while it seems to achieve its
objective of curbing risk of expropriation. In connection to this, it is also observed that a lack of man-made boundary demar-
cations seems to be positively associated with border dispute risk as households fear border disputes for plots that have only
natural boundary demarcations. In contrast to the results obtained in the descriptive analysis, the regression result indicates
that households perceive higher levels of expropriation risk for plots that were acquired a long time ago, though they per-
ceive less border dispute risk for such plots. The regression results also suggest that tenure insecurity is positively associ-
ated with soil quality and farm size. When we look at decision making over parcel use and explaining who has control over
how the land is used, sole decision making by the head or collective decision making by members of the household is nega-
tively associated with both risk of private-type disputes over ownership and public-type disputes, including risks of expropria-
tion by the government. This indicates the high vulnerability of female, spouse-controlled parcels to risks of both private-type
and public-type disputes.
20
Regardless of the tenure insecurity indicator we used, consistent with our findings based on means comparisons in
the descriptive analysis section, the regression analysis suggests that kebele-level population density appears to have a
negative correlation with tenure insecurity. Similarly, the same regression analysis suggests land use change to be positively
correlated with expropriation risk and negatively correlated with border dispute risk.
Generally, compared to Tigray, Oromiya and SNNP have a higher level of expropriation risk, while Amhara region
has a lower level of expropriation risk. This could possibly be related to private large and medium scale land acquisitions
being higher in Oromiya and SNNP than in Amhara and Tigray. In contrast, as compared to Tigray, SNNP has a higher level
of border dispute risk, while Oromiya and Amhara regions have a lower level of dispute risk. This could be related to the high
level of land scarcity in SNNP. This suggests that, in terms of policy intervention, a cautious and pragmatic approach that
takes into account observed regional variations is required.
The parcel-level descriptive analysis suggests a negative association between land registration and the likelihood of
private land dispute. Furthermore, the demand for second-level land certification (demarcation) is positively associated with
tenure insecurity. This shows the relevance of land certification in terms of improving tenure security. Generally, the per-
ceived risk of government expropriation and border disputes and, consequently, the demand for land demarcation is still high
in Ethiopia
Households with border dispute experience perceive a higher risk of tenure insecurity and are more likely to demand
new formalization of land rights. Private land tenure security risk is positively associated with the number of parcels and farm
size of the households. The results from the logistic model confirmed that demand for land demarcation is associated with
the time of land acquisition. Households who acquired their land a long time ago are less tenure insecure and are less likely
to demand second-level land certification.
Moreover, results from the logistic model reveal that households that experienced border dispute before the imple-
mentation of the first-level land registration, as well as households with a higher perceived risk of private land disputes, are
more likely to be interested in a second-level certificate. Similarly, according to the logit model results, individuals who have
greater awareness of the features of second-level land certification, such as demarcation, are more likely to be interested in
this certification. Among households that predominantly acquired their parcels through family inheritance, second-level certi-
fication is significantly higher, compared to those who acquire their parcels predominantly from government allocation or pur-
chases. Interestingly, after controlling for other factors, households in SNNP, which is the latest region to implement the first
level land certification, are less likely to demonstrate demand for the second-level land certification, while households from
Tigray, the first region to implement the first level land certification starting nine years ago, show significantly higher demand
for the second-level land certification, compared to Oromiya.
Overall, the fact that border dispute experience is positively associated with demand for second-level land certifica-
tion, suggests that the implementation of the second-level land certification needs to be implemented gradually, while giving
priority to areas where land disputes are common and possibly based on need. Similarly, consideration should be paid to the
fact that modes of land acquisition, incidences of investment in building structures, and the length of time since first parcel
acquisition are all strongly associated with interest in obtaining a second-level certificate. Hence, the results indicate the im-
portance of effective targeting and prioritization, using these parameters in the implementation of the second-level land certi-
fication. On the other hand, the observed variation in the demand for the second-level land registration, based on house-
holds’ awareness of the added value second-level certification can bring, calls for the need for sensitization or knowledge
dissemination campaigns to maximize the impacts of the new intervention. Finally, as there is regional variation in the de-
mand for second-level land registration, the rollout strategy should not be a blanket solution for the entire nation. A cautious,
pragmatic approach is what is required, taking into account the drivers of perceived tenure insecurity and economic viability
of the program across the regions.
REFERENCES
Andre, C. and J.P. Platteau. 1998. "Land Relations under Unbearable Stress: Rwanda Caught in the Malthusian Trap." Jour-nal of Economic Behavior and Organization 34 (1): 1-47.
Benjaminsen, T.A., S. Holden, C. Lund, and E. Sjaastad. 2009. “Formalization of Land Rights: Some Empirical Evidence from Mali, Niger and South Africa.” Land Use Policy 26 (1):28–35.

21
Besley, T. 1995. “Property Rights and Investment Incentives: Theory and Evidence from Ghana.” Journal of Political Econo-my 103 (5): 903–37.
Besley, T. and R. Burgess. 2000. “Land Reform, Poverty Reduction, and Growth: Evidence from India.” The Quarterly Jour-nal of Economics 115 (2): 389–430.
Bezabih, M., A. Mannberg, and E. Siba. 2014. The Land Certification Program and Off-farm Employment in Ethiopia. Gran-tham Research Institute on Climate Change and the Environment Working Paper no. 168. London: London School of Economics and Political Science
Bezabih, M., S. Holden, and A. Mannberg. 2012. The Role of Land Certification in Reducing Gender Gaps in Productivity in Rural Ethiopia. CLTS Working Papers 1/12, Centre for Land Tenure Studies, Norwegian University of Life Science.
Cotula, L., C. Toulmin, and C. Hesse. 2004. Land Tenure and Administration in Africa: Lessons of Experience and Emerging Issues. International Institute for Environment and Development.
Deininger, K. 2003. “Land Markets in Developing and Transition Economies: Impact of Liberalization and Implications for Future Reform.” American Journal of Agricultural Economics 85 (5): 1217–1222.
Deininger, K. and R. Castagnini 2006. “Incidence and Impact of Land Conflict in Uganda”. Journal of Economic Behaviour and Organisation, 60 (3): 321–345.
Deininger, K., D.A. Ali, and T. Alemu. 2011. “Impacts of Land Certification on Tenure Security, Investment, and Land Market Participation: Evidence from Ethiopia.” Land Economics 87 (2): 312–334.
Deininger, K., D.A. Ali, S. Holden, and J. Zevenbergen. 2008. “Rural Land Certification in Ethiopia: Process, Initial Impact, and Implications for Other African Countries.” World Development 36 (10): 1786–1812.
Deininger, K., F. Byamugisha, S. Holden, D.A. Ali and J. Zevenbergen. 2005. Aid Memoire of World Bank’s Mission on Rural Land Policy in Ethiopia. Washington, DC: World Bank.
Elliott, D., and A. Gibson. 2012. Government for Growth (G4G): Second Stage Scoping Report. Final report. Durham, UK: Springfield Centre.
Feder, G., and A. Nishio. 1998. “The Benefits of Land Registration and Titling: Economic and Social Perspectives.” Land Use Policy 15 (1): 25–43.
Hagos, H.G., and S. Holden. 2013. Links Between Tenure Security and Food Security: Evidence from Ethiopia. IFPRI dis-cussion paper 1288. Washington, DC: International Food Policy Research Institute.
Holden, S., K. Deininger, and H. Ghebru. 2011. “Tenure Insecurity, Gender, Low-cost Land Certification and Land Rental Market Participation in Ethiopia.” Journal of Development Studies 47 (1): 31–47.
Holden, S.T., K. Deininger, and H. Ghebru. 2007. “Impacts of Low-Cost Land Certification on Investment and Productivity.” American Journal of Agricultural Economics 91 (2): 359–373.
IFAD. (International Fund for Agricultural Development). 2015. Strengthening Women’s Access to Land in Ethiopia – Ethio-pia Fact Sheet. Rome: IFAD. http://www.ifad.org/pub/land/ethiopia.pdf
Jacoby, H.G., and B. Minten. 2007. “Is Land Titling in Sub-Saharan Africa Cost-Effective? Evidence from Madagascar.” World Bank Economic Review 21 (3): 461–485.
LIFT (Land Investment for Transformation Program). 2014. Inception Report. Addis Ababa: UK Department for International Development.
Migot-Adholla, S., P. Hazell, B. Blarel, and F. Place. 1991. “Indigenous Land Rights Systems in sub-Saharan Africa: A Con-straint on Productivity?” World Bank Economic Review 5 (1): 155–175.
ORGUT. 2010. Building Better Livelihoods: Land Reform, Administration and Management and Land-related Investment. Stockholm: ORGUT. http://www.orgut.se/wp-content/uploads/2013/10/Building-better-livelihoods-Lands.pdf
Pender, J.L., and J.M. Kerr. 1994. “The Effect of Transferable Land Rights on Credit, Land Investment and Use: Evidence from South India.” Provo, Utah: Department of Economics, Brigham Young University.
USAID. 2011. USAID country profile: Property Rights and Resource Governance, Ethiopia
Williams, R. 2006. Generalized Ordered Logit/Partial Proportional Odds Models. Department of Sociology. West Bend, IN: University of Notre Dame.

22
APPENDICES
Appendix Table1: Proportion of households who gave uniform responses to key questions for all of their parcels, by
region
Key Questions Tigray Amhara Oromiya SNNP
How did your household acquire this parcel? 81.3 84.3 88.2 91.9
Have you had disputes over this parcel? 92.8 89.1 92.5 95.1
How likely will someone dispute your ownership or use right? 85.6 83.0 89.6 94.1
How confident are you that you will not lose this parcel due to gov-ernment expropriation?
83.6 88.4 89.7 93.4
How confident are you that you will receive compensation for this parcel if expropriated?
88.1 89.7 91.1 94.2
What is the first most likely issue that might spur disputes? 85.3 89.2 89.7 93.9
Does this parcel have a clearly marked boundary? 93.5 95.9 96.6 98.3
Source: Author calculation from AGP dataset
Appendix Table 2: Proportion of households who acquired all of their parcels exclusively from one source, percent
Tigray Amhara Oromiya SNNP
Allocated 63.2 44.8 40.3 9.4
Purchased 7.0 5.6 6.1 8.2
Inherited/Parent's Gift 11.0 33.7 41.8 74.3
Mortgaged/Pledged 0.1 0.1 0.1 0.0
No answer 0.1 0.1 0.0 0.0
Sub-total 81.3 84.3 88.2 91.9
Source: Author calculation from AGP dataset

About the Authors
Hosaena Ghebru Hagos is a Research Fellow in the Development Strategy and Governance Division of International Food
Policy Research Institute, based in Addis Ababa, Ethiopia. Bethelhem Koru is a Research Officer in the Ethiopia Strategy
Support Program (ESSP) of the International Food Policy Research Institute and the Ethiopian Development Research Insti-
tute (EDRI), Addis Ababa, Ethiopia. Alemayehu Seyoum Taffesse is a Senior Research Fellow in the Development Strat-
egy and Governance Division of the International Food Policy Research Institute, working within ESSP of IFPRI and EDRI.
About ESSP
The Ethiopia Strategy Support Program is an initiative to strengthen evidence-based policymaking in Ethiopia in the areas of
rural and agricultural development. Facilitated by the International Food Policy Research Institute (IFPRI), ESSP works
closely with the government of Ethiopia, the Ethiopian Development Research Institute (EDRI), and other development part-
ners to provide information relevant for the design and implementation of Ethiopia’s agricultural and rural development strat-
egies. For more information, see http://www.ifpri.org/book-757/ourwork/program/ethiopia-strategy-support-program or
http://essp.ifpri.info/ or http://www.edri-eth.org/.
About these working papers
The ESSP Working Papers contain preliminary material and research results from IFPRI and/or its partners in Ethiopia. The
papers are not subject to a formal peer review. They are circulated in order to stimulate discussion and critical comment. The
opinions are those of the authors and do not necessarily reflect those of their home institutions or supporting organizations.
INTERNATIONAL FOOD POLICY RESEARCH INSTITUTE
2033 K Street, NW | Washington, DC 20006-1002 USA | T: +1.202.862.5600 | F: +1.202.457.4439 | Skype: ifprihomeoffice | [email protected] | www.ifpri.org
IFPRI–ESSP ADDIS ABABA
P.O. Box 5689, Addis Ababa, Ethiopia | T: +251.11.617.2000 | F: +251.11.646.2318 | [email protected] | http://essp.ifpri.info
ETHIOPIAN DEVELOPMENT RESEARCH INSTITUTE
P.O. Box 2479, Addis Ababa, Ethiopia | T: +251.11.550.6066 ; +251.11.553.8633 | F: +251.11.550.5588 | [email protected] | www.edri-eth.org
The Ethiopia Strategy Support Program (ESSP) is financially supported by the United States Agency for International Development (USAID)
and the Department for International Development (DFID) of the United Kingdom. This publication has been prepared as an output of ESSP. It
has not been independently peer reviewed. Any opinions stated herein are those of the author(s) and are not necessarily representative of or
endorsed by the International Food Policy Research Institute or the Ethiopian Development Research Institute.
Copyright © 2016, International Food Policy Research Institute. All rights reserved.
To obtain permission to republish, contact [email protected].