household market participation behavior in small ruminants...
TRANSCRIPT

1
Household Market Participation Behavior in Small Ruminants in the Highlands of
Ethiopia: The Role of Herd Size, Herd Structure and Institutional Services
Berhanu Gebremedhin
1*, Dirk Hoekstra
1, Azage Tegegne
1, Kaleb Shiferaw
1 and Aklilu Bogale
1
1International Livestock Research Institute (ILRI), P.O.Box 5689, Addis Ababa, Ethiopia
*Corresponding author: [email protected]
Abstract
Small ruminants, which account for more than half of the domesticated ruminants in the
world, are an important component of the farming systems in most developing countries.
Despite their economic and social importance, socio-economic and marketing research
on small ruminants has so far been limited, a fact which also holds strongly true in
Ethiopia. This study, based on survey data of 5004 Ethiopian smallholder households,
uses analysis of descriptive information and econometric analysis to draw implications
to promote market orientation. Econometric results are based on estimation of bivariate,
ordinal, and multinomial probit models. We find that small ruminant herd size, large
ruminant herd size, herd structure, access to livestock market, and involvement in the
institutional services of extension and credit stand out as important factors affecting
market participation behavior of households. We find optimal herd size of 41 heads of
animals after which probability of participation as seller declines and an optimal herd
size of 21 heads of animals after which probability of participation as buyer declines.
Our results imply that an effective package of interventions to promote market oriented
small ruminant production will need to include development of livestock market
infrastructure and market institutions, improved access to extension and credit use,
efficient animal reproduction and management, and proper animal health care.
2
1. Introduction
Small ruminants, which account for more than half of the domesticated ruminants in the world,
are an important component of the farming systems in most developing countries (Tedeschi et
al., 2011; Kosgey, 2004). Between 1961 and 2006, the global population of small ruminants
increased from 1.35 billion to 1.94 billion (Tedeschi et al., 2011). Since they require less
investment compared to large ruminants, small ruminants are more suitable livelihood strategies
for resource poor households, and particularly for women who are often the most vulnerable
members of society in the developing world. In the crop-livestock mixed farming systems small
ruminants are considered as diversification strategy to cushion market and climatic risks and
optimize the use of available resources (Oluwatayo and Oluwatayo, 2012).
Sheep and goats have high adaptive capacities to survive and produce in difficult environments
which make them even more appropriate component in the face of climate change and adaptation
strategies for smallholder farmers (Gizaw, et al. 2010). For the rural part of most developing
countries that are characterized by widespread poverty, inadequate access to financial markets,
with ever decreasing land holding and recurring natural shocks, small ruminant production offers
an alternative livelihood option. The short reproductive cycle of small ruminants allows quick
stock recovery after losses due to droughts or diseases. Because of the ease to liquidate small
ruminants at times of household cash needs, small ruminants are sometimes dubbed as ‘village
banks’. Despite their social and economic role, however, production and marketing research on
small ruminants is limited (Tedeschi et al., 2011).
Ethiopia is one of the African countries with the largest small ruminant population in the
continent (Abebe, 2013). Recent estimate indicates that there are about 27.35 million sheep and
28.16 million goats in the country (CSA, 2014). Almost all of the small ruminant population is
comprised of local breeds. The CSA data further indicate that of those who own sheep or goat
about 64% and 58% own less than five heads of sheep and goats, respectively. Gezahegn et al
(2006) posit that small ruminants play a major role in the livelihoods of smallholders in the
mixed crop-livestock systems of the highlands of Ethiopia. However, the same study underlined
that there was little strategic production of livestock for marketing except for some sales targeted
at Ethiopian festivals.

3
Despite the importance of small ruminants in the livelihoods of rural households, the current
productivity of goats and sheep in developing countries remains low, mainly because of under-
feeding, poor management and diseases. In Ethiopia, traditional small ruminant production
technologies and practices render the productivity of the sub-sector low (Gizaw, 2010). This
means considerable increase in animal productivity and production can be achieved with
improved technology and management practices.
Promoting market orientation in small ruminant production requires an understanding of why
farmers opt to stay out of markets and the constraints they face in market participation1. Market
orientation is likely to facilitate the adoption of improved technologies and practices, thus
helping households to increase marketable surplus, with the resultant expected higher level
market participation (von Braun et al, 1994; Gebremedhin et al, 2006; Barret, 2008). Hence,
analysis of household market participation is fundamental to transforming small ruminant
production in developing countries. Such an analysis is particularly important in Ethiopia due to
the large population size of the animals.
This paper is aimed at analyzing the market participation behavior of small ruminant producers
in the crop-livestock mixed systems of the Ethiopian highlands. Based on analysis of descriptive
information, and econometric analysis of the determinants of household participation in selling
and buying small ruminants, market position of households (net seller, autarkic and net buyers),
and market participation regimes of households (non-seller non-buyer, seller only, buyer only,
and seller and buyer), the paper attempts to draw implication to improve market orientation and
participation of small ruminant producers. In particular, the paper analyses the roles of herd size
and her structure, and institutional services in promoting market participation of households in
small ruminants. Results are based on analysis of data from a survey of 5004 smallholder
households in the highlands of Ethiopia conducted in 2014.
The paper is organized as follows. The following section presents the conceptual framework of
the study, followed in section three by methods of the study. Section four discusses results of
1 We define market orientation as agricultural production systems where most of the produce is targeted for sales
and production decisions are based on market signals. Market participation refers to the actual involvement of
producers as sellers in the output market.

4
descriptive and econometric analysis. The last section concludes the paper and draws
implications.
2. Conceptual framework
The conceptual framework followed in this paper is based on the theoretical framework
developed by Barret (2008) and Boughton et al. (2007). The key features of the models are that
farm households access to markets are not uniform because households face differential
transaction costs due to household and farm specific characteristics as well as meso-level factors
related to spatial differences in costs of commerce and degree of competition among market
intermediaries. Hence, the core issues in the models are the effect of asset endowments and
access to physical and institutional infrastructure.
The question of what interventions are required to break smallholders in developing countries
out of the semi-subsistence poverty trap that locks them up in the vicious circle of poverty and
low productivity lies at the heart of agricultural and rural development policy of these countries
(Barret, 2008). Underlying this broad policy issue is the subsidiary question of how to improve
smallholder market participation and facilitate their transformation from semi-subsistence into
market orientation (Gebremedhin and Jaleta, 2012). Market participation is important because of
the static welfare effects of engagement in transactions due to specialization and comparative
advantages, as well as from the opportunities of larger-scale production in the face of non-trivial
fixed and sunk costs of production and marketing (Romer, 1994).
The low level equilibrium poverty trap that pre-dominates many farm households in many
developing countries is associated with semi-subsistence production using rudimentary
production technologies and limited assets, reinforced by weak access to physical and
institutional infrastructure, and the resultant limited participation in profitable markets (Barret,
2008). Market participation of smallholders is both a consequence as much as cause of
development, and just “getting prices right” may not induce broad-based, welfare-enhancing
market participation, as farm households need to have access to productive assets and improved
technologies to produce surplus to the market and generate reasonable return to their investment
(ibid, 2008). Micro- or meso-level interventions that shift productivity or demand or local-level
transaction costs are needed to generate behavioral or welfare effects. Access to adequate assets

5
and improved technologies that enhance productivity, and access to infrastructural and
institutional services that reduce production and marketing costs are necessary for smallholder’s
active engagement in markets.
Hence, the focus of this analysis is on herd size and herd structure (crucial asset bases for market
participation in small ruminants), and access to physical and institutional infrastructure.
Although asset endowments have been recognized as important determinants of market
participation, systematic analysis of the relationship between asset holdings and market
participation is limited (Boughton et al., 2007). We have not been able to control for variations
in technologies since production technologies in small ruminants are basically traditional and
uniform throughout the study area.
3. Empirical Models and Methods
3.1. Empirical model
Our specification of empirical models is based on the conceptual framework described in the
previous section and is divided into three (1) the determinants of market participation of
households as sellers and buyers of small ruminants, (2) the determinants of market position of
households (net sellers, autarkic, and net buyers), and (3) the determinants of market
participation regime of households (non-seller non-buyer, seller only, buyer only, and seller and
buyer). The focus of our analysis is on the effect of herd structure and size, and access to
services. However, in order to minimize the bias in estimating the marginal effect of these
variables, we also control for several household and community level variables. Hence, each of
our dependent variables of interest is modeled as a function of household characteristics (age,
sex and education of household head, household size, and household dependency ratio),
household assets (land, labor supply, physical assets excluding small and large ruminants, non-
farm income, and ownership of mobile), herd characteristics (small ruminant herd size, large
ruminant herd size, proportion of female animals in the herd, and number of dead animals in the
year), access to physical infrastructure (distance from household homestead to nearest livestock
market, and all weather road), household access to extension and credit services (distance from
household homestead to farmer training center or development agent post, whether household
received extension advice/training on improved livestock production the previous year, and

6
whether household had obtained credit during the previous year) and community level variable
(population density).
3.2. Method
3.2.1. Data sources
Results are based on analysis of data from a survey 5004 smallholder households and 497 rural
kebeles2 in the four highland regions of Ethiopia (Tigray; Amhara; Oromia; and Southern
Nations, Nationalities and Peoples (SNNP) regions). Ten zones were selected for the study from
which 72 districts were further identified. The study area accounts for about 13.6% of the
national area, 30% of the national3 sheep population, and 22.5% of the national goat population.
For sampling purposes, the study districts were stratified into 10 agro-ecologies, and farm
households were selected randomly based on proportional to size sampling technique. Data were
collected on household characteristics; household asset ownership; farm characteristics including
land holding, herd size and structure; access to physical and institutional infrastructure; and cash
earning of household. Survey was conducted in 2014 and referred to the 2012/2013 production
season.
3.2.2. Econometric approach
The econometric models used depend on the nature of the dependent variables. The dependent
variables used in this analysis are household participation in small ruminant markets as seller and
as buyer (bivariate outcome); household market participation position as net seller, autarkic and
net buyer (ordinal outcome); and household market participation regime as non-seller non-buyer,
seller only, buyer only, and buyer and seller (multinomial outcome), during the study year. The
choice between using separate probit models or a bivariate probit model to analyze the
determinants of household market participation decision as buyer and as seller is an empirical
question. Descriptive analysis of the buying and selling data show that more than 5% of
households that participated in the small ruminant market participated both as buyers and sellers.
Bivariate probit model estimation results also show a significant correlation between the two
2 A KebeleI is the lowest administrative unit in Ethiopia and comprises of 4-5 villages.
3 The national figures used to compute these percentages exclude the lowland non-sedentary zones of the Afar and
Somali regions.

7
binary outcomes. Hence, we used bivariate probit model to analyze the determinants of
household participation in selling and buying small ruminants. An order probit model was used
to analyze the determinants of household market participation position since the outcomes are
ordinal, while multinomial probit model was used to analyze the determinants of household
market participation status, since the outcomes are choices without any order attached to them.
Involvement in extension and use of credit are potentially endogenous variables, since they can
be related systematically to household or farm characteristics. To control for these potential
endogeneity, we use lagged value of these variables.
4. Results
4.1. Analysis of descriptive information
Small ruminant ownership
Table 1 presents small ruminant ownership structure. Among the surveyed households, 52.6% of
them own small ruminants, with an average ownership size of 7.8 heads, split into 4.7 heads of
sheep and 3.1 heads of goats. The sheep stock structure shows that about 48.9% of the sheep
stock is accounted for by ewes, followed by lambs which account for 34.1%. Mature male sheep
(rams and castrated sheep) account for only 17%. The goat stock structure also shows that about
48.4% of the goat flock is accounted for by does, followed by goat kids which account for
32.2%. Mature male goats account for only 19.4%. In terms of the total small ruminant stock
structure, ewes account for 29.5%, followed by lambs which account for about 20.5%. Does
account for about 19.2%. This herd structure clearly shows breeding stock dominate the herds.
TABLE 1 HERE
About 57.8% of small ruminant producers produce sheep without goats, and about 28.1%
produce goats without sheep. Just about 14% of producers produce both sheep and goats.
Because of the highland nature of the study area, sheep appear to be owned by a higher
percentage of households than goats. The results also show that sheep and goat production are, in
most parts, separate enterprises. Moreover, 52.5% of small ruminant producers rear sheep only
with cattle, while 26.3% produce goats only with cattle. Almost all the households who own both
sheep and goat also produce cattle. Only 5.3% of small ruminant owners rear only sheep

8
(without cattle or goats) and 1.8% rear only goats (without cattle and sheep). These results
indicate that small ruminant production is conducted jointly with cattle rearing.
The proportion of small ruminant producers who own the types of animals is given in Table 2.
About 66.2% of small ruminant producers own ewes, 36.1% own does, while 45% own lambs.
About 39% of small ruminant owners own does. Mature male sheep (castrated and un-castrated)
are owned by 38% of the producers, while mature male goats are owned by 23.7% of small
ruminant producers. This structure of stock also mirrors the primary reproduction objective of
producers.
TABLE 2 HERE
Among the sheep producers, only 7.8% did not have ewes in the stock, while among goat
producers, only 7.4% did not have does, reinforcing the result that reproductive female animals
are essential components of the small ruminant stock. On the other hand, among sheep producers
about 47.1% of them did not have rams, and among goat producers about 43.6% did not have
bucks, suggesting that significant number of small ruminant producers depend on other
household’s stock for mating their animals. This issue is likely to be of a more serious concern
with the declining availability of communal grazing lands
Among the households who owned small ruminants during the year, 7.5% (198 households) had
zero beginning stock, but acquired the animals during the year through purchases and gifts.
About 93% of these households acquired the animals through purchases, and 5.6% acquired
them through gifts. Of the purchases, about 70% of the animals were meant for reproductive
purpose, and only 13% were meant for reselling. Analysis of ending stock ownership reveals that
only 29% of the households who had zero beginning stock ended up with zero ending stock. On
the other hand, 11.3% (298 households) who had owned small ruminants during the year had no
ending stock, of which about 85% had non-zero beginning stock. These results show that while
some household get into small ruminant production, others exit from small ruminant production
during the year, although the proportion that exit is higher by about 4%.

9
Off-takes and inflows
We found a total gross off-take rate (total off-take as a sum of sales, deaths, given out as gift and
lost due to theft, divided by the sum of beginning stock and inflows during the year) of 34.3%
constituted by commercial off-take of 18.9%, slaughter of 4.5%, death of 10.1%, given out as
gift of 0.3% and loss due to theft of 0.3% (Table 3). We also found gross inflow rate (total inflow
as a sum of births, purchases, and received as gift, divided by the sum of beginning stock and
inflows during the year) of 22.5% constituted by inflow due to birth of 18.4%, purchase of 3.9%
and obtained as gift of 0.2%. These results show that births are the most important sources of
inflow and that there was a decrease in the stock of small ruminants by 11.8% during the year.
Negassa and Jabbar (2008) also found that there was 27% and 13% reduction in sheep and goats
stock within one year in their study areas in Ethiopia. We computed lambing and kidding rates of
66.6% and 67.4%, respectively.
TABLE 3 HERE
We also found gross net commercial off-take rate (sales less purchases divided by the sum of
beginning stock and inflows during the year) of 15.1% for small ruminants (Table 3).
Commercial off-take rates vary slightly between sheep and goats. We found gross commercial
off-take rate of 20.9% and 16% for sheep and goats, respectively. The corresponding net
commercial off-take rates for sheep and goats are 16.3% and 13.3%, respectively. Negassa and
Jabbar (2008), using Ethiopian CSA data, calculated gross commercial off-take rates of 19% and
15% for sheep and goats, respectively. The gross commercial off-take rates they calculated using
their own survey data was much higher at 34% and 30% for sheep and goats, respectively. On
average among the households who own small ruminants, we found net sales of 1.19 animals per
household. This was confirmed by the total number of sales of 3924 heads of small ruminants
versus a total purchase by producers of 802 heads of small ruminants among the 2634 owning
households.
About 27% of small ruminant owning households reported loss of small ruminants due to death
and about 23% of owning households reported slaughtering own animal for home consumption.
The slaughter rates for household consumption for sheep and goats were 4.8% and 4.2%,

10
respectively. Loss due to theft appears to be small, with only 1.5% of households reporting it,
and a lesser proportion (1.1%) reported giving out small ruminants as gift.
The small ruminant death rate we computed (about 10.1%) is lower than normally reported
(Table 3). It may be that the study year was a good season year in terms of rainfall and feed
availability as confirmed by community level data which shows that more than 68% of surveyed
communities reporting normal or above normal rainfall season and more than 62% reporting no
significant livestock diseases during the year. Death rates for sheep and goats are computed to
be 10.5% and 9.6%, respectively. The death rate figures for lambs and goat kids are 11.7% and
12%, respectively. The death rates of mature male sheep and goats are the lowest at 6.1% and
5.4%, respectively.
The most cited cause of loss of small ruminants due to death is diseases, which was reported by
99% of households who lost animals for death. Moreover, about 71% of deaths of small
ruminants were due to diseases. Injuries and accidents was the second important reported cause
of death of animals, reported by 22%, with about 16% of deaths accounted for by this incidence.
About 13% of households cited predators and feed shortage due to drought as causes of small
ruminant death, accounting for 9.4% of deaths.
Market participation
More than 51% of small ruminant owning households sold small ruminants during the study
period, while just about 13% bought the animals. About 7.5% of owners bought the animals to
build a new stock in the year. Hence, only 5.5% of households were purchasers who also had
own stock at the beginning of the study period. Analysis of the market participation regime of
households also shows that about 40% of owners remained non-seller non-buyer during the study
period, while about 46% and 8% of owners were sellers only nand buyers only, respectively.
Only about 5% of owners were involved in both buying and selling. Similarly, just above 50%
of owners were net sellers during the year, while about 41% and 9% of owners were autarkic and
net buyers, respectively. Among those who purchased small ruminants, the average purchase was
2.3 heads, while among those who sold the animals, the average sale was 2.9 heads. Among the
sold animals, about 31% were mature male sheep, followed by ewes (18%), does (16.6%), and
mature male goats (11.4%). We also computed the ratio between sales and slaughter for

11
household consumption of 4.35 for sheep and 3.85 for goats, suggesting that small ruminants are
kept primarily as source of cash for the household rather than for own consumption.
Mean t-tests of characteristics of small ruminant owners who participated in the market (either as
seller or buyer) and those who did not participate shows that participants have higher proportion
of households who slaughter for home consumption and slaughter higher proportion of their
stock, use more purchased feed, have larger herd size, and earn more income from non-farm
activities than non-participants. On the other hand, non-participants have higher land-labor ratio,
higher land per capita, and are farther away from livestock markets. We find no difference in
asset wealth between the two. These results show that non-market participants have better return
opportunities from land-based agricultural activities, while participants don’t seem to have these
opportunities because of smaller land holding. The comparative advantage of households with
small-land size appears to be on livestock production and non-farm income.
About 5% of small ruminant owners are involved in small ruminant fattening business. These
fatteners have been in the business for an average of 3.5 years. The average fattening cycle is 5
months. We found that the three major constraints faced by fatteners in their fattening business
are feed shortage, diseases and market problem in that order.
Reasons of selling and buying
Households reported meeting planned household expenses, meeting emergency household
expenses, removal of animal because of low productivity, removal of animal because of sickness,
and trading (buying and selling for profit) as reasons for selling small ruminants. More than 79%
of sellers cited meeting planned household expenses as a reason, followed by about 12% of
households who cited meeting emergency household expenses (Table 4). Similarly, about 74%
of sales were made to meet planned expenses, and about 11% of sales were made to meet
emergency expenses (Table 4). These results show that households do in fact plan ahead of time
on their sales of small ruminants to meet required household expenses. Trading was cited by only
about 3% of sellers.
TABLE 4 HERE
12
Small ruminant producers purchase small ruminants for different purposes. Among the reported
reasons were reproduction, replacement of unproductive or old animals, trading and household
consumption. About 66% of the household who purchased small ruminants made the purchase
for reproduction purposes, which accounted for about 62% of the purchases (Table 5). This was
followed by about 14.4% of the buyers reporting household consumption as a reason, and by
13.8% of households who reported trading. These results clearly show that most of the small
ruminants that are sold come from households own production. Most of the small ruminants that
are bought for reproduction purposes are ewes and does.
TABLE 5 HERE
Responsibility of selling and income control
More than 87% of the sales of small ruminants are done by the household head. The income
from the sales of small ruminants is controlled either by the head (in 41% of seller households)
or jointly by the head and the spouse (in 54% of seller households). The proportion of female
headed households among those who sold small ruminants was 15%. Hence, these results
indicate that in the highlands of Ethiopia, in about 69% of seller households, income from the
sale of small ruminants is controlled either by women or jointly by men and women, indicating
the importance of the proceeds for the welfare of household members. Studies on gender and
income control reported that income controlled by women is more likely to be used for
household consumption (Bertrand et al., 2013; Njuki and Mburu, 2013; Kariuki J. et al. 2013).
Market places and market channels
Small ruminants are sold at farm gate, in markets at the peasant association (PA), in markets in
nearby PAs, in district markets, and in zonal or regional markets. District markets account for
38.2% of sales followed by markets in nearby PAs which accounted for 35% (Table 6). Hence,
district markets and markets in other PAs are the most important market places for small
ruminant producers. Markets in the PAs in which a respondent household resides accounted for
17.4%. Farm gates, zonal and regional markets are the least used by small ruminant producers.
These results show that almost all sales of small ruminants by farmers are done in markets within

13
the district. The pattern of the importance of these market places remains almost the same when
disaggregated by type of animals sold (Table 6).
TABLE 6 HERE
In terms of market channels for producers, farmer-to-urban consumer, farmer-to retailer4, and
farmer-to-farmer channels stand out as most important channels, which account for 24.8%,
22.2% and 21.6% of sales, respectively (Table 7). Assemblers and wholesalers accounted for
17.1% and 13.1% of sales, respectively. It is interesting to note that there was no reported sale to
cooperatives, and sale to processors5 is the least important among the market channels that were
used by producers. There is variation in the importance of market places when analysis is
disaggregated by type of animal sold (Table 7). Farmer-to-farmer channels are more important
for ewes, does, and goat kids, perhaps because of the role of these types of animals in
reproduction which is the main purpose of purchases for farmers. The farmer-to-urban consumer
channel is more important for mature male sheep and goats.
TABLE 7 HERE
4.2. Econometric analysis results
In this section we present and discuss econometric results of the estimation of determinants of
household participation in small ruminant markets as seller and as buyer; the market
participation position of households as net seller, autarkic and net buyer; and the market
participation regime of households as non-seller non-buyer, seller only, buyer only, and seller
and buyer. Household characteristics included as explanatory variables are household size
(number of people), age of household head, sex of household head (male = 1), level of education
of head (years) and total household dependency ratio. Herd characteristics included as
explanatory variables are small ruminant herd size (number of small ruminants and its squared
value), herd size of large ruminants, proportion of female animals in the small ruminants herd,
and the number of small ruminants that died in the year. Household assets were measured in
household labor supply (members between 14 and 64 years of age), land size (ha), value of
4 Retailers are defined as those who sell live shoats to individual consumers or producers.
5 Processors include slaughter houses, butchers, or food processing business such as restaurants and hotels.

14
household physical assets excluding small and large ruminants (1000 Birr6), ownership of mobile
(Own=1), and non-farm income in the year (1000 Birr). Access to physical and institutional
infrastructure was measured in terms of walking time (minutes) to nearest livestock market and
all weather road, walking time (minutes) to farmer training center or development agent (DA)
post, and involvement in extension service and use of credit facilities the previous year. We also
controlled for population density at PA level. We included the squared value of the small
ruminants herd size in order to capture potential non-linear effect of herd size. We discuss the
results of econometric analysis of these models below. Descriptive statistics of the variables
included in the regression models are given in Table 8.
TABLE 8 HERE
Bivariate probit regression results
Table 9 presents the results of the maximum likelihood bivariate probit estimates of the models
explaining the probability of household participation in small ruminant markets as seller and as
buyer. The estimate of ρ (the correlation coefficient between the errors of the two binary
outcomes) that maximized the bivariate probit function is 0.096 and is significant at the 10%
level. This shows that the random disturbances in the small ruminant market participation
decisions of sellers and buyers are affected in the same directions by random shocks. The
implication is that the market participation decisions are not statistically independent. Separate
estimation of the equation would, therefore, lead to inefficient parameter estimates. The sample
value of the likelihood ratio is -1898.5074 and is significant at the 1% level, showing that the
independent variables taken together influence market participation decisions.
The results show that small ruminant herd size, participation in livestock extension service, and
use of credit services increase the probability of market participation as seller, all with expected
signs. Small ruminant herd size has significant non-linear effect on probability of selling, with an
optimal small ruminant herd size of 41 animals, beyond which probability of participation as
seller starts to decline. Herd size increases participation as seller because of the possibility to
produce surplus to market, result that is consistent with the findings of Negassa and Jabbar
(2008) in the highlands of Ethiopia, and Bellemare and Barret (2007) for the pastoral regions of
6 The exchange rate between the US dollar and Birr during the survey year was 1 USD = 19.25 Birr.

15
northern Kenya and Southern Ethiopia. The livestock development extension program increases
the probability of selling consistent with its core objectives of promoting household’s
involvement in market oriented livestock production. Use of credit facilities increases selling
since the imperfect or missing credit markets is a major constraint of investment in livestock in
the highlands of Ethiopia.
Large ruminant herd size, proportion of female animals in the herd, number of dead animals in
the year, land size, household wealth, and distance to nearest livestock market decrease the
probability of market participation as seller, also all with expected signs. Large ruminants may
be serving as alternative cash sources for households, thus detracting from selling small
ruminants. The number of dead animals reduces probability of selling, consistent with and
reinforcing the effect of larger herd size increasing the probability of selling. Female animals in
the herd are usually preferably kept for breeding purposes and in a small herd size such as shown
by the average stock size of sample households, the higher proportion of female animals is likely
to decrease selling at the margin because households retain female animals to sustain their stock.
Multivariate econometric results obtained by Barret et al. (2006) for pastoralists showed no
significant effect of proportion of female animals on livestock marketing behavior of herders.
Households with larger land size are more likely to depend on crop production and so the lower
likelihood for them to participate in the small ruminant markets as sellers. Such households may
have higher opportunity costs for involvement in market oriented small ruminant production.
Desta (1999) posits that in a local economy offering limited alternative livelihood strategies,
livestock are the most attractive assets available and a best option to meet future food security for
the household. Barret et al. (2006) also reported that the low market participation sites in their
study areas were the areas which had the best alternative livelihoods.
The farther the household resides from the nearest livestock market, the less likely it will be
involved in selling due to both fixed and variable marketing costs. Distant markets can be source
of fixed costs in the form of transport and lodging for the participant, as well as variable costs.
Barret et al. (2006) also found that reduced costs to market participation for Ethiopian
pastoralists stimulate livestock marketing at the margin.
TABLE 9 HERE

16
Marginal effect coefficients of the bivariate model are given in Table (10). Marginal effect
results show that involvements in extension and use of credit have higher marginal effects.
Involvement in livestock extension and use of credit increase the probability of a seller by about
6% and 7%, respectively, while one more animal in the herd increases probability of
participation as a seller by 4.2%. The small effect of an increase of one head of animal to the
heard on the probability of market participation shows that the average herd size is too small to
promote market orientation and significant effort is needed to raise the herd size to an optimal
level of 41 heads of animals.
TABLE 10 HERE
The combined effect of these variables on market participation could guide the development of
small ruminant extension package. An increase of herd size by 10 animals combined with
involvement in extension and credit increases the probability of market participation as a seller
by more than 55%. These results suggest that improved production supported with strengthened
livestock extension service and availability of credit facilities to small ruminant producers can be
helpful in encouraging market oriented small ruminant production.
The effect of proportion of female animals in the herd is also important: ten percent increase in
the proportion of female animal decreases probability of a selling by almost 4%, and death of
one animal decreases probability of selling by about 3%. A reduction of two hours walking
distance to livestock market increases the probability of participation as seller by about 7.2%.
better livestock health service, development of livestock market places, improvement of access
to road and transport infrastructure and collective action to sell small ruminants may be potential
option to explore to reduce marketing costs. Our results show that the development of livestock
markets, market institutions and transportation infrastructure should be combined with improved
production, health care, and access to extension and credit services for highest impact to promote
market oriented small ruminant production.
The results also show that household wealth (value of physical assets excluding small and large
ruminants), herd size, involvement in livestock extension, and use of credit services increase the
probability of buying, all with expected signs. Small ruminant herd size has a significant
quadratic effect on probability of selling, with an optimal size of 21 animals, beyond which

17
probability of buying starts to decline, suggesting that herd size of 21 animals can be adequately
self-sustaining in the highlands. Descriptive analysis results show that most of the purchases
made by households were meant for reproduction purposes. Hence, herd size, not only
encourages selling, but also buying apparently in order to build stock and produce marketable
surplus. This effect of herd size on the probability of selling and buying suggests that building
herd size is crucial for market oriented small ruminant production. Interestingly, we also find that
large ruminants herd size increases probability of buying, perhaps because income from large
ruminants may be used to finance purchase of small ruminants.
The livestock extension service increases probability of buying, in addition to its positive effect
on the probability of selling. The livestock extension package seems to have started showing
effect in promoting market oriented small ruminant production. Access and use of credit
facilities also increase probability of buying and selling, suggesting that livestock credit facilities
are important to promote market oriented livestock production. Marginal effect results show that
one more small ruminant to the herd increases probability of buying by about 7%, while one
more large ruminant increases the probability by about 2%. Involvement in extension and use of
credit increase the probability of buying by about 2% each.
Ordered probit regression results
Table 11 presents the results of the maximum likelihood ordered probit equation explaining the
probability of household positions in the market. The model is significant at 1% level, showing
that the independent variables taken together explain the market position of households. Results
of the ordered probit reinforce the findings in the bivariate probit estimation. Results show that
household total dependency ratio, small ruminant herd size, and use of credit increase the
probability of a household being a net seller, all with expected signs. Higher dependency ratio
increases household cash requirements to cover miscellaneous expenses related with dependents,
and raises the probability of a household being net seller than autarkic or net buyer. As herd size
increases, household is more likely to be net seller than to be autarkic or net buyer because of the
effect to have surplus for sale, other things held constant. Credit, by easing the liquidity
constraints to invest in livestock, increases the probability of being net seller. On the other hand,
land size, large ruminant herd size, proportion of female animals, number of dead animals, and

18
distance to livestock market decrease the probability of net selling. These same variables, except
dependency ratio, also reduce the probability of household participation as seller.
TABLE 11 HERE
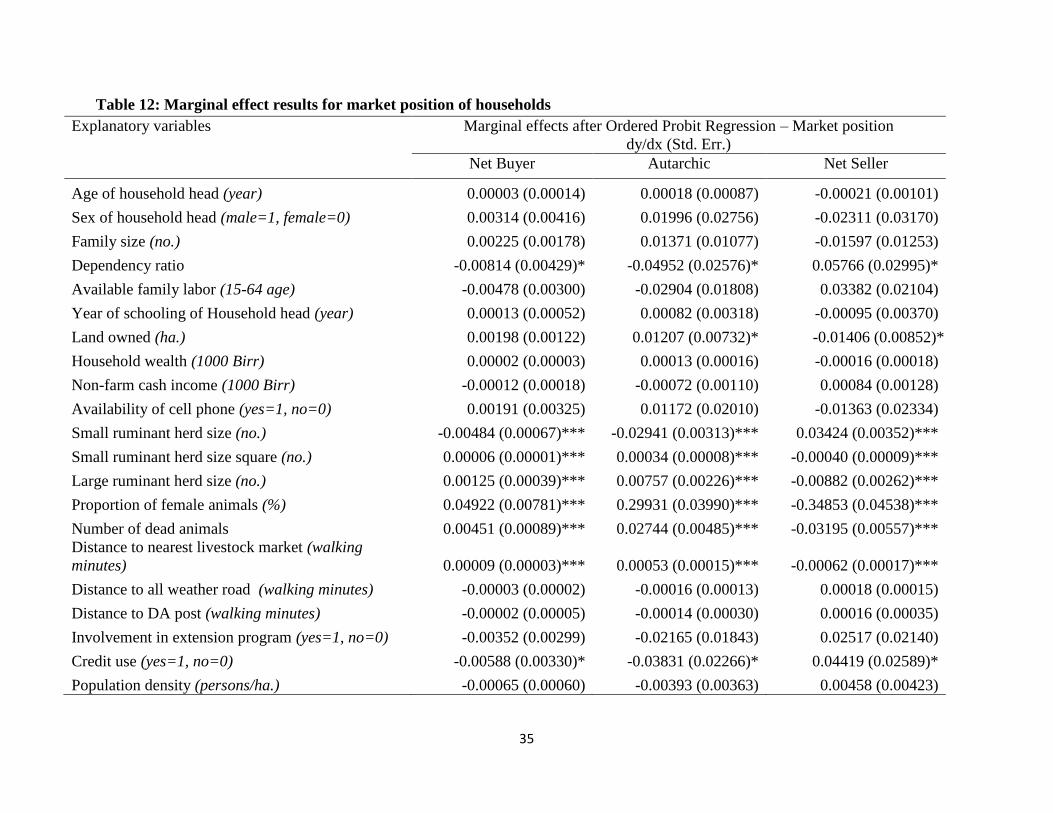
Marginal effect results (Table 12) show that a unit increase in dependency ratio increases the
probability of being net seller by 5.7%, while an addition of one head of animal to the herd
increases probability of being a net seller by about 3.4%. Use of credit increases the likelihood of
net selling by about 4.4%. The fact that credit use affects positively both the probability of
selling and buying, as well as the probability of being net seller strengthens the point that that
livestock credit is essential to promote market oriented small ruminant production in the study
area. A ten percent increase in the proportion of female animals decreases the likelihood of net
selling by 3.5%. The negative effects of the proportion of female animals on selling, and net
selling can be reduced by increasing the reproductive efficiency of small ruminants. A death of
one animal also reduces probability of net selling by about 3.2%, consistent with the effect of
herd size. A reduction of 2 hours of walking distance to nearest livestock market increases the
probability of net selling by about 7.2%, strengthening the result of the bivariate probit model.
TABLE 12 HERE
The marginal effect results also identified significant variables that affect probability of net
buying (Table 12). Large ruminant herd size, proportion of females in the herd, number of dead
animals and distance to livestock market increase the probability of net buying, while
dependency ratio, small ruminant herd size, and credit use decrease the probability of net buying.
Large ruminant herd size increase probability of net buying perhaps because of its role as
alternative cash sources. It is not clear why higher proportion of female animals in the herd
increase the probability of net buying. It could be that households with higher proportion of
female animals are induced to buy bucks or rams for reproductive purposes, other factors held
constant. However, this is a tentative hypothesis to explain an unexpected result and requires
further testing. The effect is also significant: a ten percent increase in the proportion of female
animals in the herd increases the probability of net buying by about 5%. Similarly, it is
interesting to see that distance to livestock market increases the probability of net buying, while
it decreases the probability of net selling, although the marginal effect is very small. It is not

19
clear why distance to livestock market increase probability of net buying and further study is
required to explain the result. The marginal effects of dependency ration and small ruminant herd
size are also small.
The marginal effects for autarkic position show that land size, large ruminant herd size,
proportion of female animals, number of dead animals, and distance to livestock market increase
the probability of being autarkic. These same variables, except land size, also increase the
probability of net buying, suggesting households with these characteristics are likely to be either
autarchic or net buying. The marginal effects of the significant variables on probability of being
autarkic are all small.
Multinomial probit regression results
Maximum likelihood estimates of the multinomial probit model are given in Table 13. In
comparison with being non-seller non-buyer, small ruminant herd size, involvement in extension
and use of credit increase the probability of being seller only, with small ruminant herd size
having a quadratic effect. Large ruminant herd size, proportion of female animals, land size,
number of dead animals, and distance to livestock market decrease the probability of being seller
only over being non-seller non-buyer.
TABLE 13 HERE
The marginal effect results (Table 14) show that an increase of one animal in the herd increases
probability of being seller only by about 3.4%, while involvement in extension and use of credit
increase the probability by 4.5% and 4.7%, respectively. A ten percent increase in the proportion
of female animals decreases the probability of being seller only by 3.6%.
TABLE 14 HERE
In comparison with being non-seller non-buyer, small ruminant herd size, large ruminant herd
size, number of dead small ruminants, and involvement in extension increases the probability of
being buyer only, while male household head and land size decrease the probability. marginal
effect results show that the marginal effects of these variables are all small.

20
Herd size, involvement in extension and use of credit increase the probability of being buyer and
seller over being non-seller non-buyer, reinforcing our earlier results that these variables are
important to promote market oriented small ruminant production. Land size, large ruminant herd
size, the proportion of female animals, and number of dead animals and distance to livestock
market decrease the probability of being seller and buyer, over being non-seller non-buyer.
Marginal effect results show that involvement in extension and use of credit increase the
probability of being seller and buyer by about 2% each. Male household head increases the
probability of being seller and buyer by 1.8%. The marginal effects of the other variables are
small.
Marginal effect results also show that land size, large ruminant herd size, proportion of female
animals, number of dead animals, and distance to livestock market increase probability of being
non-seller non-buyer. Small ruminant herd size, involvement extension and use of credit
decrease probability of being non-seller non-buyer. Involvement in extension and use of credit
decrease probability of being non-seller non-buyer by about 7% each, while one more small
ruminant to the herd decrease the probability by about 4.2%. A two hours reduction in trvel
distance to livestock market decrease probability of being non-seller non-buyer by about 7%. A
half a hectare increase in land holding increases probability of being non-seller non-buyer by
about 1.6%.
5. Conclusions and Implications
Small ruminants, which account for more than half of the domesticated ruminants in the world,
are an important component of the farming systems in most developing countries. Despite their
economic and social importance, socioeconomic and marketing research on small ruminants has
so far been limited, a fact which also holds strongly true in Ethiopia. This study is aimed at
contributing to the limited knowledge on household marketing behavior in small ruminants in the
highlands of Ethiopia.
Ethiopia, with an estimated population of 27.35 million sheep and 28.16 million goats in
2012/13, is one of the African countries with the largest small ruminant population in the
continent. However, small ruminant production in the country is characterized by low
productivity based on traditional technology. Promoting market oriented small ruminant

21
production in Ethiopia requires an understanding of the marketing behavior of the producers, and
the physical and institutional infrastructural constraints limiting small holder participation in
markets. This study, based on survey data of 5004 households, uses analysis of descriptive
information and econometric analysis to draw implications to promote market orientation of
households.
Just over half of the surveyed households rear small ruminants with an average flock size of 7.8
animals. Breeding stock dominate the herd structure, consistent with the primary producers’
objective of reproduction. Because of the highland nature of the study area, sheep dominate the
small ruminant herds. We find that sheep and goat production are, for the most part, separate
enterprises, as only 14% of small ruminant producers rear both sheep and goat. However, about
92.8% of small ruminant producers also keep cattle showing that small ruminant production is
done together with cattle rearing. The fact that about 47% of sheep producers do not own rams
and 44% of goat producers do not own bucks indicates the need for attention to breeding
strategies at household level.
We find total gross small ruminant off-take rate of 34.3%, and gross inflow rate of 22.5%,
suggesting that there was a decrease in the stock of small ruminants by 11.8% during the year in
the study area. Births are the most important sources of inflow, as shown by the inflow rate due
to birth of 18.4%. The gross and net commercial off-take rates of small ruminants are 19% and
15%, respectively. Sheep have slightly higher gross and net commercial off-take rates than
goats. The ratios between sales and slaughter for home consumption are 4.35 for sheep and 3.85
for goats, indicating that small ruminants are reared primarily as source of cash for the household
rather than for own consumption.
Loss of animals due to death is an important small ruminant outflow category. About 10% of the
total small ruminant stock was lost due to death during the study period. This proportion is lower
than normally reported and may be because the study year was a good season year in terms of
rainfall and feed availability. Death rate for sheep is slightly higher than that of goats. The death
rates for lambs and goat kids are higher than those of mature animals. The most cited cause of
loss of small ruminants due to death is diseases.
22
Just about half of the small ruminant producers participated in the market as sellers, while only
about 13% participated as buyers, and 40% did not participate in the market either way.
Producers participate in the market mostly either as seller only or as buyer only, with only 5% of
market participants participating both as sellers and buyers. Mature male sheep are the most sold
type of animals. Almost all those who participate in the market as sellers are net sellers. Only 9%
of owners are net buyers.
The most important reason for selling as reported by producers is to meet planned household
expenses, followed by a much smaller proportion reporting meeting emergency household
expenses as a reason. This result is contrary to the widely held belief that producers sell animals
mainly to meet unplanned household expenses. The most important reason of buying small
ruminants is for reproductive purposes. Selling of animals is the responsibility of the household
head in almost all households. However, income from small ruminant sales is controlled either
by women or jointly by the husband and wife in about 69% of the sales, suggesting that income
from small ruminant sales is important for household welfare.
The two most important market places for small ruminants are district markets and markets in
nearby the PAs. Farm gates, zonal and regional markets are the least used by small ruminant
producers. Hence, livestock market development interventions need to pay attention to markets
that operate within the districts. In terms of market channels for producers, farmer-to-urban
consumer, farmer-to-retailer, and farmer-to-farmer channels stand out as most important
channels. No sale was reported to cooperatives, and selling to processors is the least important
among the market channels that were used by producers. However, farmer-to-farmer channels
are more important for ewes, does, lambs and goat kids, perhaps because of the role of these
types of animals in reproduction which is the main purpose of purchases buy farmers. The
farmer-to-urban consumer channel is more important for adult male animals.
Econometric results identified important variables that affect market participation behavior of
small ruminant producers. Herd size increases the probability of selling, buying, being net seller,
being seller only, and being seller and buyer, and decreases the probability of being net buyer,
autarkic, and non-seller-non-buyer, suggesting that herd size is a crucial factor for market
participation, consistent with the findings that established the importance of asset ownership for

23
market participation (Barret, 2008; Negassa and Jabbar, 2008; Bellemare and Barret, 2006). The
fact that herd size not only promotes selling but also buying indicates that larger herd size is
needed to transform the small ruminant production into market orientation. Methods of
increasing herd size could include promoting improved production and specialized small
ruminant producers, combined with availing credit for small ruminant production. The
significant quadratic effects of small ruminant herd size on the various indicators of market
participation behavior of households also indicates that there is an optimal herd size beyond
which market participation may decline. We find that a herd size of about 41 heads of small
ruminants is optimal for market participation as seller and a herd size of 21 is optimal for market
participation as buyer.
Reinforcing the effect of herd size on market participation, the number of dead animals in the
year decreases the probability of selling, being net seller, being seller only, and being seller and
buyer, and increases the probability of being net buyer, autarkic, being non-seller non-buyer, and
net buyer only. The most important cause of death of animals is diseases. Hence, the results
suggest that improved animal health care and reduction of loss of animals is an important
consideration in promoting market oriented small ruminant production.
However, the structure of the herd also matters in a crucial way. The proportion of female
animals in the herd decreases the probability of selling, being net seller, and being seller only and
increases the probability of being net buyer, autarkic and being non-seller non-buyer. These
results indicate that promoting modern breeding approaches that increase the efficiency of
reproduction in small ruminants can promote market participation.
Herd size of large ruminants decreases probability of selling, buying, being net seller, and being
seller only, while it increases probability of being net buyer, being autarkic, being non-seller
non-buyer, and being buyer only. Clearly, these results suggest that small ruminant and large
ruminant production are close substitutes as cash sources to the households. Interventions to
increase market orientation in small ruminant production need to take this fact into account.
Land size decreases the probability of selling, being net seller, and being seller only, and
increases the probability being autarkic and being non-seller non-buyer. These results suggest
that households with larger land size may be more likely to have alternative sources of cash

24
income and the opportunity cost of small ruminant production for such households may also be
high. Perhaps, such households rely more on land-based agricultural activities.
Distance to livestock market is another important variable that affects market behavior of
households. Distance from homestead to nearest livestock market decreases the probability of
selling, being net seller, being seller only, and being seller and buyer, and increases the
probability of being net buyer, autarkic, and non-seller non-buyer. These results suggest that
improvement in livestock market access should be an important consideration in promoting
market oriented small ruminant production. It could take the form of developing market
infrastructure such as building market places and/or developing and improving road
infrastructure to reduce transportation costs. Moreover, promoting collective action for
marketing small ruminants could be explored as an option.
The effects of the two institutional factors of involvement in extension and credit use are found
to be strong. Involvement in livestock extension programs increases the probability of selling,
buying, being seller only, and being seller and buyer and decreases the probability of being non-
seller non-buyer. The effect of credit use is similar. Credit use increases the probability of
selling, buying, being net seller, being seller only, being buyer only, and being seller and buyer,
while it decreases the probability of net buying, being autarchic and being non-seller non-buyer.
These results suggest that strengthening the livestock extension program supplemented by credit
facilities can play important role in promoting market oriented small ruminant production. In
particular, the promotion of market oriented livestock extension needs to be given due attention.
In summary, our results offer important insights about the development of intervention programs
to promote market oriented small ruminant production. An effective package of interventions to
promote market oriented small ruminant production will need to include development of
livestock market infrastructure and market institutions, improved access to extension and credit
use, efficient animal reproduction and management, and proper animal health care.

25
References
Abebe, Y., Melaku, S. and Tegegne, A. 2013 Assessment of sheep marketing system in Burie
district, North Western Ethiopia. Wudpecker Journal of Agricultural Research ISSN 2315-7259
Vol. 2(3), pp. 097 - 102
Ayele, G. Jabbar, A. M., Teklewold, H., Mulugeta, E. and Kebede, G. 2006 Seasonal and inter-
market differences in prices of small ruminants in Ethiopia. Journal of Food Products Marketing
(USA), 12(4): 59-77
Barrett, C.B., M.F. Bellemare and S.M. Osterloh (2006), Household-Level Livestock Marketing
Behavior Among Northern Kenyan and Southern Ethiopian Pastoralists, in P.D. Little and J.G.
McPeak, eds., Pastoral Livestock Marketing in Eastern Africa: Research and Policy Challenges
London: Intermediate Technology Development Group Publishing.
Bellemare, M. and Barrett, C. B. 2006. An Ordered Tobit Model of Market Participation:
Evidence from Kenya and Ethiopia. American Journal of Agricultural Economics, Vol. 88 (2):
324-337.
Barrett, C. B. 2008. Smallholder market participation: Concepts and evidence from eastern and
southern Africa. Food Policy, Vol. 33 (4): 299-317.
Bertrand, M., Pan, J. and E. Kamenica, E 2013, Gender identity and relative income within
households, NBER Working Paper 19023
Boughton, D., Mather, D., Barrett, C. B., Benfica, R., Abdula, D., Tschirley, D. and Cunguara,
B. 2007. Market Participation by Rural Households in a Low-Income Country: An Asset-Based
Approach Applied to Mozambique. Faith and Economics, Vol. 50: 64-101
Desta, S. 1999 Diversification of Livestock Asset for Risk Management in the Borana Pastoralist
System of Southern Ethiopia, PhD Dissertation, Utah State University
Federal Democratic Republic of Ethiopia Central Statistical Agency 2014 Agricultural Sample
Survey 2013/14 [2006 E.C.] VOLUME II Report on Livestock and Livestock Characteristics
(Private Peasant Holdings. Statistical Bulletin 573. Addis Ababa, Ethiopia

26
Gebremedhin, B., D. Hoekstra and A. Tegegne. 2006 Commercialization of Ethiopian
Agriculture: Extension Service from Input Supplier to Knowledge Broker and Facilitator. IPMS
(Improving Productivity and Market Success) of Ethiopian Farmers Working Paper No. 1. ILRI
(International Livestock Research Institute), Nairobi, Kenya.
Gebremedhin, B. and Jaleta, M. 2012 Interdependence of smallholders' net market positions in
mixed crop-livestock systems of Ethiopian highlands. Journal of Development and Agricultural
Economics. Vol. 4(7), pp 199-209
Gizaw, S. Tegegne, A., Gebremedhin, G. and Hoekstra, D., 2010. Sheep and goat production and
marketing systems in Ethiopia: Characteristics and strategies for improvement. IPMS (Improving
Productivity and Market Success) of Ethiopian Farmers Project Working Paper 23. ILRI
(International Livestock Research Institute), Nairobi, Kenya. 58 pp.
Isaac Oluwatayo and Titilayo Oluwatayo 2009, Small Ruminants as a Source of Financial
Security: A Case Study of Women in Rural, South West, Nigeria. IMTFI Working Paper 2012-2
Kariuki J., Jemimah Njuki, J. Mburu, S. and Waithanji, E. 2013 Women, Livestock Ownership
and Food Security. In Njuki, J. and Sanginga, P.C. eds (2013) Women, livestock ownership, and
markets: bridging the gender gap in Eastern and Southern Africa. Routledge and IDRC.
Kosgey I S 2004. Breeding Objectives and Breeding Strategies for Small Ruminants in the
Tropics. PhD Thesis, Wageningen University, The Netherlands.
Negassa A, Jabbar M 2008 Livestock ownership, commercial off-take rates and their
determinants in Ethiopia. Research Report 9. Nairobi, Kenya: ILRI (International Livestock
Research Institute). p 52
Njuki, J. and Mburu, S. 2013 Gender and Ownership of Livestock Assets. In Njuki, J. and
Sanginga, P.C . eds (2013) Women, livestock ownership, and markets: bridging the gender gap
in Eastern and Southern Africa. Routledge and IDRC.
Romer, P. 1994. New Goods, Old Theory and The Welfare cost of trade restrictions. Journal of
Development Economics, 43(1): 5-38.

27
Tedeschi LO, Nicholson C., F. and Rich E., 2011. Using System Dynamics Modelling Approach
to Develop Management Tools for Animal Production with Emphasis on Small Ruminants.
Small Ruminant Research 98: 102-110
von Braun J, Bouis H and Kennedy E. 1994. Conceptual framework. In: von Braun J and
Kennedy E (eds), Agricultural commercialization, economic development, and nutrition. Johns
Hopkins University Press, Baltimore, Maryland, USA. pp. 9–33.

28
Table 1. Ownership structure across those who own small ruminants (N=2634)
Type of animal Mean ownership
(SE)
% of flock (by
sheep and goats)
% of flock
(by total)
Mature male sheep 0.8 (0.03011) 17.0 10.3
Ewe 2.3 (0.05969) 48.9 29.5
Lamb 1.6 (0.04943) 34.1 20.5
Mature male goats 0.6 (0.02742) 19.4 7.7
Doe 1.5 (0.05850) 48.4 19.2
Goat kid 1.0 (0.04552) 32.2 12.8
Table 2. Proportion of households who own the type of animal (%) (N=2634)
Type of animal %
Ewe 66.2
Doe 39.0
Mature male sheep 38.0
Lamb 45.0
Mature male goats 23.7
Goat kid 26.8
Table 3. Commercial off-take rates and death rates by type of animal
Type of off-take or inflow Rate (%)
Small ruminant gross commercial off-take rate 19.0
Small ruminant net commercial off-take rate 15.1
Sheep gross commercial off-take rate 20.9
Sheep net commercial off-take rate 16.3
Goat gross commercial off-take rate 16.0
Goat net commercial off-take rate 13.3
Small ruminant death rate 10.1
Sheep death rate 10.5
Mature male sheep death rate 6.1
Ewe death rate 11.2
Lamb death rate 11.7
Goat death rate 9.6
Mature male goats death rate 5.4
Doe death rate 9.7
Goat-kid death rate 12.0

29
Table 4. Reasons of selling (% of owning households, selling households, and number of
sales)
Reason % of
households
who owned
(N=2634)
% of
households
who sold
(N=1355)*
% of sales
(N=3924)
Meet planned household expenses 40.8 79.3 73.5
Meet emergency household expenses 6.0 11.7 10.6
Livestock trading as a business 1.7 3.3 6.1
Culling because not productive or sick 1.8 3.4 2.8
Others (credit payment, input purchase,
fines etc.) 3.6 7.1 7.0
*Percentages sum up to slightly more than 100% because a few households sold animals for
more than one reason.
Table 5. Farmers’ reasons of buying small ruminants (% of owning households, buying
households, and number of purchases)
Reason % of households
who owned
(N=2634)
% of households
who purchased
(N=348)*
% of purchase
(N=802)
Replacement of old or culled animals 0.6 4.3 2.7
Reproduction 8.7 66.1 62.3
Trading 1.8 13.8 22.8
Household consumption 0.6 14.4 9.0
Store of wealth 1.9 4.6 3.1
*Percentages sum up to slightly more than 100% because a few households bought animals for
more than one reason.

30
Table 6. Market places of sale by type of animal (% of sales)
Type of animal
Market place
Farm-gate PA Other PA District Zonal Regional
Small ruminant 4.5 17.4 35.0 38.2 4.5 0.4
Mature male sheep 4.8 18.0 29.9 40.8 6.2 0.3
Ewe 6.1 18.5 31.4 37.9 5.2 0.6
Lamb 2.7 25.1 37.7 31.3 2.9 0.3
Mature male goats 3.5 10.8 37.8 43.0 4.3 0.6
Doe 5.1 12.3 42.5 36.8 3.2 0
Goat kid 3.9 16.9 41.7 35.0 2.4 0
Table 7. Type of buyers by type of animals (% of buyers)
Type of animal
Type of buyers
Farmer Assembler Wholesale
r
Retailer Processo
r
Urban
consume
r
Coops
Small ruminant 21.6 17.1 13.1 22.2 1.1 24.8 0
Mature male sheep 12.2 21.4 14.4 22.5 0.8 28.6 0
Ewe 37.3 13.0 11.4 18.9 0.7 18.7 0
Lamb 21.4 19.7 12.7 24.2 0.9 21.0 0
Mature male goats 12.0 15.8 15.5 22.1 1.6 32.9 0
Doe 32.5 13.7 10.8 22.1 1.4 19.2 0
Goat kid 27.6 11.3 10.9 24.8 1.7 23.6 0

31
Table 8: Descriptive values of variables included in the regression models (N= 2246)
Dependent variables %
Market position
Net buyer 9.38
Autarkic 40.51
Net seller 50.11
Market
participation
None seller nor buyer
40.39
Seller only 46.39
Buyer only 8.16
Seller and buyer 5.05
Mean
Min.
Max.
Sell or not 0.51 0 1
Buy or not 0.13 0 1
Explanatory variables
Age of household head (year) 45.50 18 120
Sex of household head (male=1, female=0) 0.85 0 1
Family size (no.) 6.23 1 22
Dependency ratio 1.06 0 6
Available family labor (15-64 age) 3.31 0 13
Year of schooling of Household head (year) 2.47 0 14
Land owned (ha.) 1.51 0 18
Household wealth (1000 Birr) (value of assets excluding
large and small ruminant) 21.15 0 822
Non-farm cash income (1000 Birr) 3.83 0 208
Availability of cell phone (yes=1, no=0) 0.61 0 1
Small ruminant herd size (no.) 7.85 0 81
Small ruminant herd size square (no.) 116.27 0 6561
Large ruminant herd size (no.) 5.03 0 80
Proportion of female animals (%) 0.72 0 1
Number of dead animals 0.80 0 41
Distance to nearest livestock market (walking minutes) 90.35 0 600
Distance to all weather road (walking minutes) 49.28 0 650
Distance to DA post (walking minutes) 31.81 0 240
Involvement in extension program (yes=1, no=0) 0.40 0 1
Credit use (yes=1, no=0) 0.21 0 1
Population density (persons/ha.) 2.81 0.46 28.90

32
Table 9: Bivariate regression results for selling and buying
Explanatory variables
Bivariate Probit Regression - Coef. (Std. Err.)
Sell or not Buy or not
Age of household head (year) -0.00013 (0.00274) 0.00040 (0.00435)
Sex of household head (male=1, female=0) -0.03723 (0.08647) 0.01118 (0.13255)
Family size (no.) -0.04626 (0.03435) -0.02161 (0.05220)
Dependency ratio 0.13006 (0.08091) 0.01463 (0.12360)
Available family labor (15-64 age) 0.08709 (0.05726) 0.00582 (0.08727)
Year of schooling of Household head (year) -0.00021 (0.00998) 0.01151 (0.01475)
Land owned (ha.) -0.07310 (0.02351)*** -0.04987 (0.03651)
Household wealth (1000 Birr) -0.00012 (0.00051) 0.00100 (0.00060)*
Non-farm cash income (1000 Birr) 0.00009 (0.00330) -0.00462 (0.00573)
Availability of cell phone (yes=1, no=0) -0.04296 (0.06323) -0.01717 (0.09797)
Small ruminant herd size (no.) 0.10550 (0.00943)*** 0.06611 (0.01774)***
Small ruminant herd size square (no.) -0.00130 (0.00023)*** -0.00158 (0.00054)***
Large ruminant herd size (no.) -0.01841 (0.00750)** 0.01792 (0.00975)*
Proportion of female animals (%) -0.95574 (0.12146)*** 0.03787 (0.20146)
Number of dead animals -0.07609 (0.01526)*** 0.00754 (0.02095)
Distance to nearest livestock market (walking
minutes) -0.00160 (0.00047)*** -0.00065 (0.00069)
Distance to all weather road (walking minutes) 0.00038 (0.00040) -0.00061 (0.00067)
Distance to DA post (walking minutes) -0.00011 (0.00096) -0.00180 (0.00162)
Involvement in extension program (yes=1, no=0) 0.16102 (0.05793)*** 0.22237 (0.08556)***
Credit use (yes=1, no=0) 0.17866 (0.07056)** 0.19900 (0.09760)**
Population density (persons/ha.) 0.00929 (0.01146) -0.02870 (0.02496)
Constant 0.32135 (0.20439) -1.84126 (0.33202)***
Number of observation 2246
Wald chi2(40) 347.70
Prob > chi2 0.0000

33
Table 10: Marginal effects of the bivariate regression equation
Explanatory variables
Marginal effects after Bivariate Probit Regression dy/dx
(Std. Err.)
Sell or not Buy or not
Age of household head (year) -0.00005 (0.00108) 0.00005 (0.00050)
Sex of household head (male=1, female=0) -0.01466 (0.03397) 0.00127 (0.01498)
Family size (no.) -0.01825 (0.01355) -0.00247 (0.00597)
Dependency ratio 0.05131 (0.03192) 0.00167 (0.01414)
Available family labor (15-64 age) 0.03436 (0.02259) 0.00067 (0.00998)
Year of schooling of Household head (year) -0.00008 (0.00394) 0.00132 (0.00169)
Land owned (ha.) -0.02884 (0.00928)*** -0.00571 (0.00417)
Household wealth (1000 Birr) -0.00005 (0.00020) 0.00011 (0.00007)*
Non-farm cash income (1000 Birr) 0.00004 (0.00130) -0.00053 (0.00065)
Availability of cell phone (yes=1, no=0) -0.01693 (0.02490) -0.00197 (0.01128)
Small ruminant herd size (no.) 0.04162 (0.00372)*** 0.00756 (0.00197)***
Small ruminant herd size square (no.) -0.00051 (0.00009)*** -0.00018 (0.00006)***
Large ruminant herd size (no.) -0.00726 (0.00296)** 0.00205 (0.00111)*
Proportion of female animals (%) -0.37704 (0.04796)*** 0.00433 (0.02305)
Number of dead animals -0.03002 (0.00602)*** 0.00086 (0.00240)
Distance to nearest livestock market (walking
minutes) -0.00063 (0.00019)*** -0.00007 (0.00008)
Distance to all weather road (walking minutes) 0.00015 (0.00016) -0.00007 (0.00008)
Distance to DA post (walking minutes) -0.00004 (0.00038) -0.00021 (0.00019)
Involvement in extension program (yes=1, no=0) 0.06332 (0.02268)*** 0.02627 (0.01039)**
Credit use (yes=1, no=0) 0.06975 (0.02718)*** 0.02497 (0.01336)*
Population density (persons/ha.) 0.00366 (0.00452) -0.00328 (0.00284)

34
Table 11: Ordered probit regression results for market position of households
Explanatory variables
Ordered Probit Regression
Market position
Coef. (Std. Err.)
Age of household head (year) -0.00054 (0.00255)
Sex of household head (male=1, female=0) -0.05848 (0.08049)
Family size (no.) -0.04030 (0.03162)
Dependency ratio 0.14552 (0.07558)*
Available family labor (15-64 age) 0.08535 (0.05309)
Year of schooling of Household head (year) -0.00241 (0.00933)
Land owned (ha.) -0.03547 (0.02151)*
Household wealth (1000 Birr) -0.00039 (0.00046)
Non-farm cash income (1000 Birr) 0.00212 (0.00322)
Availability of cell phone (yes=1, no=0) -0.03441 (0.05898)
Small ruminant herd size (no.) 0.08642 (0.00890)***
Small ruminant herd size square (no.) -0.00100 (0.00022)***
Large ruminant herd size (no.) -0.02225 (0.00661)***
Proportion of female animals (%) -0.87961 (0.11450)***
Number of dead animals -0.08064 (0.01406)***
Distance to nearest livestock market (walking
minutes) -0.00156 (0.00043)
Distance to all weather road (walking minutes) 0.00046 (0.00037)
Distance to DA post (walking minutes) 0.00041 (0.00089)
Involvement in extension program (yes=1, no=0) 0.06357 (0.05410)
Credit use (yes=1, no=0) 0.11207 (0.06605)*
Population density (persons/ha.) 0.01156 (0.01068)
Number of observation 2246
LR chi2(20) 271.85
Prob > chi2 0.0000
Pseudo R2 0.0748
35
Table 12: Marginal effect results for market position of households
Explanatory variables
Marginal effects after Ordered Probit Regression – Market position
dy/dx (Std. Err.)
Net Buyer Autarchic Net Seller
Age of household head (year) 0.00003 (0.00014) 0.00018 (0.00087) -0.00021 (0.00101)
Sex of household head (male=1, female=0) 0.00314 (0.00416) 0.01996 (0.02756) -0.02311 (0.03170)
Family size (no.) 0.00225 (0.00178) 0.01371 (0.01077) -0.01597 (0.01253)
Dependency ratio -0.00814 (0.00429)* -0.04952 (0.02576)* 0.05766 (0.02995)*
Available family labor (15-64 age) -0.00478 (0.00300) -0.02904 (0.01808) 0.03382 (0.02104)
Year of schooling of Household head (year) 0.00013 (0.00052) 0.00082 (0.00318) -0.00095 (0.00370)
Land owned (ha.) 0.00198 (0.00122) 0.01207 (0.00732)* -0.01406 (0.00852)*
Household wealth (1000 Birr) 0.00002 (0.00003) 0.00013 (0.00016) -0.00016 (0.00018)
Non-farm cash income (1000 Birr) -0.00012 (0.00018) -0.00072 (0.00110) 0.00084 (0.00128)
Availability of cell phone (yes=1, no=0) 0.00191 (0.00325) 0.01172 (0.02010) -0.01363 (0.02334)
Small ruminant herd size (no.) -0.00484 (0.00067)*** -0.02941 (0.00313)*** 0.03424 (0.00352)***
Small ruminant herd size square (no.) 0.00006 (0.00001)*** 0.00034 (0.00008)*** -0.00040 (0.00009)***
Large ruminant herd size (no.) 0.00125 (0.00039)*** 0.00757 (0.00226)*** -0.00882 (0.00262)***
Proportion of female animals (%) 0.04922 (0.00781)*** 0.29931 (0.03990)*** -0.34853 (0.04538)***
Number of dead animals 0.00451 (0.00089)*** 0.02744 (0.00485)*** -0.03195 (0.00557)***
Distance to nearest livestock market (walking
minutes) 0.00009 (0.00003)*** 0.00053 (0.00015)*** -0.00062 (0.00017)***
Distance to all weather road (walking minutes) -0.00003 (0.00002) -0.00016 (0.00013) 0.00018 (0.00015)
Distance to DA post (walking minutes) -0.00002 (0.00005) -0.00014 (0.00030) 0.00016 (0.00035)
Involvement in extension program (yes=1, no=0) -0.00352 (0.00299) -0.02165 (0.01843) 0.02517 (0.02140)
Credit use (yes=1, no=0) -0.00588 (0.00330)* -0.03831 (0.02266)* 0.04419 (0.02589)*
Population density (persons/ha.) -0.00065 (0.00060) -0.00393 (0.00363) 0.00458 (0.00423)

36
Table 13: Multinomial probit regression results for market participation regimes of households
Explanatory variables
Multinomial Probit Regression – (Base-None Seller nor Buyer)
Market participation - Coef. (Std. Err.)
Sellers only Buyers only Sellers and buyers
Age of household head (year) -0.00065 (0.00388) -0.00381 (0.00841) 0.00234 (0.00680)
Sex of household head (male=1, female=0) -0.11748 (0.12251) -0.43677 (0.22694)* 0.26057 (0.23506)
Family size (no.) -0.05157 (0.04854) 0.03440 (0.10020) -0.11242 (0.08404)
Dependency ratio 0.16445 (0.11442) -0.05047 (0.24220) 0.19303 (0.19737)
Available family labor (15-64 age) 0.11506 (0.08106) 0.00780 (0.16629) 0.11391 (0.14015)
Year of schooling of Household head (year) -0.00392 (0.01414) -0.00694 (0.02964) 0.02175 (0.02288)
Land owned (ha.) -0.11121 (0.03332)*** -0.16904 (0.07311)** -0.10708 (0.05648)*
Household wealth (1000 Birr) -0.00007 (0.00073) 0.00168 (0.00114) 0.00092 (0.00102)
Non-farm cash income (1000 Birr) -0.00062 (0.00464) -0.01858 (0.01629) -0.00437 (0.00812)
Availability of cell phone (yes=1, no=0) -0.07140 (0.08955) -0.08017 (0.18424) -0.02405 (0.15603)
Small ruminant herd size (no.) 0.14071 (0.01332)*** 0.08905 (0.03650)** 0.20023 (0.02817)***
Small ruminant herd size square (no.) -0.00177 (0.00032)*** -0.00237 (0.00119)** -0.00333 (0.00084)***
Large ruminant herd size (no.) -0.02259 (0.01066)** 0.03581 (0.01725)** -0.00554 (0.01660)
Proportion of female animals (%) -1.31090 (0.17184)*** -0.09270 (0.39100) -0.94208 (0.31493)***
Number of dead animals -0.08728 (0.02174)*** 0.05984 (0.03540)* -0.13510 (0.04357)***
Distance to nearest livestock market (walking
minutes) -0.00201 (0.00066)*** -0.00014 (0.00121) -0.00324 (0.00119)***
Distance to all weather road (walking minutes) 0.00046 (0.00056) -0.00134 (0.00145) -0.00002 (0.00102)
Distance to DA post (walking minutes) -0.00010 (0.00135) -0.00236 (0.00309) -0.00279 (0.00262)
Involvement in extension program (yes=1, no=0) 0.22089 (0.08210)*** 0.34248 (0.16415)** 0.44586 (0.13621)***
Credit use (yes=1, no=0) 0.23343 (0.10009)** 0.27271 (0.19205) 0.46061 (0.15530)***
Population density (persons/ha.) 0.01523 (0.01620) -0.01909 (0.04715) -0.02564 (0.03876)
Constant 0.47095 (0.28936) -1.87309 (0.63628)*** -2.00526 (0.52781)***
Number of observation 2246
357.48
0.0000
Wald chi2(60)
Prob > chi2
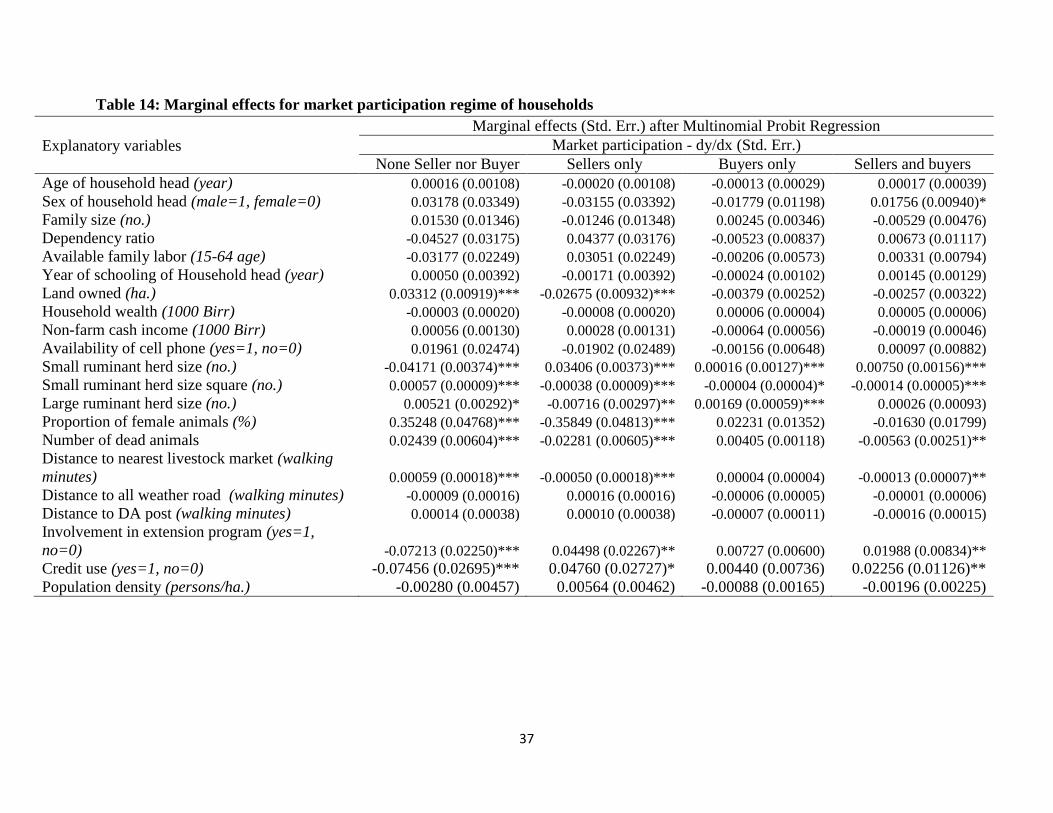
37
Table 14: Marginal effects for market participation regime of households
Explanatory variables
Marginal effects (Std. Err.) after Multinomial Probit Regression
Market participation - dy/dx (Std. Err.)
None Seller nor Buyer Sellers only Buyers only Sellers and buyers
Age of household head (year) 0.00016 (0.00108) -0.00020 (0.00108) -0.00013 (0.00029) 0.00017 (0.00039)
Sex of household head (male=1, female=0) 0.03178 (0.03349) -0.03155 (0.03392) -0.01779 (0.01198) 0.01756 (0.00940)*
Family size (no.) 0.01530 (0.01346) -0.01246 (0.01348) 0.00245 (0.00346) -0.00529 (0.00476)
Dependency ratio -0.04527 (0.03175) 0.04377 (0.03176) -0.00523 (0.00837) 0.00673 (0.01117)
Available family labor (15-64 age) -0.03177 (0.02249) 0.03051 (0.02249) -0.00206 (0.00573) 0.00331 (0.00794)
Year of schooling of Household head (year) 0.00050 (0.00392) -0.00171 (0.00392) -0.00024 (0.00102) 0.00145 (0.00129)
Land owned (ha.) 0.03312 (0.00919)*** -0.02675 (0.00932)*** -0.00379 (0.00252) -0.00257 (0.00322)
Household wealth (1000 Birr) -0.00003 (0.00020) -0.00008 (0.00020) 0.00006 (0.00004) 0.00005 (0.00006)
Non-farm cash income (1000 Birr) 0.00056 (0.00130) 0.00028 (0.00131) -0.00064 (0.00056) -0.00019 (0.00046)
Availability of cell phone (yes=1, no=0) 0.01961 (0.02474) -0.01902 (0.02489) -0.00156 (0.00648) 0.00097 (0.00882)
Small ruminant herd size (no.) -0.04171 (0.00374)*** 0.03406 (0.00373)*** 0.00016 (0.00127)*** 0.00750 (0.00156)***
Small ruminant herd size square (no.) 0.00057 (0.00009)*** -0.00038 (0.00009)*** -0.00004 (0.00004)* -0.00014 (0.00005)***
Large ruminant herd size (no.) 0.00521 (0.00292)* -0.00716 (0.00297)** 0.00169 (0.00059)*** 0.00026 (0.00093)
Proportion of female animals (%) 0.35248 (0.04768)*** -0.35849 (0.04813)*** 0.02231 (0.01352) -0.01630 (0.01799)
Number of dead animals 0.02439 (0.00604)*** -0.02281 (0.00605)*** 0.00405 (0.00118) -0.00563 (0.00251)**
Distance to nearest livestock market (walking
minutes) 0.00059 (0.00018)*** -0.00050 (0.00018)*** 0.00004 (0.00004) -0.00013 (0.00007)**
Distance to all weather road (walking minutes) -0.00009 (0.00016) 0.00016 (0.00016) -0.00006 (0.00005) -0.00001 (0.00006)
Distance to DA post (walking minutes) 0.00014 (0.00038) 0.00010 (0.00038) -0.00007 (0.00011) -0.00016 (0.00015)
Involvement in extension program (yes=1,
no=0) -0.07213 (0.02250)*** 0.04498 (0.02267)** 0.00727 (0.00600) 0.01988 (0.00834)**
Credit use (yes=1, no=0) -0.07456 (0.02695)*** 0.04760 (0.02727)* 0.00440 (0.00736) 0.02256 (0.01126)**
Population density (persons/ha.) -0.00280 (0.00457) 0.00564 (0.00462) -0.00088 (0.00165) -0.00196 (0.00225)