household energy use: a study investigating viewpoints
TRANSCRIPT

ORIGINAL ARTICLE
Household energy use: a study investigating viewpointstowards energy efficiency technologies and behaviour
Marcos Pelenur
Received: 28 October 2016 /Accepted: 22 January 2018 /Published online: 13 February 2018# The Author(s) 2018. This article is an open access publication
Abstract Improving the energy efficiency of ourhomes presents an excellent opportunity to reducegreenhouse gas emissions and increase thermal comfort.However, a shortfall exists between the full potentialand realised adoption of energy efficiency measures,a phenomenon termed the ‘Energy Efficiency Gap’.To better understand the energy efficiency gap, thisresearch identified household viewpoints towardsenergy and stated preferences towards energy effi-ciency technologies and behaviour. The researchwas carried out through interviews and a Q studyin the cities of Manchester and Cardiff, alongside aquestionnaire. The results revealed a range of nu-anced viewpoints, which mapped onto three princi-pal household themes: energy use in terms of theenvironment, energy in relation to money and apa-thy towards energy. A key finding was the smallnumber strong correlations between distinct energyviewpoints and specific energy efficiency technolo-gies or behaviours. This result implies that beingenvironmentally aware and actively concerned aboutenergy efficiency does not in itself lead to a stateddesire, or even, intention to install energy-efficienttechnologies. The wider implication is that house-holds that hold proactive energy efficiency view-points based on environmental concern may stillrequire specifically targeted incentives to encourage
the uptake of energy efficiency measures, i.e. theirproactive and environmental beliefs are not aloneenough to motivate them to improve the energyefficiency of their home.
Keywords Subjectivity . Qmethodology . Energyefficiency gap . Retrofit . Behaviour change
Introduction
The existing building stock in European countries ac-counts for over 40% of final energy consumption, ofwhich residential use represents 63% of total energyconsumption in the buildings sector (Balarasa et al.2007). In the UK, the built environment accounts forabout 45% of its anthropogenic CO2 emissions (KellyM. J. 2009; Lior 2010) and 50% of the total UK energydemand (Lior 2010). For homes, space and waterheating account for the bulk of energy use, at approxi-mately 72%. (Department of Environment, Food andRural Affairs 2007; Department of Energy and ClimateChange 2012; Kelly M. J. 2009). As such, installingenergy efficiency measures in residential dwellings pre-sents an excellent opportunity to cut CO2 emissions,reduce national energy demand and improve buildingperformance (Kelly M. J. 2009; Stafford, Gorse andShao 2012).
Yet, despite these benefits, there exists a shortfallbetween the potential and realised adoption of energyefficiency measures, a phenomenon termed the ‘EnergyEfficiency Gap’ (Jaffe and Stavins 1994; Pelenur M.
Energy Efficiency (2018) 11:1825–1846https://doi.org/10.1007/s12053-018-9624-x
M. Pelenur (*)Department of Engineering, Centre for Sustainable Development,University of Cambridge, Cambridge, UKe-mail: [email protected]
2013). In OECD countries, the energy savings loss dueto the energy efficiency gap is estimated at 30% of thetotal potential energy savings of the measures (Weber,1997). While a number of technical or economic factorsmay help explain this gap, difficult to quantify factors,such as social motivations, barriers and viewpoints to-wards energy are also significant and often under-emphasised in public policy (Pelenur M. 2013).
A number of studies investigated viewpoints towardsresidential energy use, but they often focused on indi-vidual issues such as wind or solar power (Eltham et al.,2008; Jones and Eiser 2009; Krohn and Damborg1999). Alternatively, other research used environmentalviewpoints as a proxy towards energy use (Zhang et al.,2012; Mansouri et al., 1996), while engineering-basedresearch often tried to capture behaviour as a variablewithin a model (Druckman and Jackson 2008; Swan andUgursal, 2009). The result is that researchers may haveoverlooked other important factors that relate to energyuse. Therefore, to address this gap, this study investigat-ed broad household viewpoints towards energy use andlinked them to technical retrofit preferences and energyefficiency behaviours in a UK context. The research wascarried out through the use of interviews, a Q study anda questionnaire. Q methodology was developed in 1952byWilliam Stephenson (psychologist and physicist) as aresearch method used to study the ‘subjectivity’ orviewpoints of specific topics. Since then, it has beenadopted by a range of disciplines.
The intended outcome of this research is to betterunderstand howwemay overcome the energy efficiencygap and help increase the adoption of residential retrofitprogrammes to improve the energy performance of thebuilt environment. This research is relevant to policymakers, professionals and academics working to pro-mote energy efficiency in the built environment.
The remainder of the paper is split into five sections:first, a background describing the relevant scholarship;second, an outline of the adopted research method;third, a presentation of the results; fourth, a discus-sion of the research with implications for policy andfifth, a conclusion.
Background
Retrofitting the UK residential built environment toimprove its energy performance is a complex challenge,exasperated by many factors including the diversity of
the UK building stock and range of occupant behaviour(Stafford, Gorse and Shao 2012).With respect to homes,the UK has some of the oldest and most energy-inefficient stock in Europe (Meijer et al., 2009). Addingto the complexity is the estimate that between 70 and80% of the existing poorly performing buildings willstill be in use in 2050 (Kelly 2009, 2010; Institution ofMechanical Engineers 2009; Stafford et al. 2012; Dixonand Eames 2013). In response to this challenge, the UKgovernment introduced a range of programmes over time,such as the following: the Carbon Emissions ReductionTarget (CERT); Community Energy Saving Programme(CESP); Decent Homes; Warm Front and the Green Deal.However, many of these programmes focus only on finan-cial incentives and do not address other factors that may bebarriers or motivations to the uptake of energy efficiencymeasures, such as social norms or viewpoints towardsenergy (Pelenur and Cruickshank 2012; Pelenur andCruickshank 2014). In order to better understand energyconsumption in the home across a broad range of factors,Lutzenhiser (1992) introduced an energy culture frame-work that took into account social norms and culturealongside the more traditional econometrics. The energyculture framework was extended by Stephenson et al.(2010) to apply to consumer energy behaviour, byspecifically examining the interactions betweencognitive norms (e.g. beliefs, understandings), ma-terial culture (e.g. technologies, building form) andenergy practices (e.g. activities, processes). Thisframework can be applied to individuals andhouseholds, as well as neighbourhoods andcommunities.
This research was guided by the energy cultureframework to better understand the relationship betweenresidential occupant viewpoints and energy efficiencyretrofits. An aspect of household cognitive norms wasexplored through the use of a Q study that identifiedsubjective viewpoints, while the household materialculture and energy practices were captured through in-terviews and a questionnaire. For this research, thedefinition of ‘viewpoint’ was taken from Q methodolo-gy, which defines it as simply the sum of behaviouralactivity that constitutes a person’s point of view (Wattsand Stenner, 2012). This definition is related to, butdifferent, to other existing definitions for ‘attitudes’ or‘perspectives’. To avoid confusion, this article onlyrefers to viewpoints as defined by Q methodology.
To support the Q study, a questionnaire wasadministered to measure household demographics,
1826 Energy Efficiency (2018) 11:1825–1846

as well as the stated desire and intention to installvarious energy efficiency technologies. The designof the questionnaire was influenced by the theoryof reasoned action (TRA) and theory of plannedbehaviour (TPB) that both suggest that the levelof ‘intentions’ shown by an individual is the bestpredictor of their behaviour (Jackson 2004Kaiseret al., 1999; Kalafatis et al., 1999). Both theorieshave been used to model behaviour over a widerange of topics, particularly pro-environmental be-haviour (Jackson 2004). However, there is alsooften a sizeable discrepancy between peoples’ self-reported knowledge, values and intentions and theirdescribed behaviour; well-known examples includethe ‘knowledge-action gap’ and ‘value-action gap’(Frederiks et al., 2015).
As such, this study did not infer that the statedanswers on the questionnaire necessarily led to behav-iour change. Instead, the purpose of the questionnairewas to reveal potentially interesting relationships be-tween the Q study factors (viewpoints) and variousenergy efficiency technologies/behaviours. Such rela-tionships help with the possible interpretation of the Qfactors.
After the oil shock of the 1970s, there was a markedincrease of research towards environmental beliefs andviewpoints towards energy use. For example, researchin the USA found that over three quarters of individualsfelt personally responsible for solving the energy crisisand held strong environmental beliefs (Olsen 1981). Theresults from another study, which investigated the im-pact that fear had on attitudes towards energy use, foundthat increasing the perceived likelihood of an energyshortage did not affect attitude, but that increasing theperceived noxiousness or severity of an energy crisisstrengthened intentions to reduce energy consumption(Hass et al., 1975). In terms of technological attitudes,another American study found no link between generalviewpoints towards technology and conservation behav-iour (Anderson and Lipsey 1978). The 1970s oil crisisshowcased how large global events can influence view-points towards energy use, with the Fukushima Daiichinuclear disaster as a more recent example that resulted instronger anti-nuclear sentiments (Visschers and Siegrist,2013. This highlights how research investigating sub-jectivity is a product of its time and may need to be re-visited in light of substantial external stimuli.
Alongside environmental stimuli, local context isalso an important factor to consider alongside
viewpoints towards energy (Lutzenhiser 1992;Owens and Driffill 2008; Shove et al., 1998). Forexample, a Canadian study examined the relation-ship between residential winter energy use andviewpoints and found that thermal comfort was themost important determinant of household energy use(Becker et al., 1981). Alternatively, other studiesfound a wide range of sociodemographic variablesmore significant in determining household energyuse (Abrahamse and Steg 2009; Guefin et al.,2000; Ritche et al., 1981). Although it is interestingto note that thermal comfort was also strongly asso-ciated with viewpoints towards energy use in a Tex-as study (Samuelson and Biek 1991). Even thoughthe Canadian and Texas study conclusions werebroadly similar, the interpretation of the results werequite different given that thermal comfort in Canadais largely defined by heating, whereas air condition-ing determines thermal comfort in Texas. Such de-tailed differences highlight the need to understandand present local context before attempting to inter-pret social research.
In the UK, the Department of Food and Rural Affairs(Defra) conducted a range of research to better under-stand pro-environmental behaviour and attitudes andinvestigate how those attitudes can be used to encouragesustainable energy consumption at home (Departmentof Environment, Food and Rural Affairs 2007;Department of Environment, Food and Rural Affairs2008). Their results segmented the population into sev-en major groups according to their environmentalvalues, namely: greens; consumers with a conscience;wastage focused; currently constrained; basic contribu-tors; long-term restricted; and disinterested (Departmentof Environment, Food and Rural Affairs 2007). Thestudies were detailed; however, they focused mostlyon environmental viewpoints and may have missedother relevant factors that impact household energy use(Pelenur, 2013). Very few studies have sought to specif-ically identify broad viewpoints towards residential en-ergy use and investigate how those viewpoints may beassociated with different retrofit technologies. To ad-dress this research gap, this study identified broadhousehold viewpoints towards energy use and linkedthem to technical retrofit preferences and energy effi-ciency behaviours in a UK context. The purpose of thisresearch was to better understand how we may over-come the energy efficiency gap and help improve theadoption of residential retrofits.
Energy Efficiency (2018) 11:1825–1846 1827

Research method
This section first outlines the rationale for selectingManchester and Cardiff as case studies and then de-scribes how the Q study, questionnaire and interviewswere designed and administered in each city.
This research was part of the research project ‘Re-Engineering the City 2020-2050 Urban Foresight andTransition Management (RETROFIT 2050)’ andadopted a case study approach to better understand thecomplex challenge associated with retrofitting the resi-dential built environment (Pelenur, 2013). A case studydesigns allows researchers to investigate a contempo-rary phenomenon within its real-life context, especiallywhen the boundaries between phenomenon and contextare not clearly evident and in which multiple sources ofevidence are used (Yin, 2009).
The cities of Cardiff andManchester were selected ascase studies because both have long strong roots withthe industrial revolution, yet both have suffered a de-cline in recent decades and are now seeking to regener-ate themselves into thriving cities (RETROFIT 20502012). Manchester and Cardiff also present large andsubstantial opportunities to improve the UK’s residentialenergy performance. Specifically, within Greater Man-chester, 25% of the housing stock is of solid wall con-struction and there are still 500 thousand untreated loftsand cavity walls (Low Carbon Housing Retrofit 2012).InWales, only approximately 18% of homes have cavitywall and loft insulation fitted (National RefurbishmentCentre 2012). Both cities are also similar in size, withapproximately 145 thousand dwellings in the unitaryauthority of Cardiff and 200 thousand dwellings in themetropolitan district of Manchester (Office for NationalStatistics 2013).
Q study design
The viewpoints towards energy use in the homewere collected through a Q study with 91 participantsand the stated intent and desire to install various energyefficiency technologies/behaviours were measuredthrough an accompanying questionnaire. Q methodolo-gy (Q) was selected because of its parsimonious strengthto explore subjective topics and identify complex view-points, while a questionnaire was used to simplify themeasurement of technology/behaviour preference. Thequestionnaire also included questions about importantphysical household characteristics and demographics. Q
methodology approaches the study of subjectivity byexamining it through the analysis of individual choicesand actions, as opposed to interviews which often takestated responses at face value. For example, with arelatively small Q-set of only 33 statements, the cogni-tive ranking task still presents participants with roughly11,000 times as many [sorting] options as there arepeople in the world (Watts and Stenner, 2012).
To evaluate the results of Q, the methodology uses aby-person factor analysis to identify groups ofparticipants who rank and make sense of statements ina comparable way (Watts and Stenner 2012). This isdifferent to other quantitative methods, such as re-gression analysis, which identifies and combinessets of dependant variables to statistically correlaterelationships between similar things. Participant in-terviews supplement the factor analysis and enablethe results to be interpreted through a qualitativelens, thereby establishing patterns within and acrossindividuals rather than patterns across individualtraits, such as gender, age or class (Barry andProops 1999). As an exploratory methodology, Qcannot prove hypotheses; however, it can help bringa sense of coherence to complex research questionswith socially contested answers (Smith et al., 1995).
Q methodology has been applied to a range of topicswith inherit subjectivity, such as investigating view-points towards nuclear energy and teen pregnancy.
Sample selection
The participants (P-set) for this study were drawn fromfour areas in Cardiff and four areas in Manchester. Theareas were selected to closely match each cities’ averagedemographic and census profile, through a statisticalstandardisation method. As such, these areas represent-ed ‘typical’ neighbourhoods in Manchester and Cardiff,insofar as being associated with census averages, suchas the following: home type, tenure, number of bed-rooms and population. This was deliberate sampling inorder to investigate viewpoints from ‘typical’neighbourhoods in each city. This ‘typical’ setting wasselected as the context for this study so that the resultsmay be more representative of an average UK city andtherefore applied to other areas. However, it may beinteresting for future research to investigate and contrastviewpoints from fringe communities.
In total, there were 10,908 households in the 4 areasof Cardiff and 12,667 households in Manchester.
1828 Energy Efficiency (2018) 11:1825–1846

Although this total number of households was notimportant to the research design; rather, it was aconsequence of the size of the statistical output areasused to identify the typical neighbourhoods. Leafletsoffering a chance to win £250 in grocery vouchersfor participating in the study were delivered to allthe homes, followed by 2 days of door canvassing.The goal was to recruit about ten participants fromeach of the areas. Nearly all of the participants wererecruited through door knocking, with a total of 46participants in Manchester and 45 in Cardiff. Thistype of non-probabilistic sampling is the norm in Q(Brown 1980; Wilson and Dowlatabadi, 2007),where participants are usually chosen based on ana priori theoretical design, rather than representa-tiveness or quantity (Eden et al., 2005). Participantsfor this study were chosen by first identifying ‘typ-ical’ neighbourhoods and then recruited. However, itis possible to for future studies to use other selectioncriteria that may relate to a household’s cognitivenorms or demographics.
The final sample between Manchester and Cardiffwere broadly similar, with some expected deviationsbetween the cities. The sample demographics arediscussed in more detail in the results section.
Administering the Q study
Each of the 91 participants took part in the Q study. Priorto administering the Q study in Manchester and Cardiff,two Q study pilots were conducted with 14 participantsin Cambridge and London. The participants were a mixof individuals with no Q methodology knowledge andexperienced Q practitioners. The aim of the pilots was totest the research instruments, specifically the compre-hensiveness of the Q-set and validity of the question-naire. The pilot was a full simulation of the Q studyconducted in Manchester and Cardiff, and as a result,changes were made to the wording in Q-set and ques-tionnaire to improve readability and clarity.
As presented by (Barry and Proops 1999), the generalsteps to a Q Study are shown below. These steps are keptintentionally simple for brevity and should not be usedas a guideline in isolation (instead, see Brown (1980)and Watts and Stenner, 2012for a more detailed over-view of Q).
The first step is to identify the area of subjective‘discourse’ to explore, for this study, the discourse washousehold viewpoints relating to energy use in Cardiff
and Manchester. The next step is to widely researchexisting ideas on the discourse through the use of inter-views, focus groups or discussions with the relevantpopulation. The main objective of this step is to createa comprehensive and representative list of opinions onthe topic.
The discourse for this Q study was derived from thetranscripts of general public semi-structured interviewsconducted in Manchester and Cardiff, as well as fromthe transcript of a multi-day workshop with energyretrofit professionals. These interviews were conductedprior to the Q study. In total, 198 public interviews werecollected across multiple areas of the cities. The inter-view questions were worded to encourage the respon-dent to adopt a ‘household’ viewpoint so that the resultsnot only included individual behaviours, but also in-sights into how relationships between family membersor multi-tenanted homes affect energy demand. Theinterviews were piloted first to ensure the wording ofthe questions could easily be understood by participant,yet open enough to allow for varied responses (Pelenurand Cruickshank 2011).
The Manchester and Cardiff interviews were thentranscribed and analysed to generate single-idea Q state-ments (Q-set) used to represent the discourse. In total,approximately 200 suitable statements were identifiedafter removing obvious duplications. This list of ‘raw’statements were grouped into themes according to aninductive and structured Q-set approach as described byMcKeown and Thomas (1988). In order to select onlythe most salient statements from each theme and ensurean approximately equal distribution, the complete list ofQ statements (grouped by theme) was shown to non-academic volunteers unfamiliar with Q methodology.The statements that the volunteers felt were the easiestto understand and relevant to the topic (energy con-sumption in the home) were selected. The final Q-setconsisted of 65 statements is shown in Table 7 (seeAppendix).
With the full Q-set of statements, and after the pilot,each of the 91 participants in Manchester and Cardiffperformed an individual Q-sort, where they received aninstruction and ranked the statements onto a quasi-normal forced distribution using a scale from − 6 (mostdisagree) through 0 to + 6 (most agree) (Watts andStenner 2012). The specific condition of instruction forthis Q study was ‘use the statements in the Q-Sort toindicate your personal views about energy use in yourhome. Sort the items according to those which you most
Energy Efficiency (2018) 11:1825–1846 1829

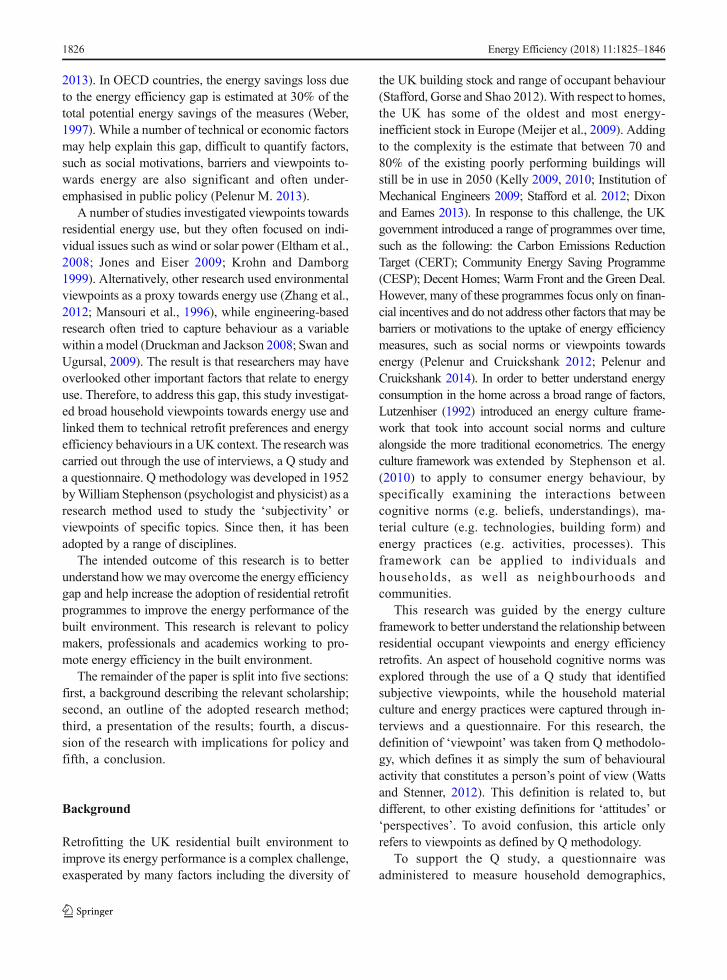
agree (+6) to those with which you most disagree (-6).The term ‘energy’ is meant to represent primary andsecondary energy sources (natural gas, coal, electricity,etc).’. Figure 1 is an illustrative example of a participantperforming a Q-sort.
After performing the Q-sorts, a semi-structured inter-view was also conducted with each participant beforeadministering the questionnaire. The aim of the inter-view was to understand why participants sorted thestatements the way they did and to ensure that theirviewpoint was adequately represented in the Q-sort.Specifically, the qualitative interview data provided con-text for the interpretation of the quantitative Q studyresults.
The total set of Q-sorts (91) were then statisticallyanalysed through a by-person factor analysis to identifysignificant factors and then quantitatively and qualita-tively interpreted into viewpoints and compared forsimilarities/differences. The quantitative data was usedto statistically measure the relationship between individ-ual Q-sorts and factors, while the interview transcriptswere used to provide the context as to why participantschose their final sorts. Because Q methodology uses aby-person factor analysis, it offers the advantage ofneeding only a small sample to explore subjective topicsand identify complex viewpoints.
Administering the questionnaire
The accompanying questionnaire was completed aftereach Q-sort and measured the desire to install or adopt arange of energy efficiency technologies and/or behav-iours as well as the participant’s stated intent to do so.The questionnaire also captured personal and householddemographics. The distinction between ‘desire’ and ‘in-tent’was intentional, in order to capture situations when
a participant wanted to install/adopt a certaintechnology/behaviour (‘desire’), but could not do so(‘intent’). For example, some participants stated theirdesire to install solar photovoltaic systems to generateelectricity, but could not do so because of the cost or dueto being a tenant (low ‘intent’). The questionnaire alsoprovided an open text box to note differences betweenintent and desire, and any motivations or barriers toadopting the technology/behaviour. If there were anytechnologies or behaviours unfamiliar to the participant,they were asked to skip the question. After the question-naire was administered, each response was reviewedtogether by the researcher and the participant to ensurethat they understood the difference between ‘intent’ and‘desire’ for installing/adopting energy-efficient technol-ogies/behaviours.
In total, the questionnaire included 18 energytechnologies, from the UK’s Standard AssessmentProcedure (SAP), and 7 energy efficiency behaviours,shown in Table 8(see Appendix). The technologieswere taken from SAP since that is the main modelused by the government for policy intervention,while the behaviours were inductively identifiedfrom the 198 general population interviews conductedpreviously in Manchester and Cardiff (Pelenur andCruickshank 2011).
Linking the questionnaire with the Q study
To investigate the relationship between the results of thequestionnaire with each Q-sort, tests of associationswere carried out between the numerical Q factor loadingsand the questionnaire responses. For this purpose, otherstudies have used ANOVA, MANOVA, Pearson’s corre-lation and path analysis (Thomas and Baas, 1996; Kubier2010; Thomas et al., 1993; Thomas et al., 1982). However,
Fig. 1 Example of a participantperforming a Q-sort with cards.Source: http://www.betterevaluation.org/en/evaluation-options/qmethodology
1830 Energy Efficiency (2018) 11:1825–1846

since the questionnaire variables in this study consisted ofmultiple data types, a range of correlation measures andtest statistics were used to investigate the relationshipbetween the numerical Q factor loadings and the question-naire responses (Pelenur, 2013). Table 1 summarises thedata types associated with each of the questionnaire vari-ables and the test of association or test statistic used tocorrelate each variable with the numerical (interval/scalecontinuous) factor loadings from the Q study.
For all the listed tests of association, the nullhypotheses (HO) was no significant correlation betweenany of the questionnaire variables and the factor loadings,while the alternative hypothesis (HA) was the existence ofany correlation between the variables. Because therewere multiple hypotheses testing between variables, theresulting p value from each test was adjusted to correctfor multiple comparisons. For this study, the Benjamini-Hochberg procedure was used to adjust the final p valuesand control the false discovery rate.
Results
Factor analysis
A total of 45 Q-sorts were completed in Cardiff and46 in Manchester. Table 2 is the summary demo-graphics for the participants in each city, as well asthe percentages and averages for each city whereavailable (percentages do not always sum to 100due to rounding).
The sample demographics between Manchester andCardiff were broadly similar, but there were some ex-pected deviations between the sample and city averages.Most notably, there were many more married/commonlaw Q-sort participants than the city averages. This wasexpected given that partners were often recruited for theQ study in tandem, in line with the goal of investi-gating how inter-household dynamics affected view-points towards energy use. The other notable differ-ence was that not many participants under 30 wererecruited, and due to the difficulty of recruiting inpurpose built flats, there were more owner occupiednon-flat residents than the average. However, the Qstudy sample still captured households from all thekey demographics and was representative of theareas selected.
For Cardiff, the by-person factor extraction was doneusing centroid factor analysis (CFA) and judgementrotation, which is a common approach in Q methodolo-gy due to the flexibility it allows in relation to dataexploration (Watts and Stenner, 2012). Four factors wereidentified in Cardiff: a dominant factor, a positive spec-ificity, a negative specificity and a secondary factor. Aspecificity is defined as a factor where respondents thatload significantly on it also agree with the main domi-nant factor (Brown 1980). In this way, specificities allowthe researcher to examine a dominant theme from mul-tiple sub-viewpoints. The Cardiff specificity was alsobipolar, which means that it was defined by both posi-tively and negatively loading Q-sorts (Watts andStenner, 2012). Therefore, for analysis, the single bipolar
Table 1 Tests of associations used in study
Questionnaire variables Data type Test of association
Technology/behaviour desire Ordinal Likert item Spearman’s rho
Technology/behaviour intent Ordinal Likert item Spearman’s rho
Installed/adopted (yes/no) Dichotomous nominal Point biserial
Sex Dichotomous nominal Point biserial
Age Ordinal Spearman’s rho
Education level Nominal ANOVA (F test)
Marital status Nominal ANOVA (F test)
Household income Ordinal Spearman’s rho
Tenure Nominal ANOVA (F test)
Type of home Nominal ANOVA (F test)
House age Ordinal Spearman’s rho
Number of bedrooms Interval Pearson product-moment correlation
Energy Efficiency (2018) 11:1825–1846 1831

factor was separated into two unique factors to representeach of the poles. In order to identify statistically signif-icant Q-sorts for each factor at p < 0.05, the Q-sortloading value had to be greater than |0.243| (Brown1980). A higher significance level of 0.4 was used forthe secondary factor in order to avoid conflating Q-sorts,i.e. Q-sorts that load onto more than one factor, while asignificance level of 0.25 was used for the bipolarspecificity.
As well as the four common Cardiff factors identifiedthrough CFA, a single participant (C13) was also visu-ally identified during the judgement rotations as beingof interest because their Q-sort was diametrically differ-ent from the others in the sample. Qmethodology is wellplaced to the analysis of interesting single cases (Brown1980), which are generally viewed as advancing knowl-edge about the process by which wider subjectiveworlds are constructed and experienced (McKeown
Table 2 Q study demographics
Source for Cardiff and Manches-ter city averages: Office for?National Statistics 2013
Demographic variables Cardiffsample (%)
Manchestersample (%)
Cardiff city Manchester city
Sex
Female 60 52 51% 50%
Male 40 48 49% 50%
Age
Under 30 7 7 45% 50%
30–45 33 39 20% 22%
45–60 36 39 17% 14%
Greater than 60 24 15 18% 13%
Marital status
Single/widowed 33 35 61% 70%
Common law 67 65 39% 30%
Type of dwelling
Flat/apartment 11 11 27% 35%
Terrace (end or mid) 36 48 30% 30%
Semi/detached house 53 41 42% 35%
Tenure
Own 76 65 59% 38%
Rent/live with family/friends 24 35 41% 62%
Number of bedrooms
1–2 13 28 (average) (average)
3–4 82 67 2.8 2.5
Greater than 4 4 4
Number of occupants
1–2 58 46 (average) (average)
3–4 33 50 2.3 2.3
Greater than 4 9 4
Education level
Degree or more 67 67
High school/trade 33 33
Income
£20 k or less 29 24
£20 k to £40 k 20 26
£40 k to £60 k 13 17
Greater than £60 k 22 26
Refused 16 7
1832 Energy Efficiency (2018) 11:1825–1846

and Thomas 1988). As such, the single Q-sort fromparticipant C13 was analysed qualitatively and used toinform the discussion of the Cardiff results.
For Manchester, the data was less homogeneous andtherefore easier to isolate separate factors. The Man-chester factor analysis was initially done using CFA/judgement rotation as well as a principal componentanalysis (PCA)/varimax rotation, which is a more math-ematically precise solution but offers less flexibility withdata exploration (Watts and Stenner, 2012). Both ap-proaches yielded two clear factors, but the PCA solutionwith varimax rotation was selected because the factorswere easier to isolate. In total, two factors were identi-fied with a raised Q-sort significance level of 0.37 toreduce the instances of conflating sorts. The rotatedfactor loadings for each factor with flagged Q-sorts areshown in Table 9 (see Appendix).
The following narratives describe each of the factorsfor Cardiff and Manchester and were constructedthrough the interpretation of the factor arrays and post-sort interview comments. Q statements used in the nar-ratives are followed by their number and factor score inparenthesis. For readability, the phrasing of some state-ments were switched from positive to negative or viceversa signified by square brackets in the statement. Thistype of narrative design is a recognised method to pres-ent the results from a Q study (Watts and Stenner, 2012).
Cardiff factor 1 (dominant factor): I think about beingenergy efficient for the environment and greater good
Twenty-six participants’ Q-sorts exemplified this factor,making this the dominant factor in the Cardiff study thataccounted for 40% of the variance.
This factor exemplifies the household viewpoint thatenergy conservation can be driven by environmentalissues, including climate change. The viewpoint alsoincludes the idea of inter-generational responsibilityand that energy efficiency should not be viewed asan inconvenience, rather as a standard expectation.As such, this factor includes many statements fromthe ‘Environment and the future’ theme. Mostlymissing from the extreme ends of the factor arrayare statements regarding economics, finance andinefficient behaviours.
‘I’m concerned about the effect of energy use onthe atmosphere’ (21: +6) and can’t understandhow some people ‘don’t believe in climate
change’ (42: -6). Therefore because ‘protectingthe environment is important to me’ (27: +6), Istrongly believe ‘it’s our responsibility to lookafter the next generation’s future’ (49: +5), whichis why ‘parents should ensure that their kids aretaught how to be energy efficient at home’ (9: +3).From a wider perspective, ‘I’d like there to bemore environmentally friendly sources of energy’(13: +5) since ‘we are too dependent on fossilfuels’ (16: +4), but ‘the government is not doingenough about improving energy use’ (24: +5).To do my bit at home, ‘I rather use multipleblankets or put on more layers than turn up theheating’ (6: +1) but ‘I believe the ever increasingnumber of gadgets is a problem for energy effi-ciency’ (54: +3). However, even though gadgetsin the home are a problem for people in general,‘modern technology, such as plasma screens, are[not] more important to me than being energyefficient’ (59: -5). Definitely ‘the appearance ofmy home is [not] more important than being en-ergy efficient’ (17: -5) nor is ‘trying to keep upwith the neighbours...’ (19: -6)’. All in all, ‘beingenergy efficient is [not] a disruption to my life-style’ (52:-5), it’s about the environment and thegreater good.
Cardiff factor 2: I want to be more energy efficientto save money, but I don’t really know how
Five participants’ Q-sorts strongly exemplified this fac-tor, which accounted for 10% of the variance.
This factor points to financial reasons as the mainmotivation to conserve energy, without specificallytouching on other themes. This viewpoint also high-lights how even though financial savings may have beenthe main driver, households did not necessarily under-stand their energy use or how they could affect theirconsumption. As such, education and information cam-paigns that promote saving energy to save money withspecific practical examples may be very effective atspurring energy efficiency in these households(Pelenur, 2013).
Even though ‘I can afford my energy bills, [I’mstill motivated to] conserve energy’ (60: −6) be-cause ‘I’m [not] happy with my energy costs’ (50:-6), which is why I really ‘try and reduce myenergy use to save money’ (23: +6). As such, ‘I
Energy Efficiency (2018) 11:1825–1846 1833

would like my household energy use to be morecost effective’ (44: +6), but while ‘I [really] thinkabout my household energy use’ (28: -5) and ‘tryand conserve energy, sometimes it’s difficult to getother people to do the same’ (36: +3). ‘I thinkother people should be more aware about theirenergy use’ (43: +4), but I believe that ‘familieswaste energy because of convenience’ (40: +5)and that ‘woman use most of the energy at home’(11: +3).Unfortunately, while I try and conserve energy tosave money, ‘I don’t know if my energy use isabove average or below average’ (58: +5), nor do I‘know how much heating I use’ (8: +3). It reallydoesn’t help that ‘the energy and utility tariffscomplicated to understand’ (2: +4). Personally,‘modern technology, such as plasma screens, are[not] more important to me than being energyefficient’ (59: -5), but I rather heat the whole homeinstead of just one room (31: -5). I want to con-serve energy to save money, but I don’t reallyknow how.
Cardiff factor 3 (specificity of factor 1): I’m consciouslyand actively energy efficient because it is plain commonsense.
Three participants’ Q-sorts exemplified this factor,which was the positive bipolar specificity of factor 1accounting for 4% of the variance.
This specificity goes deeper into the environmentalmotivation of factor 1 and highlights how energy effi-ciency is not only about the environment but also aboutreducing waste as an overarching principal. This factoralso exemplifies the viewpoint that energy efficiency isa part of personal responsibility and lists specific exam-ples instead of using broad statements.
‘I try and conserve energy out of general principle’(39: +5), for example ‘I turn off lighting when notin the room’ (51: +6), I ‘heat one room rather thanthe whole home’ (31: +4), and ‘I make a consciouseffort to turn things off at the socket’ (48: +5).Basically, ‘I was raised to not waste energy’ (30,+3). However, ‘I try and conserve energy, butsometimes it’s difficult to get other people to dothe same’ (36: +3). That’s why I think ‘schoolsshould be teaching more about energy efficiencyto kids’ (57: +5) and that ‘parents should ensure
that their kids are taught how to be energy efficientat home’ (9: +3); in general, ‘not enough commu-nication is being done within households aboutenergy issues’ (41: +4).I take an active approach to being energy efficient,‘I [always] turn off the lights or TV’ (3: -5), ‘I[know] how to control my heating efficiently’ (12:-6), and ‘I [don’t] forget to turn the heating off’(46: -6).We can all be doing a bit more though, forexample ‘I think solar panels should be built intoall new properties’ (29: +6) and that ‘energy effi-cient bulbs [are] good’ (55: -5); ‘trying to keep upwith the neighbours is [not] more important thanbeing energy efficient’ (19: -6). I take an activeand conscious approach to being energy efficient,because what’s the point of waste?
Cardiff factor 4 (specificity of factor 1): I don’t reallythink about energy-efficient behaviours, but I want myenergy supply to be renewable and greener
Five participants’ Q-sorts exemplified this factor, whichwas also the negative bipolar specificity of factor 1accounting for 4% of the variance.
This factor was the bipolar viewpoint of factor 3; assuch, this viewpoint focused on the responsibility ofenergy generation companies to promote energy effi-ciency instead of personal responsibility. Although en-vironmental concerns were important to this viewpoint,the desire to be energy efficient did not always translateto action at home.
‘Protecting the environment is important to me’(27: +5), which is why ‘I’d like there to be moreenvironmentally friendly sources of energy’ (13:+5). Specifically, I believe ‘we’re not using sunlight or wind effectively as a nation’ (25: +6),and that ‘solar panels should be built into allnew properties’ (29: +6). Ideally I ‘want myenergy use to be greener’ (12: +5) and that ‘asa society, we should be self sufficient with ourenergy’ (53: +4).However, ‘I [don’t always] make a consciouseffort to turn things off at the socket’ (48: -3) or‘use as little energy as possible’ (5: -2). But defi-nitely ‘the appearance of my home is [not] moreimportant than being energy efficient’ (17: -5) noris ‘trying to keep up with the neighbours...’ (19: -6). I also think that ‘modern technology, such as
1834 Energy Efficiency (2018) 11:1825–1846

plasma screens, are [not] more important to methan being energy efficient’ (59: -5). Even though‘I can afford my energy bills, [I still care] aboutconserving energy’ (60: -6). I may not alwaysthink about conserving energy, but for the sakethe environment, I wish my energy supply wasrenewable and green.
Cardiff single case Q-sort (C13)
Even though this Q-Sort did not load on any singlefactor, it was sufficiently different from the otherresponses that it warranted a more detailed analysis.This single case exemplified a unique viewpoint fromthe study, one which revealed a detached approach toenergy use without a clear motivation to conserveenergy.
A reason for this view may be that participant C13did not pay any of the bills, instead his wife managed allthe household finances. In the post-sort interview, theparticipant said that household energy use ‘doesn’t im-pact anybody else’s life’ and that ‘if people want towaste [energy], they can because they pay for it’. Un-derstanding this context helps explain the viewpoint. Asa unique single case, this viewpoint is worth including inthe discussion but was unable to be quantitatively com-pared to the other factors.
When it comes to energy use in my home, I don’treally care. I especially don’t want ‘.. . moreinformation about my household’s energy use’(38: −6). To be fair, as a man it’s not my problemsince ‘woman use most of the energy at home’(11: +5), although ‘families waste energy becauseof convenience’ (40: +3). Regardless, I think ‘[toomuch] communication [is] being done withinhouseholds about energy issues’ (41: -5). If any-thing, ‘schools should be teaching more aboutenergy efficiency to kids’ (57: +3), not me.While I strongly agree that ‘it’s our responsibilityto look after the next generation’s future’ (59: +6),‘it’s a balance between what you pay for energyand what it costs you to improve energy efficien-cy’ (37: +5). For example, I admit that ‘trying tokeep up with the neighbours is more importantthan being energy efficient’ (19: +3) and that‘modern technology, such as plasma screens aremore important to me than being energy efficient’(59: +6). Even though I agree that ‘the ever
increasing number of gadgets is a problem forenergy efficiency’ (55: +4). I guess I just don’tagree with the importance of conserving energy.For me, ‘being energy efficient is about savingtime’ (47: +4), which is why ‘it’s better to heat oneroom rather than the whole home’ (31: +5). Al-though, ‘my house is [not] very hard to heat’ (64: -4), which means that ‘I [do not really] want toreduce my heating’ (10: -3), nor do I care about ‘... my household energy use [being] more costeffective’ (44: −3).When it comes to the environment, ‘I don’t [par-ticularly] believe in climate change’ (42: +3) and‘protecting the environment is [not that] importantto me’ (27: −2). I don’t really think ‘we are toodependent on fossil fuels’ (6: −2) and I especiallywould not ‘.. . like there to be more environmen-tally friendly sources of energy’ (13: -4), for ex-ample ‘I [don’t] think solar panels should be builtinto all new properties’ (29: -4). We should justleave homes as they are, I don’t want to see ‘oldhomes . .improved to modern building standards’(7:-6). As a society, we’re making a big deal aboutnothing important.
Manchester factor 1: I think about being energy efficientand the environment is important to me, but I reduceenergy to save money
Twent-five participants’ Q-sorts exemplified this factoraccounting for 33% of the variance.
This factor presents a balanced viewpoint that con-siders both environmental and financial motivations toconserve energy, and as such includes a range of energyefficiency themes in a single factor. This viewpointunderscores the challenge of understanding energy useat home. This viewpoint is similar to a combination offactors 1 and 2 from Cardiff.
‘It’s our responsibility to look after the next gen-eration’s future’ (49: +6) and ‘protecting the envi-ronment is important to me’ (27: +6), but ‘I try andreduce my energy use to save money’ (23: +5) asopposed to just the environment. If ‘I [do] thinkabout my household energy use’ (28: -5) it’s be-cause ‘I would like my household energy use tomore cost effective’ (44: +5), which is why ‘I turnoff lighting when not in the room’ (51: +4),‘[don’t] leave lights on for appearances’ (33: -4),
Energy Efficiency (2018) 11:1825–1846 1835

and ‘I’m [not] too lazy to always turn off the lightsor TV’ (3: -5). Aside from just saving money, ‘Iuse as little energy as possible’ (5: +3) because ‘Iwas raised to not waste energy’ (30: +3), I basi-cally ‘try and conserve energy out of generalprinciple’ (39: +5).Of course, ‘I [do] believe in Climate Change’ (42:-6) and ‘I’m concerned about the effect of energyuse on the atmosphere’ (21: +4), so as well astaking personal responsibility, ‘I’d like there tobe more environmentally friendly sources of en-ergy’ (13: +4) and ‘think solar panels should bebuilt into all new properties’ (29: +4). Especially,since ‘the appearance of my home is [not] moreimportant than being energy efficient’ (17: -5), noris ‘trying to keep up with the neighbours moreimportant than being energy efficient’ (19: -6).‘Being energy efficient is [not] a disruption tomy lifestyle’ (52: -4) and the environment is im-portant to me, but I reduce energy to save money.
Manchester factor 2: I don’t really know how muchenergy I use, nor do I really care. I’m too lazy to changemy lifestyle.
Five participants’ Q-sorts exemplified this factor ac-counting for 14% of the variance.
This factor is a striking viewpoint that focuses on thecomfort and lifestyle effects of energy use rather thancontaining motivations for energy efficiency. As a re-sult, when considering interventions to promote energyconservation, financial incentives may not be effectiveon these households if the result will negatively impacton the household’s lifestyle.
Energy use at home is just not that important tome. ‘I don’t know howmuch heating I use’ (8: +5)and I’m not ashamed to say that ‘I’m too lazy toalways turn off the lights or TV’ (3: +6). Funda-mentally, ‘being comfortable is more importantthan saving energy’ (56: +4), that’s why ‘I [leave]lights on when not in the room’ (51: -5), ‘[don’t]make a conscious effort to turn things off at thesocket’ (48: -6), and ‘sometimes forget to turn myheating off’ (46: +4). Although I do agree that ‘it’sbetter to heat one room rather than the wholehome’ (31: +5).From a broad perspective, ‘I [do] believe in cli-mate change’ (42: -6) and I do think that ‘we are
too dependent on fossil fuels’ (16: +6) since‘we’re not using sunlight or wind effectively as anation’ (25: +5) but I don’t let it affect my life-style. ‘I [don’t] use as little energy as possible’ (5:-4) and ‘when I buy and appliance, I [don’t checkthe energy ratings’ (18: -5), I just buy what I want.I’m not really that fussed about thinking about myenergy use, but I do agree that ‘the energy andutility tariffs are complicated to understand’ (2:+2), although I feel strongly that ‘people should[not] pay the same per-unit-cost of energy regard-less of how much they use’ (20: -5). I don’t reallyknow how much energy I use, nor do I really care.I’m too lazy to change my lifestyle.
Questionnaire results
Using the statistical software package R, the results fromthe questionnaires were correlated with the Q studyfactor loadings according to the tests of associationsdescribed in Table 2, and their p values were adjustedto compensate for multiple comparisons using the BHstep-up procedure. The results shown in Tables 3 and 4are the variables which were found to be significantlycorrelated (p < 0.05) with each of the factor loadings(note the sign of the correlation to determine directionof relationship).
Since the Cardiff factor 4 loadings were the invertedloadings from factor 3, it was expected to find aninverse relationship between the variable associationsof factor 3 and 4.
The results from the tests of association reveal thatthe only energy efficiency behaviour significantly cor-related with Cardiff factor 1 was using washing ma-chines at a lower temperature. Interestingly, the intentto install combined heat and power generators (CHP)was negatively correlated with the factor. Commentsfrom the questionnaires stated that CHPs were unfa-miliar, ‘not appropriate’ because of rental propertyor area, too much of a ‘financial outlay’ and thatsome participants ‘needed more information aboutthe cost and benefit’. This indicates that even thoughthis factor highlighted energy conservation for theenvironment and greater good, this alone may not beenough to encourage the uptake of less-known ret-rofit technologies such as combined heat and powergenerators.
Not surprisingly for Cardiff factor 2 (I want to bemore energy efficient to save money, but I don’t really
1836 Energy Efficiency (2018) 11:1825–1846

know how), the viewpoint was not correlated with anyenergy-efficient technologies or behaviours, althoughthere was a relationship with this viewpoint and thequestionnaire question relating to energy awareness(‘how frequently do you think about your householdenergy’?). This positive correlation supports energyefficiency interventions, as it suggests that a portionof households are motivated to be energy efficientand think about it often, but just do not know how togo about it.
Cardiff factors 3 (I’m consciously and actively ener-gy efficient because it is plain common sense) and 4 (Idon’t really think about energy efficient behaviours, butI want my energy supply to be renewable and greener)were specificities of factor 1 and represented two bipolarviewpoint. Being a specificity implies general agree-ment with the main factor, but from alternate perspec-tives. There were no associations between either factorand energy efficiency demographics or behaviours, butthe installation of radiator thermostats and wall
Table 3 Significantly correlated technologies, behaviours and demographic variables for Cardiff factors
Questionnaire variables p value Statistic Test of association
Factor 1: I think about being energy efficient for the environment and greater good
Technologies
Combined heat and power (intent) 0.032 − 0.509 Spearman’s rho
Behaviours
User lower washing machine temp. (adopt) 0.032 0.510 Point biserial
Factor 2: I want to be more energy efficient to save money, but I don’t really know how
Demographics
Energy awareness 0.041 12.321 F statistic
Factor 3: I’m consciously and actively energy efficient because it is plain common sense.
Technologies
Wall insulation (installed) 0.039 0.493 Point biserial
Radiator thermostats (installed) 0.019 0.556 Point biserial
Factor 4: I don’t really think about energy-efficient behaviours, but I want my energy supply to be renewable and greener
Technologies
Wall insulation (installed) 0.039 − 0.493 Point biserial
Radiator thermostats (installed) 0.019 − 0.556 Point biserial
Table 4 Significantly correlated technologies, behaviours and demographic variables for Manchester factors
Questionnaire variables p value Statistic Test of association
Factor 1: I think about being energy efficient and the environment is important to me, but I reduce energy to save money
Behaviours
Turn off appliances completely (desire) 0.004 0.566 Spearman’s rho
Turn off appliances completely (intent) 0.017 0.488 Spearman’s rho
Turn off appliances completely (adopt) 0.004 0.578 Point biserial
Consciously use less (desire) 0.017 0.488 Spearman’s rho
Consciously use less (intent) 0.017 0.482 Spearman’s rho
Consciously use less (adopt) 0.004 0.554 Point biserial
Factor 2: I don’t really know how much energy I use, nor do I really care. I’m too lazy to change my lifestyle.
Behaviours
Turn off appliances completely (adopt) 0.017 − 0.500 Point biserial
Energy Efficiency (2018) 11:1825–1846 1837
insulation were positively associated with factor 3 andthereby negatively associated with factor 4. The associ-ations support the interpretation of the viewpoints. Fac-tor 3 represented a proactive perspective to energy effi-ciency while factor 4 represented the passive perspec-tive. An interesting result was that only the that only thesimplest and most cost effective retrofit measures wereassociated with factor 3, even though it represented aproactive specificity of factor 1 (environmental). Thissuggests that households with proactive energy efficien-cy viewpoints based on environmental concern may stillrequire specific targeted incentives to encourage theuptake of energy efficiencymeasures, i.e. their proactiveand environmental beliefs may not be enough to moti-vate them to install retrofit measures (PelenurM., 2013).
For the results from Manchester, it was not possibleto easily identify the two axes seen in Cardiff (save theenvironment and save money); rather, Manchester’sfactor 1 was a conflation of both themes. Two energyefficiency behaviours (desire, intention and adoption)were correlated with the viewpoint: turning off appli-ances completely as opposed to leaving them on stand-by and consciously using less energy. No retrofit tech-nology was associated with the factor. These behaviour-al associations were consistent with the factor’s proac-tive approach towards energy efficiency.
For Manchester factor 2 (I don’t really know howmuch energy I use, nor do I really care. I’m too lazy tochange my lifestyle), the only behaviour correlated withthe viewpoint was a negative association with turningoff appliances completely. This factor shines a light onhouseholds that may be deliberately wasting energy.Improving our understanding of the motivations andbarriers to energy efficiency for these households shouldbe the topic of future research, as reaching householdswho hold this viewpoint through traditional incentives(financial or social pressure) may not be effective.
Comparison between Manchester and Cardiff
The viewpoints within Manchester and Cardiff over-lapped substantially when compared qualitatively, withthe exception of Manchester factor 2 (apathy). On thesurface, this may indicate that typical households inlarge UK cities consider energy use within the themesof the environment and financial concerns. The maindifference between the two studies is that the apatheticviewpoint towards energy use was clearly identified inManchester, while mostly missing in Cardiff. Another
difference was that in Cardiff, the responsibility of de-livering energy efficiency measures was split betweenthe government and households. A possible reason forthe difference in apathy between cities may be due todiffering awareness campaigns by local councils, orlarge external projects that are highly visible to thecommunity, such as the proposed tidal power plants inWales.
Because the same statements were used in both cities,it was also possible to compare the results quantitativelybetween Cardiff and Manchester. This was accom-plished by using each identified viewpoint (factor array)from Manchester and Cardiff as Q-sorts in a new Qstudy. This technique, known as second-order factoranalysis, yielded a secondary set of super factors thatcaptured any relevant family associations or differencesbetween the original viewpoints (Watts and Stenner,2012). Table 5 is the correlation matrix from thesecond-order factor analysis.
The correlation matrix in Table 5 demonstrates howthe themes from Manchester and Cardiff overlap. Forexample, Manchester factor 1 was associated to somedegree with all the Cardiff factors, which supports theinterpretation that Manchester factor 1 was a conflationof the separate themes identified in Cardiff.
Alternatively, Manchester factor 2 only showed aweak association with Cardiff factor 1 and 4. This resultalso supports the interpretation of Manchester factor 2,since even though it represented a disinterested andapathetic approach towards household energy use, theviewpoint still exemplified a certain degree of environ-mental awareness, which was also strongly revealed inCardiff factor 1. Although unlike Cardiff factor 1, envi-ronmental awareness did not motivate households toadopt energy efficiency practices.
Cardiff factor 4 and Manchester factor 2 also sharedthemes of a passive approach to energy efficiency with aminimum amount of responsibility placed on the house-hold. From the opposite pole, Manchester factor 2 wasstrongly not associated with Cardiff factors 2 and 3. Thisis in line with the interpretation of Manchester factor 2since Cardiff factors 2 and 3 represented a proactivedesire to be energy efficient.
Household-shared viewpoints
In a Q study, each participant is analysed independentlyusing their Q-sort. However, the Q-set was created fromstatements that reflected a household perspective
1838 Energy Efficiency (2018) 11:1825–1846

towards energy use. To investigate the similarities/differences between the viewpoints of individuals livingin the same household, this study did include multipleparticipants from the same dwelling, for example hus-band and wife, or mother and daughter. As such, theresults for multi-participant households were examinedto identify if they shared a common viewpoint, or helddiffering viewpoints about energy use. In Cardiff, therewere six multi-participant households, while in
Manchester, there were five. The participant relation-ships and factor association are shown in Table 6.
Table 6 revealed that 5 out of the 11 multi-participanthouseholds did not share a common viewpoint. How-ever, Cardiff factor 4 was as a subset of factor 1, since itwas its specificity, so it may be considered to share thesame overarching theme. Likewise, having no factorassociation does not necessarily imply a disagreement,but rather that the participant’s Q-sort was conflated, i.e.
Table 5 Correlation matrix between Manchester and Cardiff viewpoints
Correlation matrix between Manchester and Cardiff viewpoints
Manchester 1 Manchester 2 Cardiff 1 Cardiff 2 Cardiff 3 Cardiff 4
Manchester 1 1.00 0.18 0.85 0.59 0.73 0.70
Manchester 2 0.18 1.00 0.36 0.09 0.01 0.45
Cardiff 1 0.85 0.36 1.00 0.45 0.68 0.84
Cardiff 2 0.59 0.09 0.45 1.00 0.44 0.52
Cardiff 3 0.73 0.01 0.68 0.44 1.00 0.48
Cardiff 4 0.70 0.45 0.84 0.52 0.48 1.00
Table 6 Multi-participant house-hold relationships and factorassociations
Location Participant Factorassociation
Relationship
Cardiff 1 C8 2 Mother (senior)
C9 1 Daughter (late 30s)
Cardiff 2 C14 4 Wife
C15 4 Husband
Cardiff 3 C17 1 Husband
C18 1 Wife
Cardiff 4 C22 1 Husband
C23 4 Wife
Cardiff 5 C25 None Husband
C26 1 Wife
Cardiff 6 C38 4 Daughter (late 20s)
C39 1 Father (late 40s)
Manchester 1 M6 1 Wife
M7 1 Husband
Manchester 2 M18 None Daughter (late 20s)
M19 None Father (late 50s)
Manchester 3 M23 1 Wife
M24 1 Husband
Manchester 4 M34 1 Wife
M35 1 Husband
Manchester 5 M42 None Husband
M43 1 Wife
Energy Efficiency (2018) 11:1825–1846 1839

loaded on multiple factors. Based on this interpretation,the results from Table 6 show only one household(Cardiff 1) with substantially different viewpoints.
For this household, the adult daughter (C9) loaded onCardiff factor 1 (I think about being energy efficient forthe environment and greater good), while the elderlymother (C8) loaded significantly on Cardiff factor 2 (Iwant to be more energy efficient to save money, but Idon’t really know how). Examining the demographicsrevealed that occupant C8 owned the home, andtherefore, ownership and maintenance of a homeinfluenced participant C8’s viewpoint towards con-serving energy to save money. Although, interestingly,the other two parent-child households did not show thispattern.
The overall results suggest that occupants inhouseholds with committed relationship may sharean aligned viewpoint towards energy use. This insight isrelevant for policy makers aiming to change householdbehaviour towards energy, as it indicates that a unifiedapproach per household is justified; however, this resultshould be validated with a wider sample. Nevertheless,it was interesting to see that all wife/husband pairsshared very similar viewpoints towards energy use.
Discussion
The factors that emerged from Cardiff and Manchesterexemplified viewpoints about household energy usefrom typical neighbourhoods. These viewpoints andthemes emerged inductively from the general publicand participants themselves, instead of a priori theory.As a result, the viewpoints were free from theoreticalconstraints which may have biased their narratives.Though it is possible that the researchers may haveinadvertently introduced their own bias into the results,care was taken at all stages of the study design andresearch to minimise possible sources of such bias.
The viewpoints generally mapped onto three axesgrouped by theme: saving the environment, savingmon-ey and apathy. Within the environmental axis, two bi-polar specificity viewpoints were also identified: takingan active approach to energy efficiency because that isthe right thing to do and taking a passive approach tobeing energy efficient but hoping that others will makethe energy supply more efficient.
These viewpoints were not counter-intuitive, house-holds think about energy in terms of money, the
environment or do not care. Yet, this research was ableto describe those viewpoints in more detail and distil the‘noisy’ subjective discourse about household energyinto succinct and useful summaries, as well as investi-gate their relationship to energy efficiency technologiesand behaviours. As such, these Q-studies provided rig-orous and empirical results that policy makers and ret-rofit professionals can apply to improve the energyperformance of the built environment. Each viewpointis discussed in more detail below.
The environment
A strong theme of environmental responsibility wasstrongly seen in Cardiff factor 1 and Manchesterfactor 1. However, these factors also showed thatsuch environmental motivations did not always leadto the adoption of energy-efficient technology orbehaviours. For example, reducing costs was astrong motivation in Manchester factor 1. This in-sight is in line with other research which highlightthe disconnect between environmental intentions andaction (Lutzenhiser 1992; Jackson 2004; Allcott andMullainathan 2010; Upham et al. 2009; Faiers et al.2007). A consequence of this result is that publicinformation campaigns to encourage the adoptionenergy-efficient technologies/behaviours should notrely solely on an environmental or green message;rather, the specific motivations from the target audi-ence should be well researched and understood. Theresults from this study show that environmentalawareness alone may not be enough to spur homeenergy efficiency improvements.
Saving money
Unsurprisingly, reducing energy costs is a commontheme across energy efficiency research (Swan andUgursal, 2009). Although, similar to the environ-mental theme, saving money alone does not alwayslead to the uptake of energy efficiency technologiesor behaviours Pelenur, 2013). Households also needto know what action to take and how to take them,as exemplified in Cardiff factor 2 (I want to bemore energy efficient to save money, but I don’treally know how). As such, a clear call to action(the ‘how’) should be presented alongside the costsavings benefits of energy efficiency.
1840 Energy Efficiency (2018) 11:1825–1846

An interesting insight from Cardiff factor 2 was thateven though households want to reduce their energy costs,some still indicated a preference to heat their whole home,thereby potentially wasting heat, as opposed to just heatingthe most used rooms. This indicates differing preferencesfor the utility of energy. In this case, adopting a loss frameto promote energy efficiency may be more effective than again frame, i.e. instead of promoting the monetary savingsof specific energy efficiency measures/behaviours, infor-mation campaigns should highlight the costs of inefficientbehaviours or poor performing technology. Highlightingcosts as opposed to savings uses insights from behaviouraleconomics that losses or disadvantages have greater impacton preferences than gains or advantages (Tversky andKahneman, 1991).
Apathy
It should be recognised that not all households are inter-ested or think about their energy use. Manchester factor 2(I don’t really know howmuch energy I use, nor do I reallycare. I’m too lazy to change my lifestyle) highlighted thisapathy. Targeting the segment of households with thisviewpoint through traditional energy efficiency interven-tions may not be effective. For these households, it may bemore effective to frame energy efficiency interventions interms of convenience or lifestyle improvements. For ex-ample, offering a house tidy up service alongside loftinsulation. Alternatively, it may be that the most effectiveway to reach these households is not through direct inter-ventions, but rather by improving the efficiency of theoverall energy supply system, such as de-carbonising thegrid. Systematic changes to the overall system may notchange the energy demand of these households, but it willat least minimise their environmental impact.
Limitations of the Q study
A Q study is an effective research method to study sub-jective topics, such as home energy use. However, theresults present a ‘snap shot’ in time, using data fromtoday’s context. As such, the insights from this studymay not necessarily be applicable under different circum-stances. For example, there may be substantial differencesbetween how households in the UK view their own energyuse compared to other parts of the world. However, themethodology does not aim for generalisability in a quan-titative sense, instead it aims to identify individual view-points from within a complex topic. The overlapping
results between Manchester and Cardiff suggest that theidentified viewpoints may also be applicable to other largeUK cities, but further research is necessary to confirm thishypothesis.
Conclusions
To better understand the energy efficiency gap, this re-search identified household viewpoints towards energyand linked those viewpoints with preferences towardsenergy efficiency technologies and behaviour. An originalcontribution of this research was to investigate householdviewpoints towards energy in a broad study and link thoseviewpoints to specific technologies/behaviours, as opposedto researching a specific type of viewpoint, such as envi-ronmentalism, or technology, such as wind or solar power.
The results revealed a range of nuanced viewpoints,which mapped onto three main household themes: energyuse in terms of the environment, energy in relation tomoney and apathy towards energy. Interestingly, therewere only a small number of strong correlations betweendistinct energy viewpoints and specific energy efficiencytechnologies or behaviours. This result supports other re-search showing that being environmentally aware andactively concerned about energy efficiency may not initself lead to a stated desire or intention to install energy-efficient technologies (Frederiks et al., 2015).
To widen the research applicability, this study designcould be repeated in fringe communities, as opposed to‘typical’ neighbourhoods. The findings from such studieswould allow for similarities/differences to be identifiedbetween samples. Together, the investigation of view-points in typical neighbourhoods, as well as fringecommunities, would allow for a more holistic inter-pretation of the data and improve the applicability ofthe recommendations. Another area for further re-search is to investigate how these results for house-holds can be scaled up to encourage city-wideretrofitting. Such systematic city-level action, as op-posed to piecemeal upgrades, is required for the step-change needed to improve the energy performance ofthe built environment and reduce national greenhousegas emissions.
Compliance with ethical standards
Conflict of interest The authors declare that they have no con-flict of interest.
Energy Efficiency (2018) 11:1825–1846 1841

Appendix
Table 7 Q statements and factor arrays
Q statements Cardiff factors Man. Factors
1 2 3 4 1 2
1. I don’t know how I would start going about changing my household’s energy use − 1 − 1 − 2 − 2 − 1 3
2. The energy and utility tariffs are complicated to understand 2 4 0 4 1 2
3. I’m too lazy to always turn off the lights or TV − 3 1 − 5 − 1 − 5 6
4. Even though there are government grants to install renewable generation, it is still too expensive 0 3 1 2 2 0
5. I use as little energy as possible 0 2 1 − 2 3 − 46. I rather use multiple blankets or put on more layers than turn up the heating 1 − 2 1 0 2 − 37. Old homes should be improved to modern building standards 0 5 0 − 1 1 3
8. I don’t know how much heating I use − 1 3 − 2 2 − 2 5
9. Parents should ensure that their kids are taught how to be energy efficient at home 3 0 3 1 3 2
10. I want to reduce my heating 0 2 0 1 2 3
11. Woman use most of the energy at home − 3 3 1 − 2 − 2 − 412. I don’t know how to control my heating efficiently − 2 1 − 6 0 − 2 − 213. I’d like there to be more environmentally friendly sources of energy 5 1 2 5 4 1
14. I want my energy use to be greener 3 0 3 5 3 1
15. I want to change how my household uses energy 0 1 0 1 1 − 216. We are too dependent on fossil fuels 4 − 2 − 1 2 1 6
17. The appearance of my home is more important than being energy efficient −5 − 3 − 3 − 5 − 5 − 118. When I buy an appliance, I check the energy ratings 1 0 2 0 0 − 519. Trying to keep up with the neighbours is more important than being energy efficient − 6 − 4 − 5 − 6 − 6 − 420. People should pay the same ‘per unit cost’ of energy regardless of how much they use − 1 0 − 2 − 1 0 − 521. I’m concerned about the effect of energy use on the atmosphere 6 − 1 1 4 4 3
22. I’d like to generate my own energy 1 0 2 1 0 0
23. I try and reduce my energy use to save money 2 6 0 2 5 − 124. The government is not doing enough about improving energy use 5 − 2 2 3 0 1
25. We’re not using sunlight or wind effectively as a nation 4 0 1 6 1 5
26. I switch energy tariffs regularly to get the best deal − 4 − 4 − 3 − 4 − 2 − 127. Protecting the environment is important to me 6 1 4 5 6 3
28. I never really think about my household energy use − 4 − 5 − 4 − 3 − 5 − 229. I think solar panels should be built into all new properties 4 2 6 6 4 1
30. I was raised to not waste energy 0 2 3 0 3 1
31. It’s better to heat one room rather than the whole home 1 − 5 4 3 2 5
32. People tell me what I should do to conserve energy but they don’t actually do it themselves − 1 − 2 0 0 − 1 0
33. I leave lights on for appearances − 3 − 3 − 3 − 2 − 4 2
34. The heating in my home isn’t thought out properly − 1 0 − 3 3 − 1 − 135. Teenagers are not serious about saving energy − 1 − 1 1 − 2 0 4
36. I try and conserve energy, but sometimes it’s difficult to get other people to do the same 1 3 3 0 1 − 237. It’s a balance between what you pay for energy and what it costs you to improve energy efficiency 0 − 3 2 − 1 0 − 138. I’d like more information about my household’s energy use 0 1 − 1 0 2 1
39. I try and conserve energy out of general principle 4 4 5 0 5 − 140. Families waste energy because of convenience 1 5 2 3 0 2
1842 Energy Efficiency (2018) 11:1825–1846

Table 7 (continued)
Q statements Cardiff factors Man. Factors
1 2 3 4 1 2
41. Not enough communication being done within households about energy issues 1 − 1 4 − 1 − 1 0
42. I don’t believe in climate change − 6 − 3 0 − 5 − 6 − 643. I think other people should be more aware about their energy use 0 4 3 1 1 0
44. I would like my household energy use to be more cost effective 2 6 4 3 5 2
45. Solar panels are changing the look of cities, not in a nice way − 3 − 1 − 1 − 3 − 3 − 246. I sometimes forget to turn the heating off − 2 0 − 6 − 1 − 2 4
47. Being energy efficient is about saving time − 2 − 1 − 1 − 3 − 3 − 348. I make a conscious effort to turn things off at the socket 1 3 5 − 3 3 − 649. It’s our responsibility to look after the next generation’s future 5 1 1 4 6 2
50. I’m happy with my energy costs − 2 − 6 − 1 − 4 − 2 − 351. I turn off lighting when not in the room 2 4 6 1 4 − 552. Being energy efficient is a disruption to my lifestyle − 5 − 3 − 4 − 3 − 4 − 353. As a society, we should be self-sufficient with our energy 3 0 0 4 1 0
54. The ever increasing number of gadgets is a problem for energy efficiency 3 1 − 1 2 0 4
55. Energy efficient bulbs are not good − 4 − 4 − 5 − 4 − 4 − 156. Being comfortable is more important than saving energy − 2 − 2 − 1 − 2 − 3 4
57. Schools should be teaching more about energy efficiency to kids 3 2 5 − 1 2 1
58. I don’t know if my energy use is above average or below average − 1 5 − 1 2 − 1 0
59. Modern technology, such as plasma screens, are more important to me than being energy efficient − 5 − 5 − 4 − 5 − 3 1
60. I can afford my energy bills, so I’m not bothered about conserving energy − 4 − 6 − 3 − 6 − 4 0
61. I don’t usually think about how to be energy efficient − 2 − 1 − 2 − 1 − 3 − 262. Better insulation for my home means I can keep the heating on for a longer time − 3 − 4 − 2 − 4 − 1 − 463. I don’t trust the energy companies when they say they will give you advice 2 − 2 − 2 1 − 1 0
64. My house is very hard to heat − 1 2 − 4 1 0 − 365. Nuclear energy is dangerous 2 − 1 0 0 − 1 − 1
Table 8 Technologies and energy efficiency behaviours included in the questionnaire
Technologies
Loft insulation Wall insulation Floor insulation Boiler insulation
Double glazing Triple glazing Condensing boiler Draught proofing
Ground source heat pump Domestic combined heatand power (CHP)
Air source heat pump Energy efficient lighting
Passive lighting Micro-wind Solar PV Solar thermal
Improved heating controls Radiator thermometers
Behaviours
Seek energy saving advice (fromenergy companies or government)
Coordinate the time-of-use of appliancesin order to minimise peak demand
Turn appliances off completelyrather than leave on stand-by
Get rid of unnecessarygadgets or appliances
Consciously use less Use lower temperature for washingmachine
Put on a jumper before turningup the heating
Energy Efficiency (2018) 11:1825–1846 1843

Table 9 Rotated factor loadings with significant loading Q-sorts
Cardiff factors Manchester factors
Q-sort 1 2 3 4 Q-sort 1 2
C1HTY1 0.7068X 0.2671 0.2048 − 0.2048 M1HOY1 0.7019X 0.342
C1HOY2 0.7661X 0.2399 − 0.1937 0.1937 M1HOO2 0.2943 0.1681
C1HOY3 0.6260X 0.3757 − 0.2308 0.2308 M1HOY3 0.7937X − 0.0968C2HOY4 0.4626X 0.2787 0.2251 − 0.2251 M1HTY4 0.6904X − 0.0984C1HOY5 0.18 0.5455X − 0.1022 0.1022 M1FTO5 0.2745 0.2602
C1HOY6 0.6971 0.1962 0.2818X − 0.2818 M1HTY6 0.6609X 0.0564
C1HOY7 0.7977X 0.083 0.236 − 0.236 M1HTY7 0.6150X 0.1629
C2HOY8 0.3548 0.4679X − 0.245 0.245 M1HTY8 0.5096X 0.1729
C2HTY9 0.4028X 0.1311 − 0.034 0.034 M2HOO9 0.4855 0.4702
C1HOY10 0.3038 0.4632X 0.0646 − 0.0646 M3HTY10 − 0.0529 0.7494X
C1HOY11 0.5695X 0.225 − 0.2223 0.2223 M2HOY11 0.4713 0.4969
C2HOY12 0.7549X 0.1582 − 0.0357 0.0357 M2HOY12 0.2389 0.4386X
C2HOY13 − 0.1006 − 0.1848 0.1657 − 0.1657 M2FTY13 0.6272 0.4946
C2HTY14 0.4971 0.358 − 0.288 0.2880X M2HOY14 0.6752 0.4383
C2HTY15 0.8362 0.2152 − 0.3362 0.3362X M2HOY15 0.6266X 0.3505
C1HOY16 0.7354X 0.2686 − 0.0693 0.0693 M2HOY16 0.6036X 0.2083
C1HOY17 0.8918X − 0.0388 0.1312 − 0.1312 M2HOO17 0.8025X 0.0721
C1HOY18 0.8690X 0.1059 − 0.1248 0.1248 M3HTY18 0.4877 0.4628
C2HTY19 0.3896 0.4491X − 0.1767 0.1767 M3HOY19 0.4143 0.591
C1HOY20 0.6011 0.452 − 0.1813 0.1813 M3HOO20 0.4857 0.4583
C3FTY21 0.5065 0.4242 0.1956 − 0.1956 M2FTO21 − 0.055 0.3728X
C2HOY22 0.5849 0.2143 − 0.338 0.3380X M2HOY22 0.4398X 0.3314
C2HOY23 0.8487X 0.0944 − 0.008 0.008 M2HOY23 0.6452X 0.2344
C1HTY24 0.8074X 0.1921 0.0389 − 0.0389 M2HOY24 0.6323X 0.1226
C3HOY25 0.5543 0.4987 0.0474 − 0.0474 M1HOY25 0.5949 0.3996
C3HOY26 0.4940X 0.3657 − 0.1379 0.1379 M3HOO26 − 0.3191 0.6026X
C3FOO27 0.6256X 0.345 0.1792 − 0.1792 M1HTY27 0.5816X 0.1197
C3HOO28 0.6715 0.4219 0.2317 − 0.2317 M2HOY28 0.5953X 0.2415
C3HOY29 0.7808X 0.2196 − 0.0534 0.0534 M3HOY29 0.6439X 0.3069
C4HOY30 0.554 − 0.0459 0.3009X − 0.3009 M4HOO30 0.0688 0.3714X
C4HOY31 0.6731 0.4089 0.2082 − 0.2082 M3HTY31 0.5572X 0.1902
C2HOY32 0.7022X 0.1821 − 0.1779 0.1779 M4FOO32 0.6262X 0.2707
C3HOO33 0.6194X 0.3176 0.137 − 0.137 M3HTY33 0.4333 0.7265
C4HOY34 0.6918X 0.2246 0.1496 − 0.1496 M3HOO34 0.6497X 0.1197
C3FTY35 0.8220X 0.0412 0.104 − 0.104 M3HOO35 0.6966X 0.1762
C4HOY36 0.4576 0.4588 − 0.2687 0.2687X M4HOY36 0.5637X 0.237
C3HOO37 0.5397X 0.3666 0.2002 − 0.2002 M4HTY37 0.4453 0.5388
C4HTY38 0.6778 0.0327 − 0.3847 0.3847X M4HOO38 0.6249X − 0.0582C4HOY39 0.8554X − 0.0723 − 0.0997 0.0997 M4HOY39 0.5967 0.5039
C4HTY40 0.6665X 0.0914 − 0.1141 0.1141 M4HOY40 0.6820X 0.3135
C4HOY41 0.2948 0.4112 0.2941X − 0.2941 M3HTO41 0.6845 0.3786
C3HOY42 0.7252X 0.1467 − 0.1374 0.1374 M3HTY42 0.4981 0.4245
C3HOY43 0.7860X 0.2277 − 0.0282 0.0282 M3HTY43 0.7403X 0.3644
C4FOY44 0.5674X 0.3364 − 0.1926 0.1926 M4HOY44 0.6401 0.4403
C4FTY45 0.0408 0.5981X 0.0128 − 0.0128 M4HOO45 0.7884X 0.3142
M4HOO46 0.6395X 0.288
% Expl. var. 40 10 4 4 % Expl. var. 33 14
1844 Energy Efficiency (2018) 11:1825–1846

Open Access This article is distributed under the terms of theCreative Commons Attribution 4.0 International License (http://creativecommons.org/licenses/by/4.0/), which permits unrestrict-ed use, distribution, and reproduction in any medium, providedyou give appropriate credit to the original author(s) and the source,provide a link to the Creative Commons license, and indicate ifchanges were made.
References
Abrahamse, W., & Steg, L. (2009). How do socio-demographicand psychological factors relate to households’ direct andindirect energy use and savings? Journal of EconomicPsychology, 30(5), 711–720. https://doi.org/10.1016/j.joep.2009.05.006
Allcott, H., & Mullainathan, S. (2010). Behavior and energypolicy. Science, 327(5970), 1204–1205. https://doi.org/10.1126/science.1180775
Anderson, R., & Lipsey, M. (1978). Energy conservation andattitudes toward technology. Public Opinion Quarterly,42(1), 17–30. https://doi.org/10.1086/268425
Balarasa, C., Gagliaa, A., Georgopouloub, E., Mirasgedisb, S.,Sarafidisb, Y., & Lalasb, D. (2007). European residentialbuildings and empirical assessment of the Hellenic buildingstock, energy consumption, emissions and potential energysavings. Building and Environment, 42(3), 1298–1314.https://doi.org/10.1016/j.buildenv.2005.11.001
Barry, J., & Proops, J. (1999). Seeking sustainability discourseswith q methodology. Ecological Economics, 28(3), 337–345.https://doi.org/10.1016/S0921-8009(98)00053-6
Becker, L., Seligman, C., Fazio, R., & Darley, J. (1981). Relatingattitudes to residential energy use. Environment andBehavior, 13(5), 590–609. https://doi.org/10.1177/0013916581135004
Brown, S. (1980). Political subjectivity: applications of Q meth-odology in political science. Yale University Press.
Department of Energy and Climate Change. (2012). Housingenergy fact file.
Department of Environment, Food and Rural Affairs. (2007).Public understanding of sustainable energy consumption inthe home.
Department of Environment, Food and Rural Affairs. (2008). Aframework for pro-environmental behaviours.
Dixon, T., & Eames, M. (2013). Scaling up: the challenges ofurban retrofit. Building Research & Information, 41(5), 499–503. https://doi.org/10.1080/09613218.2013.812432
Druckman, A., & Jackson, T. (2008). Household energy consump-tion in the UK: a highly geographically and socio-economically disaggregated model. Energy Policy, 36(8),3177–3192. https://doi.org/10.1016/j.enpol.2008.03.021
Eden, S., Donaldson, A., &Walker, G. (2005). Structuring subjectiv-ities? Using Q methodology in human geography. Area, 37(4),413–422. https://doi.org/10.1111/j.1475-4762.2005.00641.x
Eltham, D., Harrison, G., & Allen, S. (2008). Change in publicattitudes towards a cornish wind farm: Implications for plan-ning. Energy Policy, 36(1), 23–33. https://doi.org/10.1016/j.enpol.2007.09.010
Faiers, A., Cook, M., & Neame, C. (2007). Towards a contempo-rary approach for understanding consumer behaviour in thecontext of domestic energy use. Energy Policy, 35(8), 4381–4390. https://doi.org/10.1016/j.enpol.2007.01.003
Frederiks, E., Stenner, K., & Hobman, E. (2015). Householdenergy use: Applying behavioural economics to understandconsumer decision-making and behaviour. Renewable andSustainable Energy Reviews, 41, 1385–1394. https://doi.org/10.1016/j.rser.2014.09.026
Guefin, D., Yust, B., & Coopet, J. (2000). Occupant predictors ofhousehold energy behavior and consumption change asfound in energy studies since 1975. Family and ConsumerSciences Research Journal, 48–80.
Hass, J., Bagley, G., & Rogers, R. (1975). Coping with the energycrisis: effects of fear appeals upon attitudes toward energyconsumption. Journal of Applied Psychology, 60(6), 754–756. https://doi.org/10.1037/0021-9010.60.6.754
Institution ofMechanical Engineers. (2009). UK 2050 energy planmak-ing our commitment a reality.
Jackson, T. (2004). Motivating sustainable consumption a reviewof evidence on consumer behaviour and behavioural change.Sustainable Development Research Network.
Jaffe, A., & Stavins, R. (1994). The energy-efficiency gap. Whatdoes it mean? Energy Policy, 22(10), 804–810. https://doi.org/10.1016/0301-4215(94)90138-4
Jones, C., & Eiser, J. (2009). Identifying predictors of attitudestowards local onshore wind development with reference to anEnglish case study. Energy Policy, 37(11), 4604–4614.https://doi.org/10.1016/j.enpol.2009.06.015
Kaiser, F., Wolfing, S., & Fuhrer, U. (1999). Environmental atti-tude and ecological behaviour. Journal of EnvironmentalPsychology, 19(1), 1–19. https://doi.org/10.1006/jevp.1998.0107
Kalafatis, S., Pollard, M., East, R., & Tsogas, M. (1999). Greenmarketing and ajzen’s theory of planned behaviour: a cross-market examination. Journal of Consumer Marketing, 16(5),441–460. https://doi.org/10.1108/07363769910289550
Kelly, M. J. (2009). Retroffiting the existing UK building stock.Building Research & Information, 37(2), 196–200.https://doi.org/10.1080/09613210802645924
Kelly,M. (2010). Energy efficiency, resilience to future climates andlong-term sustainability: the role of the built environment.Philosophical Transactions of the Royal Society:Mathematical, Physical and Engineering Sciences,368 (1914), 1083–1089. ht tps: / /doi .org/10.1098/rsta.2009.0212
Krohn, S., & Damborg, S. (1999). On public attitudes towardswind power. Renewable Energy, 16(1-4), 954–960.https://doi.org/10.1016/S0960-1481(98)00339-5
Kubier, P. (2010). Varieties of religious perception: a Q-methodological approach to the study of religious beliefs.Oklahoma: University of Central Oklahoma.
Lior, N. (2010). Sustainable energy development: the present (2009)situation and possible paths to the future. Energy, 35(10),3976–3994. https://doi.org/10.1016/j.energy.2010.03.034
Low Carbon Housing Retrofit. (2012). Transforming homes fromg to a. Manchester: Manchester City Council.
Lutzenhiser, L. (1992). A cultural model of household energyconsumption. Energy, 17(1), 47–60. https://doi.org/10.1016/0360-5442(92)90032-U
Energy Efficiency (2018) 11:1825–1846 1845

Mansouri, I., Newborough, M., & Probert, D. (1996). Energyconsumption in UK households: impact of domestic electri-cal appliances. Applied Energy, 54(3), 211–285. https://doi.org/10.1016/0306-2619(96)00001-3
McKeown, B., & Thomas, D. (1988). Q methodology. SAGEPublications, DOI: https://doi.org/10.4135/9781412985512.
Meijer, F., Itard, L., & Sunikka-Blank, M. (2009). ComparingEuropean residential building stocks: performance, renova-tion and policy opportunities. Building Research &Information, 37(5-6), 533–551. https://doi.org/10.1080/09613210903189376
National Refurbishment Centre. (2012). Refurbishing the nation:gathering the evidence. Watford: BRE.
Office for National Statistics. (2013, March 31). Neighbourhoodstatistics. Retrieved from ONS Neighbourhood Statistics da-tabase: http://www.neighbourhood.statistics.gov.uk/dissemination/
Olsen, M. (1981). Consumers’ attitudes toward energy conserva-tion. Journal of Social Issues, 37(2), 108–131. https://doi.org/10.1111/j.1540-4560.1981.tb02628.x
Owens, S., & Driffill, L. (2008). How to change attitudes andbehaviours in the context of energy. Energy Policy, 36(12),4412–4418. https://doi.org/10.1016/j.enpol.2008.09.031
Pelenur, M. (2013). Retrofitting the domestic built environment:investigating household perspectives towards energy effi-ciency technologies and behaviour. In University ofCambridge, Department of Engineering. Cambridge:University of Cambridge.
Pelenur, M., & Cruickshank, H. (2011). The subjective view ofenergy in the urban built environment: what are the socialfactors that affect our interaction with energy? Proceedings ofthe 6th UNESCO Dubrovnik conference on sustainable de-velopment of energy, water and environment systems.Dubrovnik: University of Dubrovnik.
Pelenur, M., & Cruickshank, H. (2012). Closing the energy effi-ciency gap: a study linking demographics with barriers toadopting energy efficiency measures in the home. Energy,47(1), 348–357. https://doi.org/10.1016/j.energy.2012.09.058
Pelenur, M., & Cruickshank, H. (2014). Motivations to adoptingenergy efficiency measures in the home. Proceedings of theICE - Energy.
RETROFIT 2050. (2012). Re-engineering the city 2020–2050 |urban foresight and transition management. Retrieved fromhttp://www.retrofit2050.org.uk
Ritche, J., McDougall, G., & Claxton, J. (1981). Complexities ofhousehold energy consumption and conservation. Journal ofConsumer Research, 8(3), 233–242. https://doi.org/10.1086/208860
Samuelson, C., & Biek, M. (1991). Attitudes toward energy con-servation: a confirmatory factor analysis. Journal of AppliedSocial Psychology, 21(7), 549–568. https://doi.org/10.1111/j.1559-1816.1991.tb00536.x
Shove, E., Lutzenhiser, L., Guy, S. H., & Wilhite, H. (1998).Energy and social systems. Human choice and climatechange, 291–325.
Smith, J., Harre, R., & Langenhove, L. (1995). Rethinkingmethods in psychology. SAGE.
Stafford, A., Gorse, C., & Shao, L. (2012). The retrofit challenge:delivering low carbon buildings.
Stephenson, J., Barton, B., Carrington, G., Gnoth, D., Lawson, R.,& Thorsnes, P. (2010). Energy cultures: a framework forunderstanding energy behaviours. Energy Policy, 38(10),6120–6129. https://doi.org/10.1016/j.enpol.2010.05.069
Swan, L., & Ugursal, V. (2009). Modeling of end-use energyconsumption in the residential sector: a review of modelingtechniques. Renewable and Sustainable Energy Reviews,13(8), 1819–1835. https://doi.org/10.1016/j.rser.2008.09.033
Thomas, D., & Baas, L. (1996). The postelection campaign:competing constructions of the Clinton victory in 1992. TheJournals of Politics, 58(2), 309–331. https://doi.org/10.2307/2960228
Thomas, D., Ribich, F., & Frieie, J. (1982). The relationshipbetween psychological identification with instructors andstudent ratings of college courses. Instructional Science,11(2), 139–154. https://doi.org/10.1007/BF00154884
Thomas, D., McCoy, C., & McBridge, A. (1993). Deconstructingthe political spectacle: sex, race, and subjectivity in publicresponse to the Clarence Thomas/Anita Hill Bsexualharassment^ hearings. American Journal of PoliticalScience, 37(3), 699–720. https://doi.org/10.2307/2111571
Tversky, A., & Kahneman, D. (1991). Loss aversion in risklesschoice: a reference-dependent model. The Quarterly Journalof Economics, 106(4), 1039–1061. https://doi.org/10.2307/2937956
Upham, P., Whitmarsh, L., Poortinga, W., Purdam, K., Darnton,A., McLachlan, C., & Devine-Wright, P. (2009). Publicattitudes to environmental change: a selective review oftheory and practice. London: Research Councils UK.
Visschers, V., & Siegrist, M. (2013). How a nuclear power plantaccident influences acceptance of nuclear power: results of alongitudinal study before and after the Fukushima disaster.Risk Analysis, 33(2), 333–347. https://doi.org/10.1111/j.1539-6924.2012.01861.x
Watts, S., & Stenner, P. (2012).DoingQmethodological research:theory. Method and Interpretation: Sage Publications Ltd.
Weber, L. (1997). Some reflections on barriers to the efficient useof energy. Energy Policy, 25(10), 833–835. https://doi.org/10.1016/S0301-4215(97)00084-0
Wilson, C., &Dowlatabadi, H. (2007).Models of decisionmakingand residential energy use. Annual Review of Environmentand Resources, 32(1), 169–203. https://doi.org/10.1146/annurev.energy.32.053006.141137
Yin, R. (2009).Case study research: design andmethods. London:SAGE Publications.
Zhang, T., Siebers, P., & Aickelin, U. (2012). A three-dimensionalmodel of residential energy consumer archetypes for localenergy policy design in the UK. Energy Policy, 47, 102–110.https://doi.org/10.1016/j.enpol.2012.04.027
1846 Energy Efficiency (2018) 11:1825–1846