household education spending - unesdoc databaseunesdoc.unesco.org/images/0022/002264/226463e.pdf ·...
TRANSCRIPT

1Household Education Spending / Methodological Guidelines
Methodological Guidelines
Household EducationSpending
Approach and estimation techniques using household surveys

3Household Education Spending / Methodological Guidelines
International Institutefor Educational Planning
Household Education SpendingApproach and estimation techniques
using household surveys
Beïfith Kouak TiyabJean-Claude Ndabananiye
Methodological Guidelines IIEP Pôle de DakarUNESCOSeptember 2013
Methodological Guidelines

4 Household Education Spending / Methodological Guidelines
International Institute for Educational Planning The International Institute for Educational Planning (IIEP) was established in 1963. It supports Member States in planning and managing their educational systems to help them achieve national goals and development objectives agreed to at the international level. IIEP develops sustainable educational capacities, research, technical assistance, networking and information sharing.
The Pôle de DakarThe Education Sector Analysis Division of the Pôle de Dakar is an expert platform attached to UNESCO-IIEP. The Pole de Dakar has been operating since 2001, supporting countries and technical and financial partners in educational system analysis, strategy development and education sector policy monitoring.
Published in 2013 by :
IIEP – Pôle de Dakar12 avenue Léopold Sédar Senghor Dakar SenegalTel: (+221) 33 849 59 79Fax: (+221) 33 821 35 25Web: www.poledakar.org
Credit :
“Beïfith Kouak Tiyab and Jean-Claude Ndabananiye, Household education spending, Approach and estimation techniques using household surveys, Methodological Guidelines, IIEP - Pôle de Dakar, UNESCO, 2013”
ISBN : 978-92-803-1372-7
Graphic design: La Rochette Comptoir Graphique +221 33 889 73 73Photo credits: Projet éducation et renforcement institutionnel au Togo (PERI)Printing: La Rochette Dakar +221 33 839 8282Translation French > English: Adjoa des Bordes
You are free to Share - to copy, distribute and transmit the work.Under the following conditions:• Attribution - You must attribute the work in the manner specified by the author or licensor (but not in any way that suggests that they endorse you or your use of the work). • Noncommercial - You may not use this work for commercial purposes. • No Derivative Works - You may not alter, transform, or build upon this work.
The names used in this publication and the presentation of data shown do not engage or necessarily represent the opinions of UNESCO or IIEP, nor the expres-sion of any opinion whatsoever as to the legal status of the country, city or area or of its authorities, or concerning its frontiers or boundaries. The ideas and opinions expressed in this publication are those of the authors and do not necessarily reflect the view points of of UNESCO or IIEP.

5Household Education Spending / Methodological Guidelines
FOREWORD
1. DEFINITION AND CONCEPTUAL FRAMEWORK
2. DATA SOURCES: BUDGET CONSUMPTION HOUSEHOLD SURVEYS2.1. Surveys specially dedicated to estimating household
education expenditure2.2. Multi-purpose household surveys: CWIQ and IHLCA
3. ESTIMATION TECHNIQUES 3.1. Case where education expenses may be tracked by
enrolled child and by level of education 3.2. Case where education expenses are grouped by all enrolled
children in a household3.2.1. Average-based estimation techniques
3.2.2. Estimation by econometric modeling 3.3. Applications
3.3.1. General principles for processing household survey data for estimating educational expenses
3.3.2. Illustration of the method for estimating household education expenditure: CWIQ household survey, Burkina Faso, 2007
ANNEX: TYPICAL TABLES FOR PRESENTING ESTIMATION FINDINGS
REFERENCES
7
9
1314
14
1516
18
1819
2323
25
28
30
The authors wish to thank Mathieu Brossard, Borel Foko, Jean-Pierre Jarousse and Francis Ndem, who, from 2008, contributed immensely to initial discussions with the Pôle de Dakar on the theme of household expenditure. They also wish to thank the entire team of Pôle de Dakar for all the contributions made toward the completion of this study.
Acknowledgements
Contents

6 Household Education Spending / Methodological Guidelines
List of tables
Table 1.1. : Classification of household education and non-education expenditure
Table 1.2. : Categorization of household education expenses into major expenditure items in 12 African countries
Table 3.1. : Household survey with education expenses disaggregated by child and by level of education
Table 3.2. : Structure of household database with aggregated education expenditure for all enrolled children in household Table 3.3.1 : Extract of a working database for estimating household education expenditure, CWIQ 2007 Burkina Faso
Table 3.3.2. : Linear regression, without constant, of total education expenditure on the number of enrolled children at various levels of education
ANNEX : TYPICAL TABLES FOR PRESENTING ESTIMATION FINDINGS
Table A.1. : Estimated household expenditure per child and according to level of education and type of school attended, year
Table A.2. : Structure of household education expenditure per child and according to level of education and type of school attended, year
Table A.3. : Total household expenditure according to level of education and determination of proportion of national expenditure borne by households
10
12
16
18
26
26
28
28
28
29
Acronyms and abbreviationsParent Teacher Associations Household Survey (Madagascar)Integrated Household Living Conditions AssessmentLight Integrated Household Survey (Mali)Household Living Standard Survey (Côte d’Ivoire)Baseline Survey on Illiteracy in Mauritania Household Budget Survey (Tanzania)International Institute for Educational PlanningMultiple Indicator Cluster SurveyUnited Nations Development Programme Core Welfare Indicators QuestionnaireSierra Leone Integrated Household SurveyUnited Nations Education, Science and Cultural Organization
PTAEAMIHLCAELIMENVMERAMHBSIIEPMICSUNDPCWIQSLIHSUNESCO

7Household Education Spending / Methodological Guidelines
ForewordEducational cost and financing analysis is a major component of education system sectoral diagnosis. It helps to assess a country’s capacity to finance expansion of its educational coverage as well as examine aspects pertaining to efficiency and equity in allocating resources mobilized for the sector. It also helps in assessing cost sharing mechanisms between public and private stakeholders, such as families.
Given the lack of statistics on expenses incurred by households on their children’s education, review of education financing is often limited to that of public expenditure, making it difficult to have objective discussions on private education financing. In the current context, where the capacity of African States to finance expansion of their education system is increasingly being called into question (Mingat et al., 2010), raising private education financing appears to be unavoidable. It is thus important to be able to have statistics so as to assess the size and nature of the contribution of households to education in various national contexts.
Based on these observations, the Pôle de Dakar, as part of its statistical and analytical production activities, has developed a method for assessing household education spending, per child and per level of education, based on household surveys. This method proves particulary useful when education expenditure for households is not disaggregated for each enrolled child. Thus, the main goal of this note is to document this methodological and technical approach.
This work initially stemmed from the need for estimates on the size and composition of household education spending in African countries. The desire to fill the methodological gap prevailing at the international level in terms of data collection on private spending was secondary. Indeed, up until now, there has not been a harmonized method at the national, regional or international level on what should be considered as household education expenditure. Also, this paper does not intend to be analytical, as a previous publication by the Pôle de Dakar had been devoted to this aspect (Household Educational Spending: An Analytical and Comparative Perspective for 15 African Countries, Pôle de Dakar, 2012). Several illustrative examples used in this guide have been taken from that publication.

8 Household Education Spending / Methodological Guidelines
The paper is organized in three parts:
1. The first part covers the conceptual framework of the notion of household education spending as, given the lack of harmonized data collection tools and methods,
estimating education expenditure implies that a framework based on a comparative and categorical definition of various expenditure items should be agreed and considered as “education expenditure”. While some items, such as school fees and supplies, may be directly attributed to attendance, this is not so for other expenditures, such as expenses on food and clothing, that are too detached to be considered as “education spending.” The aim here is to review the main household expenditures and agree on a list that could be considered as educational. This phase is crucial for a comparative perspective, where assessment of household spending is not necessarily the same from country to country or one type of survey to another.
2. The second part provides a brief review of various types of household surveys on estimation of education spending. First, there is the rare, yet ideal, model of dedicated household
surveys, which is specially designed for estimating household spending; and secondly, other types of surveys that often require the use of econometric tools for estimating the average cost per enrolled child for every household and for various levels of schooling.
3. The third and major part of this note provides the method developed to estimate education spending per child and for every level of education. We will see that it varies according
to data available and their level of detail in identifying the various expenditure items.
9Household Education Spending / Methodological Guidelines
1. Definition & conceptual frameworkGenerally speaking, “household education spending” denotes all the expenses incurred by a household1 for the education of one or more of its members. While this definition may appear simplistic, the expenses for children’s schooling often have to do with aspects directly related to enrolment, however there are often other various expenditures that might not have a clear relationship to education. Outlining the expenditure items to be taken into account is a preliminary step to analyzing household education spending. That is the objective of this first section.
According to the definition of the UNESCO Institute of Statistics2 (UIS) guide, household education expenses are: (a) direct payments by pupils/students and households to schools; (b) payments by pupils/students and households for direct purchases of personal items used in schools; and (c) what households spend on pupil/student living expenses. Public payments or transfers to pupils/students and households in the form of scholarships, subsidies or study loans should be deducted from total private expenditure, as this financial aid is already accounted for as public education expenditure.
Two main criteria can be used to define private education expenditure, namely its direct link with schooling and its mandatory nature. Consequently, expenditure directly caused by school attendance and paid by the household, either to the school attended (school fees, some textbooks, school canteen, accomodation etc.) or outside the school (uniforms, school supplies, transportation, etc.) can all be considered as education expenditure.
Based on that, we may identify three major categories of expenditure:
- School fees and other expenses: This category is comprised of registration fees, school fees, parent-teacher association (PTA) contributions and other related expenses, including examination fees and documentation and insurance fees;
1A household is generaly defined as a person or group of persons who live in the same home, under the authority of a head. A household is not necessarily the equivalent of a family, as non-family members can live in the home.2 UOE/EUROSTAT/ data collection on education systems: Concepts, definitions and classifications. Volume 2: http://www.uis.unesco.org/Library/Documents/uoe-data-collection-education-systems-v2-en.pdf

10 Household Education Spending / Methodological Guidelines
- Purchase of uniforms, manuals and school supplies: These are expenses incurred for uniforms and sportswear, exercise books, other books, textbooks and other mandatory school supplies;
- Other expenses for ancillary services: These include expenses for accomodation, meals and transportation to school. These are mainly provided alongside school services. For secondary and tertiary education, these services can account for large expenses for boarding students.
Based on these criteria, Table 1.1 below proposes a conceptual classification for categorizing expenditure items. However, this is not a set outline, as its use will depend on: (a) how detailed are expenditure items proposed by various surveys; and (b) ensuring alignment for a comparative perspective.
Household education expenditure
(directly pertaining to school attendance)
School expensesUniforms, school equipment
and supplies Other related expenses
• Registration fees • PTA contributions • Examination fees • Documentation fees • Other registration-related fees
• Uniforms and mandatory sports equipment
• Textbooks (mandatory) • Exercise books and other school
supplies
• Boarding fees• Canteen and cafeteria
fees• Transportation
Expenses not directly related to school
enrolment
• Additional non-mandatory textbooks• Non-school books • Newspapers, journals• Computer equipment • Educational games
• Pocket money • Leisure and
extracurricular activities • Private classes and home
support/home teacher costs
Source: Pôle de Dakar.Note : Table compiled from the “educational expenses” section of various household surveys.
Table 1.1. : Classification of household education and non-education expenditure
11Household Education Spending / Methodological Guidelines
While the some of the above expenditure categories may be directly related to education, other costs that have been incurred are difficult to consider as educational, as they are not necessary caused by school attendance. This is true for textbooks, computer equipment, costs for extracurricular activities or after school classes.
On the other hand, categorizing expenses proposed earlier is justified from a comparative, time and space perspective. Not all surveyed countries consider household education expenditure in the same way. In this case, variables as comparable as possible should be generated to ensure homogeneity. Table 1.2 below shows categorization by a recent analytical and comparative study conducted by the Pôle de Dakar. It shows great variability in the content of expenditure by major groups.

12 Household Education Spending / Methodological Guidelines
Table 1.2. : Categorization of household education expenses into major expenditure items in 12 African countries
Country School expenses Equipmentand supplies
Ancillary and other related expenses
Benin (Household survey with questionnaire on basic welfare indicators, CWIQ 2003)
School fees; (h1a) contributions and construction (h1e).
Books and supplies (h1b); School uniforms (h1c).
Transport costs (h1d) ; Other expenses (h1f).
Burkina Faso (CWIQ 2003)
School fees (J11/J21); parent contributions (J15/J25); Other school contributions (J16/J26).
Books and supplies (J12/J22); school uniforms (J13/J23). Transport costs (J14/J24).
Côte d’Ivoire (Household living standard survey, ENVM 2002)
Registration fees (Q63); Other registration fees (Q64) ; School
fees (Q65); PTA Contribution (Q72); Other expenses (Q74).
Textbooks (Q66) ; Uniforms and sportswear (Q68); Other
school supplies (Q67).
Transport (Q69) ; Food, canteen, etc. (Q70) ; Home
teacher (Q73).
Gabon (Gabon poverty assessment and monitoring survey, 2005)
School fees (nursery, primary, secondary (general), secondary (technical), tertiary education) –
see QRD, page 19, section M
Textbooks; uniforms; exercise books; school bags; raincoats;
printer paper; folders and sheets; other supplies – see
QRD, page 19, section M.
Home teacher costs QRD, page 19, section M.
Madagascar (Household survey, EAM 2001)
School fees (Q27) ; FRAM contributions (Q28a), Assurance-PASCOMA (Q28b); School fees;
other expenses
School uniforms; (Q30) sportswear (Q31), Books
(Q32) ; school supplies (Q33).
Transport to school (Q34); Food (Q35); Allowance (Q36).
Mali (Integrated light household survey, ELIM 2006)
School fees (nursery, primary, secondary (general), secondary (technical), tertiary education) - see QRD, page 26, section M
Textbooks; school uniforms; other supplies – see QRD,
page 26, section M.
Home teacher costs - see QRD, page 26, section M.
Mauritania (Baseline survey on illiteracy inMauritania, ERAM 2008)
School fees (J1-1.1; PTA contributions (J1-1.3).
Textbooks and supplies (J1-1.2).
Other unspecified school contributions (J1-1.4).
Niger (Niger living standards survey, 2005)
School fees; PTA contribution; kickback costs; building contribu-
tion; other expenses
Textbooks and supplies; school uniforms School transport.
Malawi(Integrated Household Survey, 2004)
School fees (C30A) ; management fees (C30D); building and
maintenance contribution; (C30E); PTA contribution (C30F).
School uniforms (C30C) ; Equipment and furniture
(C30B).
Other education expenditure (C30G).
Rwanda (Integrated survey on living conditions, EICM 2005)
Registration and fees (S2AQ10A); parent contributions (S2AQ10B);
Other school expenses (S2AQ10G).
Uniforms and other sportswear (S2AQ10C); Text
books and other supplies (S2AQ10D).
School transport (S2AQ10E); School canteen and
allowance
Sierra Leone(Sierra Leone Integrated Household Survey SLIHS 2003)
School fees (s2aq6) ; CTA costs (s2aq7) ; extra-curricular fees
(s2aq12); other costs (s2aq13).
Uniforms (s2aq9) ; books (s2aq9).
Transport (s2aq10) ; Food (s2aq11).
Tanzania (Household Budget Survey, HBS 2007)
School fees; Other expenses, PTA expenses
Textbooks and school sup-plies, uniforms and bags.
Home teacher costs; food; canteen
Notes : Names of variables as reported in country questionnnaires are in brackets. Source: Processing of questionnaires and household survey data.

13Household Education Spending / Methodological Guidelines
2. 2. Data sources: Budget and consumption household surveys Estimating household education expenditure often entails mobilizing data from “budget consumption” surveys, which require surveyed households to estimate expenses incurred over a given period for various items, including those for education of household members. Most of these surveys also have information on the enrolment status (level of education, current class, type of school, etc.) and on the socioeconomic and demographic characteristics of household members (location, wealth, etc.). It is thus possible to intersect the various types of information to estimate the expenditure per enrolled child by level of education as well as other relevant dimensions.
Household survey use is quite often the sole alternative3 where it is possible to mobilize data on household expenditure on education, from one single source, accured both within and outside of schools. However, these household surveys are not always equivalent in terms of their designs, items covered, etc. Their degree of capturing education expenses differs, as do the initial objectives targeted, or techniques of survey and sampling used. This part gives a brief overview of the various types of surveys available in African countries. It highlights their characteristics, as well as advantages and disadvantages.
3 There i s ano the r poss ib i l i t y tha t can he lp t o es t ima te househo ld educa t i on expend i tu re by mob i l i z i ng f i nanc ia l i n fo rma t i on a t schoo l - l eve l , name ly payments rece i ved f rom househo lds . However, t h i s sou rce on l y documents a re l a t i ve l y l im i ted po r t i on o f educa t i ona l expenses , as th i s approach does no t t r ack o the r expenses such as un i f o rms , t ex tbooks and t ranspor t cos ts , i ncu r red by fami l i es ou ts ide schoo l s , a l t hough they may be s ign i f i can t . Fu r the rmore , th i s approach p resumes tha t schoo l s keep regu la r accoun ts and a re ready to sha re them, wh ich may o r may no t be the case .

14 Household Education Spending / Methodological Guidelines
2.1. Surveys especially dedicated to estimating household education expenditure“Dedicated” surveys are designed to estimate household educational expenses. In this case, the data collection tools and method used (questionnaire, sampling procedure, main expenditure items to be considered, period of observation, etc.) are specially prepared to evaluate household education expenditure as precisely as possible. However, this type of survey is rather rare in African countries.
In the absence of this type of survey, it is also possible to have valid estimates of education expenditure by mobilizing data collected by other types of household surveys.
2.2. Multi-purpose household surveys
Multi-purpose household surveys collect data on several aspects, such as access to basic social services, household assets, food, education, incomes and household expenditure. Household expenditure for education usually goes alongside other items, such as nutrition, healthcare and housing.
The main advantage of these types of surveys is that they are more accessible in most countries in the region, as they are regularly conducted to monitor progress of the Millenium Development Goals and progress made by national poverty reduction programmes. We are presenting here, two major4 multi-purpose household surveys often used in sub-Saharan Africa - the Core Welfare Indicators Questionnaire and the Integrated Household Living Conditions Assessment.
4 T h e s u r v e y s m e n t i o n e d a b o v e a r e n o t t h e o n l y h o u s e h o l d s u r v e y s w i t h d a t a o n e d u c a t i o n e x p e n d i t u r e . S o m e t i m e s , o t h e r s u r v e y s s u c h a s M I C S a n d D H S , w h i c h b a s i c a l l y h a v e t o d o w i t h g a t h e r i n g o f s o c i o - h e a l t h s t a t i s t i c s , c o n t a i n a s p e c i a l s e c t i o n o n e d u c a t i o n e x p e n d i t u r e .

15Household Education Spending / Methodological Guidelines
CWIQ and IHLCA surveys5
Developed mainly by the World Bank and UNDP, the CWIQ and IHLCA surveys were designed to provide statistics for monitoring progress made by national poverty reduction programmes. CWIQ is used for collecting rapid and occasional data on the well-being of households (health, education, etc.) as well as indicators on access and use of basic public services. IHLCA is a more broad-ranging and long term study (about five years). It measures and analyses poverty trends in a given country by collecting information on the possession of assets, incomes and household expenditure, health, education, employment, agriculture, housing and access to social programmes.
Many sub-Saharan African countries now have several series of CWIQ or IHLCA surveys, allowing for interesting comparative studies.
IHLCA is typically comprised of three types of questionnaires: the questionnaire to collect information on members of the household, a community questionnaire to collect information on local conditions common to households in the same region and a questionnaire on prices for adjustments in countries where prices vary regionally. IHLCA surveys are often carried out in the course of a whole year to correct issues related to seasonal variations.
3. Estimation techniques The aim of this section is to give a more detailed description of statistical methods and techniques proposed for estimating education expenditure per child and by level of education.
Estimating household education expenditure based on IHLCA or CWIQ surveys can be challenging. This is due to the methodological differences in assessing household expenditure (see Part 1 on the preliminary phase of categorizing expenditure items); and also the fact that the information collected may be (a) disaggregated by each enrolled child in the household or (b) grouped for all enrolled children in a household.
In the first case, calculation of average expenditure per child and by level of education is relatively easy. For a given level of education, the expenditure for individuals enrolled at that level is calculated and divided by the number of students at that level, appropriately taking into account the weights. This approach is presented in subsection 3.1 below.
5 F o r m o r e i n f o r m a t i o n o n Q U I B B s u r v e y s e e http://go.worldbank.org/66ELZUGJ30, and http://go.worldbank.org/UK1ETMHBN0 for IHLCA survey.

16 Household Education Spending / Methodological Guidelines
In the second case, where information per child and per level is not available, it is possible, using econometric modeling, to split the total expenditure of the household into average unit expenditure per child for each level of education,. This approach shall be explained further in Subsection 3.2. This will be backed by illustrative examples of the
stages to be followed for implementing the econometric technique.
3.1. Case where education expenses may be tracked by enrolled child and by level of education
It is assumed here that preliminary work has been done by merging information on education expenditure with that of school attendance and other relevant characteristics. This will lead to a structure similar to the one below :
Table 3.1. : Household survey with education expenses disaggregated by child and by level of education
Hous
ehol
d id
entifi
catio
n co
de
Enro
lled
child
iden
tifica
tion
code
Leve
l of e
duca
tion
Tota
l edu
catio
n ex
pend
iture
Scho
ol e
xpen
ses
Unifo
rms
Equi
pmen
t and
sup
plie
s
Othe
r exp
ense
s (tr
ansp
ort,
cant
een
etc.
)
Type
of s
choo
l atte
nded
(Pub
lic/P
rivat
e)
Soci
oeco
nom
ic v
aria
bles
:in
com
e, e
nviro
nmen
t, ge
nder
Wei
ghtin
gs
M001 M001_E01 Primary M001 M001_E02 Primary M001 M001_E03 Secondary 1 M002 M002_E01 Primary M003 M002_E02 Secondary 2 M003 M003_E01 Primary
Source : Authors.

17Household Education Spending / Methodological Guidelines
In this configuration, education expenses are distinctly separated per enrolled child. For instance, the household with code M001 is responsible for three enrolled children, with two in primary and one in lower secondary.
In this case, it is easy to determine the average expenditure per child and by level of education by dividing the total amount of education expenses for each level of education by the total number of children enrolled at that level. Formally, this works out as follows:
Average expenditure per enrolled child at level of education k is equal to: (E3.1)
Where :
•k is the level of education considered (with k being either pre-school, primary, lower secondary, upper secondary, technical and vocational or tertiary education); • i is the identification code for the enrolled individual at a given k level; •EEik is the total education expenditure incurred on the individual i at level of education k; •Nik is equal to 1 when individual i is enrolled at education level k.
Important : Calculation of the average expenditure should naturally take the various parametres of the sampling procedure (such as the weights, etc.) into consideration (see section 3.3 for more details).
This average statistic can then be distributed according to the type of school attended (public, private, mission, etc.), the gender, level of household wealth (income quintiles Q1, Q2, etc.), the area of residence (rural/urban) or all other characteristics relevant to the study. Likewise, it is possible to calculate average expenses per expenditure item; namely school fees, supplies, uniforms, etc.
However, not all surveys from which household education expenditure data is mobilized allow for identifying the expenses made for each enrolled child. This is the case in most African countries.

18 Household Education Spending / Methodological Guidelines
3.2. Case where education expenses are grouped by all enrolled children in a household In most cases, only the total expenditure incurred per household for different items is declared, as shown in table 3.2 below:
Table 3.2. : Structure of household database with aggregated education expenditure for all enrolled children in household
Hous
ehol
d ID
Tota
l edu
catio
n ex
pend
iture
No. o
f enr
olle
d ch
ildre
n pe
r lev
el o
f ed
ucat
ion
Scho
ol fe
es
Unifo
rms
Equi
pmen
t and
su
pplie
s
Othe
r exp
endi
ture
: tr
ansp
ort,
cant
een
etc.
Type
of s
choo
l at
tend
ed:
Publ
ic/P
rivat
e
Soci
oeco
nom
ic v
aria
bles
: inc
ome
quin
tile,
set
ting,
ge
nder
Wei
ghts
M001 M002 M003 M004 M005
Source : Authors.
In the case above, which is the most frequent in the surveys available, one can not directly see how much a household with more than one enrolled child at various levels of education spends on average per child and per level of education. Several approaches may be envisaged to estimate such information.
3.2.1. Estimation Techniques Based on the MeanA first approach may be to divide the total education expenditure by the number of children enrolled, irrespective of their level of education. This approach helps to have the average expenditure per student, irrespective of level. However, it does not make for disaggregating the average expenditure per level of education, depending on the status of the schools. It is obvious that education expenditure is not the same in primary, secondary, technical vocational and tertiary institutions. This approach may not be the most appropriate.

19Household Education Spending / Methodological Guidelines
Furthermore, education expenses are not the same, depending on the type of school attended (public, private, faith-based, etc.); making this approach unsuitable.
A second approach entails considering sub-samples of households responsible for only enrolled children at a given educational level, and comparing the total expenditure with number of enrolled children at the same level. While this approach seems less refutable than the first one, it has a major methodological disadvantage of restricting the estimates on small sub-samples. This impacts the precision of the estimated statistics due to possible selection bias.
All in all, dividing the total education expenditure by the number of children or restricting the estimates to small sub-samples is unsatisfactory, making it necessary to use the approach based on econometric modeling, which is presented in the following section.
3.2.2. Estimation by econometric modeling
• Theoretical and formal aspectsThis approach is based on the accounting identity6, where total education expenditure incurred by a household is equal to the sum of expenditures incurred by level of education.
Considering an educational system with n levels of school, i.e., preschool, primary, lower general secondary, upper general secondary, technical and vocational training and tertiary education, this “accounting” relation may be calculated as follows:
(E3.2.1)
6 I n g e n e r a l , a n a c c o u n t i n g i d e n t i t y i s d e f i n e d a s a n e q u a l i t y, w h i c h c a n b e c h e c k e d a m o n g s e v e r a l s e r i e s o f d a t a o b s e r v e d . I n o u r c a s e , t h e a c c o u n t i n g i d e n t i t y d e s c r i b e d i n e q u a t i o n s E 3 . 2 . 1 , E 3 . 2 . 2 a n d E 3 . 2 . 3 r e p r e s e n t n o m o r e t h a n t h e c h o i c e t o d i s a g g r e g a t e t h e d a t a o b s e r v e d f o r t h e t o t a l e x p e n d i t u r e o f a h o u s e h o l d p e r e n r o l l e d c h i l d . I t i s n e i t h e r a n e x p l a n a t o r y m o d e l n o r a p r e d i c t i v e o n e . I n d e e d , n o c a u s a l i n t e r p r e t a t i o n c a n b e g i v e n t o a n a c c o u n t i n g i d e n t i t y ( s e e S p a n o s , A . 1 9 8 3 ) .
Where for a given household i, EEi the total education expenditure, EEik the total education expenditure incurred for k, k level of education from preschool to tertiary education.

20 Household Education Spending / Methodological Guidelines
This “accounting” relation can then be estimated using a linear regression model with no constant7. The linear model to be estimated can be expressed as follows:
With :•EEi total household i education expenditure; •Nik number of children enrolled at given level of education k (k varying from 1 to n) within household i;•ε the error term of the mean zero and σ2 variance;•CUk coefficients for estimation. They represent the mean education expenditure per child per level of education k.
Important : Calculation of the average expenditure by econometric regression should naturally take the parametres of the sampling procedure into consideration (for more details see section 3.3).
To assess the extent of variability of the unit expenditure, the econometric regression may be reproduced according to dimensions such as the type of school (public/private), the gender or socioeconomic characteristics of the household (income quintiles, schooling of parents, etc.) or the area of residence (rural/urban), by introducing indicator or dummy variables that correspond to these dimensions.
7 By definition, a household with no enrolled child will have no education expenditure. Therefore the linear model should be estimated without a constant.
There is then the assumption that in the household i, for a given level of education k, the total expenditure incurred for this level corresponds to the average per child, multiplied by the total number of children of the household enrolled at that level.
(E3.2.3)
(E3.2.2)
With Nik the number of children of household i enrolled at a level of education k, k varying from 1 to n, and the mean expenditure by child at a level of education k.

21Household Education Spending / Methodological Guidelines
8 For most general surveys, the idea of having estimates on several areas (health, education, housing, etc.) makes it difficult to optimize the sample, with some sub-samples being under-represented; this can have adverse impacts on the quality of estimates.
• Unit cost coefficient and coherence validity tests
Coefficients previously estimated by the regression model must pass through the usual statistical tests in order to check their statistical validity and robustness. For more information on post estimation tests, the reader should seek further documentation.
Econometric regression must also assure an internal consistency of estimations as, for a given level of education, the average expenditure estimated for each enrolled child should be between the estimated average expenditure in public schools and that for private schools. Box E1 below provides details on that.
It is also important to pay attention to the under-representation of certain sub-samples (for instance, a given level of education8). Once the estimates have been verified and validated, it would be useful to consolidate the information in tables or graphs in order to analyse them. Annex A.1 proposes some typical tables to present the results of the estimates.
22 Household Education Spending / Methodological Guidelines
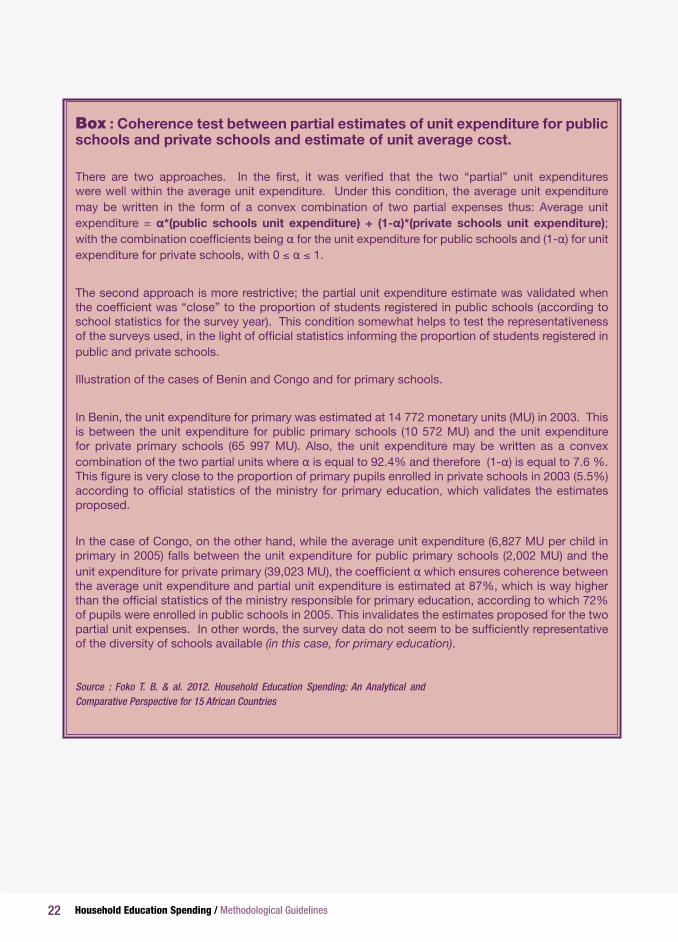
Box : Coherence test between partial estimates of unit expenditure for public schools and private schools and estimate of unit average cost.
There are two approaches. In the first, it was verified that the two “partial” unit expenditures were well within the average unit expenditure. Under this condition, the average unit expenditure may be written in the form of a convex combination of two partial expenses thus: Average unit expenditure = α*(public schools unit expenditure) + (1-α)*(private schools unit expenditure); with the combination coefficients being α for the unit expenditure for public schools and (1-α) for unit expenditure for private schools, with 0 ≤ α ≤ 1.
The second approach is more restrictive; the partial unit expenditure estimate was validated when the coefficient was “close” to the proportion of students registered in public schools (according to school statistics for the survey year). This condition somewhat helps to test the representativeness of the surveys used, in the light of official statistics informing the proportion of students registered in public and private schools.
Illustration of the cases of Benin and Congo and for primary schools.
In Benin, the unit expenditure for primary was estimated at 14 772 monetary units (MU) in 2003. This is between the unit expenditure for public primary schools (10 572 MU) and the unit expenditure for private primary schools (65 997 MU). Also, the unit expenditure may be written as a convex combination of the two partial units where α is equal to 92.4% and therefore (1-α) is equal to 7.6 %. This figure is very close to the proportion of primary pupils enrolled in private schools in 2003 (5.5%) according to official statistics of the ministry for primary education, which validates the estimates proposed.
In the case of Congo, on the other hand, while the average unit expenditure (6,827 MU per child in primary in 2005) falls between the unit expenditure for public primary schools (2,002 MU) and the unit expenditure for private primary (39,023 MU), the coefficient α which ensures coherence between the average unit expenditure and partial unit expenditure is estimated at 87%, which is way higher than the official statistics of the ministry responsible for primary education, according to which 72% of pupils were enrolled in public schools in 2005. This invalidates the estimates proposed for the two partial unit expenses. In other words, the survey data do not seem to be sufficiently representative of the diversity of schools available (in this case, for primary education).
Source : Foko T. B. & al. 2012. Household Education Spending: An Analytical and Comparative Perspective for 15 African Countries
23Household Education Spending / Methodological Guidelines
3.3. ApplicationsThe following example gives a step-by-step account of the econometric estimation technique, based on Burkina Faso’s CWIQ survey (2007). Before delving into estimations, it is important to present a few steps to take prior to preparing the survey data. It does not entail providing an exhaustive list of guidelines for manipulating household survey data but rather underlining some of the key elements to be taken into consideration when preparing a database from household surveys.
3.3.1. General principles for processing household survey data for estimating educational expenses
1Level of database disaggregation, particularly the section on education expenses: Firstly, it is important to know if the education expenses are informed by child enrolled or the total number of
children enrolled in a given household. This determines the method for estimating average expenditure.
2Content of database: Secondly, it is essential to be aware of the content of the database, the size of the sample, its structure, the various sections or modules available, the nature of its variables,
data collection objectives, sampling procedure, etc. These elements tend to be very useful for future work on data processing and analysis. In most cases, this information is available either in the database itself or from documentation accompanying the database; for instance, the questionnaire, the report (final or preliminary), the coding manual and other metadata.
3Variable coding: Finally, before starting to use the variables, it is important to know the way in which they are coded; for example, for binary variables, knowing if 1 represents the man
or the woman, the rural or urban area and the public or private school. This is also true for category variables (such as income quintiles). This information can be found in the questionnaires or database.

24 Household Education Spending / Methodological Guidelines
4Processing of no response and missing data: Statistical challenges caused by lack of responses and missing data must be dealt with properly. Several approaches may be used
for this. The two main ones are reweighting or imputation. To learn more about processing of no response and missing data, see specific documentation on this issue, such as Haziza et al. (2003).
5 Taking sampling procedure into account: What is the sampling design (clusters, stratification, two stage sampling, etc.)? If weights are assigned to households, this must be taken into
account during estimations. In practice, this is first done by identifying the variables of the sampling procedure. They must then be integrated appropriately when calculating average expenditure by the statistical software. Overall, three variables of the sampling procedure must be taken into consideration.
a. The stratification variable: Stratification entails dividing the population into mutually exclusive portions (strata). Part of the sample is selected in each stratum. Stratification may be done on geographical basis or by referring to another characteristic of the population.
b. The cluster or Primary Sampling Unit (PSU): This is necessary, in that, sampled participants from the same cluster are more likely to have similar features, than those from other clusters.
c. The weights may be interpreted as the number of typical households within the total population that each sampled household represents. Once the households have been sampled according to a specific procedure, the estimations must take the sampling procedure into account, if the results are to be extrapolated to the entire population. Most of the statistical software currently available, such as STATA and SPSS, facilitate the use these parametres in analysis of survey data (see for example the SVY package and its options available under STATA). For more information on the subject, the reader of this note should refer to specific documentation of its statistical software.

25Household Education Spending / Methodological Guidelines
3.3.2. Illustration of the method for estimating household education expenditure: CWIQ household survey, Burkina Faso, 2007In 2007, Burkina Faso conducted a CWIQ survey, among households, for collecting data on well-being indicators of the Burkinabe population. These include access to potable water, healthcare, school attendance, employment, incomes and expenditure. In this last section, households were asked to report on the expenditure incurred for the schooling of their children aged five and over. To this end, six major categories of expenditure were identified: (a) school fees; (b) textbooks and supplies; (c) uniforms; (d) transportation; (e) PTA contributions; (f) other school contributions. However, for each of these items, the survey was only able to report on the total amount for all enrolled members of the household, making it advantageous to use econometric modeling to estimate the average education expenditure per child and per level of education.
1Use of econometric regression requires a database which states the following variables for each household9: a) Total annual amount of education expenditure for all
children enrolled in the household;
b) Number of children enrolled at each education level. By definition, if a family has no enrolled child at any level, this variable will have a value of 0;
c) Weights or, where necessary, the probability of inclusion; d) Socioeconomic characteristics of the household.
This leads to a working database similar to the table below.
9 Practically this is done in two stages. First, the school attendance and education expenditure sections are merged. Second, for each household, create a variable that enumerates the number of schooled children at each level of education.

26 Household Education Spending / Methodological Guidelines
Table 3.3.1 : Extract of a working database for estimating household education expenditure, CWIQ 2007 Burkina Faso
Table 3.3.2. : Linear regression without constant10 of total education expenditure on the number of enrolled children at various levels of education
Hous
ehol
d Co
de
Tota
l edu
catio
n ex
pend
iture
No. o
f chi
ldre
n en
rolle
d in
pre
scho
ol
No. o
f chi
ldre
n en
rolle
d in
prim
ary
No. o
f stu
dent
s en
rolle
d in
low
er s
econ
dary
No. o
f stu
dent
s en
rolle
d in
upp
er s
econ
dary
No. o
f stu
dent
s en
rolle
d in
TVE
T
No. o
f stu
dent
s in
tert
iary
inst
itutio
ns
Wei
ghts
Rura
l / U
rban
Inco
me
Quin
tile
5= w
ealth
iest
/ 1
= P
oore
st
100 302 29 500 0 1 0 0 0 0 98.259 Rural 1
106 503 35 000 0 1 0 2 0 0 84.454 Rural 1
100 504 87 000 0 0 0 1 0 0 98.259 Urban 3
100 505 196 500 1 2 0 1 0 0 98.259 Urban 3
101 123 88 000 0 1 0 0 0 0 77.599 Urban 2
107 707 81 000 0 1 0 0 0 0 73.958 Urban 2
Source : Excerpt from the working database, CWIQ Burkina Faso 2007.
Source : Calculation by authors, using Burkina Faso CWIQ (2007) survey. No. of observations: 3281 - R2 : 47,4 % - Note : (1) *** significant at threshold of 1%
2 After that, the use of a statistical software helps to estimate the coefficients of the “accounting relationship” by regressing the total education expenditure on the number of
children enrolled at each levels of education. The results are shown in table 4.2 below.
Number of children enrolled at:
CoefficientsStandard
errors t P > |t| Significance1
Preschool 49 024,5 9 186,5 5,34 0,000 ***
Primary 8 839,1 685,9 12,89 0,000 ***
Secondary (lower) 47 196,5 4 067,2 11,6 0,000 ***
Secondary (higher) 75 911,5 10 908,0 6,96 0,000 ***
TVET 92 096,4 15 983,3 5,76 0,000 ***
Tertiary education 114 170,5 22 437,2 5,09 0,000 ***

27Household Education Spending / Methodological Guidelines
Two of the results in the table are of particular interest11. First, the coefficient signs must logically be positive and second, the statistical validity of the coefficients estimated by the model. For that, validity tests must be done as mentioned in the preceding section.
The findings indicate that the coefficients are positive and highly significant (see the t-stats associated with each coefficient). In 2007, the annual mean unit costs per household were estimated at 49 024 FCFA for preschool, 8 839 FCFA for primary, 47 496 FCFA for lower secondary, 75 911 FCFA for higher secondary, 92 096 FCFA for technical and vocational education and training and 114 170 FCFA for tertiary education. This is the classic structure for growing unit costs with level of education, with the only exception being that preschool is nearly as expensive as secondary school.
Likewise, we can estimate the average expenditure according to the type of school or the socioeconomic characteristics of the students (gender, incomes etc.). Typical tables for presenting the findings are shown in the annex.
10 Linear regression without a constant and which takes the sampling procedure into account.
11 For more information refer to econometric initiation manual.

28 Household Education Spending / Methodological Guidelines
Annex: Typical tables for presenting estimation findings
Table A.1. : Estimated household expenditure per child and according to level of education and type of school attended, year
Table A.2. : Structure of household education expenditure per child and according to level of education and type of school attended, year
Average expenditure estimated for each
student, MU
Structure of household education expenditure
TotalSchool fees
Textbooks and
supplies
School uniforms
Other expenses
Public sector PreschoolPrimary
Secondary (general) (separate lower and upper if possible)
Secondary (TVET) Tertiary
Private sectorPreschoolPrimary
Secondary (general)Secondary (TVET)
Tertiary
Preschool PrimaryGeneral secondary
TVET Tertiary TotalLower Higher
Average expenditure per student
According to school:PublicPrivate
Other (community etc.)
According to genderBoys Girls
According to level of wealthPoor quintile (Q1 - Q2)
Intermediate quintile (Q3)Wealthy quintile (Q4 - Q5)
Table A.1.
Table A.2.
28 Household Education Spending / Methodological Guidelines

29Household Education Spending / Methodological Guidelines
Table A.3. : Total household expenditure according to level of education and national expenditure borne by households
Preschool PrimarySecondary (general)
TVET Tertiary TotalLower Higher
Average expenditure per student, year n (A)
Number of enrolled children ,year n (B)
Total household expenditure1 : C = A x B
Total government currentexpenditure year n (D)
National education expenditure (households + government), year n :
E = C + D
% national expenditure borne by households2, year n = (C / E) x 100
Table A.3.
Notes : 1. Total household expenditure for year n is calculated as the average expenditure per student (public and private), multiplied by the
respective numbers.2. The share of national expenditure (households + government) borne by households is obtained by dividing total expenditure of
households (c) by the total household expenditure and current expenditure of the State (E) multiplied by 100.

30 Household Education Spending / Methodological Guidelines
References
Foko T. B., B. Kouak Tiyab and G. Husson. 2012."Household Education Spending"Analytical and Comparative Perspective for 15 African Countries. Working document of the Education Sector Analysis Division, UNESCO/BREDA (Pôle de Dakar).
Haziza, D. 2011."Traitement de la non-réponse totale et partielle dans les enquêtes"FCDA, Ensai.
Haziza, D., and Rao, J.N.K. 2003."Inference for population means under un-weighted imputation for missing survey data"Survey Methodology, 29, 81-90.
Mingat, A., Ledoux, B., and M. Rakotomalala, 2010."L’enseignement post-primaire en Afrique subsaharienne"Viabilité financière des différentes options de développement. Série développement humain de la région Afrique. World Bank. http://www.afd.fr/webdav/shared/PORTAILS/SECTEURS/EDUCATION/images/
post%20primaire%20fr%20.pdf
Spanos, A. 2012."Identities and their Role in Econometric Modeling"Department of Economics, Virginia Tech.
UOE/EUROSTAT/ data collection on education systems"Concepts, definitions and classifications. Volume 2"http://www.uis.unesco.org/Library/Documents/uoe-data-collection-education-systems-v2-en.pdf

31Household Education Spending / Methodological Guidelines
International Institutefor Educational Planning

32 Household Education Spending / Methodological Guidelines
Tel : (+221) 33 849 59 79Fax : (+221) 33 821 35 25
Web : www.poledakar.org
IIEP - Pôle de Dakar UNESCO12 avenue Léopold Sédar SenghorDakar - Sénégal