house flipping in nyc: how real estate speculators … · market, depriving non-professional buyers...
TRANSCRIPT
H O U S E F L I P P I N G I N N Y C :
H O W R E A L E S TAT E S P E C U L AT O R S A R E TA R G E T I N G N E W Y O R K C I T Y ’ S M O S T A F F O R D A B L E N E I G H B O R H O O D SBy Leo Goldberg and John Baker
APRIL 2018
In neighborhoods across New York City, real estate investors are knocking on doors and calling up homeowners, seeking to convince them to sell their properties at low prices so that the homes can be resold for substantial profits. Commonly referred to as “housing flipping,” this practice can uproot residents in gentrifying neighborhoods and reduce the stock of affordable homes in a city where homeownership is increasingly out of reach for most.
Not since 2006, when property speculators played a significant role in spurring the mortgage crisis that triggered the Great Recession, has so much house flipping been recorded in the city.1 The practice is often lucrative for investors but can involve unwanted and sometimes deceptive solicitations of homeowners. And the profitability of house flipping creates an incentive for scammers seeking to dislodge vulnerable — and often older — homeowners from their properties.2
In more economically depressed parts of the country, flipping is sometimes considered a boon because it puts dilapidated homes back on the market. However, in New York City, where prices are sky-high and demand for homes far exceeds supply, flipping contributes to gentrification and displacement. The practice not only affects homeowners, but also renters who live in 1-4 unit homes and often pay some of the most affordable rents in the city. Once an investor swoops in, these renters can find they’ve lost their leases as the property gets flipped.
This report builds on our previous research on the effects of flipping on affordability and displacement by analyzing the connection between foreclosure and property speculation.3 Our analysis of flipped homes from 2010 to 2017 shows that investors sourced over one third of their properties from homeowners who are in foreclosure.
1 A new paper from the National Bureau of Economic Research finds that borrowers with poor credit had a much smaller role in the wave of mortgage defaults that began in 2006 than commonly believed. Instead, it was investors who began rapidly defaulting in that year, creating ripple effects in the mortgage industry and, ultimately. the economy at large. Albanesi, De Giorgi, and Nosal, Credit Growth and the Financial Crisis: A New Narrative, NBER Working Paper No. 23740, August 2017. Available at: http://papers.nber.org/tmp/85065-w23740.pdf
2 “11 People, 2 Companies Accused Of Tricking Homeowners Into Signing Over Deeds In Queens,” CBS New York. March 1, 2017. Available at http://newyork.cbslocal.com/2017/03/01/queens-deed-fraud/
3 “The Impact of Property Flipping on Homeowners and Renters in Small Buildings,” available at http://cnycn.org/wp-content/ uploads/2016/04/CNYCN-NYC-Flipping-Analysis.pdf
2
This practice allows investors to access properties not listed on the open real estate market, depriving non-professional buyers of the opportunity to bid on them.
Additionally, by comparing the sales prices of flipped homes to non-flipped homes in the same neighborhood, we can distinguish between price increases caused by housing market trends and price inflation generated by property speculation.
FINDINGS 1. In 2017, investors purchased over one-third (38%) of the homes that sold at prices within reach of middle- and working-class families in New York City, dramatically diminishing the supply of homes affordable to those households.
2. Flipping is fueled by foreclosures: Twelve percent of all homes sold in 2017 had been in foreclosure at the time of sale while the same is true of 34% of the homes flipped in 2017. That means that a flipped home was almost three times more likely to have been in foreclosure than a home that sold without being flipped.
3. Flipping makes it more difficult for prospective buyers to find affordable homesby inflating prices beyond similar properties in the neighborhood. For example, flipped homes in Jamaica, Queens, sell for 33% more than similar properties not purchased by investors.
FINDING 1
Home flipping significantly diminished the supply of affordable homes in 2017
Very few home sales in New York City can be considered affordable to first-time homebuyers. Flippers have captured many of those homes, further limiting the already constrained options for families looking to buy.
In 2017, 24,344 1-4 unit homes were sold in New York City. Of those, only 2,705 (11%) were affordable to families making the area median income for a family of three — $85,900.4 Of those sales, 1,026 (38%) were flipped in the following months by investors — almost always at much higher prices. That means that over one third of homes on the market affordable to families at the area median income (100% of AMI) were purchased by investors and subsequently resold at less affordable prices.5 Another way to understand the phenomenon: even though the vast majority of sales were at higher price points, the majority of flips (51%) were of homes sold at prices affordable to families at the area median income.
4 This calculation assumed the median 2016 loan-to-income ratio of 3.74 (as indicated by Home Mortgage Disclosure Act data) and a 5% downpayment (most low and moderate income homebuyers in New York City use low-downpayment mortgages from the FHA or other sources). Assuming a 20% downpayment and thus a higher affordable sales price, does not make a significant change to this analysis, dropping the percentage of affordable sales that were flipped only 1%.5 This analysis does not include co-ops and condos. There are just under 200,000 condos and co-ops in New York City; 636,000 lots contain 1-3 family homes.
3
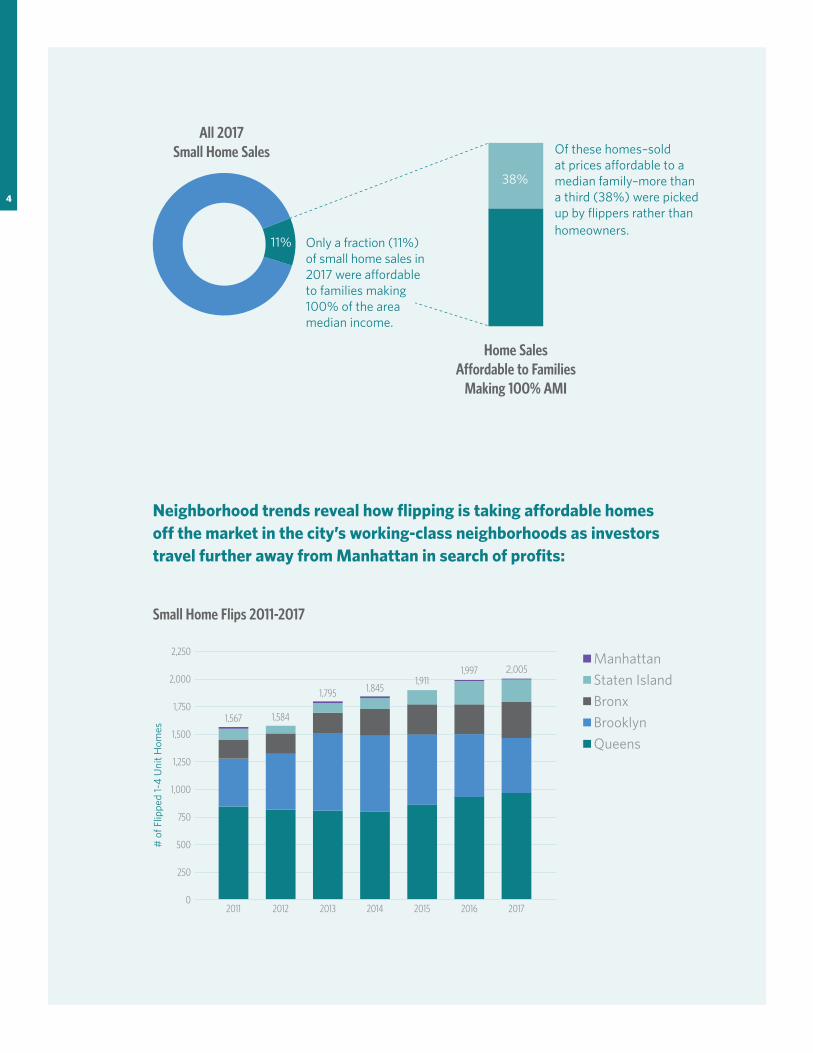
Neighborhood trends reveal how flipping is taking affordable homes off the market in the city’s working-class neighborhoods as investors travel further away from Manhattan in search of profits:
Of these homes–sold at prices affordable to a median family–more than a third (38%) were picked up by flippers rather than homeowners.
Home Sales Affordable to Families
Making 100% AMI
Small Home Flips 2011-2017
# o
f Flip
ped
1-4
Uni
t Hom
es
Manhattan
Staten Island
Bronx
Brooklyn
Queens
1,567
2011 2013 2014 2015 2016 20172012
1,584
1,795 1,8451,911
1,997 2,005
2,250
2,000
1,750
1,500
1,250
1,000
750
500
250
0
4
All 2017 Small Home Sales
38%
11% Only a fraction (11%) of small home sales in 2017 were affordable to families making 100% of the area median income.

The most intense speculative activity continues to be in southeast Queens and eastern Brooklyn. In Jamaica, Queens, more than one out of every five home sales (22%) is to a flipper. This is significantly higher than the borough-wide figure for Queens, which is 10%.6
Cambria Heights, Queens and Queens Village have seen steep year-over-year increases in flipping — as have the northern Bronx, and Brooklyn neighborhoods like Flatbush, Canarsie, and Flatlands.
Meanwhile, flipping has slowed in Bedford-Stuyvesant and other central and western Brooklyn neighborhoods. Bedford-Stuyvesant saw the number of flips diminish from 171 in 2013 to 46 in 2017. As property prices have surged in the area, investors have likely found bargain prices harder to come by and have turned their attention to neighborhoods farther east or outside the borough.
Flipping activity has picked up on Staten Island but is still relatively low compared to the general volume of home sales. In some city neighborhoods, flipping makes up as much as 22% of the market for small homes. On Staten Island, flipping has made up no more than 5% of home sales in any year since 2010.
6 See Appendix B for the rate of flipping (flipping compared to all sales) by borough and neighborhood.
Where are homes flipped most frequently?
1-20
20-61
61-101
101-205
205-376
5
FINDING 2
Flipping is Fueled By Foreclosures
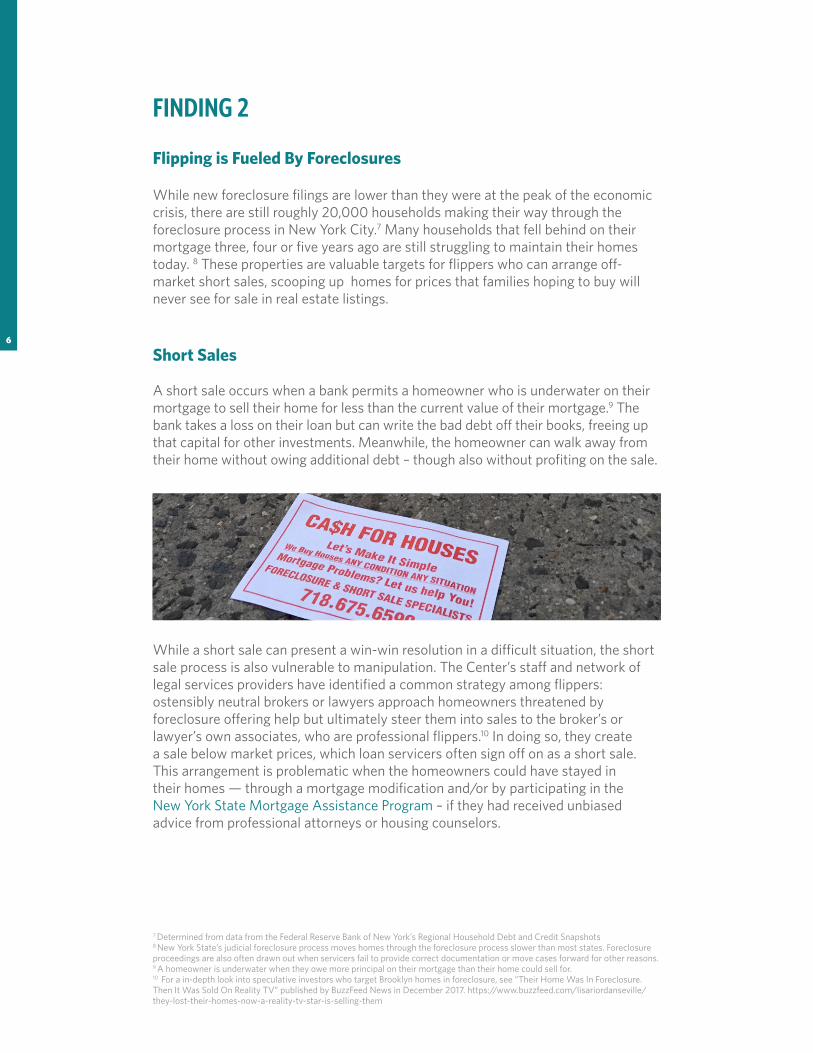
While new foreclosure filings are lower than they were at the peak of the economic crisis, there are still roughly 20,000 households making their way through the foreclosure process in New York City.7 Many households that fell behind on their mortgage three, four or five years ago are still struggling to maintain their homes today. 8 These properties are valuable targets for flippers who can arrange off- market short sales, scooping up homes for prices that families hoping to buy will never see for sale in real estate listings.
Short Sales
A short sale occurs when a bank permits a homeowner who is underwater on their mortgage to sell their home for less than the current value of their mortgage.9 The bank takes a loss on their loan but can write the bad debt off their books, freeing up that capital for other investments. Meanwhile, the homeowner can walk away from their home without owing additional debt – though also without profiting on the sale.
While a short sale can present a win-win resolution in a difficult situation, the short sale process is also vulnerable to manipulation. The Center’s staff and network of legal services providers have identified a common strategy among flippers: ostensibly neutral brokers or lawyers approach homeowners threatened by foreclosure offering help but ultimately steer them into sales to the broker’s or lawyer’s own associates, who are professional flippers.10 In doing so, they create a sale below market prices, which loan servicers often sign off on as a short sale. This arrangement is problematic when the homeowners could have stayed in their homes — through a mortgage modification and/or by participating in the New York State Mortgage Assistance Program – if they had received unbiased advice from professional attorneys or housing counselors.
7 Determined from data from the Federal Reserve Bank of New York’s Regional Household Debt and Credit Snapshots8 New York State’s judicial foreclosure process moves homes through the foreclosure process slower than most states. Foreclosure proceedings are also often drawn out when servicers fail to provide correct documentation or move cases forward for other reasons.9 A homeowner is underwater when they owe more principal on their mortgage than their home could sell for.10 For a in-depth look into speculative investors who target Brooklyn homes in foreclosure, see “Their Home Was In Foreclosure. Then It Was Sold On Reality TV” published by BuzzFeed News in December 2017. https://www.buzzfeed.com/lisariordanseville/they-lost-their-homes-now-a-reality-tv-star-is-selling-them
6
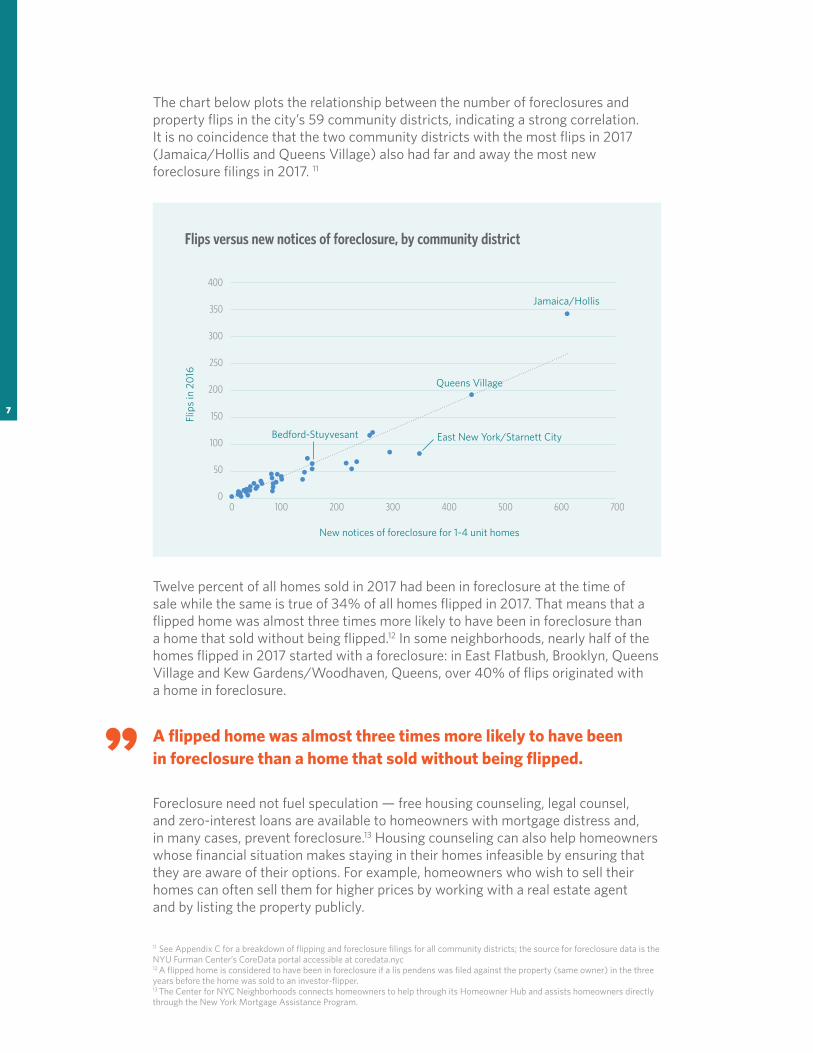
The chart below plots the relationship between the number of foreclosures and property flips in the city’s 59 community districts, indicating a strong correlation. It is no coincidence that the two community districts with the most flips in 2017 (Jamaica/Hollis and Queens Village) also had far and away the most new foreclosure filings in 2017. 11
Twelve percent of all homes sold in 2017 had been in foreclosure at the time of sale while the same is true of 34% of all homes flipped in 2017. That means that a flipped home was almost three times more likely to have been in foreclosure than a home that sold without being flipped.12 In some neighborhoods, nearly half of the homes flipped in 2017 started with a foreclosure: in East Flatbush, Brooklyn, Queens Village and Kew Gardens/Woodhaven, Queens, over 40% of flips originated with a home in foreclosure.
Foreclosure need not fuel speculation — free housing counseling, legal counsel, and zero-interest loans are available to homeowners with mortgage distress and, in many cases, prevent foreclosure.13 Housing counseling can also help homeowners whose financial situation makes staying in their homes infeasible by ensuring that they are aware of their options. For example, homeowners who wish to sell their homes can often sell them for higher prices by working with a real estate agent and by listing the property publicly.
11 See Appendix C for a breakdown of flipping and foreclosure filings for all community districts; the source for foreclosure data is the NYU Furman Center’s CoreData portal accessible at coredata.nyc12 A flipped home is considered to have been in foreclosure if a lis pendens was filed against the property (same owner) in the three years before the home was sold to an investor-flipper.13 The Center for NYC Neighborhoods connects homeowners to help through its Homeowner Hub and assists homeowners directly through the New York Mortgage Assistance Program.
Flips versus new notices of foreclosure, by community district
Flip
s in
20
16
New notices of foreclosure for 1-4 unit homes
Jamaica/Hollis
Queens Village
East New York/Starnett CityBedford-Stuyvesant
1000 300 400 500 600 700200
400
350
300
250
200
150
100
50
0
A flipped home was almost three times more likely to have been in foreclosure than a home that sold without being flipped.
7
FINDING 3
Flipping makes it harder for prospective buyers to find affordable homes
Flippers typically purchase homes at bargain prices that are considerably lower than comparable sales prices in the area and then sell them at significantly higher prices. In 2017, flippers were able to purchase homes at a median price per square foot of $212, while similar homes sold on the open market for a median price of $368 per square foot.14 Across the city, flippers purchased homes for 20% to 50% less than the sales prices of comparable properties in the neighborhood. Cypress Hills and East New York (Brooklyn Community District 5) lead Brooklyn in flipping because investors are able to buy homes at much lower prices than other buyers. While the neighborhood’s median sale price for non-flip 1-4 family sales was $261/sqft, investors looking to flip bought similar homes for a median price of $186/sqft in 2017. That difference means that investors are able to beat out first-time homebuyers for whom East New York and Cypress Hills’ modest two-story houses have traditionally been entry points to homeownership.
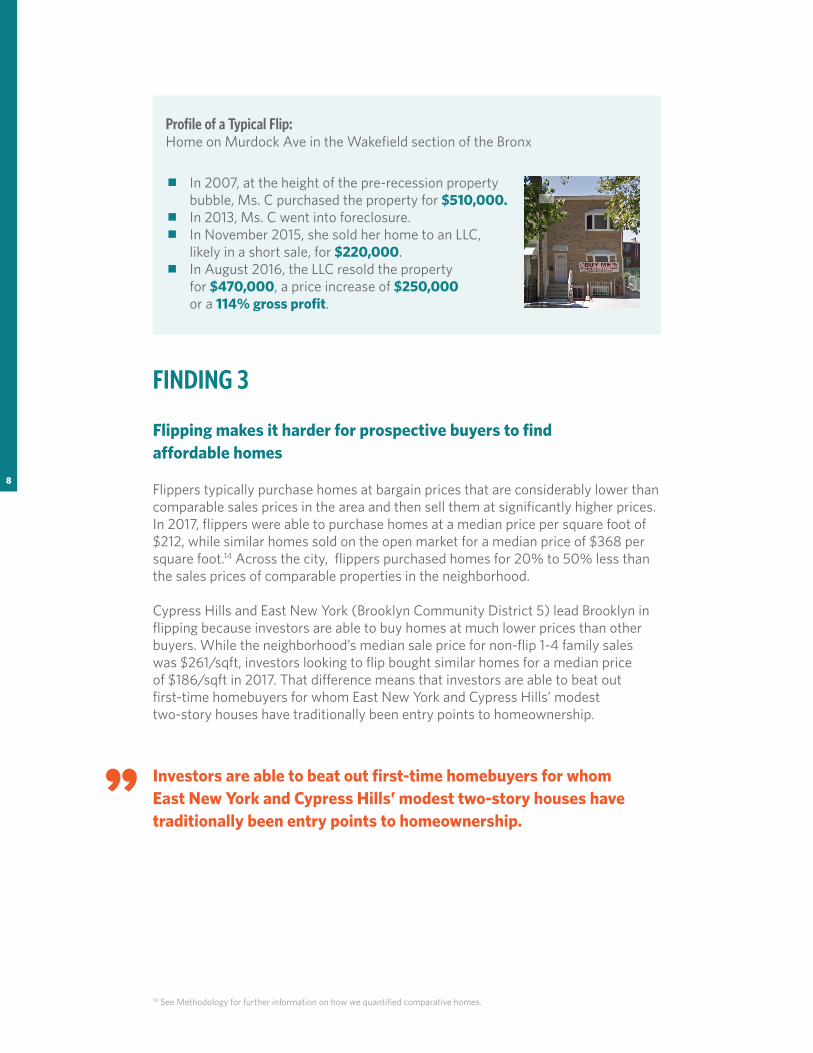
Profile of a Typical Flip:Home on Murdock Ave in the Wakefield section of the Bronx
In 2007, at the height of the pre-recession property bubble, Ms. C purchased the property for $510,000.
In 2013, Ms. C went into foreclosure. In November 2015, she sold her home to an LLC,
likely in a short sale, for $220,000. In August 2016, the LLC resold the property
for $470,000, a price increase of $250,000 or a 114% gross profit.
Investors are able to beat out first-time homebuyers for whom East New York and Cypress Hills’ modest two-story houses have traditionally been entry points to homeownership.
14 See Methodology for further information on how we quantified comparative homes.
8
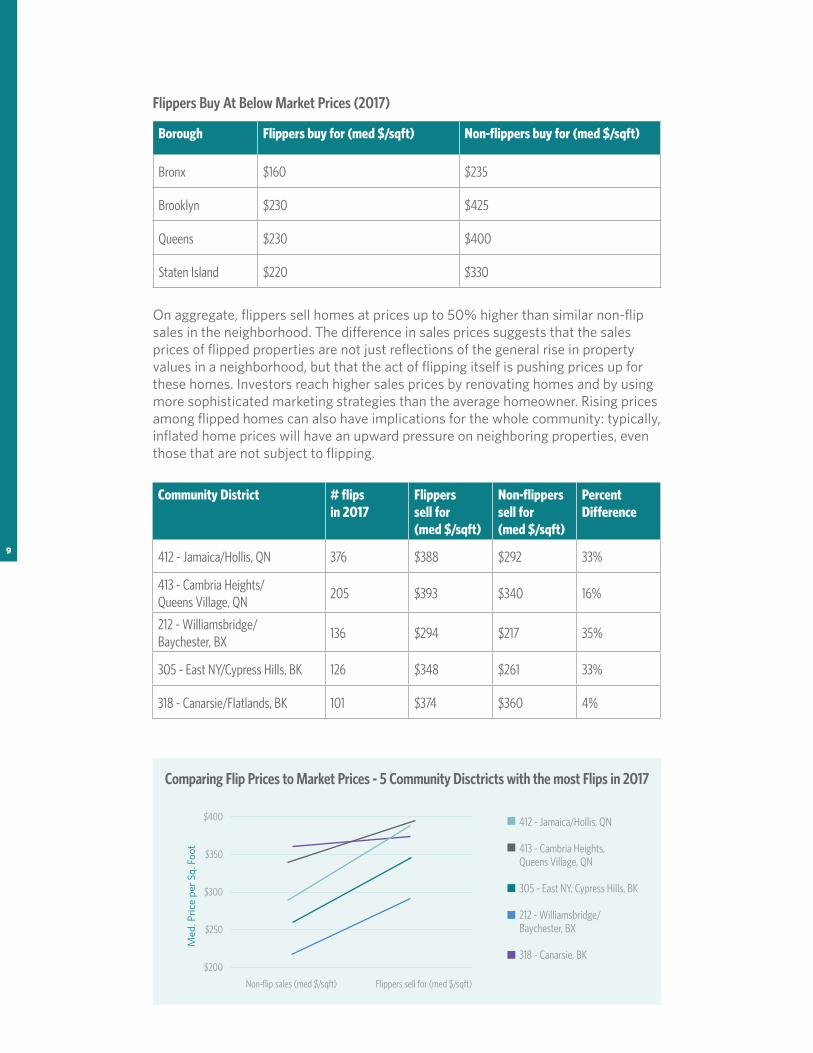
On aggregate, flippers sell homes at prices up to 50% higher than similar non-flip sales in the neighborhood. The difference in sales prices suggests that the sales prices of flipped properties are not just reflections of the general rise in property values in a neighborhood, but that the act of flipping itself is pushing prices up for these homes. Investors reach higher sales prices by renovating homes and by using more sophisticated marketing strategies than the average homeowner. Rising prices among flipped homes can also have implications for the whole community: typically, inflated home prices will have an upward pressure on neighboring properties, even those that are not subject to flipping.
Community District # flips in 2017
Flippers sell for (med $/sqft)
Non-flippers sell for (med $/sqft)
Percent Difference
412 - Jamaica/Hollis, QN 376 $388 $292 33%
413 - Cambria Heights/ Queens Village, QN
205 $393 $340 16%
212 - Williamsbridge/ Baychester, BX
136 $294 $217 35%
305 - East NY/Cypress Hills, BK 126 $348 $261 33%
318 - Canarsie/Flatlands, BK 101 $374 $360 4%
Flippers Buy At Below Market Prices (2017)
Borough Flippers buy for (med $/sqft) Non-flippers buy for (med $/sqft)
Bronx $160 $235
Brooklyn $230 $425
Queens $230 $400
Staten Island $220 $330
Comparing Flip Prices to Market Prices - 5 Community Disctricts with the most Flips in 2017
Med
. Pri
ce p
er S
q. F
oot
Non-flip sales (med $/sqft) Flippers sell for (med $/sqft)
$400
$350
$300
$250
$200
412 - Jamaica/Hollis, QN
413 - Cambria Heights, Queens Village, QN
305 - East NY, Cypress Hills, BK
212 - Williamsbridge/Baychester, BX
318 - Canarsie, BK
9

Unlike neighborhoods with high flipping activity, neighborhoods with relatively little flipping activity do not see a significant impact on prices. For example, southern and western Brooklyn, and western Queens, show median market sales prices higher than those of flipped properties. This may be because the flipping in those areas is not conducted by experienced investors who specialize in maximizing value from their flips. The same is true for two of the three community districts of Staten Island. Another possible explanation is that the homes flipped in these neighborhoods are less valuable than other homes because of factors beyond the scope of this analysis (such as building age).
As explored in the Center for NYC Neighborhoods’ 2016 report, “The Impact of Property Flipping on Homeowners and Renters in Small Buildings,” inflated home prices mean fewer opportunities for first-time homebuyers. In eastern Brooklyn, the median price that investors purchased homes for would have been accessible to a family making about $94,000 a year. At the median price that investors sold for, only families making at least $182,000 would have a realistic chance of affording to buy.
Inflated home prices can also affect renters as well. That’s because most small homes in New York City contain at least one rental unit (the city has over 230,000 two-family homes). These units tend to be available at rents below those of other market rate units and make up the predominant form of rental housing in low-rise outer-borough neighborhoods.15
In the most recent five-year period, the 9,000 flipped homes represent 15,000 individual housing units. If every home had one unit inhabited by the owners, then at least 6,000 of these units were rentals, though the actual number is likely higher.
The Impact of flipping on affordability in Brooklyn Community District 5 (East NY, Cypress Hills)
Total housing units in flipped homes including rentals
Before Flip After Flip
Price $350,000 $680,000
Income to afford $94K (110% of AMI for family of 3) $182k (210% of AMI for family of 3)
2011 2012 2013 2014 2015 2016 2017
2,679 2,733 3,158 3,256 3,298 3,318 3,179
15 2014 New York City Housing and Vacancy Survey
10
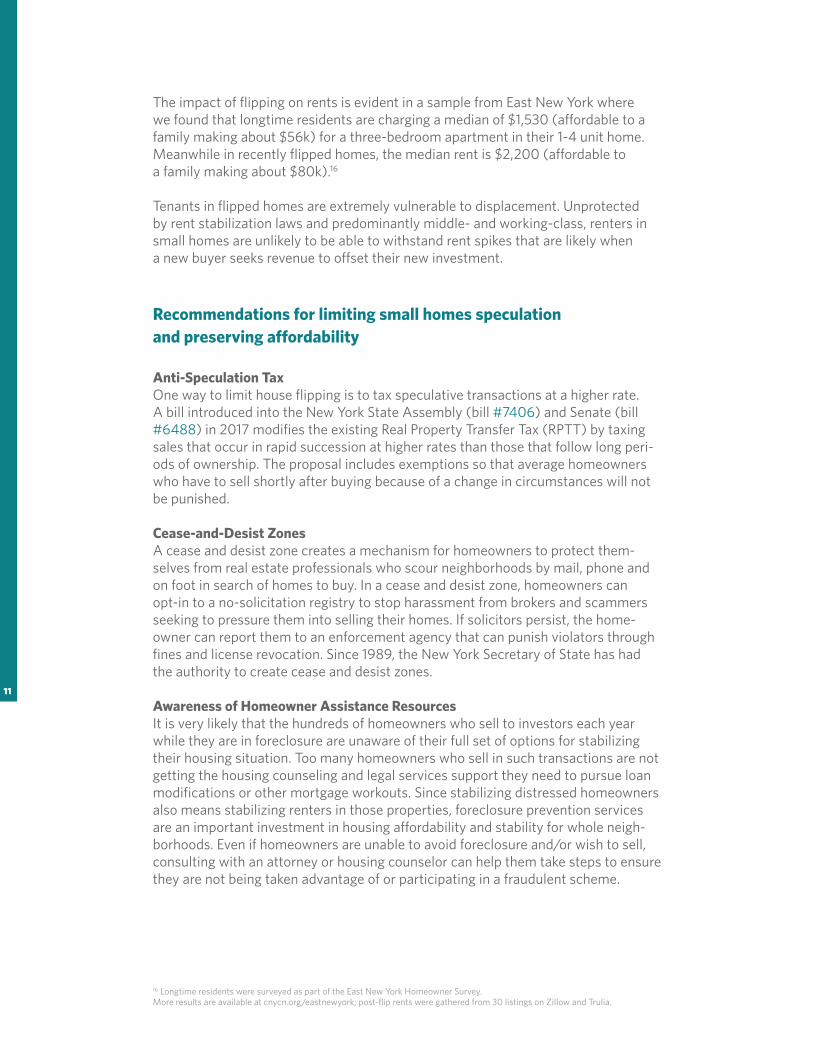
The impact of flipping on rents is evident in a sample from East New York where we found that longtime residents are charging a median of $1,530 (affordable to a family making about $56k) for a three-bedroom apartment in their 1-4 unit home. Meanwhile in recently flipped homes, the median rent is $2,200 (affordable to a family making about $80k).16
Tenants in flipped homes are extremely vulnerable to displacement. Unprotected by rent stabilization laws and predominantly middle- and working-class, renters in small homes are unlikely to be able to withstand rent spikes that are likely when a new buyer seeks revenue to offset their new investment.
Recommendations for limiting small homes speculation and preserving affordability
Anti-Speculation TaxOne way to limit house flipping is to tax speculative transactions at a higher rate. A bill introduced into the New York State Assembly (bill #7406) and Senate (bill #6488) in 2017 modifies the existing Real Property Transfer Tax (RPTT) by taxing sales that occur in rapid succession at higher rates than those that follow long peri-ods of ownership. The proposal includes exemptions so that average homeowners who have to sell shortly after buying because of a change in circumstances will not be punished.
Cease-and-Desist ZonesA cease and desist zone creates a mechanism for homeowners to protect them-selves from real estate professionals who scour neighborhoods by mail, phone and on foot in search of homes to buy. In a cease and desist zone, homeowners can opt-in to a no-solicitation registry to stop harassment from brokers and scammers seeking to pressure them into selling their homes. If solicitors persist, the home-owner can report them to an enforcement agency that can punish violators through fines and license revocation. Since 1989, the New York Secretary of State has had the authority to create cease and desist zones.
Awareness of Homeowner Assistance ResourcesIt is very likely that the hundreds of homeowners who sell to investors each year while they are in foreclosure are unaware of their full set of options for stabilizing their housing situation. Too many homeowners who sell in such transactions are not getting the housing counseling and legal services support they need to pursue loan modifications or other mortgage workouts. Since stabilizing distressed homeowners also means stabilizing renters in those properties, foreclosure prevention services are an important investment in housing affordability and stability for whole neigh-borhoods. Even if homeowners are unable to avoid foreclosure and/or wish to sell, consulting with an attorney or housing counselor can help them take steps to ensure they are not being taken advantage of or participating in a fraudulent scheme.
16 Longtime residents were surveyed as part of the East New York Homeowner Survey.More results are available at cnycn.org/eastnewyork; post-flip rents were gathered from 30 listings on Zillow and Trulia.
11
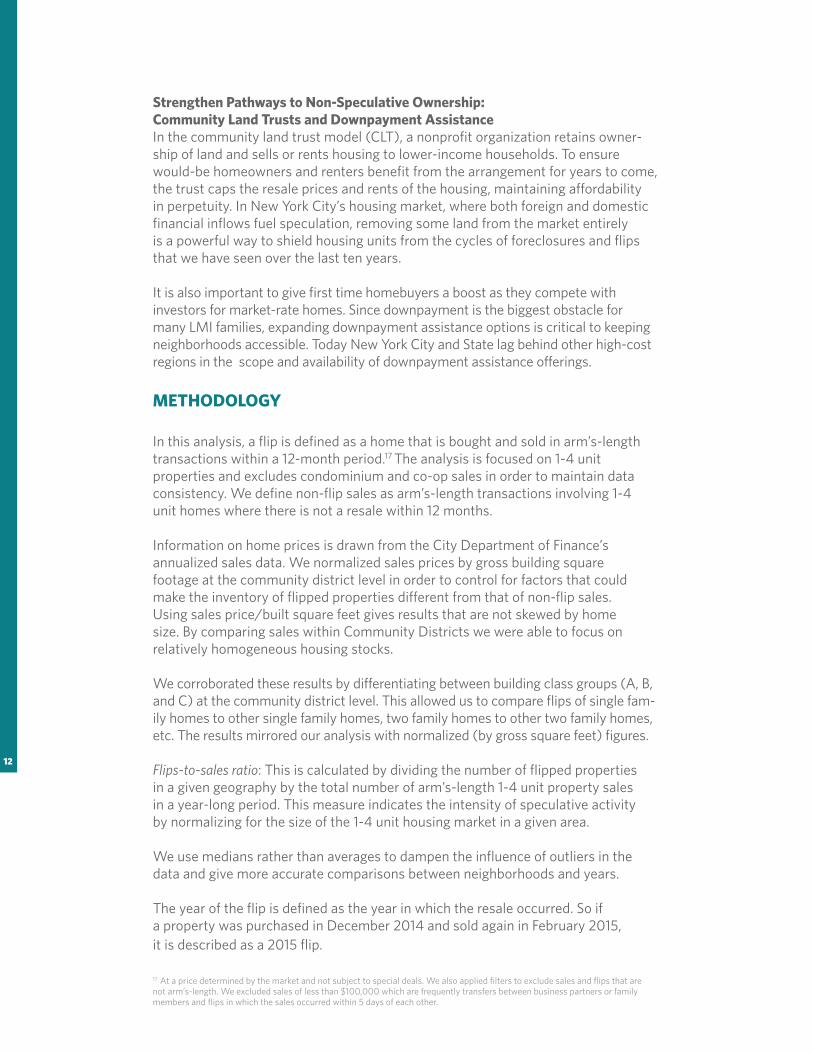
Strengthen Pathways to Non-Speculative Ownership: Community Land Trusts and Downpayment AssistanceIn the community land trust model (CLT), a nonprofit organization retains owner- ship of land and sells or rents housing to lower-income households. To ensure would-be homeowners and renters benefit from the arrangement for years to come, the trust caps the resale prices and rents of the housing, maintaining affordability in perpetuity. In New York City’s housing market, where both foreign and domestic financial inflows fuel speculation, removing some land from the market entirely is a powerful way to shield housing units from the cycles of foreclosures and flips that we have seen over the last ten years.
It is also important to give first time homebuyers a boost as they compete with investors for market-rate homes. Since downpayment is the biggest obstacle for many LMI families, expanding downpayment assistance options is critical to keeping neighborhoods accessible. Today New York City and State lag behind other high-cost regions in the scope and availability of downpayment assistance offerings.
METHODOLOGY
In this analysis, a flip is defined as a home that is bought and sold in arm’s-length transactions within a 12-month period.17 The analysis is focused on 1-4 unit properties and excludes condominium and co-op sales in order to maintain data consistency. We define non-flip sales as arm’s-length transactions involving 1-4 unit homes where there is not a resale within 12 months.
Information on home prices is drawn from the City Department of Finance’s annualized sales data. We normalized sales prices by gross building square footage at the community district level in order to control for factors that could make the inventory of flipped properties different from that of non-flip sales. Using sales price/built square feet gives results that are not skewed by home size. By comparing sales within Community Districts we were able to focus on relatively homogeneous housing stocks.
We corroborated these results by differentiating between building class groups (A, B, and C) at the community district level. This allowed us to compare flips of single fam-ily homes to other single family homes, two family homes to other two family homes, etc. The results mirrored our analysis with normalized (by gross square feet) figures.
Flips-to-sales ratio: This is calculated by dividing the number of flipped properties in a given geography by the total number of arm’s-length 1-4 unit property sales in a year-long period. This measure indicates the intensity of speculative activity by normalizing for the size of the 1-4 unit housing market in a given area.
We use medians rather than averages to dampen the influence of outliers in the data and give more accurate comparisons between neighborhoods and years. The year of the flip is defined as the year in which the resale occurred. So if a property was purchased in December 2014 and sold again in February 2015, it is described as a 2015 flip.
17 At a price determined by the market and not subject to special deals. We also applied filters to exclude sales and flips that arenot arm’s-length. We excluded sales of less than $100,000 which are frequently transfers between business partners or family members and flips in which the sales occurred within 5 days of each other.
12
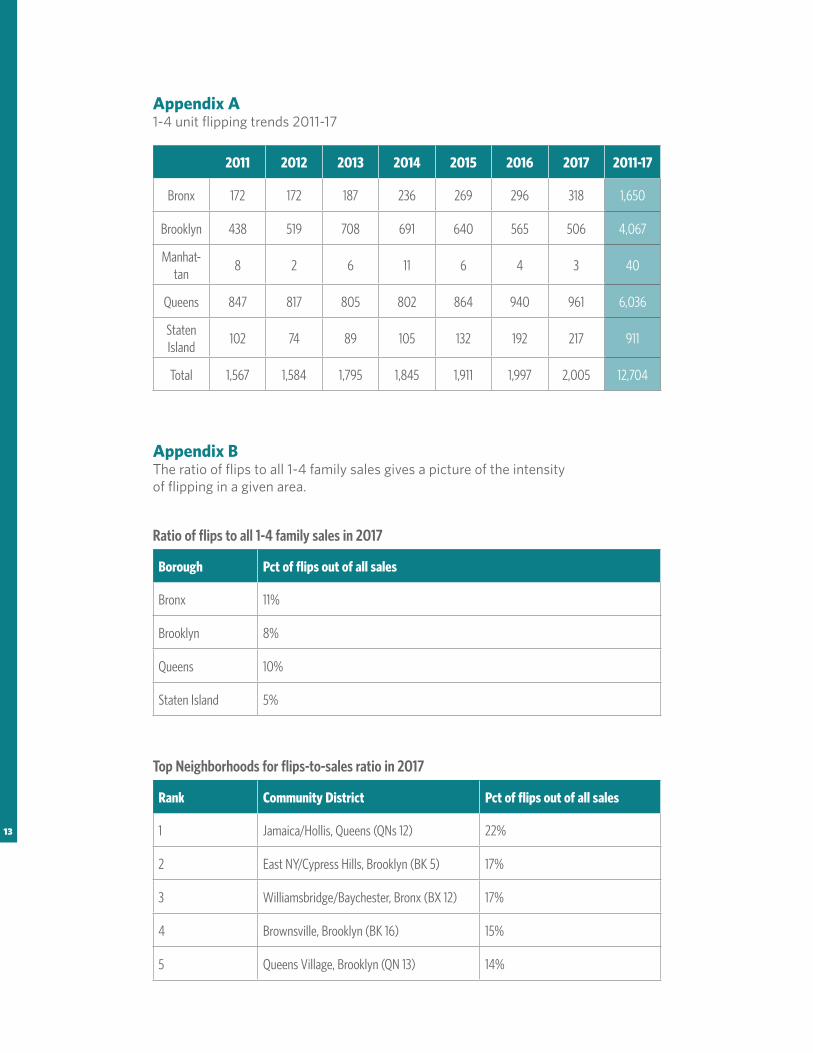
Appendix A1-4 unit flipping trends 2011-17
2011 2012 2013 2014 2015 2016 2017 2011-17
Bronx 172 172 187 236 269 296 318 1,650
Brooklyn 438 519 708 691 640 565 506 4,067
Manhat-tan
8 2 6 11 6 4 3 40
Queens 847 817 805 802 864 940 961 6,036
Staten Island
102 74 89 105 132 192 217 911
Total 1,567 1,584 1,795 1,845 1,911 1,997 2,005 12,704
Appendix BThe ratio of flips to all 1-4 family sales gives a picture of the intensity of flipping in a given area.
Ratio of flips to all 1-4 family sales in 2017
Top Neighborhoods for flips-to-sales ratio in 2017
Borough Pct of flips out of all sales
Bronx 11%
Brooklyn 8%
Queens 10%
Staten Island 5%
Rank Community District Pct of flips out of all sales
1 Jamaica/Hollis, Queens (QNs 12) 22%
2 East NY/Cypress Hills, Brooklyn (BK 5) 17%
3 Williamsbridge/Baychester, Bronx (BX 12) 17%
4 Brownsville, Brooklyn (BK 16) 15%
5 Queens Village, Brooklyn (QN 13) 14%
13
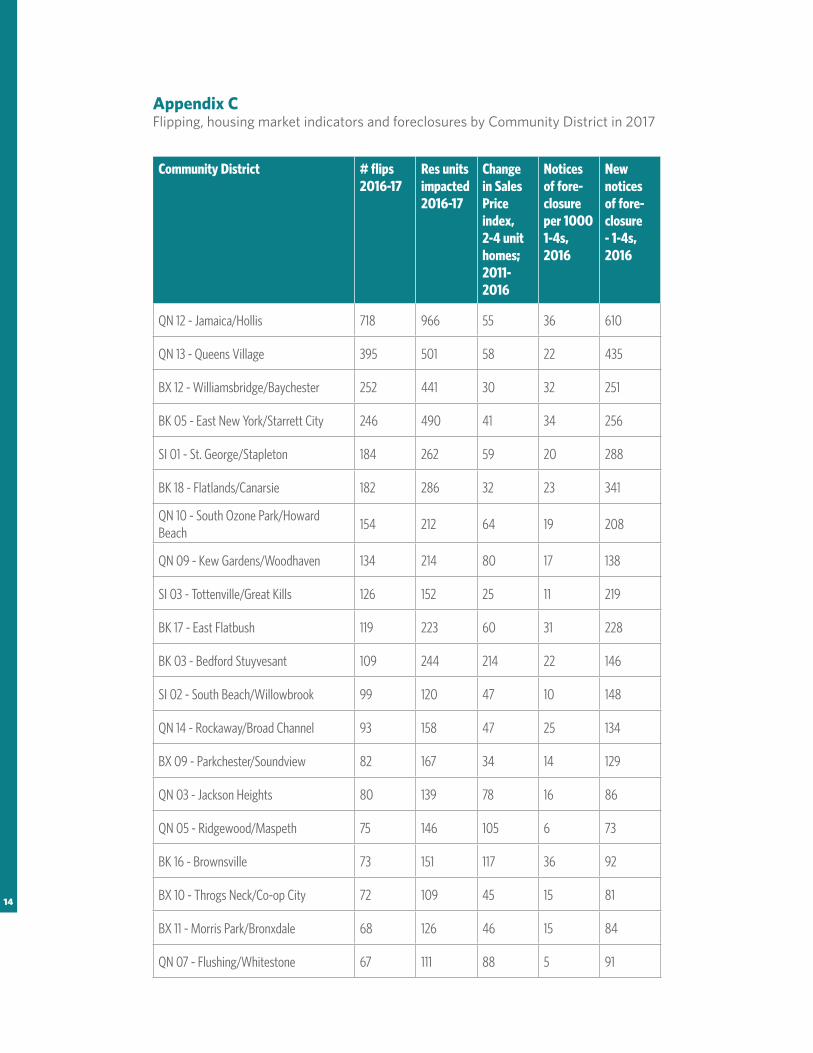
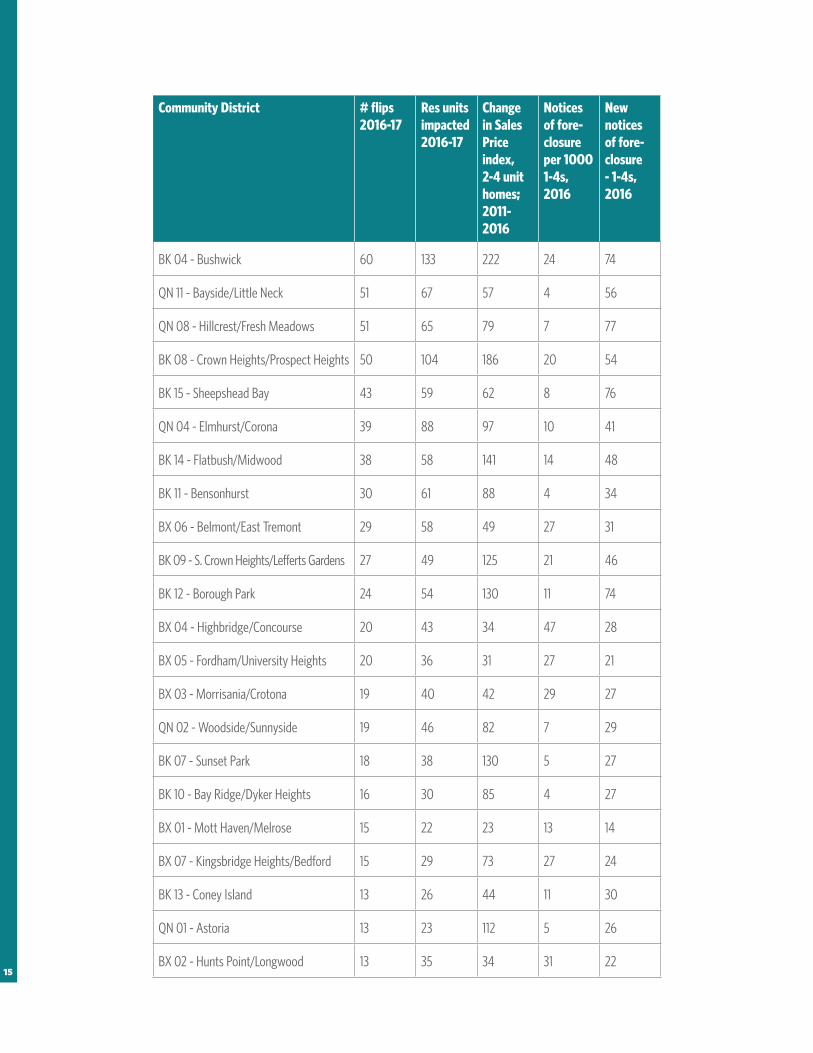
Appendix CFlipping, housing market indicators and foreclosures by Community District in 2017
Community District # flips 2016-17
Res units impacted 2016-17
Change in Sales Price index, 2-4 unit homes; 2011-2016
Notices of fore-closure per 1000 1-4s, 2016
New notices of fore-closure - 1-4s, 2016
QN 12 - Jamaica/Hollis 718 966 55 36 610
QN 13 - Queens Village 395 501 58 22 435
BX 12 - Williamsbridge/Baychester 252 441 30 32 251
BK 05 - East New York/Starrett City 246 490 41 34 256
SI 01 - St. George/Stapleton 184 262 59 20 288
BK 18 - Flatlands/Canarsie 182 286 32 23 341
QN 10 - South Ozone Park/Howard Beach
154 212 64 19 208
QN 09 - Kew Gardens/Woodhaven 134 214 80 17 138
SI 03 - Tottenville/Great Kills 126 152 25 11 219
BK 17 - East Flatbush 119 223 60 31 228
BK 03 - Bedford Stuyvesant 109 244 214 22 146
SI 02 - South Beach/Willowbrook 99 120 47 10 148
QN 14 - Rockaway/Broad Channel 93 158 47 25 134
BX 09 - Parkchester/Soundview 82 167 34 14 129
QN 03 - Jackson Heights 80 139 78 16 86
QN 05 - Ridgewood/Maspeth 75 146 105 6 73
BK 16 - Brownsville 73 151 117 36 92
BX 10 - Throgs Neck/Co-op City 72 109 45 15 81
BX 11 - Morris Park/Bronxdale 68 126 46 15 84
QN 07 - Flushing/Whitestone 67 111 88 5 91
14
Community District # flips 2016-17
Res units impacted 2016-17
Change in Sales Price index, 2-4 unit homes; 2011-2016
Notices of fore-closure per 1000 1-4s, 2016
New notices of fore-closure - 1-4s, 2016
BK 04 - Bushwick 60 133 222 24 74
QN 11 - Bayside/Little Neck 51 67 57 4 56
QN 08 - Hillcrest/Fresh Meadows 51 65 79 7 77
BK 08 - Crown Heights/Prospect Heights 50 104 186 20 54
BK 15 - Sheepshead Bay 43 59 62 8 76
QN 04 - Elmhurst/Corona 39 88 97 10 41
BK 14 - Flatbush/Midwood 38 58 141 14 48
BK 11 - Bensonhurst 30 61 88 4 34
BX 06 - Belmont/East Tremont 29 58 49 27 31
BK 09 - S. Crown Heights/Lefferts Gardens 27 49 125 21 46
BK 12 - Borough Park 24 54 130 11 74
BX 04 - Highbridge/Concourse 20 43 34 47 28
BX 05 - Fordham/University Heights 20 36 31 27 21
BX 03 - Morrisania/Crotona 19 40 42 29 27
QN 02 - Woodside/Sunnyside 19 46 82 7 29
BK 07 - Sunset Park 18 38 130 5 27
BK 10 - Bay Ridge/Dyker Heights 16 30 85 4 27
BX 01 - Mott Haven/Melrose 15 22 23 13 14
BX 07 - Kingsbridge Heights/Bedford 15 29 73 27 24
BK 13 - Coney Island 13 26 44 11 30
QN 01 - Astoria 13 23 112 5 26
BX 02 - Hunts Point/Longwood 13 35 34 31 2215
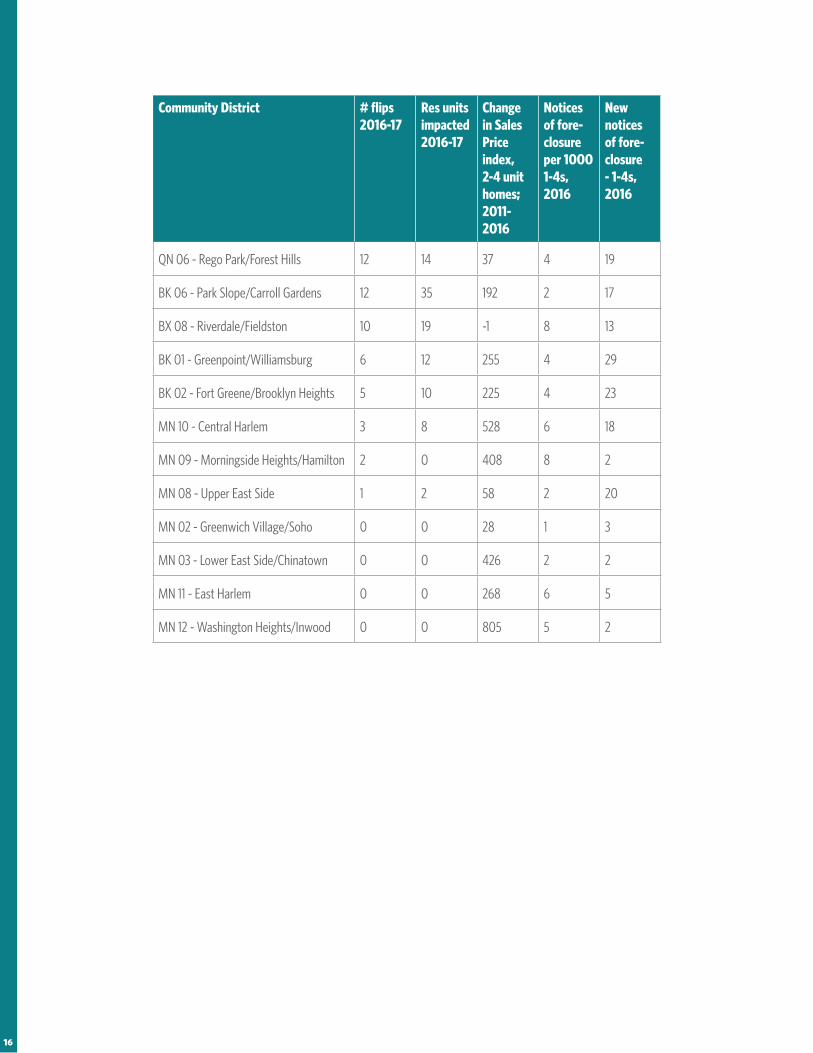
Community District # flips 2016-17
Res units impacted 2016-17
Change in Sales Price index, 2-4 unit homes; 2011-2016
Notices of fore-closure per 1000 1-4s, 2016
New notices of fore-closure - 1-4s, 2016
QN 06 - Rego Park/Forest Hills 12 14 37 4 19
BK 06 - Park Slope/Carroll Gardens 12 35 192 2 17
BX 08 - Riverdale/Fieldston 10 19 -1 8 13
BK 01 - Greenpoint/Williamsburg 6 12 255 4 29
BK 02 - Fort Greene/Brooklyn Heights 5 10 225 4 23
MN 10 - Central Harlem 3 8 528 6 18
MN 09 - Morningside Heights/Hamilton 2 0 408 8 2
MN 08 - Upper East Side 1 2 58 2 20
MN 02 - Greenwich Village/Soho 0 0 28 1 3
MN 03 - Lower East Side/Chinatown 0 0 426 2 2
MN 11 - East Harlem 0 0 268 6 5
MN 12 - Washington Heights/Inwood 0 0 805 5 2
16