hotspots, opportunities & initiatives spirits - wrap v1.pdf · 10. wrap (2006). colourite...
TRANSCRIPT
Hotspots, opportunities & initiatives
Spirits
Version 1 May 2013
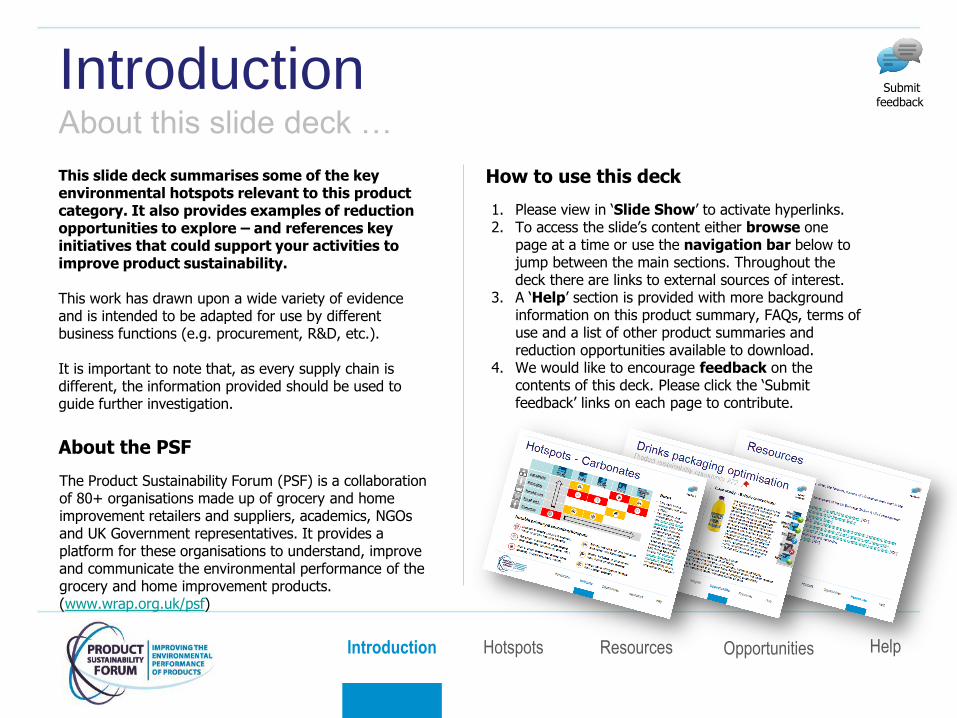
The Product Sustainability Forum (PSF) is a collaboration of 80+ organisations made up of grocery and home improvement retailers and suppliers, academics, NGOs and UK Government representatives. It provides a platform for these organisations to understand, improve and communicate the environmental performance of the grocery and home improvement products. (www.wrap.org.uk/psf)
About the PSF
How to use this deck
Introduction Opportunities Hotspots Resources Help
1. Please view in „Slide Show‟ to activate hyperlinks. 2. To access the slide‟s content either browse one
page at a time or use the navigation bar below to jump between the main sections. Throughout the deck there are links to external sources of interest.
3. A „Help‟ section is provided with more background information on this product summary, FAQs, terms of use and a list of other product summaries and reduction opportunities available to download.
4. We would like to encourage feedback on the contents of this deck. Please click the „Submit feedback‟ links on each page to contribute.
Introduction About this slide deck …
Submit feedback
This slide deck summarises some of the key environmental hotspots relevant to this product category. It also provides examples of reduction opportunities to explore – and references key initiatives that could support your activities to improve product sustainability. This work has drawn upon a wide variety of evidence and is intended to be adapted for use by different business functions (e.g. procurement, R&D, etc.). It is important to note that, as every supply chain is different, the information provided should be used to guide further investigation.
Notable primary & secondary hotspots
Notes
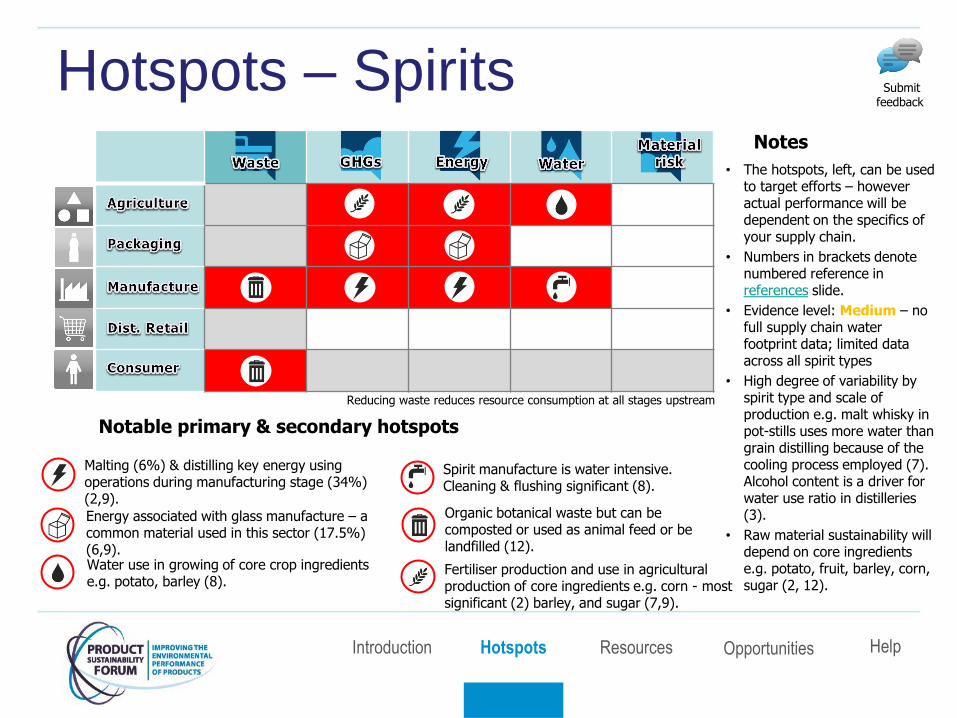
Hotspots – Spirits
Malting (6%) & distilling key energy using operations during manufacturing stage (34%) (2,9).
Fertiliser production and use in agricultural production of core ingredients e.g. corn - most significant (2) barley, and sugar (7,9).
Energy associated with glass manufacture – a common material used in this sector (17.5%) (6,9).
Spirit manufacture is water intensive. Cleaning & flushing significant (8).
Organic botanical waste but can be composted or used as animal feed or be landfilled (12).
• The hotspots, left, can be used to target efforts – however actual performance will be dependent on the specifics of your supply chain.
• Numbers in brackets denote numbered reference in references slide.
• Evidence level: Medium – no full supply chain water footprint data; limited data across all spirit types
• High degree of variability by spirit type and scale of production e.g. malt whisky in pot-stills uses more water than grain distilling because of the cooling process employed (7). Alcohol content is a driver for water use ratio in distilleries (3).
• Raw material sustainability will depend on core ingredients e.g. potato, fruit, barley, corn, sugar (2, 12).
Water use in growing of core crop ingredients e.g. potato, barley (8).
Reducing waste reduces resource consumption at all stages upstream
Introduction Opportunities Hotspots Resources Help
Submit feedback
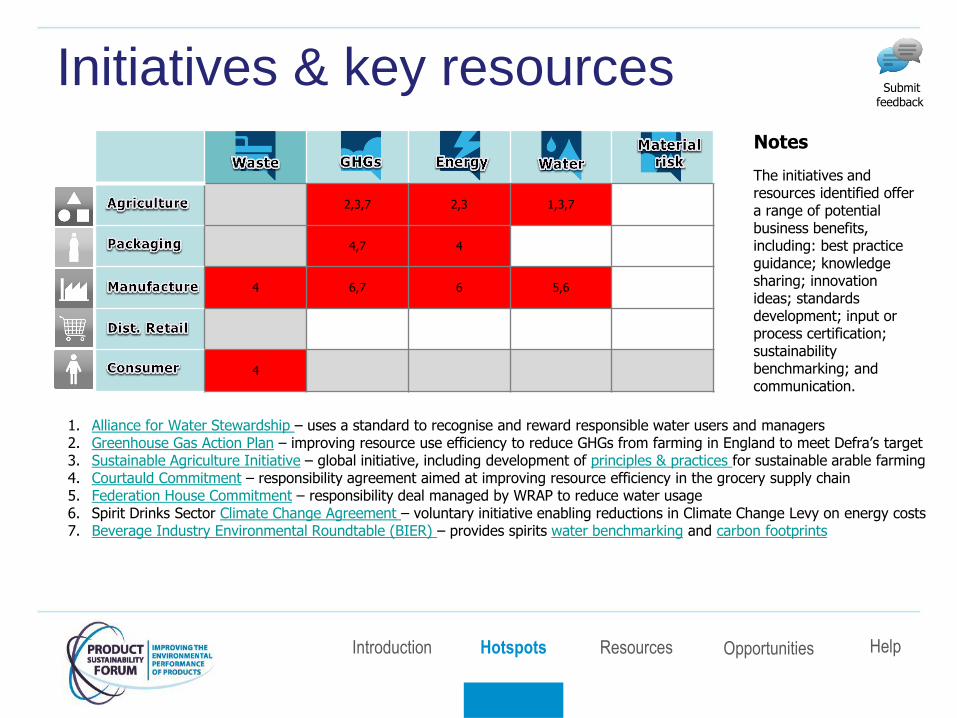
Initiatives & key resources
Notes
1. Alliance for Water Stewardship – uses a standard to recognise and reward responsible water users and managers 2. Greenhouse Gas Action Plan – improving resource use efficiency to reduce GHGs from farming in England to meet Defra‟s target 3. Sustainable Agriculture Initiative – global initiative, including development of principles & practices for sustainable arable farming 4. Courtauld Commitment – responsibility agreement aimed at improving resource efficiency in the grocery supply chain 5. Federation House Commitment – responsibility deal managed by WRAP to reduce water usage 6. Spirit Drinks Sector Climate Change Agreement – voluntary initiative enabling reductions in Climate Change Levy on energy costs 7. Beverage Industry Environmental Roundtable (BIER) – provides spirits water benchmarking and carbon footprints
The initiatives and resources identified offer a range of potential business benefits, including: best practice guidance; knowledge sharing; innovation ideas; standards development; input or process certification; sustainability benchmarking; and communication.
2,3,7 2,3 1,3,7
4,7 4
4 6,7 6 5,6
4
Introduction Opportunities Hotspots Resources Help
Submit feedback
The documents below have been used to identify primary and secondary environmental impact hotspots
Hotspot references 1. BIER (2011). A Practical Perspective on Water Accounting in the Beverage Sector [PDF].
2. BIER (2012). Research on the Carbon Footprint of Spirits [PDF].
3. BIER (2012). Water use benchmarking in the beverage industry [PDF]
4. British Glass, (2007). Glass Sustainability Report [PDF].
5. C-Tech Innovation Ltd, (2004). UK Food and Drink Processing - Mass Balance [PDF].
6. Enviros, (2003). Glass Recycling – Life Cycle Carbon Dioxide Emissions [PDF].
7. Garnett, T., (2007). The Alcohol We Drink and its Contribution to the UK‟s Greenhouse Gas Emissions. A discussion Paper [PDF].
8. Just Drink, (2012). Sustainability in Spirits - Part I
9. Scotch Whisky Association, (2006), The Life Cycle Assessment of Scotch Whisky
10. WRAP (2006). Colourite Project – Maximising Cullet additions in glass container industry.
11. WRAP (2009). Down the drain [PDF]
12. WRAP (2011). Drinks Resource Maps [PDF]
13. WRAP (2013). An initial assessment of the environmental impact of grocery products [PDF]
14. WRAP (n.d.). Clean-In-Place
15. WRAP (n.d.). Effluent Segregation [PDF]
16. WRAP (n.d.). Understanding the recycled content of glass [PDF].
17. WRAP (n.d.). Resource efficiency in the UK gin and Vodka sector.
18. WRAP (n.d.). Resource efficiency in the UK whisky sector
19. WRAP (n.d.). Reducing Fill Losses
20. WRAP (n.d.). Overproduction
21. WRAP (n.d.). Organic Arisings
22. WRAP (n.d.). Product losses
23. WRAP (n.d.). Water use in the drinks supply chain: Opportunity for reduction [PDF]
24. Zero Waste Scotland (2011). Zero Waste Scotland helps whisky industry identify potential savings
Introduction Opportunities Hotspots Resources Help
Submit feedback
Reduction opportunities The PSF has researched a selection of „reduction opportunities‟, „action plans and topic guides‟ relevant to the grocery sector. Below are a selection relevant to spirits. Follow the links to find out more about each opportunity. For a full list of resources available see the Help section. While many of the opportunities are not tailored specifically to spirits – the principles and resources are transferable. Where they target a hotspot they are flagged red.
• Addressing 'green water' impacts in agriculture • Drinks packaging optimisation • Renewable packaging materials • Clean in place (CIP) best practice for resource
efficiency • Water efficiency in drinks manufacture • Water re-use in food and drink processing • Reducing consumer food waste
Hotspot
Reduction opportunities • How to participate in the closed loop economy through waste
exchange
• Refrigeration best practice in food and drink chill chains
Action plans
Topic guides • Best practice in embedding sustainability in product design
• Effective commissioning of LCAs/footprint studies
• Engaging suppliers on sustainability
Submit feedback
Introduction Opportunities Hotspots Resources Help

Addressing ‘green water’ Product sustainability opportunity Green water is defined as “the precipitation on land that does not run off or recharge the groundwater but is stored in the soil or temporarily stays on top of the soil or vegetation” – i.e. soil infiltration (1). To date, water initiatives have tended to focus on blue water impacts (surface and groundwater abstracted), but green water is a major component of
food water footprints, e.g. 94% of beef‟s water footprint (1). Rain-fed agriculture represents 80% of cultivated lands (1.2bn ha) and 85% of global agricultural water usage. An effective approach is improved soil management.
Other key resources & initiatives 1. Water Footprint Network – for definitions of water categories and a feel for priority products/countries 2. Green Water Management Handbook – a comprehensive review of technologies available for addressing green water impacts 3. Global Water Tool – free and easy-to-use tool for companies to map their water use from WBCSD 4. Protecting our Water, Soil and Air – Defra‟s best practice guide for water, soil and air quality 5. Resources available to businesses to quantify and reduce the water impacts of their water use – Defra report 6. Simply Sustainable Water – advice from LEAF on Six Simple Steps for managing water quality & use
Effective green water management Case study – Zambia
In Zambia, like a lot of arid/semi-tropical regions, only 15-30% of rainfall contributes directly towards plant growth. Digging holes filled with organic matter to collect rainfall and tearing up the soil to increase soil infiltration has led to yield increases of 50-100% (2). In the UK, green water yield improvements can be effected through increasing soil organic matter (see Soil Management Reduction Opportunity).
Addressing green water impacts has potential for yield improvements through increasing effective rainfall (2): • Reducing runoff through levelling and terracing • Increasing infiltration through conservation tillage • Minimising deep percolation by improving soil texture
and deep root zone • Planning cropping patterns around rainfall patterns Increasing yield has the added benefits of reducing other external inputs like inorganic fertilisers per unit of output – and so has potential to improve other PSF metrics as well.
Hotspot
Submit feedback
Introduction Opportunities Hotspots Resources Help

Drinks packaging optimisation Product sustainability opportunity
The key business drivers for addressing packaging sustainability include the increasing cost of raw materials and concerns over security of supply. Common approaches include: use of recycled content; packaging weight reductions; reusable systems; and clearer date labelling.
Other key resources & initiatives
1. Beverage Industry Environment Roundtable (BIER) – climate change, energy & water focus. Published carbon and water research 2. British Soft Drinks Association – Sustainability Strategy includes focus on water, packaging & waste 3. Consumer Goods Forum Global Packaging Project – protocol & framework to discuss & assess packaging sustainability 4. Courtauld Commitment – responsibility agreement aimed at improving resource efficiency of UK grocery, including packaging
5. Soft Drinks Roadmap – Defra-funded research currently under way, includes focus on packaging 6. WRAP Packaging optimisation resources – range of advice on packaging issues, with case studies and tools
Step 1: Think about breaking the mould - can the product be used by the customer differently? (See WRAP guidance on Reusables and Product Reformulation) Step 2: Get ideas from The International Packaging Study Step 3: Read the WRAP Packaging and Recyclability Guide Step 4: Visit the Resource Efficient Innovations Database for latest industrial technology and best practices Step 5: Make it happen – stay close to what your sector is doing: view case studies under Courtauld Commitment 2
How to get started
Case study – A G Barr
Since joining the Courtauld Commitment 2 in Feb 2010, A G Barr has installed state of the art PET bottle blowing & filling technology. This allowed the company to reduce the carbon impact of its 2l, 500ml and 250ml bottles by 1,869tCO2e in 2010, saving 505 tonnes of plastic. The 500ml and 250ml bottles alone saved 316 tonnes of plastic, and are amongst the lightest within the carbonated soft drinks market.
Hotspot
Submit feedback
Introduction Opportunities Hotspots Resources Help
Renewable packaging materials Product sustainability opportunity
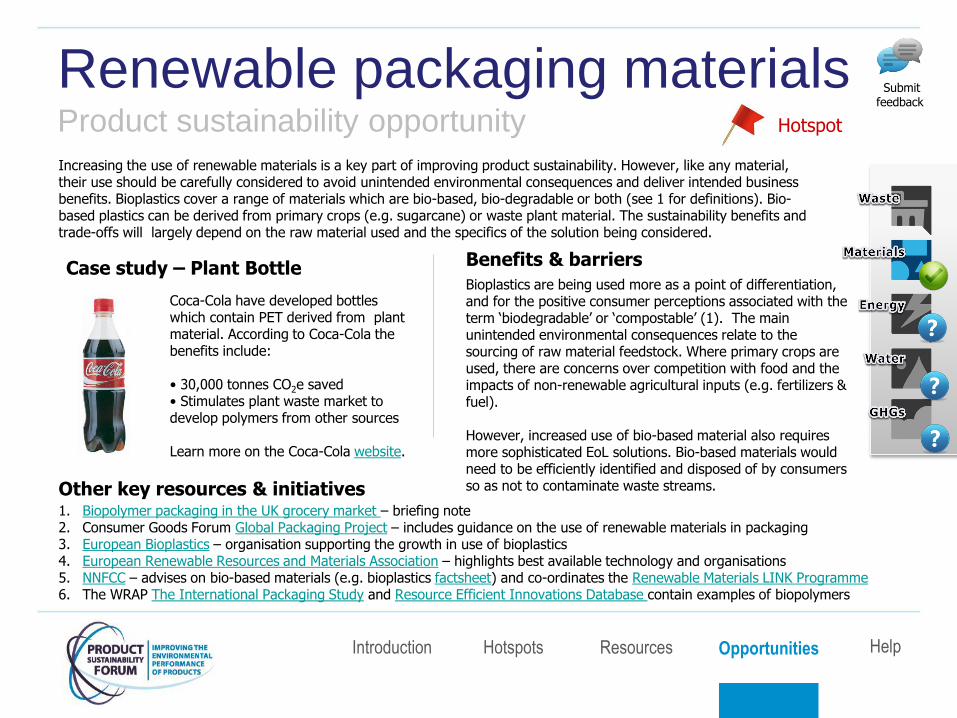
Increasing the use of renewable materials is a key part of improving product sustainability. However, like any material, their use should be carefully considered to avoid unintended environmental consequences and deliver intended business benefits. Bioplastics cover a range of materials which are bio-based, bio-degradable or both (see 1 for definitions). Bio-based plastics can be derived from primary crops (e.g. sugarcane) or waste plant material. The sustainability benefits and trade-offs will largely depend on the raw material used and the specifics of the solution being considered.
Other key resources & initiatives 1. Biopolymer packaging in the UK grocery market – briefing note 2. Consumer Goods Forum Global Packaging Project – includes guidance on the use of renewable materials in packaging 3. European Bioplastics – organisation supporting the growth in use of bioplastics 4. European Renewable Resources and Materials Association – highlights best available technology and organisations 5. NNFCC – advises on bio-based materials (e.g. bioplastics factsheet) and co-ordinates the Renewable Materials LINK Programme 6. The WRAP The International Packaging Study and Resource Efficient Innovations Database contain examples of biopolymers
Bioplastics are being used more as a point of differentiation, and for the positive consumer perceptions associated with the term „biodegradable‟ or „compostable‟ (1). The main unintended environmental consequences relate to the sourcing of raw material feedstock. Where primary crops are used, there are concerns over competition with food and the impacts of non-renewable agricultural inputs (e.g. fertilizers & fuel). However, increased use of bio-based material also requires more sophisticated EoL solutions. Bio-based materials would need to be efficiently identified and disposed of by consumers so as not to contaminate waste streams.
Benefits & barriers Case study – Plant Bottle
Coca-Cola have developed bottles which contain PET derived from plant material. According to Coca-Cola the benefits include: • 30,000 tonnes CO2e saved • Stimulates plant waste market to develop polymers from other sources Learn more on the Coca-Cola website.
Hotspot
Submit feedback
Introduction Opportunities Hotspots Resources Help
CIP for resource efficiency Product sustainability opportunity
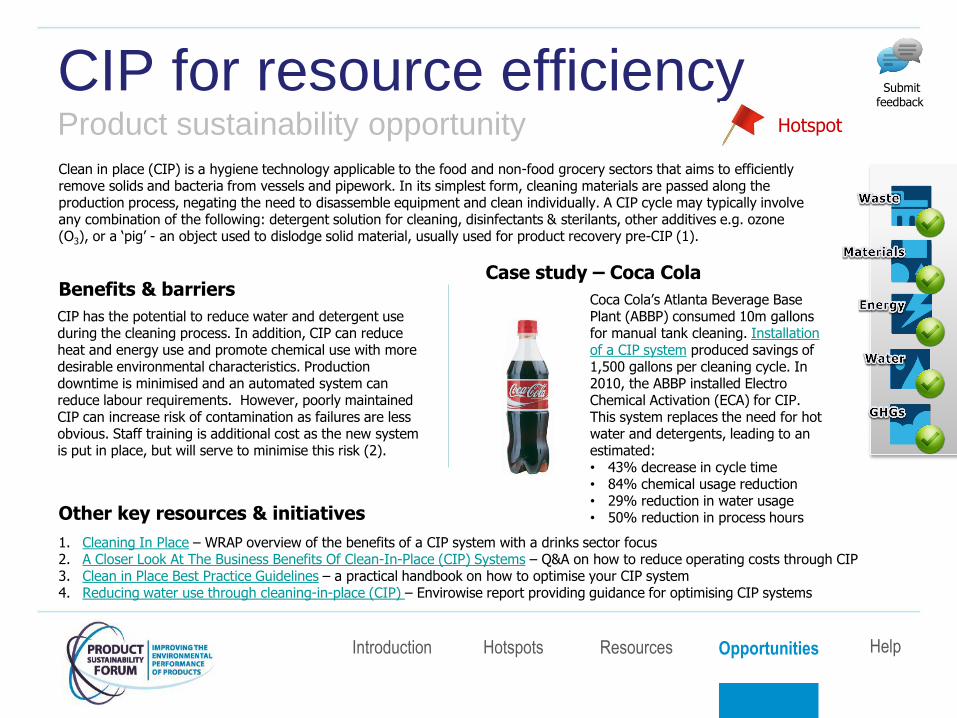
Clean in place (CIP) is a hygiene technology applicable to the food and non-food grocery sectors that aims to efficiently remove solids and bacteria from vessels and pipework. In its simplest form, cleaning materials are passed along the production process, negating the need to disassemble equipment and clean individually. A CIP cycle may typically involve any combination of the following: detergent solution for cleaning, disinfectants & sterilants, other additives e.g. ozone (O3), or a „pig‟ - an object used to dislodge solid material, usually used for product recovery pre-CIP (1).
Other key resources & initiatives
1. Cleaning In Place – WRAP overview of the benefits of a CIP system with a drinks sector focus 2. A Closer Look At The Business Benefits Of Clean-In-Place (CIP) Systems – Q&A on how to reduce operating costs through CIP 3. Clean in Place Best Practice Guidelines – a practical handbook on how to optimise your CIP system 4. Reducing water use through cleaning-in-place (CIP) – Envirowise report providing guidance for optimising CIP systems
CIP has the potential to reduce water and detergent use during the cleaning process. In addition, CIP can reduce heat and energy use and promote chemical use with more desirable environmental characteristics. Production downtime is minimised and an automated system can reduce labour requirements. However, poorly maintained CIP can increase risk of contamination as failures are less obvious. Staff training is additional cost as the new system is put in place, but will serve to minimise this risk (2).
Benefits & barriers Case study – Coca Cola
Coca Cola‟s Atlanta Beverage Base Plant (ABBP) consumed 10m gallons for manual tank cleaning. Installation of a CIP system produced savings of 1,500 gallons per cleaning cycle. In 2010, the ABBP installed Electro Chemical Activation (ECA) for CIP. This system replaces the need for hot water and detergents, leading to an estimated: • 43% decrease in cycle time • 84% chemical usage reduction • 29% reduction in water usage • 50% reduction in process hours
Hotspot
Submit feedback
Introduction Opportunities Hotspots Resources Help
Water efficiency in drinks manufacture Product sustainability opportunity
The four most water intensive industries within the food & drink sector are dairies, breweries, soft drink & distilleries accounting for 124.5million m3 per year. In the EU the UK ranks 3rd poorest in terms of water availability per head. Additionally, in line with the increasing cost of water to business, a 20% reduction in water use would save the F&D sector £60million per year. WRAP suggest that it is possible to reduce water use by 30% through no-cost initiatives and up to 50% saving for those prepared to make a capital cost investment.
Other key resources & initiatives
1. Beverage Industry Environmental Roundtable (BIER) – has published risks & opportunities and water use benchmarking reports 2. Enhanced Capital Allowance scheme for water – allows businesses to write-off 100% cost of plant machinery against taxable profits 3. Federation House Commitment Progress Report 2012 – helping the food & drink industry improve water efficiency 4. Water Use in the Supply Chain – the IGD details water use within the F&D sector 5. WRAP has produced Water Efficiency. Case study: UK Drinks Sector & Resource Efficiency in the UK Soft Drink Sector
Reducing the amount of water brought onto site & lowering wastewater treatment requirements can reduce operating costs. Water scarcity might impact availability and cost, although tools can highlight business risk. Tax Incentive Schemes can mitigate the investment in water efficiency measures, although no cost initiatives are highlighted by WRAP. A lack of data can hamper the decision making process as well as a fear of reducing product quality.
Benefits & barriers
Hotspot
Submit feedback
Introduction Opportunities Hotspots Resources Help
Case study - Adnams
Adnams produces 85,000 barrels of cask ale per year, whilst being based in East Anglia, the UK‟s driest region. During planned redevelopment, Adnams upgraded their on-site water efficiency measures, lowering their water use below the industry average by: • Using stainless steel in brewery
construction which is easier to clean
• Harvesting rainwater for use at distribution
center and cellar & kitchen store
• Balancing effluent to require less dilution
to become safe waste
Through the optimisation of clean-in-place systems and the re-use of production waste water, a Kraft site has achieved reductions in potable water use (4): • 4 year project • Invested AUS$3.2million • Avg. payback: 3 years • 39% reduction in water use • Savings of 74 million litres per year The site has also partnered with a construction group to re-use 10million litres of water per year for road compaction and dust compression turning waste water into a secondary commodity.
Water re-use in F&D processing Product sustainability opportunity Food & drink manufacturing used 7.5% of industrial water consumed in the UK in 2009 (1). Water is typically used for cleaning and sterilising machinery and working environments, but is also used for transportation or used as an ingredient (particularly in alcoholic and non-alcoholic drinks) (2). One of the main drivers for water use reduction is concern for future water scarcity.
Other key resources & initiatives
1. Greener Business. Food and Drink – Environment Agency overview of the environmental impacts of the F&D sector 2. Federation House Commitment – voluntary initiative aiming to help industry target of cutting water use by 20% by 2020 3. Casani, S., et al. 2005. A Discussion Paper on Challenges and Limitations to Water Re-use and Hygiene in the Food industry 4. Saving Water Makes Us Happy Little Vegemites – document detailing Kraft water savings at their Port Melbourne site 5. Beverage Industry Environmental Roundtable (BIER) – supporting environmental engagement through meetings and working groups 6. Manufacturing Introduction – introduction to manufacturing water use written by the Alliance For Water Efficiency 7. CDP Water Program – good resource for company water reports and case studies
Reducing water use decreases initial outlay of water costs and reduces the volume, and associated costs, of wastewater leaving a processing site. Additional savings of time, energy and chemical outlay can be made through the decreased need to pre-treat as much water. Uncontaminated water, e.g. cooling water, can be re-used for irrigation, sanitary water supply, line lubrication, facilities maintenance, further cooling/heating or other cleaning processes. A key barrier to increased water re-use in the F&D sector is hygiene – although this issue can be an overcome with adherence to strict hygiene procedures (3).
Benefits & barriers
Submit feedback
Case study – Kraft
Hotspot
Submit feedback
Introduction Opportunities Hotspots Resources Help
Reducing consumer food waste Product sustainability opportunity
In the UK, 7.2 million tonnes of food and drink is wasted every year, 4.4 million of which is avoidable. The average UK household currently spends £480 on wasted food every year, totalling £12 billion overall. WRAP reported a significant reduction between 2006/7 and 2010 (13%) (1) but a range of opportunities exist for retailers and manufacturers to help further reduce this waste, and deliver significant financial (for customers) and environmental benefits.
Other key resources & initiatives
1. Household food waste resource listing – summary of WRAP partner resources to use to reduce household food and drink waste 2. Courtauld Commitments Phase Two Case Studies November 2012 – WRAP report providing a list of useful case studies 3. Love Food Hate Waste partners site – wide range of resources available for partners to use free of charge 4. New estimates for household food and drink waste in the UK – WRAP report providing food waste estimates for 2011 5. What retailers and brands are doing to help you reduce food waste – Love Food Hate Waste report
Raising awareness and enabling behaviour change
Case studies: Changes to products
Changes to products, packaging and labelling makes it easier for consumers to buy the right amount and use what they buy. • M&S were the first to introduce „freeze
before the date‟ labelling, replacing „freeze on day of purchase‟, giving consumers more flexibility to freeze what they may not eat in time.
• „Display until‟ dates are being removed by many retailers and brands, reducing confusion and giving prominence to the important dates.
• ASDA launched new packaging for their extra special Royal Jersey potatoes that increases shelf life and reduces waste
A combination of large-scale campaigns and local engagement is an effective way to help consumers realise the benefits of throwing away less food, and giving them the tools and confidence to make small changes to the way they shop, store and cook food. Morrisons Great Taste Less Waste had regular articles in their magazine and on-line tips and advice, whilst Sainsbury‟s Make your roast go further campaign provided its customers with leftover recipes designed to incorporate key ingredients from a roast. The Co-op regularly includes Love Food Hate Waste messages on till-screens, reaching millions of customers in store.
Hotspot
Submit feedback
Introduction Opportunities Hotspots Resources Help
Participating in waste exchange Action Plan All businesses produce waste that they cannot reduce further, re-use in their processes or send for recycling. For manufacturers, distributors and retailers involved with grocery products 5 million tonnes of food product related waste (excluding packaging) is sent to landfill each year(1). Establishing a mutually beneficial waste exchange arrangement with other organisations can reduce waste, material and processing costs and impacts. This may include involvement in food redistribution projects, supplying food waste and by-product materials for recycling or equipment and material reuse schemes.
Resources 1. WRAP - Waste arisings in the supply of food and drink to households in the UK 2. DEFRA - Guidance on the legal definition of waste and its application - a practical guide for businesses and other organisations 3. SEPA - Is It Waste - Understanding the definition of waste and supplementary guidance 4. WRAP - How to apply date labels to help prevent food waste 5. Environment Agency - A guide to when electrical and electronic equipment is considered waste and the controls that apply 6. WRAP - Workforce partnerships for resource efficiency
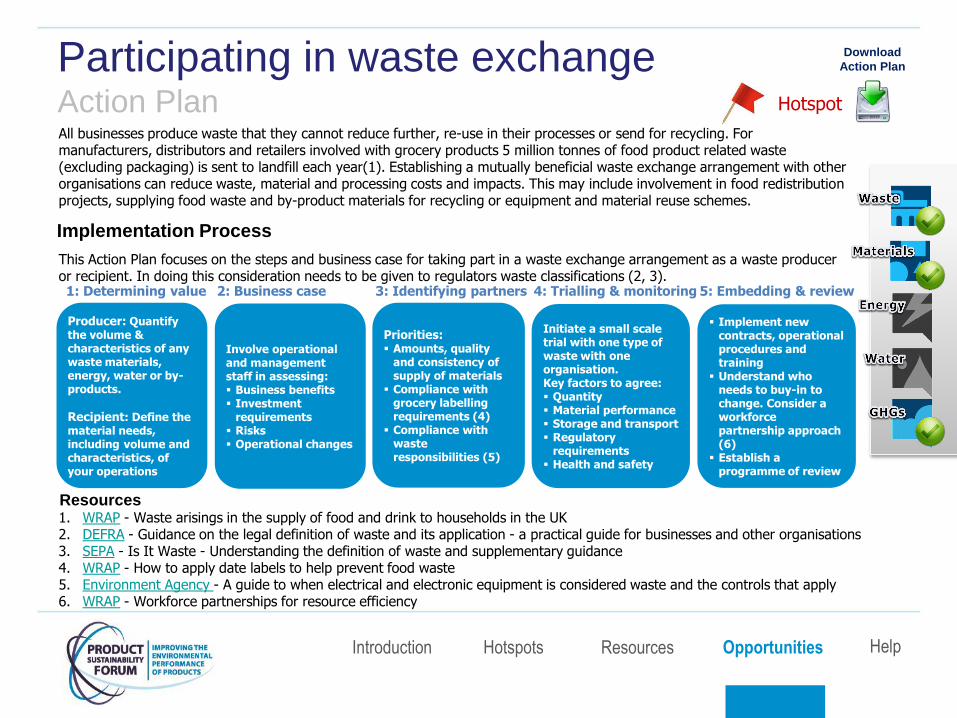
Implementation Process
This Action Plan focuses on the steps and business case for taking part in a waste exchange arrangement as a waste producer or recipient. In doing this consideration needs to be given to regulators waste classifications (2, 3).
Introduction Opportunities Hotspots Resources Help
Download
Action Plan
2: Business case 3: Identifying partners 4: Trialling & monitoring 5: Embedding & review 1: Determining value
Initiate a small scale trial with one type of waste with one organisation. Key factors to agree: Quantity Material performance Storage and transport Regulatory
requirements Health and safety
Producer: Quantify the volume & characteristics of any waste materials, energy, water or by-products.
Recipient: Define the material needs, including volume and characteristics, of your operations
Involve operational and management staff in assessing: Business benefits Investment
requirements Risks Operational changes
Priorities: Amounts, quality
and consistency of supply of materials
Compliance with grocery labelling requirements (4)
Compliance with waste responsibilities (5)
Implement new contracts, operational procedures and training
Understand who needs to buy-in to change. Consider a workforce partnership approach (6)
Establish a programme of review
Hotspot

Optimising refrigeration Action Plan Refrigeration is a crucial utility used in the grocery supply chain, in particular in manufacturing, transport, bulk storage and retail. In terms of energy use and CO2e emissions, refrigeration is the most important utility in food and drink manufacturing and retail operations. This action plan addresses the management, operation, maintenance and design of refrigeration systems so you can benefit from significant cost savings as well as large reductions in CO2e emissions.
Resources
1. Defra and SKM Enviros, 2011 - Examination of the global warming potential of refrigeration in the food chain 2. FDF and others, 2007 - Food and Drink Industry Refrigeration Efficiency Initiative 3. IOR, BRA, Carbon Trust, 2010 - Refrigeration road map for the food retail sector
Saving Potential
Introduction Opportunities Hotspots Resources Help
Download
Action Plan
Refrigerant
GHG
emissions
Energy
Existing
Systems 50% 25%
New
Systems >90% 40%
Implementation Process
Improve Management Information Cooling loads, energy use, operating data, leak rates
Invest in existing refrigeration plants Leakage: replace leaky components, replace R404A Energy: better maintenance, operation and control
Careful selection of all new refrigeration plants Minimise cooling demand and design for high efficiency Use low GWP refrigerants and design for low leakage

Proposal/ briefing
Product design
Production Launch Post-
launch review
Embedding sustainability in product design Topic Guide Over 80% of all product-related environmental impacts can be influenced during the design phase, presenting an opportunity for designers to adopt more sustainable practices and in turn contribute towards lower impact products and services. The challenge is to incorporate sustainable design principles into R&D processes, and to embed Ecodesign principles within the business sustainability strategy and brand positioning considerations.
The business benefit include cost reductions, brand and reputation enhancement. This approach may also meet future customer demand for products and services with reduced environmental impacts.
Resources
1. Defra sustainable product roadmaps – life cycle assessments, research and initiatives to improve environmental impact of products 2. WRAP circular economy – research and information on the circular economy (recapture & reuse of resources) 3. Eco SME – resources on Ecodesign for small businesses 4. Centre for Sustainable Design Ecodesign Strategy Wheel – Ecodesign consultancy for business 5. Eco3 Design consultancy – integrating Ecodesign into R&D
Implementation Process
This Topic Guide focuses on how to adapt conventional design into Ecodesign, starting with R&D. Embedding Ecodesign encompasses five main stages:
1) Identify design improvements
2) Compare design alternatives
3) Set Ecodesign strategy
4) Develop communications plan
5) Pilot and review of programme
Download
Topic Guide
Identify
design
improvements
– review
products in
context of
sustainability
strategy
Comparison
of design
alternatives –
develop new
products or
make changes
to existing
products
Ecodesign
strategy
setting –
agree
principles
aligned to
strategy
Communicate
environmental
benefits of
products
Pilot and
embed
programme.
Review and
feedback on
process
Introduction Opportunities Hotspots Resources Help
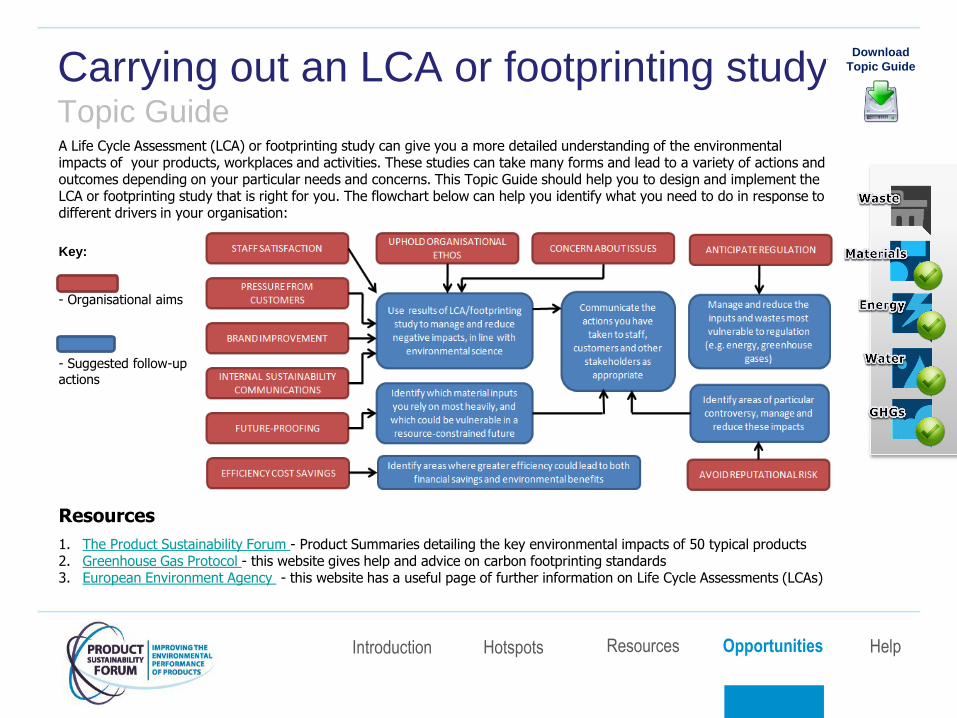
Key:
- Organisational aims
- Suggested follow-up actions
Carrying out an LCA or footprinting study Topic Guide A Life Cycle Assessment (LCA) or footprinting study can give you a more detailed understanding of the environmental impacts of your products, workplaces and activities. These studies can take many forms and lead to a variety of actions and outcomes depending on your particular needs and concerns. This Topic Guide should help you to design and implement the LCA or footprinting study that is right for you. The flowchart below can help you identify what you need to do in response to different drivers in your organisation:
Resources
1. The Product Sustainability Forum - Product Summaries detailing the key environmental impacts of 50 typical products 2. Greenhouse Gas Protocol - this website gives help and advice on carbon footprinting standards 3. European Environment Agency - this website has a useful page of further information on Life Cycle Assessments (LCAs)
Introduction Opportunities Hotspots Resources Help
Download
Topic Guide
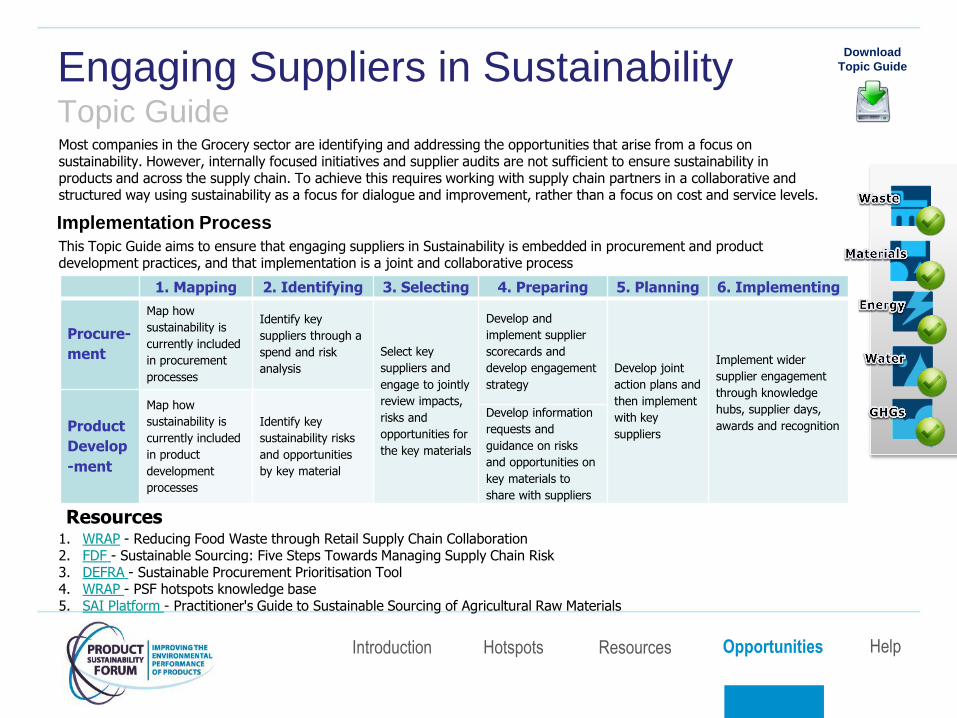
Engaging Suppliers in Sustainability Topic Guide Most companies in the Grocery sector are identifying and addressing the opportunities that arise from a focus on sustainability. However, internally focused initiatives and supplier audits are not sufficient to ensure sustainability in products and across the supply chain. To achieve this requires working with supply chain partners in a collaborative and structured way using sustainability as a focus for dialogue and improvement, rather than a focus on cost and service levels.
Resources 1. WRAP - Reducing Food Waste through Retail Supply Chain Collaboration 2. FDF - Sustainable Sourcing: Five Steps Towards Managing Supply Chain Risk 3. DEFRA - Sustainable Procurement Prioritisation Tool 4. WRAP - PSF hotspots knowledge base 5. SAI Platform - Practitioner's Guide to Sustainable Sourcing of Agricultural Raw Materials
Implementation Process
This Topic Guide aims to ensure that engaging suppliers in Sustainability is embedded in procurement and product development practices, and that implementation is a joint and collaborative process
Introduction Opportunities Hotspots Resources Help
Download
Topic Guide
1. Mapping 2. Identifying 3. Selecting 4. Preparing 5. Planning 6. Implementing
Procure-
ment
Map how
sustainability is
currently included
in procurement
processes
Identify key
suppliers through a
spend and risk
analysis
Select key
suppliers and
engage to jointly
review impacts,
risks and
opportunities for
the key materials
Develop and
implement supplier
scorecards and
develop engagement
strategy
Develop joint
action plans and
then implement
with key
suppliers
Implement wider
supplier engagement
through knowledge
hubs, supplier days,
awards and recognition
Product
Develop
-ment
Map how
sustainability is
currently included
in product
development
processes
Identify key
sustainability risks
and opportunities
by key material
Develop information
requests and
guidance on risks
and opportunities on
key materials to
share with suppliers
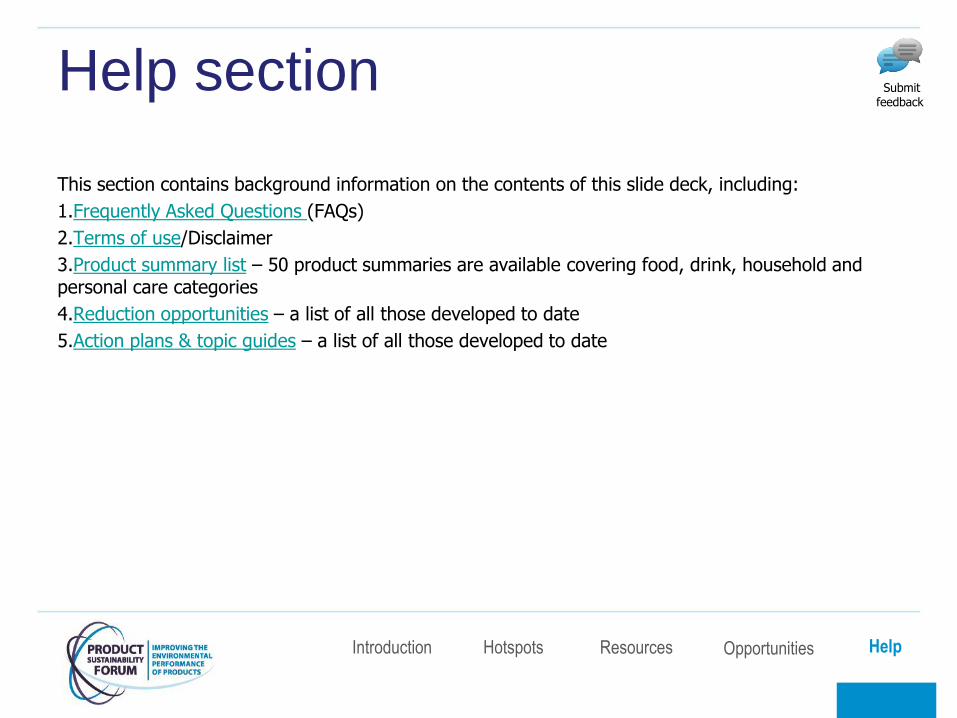
Help section
This section contains background information on the contents of this slide deck, including:
1.Frequently Asked Questions (FAQs)
2.Terms of use/Disclaimer
3.Product summary list – 50 product summaries are available covering food, drink, household and personal care categories
4.Reduction opportunities – a list of all those developed to date
5.Action plans & topic guides – a list of all those developed to date
Introduction Opportunities Hotspots Resources Help
Submit feedback
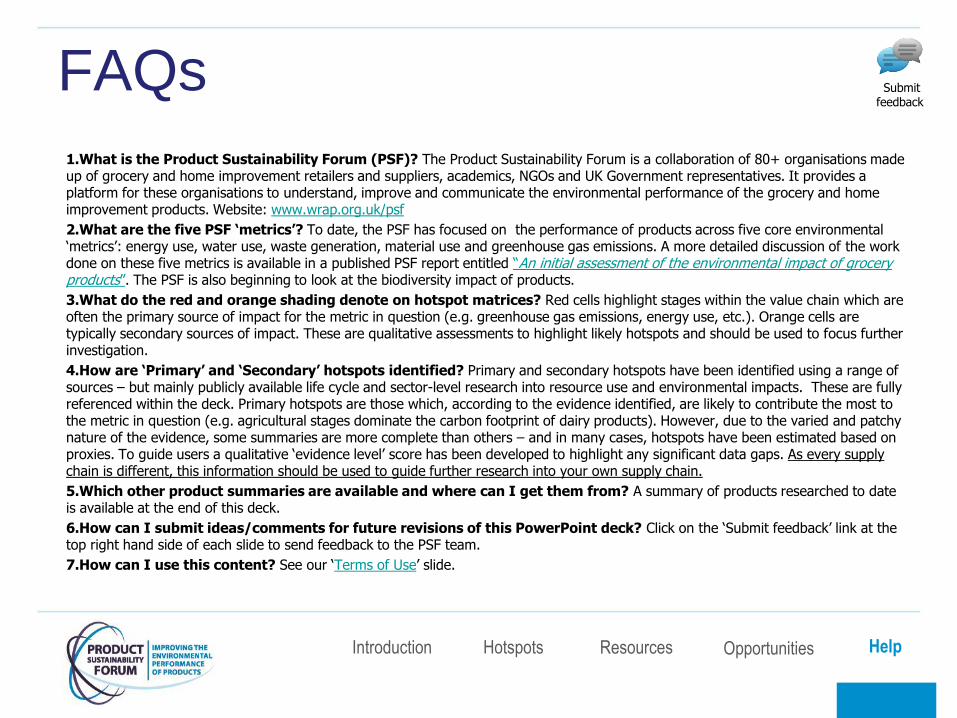
FAQs
1.What is the Product Sustainability Forum (PSF)? The Product Sustainability Forum is a collaboration of 80+ organisations made up of grocery and home improvement retailers and suppliers, academics, NGOs and UK Government representatives. It provides a platform for these organisations to understand, improve and communicate the environmental performance of the grocery and home improvement products. Website: www.wrap.org.uk/psf
2.What are the five PSF ‘metrics’? To date, the PSF has focused on the performance of products across five core environmental „metrics‟: energy use, water use, waste generation, material use and greenhouse gas emissions. A more detailed discussion of the work done on these five metrics is available in a published PSF report entitled “An initial assessment of the environmental impact of grocery products”. The PSF is also beginning to look at the biodiversity impact of products.
3.What do the red and orange shading denote on hotspot matrices? Red cells highlight stages within the value chain which are often the primary source of impact for the metric in question (e.g. greenhouse gas emissions, energy use, etc.). Orange cells are typically secondary sources of impact. These are qualitative assessments to highlight likely hotspots and should be used to focus further investigation.
4.How are ‘Primary’ and ‘Secondary’ hotspots identified? Primary and secondary hotspots have been identified using a range of sources – but mainly publicly available life cycle and sector-level research into resource use and environmental impacts. These are fully referenced within the deck. Primary hotspots are those which, according to the evidence identified, are likely to contribute the most to the metric in question (e.g. agricultural stages dominate the carbon footprint of dairy products). However, due to the varied and patchy nature of the evidence, some summaries are more complete than others – and in many cases, hotspots have been estimated based on proxies. To guide users a qualitative „evidence level‟ score has been developed to highlight any significant data gaps. As every supply chain is different, this information should be used to guide further research into your own supply chain.
5.Which other product summaries are available and where can I get them from? A summary of products researched to date is available at the end of this deck.
6.How can I submit ideas/comments for future revisions of this PowerPoint deck? Click on the „Submit feedback‟ link at the top right hand side of each slide to send feedback to the PSF team.
7.How can I use this content? See our „Terms of Use‟ slide.
Introduction Opportunities Hotspots Resources Help
Submit feedback
Terms of use
While we have tried to make sure this slide deck is accurate, we cannot accept responsibility or be held legally responsible for any loss or damage arising out of or in connection with this information being inaccurate, incomplete or misleading. This material is copyrighted. You can copy it free of charge as long as the material is accurate and not used in a misleading context. You must identify the source of the material and acknowledge our copyright. You must not use material to endorse or suggest we have endorsed a commercial product or service. For more details please see our terms and conditions on our website at www.wrap.org.uk.
Introduction Opportunities Hotspots Resources Help
Submit feedback
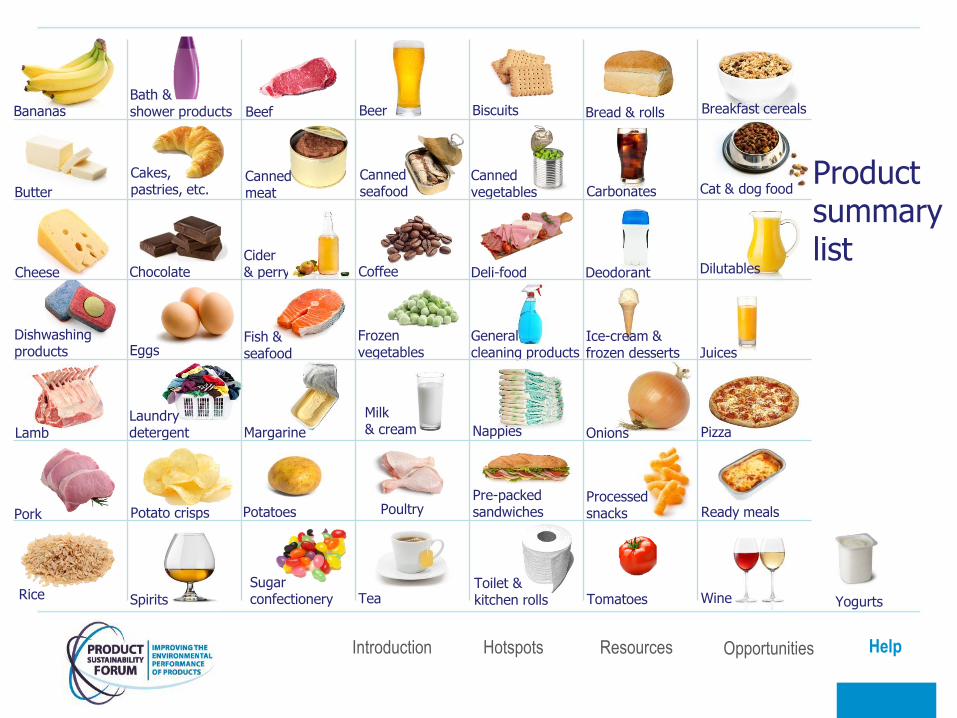
Product summary list
Bananas Bath & shower products Beef Biscuits Bread & rolls Breakfast cereals
Butter
Cakes, pastries, etc.
Canned meat
Coffee
Canned vegetables Carbonates Cat & dog food
Cheese Chocolate Cider & perry Deli-food Deodorant
Nappies
Dishwashing products
Fish & seafood
Frozen vegetables
General cleaning products
Ice-cream & frozen desserts
Lamb Margarine
Pork Potato crisps Potatoes Poultry Pre-packed sandwiches Ready meals
Rice Spirits
Sugar confectionery Tea
Toilet & kitchen rolls Tomatoes
Processed snacks
Yogurts
Dilutables
Beer
Laundry detergent
Eggs
Wine
Juices
Onions Pizza
Canned seafood
Milk & cream
Introduction Opportunities Hotspots Resources Help

Reduction opportunity list
• Addressing „green water‟
• Benefits of soil management
• Crop irrigation best practice
• Precision agriculture
• Rolling out agricultural GHG tools
• Sourcing palm oil responsibly
• Sugar crop sustainability
• Sustainable fisheries & aquaculture
• Sustainable forestry products
• Water efficiency in livestock farming
• Closed-loop recycling
• Drinks packaging optimisation
• Renewable packaging materials
• Boiler energy efficiency in F&D
• CIP for resource efficiency
• Identifying the true cost of waste
• Increased efficiency of in-store bakeries
• Increasing motor drive efficiency
• Product re-formulation
• Water efficiency in drinks manufacture
• Water efficiency in meat processing
• Water re-use in F&D processing
• Extending product shelf life
• Food redistribution
• Shared logistics opportunities
• Improving consumer portioning
• Reducing kitchen energy use
• Reducing consumer food waste
• Water efficiency in the home
• Capital allowance for green tech
Introduction Opportunities Hotspots Resources Help
Submit feedback
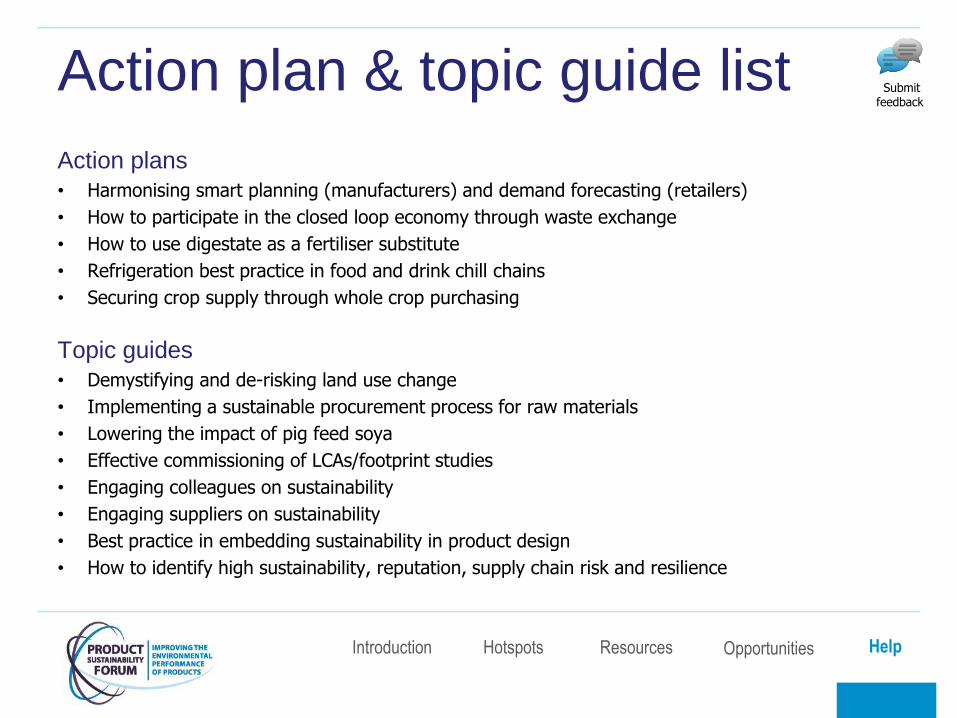
Action plan & topic guide list
Action plans
• Harmonising smart planning (manufacturers) and demand forecasting (retailers)
• How to participate in the closed loop economy through waste exchange
• How to use digestate as a fertiliser substitute
• Refrigeration best practice in food and drink chill chains
• Securing crop supply through whole crop purchasing
Topic guides
• Demystifying and de-risking land use change
• Implementing a sustainable procurement process for raw materials
• Lowering the impact of pig feed soya
• Effective commissioning of LCAs/footprint studies
• Engaging colleagues on sustainability
• Engaging suppliers on sustainability
• Best practice in embedding sustainability in product design
• How to identify high sustainability, reputation, supply chain risk and resilience
Introduction Opportunities Hotspots Resources Help
Submit feedback