hotels in india – trends & opportunities hospitality services 1 hotels in india – trends...
TRANSCRIPT

HVS Hospitality Services 1
HOTELS IN INDIA – TRENDS & OPPORTUNITIES
2009 Edition
This edition has been published by the New Delhi office of HVS. www.hvs.com
0
100
200
300
400
2001/02 2002/03 2003/04 2004/05 2005/06 2006/07
Nu
mb
er
of
Ro
om
s (
00
’s)
0
100
200
300
400
Nu
mb
er
of
Ho
tels
Introduction
HVS has now been at the forefront of providing hospitality services in India for 13 years. After observing two economic downturns and a historical growth period, we are in a position to offer a unique perspective on the cyclical nature of the hospitality industry as well as the process of recovery.
The Trends & Opportunities report assesses key trends in market performance of major Indian cities and also presents HVS' outlook of the market's performance in the near future. In addition, it outlines opportunities in the hospitality industry of specific interest to investors, developers, as well as hotel operators. The report is generated after analysis of the results of the Trends & Opportunities Survey conducted by HVS annually; the survey collates data re lated to key hotel operat ional characteristics. This year, a record 349 hotels having a total room count of 42,425 (rounded off to 42,400) rooms participated in the survey: an increase of 27 new hotels and approximately 1,785 rooms since the last survey. When we started collecting data for this market in 1995/96, only 120 hotels with a total of 18,160 rooms participated in the survey. The increase in the number of respondents over the years demonstrates both HVS' penetration into the market as well as the size of the market.
Table 1 illustrates survey participation from the years 2001/02 to 2008/09, with 1995/96 being the base year for the surveys.
The financial year 2008/09 was an unforgettable one for the Indian tourism industry with the Mumbai terror attacks and the global economic downturn affecting the industry's performance. The hotel industry, too, observed an overall decline in occupancy and revenue per available room (RevPAR) in most cities in India. We have provided detailed information about Occupancy, Average Rates, and RevPAR in major Indian cities for the past 14 years (refer to Tables 4 to 12).
Mumbai reported the largest RevPAR decline of 20.1% for 2008/09 amongst the major cities in India. This was due to the Mumbai terror attacks, which catapulted across the international firmament as the electronic media beamed live images of the Taj going up in flames; even earning the dubious distinction of being 'India's 9/11'. The event raised concerns in the minds of international travellers regarding India's worthiness as a safe and secure travel destination.
Despite the Occupancy and RevPAR declines in most cities, we note that the global downturn that started in the US did
not have a very drastic impact on the Indian real estate market. With the bursting of the housing bubble, the real estate market came to a standstill in the US towards the latter half of 2008 as hardly any transactions took place due to market uncertainty and drop in investor confidence. Many hotels in the US saw and continue to see foreclosures with real estate companies filing for bankruptcy. Though in India the real estate market did not see as much of a downfall as that in the US, the market saw a correction in prices. This was more so in the case of projects under construction. Developers struggled to pay the high debts they had taken in the hope of pre-selling assets before or during construction. However, there was some relief for these developers as the prices of labour and construction materials declined towards the end of 2008/09.
Another respite for investors and owners of hotels comes through the Guidelines on commercial real estate (CRE) exposures, released recently by the Reserve Bank of India (RBI). According to this, bank finance to developers of infrastructure facilities in special economic zones (SEZs) would be classified as infrastructure lending, against its 2006 ruling that classified these as CRE exposures. This enables the availability of cheaper loans as compared to the practice of treating the loans at 100% risk level for which they have a 9% capital adequacy ratio. In non-CRE projects, the risk weight would vary according to the ratings of the borrower or that of the project [for which the loan is being sanctioned], thus ultimately lowering the lending rates from banks in the case of a well-rated borrower. This norm could start a trend whereby we witness more investors partnering with well-known international and domestic brands to lower the risk weight of the project and obtain cheaper bank loans.
A trend highlighted by the previous editions of this report is the shortage of skilled manpower due to attrition to IT & retail sectors, that compete for the same resource pool as the hotel industry.
Table 1: Sample Size for the Trends & Opportunities Survey for the Years 2001/02-2008/09

2 HVS Hospitality Services
The recession has made this issue decline in importance as all industries adopted a cost-sensitive approach to business in 2008/09; however, over a long term, hiring, training, and retention of quality manpower will still be a priority for the hospitality sector.
Critical to the performance of the hospitality sector is the economic and political climate of a country. This report discusses the tourism industry in India in relation to the economic scenario and includes macro data from the Department of Tourism, Government of India.
India’s GDP recorded a growth rate of 6.7% for the financial year 2008/09, according to the Central Statistical Organisation (CSO). After recording growth above 9% for three consecutive years, the global downturn took its toll on the gross domestic product (GDP) growth. However, the GDP growth rate for India is second only to that of China’s (9.8%) when compared across the BRIC (Brazil, Russia, India and China) economies.
The GDP growth in 2008/09 can be attributed to a strong service sector, steady foreign direct investment (FDI) inflows, as well as government policies that helped enhance economic growth. In contrast to the manufacturing-led growth of other developing economies, India's growth has been unique in that it was fuelled by the service sector, which contributed 57% to the GDP in 2008/09. As per the CSO, trade, hotels, transport and communications grew by 6.3%, and financing, insurance, real estate and business services grew by 9.5% during Jan-Mar 2009. Table 2 depicts the annual growth rates and contributions by different sectors of the Indian economy over the last six years.
The Indian Economy – An Overview
The inflow of Foreign Investors in the country has been an influential factor in fuelling economic growth. According to the Department of Industrial Policy & Promotion, FDI poured in US$23.9 billion during April 2008-January 2009, a growth of 65% compared to US$14.4 billion in the corresponding period in 2007/08.
The economic recovery of the country can be further kept on course by a stable political environment provided by the Congress-led United Progressive Alliance (UPA) returning to power through a comfortable majority in the general elections this year. This has already been validated by the policies of the newly elected government, leaning towards dis investment and infrastructure development that have helped sustain economic growth. Initiatives such as the National Highways Development Project (NHDP), the Airport Financing Plan, the Nat iona l Mar i t ime Deve lopment Programme (NMDP), and the Jawaharlal Nehru National Urban Renewal Mission (JNNURM) are efforts to achieve a targeted growth rate of 9% in the next financial year.
Although the year 2008/09 began under high inflationary pressures, there were concerns about negative inflation towards the year end. This financial year saw low inflation levels and even fears of deflation due to the plunging of the Wholesale Price Index (WPI). In its downward slide from the previous year's all-time high of 12.38 % (August 2008), WPI for June 2009 turned negative (-1.3%) for the first time since 1978. The primary reasons for this negative growth were sharp declines in cost of fuel, power, light, chemicals, machinery and tools. The drop in commodity prices can benefit hotel developers, who can take advantage of cheaper construction materials.
The Indian rupee also saw a sharp depreciation against the US dollar in the year 2008/09. Due to foreign investors pulling out money from the Indian stock markets to plough it back into American and European markets, the rupee depreciated to an all time low of Rs52 against the US dollar in March 2009. The growing Indian trade deficit and the large fiscal deficit are also contributing to the fall of the rupee. The rupee appreciated marginally and fluctuated between Rs48 and Rs49 in the first quarter of 2009/10.
The Indian economy has withstood the global economic recession owing to the strong and well-capitalised banks as well as influx of capital from the government in the form of infrastructure spending. In the Union Budget for 2009, the government has planned an increase in spending on infrastructure to US$989 billion for the twelfth plan compared to US$494.4 billion (in 2006/07 prices) in the eleventh one. The planned expenditure has been increased to approximately 9% of the GDP as compared to the existing 5%. The increased spending on infrastructure development will help boost the tourism industry. The one event that everyone associates with the improvement of tourism is the granting of infrastructure status for hotels, which would help rationalise the tax structure and interest rates for bank loans. While there have been discussions on the subject, the new government has failed to deliver on this account.
The tourism industry in India contributed 6.1% to the GDP in 2008/09 compared to 6.8% in 2007/08. According to estimates of the World Travel and Tourism Council (WTTC), GDP growth for Travel & Tourism economy is expected to average 7.6% per annum over the next ten years.
Despite the global economic recession, foreign tourist arrivals (FTA) to India show a continuing growth trend and increased to 5.37 million in 2008 from 4.98 million in 2007. However, the FTA growth rate declined from 14.7% in 2007/08 to only 5.7% in 2008/09, the lowest recorded since 2001/02 when the 9/11 terror strikes occurred. The decline in growth rate reflects the significant impact of the economic recession on the international travel industry. However, according to the India Tourism Statistics 2008 published by the Ministry of Tourism, the future outlook remains positive. The report showing year-to-date
Trends & Development in Tourism
Table 2: Sectoral Growth Rates at Factor Cost by Industry – India (2003/04-2008/09)
Source: Central Statistical Organisation - Economic Survey 2008/09 (revised estimates for 2007/08 and 2008/09) 1999-2000 base year
2009 Edition

3HVS Hospitality Services
numbers for FTA shows that in the first quarter of 2009, the FTA declined significantly to 13.8% as compared to that in 2008, but in the second quarter the situation improved markedly (a decline of only 1.8%) with the FTA close to that of last year's. Considering that the second quarter was the traditionally weaker period in terms of season, we can attribute this improvement to the growing positive business sentiments in India.
Over the last six years, FTA into India has recorded a growth of 125.6% from 2.38 million in 2002 to 5.37 million in 2008. Even at this visitation level, India accounts for less than 1% of the global tourism market. Although the total share of world tourist arrivals to India might be less, it has been steadily increasing. India attracted 0.58% of the world tourists in 2008 as compared to 0.34% in 2002. In the same period, India moved from 54th rank in world tourist arrivals in 2002 to 41st in 2008, this being the highest ever attained by the country.
In 2008, the domestic market in India recorded 562.9 million travellers as c o m p a r e d t o o n l y 5 . 3 7 m i l l i o n international travellers. This highlights the potential of domestic tourism in the country, which is 104 times that of international arrivals in 2008. India is fortunate to have a domestic market that supports the growth of the tourism industry even when the world economy is experiencing a downturn. According to HVS, domestic tourism has never been given its due. Even today, the statistics on foreign travellers that garner attention; however, the less represented domestic travellers form the major component of revenue generators for the Indian travel industry.
Based on our research, we would like to assert that it is the domestic traveller with an increased spending power and better access to air and road infrastructure who is sustaining tourism and the Commercial segment in India. The availability of quality hotels in the mid market and budget segment is also providing more cost-effect ive travel options and encouraging travel across different cities in India. It is interesting to note that it was also the domestic travellers who helped the industry recover from the downturn in 2001/02.
Table 3 compares the growth rates of domestic travellers with that of outbound international ones from India. The domestic travellers grew at almost twice the rate of the outbound ones between
2002 and 2003, therefore helping revive the Indian hotel market after the 2001/02 downturn. The table also shows that three years into the recovery cycle, there was a drop in the growth rate of the domestic traveller (7% in 2005). In contrast, the g r o w t h r a t e s p l a t a e u e d i n t h e corresponding period for outbound travellers. This indicates that Indians also chose to travel to international locations owing to the economic growth. HVS expects the recovery cycle from the current downturn to be similarly driven by domestic travellers.
The growth in the numbers of outbound tourists from India during 2003-07 also merits notice as with more Indians travelling internationally, there is greater awareness of international brands and service standards. This will benefit those international brands expanding in India who can be recognised and appreciated by Indian consumers who travel to foreign destinations.
The new airports at Hyderabad and Bangalore, along with the redeveloping ones at Delhi and Mumbai, are leading the way to better quality of air infrastructure in the country, with the objective of augmenting growth in all sectors of the economy. The improved air infrastructure – critical to travel – will eventually lead to a faster recovery of the hospitality sector; together contributing to the growth of tourism in India.
The expansion of the Indira Gandhi International Airport at Delhi has been given priority by the government due to the Commonwealth Games scheduled for October 2010 in Delhi. The expansion will take place in five phases; the first phase is targeted for completion in August 2010 and will increase the airport's handling capacity from 12 million passengers per annum (mppa) to 37 mppa.
Airport Infrastructure Overview
The Chhatrapati Shivaji International Airport at Mumbai is also undergoing redevelopment simultaneously. Once the planned redevelopment and expansion of the airport is completed (projected date December 2012), the Mumbai airport will be able to handle more than 50 mppa as compared to the existing capacity of 15 mppa. In addition to the airside developments, 10.0% land will be available for city-side commercial developments including hospitality, Grade A office space, as well as high street and mall retail.
The Trends & Opportunities Survey is computed by dividing the respondent branded hotels into their respective classifications according to star rating and major cities. This year, the survey examined the performance of 11 major cities across India, wherever a reasonable sample allowed. For each city we have presented the new supply, its market orientation and the number of rooms under construction or active development (refer to Table 17). We have also recommended the best markets for hotel development in the current scenario and proposed steps for improving their long-term performance.
In addition to this document, we publish The Indian Hotel Industry Survey, in association with the Federation of Hotel & Restaurant Associations of India (FHRAI) on an annual basis. This publication, the only one of its kind in India, provides detai led f inancial and operat ing information on the hotel industry, analysed by star category and across all major cities in the country. The next edition (2008/09) will be available by the end of the year.
The Trends & Opportunities Survey reports a slowdown in growth. While the perceived slowdown in growth can p r i m a r i l y b e a t t r i b u t e d t o t h e macroeconomic outlook, HVS would also
Survey Results
Table 3: Growth Trend Comparison: Domestic vs. Outbound Travellers – India (2000-08)
2009 Edition
Yo
Y G
row
th (
%)
15.4%
7.4%
14.0% 14.6%
18.5%
7.0%
18.0%
13.9%
6.9%7.3%
3.4%
8.2%8.3%
16.1%
15.6% 16.1%
17.3%
8.8%
0.0%
2.0%
4.0%
6.0%
8.0%
10.0%
12.0%
14.0%
16.0%
18.0%
20.0%
2000 2001 2002 2003 2004 2005 2006 2007 2008
Domestic Travellers Outbound Travellers from India

like to reiterate that over the last three years some industry players have been guilty of exploiting the delicate price-value propositions. One can understand when some of the hotels, which compete in the top end of the luxury market with international product offerings and service delivery standards charge high rates. However, when all hotels start to charge rates that are 50-75% higher than their global average brand rates, there is a cause for concern. If such a trend continues, India is at a risk of out-pricing itself and losing its competitive advantage; the industry will then have only itself to blame. The high rates become barriers to entry for segments like meetings, incentives, conferences and exhibitions (MICE) and leisure travellers, who have found destinations in the Asia-Pacific region such as Malaysia and Thailand to be more attractive in terms of rates and facilities offered.
Following the downward trend started last year, the occupancy levels of the overall industry saw a decline of 12.4% this year. Despite the global meltdown and the economic recession, the average rates for the industry surprisingly declined by 1.9% only for 2008/09. Despite minimal rate correction, RevPAR saw a large decline by 14% in this year due to the major decline in occupancy levels. If the strategy of hotel
Industry Performance According to Star Category
operators was to take a hit in occupancy and raise average rates to maintain RevPAR, clearly it was not too successful and the market is demanding further rate corrections.
Our view at HVS is that occupancies have actual ly a lready been cor rect ing themselves for the past one to two years. However, rate correction has started only recently, but will become a growing trend owing not only to the economic situation, but also to the new branded supply entering the market. In fact, the first four to five months of the current fiscal year have clearly indicated the same.
The addition of quality new supply in each of the hotel categories, particularly in the three and four-star ones, will ensure that the hotels charging high rates have a product that can support that rate. Current hotel operators need to realise that once the consumers have several options, they will settle for the best value proposition and be quick to switch loyalty from hotels that they believe are overcharging them.
In last year's report, we noted that the largest occupancy decline was in the three-star category due to the new supply entering the market. This year, the five and four-star category hotels took the biggest occupancy hits. The new supply in the three-star category can be responsible for this decline in occupancies as customers
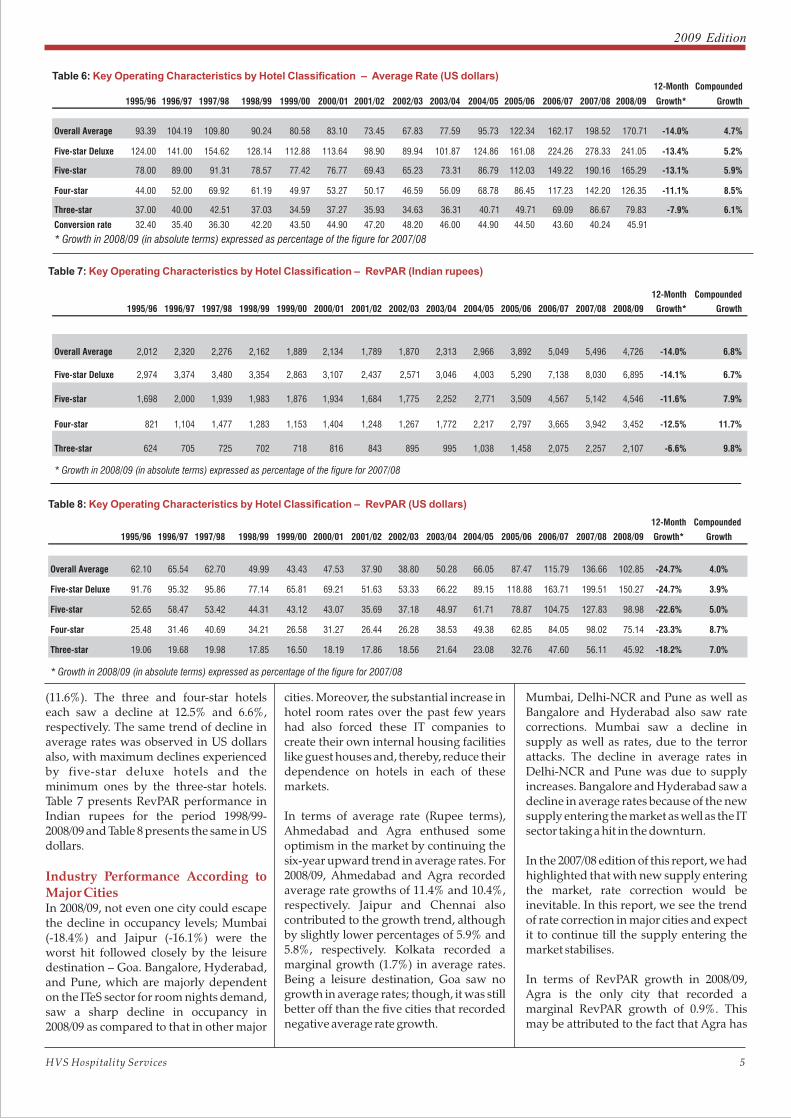
with limited budgets (in view of the economic situation) are able to find quality options at more affordable prices. Table 4 reflects room occupancy by hotel classification for the period 1995/96-2008/09. Table 5 presents average rate performance in Indian rupees for the same period while Table 6 reflects average rate results in US dollars. Table 6 contains the conversion rates from Indian rupees to US dollars; the same rates are used throughout the report wherever the numbers are presented in dollars.
Although average rates across the industry declined marginally, the three and four-star categories managed to increase average rates (in Indian rupees) by 5.1% and 1.4% respectively. The highest increase in average rates was in the three-star category, which can be attributed to the unmet demand for quality mid market products that was being transferred to four or five-star hotels. We believe that there will be further rate correction in the upscale market owing to competition from leading international brands and new domestic brands entering the market, as well as the availability of quality options in the mid market category.
In terms of RevPAR, all categories experienced a decline in 2008/09. The five-star deluxe hotels experienced the maximum decline in Indian rupee terms (14.1%) followed by the five-star hotels
Table 4: Key Operating Characteristics by Hotel Classification – Occupancy
1995/96 1996/97 1997/98 1998/99 1999/00 2000/01 2001/02 2002/03 2003/04 2004/05 2005/06 2006/07 2007/08 2008/09
12-Month
Growth*
Compounded
Growth
Overall Average 66.5% 62.9% 57.1% 55.4% 53.9% 57.2% 51.6% 57.2% 64.8% 69.0% 71.5% 71.4% 68.8% 60.3% -12.4%
Five-star Deluxe 74.0% 67.6% 62.0% 60.2% 58.3% 60.9% 52.2% 59.3% 65.0% 71.4% 73.8% 73.0% 71.7% 62.3% -13.1%
Five-star 67.5% 65.7% 58.5% 56.4% 55.7% 56.1% 51.4% 57.0% 66.8% 71.1% 70.4% 70.2% 67.2% 59.9% -10.9%
Four-star 57.9% 60.5% 58.2% 55.9% 53.2% 58.7% 52.7% 56.4% 68.7% 71.8% 72.7% 71.7% 68.9% 59.5% -13.6%
Three-star 51.5% 49.2% 47.0% 48.2% 47.7% 48.8% 49.7% 53.6% 59.6% 56.7% 65.9% 68.9% 64.7% 57.5% -11.1%
-0.8%
-1.3%
-0.9%
0.2%
0.9%
* Growth in 2008/09 (in absolute terms) expressed as percentage of the figure for 2007/08
Table 5: Key Operating Characteristics by Hotel Classification – Average Rate (Indian rupees)
1995/96 1996/97 1997/98 1998/99 1999/00 2000/01 2001/02 2002/03 2003/04 2004/05 2005/06 2006/07 2007/08 2008/09
12-Month
Growth*
Compounded
Growth
Overall Average 3,025 3,688 3,986 3,903 3,505 3,731 3,467 3,269 3,569 4,299 5,444 -1.9%
Five-star 2,515 3,044 3,315 3,516 3,368 3,447 3,277 3,114 3,372 3,897 4,985 -0.8%
Three-star 1,212 1,432 1,543 1,457 1,505 1,673 1,696 1,669 1,670 1,830 2,212
7,071
6,506
3,012
7,989
7,652
3,488
7,837
Five-star Deluxe 4,019 4,991 5,613 5,572 4,910 5,102 4,668 4,335 4,686 5,606 7,168 -1.2%
9,778 11,200 11,067
7,589
3,665 5.1%
5,111 5,722 5,801Four-star 1,418 1,825 2,538 2,296 2,168 2,392 2,368 2,246 2,580 3,088 3,847 1.4% 11.4%
7.6%
8.1%
8.9%
8.9%
* Growth in 2008/09 (in absolute terms) expressed as percentage of the figure for 2007/08
4 HVS Hospitality Services
2009 Edition
5HVS Hospitality Services
(11.6%). The three and four-star hotels each saw a decline at 12.5% and 6.6%, respectively. The same trend of decline in average rates was observed in US dollars also, with maximum declines experienced by five-star deluxe hotels and the minimum ones by the three-star hotels. Table 7 presents RevPAR performance in Indian rupees for the period 1998/99-2008/09 and Table 8 presents the same in US dollars.
In 2008/09, not even one city could escape the decline in occupancy levels; Mumbai (-18.4%) and Jaipur (-16.1%) were the worst hit followed closely by the leisure destination – Goa. Bangalore, Hyderabad, and Pune, which are majorly dependent on the ITeS sector for room nights demand, saw a sharp decline in occupancy in 2008/09 as compared to that in other major
Industry Performance According to Major Cities
cities. Moreover, the substantial increase in hotel room rates over the past few years had also forced these IT companies to create their own internal housing facilities like guest houses and, thereby, reduce their dependence on hotels in each of these markets.
In terms of average rate (Rupee terms), Ahmedabad and Agra enthused some optimism in the market by continuing the six-year upward trend in average rates. For 2008/09, Ahmedabad and Agra recorded average rate growths of 11.4% and 10.4%, respectively. Jaipur and Chennai also contributed to the growth trend, although by slightly lower percentages of 5.9% and 5.8%, respectively. Kolkata recorded a marginal growth (1.7%) in average rates. Being a leisure destination, Goa saw no growth in average rates; though, it was still better off than the five cities that recorded negative average rate growth.
Mumbai, Delhi-NCR and Pune as well as Bangalore and Hyderabad also saw rate corrections. Mumbai saw a decline in supply as well as rates, due to the terror attacks. The decline in average rates in Delhi-NCR and Pune was due to supply increases. Bangalore and Hyderabad saw a decline in average rates because of the new supply entering the market as well as the IT sector taking a hit in the downturn.
In the 2007/08 edition of this report, we had highlighted that with new supply entering the market, rate correction would be inevitable. In this report, we see the trend of rate correction in major cities and expect it to continue till the supply entering the market stabilises.
In terms of RevPAR growth in 2008/09, Agra is the only city that recorded a marginal RevPAR growth of 0.9%. This may be attributed to the fact that Agra has
Table 6: Key Operating Characteristics by Hotel Classification – Average Rate (US dollars)
1995/96 1996/97 1997/98 1998/99 1999/00 2000/01 2001/02 2002/03 2003/04 2004/05 2005/06 2006/07 2007/08 2008/09
12-Month
Growth*
Compounded
Growth
Overall Average 104.19 109.80 90.24 80.58 83.10 73.45 67.83 77.59 95.73 122.34 162.17 198.52 170.71
Five-star Deluxe 141.00 154.62 128.14 112.88 113.64 98.90 89.94 101.87 124.86 161.08 224.26 278.33 241.05
Five-star 89.00 91.31 78.57 77.42 76.77 69.43 65.23 73.31 86.79 112.03 149.22 190.16 165.29
Four-star 52.00 69.92 61.19 49.97 53.27 50.17 46.59 56.09 68.78 86.45 117.23 142.20 126.35
Three-star 40.00 42.51 37.03 34.59 37.27 35.93 34.63 36.31 40.71 49.71 69.09 86.67 79.83
-14.0%
-13.4%
-13.1%
-11.1%
-7.9%
4.7%
5.2%
5.9%
8.5%
6.1%
Conversion rate
93.39
124.00
78.00
44.00
37.00
32.40 35.40 36.30 42.20 43.50 44.90 47.20 48.20 46.00 44.90 44.50 43.60 40.24 45.91
* Growth in 2008/09 (in absolute terms) expressed as percentage of the figure for 2007/08
Table 7: Key Operating Characteristics by Hotel Classification – RevPAR (Indian rupees)
1995/96 1996/97 1997/98 1998/99 1999/00 2000/01 2001/02 2002/03 2003/04 2004/05 2005/06 2006/07 2007/08 2008/09
12-Month
Growth*
Compounded
Growth
Overall Average
Five-star Deluxe
Five-star
Four-star
Three-star
2,012
2,974
1,698
821
624
2,320
3,374
2,000
1,104
705
2,276
3,480
1,939
1,477
725
2,162
3,354
1,983
1,283
702
1,889
2,863
1,876
1,153
718
2,134
3,107
1,934
1,404
816
1,789
2,437
1,684
1,248
843
1,870
2,571
1,775
1,267
895
2,313
3,046
2,252
1,772
995
2,966
4,003
2,771
2,217
1,038
3,892
5,290
3,509
2,797
1,458
5,049
7,138
4,567
3,665
2,075
5,496
8,030
5,142
3,942
2,257
4,726
6,895
4,546
3,452
2,107
-14.0%
-14.1%
-11.6%
-12.5%
-6.6%
6.8%
6.7%
7.9%
11.7%
9.8%
* Growth in 2008/09 (in absolute terms) expressed as percentage of the figure for 2007/08
Table 8: Key Operating Characteristics by Hotel Classification – RevPAR (US dollars)
1995/96 1996/97 1997/98 1998/99 1999/00 2000/01 2001/02 2002/03 2003/04 2004/05 2005/06 2006/07 2007/08 2008/09
12-Month
Growth*
Compounded
Growth
Overall Average 62.10 65.54 62.70 49.99 43.43 47.53 37.90 38.80 50.28 66.05 87.47 115.79 136.66 102.85 -24.7% 4.0%
Five-star Deluxe 91.76 95.32 95.86 77.14 65.81 69.21 51.63 53.33 66.22 89.15 118.88 163.71 199.51 150.27 -24.7% 3.9%
Five-star 52.65 58.47 53.42 44.31 43.12 43.07 35.69 37.18 48.97 61.71 78.87 104.75 127.83 98.98 -22.6% 5.0%
Four-star 25.48 31.46 40.69 34.21 26.58 31.27 26.44 26.28 38.53 49.38 62.85 84.05 98.02 75.14 -23.3% 8.7%
Three-star 19.06 19.68 19.98 17.85 16.50 18.19 17.86 18.56 21.64 23.08 32.76 47.60 56.11 45.92 -18.2% 7.0%
* Growth in 2008/09 (in absolute terms) expressed as percentage of the figure for 2007/08
2009 Edition

6 HVS Hospitality Services
Table 9: Key Operating Characteristics by Major City – Occupancy
Compounded
1995/96 1996/97 1997/98 1998/99 1999/00 2000/01 2001/02 2002/03 2003/04 2004/05 2005/06 2006/07 2007/08 2008/09
12-Month*Growth Growth
Agra
Ahmedabad
Bangalore
Chennai
Delhi
Goa
Hyderabad
Jaipur
Kolkata
Mumbai
46.1%
71.8%
61.2%
68.4%
60.2%
59.2%
53.4%
51.7%
61.8%
65.3%
46.4%
58.0%
59.0%
64.7%
54.1%
58.6%
66.0%
45.6%
57.8%
67.6%
40.1%
50.8%
64.4%
65.3%
52.9%
53.3%
61.3%
47.0%
54.8%
64.5%
33.7%
53.2%
64.3%
56.5%
53.3%
53.6%
68.0%
48.3%
66.4%
52.0%
Pune
47.6%
55.7%
71.3%
84.6%
71.7%
62.1%
58.1%
52.2%
63.8%
81.0%
51.7%
65.8%
67.2%
80.2%
67.3%
58.4%
54.8%
58.4%
55.9%
73.0%
42.5%
55.8%
69.8%
64.6%
58.9%
60.6%
69.1%
55.0%
62.9%
64.6%
30.7%
53.8%
72.0%
58.3%
60.4%
60.5%
68.9%
44.9%
65.4%
63.4%
71.0%
50.0%
63.2%
78.5%
66.6%
73.1%
59.3%
75.9%
58.8%
62.8%
69.7%
68.9%
57.1%
68.3%
81.4%
72.9%
79.1%
62.5%
78.7%
67.2%
69.0%
72.0%
86.4%
56.0%
69.1%
76.7%
78.2%
80.8%
67.8%
82.0%
65.7%
76.4%
76.2%
83.1%
58.9%
67.9%
72.5%
74.7%
76.9%
72.8%
72.1%
65.5%
75.5%
77.9%
83.4%
58.3%
73.3%
65.3%
72.8%
73.9%
72.2%
65.7%
64.7%
73.9%
74.6%
69.5%
53.3%
62.1%
56.4%
64.7%
68.5%
60.9%
56.6%
54.3%
69.5%
60.9%
61.1%
-8.6%
-15.3%
-13.6%
-11.1%
-7.3%
-15.7%
-13.9%
-16.1%
-6.0%
-18.4%
-12.1%
0.9%
0.8%
-1.8%
-2.0%
-0.4%
-0.1%
-0.2%
0.3%
0.7%
-2.2%
-2.5%
* Growth in 2008/09 (in absolute terms) expressed as percentage of the figure for 2007/08
Table 10: Key Operating Characteristics by Major City – Average Rate (Indian rupees)
1995/96 1996/97 1997/98 1998/99 1999/00 2000/01 2001/02 2002/03 2003/04 2004/05 2005/06 2006/07 2007/08 2008/0912-Month*
Growth
Agra
Ahmedabad
Bangalore
Chennai
Delhi
Goa
Hyderabad
Jaipur
Kolkata
Mumbai
1,593
2,132
2,300
2,779
3,054
2,220
1,499
1,518
3,104
5,137
1,826
2,678
3,136
3,540
4,007
2,347
1,604
1,836
3,556
6,229
2,027
1,833
3,451
3,977
4,913
2,303
1,646
2,473
3,951
6,169
1,906
2,220
3,254
3,600
4,626
2,863
1,579
2,533
3,888
6,297
1,638
2,705
3,025
3,424
4,115
2,727
1,867
2,514
3,557
5,661
1,586
2,736
3,602
3,796
4,526
2,914
2,316
2,902
3,698
5,555
Pune
1,840
2,354
3,735
3,535
4,338
2,676
2,414
2,949
3,409
4,932
1,954
2,164
3,752
3,224
4,089
2,754
2,541
2,728
2,917
4,184
2,603
2,431
2,410
4,832
3,323
4,269
3,086
2,774
2,980
3,021
4,356
2,805
3,012
2,787
7,470
3,714
5,103
3,985
3,772
3,461
3,240
4,822
3,521
3,622
3,111
8,762
4,357
6,909
4,804
4,870
4,407
3,887
6,041
4,915
4,715
3,526
10,406
5,378
9,192
5,801
5,962
5,285
5,288
8,738
6,523
5,262
4,351
9,827
6,340
10,429
6,255
6,271
5,664
6,575
10,932
7,946
5,810
4,849
9,527
6,709
10,097
6,252
6,142
6,000
6,687
10,695
7,723
10.4%
11.4%
-3.1%
5.8%
-3.2%
0.0%
-2.1%
5.9%
1.7%
-2.2%
-2.8%
CompoundedGrowth
10.5%
6.5%
11.6%
7.0%
9.6%
8.3%
11.5%
11.2%
6.1%
5.8%
19.9%
* Growth in 2008/09 (in absolute terms) expressed as percentage of the figure for 2007/08
Table 11: Key Operating Characteristics by Major City – Average Rate (US dollars)
12-Month
1995/96 1996/97 1997/98 1998/99 1999/00 2000/01 2001/02 2002/03 2003/04 2004/05 2005/06 2006/07 2007/08 2008/09 Growth*
Compounded
Growth
Agra
Ahmedabad
Bangalore
Chennai
Delhi
Goa
Hyderabad
Jaipur
Kolkata
Mumbai
49
66
71
86
94
69
46
47
96
159
52
76
89
100
113
66
45
52
100
176
56
50
95
110
135
63
45
68
109
170
50
53
81
89
111
73
39
62
88
138
38
62
70
79
95
63
43
45
82
130
39
50
79
75
92
57
51
62
72
104
Pune
35
61
80
85
101
65
52
65
82
124
41
45
78
67
85
57
53
57
61
87
54
53
52
105
72
93
67
60
65
66
95
61
67
62
166
83
114
89
84
77
72
107
78
81
70
197
98
155
108
109
99
87
136
110
108
81
239
123
211
133
137
121
121
200
150
131
108
244
158
259
155
156
141
163
272
197
127
106
208
146
220
136
134
131
146
233
168
-3.2%
-2.3%
-15.0%
-7.2%
-15.1%
-12.4%
-14.1%
-7.1%
-10.9%
-14.2%
-14.8%
7.6%
3.7%
8.6%
4.2%
6.8%
5.4%
8.6%
8.2%
3.3%
3.0%
25.5%
* Growth in 2008/09(in absolute terms) expressed as percentage of the figure for 2007/08
2009 Edition

7HVS Hospitality Services
been slow in attracting new supply. All other cities recorded negative growth in 2008/09 owing to the decline in business travel. Table 9 illustrates hotel occupancy for ten key cities in India between 1995/96 and 2008/09. Tables 10 and 11 show average rates for each hotel market, expressed in Indian rupees and US dollars, respectively. Tables 12 and 13 present the corresponding RevPAR data.
In the time that the India office of HVS has been operational, two distinct cycles for the hospitality industry are discernable. The first cycle peaked in 1997, after which it started a downward trend hitting the bottom in the year 2001/02.
The second cycle started with the recovery of the economy in 2002/03, peaking in 2007/08 after a period of continuous growth. Table 14 presents the RevPAR trend for fourteen years, from 1995/96 to 2008/09 along with the GDP growth rate for the same years.
Cyclical Nature of the Hospitality Industry
We assert that the leading macroeconomic indicators such as GDP are correlated to the performance of the hotel industry. However, though the hotel industry is amongst the first to be hit by a downturn, it is amongst the slowest to recover since the spending on travel is considered as discretionary for most leisure travellers and some business ones as well.
In 1995/96, when HVS India started tracking this market, a trend was observed with correction of occupancy and then average rates. Recovery started to take place in 2000/01; however, the September 11 attack in 2001 and the subsequent war in Afghanistan ensured that there was no further real improvement in market sentiments in the region. In 2003, two global events happened, namely, the Iraq war and the outbreak of SARS. These actually benefited India indirectly as most out-bound traffic from India chose not to travel, fuelling the growth of domestic tourism. Starting 2003/04, the markets gained in strength year-on-year before the downturn of 2008/09. The current downturn, the Mumbai terror attacks, and
the H1N1 flu scare have not cut as deep into the Indian markets as that of some of the countries in North America and Europe. Even though the GDP growth rate for the economy declined after recording over 9% growth for three years, India managed to maintain visibility in the eyes of global investors due to the relatively strong position of banks and the service sector as a whole, as well as a huge consumer market. We estimate a slightly longer recovery period of three to four years before the market stabilises, due to the new supply entering the market and the introduction of quality international and domestic brands in all hotel categories. We feel that the introduction of new supply will prompt significant rate correction as operators lower rates in response to the increased competition in the market and try to maintain market share. We do not intend to say that the segment will become unprofitable due to the new supply. In fact, we think that the introduction of quality supply will attract more international travellers encouraging infrastructure development across the country and strengthening tourism.
Table 12: Key Operating Characteristics by Major City – RevPAR (Indian rupees)
1995/96 1996/97 1997/98 1998/99 1999/00 2000/01 2001/02 2002/03 2003/04 2004/05 2005/06 2006/07 2007/08 2008/0912-Month*
GrowthCompounded
Growth
Agra
Ahmedabad
Bangalore
Chennai
Delhi
Goa
Hyderabad
Jaipur
Kolkata
Mumbai
758
1,188
1,640
2,351
2,190
1,379
871
792
1,980
4,161
944
1,762
2,107
2,839
2,697
1,371
879
1,072
1,988
4,547
934
1,316
2,112
2,720
2,958
1,363
879
1,279
2,442
4,028
Pune
884
1,288
1,920
2,329
2,503
1,678
1,042
1,155
2,247
4,257
657
1,374
1,948
2,236
2,177
1,453
1,144
1,182
1,949
3,651
674
1,527
2,514
2,452
2,666
1,766
1,600
1,596
2,326
3,589
620
1,252
2,402
1,997
2,312
1,434
1,642
1,424
2,264
2,565
600
1,164
2,701
1,880
2,470
1,666
1,751
1,225
1,908
2,653
1,848
1,216
1,523
3,793
2,213
3,121
1,830
2,105
1,752
1,897
3,036
1,933
1,720
1,904
6,081
2,708
4,036
2,491
2,969
2,326
2,236
3,472
3,042
2,028
2,150
6,720
3,407
5,582
3,257
3,993
2,895
2,970
4,603
4,084
2,777
2,394
7,544
4,017
7,069
4,223
4,299
3,462
3,992
6,807
5,440
3,068
3,189
6,417
4,616
7,707
4,516
4,120
3,665
4,859
8,155
5,522
3,097
3,011
5,373
4,341
6,916
3,807
3,476
3,258
4,647
6,513
4,719
0.9%
-5.6%
-16.3%
-6.0%
-10.3%
-15.7%
-15.6%
-11.1%
-4.4%
-20.1%
-14.6%
11.4%
7.4%
9.6%
4.8%
9.3%
8.1%
11.2%
11.5%
6.8%
3.5%
16.9%
* Growth in 2008/09 (in absolute terms) expressed as percentage of the figure for 2007/08
Table 13: Key Operating Characteristics by Major City – RevPAR (US dollars)
1995/96 1996/97 1997/98 1998/99 1999/00 2000/01 2001/02 2002/03 2003/04 2004/05 2005/06 2006/07 2007/08 2008/0912-MonthGrowth*
CompoundedGrowth
Agra
Ahmedabad
Bangalore
Chennai
Delhi
Goa
Hyderabad
Jaipur
Kolkata
Mumbai
23
37
51
73
67
43
27
25
61
129
27
50
60
80
76
39
25
30
56
128
26
36
58
75
81
37
24
35
67
111
23
31
48
58
60
43
26
28
51
93
15
31
45
52
50
34
26
21
45
84
15
34
56
55
59
39
36
36
52
80
13
27
51
42
49
31
35
30
48
54
Pune
13
24
56
39
51
34
37
26
40
55
38
27
33
82
48
68
40
46
38
41
66
42
38
42
135
61
90
56
66
52
50
77
67
45
48
151
77
125
73
89
65
66
104
91
64
55
173
92
162
97
99
79
91
156
125
76
79
160
115
192
112
102
91
121
203
137
67
66
117
95
151
83
76
71
101
142
103
-11.6%
-17.2%
-26.7%
-17.5%
-21.3%
-26.2%
-26.1%
-22.1%
-16.1%
-29.9%
-25.1%
8.5%
4.6%
6.7%
2.0%
6.4%
5.2%
8.3%
8.5%
3.9%
0.8%
21.8%
* Growth in 2008/09 (in absolute terms) expressed as percentage of the figure for 2007/08
2009 Edition

Table 15: RevPAR across Star Categories – India (1995/96 - 2008/09)
any flippant statements made to the media or announcements made by real estate developers to promote their brand and, therefore, get greater visibility. Thus, like each year, we have put together a list of developments under construction or those announced in each market that have a confirmed tie-up with an operator. Such developments have been analysed rationally, through the prism of an unbiased third party, for the probability factor of their development within the next five years.
We note that with financing becoming harder to obtain and hotel projects taking longer to complete, the proposed supply pipeline in most markets is stretched. Table 16 presents the existing and proposed supply entering each of the 11 markets covered in this report. The table reflects the anticipated growth over the next five years and also presents a probability factor (active supply) reflecting those hotels, which are either under construction or those that HVS is confident will open before March 2014. Further, in this table we have classified the new supply and classified it into luxury, first class, mid market, budget and extended stay hotels. Table 17 is a comparative analysis of the hotel supply in three years, and shows how the sector is evolving.
The Pune market is expected to have the maximum development (531% supply growth over existing supply) over five years, followed closely by Chandigarh, where we expect 416% supply growth over the existing supply. While Table 16 needs to be read carefully and may come as an eye opener to many potential investors, it is the fourth column that needs careful consideration, if not more weight, since it reflects the actual active development for the proposed supply. So while Pune may reflect that 8,054 rooms are under development, we at HVS believe that only 52% of this proposed supply will actually get developed by 2013/14. Similarly, Table 17 illustrates how the Pune market has changed on the supply front over the past two years. Later in this report we discuss the growth, demand and supply situation for each of the 11 cities. If one were to analyse the entire country, we expect that approximately 59% of the total new supply of 94,115 rooms, or approximately 54,587 rooms, will actually get developed over the next five years. Our estimate is that there are approximately 125,000 rooms operating in India. This, however, does not include the guest accommodations provided by the
8 HVS Hospitality Services
Overall Average
Five-star Deluxe
Five-star
Four-star
Three -star
1995
/96
1996
/97
1997
/98
1998
/99
1999
/00
2000
/01
2001
/02
2002
/03
2003
/04
2004
/05
2005
/06
2006
/07
2007
/08
2008
/09
Re
vP
AR
(In
dia
n r
up
ee
s)
0
1,000
2,000
3,000
4,000
5,000
6,000
7,000
8,000
9,000
According to HVS, from an investor's perspective this weak period is probably the best time to make investments into the hotel sector. Also from a developer's point of view, this is a good time to construct and finish hotels so that they are ready to open and stabilise as the upswing starts.
In this report, we also evaluate the trend across hotel segments for a fourteen-year period. Table 15 shows the RevPAR trend for different hotel categories. The five-star deluxe and five-star categories have trend lines showing sharp increases and decreases as compared to the flatter line of the three-star hotels signifying wider gaps in rates during the different economic periods. This is expected, as the luxury and upscale markets take a stronger hit when the economy slows since people move to lower-scale hotels, and in the good times they experience unprecedented growth due to increased spending by a confident consumer market.
It is also interesting to see that there is a huge gap in the RevPAR of five-star deluxe
markets and the five star ones; however, the gap narrows between the five and four-star markets as well as the four and three star ones. Following the economic downturn, it will not be surprising to see customers of five-star hotels switch to new four-star hotels being developed by international brands that are available at lower rates, and to see four-star customers settle for three-star brands to get greater value for money.
Over the past few years HVS has been tracking the development of new supply very closely. In 2006/07, the proposed new supply of branded and quality hotels in India was 1,01,971. This rose to 1,14,466 in 2007/08, and then due to the economic downturn, declined to 94,115 rooms in 2008/09.
We would like to state that a lot of effort goes into collating this data and then verifying many of these projects across var ious c i t ies in ter ms of the i r development stage. Our tracking omits
Hotel Supply
2009 Edition
Table 14: RevPAR and GDP Trend for the Hospitality industry – India (1995/96 - 2008/09)
0.0%
2.0%
4.0%
6.0%
8.0%
10.0%
12.0%
-
RevPAR GDP Growth
1995
/96
1996
/97
1997
/98
1998
/99
1999
/00
2000
/01
2001
/02
2002
/03
2003
/04
2004
/05
2005
/06
2006
/07
2007
/08
2008
/09
Re
vP
AR
(In
dia
n r
up
ee
s)
1,000
2,000
3,000
4,000
5,000
6,000
GD
P G
row
th R
ate
(%)

unorganised sector that would further take this number up by 25%. The reason we highlight this is because there are various guess-estimates doing the rounds.
Research by HVS confirms an alarmingly low number of branded/quality rooms supply in the country, which stand at approximately 48,500 rooms. This overall number for India is actually lower than that for most major cities across the globe. Therefore, even with the addition of 54,587 quality/branded rooms across India in the
next five years, we believe that there is a huge potential for investors and operators across all segments. Moreover, the fact that India has an annual travelling population of 563 million travellers, which is bigger than the entire population of the US alone is a case in point.
Based on the data collected by HVS in the past 14 years for this report, we are able to present a picture of the increase in supply over the years. With unprecedented economic growth in the four years
preceding the downturn, the supply of hotel rooms had grown to accommodate the expanding international and domestic tourism market. Although the growth in supply in the early 2000s started with the expansion of the luxury and upscale segment, we forecast a growth in the mid market and budget segments to accommodate the price-sensitive travellers and get back those from the unorganised apartment rental operators.
9HVS Hospitality Services
Table 16: Distribution of Existing and Proposed Branded Hotels by Major City – 2008/09
Proposed Increase over
Active
Development of
Existing Supply Supply Five Years Supply Luxury First Class Mid-market Budget Extended Stay
Agra 1,419 400 28% 75% 25.0% 0.0% 75.0% 0.0% 0.0%
Ahmedabad 800 3,058 382% 71% 8.2% 39.2% 35.2% 10.3% 7.2%
Bangalore 3,889 10,784 277% 58% 23.8% 29.0% 16.0% 22.7% 8.4%
Chandigarh 351 1,459 416% 55% 11.3% 34.4% 25.1% 29.2% 0.0%
Chennai 3,307 4,945 150% 67% 36.7% 32.1% 12.4% 11.8% 7.0%
Delhi (NCR) 8,625 16,560 192% 53% 18.2% 30.3% 33.7% 16.3% 1.5%
Goa 2,795 2,178 78% 31% 14.0% 41.8% 30.8% 13.4% 0.0%
Hyderabad 2,761 5,884 213% 73% 42.1% 21.0% 17.8% 19.1% 0.0%
Jaipur 1,683 3,357 199% 53% 16.1% 27.2% 40.5% 16.2% 0.0%
Kolkata 1,373 4,025 293% 62% 24.2% 28.4% 36.3% 11.1% 0.0%
Mumbai 7,948 13,386 168% 73% 29.9% 25.6% 24.8% 15.2% 4.4%
Pune 1,518 8,054 531% 52% 22.3% 28.8% 29.6% 19.2% 0.0%
Other Cities 12,006 20,025 167% 60% 2.5% 20.8% 48.0% 28.1% 0.6%
Total 48,475 94,115 194% 60% 20.2% 26.7% 31.2% 19.0% 2.9%
Proposed Supply
Table 17: Comparative Analysis – Distribution of Existing and Proposed Branded Hotels by Major City – YoY
2006/07 2007/08 2008/09 2006/07 2007/08 2008/09 2006/07 2007/08 2008/09
Agra 1,336 1,336 1,419 764 670 400 32% 55% 75%
Ahmedabad 519 675 800 2,230 3,664 3,058 60% 47% 71%
Bangalore 2,414 3,456 3,889 12,882 15,542 10,784 61% 60% 58%
Chandigarh 340 340 351 1,567 1,813 1,459 45% 54% 55%
Chennai 2,442 2,826 3,307 6,213 7,147 4,945 68% 71% 67%
Delhi (NCR) 7,990 9,019 8,625 19,423 22,360 16,560 56% 51% 53%
Goa 2,450 2,768 2,795 3,058 3,353 2,178 58% 42% 31%
Hyderabad 1,868 2,554 2,761 10,619 8,250 5,884 47% 64% 73%
Jaipur 1,388 1,556 1,683 4,012 2,937 3,357 56% 53% 53%
Kolkata 1,354 1,396 1,373 3,644 5,965 4,025 67% 49% 62%
Mumbai 7,402 8,454 7,948 11,578 10,613 13,386 49% 62% 73%
Pune 777 1,346 1,518 8,072 8,243 8,054 77% 66% 52%
Other Cities 9,005 11,256 12,006 17,909 23,909 20,025 58% 60% 60%
Total 39,285 46,982 48,475 1,01,971 1,14,466 94,115 58% 58% 60%
Proposed SupplyExisting Supply Active Development of Supply
2009 Edition

In Table 18, we note that from 1998/99 to 2008/09, in a period of eleven years, the supply of rooms increased by 109.1%. As the government policies become more favourable towards foreign investors and India continues to receive attention as an emerging market promising growth even in the economic downturn, the room supply is expected to increase by 94.2% in 2013/14 from that in 2008/09. The domestic market has shown huge potential in the past and continues to support the growing tourism industry, protecting India from the global economic and tourism downturns. Many international hotel brands are keen to have a presence in India in order to include an emerging market in their portfolio so as to offset losses from mature markets like the US. Delhi-NCR is attracting operators and developers to open hotels before the Commonwealth Games in October 2010 on account of the five-year tax holiday offered by the government for such hotels.
The huge percentage of supply coming into the market is sure to prompt a rate correction and put pressure on hotels to maintain quality and benchmark their service standards and facilities to that of their competitive set. It may seem that with the increase in supply there will be more hotels fighting for the same customers, but increase in supply can benefit all hotels in the market and attract more segments that the Indian hotel market has been unable to cater to.
The price correction induced by the new supply and introduction of more budget and mid market hotels will increase the market's potential for attracting high volume, price sensitive segments such as meeting and conferences, domestic leisure groups, incentive travel etc. The recent demand-supply imbalance, increase in room rates, and unavailability of quality recreational and conference facilities had forced the mid-level traveller to look for cost-effective alternatives. The mid-level traveller segment generates substantial demand and has comparatively higher length of stay. The MICE segment had also been largely neglected due to the unavailability of conference facilities and rooms at reasonable prices. With convention centres coming up in major cities, this segment can also be expected to generate significant demand. We discuss the demand & supply scenario and the market performance in major Indian cities.
Agra historically has been amongst the poorest performers when it comes to hotel
City Trends
performance. Yet last year (2008/09), this was the only market from amongst the 11 cities tracked that actually saw a marginal increase in RevPAR. Unlike Goa and Jaipur, which were adversely affected due to the global meltdown and terror attacks, it appears Agra focused and gained more from the domestic travellers who visited this city. While the city continues to market the Taj Mahal to charm and attract tourists, the state administration has notably done little to maintain a clean infrastructure which is hurting further growth of this city. We believe the market will perhaps grow o n l y b y 2 8 % ( 4 0 0 r o o m s ) a n d approximately 75% of this might actually get developed. The silver lining is that most of this active development is taking place in the mid-market space.
Ahmedabad had new supply grow by 18.5% in 2008/09. The high growth is clearly due to its existing low base of quality rooms. Under Chief Minister Narendra Modi’s business-friendly regime, investors have been looking at this state aggressively as they expect growth and development to continue. In the past 12 months, many new projects have been announced; we expect a growth of 382% (3,058 rooms) increase in supply with a 71% -probability factor of all these rooms actually opening. Considering that Ahmedabad witnessed only a drop of 5.6% in RevPAR last year and has a stable g o v e r n m e n t i n p l a c e , w h i c h i s encouraging industries and businesses, we feel that the city will absorb this new supply over the medium to long period.
Bangalore is not amongst the top performing markets in India for the past few years. New hotel developments have
witnessed a delay and the drop in demand from the IT/ITeS segment affected the city performance. The room supply increased by only 12.5% during the past 12 months. However, this was accompanied by a huge growth in supply of the unorganised sector in terms of guest houses. Additionally, some of the major IT companies added their own hostels and other accommodation in order to avoid paying huge hospitality bills. Bangalore needs to reduce its dependence on just corporate business and focus on marketing the city to other travel segments.
Over the past few years we have maintained that Bangalore hotels have witnessed a correction in rate and occupancy. Future growth of room supply in the city is expected to be 277% (10,784 rooms); 58% of these have an actual probability of development. We anticipate a delay in completion of many projects from the estimated schedules and this is likely to work towards reviving the market. We believe the city is currently flirting with the danger of oversupply in the luxury and first class space.
Unlike some other large cities in India, Bangalore has no tourist base historically and therefore the only possible growth can come from the MICE segment. Fortunately, there are active plans underway to develop a large convention centre near the new international airport that will be the largest of its kind in India. We, however, expect the city to start gaining from this from only 2015 onwards. We continue to maintain that Bangalore is a great city for hotel development in the medium to long term, provided an investor's financial model takes into account the realistic
10 HVS Hospitality Services
Table 18: Growth of Room Supply – India (1998/99-2013/14)
23,185
48,475
94,115
0
10,000
20,000
30,000
40,000
50,000
60,000
70,000
80,000
90,000
1,00,000
1,10,000
1998/99 2008/09 2013/14
109.1% increase in eleven years
Source: HVS Research
94.2 % projected increase in five years
2009 Edition
Num
ber
of R
oom
s

pricing of room rates and not the historically high room rates.
Chandigarh (also includes Mohali) continues to have only two recognised brands and, therefore, has an extremely low base of room supply. There has also been no new addition to the city's supply. The city continues to offer excellent opportunities for food and beverages (F&B), banquets etc. We expect that first class, mid market and budget hotels will particularly do well. We believe that the current base of rooms is going to grow by 416% (1,459 rooms) with a 55% probability of actually being developed. While many hotel projects have been announced, there is not much activity in terms of on-ground development at most sites. Also, the slow pace of IT/ITeS development is a continued cause of worry since this sector is considered important for the potential growth of the hotel market.
Chennai continues to be a stable and steady market. We anticipate that this city will see an increase of 150% (4,945 rooms) growth with a probability factor of 67%. This has substantially corrected itself in the past 12 months and, therefore, has made this city more favourable in the current environment. Chennai is the most diversified market in the country with various demand generators that include the IT/ITeS industry, a strong automobile manufacturing base and Southern India's regional headquarters for many banking companies. These demand generators provides a lot of comfort to new developers. The next few months are going to see a lot of activity at the upper end of the hotel market with the development and completion of projects by Marriott, Hyatt and the Leela group. Although in the past 12 months new supply grew by over 17%, we foresee a marginal decline in occupancy as demand keeps pace with supply in the market.
Goa continues to be India's preferred beach destination. The location has barriers to entry in terms of environmental clearances and other government obstacles and, therefore, development projects take longer to complete. The state is likely to see an increase of 78% (2,178 rooms) with a low probability factor of 31% for the next few years. There has been limited progress made on the proposed convention centre, and also on the upgradation of the existing airport. The November attacks on the neighbouring city of Mumbai have not helped either. Having said this, Goa remains an excellent investment opportunity for hotel
development due to its growing potential as a leisure destination. Unfortunately, due to the political instability in the state, Goa has now become one of the worst administrations to get approvals and licenses for opening new hotels; and that is hurting the state as its economy is highly reliant on tourism. At present, we are only aware of one large resort under active construction and this makes Goa one of the favourite places for development.
Delhi-National Capital Region (NCR) is perhaps the only market in the country that continues to receive constant media focus on new hotel supply. HVS is currently tracking at least 60 different hospitality projects being developed in the NCR, in time for the Commonwealth Games next year (October). It's interesting to note that at its peak in 2007 this number touched 100 projects. The city will see a growth of 192% over its existing supply (16,560 rooms). However, we expect only 53% of all these projects to be built over the next five years. More importantly, a large number of these will not get completed before the games. HVS estimates that only 5,700 rooms will open before the Commonwealth Games. HVS associates have physically verified the development stages for each of these projects and have reported the numbers based on hotels under construction in Delhi, Gurgaon and Noida. In the short term, we expect the NCR to see a major rate correction.
The Hyderabad market has been adversely affected during the past year. Even though the city maintained a high compounded RevPAR growth of 11.2% over a fourteen-year period, it has seen sharp occupancy corrections in the past three years and average rates grew only in line with inflation. The city continues to see tremendous development in commercial building activity. An interesting analysis of the increase in construction can be made from the number of cranes being used in the city: five years ago this would have b e e n 5 - 6 ; b u t t o d a y, t h e r e a r e approximately 70–80 cranes. Many of the global IT and financial brands also continue to flock to this city, signifying scope for more growth. The city had an increase in rooms supply by 8.1% in the last 12 months. Expected new supply has declined by nearly 2,500 rooms and is now expected at 213% (5,884 rooms) growth in the next five years with a probability development factor of 73%. Our observation is that the highest growth is expected in the luxury and first class segment (63.1%), where the average rates are below US$150. Four first class and mid-
market brands – the Westin, The Park, Courtyard by Marriott, and the Taj Vivanta – are expected to open in Hyderabad in the next few months. This is expected to be followed by more budget and luxury hotels, all of which are under active construction. A good sign for the city is the growth in demand from the MICE s e g m e n t . W i t h t h e H y d e r a b a d International Convention Centre (HICC) reaching a stabilised level as it approaches its third full year of operations, it is beginning to generate demand for the rest of the city in terms of room nights. HVS remains optimistic about this city in the medium to long run and believes that the average rates will need to be low to attract business.
Jaipur continues to do well both as a Leisure and emerging Commercial destination. New supply is expected to grow by 199% (3,357 rooms), of which HVS believes 53% will actually get developed. Although some supply entered the market during the past 12 months, occupancies declined and average rates grew by inflation. Like before, we believe that new supply will get successfully absorbed, provided the projects are built to quality that matches the segments they compete for. Moreover, having their own individual unique selling points (USP) would give the hotels a better chance of absorption. Fortunately, 56.7% of the new supply is expected in the budget to mid market segments, which is excellent for the overall tourism potential of the city as well as fuelling more domestic travellers into Jaipur.
For the past few years, and again this year, Kolkata has been amongst the top performers. The city had the lowest declines in occupancy amongst the cities being tracked and was one of those that continued to see an increase in terms of average rates. The city, however, has a small base and therefore we can expect a growth of 293% (4,025 rooms) in new rooms supply with a probability factor of 62% development taking place over the next few years. Last year, the number of projects announced was much higher; though, this has now significantly reduced which makes this city once again an attractive destination for growth. However, the state government took a serious image beating after the controversy surrounding the manufacture of the Tata's Nano car and more recently the withdrawal of IT companies setting up their campus in the state. Should new investments in the state and Kolkata in particular not be supported by the state
HVS Hospitality Services 11
2009 Edition
administration, we expect the hospitality sector to decline. Of the few developments in the pipeline, we believe currently there is too much focus on the luxury and first class segments and not enough on the budget front.
The Mumbai market has been able to retain the average rates but saw a sharp decline in occupancy. We expect a strong recovery in the city demand after the decline witnessed in November and December 2008. Being the commercial capital of India, as the economy rebounds and the business traveller makes a comeback we believe Mumbai will be amongst the first cities to see strong demand growth. The city has a supply growth pipeline of 168% (13,386 rooms). Of this, we expect 73%(the highest in metro locations) to actually get built. Mumbai continues to offer fantastic opportunities for new hotel development as demand certainly continues to be strong. With all the various redevelopment/rehabilitation schemes of mill lands and the master development of Mumbai's international airport, we expect there to be good opportunities for hotels to come up during the next decade or so. Till then, we will continue to see good growth rates and reasonably healthy occupancy levels.
Pune saw a growth in room supply of 12.8% in 2008/09, but a decline in the city performance owing to a drop in demand primarily from the IT/ITeS sectors. The new supply remains strong at 531% (8,054 rooms); however, most of the new development is spread across a large geographical area and in the future we believe the city will develop individual micro markets like Chakan, Ranjangaon and Talegaon. With a 52% probability factor of all these rooms actually opening, we believe that Pune will see a correction in both occupancy and average rates over the short to medium term. At this stage, HVS is tracking close to 30 projects in this market, a few of which are expected to get delayed further.
Despite these developments, HVS believes there would be opportunities in certain micro markets provided the product positioning is appropriate for the site. Future challenges on the room supply side are the exorbitant prices of land parcels and the high expectations of the landowners for the same. Many standalone real estate owners land banked thinking that they would sell ahead and make an early exit. However, with a change in sentiments this is now an enormous
challenge. While prices at a few locations have softened, it maybe a while before the others follow. The credit crisis has certainly added negat ively to the market sentiments. With the government taking adequate measures to tackle inflationary pressures and revive borrowing in the market, HVS believes transactions of hospitality projects in the future will be possible.
One worrying factor, though, is a growing misconception that the situation is returning to normal and rates can be increased as can be the valuations of hotel projects currently under construction. This may perhaps have its roots in last month's sharp rise of the Indian stock market. However, many analysts believe it to be overrated. We do believe that smart investors will be looking at cash flows of the project under development rather than what the sentiments or trends may be at the stock market. Therefore, in the short term we see fewer transactions but in the next three to four years we certainly see some good buying opportunities in the market as the credit crises will take over and property investors and developers will need to give way to the market.
The last year saw a correction in occupancy and average rates across most markets in the country. While this hurt hotel companies operating across all segments, it allowed for a price correction to realistic levels at par with similar brands in international locations. Due to the global economic slowdown, some new hotel supply, and inflationary pressures including fluctuations in fuel prices that forced the cost of air travel to increase, there has been a severe tightening of travel budgets, which resulted in a significant drop in occupancy. Hotels that were caught off guard as these events unfolded and continued to push for higher rates found their policy to be counterproductive as occupancy levels began to correct sharply.
In the future, valuations of hotels are expected to see a correction and this would actually be a good opportunity for serious investors to invest in incomplete hotel projects. While historical capitalisation rates or cap rates have never been available in India, we anticipate them to go upwards in the short to medium term and range possibly between 10.5% and 12.0%. However, while not generalising, we expect certain markets and particularly micro locations in major cities to be able to
Future Trends
swim against this trend. Mumbai, Chennai, Agra, and Goa appear to be the markets ready for further growth.
Another trend that we can see with the downturn is hotels and chains rethinking their revenue management strategies. In the current situation where the customer is searching for value propositions and has more choices, the sales managers cannot risk turning away customers by quoting unrealistic rates that the hotel services and facilities cannot justify. In the future, hotels are likely to more actively start using RevPAR to measure performance as well as to set targets for employees instead of using rates or occupancies, since RevPAR gives a more complete picture of the situation and can be used as a benchmark against other hotels. We also expect pricing to be based on seasonality patterns and customised to different segments, instead of having the same published rates for all customers. The rates need to be more flexible and packages and promotions need to be variable according to the type of customer, i.e. leisure, commercial etc.
Owing to the economic situation, we foresee hotels accounting for the return on each rupee spent on advertising and marketing across different channels. A more cost-sensitive approach that evaluates best options instead of advertising on all channels such as travel agents, online mediators, and GDS systems is likely. We also think that the current situation will prompt hotel managers and owners to scrutinise the performance of all revenue generating departments such as Spa, F&B, and Fitness Centres and evaluate options for alternate revenue generation from the local market instead of relying completely on room revenue for contributing to the bottomline.
We also expect the growing need for professional Asset Managers who can step in and provide an unbiased third party opinion on hotel performances and suggestions to improve the bottomline.
India, in recent years, started observing the introduction of quality budget and mid market hotels. Domestic brands like Lemon Tree, Hometel, and Fortune and international brands like Ibis, Etap by Accor, and Premier Inn are going to transform the budget and mid market sectors. Many of these new brands mentioned above continue to build very cost-effective hotels and clearly are not over-spending like some of their full service counterparts in the same locations.
12 HVS Hospitality Services
2009 Edition

HVS believes that owners who visit and see these projects will be convinced that they do not have to build beyond standard product specifications. International brands are also aligning their product specifications to suit the Indian market; however, their product threshold costs are still too high to justify entry into newer and smaller markets in India. With a tightening in availability of equity capital and debt, we hope and expect there to be a consensus on this issue between brands, developers and financial institutions. Additionally, the benefit in reduction of construction raw material by 10-15% in the past year will help to support more mid market and budget hotel developments.
Amongst the cities tracked, our favourite destinations for investment continue to remain Mumbai and Goa. We expect to regain demand at both these locations over the foreseeable future. We foresee the possibility of viable large format hotels, which have not yet been tested in India but can be extremely healthy for the bottomlines. Opportunities for such development exist in locations closer to the new airports in Delhi and Mumbai since they are close to the city centres. There also remains a scarcity of units for the extended stay segment. In fact, industrial and manufacturing areas could also be good locations for budget hotels. Locations in Gujarat, Orissa and the Northeast also probably hold out good possibility for mid market and budget hotels. A few smaller s t a t e c a p i t a l s l i k e L u c k n o w, Bhubhaneswar, and Bhopal may also provide opportunities for development in the mid market or budget space.
We also continue to believe that there are huge opportunities in the leisure space. As we have mentioned previously too, India is certainly ready for family destination resorts built to international standards. These could be done near both the eastern and western coastlines or within short distances of major cities. It is important that these destinations be built to international standards and offer value for money to the families they target. These destination resorts can also target the MICE segment. Similarly, the Himalayan range offers a whole host of opportunities for leisure development.
Going forward, large industrial parks and locations near existing and new airports remain hot spots for hotel development and offer good opportunities. Some of these should be looked at from a mixed-used development format which will
Opportunities
ensure that price of land is shared with other components. However, this can only happen for hotels that have a budget orientation or are at best mid market; the developer will have to customise the mall to the hotel and not the other way around. We are already seeing this in many locations and expect this trend to grow significantly in the future.
The Hotels in India – Trends & Opportunities – 2009 edition has been developed for the benefit of employees, developers, investors and operators with an interest in the tourism industry in India. The study has been made possible only with the contribution and support of all the domestic and international hotel chains, to which HVS would like to express its gratitude and appreciation.
If you or any of your colleagues would like to receive complimentary copies of this publication, or HVS Executive Search information, kindly send your e-mail address along with full contact details to Swarn Jai t ly at . Alternatively, please visit our website
and register yourself.
HVS Hospitality Services is the world's leading full-service consulting and appraisal firm devoted exclusively to the hospitality industry. Founded in 1980 in the United States, the company has 22 offices across the globe. Since 1980, HVS has consulted with over 19,000 hotels in more than 70 different countries worldwide. In South Asia, HVS has a Consulting & Valuation division and an Executive Search office in Delhi while the Mumbai office is dedicated to Executive Search. Two years ago, we initiated two additional services, namely Marketing & Communications Services, and HVS Web Strategies. The company has recently launched its third division in India catering towards HVS Asset Management & Operational Advisory Services.
The New Delhi team has worked on a wide range of projects that include feasibility and marketing studies; valuation of hotels; residual land values; operator search and management contract negotiations; development strategies for new brands; research reports and investment services. Our clients in India include Indian Hotels, EIH Ltd, ITC Hotels, Park Group, Hotel Leela Venture Ltd, Accor, Intercontinental Hotels & Resorts, Mandarin Oriental, Carlson Hospitality, Global Hyatt, Hilton International, Merrill Lynch, Lehman
Acknowledgements
About HVS
s jai t [email protected]
www.hvs.com
Bros., Credit Suisse, GIC, AIG, IFC, ICICI Bank, Sun Group, Emaar (Dubai), Kingdom Hotel Investments, DIAL and MIAL amongst others.
Manav Thadani joined HVS New York office as a Consultant and Valuation Analyst in September 1995. After working with the New York and London offices of HVS, he relocated to Delhi to open HVS's first Asian office in India, which was established in New Delhi in 1997. As Managing Director and Partner of the New Delhi office he is responsible for all HVS activities in the region including Consulting & Valuation, Executive Search, Marketing & Communications Services, and HVS Web Strategies. Recently, he also helped set up HVS Asset Management & Operational Advisory Services.
Manav holds a Masters degree in Food Service Management from New York University (NYU), prior to which he completed his undergraduate education in hotel management at NYU. He is also a regular speaker at various hospitality / real estate industry conferences and plays host to the annual Hotel Investment Conference – South Asia (HICSA). He would also be playing host to the upcoming Hotel Operations Summit India (HOSI) to be held in December 2009.
Inshita Wij joined HVS New Delhi in August 2009 as a Consulting & Valuation Analyst. Inshita holds a B.Sc. in Hotel Administration from Cornell University, I thaca and a Dip loma in Hote l Management from Les Roches School of Hotel Management, Switzerland.
During her stay in Switzerland, she worked for the Hotel Novotel, Geneva and the Best Western Hotel Astoria, Geneva where she gained thorough knowledge of hotel operations. In India, Inshita started her career with the Starwood corporate office in New Delhi as an intern in the Training and Development division. She then moved to HVS New Delhi after completing her studies at Cornell.
We would also like to acknowledge the efforts and contributions of Bhaskar M. B. Baruah - Associate, Sapna Gill - Research Associate, Gaurav Sharma - Creative Designer and Avantika Singh - Editor for their support in getting this article published.
About the Authors
HVS Hospitality Services 13
2009 Edition

April 7 - 8, 2010, Grand Hyatt, Mumbai, India
www.hicsaconference.com
14 HVS Hospitality Services

6th Hotel Investment Conference - South Asia (HICSA) 2010
A FEW CONFIRMED SPEAKERS
Eric Danziger, President & CEO - Wyndham Worldwide
Frits van Paasschen, President & CEO - Starwood Hotels & Resorts
Mark Hoplamazian, CEO - Hyatt Hotels Corporation
Gamal Aziz, President & CEO - MGM Mirage Hospitality
Gerald Lawless, Executive Chairman - Jumeirah Group
Nakul Anand, Divisional Chief Executive - Hotel Division, ITC
Raymond Bickson, MD & CEO - Taj Hotels Resorts and Palaces
Martin Rinck, President - Asia Pacific, Hilton Hotels
Jean-Marc Busato, MD - Asia Pacific, Carlson Hotels Worldwide
India
HVS Hospitality Services 15

OFFICES:DIVISIONS
HVS6th Floor, Tower - C, Building No. 8DLF Cyber City - IIGurgaon 122 022 INDIAPhone : 91 124 461 6000
ADDRESS CORRECTION REQUESTED
•
•
•
•
•
•
•
•
•
•
•
•
•
•
•
•
Consulting & Valuation Services
Executive Search
Investment Banking
Asset Management & Strategic
Advisory Services
Hotel Management
Hotel Parking Consulting
Food & Beverage Services
Gaming Services
Convention, Sports & Entertainment
Facilities Consulting
Interior Design
Sales & Marketing Services
Shared ownership Services
Golf Services
Ecotel Certifications
Web Strategies
Risk Management
Asia - Pacific
Europe
North America
New Delhi
Mumbai
Beijing
Hong Kong
Shanghai
Singapore
Athens
London
Madrid
Moscow
Atlanta
Boston
Boulder
Chicago
Dallas
Denver
Las Vegas
Mexico City
Miami
New York
Newport, RI
San Francisco
Toronto
Vancouver
Washington DC
Buenos Aires
São Paulo
South America
Dubai
Bahamas
Middle East
Caribbean
HOTELS IN INDIA – TRENDS & OPPORTUNITIES
16 HVS Hospitality Services