hotel feasibility study - rk consulting services, inc
TRANSCRIPT

Hotel Feasibility Study
Clarion Inn and SuitesColumbia, Pennsylvania
This report is provided in accordance with and subject to the RK Consulting Services, Inc. Agreement. It is designed to be accurate and authoritative, based on information obtained from third parties that we believe to be reliable. RK Consulting Services, Inc. does not, however, warrant or guarantee in any way the accuracy, completeness or fairness of the information provided. This report and the information contained herein are confidential and intended for our individual client's specifically authorized use.
COPYRIGHTED

Hotel Feasibility Study
Clarion Inn and SuitesColumbia, Pennsylvania
Table of Contents : Page Section NumberSummary of Work
Description of the Assignment 1Scope of Work 2Executive Summary 3
Estimated Valuation of AssetValuation Method 5Estimated Valuation of Subject Hotel 6
Site Location and DescriptionDescription of the Site and Location 8Aerial shot of Building 9
Choice Hotels International Clarion ® Hotels 10 Recent Article in Hotels Magazine on new Choice Reservation System 12
Local Area Descriptions and AttractionsCommonwealth of Pennsylvania 13Lancaster County, Pennsylvania 16
Top Employers in the Area 19Borough of Columbia, Pennsylvania 22 Excerpts from a Recent Article on Keystone Edge Website 25
Travel Markets for HotelLeisure Travel Market 26Corporate Travel Market 27 Article in Lodging Magazine: Surge in Consumer, Business Sentiment 29
Local Hotels in Competitive SetRating Star System 30Rating of Competitive Set 31Description of Competitive Hotels 32Trend Report Competitive Set Smith Travel Research (STR) 35STR Trend Report Analysis
Occupancy Analysis 36 Average Daily Rate (ADR) Analysis 37 Revenue Per Available Room (RevPAR) Analysis 38 Rolling 12 Month Day by Day Analysis 39
Day of the Week Analysis - Competitive Set 40Amenity Profile by Hotel - Competitive Set 42Amenity Profile by Hotel - Nationally 43
Hotel Projects Under ConstructionSummary of Closest Hotels by Chain Type 44Pipeline Projects 25 Mile Radius from Site 45
Estimated Construction CostsAnalysis of Construction Costs 47
Projected Cost of Construction 4910 Year Proforma Analysis
Notes to 10 Year Proforma Subject Hotel 50 10 Year Proforma 52 Returns Analysis 54
Appendix1. CBRE Cap Rate Survey Hotels - 2017 First Half Philadelphia2. Smith Travel Historical Trend Report - Lancaster and Columbia PA3. Term Sheet First EDC Finance Corporation dated 11/11/20174. Article on Keystone Edge Website dated 02/20/2018
This report is provided in accordance with and subject to the RK Consulting Services, Inc. Agreement. It is designed to be accurate and authoritative, based on information obtained from third parties that we believe to be reliable. RK Consulting Services, Inc. does not, however, warrant or guarantee in any way the accuracy, completeness or fairness of the information provided. This report and the information contained herein are confidential and intended for our individual client's specifically authorized use.
COPYRIGHTED

PO Box 715 15 West Montauk Hwy Suite 150 Hampton Bays, NY 11946 Hampton Bays, NY 11946 Cell Phone: (631) 804-8084 Phone: (631) 728-2300 www.rkconsulting-inc.com
Description of Assignment The enclosed Report describes the projections regarding the proposed project of constructing a hotel on the site mentioned below. The reader should be aware that the report is based upon numerous estimates, projections and assumptions developed from our research of the area, as well as our own experience as hospitality professionals. The basis of the estimates and assumptions for the projected occupancy and average rate are stated in the Report. In reviewing the Report, it should be noted that changes that affect the estimates and assumptions upon which this Report is based, as well as unanticipated events and circumstances, inevitably will occur, and that the actual results may differ materially from those in the Report. Moreover the estimates and assumptions used in the Report are based upon conditions as of the date of the Report, which, of course are subject to change thereafter.
The purpose of this assignment is to evaluate the lodging market in the vicinity of the Borough Columbia, Pennsylvania and the Lancaster area of Pennsylvania are in order to forecast the business levels, including occupancy and average rate of a proposed Clarion Inn and Suites by Choice Hotels hotel on the site at 12 N. Second Street, Columbia, Pennsylvania. The assumption is the proposed two and a half star service level hotel will contain a total of 60 rooms. This assumption is based on the information provided to this agency by the client, the Borough of Columbia Board located in Columbia, Pennsylvania as well as the developer of the project, Cimarron Investments, LLC. .
Please note that the scope of work for this phase of the project excludes the investigation of zoning issues, local building ordinance and any legal and/or physical issues that may arise over the proposed development of the site. For the purpose of this study it is assumed that the proposed development of the hotel can legally and physically move forward along the guidelines set forth.
This Report and the Projections herein assumes that the construction of the hotel on the proposed site can be completed by on or about June 1, 2019. It should be noted that the following study or the scope of the work of this study does not include detailed verification of this assumption. However, based our general knowledge of and experience in the lodging industry, the construction timing estimates of roughly 12 to 18 months to complete this project is consider to be at the around the norm of industry standard of building a two and half star hotel.
The proforma created for this study was created using specific financial information of the area hotels provided by Smith Travel Research. The assumption taken is the hotel proposed for the site will be the highest level of service for hotels in the area. Currently the site location and surrounding area has a limited number of hotel rooms. This market study provides a description and evaluation of the market area, the proposed site to be utilized for the facilities. Also included is an analysis of the surrounding area hotels of the Borough of Columbia, Pennsylvania and concludes with projections of the proposed subject property’s occupancy and average rate.
Page 1 CO
PYRIGHTED

Confidential March 16, 2018
Scope of Work All the information was collected and analyzed by RK Consulting Services, Inc. and its support staff. Data such as site location, proposed use of property, and identification and so forth was supplied by the client the Borough of Columbia Board as well as the developer of the project, Cimarron Investments, LLC. This study was prepared with a physical inspection of the site and a physical review of the existing hotels in the general area of the subject hotel location. This is a standard practice in the preparation of such a detailed study.
The purpose of this study is to examine if there exists the need for a Clarion Inn and Suites by Choice Hotels hotel on the site at 12 North Second Street, Columbia where such a brand does not exist currently. This study will examine if it is a viable and profitable option for a potential developer as well as developing partners who may express an interest in participating in the project.
This feasibility study provides a description and evaluation of the market area as well as the proposed site to be utilized for the facilities. In order to develop this study, a group of competitive hotels were selected by a process based on the size of the competitor’s hotel and its proximity to the subject site. This study also includes an analysis of economic factors of the area as well as identifying the potential travel markets which may provide potential revenue stream for the hotel once it is opened and operating.
The proforma’s created for this study was created using specific financial information of a group of selected area hotels. This information was provided by Smith Travel Research (STR). STR is a third party research company based in Hendersonville, Tennessee, that tracks supply and demand indicators for the hotel industry and provides market share analysis for all major hotel chains and brands as well as independent hotels in the United States, Canada, Mexico and the Caribbean.
A radius of 25 miles was used in the selection process of the five hotels. The five hotels are similar in size and service levels. The five hotels are:
1. Comfort Inn Lancaster County 2. Holiday Inn Express & Suites Lancaster Lititz 3. Hampton Inn & Suites Mount Joy Lancaster West 4. Fairfield Inn & Suites Lancaster 5. Country Inn & Suites Lancaster
There is a complete analysis of 5 Area hotels, including quoted rates, amenities offered, and business levels. The business levels analysis are established as the group of five hotels (listed above) were selected as the competitive set for the proposed hotel.
Also included in the scope of work was an interview with the President of the Discover Lancaster Tourism Board as well with the Director of Sales for the Lancaster Marriott at Penn Square which operates as the convention space for the City of Lancaster. Also included was identifying any new hotel projects in construction or planning stages or recently opened hotel projects in the area and the potential impact of those projects on the proposed hotel construction at the designated site. This study also includes an analysis of demographics in the area as well as the economic growth as well as any potential local government incentives which may be considered for building the Proposed Hotel in the Borough Columbia, Pennsylvania.
Page 2
COPYRIGHTED
Confidential March 16, 2018
Executive Summary Discussion: The Borough of Columbia and the surrounding area of Lancaster, PA have a total of 108 hotel properties. These hotels range from Limited or Select Service Hotels (Best Western Motor Inn) average rating of 2 Stars or less to a 2.5 Star Select Service hotel (Holiday Inn and Suites). The average occupancy percent is 64.9% Year Ending 2017 for Competitive Set of the five hotels selected in the area. (STR Report on page 35) Bearing in mind the area is a mainly considered a rural area to a larger city such as Philadelphia these business levels are considered to be healthy in the current environment. Additionally, the Average Daily Rate (ADR) of $124.95 Year Ending 2017 presented in the STR Report supports a solid price point for hotels in this area compared to other Fourth Tier Markets in USA. Throughout the research and gathering of information for this project, certain indicators support the viability of the proposed project of Clarion Inn and Suites by Choice International on the subject site. The first indicator is the Future Valuation at Year Five was analyzed for the proposed hotel. As reflected on Pages 6 and 7 the future estimated valuation of the hotel reflects extremely well even when considering a conservative approach on the Cap Rate of 9.00% compared to a market currently reporting an average Cap Rate of 7.75% – 8.50% (See table on Page 5) on similar commercial transaction in the same type of facilities in the suburban area of Philadelphia The residual value calculated based on the 9.00% Cap on $709,329 Net Operating Income (NOI) is $7.9 Million Dollars. This a conservative increase of $1.7 Million over the initial project costs of $6.2 Million dollars. This estimated five year value will result, after all debt and equity on the hotel has been satisfied, a Net Profit of $3.6 Million will remain after the liquidation of the asset. Based on the projections in the 10 year proforma, the hotel operations also averages a Debt Service Coverage Ratio of 1.52. The Debt Service Coverage Ratio is presented in the 10 Year Proforma by year on the bottom of Page 53 The second indicator is the tremendous opportunity which may present itself with operating a Select Service hotel such as Clarion Inn and Suites in this area. This hotel will offer travelers an option to stay outside of the Lancaster city limits and is closer to tourist attractions like the Turkey Hill Experience and the Watch and Clock museum located within the Borough of Columbia. Additionally, two out of the top three hotels on “TripAdvisor.com” are the newer hotels in the area which have opened in the last four years. This trend shows that most travelers to the area prefer a newer product to older, outdated accommodations. This trend would most likely have a positive impact on any new hotel opening in the area. The third indicator is the future demand of the area in and around Columbia. The opportunity of bringing another hotel to the area coupled with the demand for rooms in the area; makes the concept of developing the hotel attractive. The market appears to be a strong leisure travel market; as illustrated in the Day of the Week Analysis on pages 40 and 41. Additionally, Director of Sales for the Lancaster Marriott at Penn Square, Josh Nowak, revealed in that there are an estimate 22 to 25 weekends a year in the area when the occupancy levels are so saturated that hotels beyond the city limits of Lancaster are enjoying a direct impact from the increased demand during those weekends. The demand is primarily created through weekend trade shows and sports tournaments in the area. This factor will most likely be very beneficial to the subject hotel.
Page 3 COPYRIGHTED

Confidential March 16, 2018
Executive Summary Discussion (Cont’d): The fifth indicator is the new hotel development happening not only in this area but nationwide. Across the northeast and the nation, the hotel industry is continuing to reclaim some of the ground that was lost during the past recession. However some of that ground is literal, with slowed or stalled development initiatives, and some of it is figurative, with at-times surprisingly steep drops in rates compounding the difficulties introduced by sagging demand. Most of the stronger development is happening in large urban markets like New York and Philadelphia. While the pace of recovery has been steady, there are some noteworthy trends which are beginning to emerge both within individual markets and across the broader industry. A snapshot of the Columbia, PA market and any new projects in a 25 mile radius of the hotel has revealed only two projects. One is the renovation of the historic, 124-room Yorktowne Hotel with a renovation budget of $20 million and repositioning the hotel as an upper-class accommodation; it will not be considered a competitor of the subject hotel. The other project is a Hampton Inn with 85 rooms. The project is located about 22 miles from the proposed subject site and will most likely not be competing with the subject hotel because of the distance. Overall, hotel development is viewed as one of the riskiest lending categories, and while the purse strings for construction lending have loosened up somewhat, credit is still in relatively short supply. This factor along with the increased demand from the Corporate Travel Market begins to loosen their purse strings as a potential result of the most recent tax cuts being initiated in 2018 could possibly benefit this new development because of the sparse number of new hotel projects in area. Finally, there is one more concern perhaps is will the economic recovery in the hotel industry continue on its positive trend? The U.S. hotel industry is projected to report continued modest growth through 2018, according to STR and Tourism Economics' latest forecast:
For total-year 2017, the U.S. hotel industry is predicted to report a 0.5% increase in occupancy to 65.3%, a 2.1% rise in average daily rate (ADR) to US$127.13 and a 2.5% increase in revenue per available room (RevPAR) to US$82.98. This is primarily due to the demand increase being larger than the supply increase (2.4% to 1.9% respectively). Looking forward to 2018, STR and Tourism Economics are projecting a slightly larger supply increase of 2.0% compared to a demand increase of 1.9% resulting in basically static decrease in occupancy of 0.2%. It should be noted that the projection for 2017 had a demand increase of 1.9% in the original Outlook at the beginning of 2017; which had to be adjusted in the last quarter of 2017 to a demand increase of 2.4% or a 25% improvement over 1.9%. After considerations of all indicators presented; it is the professional opinion of this agency that there exists a strong opportunity in this marketplace for the project of the developing the hotel detailed in this report.
Page 4
COPYRIGHTED

Confidential March 16, 2018
Valuation Methodology The net income capitalization approach is based on the principle that the value of a property is indicated by its net return, or what is known as the "present worth of future benefits." The future benefits of income-producing properties, such as hotels, are factors of the net income estimated by a forecast of income and expense along with the anticipated proceeds from a future sale or refinancing. These benefits can be converted into an indication of market value through a capitalization process and discounted cash flow analysis. Capitalization rate ranges are best estimates provided by CBRE Group’s professionals based on recent trades in their respective markets as well as communications with investors. The CBRE Cap Rate Survey for the first half (H1) 2017 found modest increases in cap rates for U.S. downtown hotels that fell in line with the increases reported for the office sector. Every hotel market segment in CBDs (i.e., luxury, full-service, select-service and economy) has recorded single-digit upticks in cap rates ranging from 4 to 8 bps. The average cap rate for all CBD tiers stood at 7.98%. Note that economy hotels are not as prevalent in CBDs as they are in the suburbs. The spread between suburban and CBD hotels remained unchanged at 53 bps (8.49% vs. 7.98%). CBD hotel cap rates were similar to those in 2016, widening modestly across nearly all tiers and market segments. Pricing in Tier III locations held up better than Tier I and II. The exception was select-service, which compressed by 8 bps. This trend is in line with suspected shifts in investor sentiment away from top-tier CBDs, where relatively strong supply growth has pushed investor interest into lower-tiered locations. The highest suburban, full-service hotel cap rates for Tier I and II metros are in West Palm Beach (9.00%), Boston (8.75%), Houston (8.75%) and the Inland Empire (8.75%). Miami and Ft. Lauderdale suburban markets also had above-average cap rates in H1 2017. The South Florida hotel markets continue to be affected by continued construction of new hotels.
CBRE professionals expect increases in all CBD hotel cap rates in the second half of 2017, resulting from anticipated increases to the 10-year Treasury rate. Hotel cap rates are highly correlated with Treasury rates, although their movements are much less than one-to-one with Treasury’s Rates. (Source: CBRE Research).
Page 5
** CBD = Central Business District First Half 2017 First Half 2017CBD** Stabilized Suburban Stabilized
Source Cap Rate Cap RateCBRE Rate Survey Philadelphia, PA 8.75% - 9.25% 9.75% - 10.25%Economy HotelsFirst Half 2017CBRE Rate Survey Philadelphia, PA 7.50% -8.50% 7.75% - 8.50%Select Service HotelsFirst Half 2017
CBRE Rate Survey Philadelphia, PA 7.25% - 8.00% 7.50% - 8.25%Full Service HotelsFirst Half 2017
CBRE Rate Survey Philadelphia, PA 6.00% - 6.50% 6.50% - 7.00%Luxury Service Hotels First Half 2017Source: CBRE Rate Survey First Half 2017See Appendix 1COPYRIGHTED

Confidential March 16, 2018
Estimated Valuations of Hotel Operations in Year 5: In taking a conservative approach to this project; a capitalization rate of 9.00% was used to determine the future value of the project in Year 5 based on the 10 Year Proforma. The assumption is being taken that dissolution of the asset will occur in year 5 of operations. This is for the purposes of reflecting a potential exit strategy for any investor or lender interested exiting or in refinancing the project. Table A below is taken from the information on the Return Analysis located on Page 54 of this report. The residual value calculated based on the 9.00% Cap on $709,329 Net Operating Income (NOI) is $7.9 Million Dollars. This a conservative increase of $1.7 Million over the initial project costs of $6.2 Million dollars.
The details of the estimated sale or dissolution of the Asset are detailed below. The calculation begins with the Estimated Value in year 5 of $7.9 Million. There is a Surplus of Cash of $1.0 Million after the debt has been served from the hotel operation cumulative over the 5 year period. The Balance of the Reserve of the Furniture Fixtures and Equipment (FFE) is $120,698. Since the developer is contributing $1.2 million US Dollars for an Equity Position of Twenty Percent (20%), that amount will be paid out in year five. Additionally, the mortgage balance of $4.1 Million will be satisfied. The $4.1 Million represents the principal balance remaining on the 60 month or 5th Year of the note.
As noted above in Table B a Net Profit of $3.6 Million will remain after the liquidation of the asset and the repayment of the Equity to the developer. This amount is enough of a capital investment to refinance the property.
Page 6
Clarion Innand Suites
Columbia, PATable A Year 5Equity Contribution 1,240,443$ Total Cash Flow (NOI) 5 Years 2,931,222Annual Debt Service (1,923,849)Net Operting Income Yr 5 709,329Estimated Residual Value 7,881,437
Clarion Innand Suites
Columbia, PATable B Year 5Estimated Value Year 5 based on 9.0% 7,881,437Surplus after Debt Year 5 1,007,373FFE Reservce 120,698Equity (1,240,443)Mortgage Balance (4,122,246) Net Cash Flow $3,646,819COPYRIGHTED
Confidential March 16, 2018
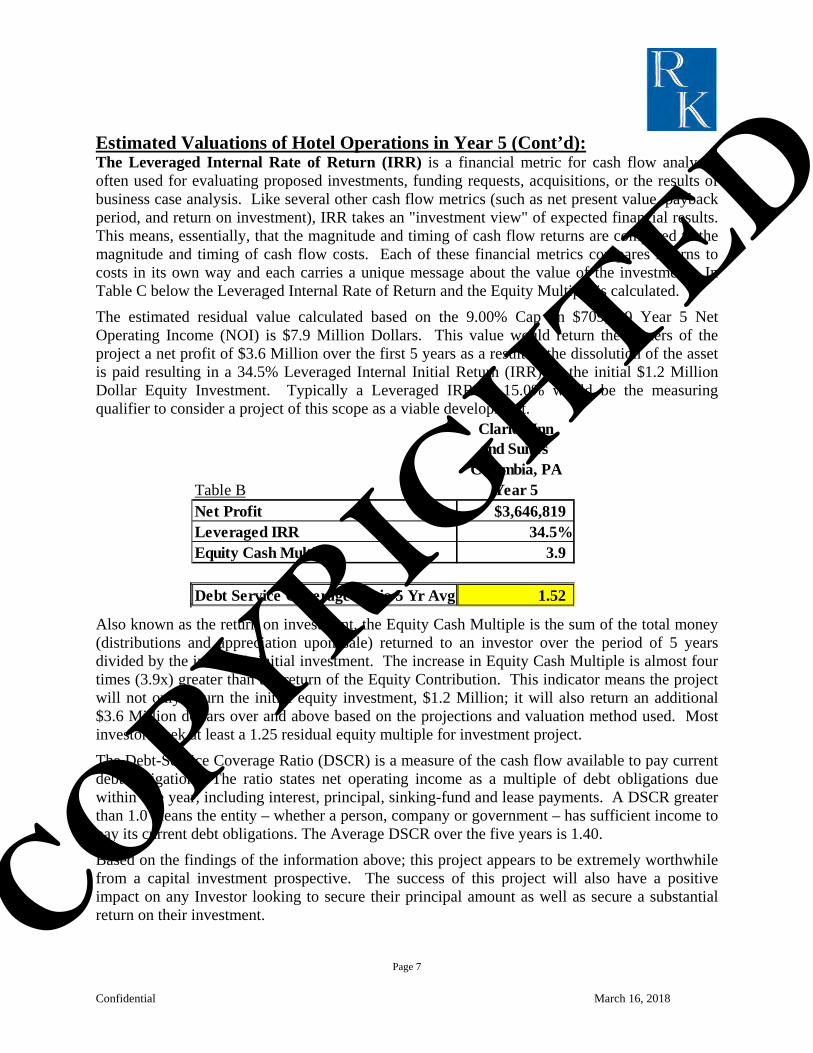
Estimated Valuations of Hotel Operations in Year 5 (Cont’d): The Leveraged Internal Rate of Return (IRR) is a financial metric for cash flow analysis, often used for evaluating proposed investments, funding requests, acquisitions, or the results of business case analysis. Like several other cash flow metrics (such as net present value, payback period, and return on investment), IRR takes an "investment view" of expected financial results. This means, essentially, that the magnitude and timing of cash flow returns are compared to the magnitude and timing of cash flow costs. Each of these financial metrics compares returns to costs in its own way and each carries a unique message about the value of the investment. In Table C below the Leveraged Internal Rate of Return and the Equity Multiple is calculated. The estimated residual value calculated based on the 9.00% Cap on $709,329 Year 5 Net Operating Income (NOI) is $7.9 Million Dollars. This value would return the owners of the project a net profit of $3.6 Million over the first 5 years as a result to the dissolution of the asset is paid resulting in a 34.5% Leveraged Internal Initial Return (IRR) on the initial $1.2 Million Dollar Equity Investment. Typically a Leveraged IRR of 15.0% would be the measuring qualifier to consider a project of this scope as a viable development.
Also known as the return on investment, the Equity Cash Multiple is the sum of the total money (distributions and appreciation upon sale) returned to an investor over the period of 5 years divided by the investor's initial investment. The increase in Equity Cash Multiple is almost four times (3.9x) greater than the return of the Equity Contribution. This indicator means the project will not only return the initial equity investment, $1.2 Million; it will also return an additional $3.6 Million dollars over and above based on the projections and valuation method used. Most investors seek at least a 1.25 residual equity multiple for investment project. The Debt-Service Coverage Ratio (DSCR) is a measure of the cash flow available to pay current debt obligations. The ratio states net operating income as a multiple of debt obligations due within one year, including interest, principal, sinking-fund and lease payments. A DSCR greater than 1.0 means the entity – whether a person, company or government – has sufficient income to pay its current debt obligations. The Average DSCR over the five years is 1.40. Based on the findings of the information above; this project appears to be extremely worthwhile from a capital investment prospective. The success of this project will also have a positive impact on any Investor looking to secure their principal amount as well as secure a substantial return on their investment.
Page 7
Clarion Innand Suites
Columbia, PATable B Year 5Net Profit $3,646,819Leveraged IRR 34.5%Equity Cash Multiple 3.9
Debt Service Coverage Ratio 5 Yr Avg 1.52
COPYRIGHTED

Confidential March 16, 2018
Description of the Site, and Area Location The site is a three story brick and timber warehouse with Susquehanna River Views. It is located near prime downtown Columbia with Public Parking lots nearby; the building is in the heart of the growing Columbia, PA Antiques and Arts district. It is close to the local Farmers Market, the new Brew Pub and various large Antique Malls. The site consists of multiple buildings including just less than 30,000 SF of floor space on 4/10 acre. Below are some images of the building: Street Level Exterior
Interior Images
Page 8
COPYRIGHTED

Aerial Shot of Building
Page 9
This report is provided in accordance with and subject to the RK Consulting Services, Inc. Agreement. It is designed to be accurate and authoritative, based on information obtained from third parties that we believe to be reliable. RK Consulting Services, Inc. does not, however, warrant or guarantee in any way the accuracy, completeness or fairness of the information provided. This report and the information contained herein are confidential and intended for our individual client's specifically authorized use. COPYRIGHTED

Confidential March 16, 2018
Choice Hotels International: Choice Hotels International, Inc. (NYSE: CHH) is one of the largest and most successful lodging companies in the world. Choice currently franchises more than 6,800 hotels, representing more than 500,000 rooms, in more than 40 countries and territories. Ranging from limited service to full service hotels in the economy, mid-scale and upscale segments, Choice-branded properties provide business and leisure travelers with a range of high-quality, high-value lodging options throughout the United States and internationally. Choice Hotels International, Inc. is a hospitality holding corporation based in Rockville, Maryland, in the United States. The company owns the hotel and motel brands Comfort Inn, Comfort Suites, Quality Inn, Sleep Inn, Clarion, Cambria Hotel & Suites, Mainstay Suites, Suburban Extended Stay, Econo Lodge, Rodeway Inn, and Ascend Hotel Collection. Choice Hotels’ headquarters is located in Rockville Town Center. Choice Hotels recently opened its brand new state of the art 200,000 square feet corporate headquarters in Rockville. The company was started in 1939 as Quality Courts, a referral chain consisting of seven motel owners in the South. It published the names of all properties complying with its standards and referred guests to the member properties. Quality Inns was converted to Clarion Hotels in 1987. It represented a line of full-service hotels that offer travelers a variety of hotel styles and locations, from city centers to airports and resorts. Clarion® Hotels The Clarion brand believes life is better when you get together. No matter the occasion – business travel and meetings, special events and celebrations, vacations or weekend getaways, the Clarion brand offers convenient and affordable accommodations to make getting together possible. BRAND INFORMATION
• There are more than 300 Clarion® hotels around the world,including properties in Europe, Asia, South America and theUnited States.
• Clarion® hotels are located near top U.S. destinations, such asNashville, New York City and New Orleans.
• Clarion® properties are designed to support small and largesocial gatherings. Guests can Get Together Here and enjoy thefollowing accommodations at each Clarion hotel:
• Get Rest in our comfortable rooms with premium bedding• Get Social in our Bar and lounge area and spacious lobbies• Get Connected in our meeting and banquet facilities• Get a Bite in our restaurants and/or with our on-site catering services• Get Productive with free Wi-Fi and 24/7 business centers• Get Fit in our fitness facilities and/or swimming pool
• Clarion® hotel guests can participate in the award-winning Choice Privileges loyaltyrewards program, rated no. 1 in USA Today’s 10 Best Readers’ Choice Awards list.Source: Choice International Development website
Page 10
COPYRIGHTED

Confidential March 16, 2018
Guestrooms: Guest Rooms Thoughtfully designed to maximize the use of space and operational efficiency, the guest rooms feature an all-white bedding program on a platform bed, expansive window for plenty of natural light, clear visual access to lighting and power, a multi-functional chair, and inventive features like sound absorption solutions that become style elements in the space. The overall number of case goods is purposefully minimal with cleverly designed, highly usable surfaces. The room size ranges from 310 Square Feet to 380 Square Feet in size. The spacious bathrooms have been designed with a laser-focus on those things that matter most to guests – all with operational ease in mind. There is a really great shower with lots of light, ample storage space, and functional amenities.
Page 11
COPYRIGHTED
Confidential March 16, 2018
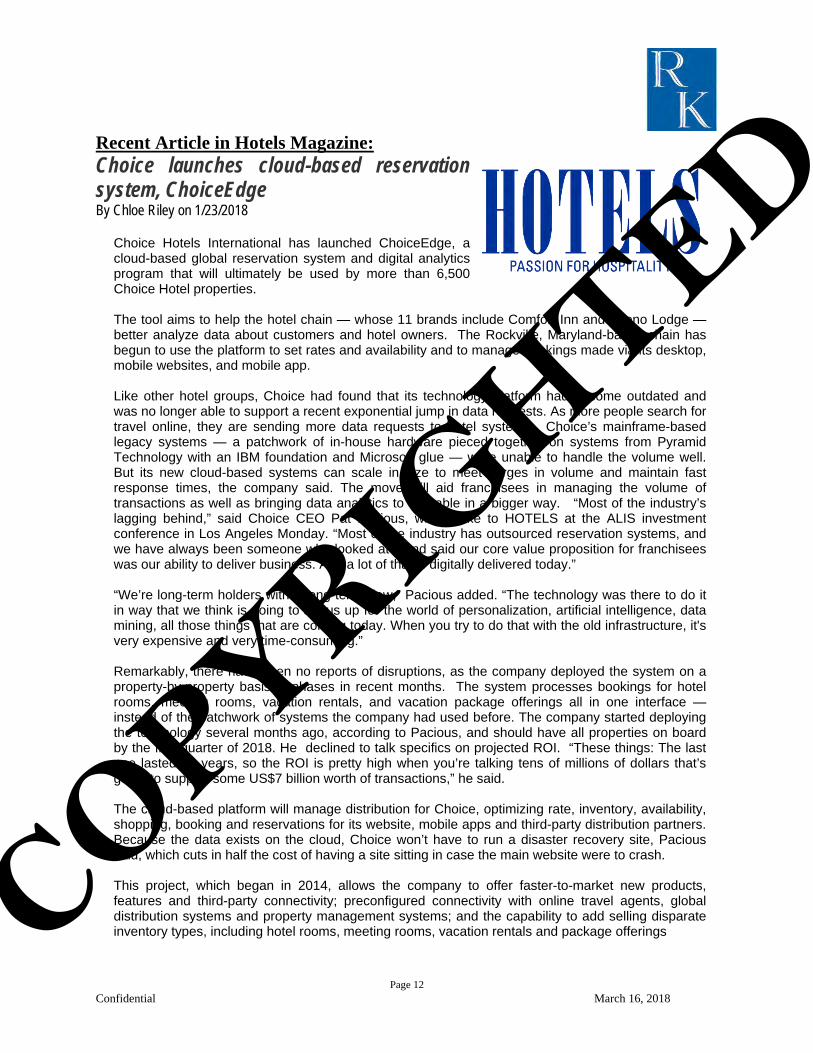
Recent Article in Hotels Magazine: Choice launches cloud-based reservation system, ChoiceEdge By Chloe Riley on 1/23/2018
Choice Hotels International has launched ChoiceEdge, a cloud-based global reservation system and digital analytics program that will ultimately be used by more than 6,500 Choice Hotel properties.
The tool aims to help the hotel chain — whose 11 brands include Comfort Inn and Econo Lodge — better analyze data about customers and hotel owners. The Rockville, Maryland-based chain has begun to use the platform to set rates and availability and to manage bookings made via its desktop, mobile websites, and mobile app.
Like other hotel groups, Choice had found that its technology platform had become outdated and was no longer able to support a recent exponential jump in data requests. As more people search for travel online, they are sending more data requests to hotel systems. Choice’s mainframe-based legacy systems — a patchwork of in-house hardware pieced together on systems from Pyramid Technology with an IBM foundation and Microsoft glue — were unable to handle the volume well. But its new cloud-based systems can scale in size to meet surges in volume and maintain fast response times, the company said. The move will aid franchisees in managing the volume of transactions as well as bringing data analytics to the table in a bigger way. “Most of the industry’s lagging behind,” said Choice CEO Pat Pacious, who spoke to HOTELS at the ALIS investment conference in Los Angeles Monday. “Most of the industry has outsourced reservation systems, and we have always been someone who looked at it and said our core value proposition for franchisees was our ability to deliver business. And a lot of that is digitally delivered today.”
“We’re long-term holders with a long-term view,” Pacious added. “The technology was there to do it in way that we think is going to set us up for the world of personalization, artificial intelligence, data mining, all those things that are coming today. When you try to do that with the old infrastructure, it's very expensive and very time-consuming.”
Remarkably, there have been no reports of disruptions, as the company deployed the system on a property-by-property basis in phases in recent months. The system processes bookings for hotel rooms, meeting rooms, vacation rentals, and vacation package offerings all in one interface — instead of the patchwork of systems the company had used before. The company started deploying the technology several months ago, according to Pacious, and should have all properties on board by the first quarter of 2018. He declined to talk specifics on projected ROI. “These things: The last one lasted 30 years, so the ROI is pretty high when you’re talking tens of millions of dollars that’s going to support some US$7 billion worth of transactions,” he said.
The cloud-based platform will manage distribution for Choice, optimizing rate, inventory, availability, shopping, booking and reservations for its website, mobile apps and third-party distribution partners. Because the data exists on the cloud, Choice won’t have to run a disaster recovery site, Pacious said, which cuts in half the cost of having a site sitting in case the main website were to crash.
This project, which began in 2014, allows the company to offer faster-to-market new products, features and third-party connectivity; preconfigured connectivity with online travel agents, global distribution systems and property management systems; and the capability to add selling disparate inventory types, including hotel rooms, meeting rooms, vacation rentals and package offerings
Page 12
COPYRIGHTED

Confidential March 16, 2018
Commonwealth of Pennsylvania: Pennsylvania, officially the Commonwealth of Pennsylvania, is a state located in the northern and Mid-Atlantic regions of the United States. T he Appalachian Mountains run through its middle. The commonwealth borders Delaware to the southeast, Maryland to the south, West Virginia to the southwest, Ohio to the west, Lake Erie and the Canadian province of Ontario to the northwest, New York to the north, and New Jersey to the east. Pennsylvania is the 33rd largest, the 6th most populous, and the 9th most densely populated of the 50 United States. The state's five most populous cities are Philadelphia (1,560,297), Pittsburgh (305,801), Allentown (118,577), Erie (100,671), and Reading (89,893). The state capital is Harrisburg. Pennsylvania has 51 miles (82 km) of coastline along Lake Erie and 57 miles of shoreline along the Delaware Estuary. The state is one of the 13 original founding states of the United States; it came into being in 1681 as a result of a royal land grant to William Penn, the son of the state's namesake. Part of Pennsylvania (along the Delaware River), together with the present State of Delaware, had earlier been organized as the Colony of New Sweden. It was the second state to ratify the United States Constitution, on December 12, 1787. Independence Hall, where the United States Declaration of Independence and United States Constitution were drafted, is located in the state's largest city of Philadelphia. During the American Civil War, the Battle of Gettysburg, was fought in the south central region of the state. Valley Forge near Philadelphia was General Washington's headquarters during the bitter winter of 1777–78. Demographics The United States Census Bureau estimates that the population of Pennsylvania was 12,802,503 on July 1, 2015, a 0.79% increase since the 2010 United States Census. In an earlier estimate, the state was 78.8% Non-Hispanic White, 11.4% Black or African American, 0.3% Native American, 3.0% Asian, 0.1% Native Hawaiian and Other Pacific Islander, 1.7% Two or More Races, and 6.1% Hispanic or Latino. Of the people residing in Pennsylvania, 74.5% were born in Pennsylvania, 18.4% were born in a different US state, 1.5% were born Puerto Rico, U.S. Island areas, or born abroad to American parent(s), and 5.6% were foreign born. As of 2013, Pennsylvania has an estimated population of 12,773,801, which is an increase of 10,265 from the previous year and an increase of 71,422 since the year 2010. Net migration to other states resulted in a decrease of 27,718, and immigration from other countries resulted in an increase of 127,007. Net migration to the Commonwealth was 98,289. Migration of native Pennsylvanians resulted in a decrease of 100,000 people. From 2008 to 2012, 5.8% of the population was foreign born. The state has an estimated 2005 poverty rate of 12%. The state also has the 3rd highest proportion of elderly (65+) citizens in 2005. Foreign born Pennsylvanians are largely from Asia (36.0%), Europe (35.9%), and Latin America (30.6%), with the remainder from Africa (5%), North America (3.1%), and Oceania (0.4%).
Page 13
COPYRIGHTED

Confidential March 16, 2018
Commonwealth of Pennsylvania (Cont’d) : Pennsylvania's Economy Pennsylvania's 2016 total gross state product (GSP) of $719.8 billion ranks the state 6th in the nation. If Pennsylvania were an independent country, its economy would rank as the 19th-largest in the world. On a per-capita basis, Pennsylvania's 2016 per-capita GSP of $50,665 ranks 22nd among the 50 states. Philadelphia in the southeast corner, Pittsburgh in the southwest corner, Erie in the northwest corner, Scranton-Wilkes-Barre in the northeast corner, and Allentown-Bethlehem-Easton in the east central region are urban manufacturing centers. Much of the Commonwealth is rural; this dichotomy affects state politics as well as the state economy. Philadelphia is home to 6 Fortune 500 companies, with more located in suburbs like King of Prussia; it is a leader in the financial and insurance industry. Pittsburgh is home to eight Fortune 500 companies, including U.S. Steel, PPG Industries, and H.J. Heinz. In all, Pennsylvania is home to 50 Fortune 500 companies. Erie is also home to GE Transportation Systems, which is the largest producer of train locomotives in the United States. As in the US as a whole and in most states, the largest private employer in the Commonwealth is Wal-Mart, followed by the University of Pennsylvania. Pennsylvania is also home to the oldest investor-owned utility company in the U.S.A, The York Water Company. As of November 2017, the state's unemployment rate is 4.6%. Banking The first nationally chartered bank in the United States, the Bank of North America, was founded in 1781 in Philadelphia. After a series of mergers, the Bank of North America is part of Wells Fargo, which uses national charter 1. Pennsylvania is also the home to the first nationally chartered bank under the 1863 National Banking Act. That year, the Pittsburgh Savings & Trust Company received a national charter and renamed itself the First National Bank of Pittsburgh as part of the National Banking Act. That bank is still in existence today as PNC Financial Services and remains based in Pittsburgh. PNC is the state's largest bank, and the sixth-largest in the United States. Gambling Casino gambling was legalized in Pennsylvania in 2004. Currently, there are nine casinos across the state with three under construction or in planning. Only horse racing, slot machines and electronic table games were legal in Pennsylvania, although a bill to legalize table games was being negotiated in the fall of 2009. Table games such as poker, roulette, blackjack and craps were finally approved by the state legislature in January 2010, being signed into law by the Governor on January 7. Sports betting is illegal. Former Governor Ed Rendell had considered legalizing video poker machines in bars and private clubs in 2009, since an estimated 17,000 operate illegally across the state. Under this plan, any establishment with a liquor license would be allowed up to 5 machines. All machines would be connected to the state's computer system, like commercial casinos. The state would impose a 50% tax on net gambling revenues, after winning players have been paid, with the remaining 50% going to the establishment owners.
Page 14
COPYRIGHTED

Confidential March 16, 2018
Commonwealth of Pennsylvania (Cont’d) : Tourism Pennsylvania has long been a travel destination, boasting a rich, multifaceted history and an ideal combination of sleek cityscapes, charming small towns, rugged woodlands and lush countryside to explore. The Commonwealth of Pennsylvania is a geographically diverse state with a Great Lake Erie on one shore and a major seaport on the other. The climate of Pennsylvania is pleasant, with cold, often snowy winters, mild to hot, humid summers, and gorgeous green springtimes, and most notably, spectacular displays of colorful autumn foliage. There are a number of vital cities, from Pittsburgh to Williamsport, (home of Little League Baseball), to Philadelphia, which houses the Liberty Bell and Independence Hall. The interior of the state has a number of subcultures worth exploring, including the famous Amish countryside in Lancaster County, a religious community. Pennsylvania is known for its Revolutionary War-era historical sites like Valley Forge, its large cities, its farming regions, some occupied by the Amish, and a strong industrial history. It is the only one of the original 13 states that did not have any frontage on the Atlantic Ocean. With equally large swaths of cities and towns alongside fields and mountains, Pennsylvania is a rich and varied state, as well as a worthy travel destination. Pennsylvania is bordered by the states of New Jersey, New York, Delaware, Maryland, West Virginia, and Ohio. Travel and tourism is an important industry for Pennsylvania, providing tens of thousands of jobs for the state’s residents and generating hundreds of millions of dollars in tax revenues for the state and local communities. The following information is from the “Pennsylvania Annual Travel Profile 2015 Travel Year” prepared by by Longwoods International In 2015, Pennsylvania hosted an estimated 193.3 million travelers (as measured in person-trips) from throughout the U.S. – a 1.5% increase from 2014 and well above the 0.3% increase in the previous two years. The 2.9 million increase in PA’s total visitor volume was largely derived from the day-trip segment, which was responsible for almost 80% of the increase in the state’s person-trips between 2014 and 2015. Roughly a third of travelers (66.0 million) stayed overnight during their PA trip with a 0.8% rate of increase that was just below the (0.9%) growth rate in 2014. This was well below the 2.4% growth rate in U.S. overnight travel. Source:Pennsylvania Annual Travel Profile 2015 Travel Year
People visit Pennsylvania for a variety of reasons, but for those who stayed overnight, visiting friends and relatives (VFR) remained the most popular reason in 2015. VFR travel accounted for slightly less than half (47%) of the state’s overnight total – or an estimated 31 million travelers. While down from 2014, it remained well above the 43% U.S. average. Marketable trips (i.e., non-VFR leisure trips that may be influenced by marketing such as tourist attractions and theme parks) was the second main reason for travel to and/or within PA in 2015, accounting for 40% of overnight travel, or an estimated 26.4 million travelers and compared to the 43% average for the U.S. in total. Business and business-leisure travelers accounted for the remaining 8 million Pennsylvania overnight travelers in 2015, or 13% of the state total and essentially equal to the U.S. average. New York, New Jersey, Ohio, and Maryland together accounted for nearly 40% of the state’s Marketable Overnight travelers in 2015. Pennsylvania’s overnight business travelers came from a wider geographic area than the state’s leisure travelers, with Pennsylvania residents accounting for 24% of the segment’s total and Maryland, New York, New Jersey, and Ohio together accounting for another 24% in 2015.
Page 15
COPYRIGHTED

Confidential March 16, 2018
Lancaster County: Lancaster County sometimes nicknamed the Garden Spot of America or Pennsylvania Dutch Country, is a county located in the south central part of the Commonwealth of Pennsylvania. As of the 2010 census, the population was 519,445. Its county seat is Lancaster. Lancaster County comprises the Lancaster, Pennsylvania, Metropolitan Statistical Area. Demographics As of 2017, there were 546,551 people. The population density was 579 people per square mile. There were 193,602 households. Of that number 140,767 (69.9%) were families. Of those families, 120,112 (88.7%) had children under the age of 18. There were 202,952 housing units at an average density of 215 per square mile . The average household size was 2.63 and the average family size was 3 In the county, the population was spread out with 24.8% under the age of 18 and 15.0% who were 65 years of age or older. The median age was 38.2 years. For every 100 females there were 95.10 males. For every 100 females age 18 and over, there were 91.60 males. 5.58% of the population and 8.37% of the children aged 5–17 reported speaking Pennsylvania German, German, or Dutch at home, while a further 4.97% of the population spoke Spanish. 39.8% were of German, 11.8% United States or American, 7.2% Irish and 5.7% English ancestry according to the United States Census, 2000.
Source: https://pennsylvania.hometownlocator.com/cities/msa/msa,id,29540.cfm
Page 16
COPYRIGHTED

Confidential March 16, 2018
Lancaster County (Cont’d): Amish Population The Lancaster Amish affiliation is the largest affiliation among the Old Order Amish. Lancaster County Anabaptist community founded in c. 1760, has the world's largest Amish settlement, with 37,000 people in 220 church districts in 2017, or about 7% of the county's population. The Lancaster Amish affiliation is relatively liberal concerning the use of technologies compared to other Amish affiliation. Some County residents speak with a Pennsylvania Dutch-influenced dialect. Lancaster also hosts other Plain Anabaptist groups. As of 2010, there are about 3,200 Old Order Mennonites of the Groffdale Conference who drive black top buggies instead of the grey top buggies of the Amish in Lancaster county. Other buggy-using Old Order Mennonites in Lancaster County are subgroups of the Stauffer Mennonites with 283 baptized members and the Reidenbach Mennonites with 232. There are about 4,000 members of the car-driving Weaverland Old Order Mennonite Conference. There are three additional congregations, the Old Order River Brethren, the Reformed Mennonite Church and the Old German Baptist Brethren all of whom have below 100 members each. Economy In 2014, the county had a per capita personal income (PCPI) of $30,790, only 93% of the national average. This reflects a growth of 4.5% from the prior year, versus a 5.0% growth for the nation as a whole. Despite the lower income, the county poverty rate in 2013 was just 8.3% compared to a national rate of 12.5%. In 2014, federal spending in Lancaster County was $4,199 per resident, versus a national average of $7,232. In 2015, Lancaster County was 10th of all counties in Pennsylvania with 17.7% of its workforce employed in manufacturing; the state averages 13.7%, and the leader, Crawford County, has only 25.1%. Lancaster County has a widely diversified economy; industries range from manufacturing to agriculture, tourism to health care, and retail trade to wholesale distribution. Many firms in the county have existed there for at least 50 and some for more than 100 years, including the oldest tobacco store in the country. Lancaster County is known for the incredible diversity of its agriculture. The county's 4,500 farms make it one of the top farming counties in the United States. Together, these farms raise 45 million broiler chickens, 10 million laying hens, 95,000 dairy cows, 250,000 beef cattle, and 335,000 hogs annually. The county also leads all Pennsylvania counties in the value of its livestock, dairy products, wheat, corn, hay, tobacco, eggs, and milk, earning $725 million a year in agricultural revenue. Farmland preservation is a top priority for Lancaster County planners, who are struggling to preserve farmland even as the population grows and development continues. In 1999, Lancaster County had more than 30,000 acres of preserved farmland and 375 preserved farms, more preserved farms than any other county in the nation. Pennsylvania has
Page 17
COPYRIGHTED

Confidential March 16, 2018
Lancaster County (Cont’d): Economy allocated millions of dollars to the farm preservation effort, which offers frmers economic incentives when they sign over development rights to the state so that the farmland can never be sold for development. Lancaster County's industrial base is supported by hundreds of manufacturers and distributors. Service industries account for millions of dollars in revenue. More than 11,000 businesses employ more than 250,000 local residents. Millions of tourists visit Lancaster County every year to tour its historical communities, view its rich architectural heritage, and witness life in its picturesque and culturally distinct farming communities. This influx of visitors provides jobs and income for thousands of local workers and businesses. Lancaster County ranks even lower, 34th, in service workers, with 13.3% of the workforce, compared to a state average of 15.8%. Philadelphia County, leads with 20.5%. Lancaster County had an projected unemployment rate of 3.8% at the end of December 2017. This is a decrease from a rate of 4.2% the previous year. (See Table below)
Source: U.S. Bureau of Labor Statistics
There are 11,000 companies in Lancaster County. The county's largest manufacturing and distributing employers at the end of 2012 were Acme Markets, Alumax Mill Products, Anvil International, Armstrong World Industries, Bollman Hat, CNH Global, Conestoga Wood Specialties, Dart Container, High Industries, Lancaster Laboratories, Pepperidge Farm, R R Donnelley & Sons, The Hershey Company, Tyco Electronics, Tyson Foods, Warner-Lambert, and Yellow Transportation. Also, Auntie Anne's, Clipper Magazine, Lancaster Farming, MapQuest, Turkey Hill Dairy, Clair Global, and Wilbur Chocolate Company are Lancaster County-based organizations with an economic footprint of regional or national significance.
Page 18
COPYRIGHTED

Confidential March 16, 2018
Lancaster County (Cont’d):
Top 25 Largest Employers in Lancaster County 3rd Quarter 2017
Initial Data Federal and State Government Entities Aggregated
Source: Pennsylvania Center for Workforce Information & Analysis 3/01/2018
Page 19
COPYRIGHTED

Confidential March 16, 2018
Lancaster County (Cont’d):
Tourism Tourism is a significant industry in Lancaster County, employing approximately 20,000. In the 1860s, articles in the Atlantic Monthly and Lippincott’s Magazine published right after the Civil War, introduced Lancaster County to many readers. However, tourism in Lancaster was nearly non-existent prior to 1955. A New York Times travel article in 1952 brought 25,000 visitors, but the 1955 Broadway musical Plain and Fancy helped to fan the flames of Amish tourism in the mid 1950s. Shortly thereafter, Adolph Neuber (then-owner of the Willows Restaurant) opened the first tourist attraction in Lancaster County showcasing the Amish culture. Lancaster County tourism tapered off, after the 1974 gas rationing and the Three Mile Island incident led to five years of stagnation. The county promotes tourist visits to the county's numerous historic and picturesque covered bridges by publishing driving tours of the bridges. With over 200 covered bridges still existing Pennsylvania has more covered bridges than anywhere else in the world, and at 29 covered bridges, Lancaster County has the largest share. The top seven tourist attractions in Lancaster County are Sight & Sound, Dutch Wonderland, Strasburg Railroad, Kitchen Kettle Village, American Music Theater, Rockvale Square Outlets and Tanger Outlets. Besides Kitchen Kettle Village, which has a much stronger connection to the Amish experience than the other six, no one else in that top seven list has a business mission related to the Amish culture. Those businesses have independently established themselves as the proverbial 800-pound gorillas in the room. Other tourist attractions include the American Music Theatere, Dutch Wonderland, Ephrata Cloister, Ephrata Fair, Hans Herr House, Landis Valley Museum, Pennsylvania Dutch Country, Pennsylvania Renaissance Faire (one of the largest Renaissance fairs in the world), Rock Ford plantation, Robert Fulton Birthplace, Sight & Sound Theatres, Wilbur Chocolate, Wheatland (James Buchanan House) and Sturgis Pretzel House. There are many tours of this historic area including the Downtown Lancaster Walking Tour. The President of the Discover Lancaster Tourism Board, Kathleen Frankford was kind enough to provide some statistics and key indicators for the preparations of this report. The “Power of Lancaster County Tourism” report was a report completed in May 2016 by the respected industry analysts at Tourism Economics. The report contains figures that demonstrate why organizations like Discover Lancaster are crucial (the buying power to consistently deliver a destination-wide message), and how they produce an average return of $50 in visitor spending for every $1 invested in tourism advertising and promotion. The highlights of the report include:
An estimated 8.34 million visitors to Lancaster County directly spent $1.97 billion in2015, creating a total tourism impact of $2.64 billion in the county.
This visitor spending supported more than 24,000 county jobs, including approximately15,970 direct tourism industry jobs, which makes tourism the fifth largest non-agricultureprivate sector employer in the county, accounting for 1 of every 15 such jobs.
State and local tax revenue generated by the tourism industry saves each LancasterCounty household an estimated $997 annually in such taxes.
On the following page there are some graphs and charts from that report Page 20
COPYRIGHTED

Confidential March 16, 2018
Lancaster County (Cont’d): Tourism
Page 21
COPYRIGHTED

Confidential March 16, 2018
Columbia, Pennsylvania: Columbia, formerly Wright's Ferry, is a borough in Lancaster County, Pennsylvania, 28 miles southeast of Harrisburg on the east bank of the Susquehanna River, across from Wrightsville and York County and just south of U.S. Route 30. The settlement was founded in 1726 by Colonial English Quakers from Chester County led by entrepreneur and evangelist John Wright. Establishment of the eponymous Wright's Ferry, the first commercial Susquehanna crossing in the region, inflamed territorial conflict with neighboring Maryland but brought growth and prosperity to the small town, which was just a few votes shy of becoming the new United States' capital. Though besieged for a short while by Civil War destruction, Columbia remained a lively center of transport and industry throughout the 19th century, once serving as a terminus of the Pennsylvania Canal. Later, however, the Great Depression and 20th-century changes in economy and technology sent the borough into decline. It is notable today as the site of one of the world's few museums devoted entirely to horology. Columbia is located in the Riverlands Region of Pennsylvania. The Riverlands Region is located on the banks of the Susquehanna River. The region includes the Boroughs of Columbia and Marietta. The Riverlands Region is home to a host of scenic biking tours and hiking trails through beautiful rolling hills. The area is well known for antigues shopping or “antiquing”. In the nineteenth century, local industrial establishments included banking and trade commerce bagan populating the downtown area of Columbia. Today, Columbia has several restaurants, and businesses that line the downtown area.
Demographics: As of the census of Jully 1, 2017, there were 10,590 people, 4,357 households, and 2,550 families residing in the borough. The population density was 4,227.8 people per square mile. There were 4,595 housing units at an average density of 1,884.1 per square mile. The racial makeup of the borough was 91.34% White, 4.42% Black or African American, 0.18% Native American, 0.41% Asian, 0.05% Pacific Islander, 1.70% from other races, and 1.90% from two or more races. 4.49% of the population were Hispanic or Latino of any race.
Source: https://pennsylvania.hometownlocator.com
Page 22
COPYRIGHTED

Confidential March 16, 2018
Columbia, Pennsylvania (Cont’d): In the borough the population was spread out, with 25.5% under the age of 18, 7.9% from 18 to 24, 32.2% from 25 to 44, 19.1% from 45 to 64, and 15.3% who were 65 years of age or older. The median age was 36 years. For every 100 females there were 95.9 males. For every 100 females age 18 and over, there were 92.1 males.The median income for a household in the borough was $41,942, and the median income for a family was $51,194. Males had a median income of $33,697 versus $26,988 for females. The per capita income for the borough was $20,562. History: In the late 1780’s, Samuel Wright had the area surveyed and formally laid out the town into 160 building lots, which were distributed by lottery at 15 shillings per ticket. "Adventurers", as purchasers were known, included speculators from many areas of the country. Wright and town citizens renamed the town “Columbia” in honor of Christopher Columbus in the hope of influencing the new U.S. Congress to select it as the nation’s capital, a plan George Washington favored; a formal proposal to do so was made in 1789. Unfortunately for the town, when Congress voted in 1790, the final tally was one vote short. Later, Columbia narrowly missed becoming the capital of Pennsylvania; Columbia became an incorporated borough in 1814. The same year, the world's longest covered bridge was built across the Susquehanna to Wrightsville, facilitating traffic flow across the river and reducing the need for the ferry. In early 1863, as the American Civil War raged, a number of local black citizens enlisted in the 54th Massachusetts Infantry. The unit achieved fame in an assault on Fort Wagner in South Carolina. Stephen Swails, one of its members, may have been the first African-American officer commissioned during the Civil War. Other local citizens fought in various regiments of the United States Colored Troops. Some of these veterans are buried in a cemetery located near Fifth Street. On June 28, 1863, during the Gettysburg Campaign, the bridge was burned by Columbia residents and the Pennsylvania state militia to prevent Confederate soldiers from entering Lancaster County. General Robert E. Lee had hoped to invade Harrisburg from the rear and move eastward to Lancaster and Philadelphia, and in the process destroy railroad yards and other facilities. Under General Early’s command and following Lee’s orders, General Gordon was to place Lancaster and the surrounding farming area “under influence” for the Confederate Army. Meanwhile Union forces under the command of Colonel Frick and Major Haller were forced to burn it. Owners of the bridge petitioned Congress repeatedly for reimbursement well into the 1960s, but were denied payment. With the Union Army hastening northward into Maryland and Pennsylvania, Lee ordered his widely scattered forces to withdraw to Heidlersburg and Cashtown to rendezvous with other contingents of the Confederate Army. The burning of the Columbia-Wrightsville Bridge thwarted one of Lee's goals for the invasion of Pennsylvania, and General Gordon later claimed the skirmish at Wrightsville reinforced the erroneous belief that the only defensive forces on hand were inefficient local militia.
Page 23
Columbia-Wrightsville Veterans Memorial Bridge
COPYRIGHTED

Confidential March 16, 2018
Columbia, Pennsylvania (Cont’d): Economy This section shows the economic outlook and local economy using the most recent economic data from the 2017 Census Bureau. Starting with Figure 1 below which shows the median earnings per worker; Columbia indicates it has $36,026 median earnings which is the 4th smallest median earnings of all the other places in the area. The city with the highest median earnings in the area is West Hempfield township with earnings of $47,475 is 31.8% larger. Comparing median earnings to the United States average of $44,910, Columbia is about 24.7% smaller. Also, versus the state of Pennsylvania, median earnings of $46,082, Columbia is approximately three-fourths the size. In Figure 2 there is a more complete view of income which includes all members in a household using the median household income and it has $39,625 median income which is the 4th smallest median income of all the other places in the area. The city with the highest median income in the area is Washington Borough with an income of $72,550 is about twice as large. Comparing median income to the United States average of $55,322, Columbia is approximately three-fourths the size. Also, versus the state of Pennsylvania, median income of $54,895, Columbia is approximately three-fourths the size.
Source: www.towncharts.com/Pennsylvania/Economy/Columbia-borough-PA-Economy-data.html
The unemployment rate in Columbia borough, Pennsylvania, is 3.80%, with job growth of 1.96%. Future job growth over the next ten years is predicted to be 39.52%.
Source: http://www.bestplaces.net/economy/city/pennsylvania/columbia_borough
Page 24
COPYRIGHTED
Confidential March 16, 2018
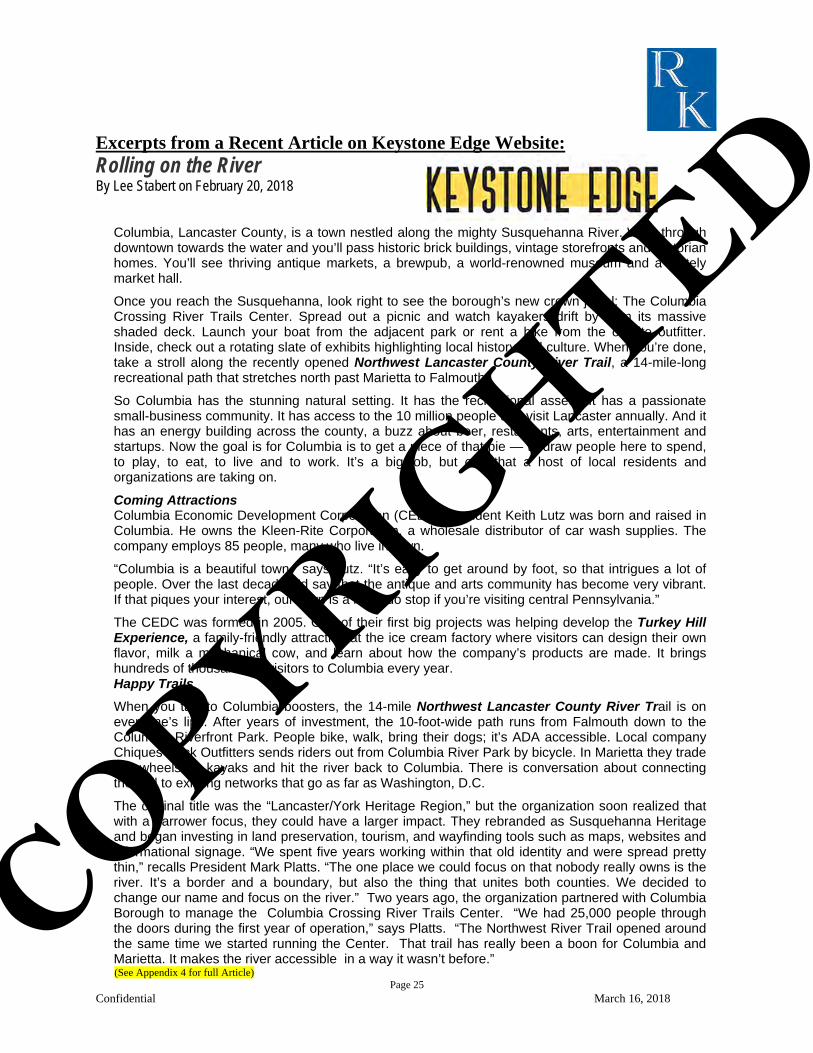
Excerpts from a Recent Article on Keystone Edge Website: Rolling on the River By Lee Stabert on February 20, 2018
Columbia, Lancaster County, is a town nestled along the mighty Susquehanna River. Walk through downtown towards the water and you’ll pass historic brick buildings, vintage storefronts and Victorian homes. You’ll see thriving antique markets, a brewpub, a world-renowned museum and a stately market hall.
Once you reach the Susquehanna, look right to see the borough’s new crown jewel: The Columbia Crossing River Trails Center. Spread out a picnic and watch kayakers drift by from its massive shaded deck. Launch your boat from the adjacent park or rent a bike from the on-site outfitter. Inside, check out a rotating slate of exhibits highlighting local history and culture. When you’re done, take a stroll along the recently opened Northwest Lancaster County River Trail, a 14-mile-long recreational path that stretches north past Marietta to Falmouth.
So Columbia has the stunning natural setting. It has the recreational assets. It has a passionate small-business community. It has access to the 10 million people that visit Lancaster annually. And it has an energy building across the county, a buzz about beer, restaurants, arts, entertainment and startups. Now the goal is for Columbia is to get a piece of that pie — to draw people here to spend, to play, to eat, to live and to work. It’s a big job, but one that a host of local residents and organizations are taking on.
Coming Attractions Columbia Economic Development Corporation (CEDC) President Keith Lutz was born and raised in Columbia. He owns the Kleen-Rite Corporation, a wholesale distributor of car wash supplies. The company employs 85 people, many who live in town.
“Columbia is a beautiful town,” says Lutz. “It’s easy to get around by foot, so that intrigues a lot of people. Over the last decade, I’d say that the antique and arts community has become very vibrant. If that piques your interest, our town is a must-do stop if you’re visiting central Pennsylvania.”
The CEDC was formed in 2005. One of their first big projects was helping develop the Turkey Hill Experience, a family-friendly attraction at the ice cream factory where visitors can design their own flavor, milk a mechanical cow, and learn about how the company’s products are made. It brings hundreds of thousands of visitors to Columbia every year. Happy Trails When you talk to Columbia boosters, the 14-mile Northwest Lancaster County River Trail is on everyone’s lips. After years of investment, the 10-foot-wide path runs from Falmouth down to the Columbia Riverfront Park. People bike, walk, bring their dogs; it’s ADA accessible. Local company Chiques Rock Outfitters sends riders out from Columbia River Park by bicycle. In Marietta they trade two wheels for kayaks and hit the river back to Columbia. There is conversation about connecting the trail to existing networks that go as far as Washington, D.C. The original title was the “Lancaster/York Heritage Region,” but the organization soon realized that with a narrower focus, they could have a larger impact. They rebranded as Susquehanna Heritage and began investing in land preservation, tourism, and wayfinding tools such as maps, websites and informational signage. “We spent five years working within that old identity and were spread pretty thin,” recalls President Mark Platts. “The one place we could focus on that nobody really owns is the river. It’s a border and a boundary, but also the thing that unites both counties. We decided to change our name and focus on the river.” Two years ago, the organization partnered with Columbia Borough to manage the Columbia Crossing River Trails Center. “We had 25,000 people through the doors during the first year of operation,” says Platts. “The Northwest River Trail opened around the same time we started running the Center. That trail has really been a boon for Columbia and Marietta. It makes the river accessible in a way it wasn’t before.”
(See Appendix 4 for full Article) Page 25
COPYRIGHTED

Confidential March 16, 2018
Leisure Travel Market: In the terminology of economists, travel spending behaves as a luxury very well. When incomes are rising, households tend to spend relatively more on travel. When the economy is weak, households tend to cut back on luxury goods, such as travel, rather than necessities. This explains why spending on travel has shown a general tendency to increase as a proportion of total income over the past several decades. Both the general increase in disposable income during the past half-century and the aging of the “baby-boomers” have stimulated travel. Secondly, spending on travel tends to follow the business cycle. For these reasons, economic indicators of the travel industry (e.g., travel spending, travel industry earnings) tend to correspond with indicators of the general economy (e.g., income, employment).
The consequences of the growth in leisure activities for travel are complex. On the one hand, spending on resident leisure may substitute for travel. There is some evidence, for example, that suggests that this has occurred recently as individuals have substituted less costly local leisure activities for travel. Clearly, households may also substitute shorter, less costly travel for longer and more expensive trips. Rural travel destinations that are located in reasonable proximity to urban areas can benefit from these types of consumer choices, as households choose to travel closer to home. The growth of leisure activities that serve local residents can also attract visitors. This is particularly true of urban areas, or areas that have the resident market to support local businesses. Indeed, many of these communities simultaneously attract visitors and new residents because of their amenities.
For all of these reasons, it is probably best to think of the growth of the leisure economy as a market for which local and regional communities may choose to compete. To the extent that these communities are successful, they attract visitor spending and retain the spending of residents. There are many area attractions which are marketed correctly and to the right demographics will have a positive impact on the Leisure Travel Market.
The Luxury Leisure Travel Market is stronger in the spring, summer, and fall periods than the Business Travel Market for this area, primarily due the sporting events, festivals, and activities happening in the area. The business levels in the subject hotel will mainly be impacted by weekend travelers for those activities.
Finally, the economic development benefits of leisure activities that serve residents can be similar to that of travel. This is because the availability of local leisure activities may encourage residents to spend their leisure dollars at home rather than in another community. As noted above, this may be even more important when local resident households choose to spend less of their income on travel. It should be noted that the Borough of Columbia as well as the Lancaster County Tourism Board are both highly involved in promoting the travel industry in the area; a strong partnership with both would be beneficial the subject hotel.
Page 26
COPYRIGHTED

Confidential March 16, 2018
Corporate Travel Market Increasing in US U.S. companies spent more than $220 billion on business travel in 2016, representing a fraction of their revenue and expenses. But, during economically challenging times and in the glare of scrutiny on corporate travel, what do businesses gain by investing in face-to-face client meetings, participation in conferences and trade shows, and development of human capital? Travel as a core component of a successful business strategy is confirmed in Oxford's report: for every dollar invested in business travel, companies realize $12.50 in incremental revenue and $3.80 in new profits. Curbing business travel can also reduce a company's profits for years. For corporate budget planners and policymakers, this analysis provides a benchmark defining how business travel in America is inextricably linked to profits and growth. Business travel is showing signs of moderate but stable growth for the coming year, according to the latest Business Travel Quarterly Outlook – United States from the Global Business Travel Association (GBTA), sponsored by Visa. The report shows that the business travel market has stabilized, but the outlook for international outbound travel is troubling due to the ongoing uncertainty of the European debt crisis and rising oil prices. GBTA continues to believe business travel will reach its pre-recession levels by the middle of 2012, with measured growth throughout the year as economic headwinds persist. GBTA forecasts that business travel spend will increase by 4.6% in 2012 on a slight (0.8%) decline in person-trips. As an economic indicator, the steady growth of business travel spend has continued to track accurately against job growth in the U.S. over the last twelve months. GBTA research demonstrates that 2015 was a year of growth for business travel. Total spending on U.S.-initiated business travel hit $251 billion in 2015 – up from $234 billion in 2014. This included $111.7 billion spent on transient business travel, $107.7 billion spent on group business travel, and $31.6 billion spent on international outbound travel. Corporate Meeting Planners are very optimistic for 2016. There are strong gains in corporate transient demand that have led the U.S. lodging industry out of the depths of the 2008/2009 industry recession. However, it wasn’t until 2011 that hotels began to see signs of recovery in the group demand segment. For the past several years, PKF Hospitality Research, LLC (PKF-HR) has conducted an annual survey of meeting planners sponsored by Convention South magazine. In October of 2015, a total of 79 planners located across the country answered questions about the 2015 and 2016 events they have organized. Looking forward, the people responsible for planning meetings and exhibitions are optimistic, and it appears that hotels will continue to see more delegates and attendees roaming their hallways in 2015.
Page 27
COPYRIGHTED

Confidential March 16, 2018
Corporate Travel Market Increasing in US (Cont’d) The following paragraphs highlight the findings of the PKF-HR 2015 survey that have the greatest impact on hotel owners and operators. Volume The vast majority of planners surveyed stated that the number of meetings and exhibitions they will organize in 2016 will equal the number they planned in 2014. However, while the volume of events is expected to remain flat, planners are expecting greater levels of attendance and expenditures. In 2015, 43 percent of the planners will be able to operate with a larger budget than they had in 2014. In turn, 46 percent will spend more to conduct their meetings next year than they did this year. Part of the reason for the greater level of expenditures is the expected increase in attendance. Nearly 90 percent of the survey sample said that 2015 average attendance levels will be equal to, or greater than, what they were in 2014. Room Rates The planners surveyed recognize that the hotel industry is recovering and they will have to start paying more for hotel rooms. During negotiations, planners are finding hotel managers less willing to concede room rates. Only 33 percent of the time in 2014 was hotels willing to offer meeting planners lower room rates as an incentive to book their group. This is down from 58 percent in 2013. With hotels offering fewer discounts, 72 percent of the survey participants have planned for an increase in room rates in 2016. An additional ten percent say rates will remain the same as 2012, but labeled existing hotel prices as “high”. Resigning the need to pay higher prices for hotel rooms, planners are no longer looking at room rates as an area where they can save money. The price of guest rooms was ranked as the sixth out of eleven areas in the meetings budget for potential cost savings. This is down from a fourth place ranking in 2014. Selection Criteria Consistent with surveys of transient travelers, meeting attendees yearn for complimentary internet access. According to the perceptions of the planners surveyed, free access to the internet is the most important meeting site criteria for attendees. Conversely, for meeting planners, complimentary Wi-Fi ranked just ninth out of 16 factors that they deemed as most important when selecting a meeting site. The selection criteria for a meeting facility rated as most important by the planners are:
1. Available meeting space2. Willingness to negotiate contracts3. Price of meeting space4. Price of hotel rooms5. Service standards6. Optimism
For hotel owners and operators, growth in group business will further boost the record levels of lodging demand that was accommodated in 2015. While the direct benefit will be felt by the meetings oriented properties, capacity at these hotels frequently leads to greater compression in the overall market, which will benefit the subject hotel project.
Page 28
COPYRIGHTED

Confidential March 16, 2018
Article in Lodging Magazine Website:
Surge in Consumer, Business Sentiment Suggests Momentum for 2017 Posted by: Lodging Staff in Finance, Finance + Development, Market Reports January 24, 2017
NEW YORK—The updated lodging forecast released today by PwC U.S. notes that strong industry performance in the fourth quarter of 2016, including encouraging trends in demand and average daily rate (ADR), coupled with a post-election surge in consumer and business sentiment that contributed to improving economic conditions, sets the stage for continued revenue per available room (RevPAR) growth in 2017.
PwC expects the increase in supply of hotel rooms to marginally outpace growth in demand, resulting in a decline in occupancy to 65.3 percent. Aided by an expected increase in corporate transient demand, growth in average daily rate is expected to drive a RevPAR increase of 2.3 percent, according to the report.
PwC’s outlook is based on an economic forecast from IHS Markit, which expects real GDP to increase 2.3 percent in 2017, measured on a fourth-quarter-over-fourth-quarter basis, approximately 50 basis points higher than in PwC’s November forecast. Improving economic conditions are driven by a number of factors, including improving business and consumer confidence, and surging financial markets, as well as potential policy decisions related to tax cuts and changes to trade regulations.
The updated estimates from PwC are based on a quarterly econometric analysis of the US lodging sector, using an updated forecast released by IHS Markit and historical statistics supplied by STR and other data providers.
“Based on a strong fourth quarter, we are encouraged by the trends we are seeing as we head into 2017,” said Scott D. Berman, principal and U.S. industry leader, hospitality & leisure, PwC. “However, we remain cautiously optimistic, as higher-than-previously anticipated increase in demand is still expected to be offset by increasing supply through the year.”
Page 29
COPYRIGHTED
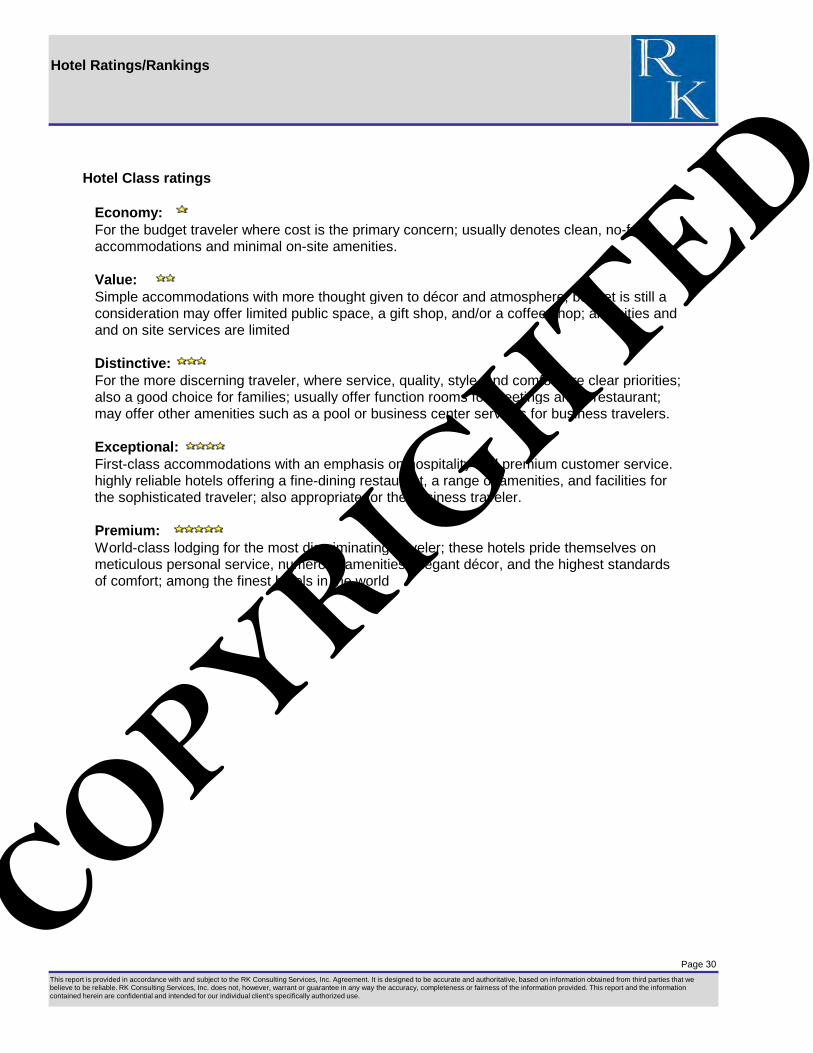
Hotel Ratings/Rankings
Hotel Class ratings
Economy:For the budget traveler where cost is the primary concern; usually denotes clean, no-frills accommodations and minimal on-site amenities.
Value:Simple accommodations with more thought given to décor and atmosphere; budget is still aconsideration may offer limited public space, a gift shop, and/or a coffee shop; amenities andand on site services are limited
Distinctive:For the more discerning traveler, where service, quality, style, and comfort are clear priorities; also a good choice for families; usually offer function rooms for meetings and a restaurant; may offer other amenities such as a pool or business center services for business travelers.
Exceptional:First-class accommodations with an emphasis on hospitality and premium customer service.highly reliable hotels offering a fine-dining restaurant, a range of amenities, and facilities for the sophisticated traveler; also appropriate for the business traveler.
Premium:World-class lodging for the most discriminating traveler; these hotels pride themselves onmeticulous personal service, numerous amenities, elegant décor, and the highest standards of comfort; among the finest hotels in the world
Page 30This report is provided in accordance with and subject to the RK Consulting Services, Inc. Agreement. It is designed to be accurate and authoritative, based on information obtained from third parties that we believe to be reliable. RK Consulting Services, Inc. does not, however, warrant or guarantee in any way the accuracy, completeness or fairness of the information provided. This report and the information contained herein are confidential and intended for our individual client's specifically authorized use.
COPYRIGHTED

Hotel Rating Competitive Set Participation Smith Travel ReportSelected Hotel Set `
Hotel City & State RoomsComfort Inn Lancaster County Columbia, PA 0.8 Miles 60Holiday Inn Express & Suites Lancaster Lititz 1/2 Lititz, PA 5.1 Miles 85Hampton Inn & Suites Mount Joy Lancaster West 1/2 Manheim, PA 6.5 Miles 130Fairfield Inn & Suites Lancaster 1/2 Lancaster, PA 10.2 Miles 90Country Inn & Suites Lancaster 1/2 Lancaster, PA 12.3 Miles 78
Total Rooms 443
Page 30
Distance
This report is provided in accordance with and subject to the RK Consulting Services, Inc. Agreement. It is designed to be accurate and authoritative, based on information obtained from third parties that we believe to be reliable. RK Consulting Services, Inc. does not, however, warrant or guarantee in any way the accuracy, completeness or fairness of the information provided. This report and the information contained herein are confidential and intended for our individual client's specifically authorized use.
COPYRIGHTED
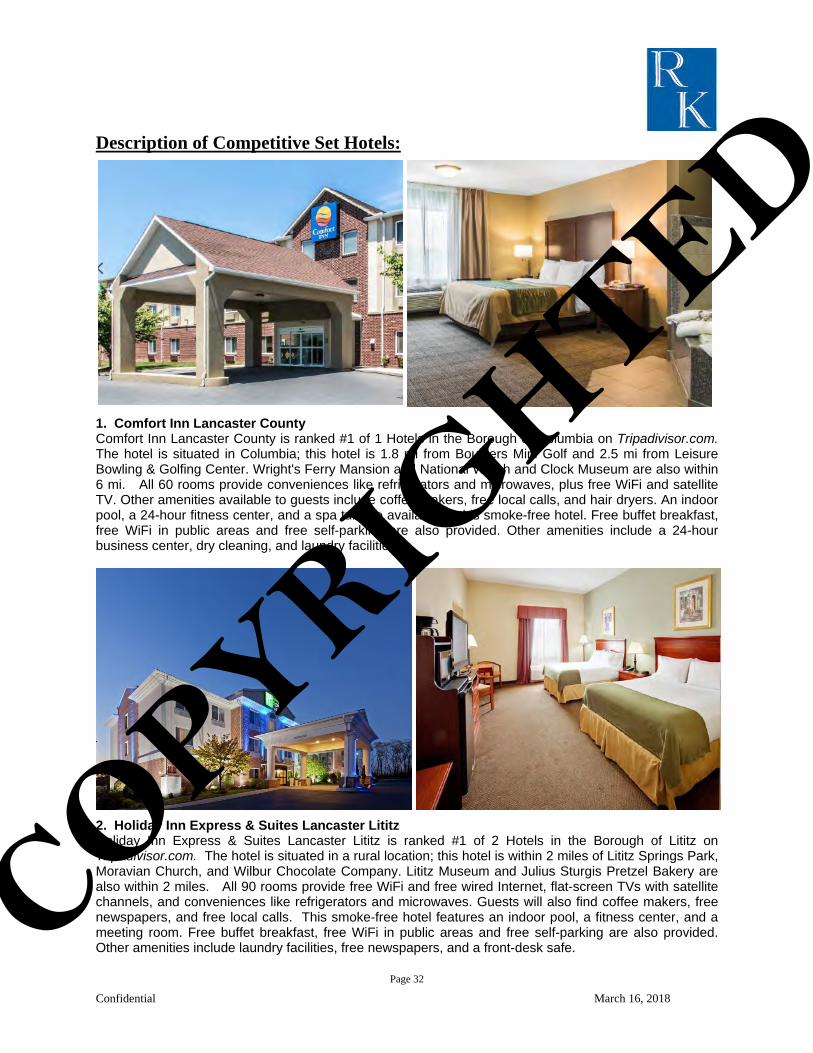
Confidential March 16, 2018
Description of Competitive Set Hotels:
1. Comfort Inn Lancaster CountyComfort Inn Lancaster County is ranked #1 of 1 Hotels in the Borough of Columbia on Tripadivisor.com.The hotel is situated in Columbia; this hotel is 1.8 mi from Boulders Mini Golf and 2.5 mi from LeisureBowling & Golfing Center. Wright's Ferry Mansion and National Watch and Clock Museum are also within6 mi. All 60 rooms provide conveniences like refrigerators and microwaves, plus free WiFi and satelliteTV. Other amenities available to guests include coffee makers, free local calls, and hair dryers. An indoorpool, a 24-hour fitness center, and a spa tub are available at this smoke-free hotel. Free buffet breakfast,free WiFi in public areas and free self-parking are also provided. Other amenities include a 24-hourbusiness center, dry cleaning, and laundry facilities.
2. Holiday Inn Express & Suites Lancaster LititzHoliday Inn Express & Suites Lancaster Lititz is ranked #1 of 2 Hotels in the Borough of Lititz onTripadivisor.com. The hotel is situated in a rural location; this hotel is within 2 miles of Lititz Springs Park,Moravian Church, and Wilbur Chocolate Company. Lititz Museum and Julius Sturgis Pretzel Bakery arealso within 2 miles. All 90 rooms provide free WiFi and free wired Internet, flat-screen TVs with satellitechannels, and conveniences like refrigerators and microwaves. Guests will also find coffee makers, freenewspapers, and free local calls. This smoke-free hotel features an indoor pool, a fitness center, and ameeting room. Free buffet breakfast, free WiFi in public areas and free self-parking are also provided.Other amenities include laundry facilities, free newspapers, and a front-desk safe.
Page 32
COPYRIGHTED
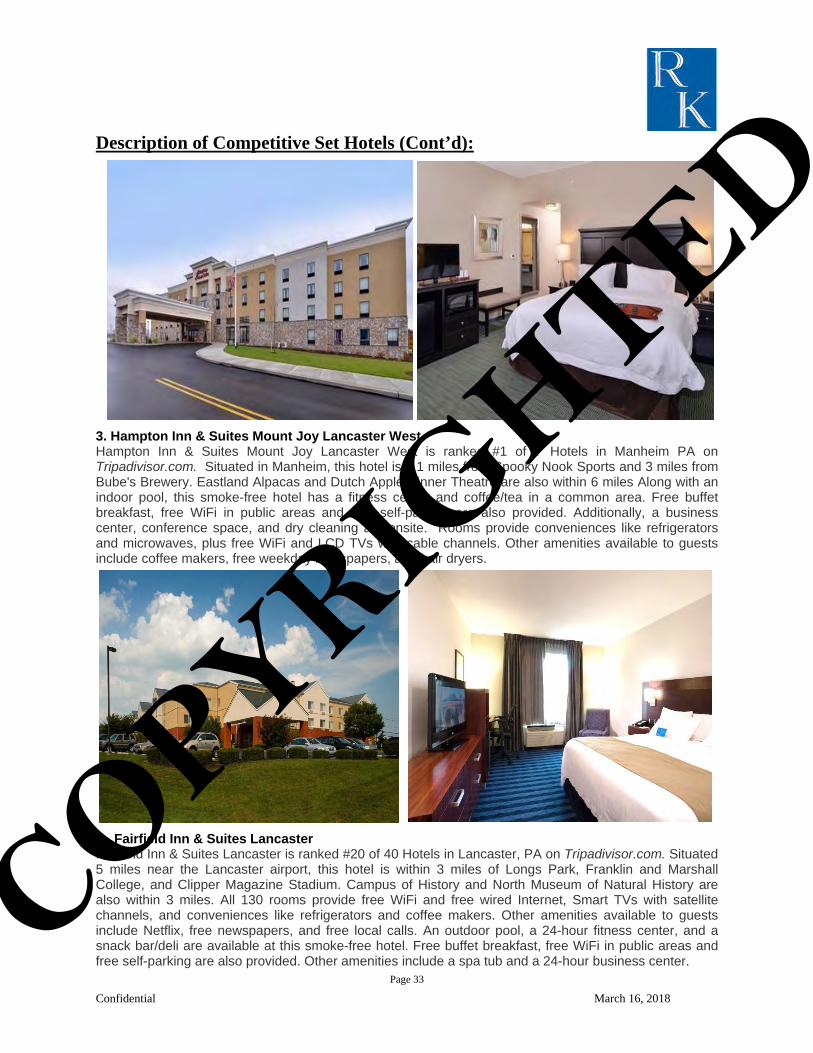
Confidential March 16, 2018
Description of Competitive Set Hotels (Cont’d):
3. Hampton Inn & Suites Mount Joy Lancaster WestHampton Inn & Suites Mount Joy Lancaster West is ranked #1 of 7 Hotels in Manheim PA onTripadivisor.com. Situated in Manheim, this hotel is 2.1 miles from Spooky Nook Sports and 3 miles fromBube's Brewery. Eastland Alpacas and Dutch Apple Dinner Theatre are also within 6 miles Along with anindoor pool, this smoke-free hotel has a fitness center and coffee/tea in a common area. Free buffetbreakfast, free WiFi in public areas and free self-parking are also provided. Additionally, a businesscenter, conference space, and dry cleaning are onsite. Rooms provide conveniences like refrigeratorsand microwaves, plus free WiFi and LCD TVs with cable channels. Other amenities available to guestsinclude coffee makers, free weekday newspapers, and hair dryers.
4. Fairfield Inn & Suites LancasterFairfield Inn & Suites Lancaster is ranked #20 of 40 Hotels in Lancaster, PA on Tripadivisor.com. Situated5 miles near the Lancaster airport, this hotel is within 3 miles of Longs Park, Franklin and MarshallCollege, and Clipper Magazine Stadium. Campus of History and North Museum of Natural History arealso within 3 miles. All 130 rooms provide free WiFi and free wired Internet, Smart TVs with satellitechannels, and conveniences like refrigerators and coffee makers. Other amenities available to guestsinclude Netflix, free newspapers, and free local calls. An outdoor pool, a 24-hour fitness center, and asnack bar/deli are available at this smoke-free hotel. Free buffet breakfast, free WiFi in public areas andfree self-parking are also provided. Other amenities include a spa tub and a 24-hour business center.
Page 33
COPYRIGHTED

Confidential March 16, 2018
Description of Competitive Set Hotels (Cont’d):
5. Country Inn & Suites LancasterCountry Inn & Suites Lancaster is ranked #5 of 40 Hotels in Lancaster, PA on Tripadivisor.com. The hotelis located in the heart of Lancaster; this hotel is within a 5-minute walk of Dutch Wonderland and TangerOutlets Lancaster. Lancaster Mennonite Historical Society and Biblical Tabernacle Reproduction are alsowithin 10 minutes. All 78 rooms provide free WiFi and free wired Internet, TVs with cable channels, andconveniences like refrigerators and microwaves. Premium bedding, coffee makers, and free weekdaynewspapers are among the other amenities available to guests. An indoor pool, a fitness center, and aspa tub are available at this hotel. Free WiFi in public areas and free self parking are also provided. Otheramenities include a meeting room, laundry facilities, and a 24-hour front desk
Page 34 COPYRIGHTED

Historical TREND SummaryAugust 2015 - December 2017 Selected Hotel Set
Year Month This Year % Chg This Year % Chg This Year % Chg This Year % Chg This Year % Chg This Year % Chg2015 August 72.1 133.95 96.63 13,733 9,907 1,327,0882015 September 67.8 123.60 83.76 13,290 9,007 1,113,2302015 October 71.4 127.93 91.36 13,733 9,807 1,254,6002015 November 60.2 120.64 72.66 13,290 8,004 965,5972015 December 46.7 110.49 51.63 13,733 6,418 709,096201520152016 January 40.6 111.69 45.32 13,733 5,572 622,3612016 February 45.9 107.78 49.48 12,404 5,695 613,7932016 March 60.4 118.36 71.47 13,733 8,292 981,4812016 April 67.9 123.27 83.72 13,290 9,026 1,112,6672016 May 63.5 124.06 78.83 13,733 8,726 1,082,5352016 June 71.9 133.60 96.07 13,290 9,556 1,276,7262016 July 78.7 142.45 112.17 13,733 10,814 1,540,4022016 August 77.4 7.3 134.89 0.7 104.41 8.0 13,733 0.0 10,630 7.3 1,433,840 8.02016 September 71.6 5.6 125.23 1.3 89.61 7.0 13,290 0.0 9,510 5.6 1,190,978 7.02016 October 75.5 5.7 127.39 -0.4 96.14 5.2 13,733 0.0 10,364 5.7 1,320,303 5.22016 November 63.1 4.7 122.24 1.3 77.08 6.1 13,290 0.0 8,380 4.7 1,024,352 6.12016 December 49.8 6.5 111.71 1.1 55.61 7.7 13,733 0.0 6,836 6.5 763,664 7.72017 Dec YTD 2017 63.9 125.37 80.17 161,695 103,401 12,963,1022016 Total Year 63.9 125.37 80.17 161,695 103,401 12,963,1022017 January 50.3 23.9 113.35 1.5 56.96 25.7 13,733 0.0 6,901 23.9 782,196 25.72017 February 55.2 20.3 114.55 6.3 63.27 27.9 12,404 0.0 6,851 20.3 784,780 27.92017 March 59.7 -1.2 120.68 2.0 72.01 0.8 13,733 0.0 8,194 -1.2 988,864 0.82017 April 65.8 -3.2 121.60 -1.4 79.96 -4.5 13,290 0.0 8,739 -3.2 1,062,694 -4.52017 May 66.5 4.7 127.00 2.4 84.50 7.2 13,733 0.0 9,137 4.7 1,160,441 7.22017 June 72.2 0.5 133.03 -0.4 96.11 0.0 13,290 0.0 9,602 0.5 1,277,360 0.02017 July 75.1 -4.6 139.47 -2.1 104.78 -6.6 13,733 0.0 10,317 -4.6 1,438,941 -6.62017 August 75.5 -2.5 133.05 -1.4 100.42 -3.8 13,733 0.0 10,365 -2.5 1,379,072 -3.82016 September 72.5 1.3 126.39 0.9 91.62 2.2 13,290 0.0 9,634 1.3 1,217,672 2.22016 October 73.7 -2.4 128.07 0.5 94.37 -1.8 13,733 0.0 10,119 -2.4 1,295,989 -1.82016 November 63.4 0.6 119.15 -2.5 75.58 -1.9 13,290 0.0 8,430 0.6 1,004,463 -1.92016 December 54.7 9.9 110.16 -1.4 60.27 8.4 13,733 0.0 7,514 9.9 827,708 8.42017 Dec YTD 2017 65.4 2.3 124.95 -0.3 81.76 2.0 161,695 0.0 105,803 2.3 13,220,180 2.02017 Total Year 65.4 2.3 124.95 -0.3 81.76 2.0 161,695 0.0 105,803 2.3 13,220,180 2.0
Source: Smith Travel Research See Appendix Number 2 Page 35
Room Supply Room Demand Room RevenueOccupancy Average Daily Rate RevPAR
This report is provided in accordance with and subject to the RK Consulting Services, Inc. Agreement. It is designed to be accurate and authoritative, based on information obtained from third parties that we believe to be reliable. RK Consulting Services, Inc. does not, however, warrant or guarantee in any way the accuracy, completeness or fairness of the information provided. This report and the information contained herein are confidential and intended for our individual client's specifically authorized use.
COPYRIGHTED

Occupancy Analysis
August 2015 - December 2017 Selected Hotel Set
Source: Smith Travel Research See Appendix Number 2 Page 34
This report is provided in accordance with and subject to the RK Consulting Services, Inc. Agreement. It is designed to be accurate and authoritative, based on information obtained from third parties that we believe to be reliable. RK Consulting Services, Inc. does not, however, warrant or guarantee in any way the accuracy, completeness or fairness of the information provided. This report and the information contained herein are confidential and intended for our individual client's specifically authorized use.
0.0
10.0
20.0
30.0
40.0
50.0
60.0
70.0
80.0
90.0
Aug-
15Se
p-15
Oct
-15
Nov
-15
Dec
-15
Jan-
16Fe
b-16
Mar
-16
Apr-1
6M
ay-1
6Ju
n-16
Jul-1
6Au
g-16
Sep-
16O
ct-1
6N
ov-1
6D
ec-1
6Ja
n-17
Feb-
17M
ar-1
7Ap
r-17
May
-17
Jun-
17Ju
l-17
Aug-
17Se
p-17
Oct
-17
Nov
-17
Dec
-17
COPYRIGHTED

Average Daily Rate (ADR) Analysis
August 2015 - December 2017 Selected Hotel Set
Source: Smith Travel Research See Appendix Number 2 Page 35
This report is provided in accordance with and subject to the RK Consulting Services, Inc. Agreement. It is designed to be accurate and authoritative, based on information obtained from third parties that we believe to be reliable. RK Consulting Services, Inc. does not, however, warrant or guarantee in any way the accuracy, completeness or fairness of the information provided. This report and the information contained herein are confidential and intended for our individual client's specifically authorized use.
$-
$20.00
$40.00
$60.00
$80.00
$100.00
$120.00
$140.00
$160.00
Aug-
15Se
p-15
Oct
-15
Nov
-15
Dec
-15
Jan-
16Fe
b-16
Mar
-16
Apr-1
6M
ay-1
6Ju
n-16
Jul-1
6Au
g-16
Sep-
16O
ct-1
6N
ov-1
6D
ec-1
6Ja
n-17
Feb-
17M
ar-1
7Ap
r-17
May
-17
Jun-
17Ju
l-17
Aug-
17Se
p-17
Oct
-17
Nov
-17
Dec
-17
Average Daily Rate (ADR)
COPYRIGHTED

Revenue Per Avalibale Room (RevPAR) Analysis
August 2015 - December 2017 Selected Hotel Set
Source: Smith Travel Research See Appendix Number 2 Page 36
This report is provided in accordance with and subject to the RK Consulting Services, Inc. Agreement. It is designed to be accurate and authoritative, based on information obtained from third parties that we believe to be reliable. RK Consulting Services, Inc. does not, however, warrant or guarantee in any way the accuracy, completeness or fairness of the information provided. This report and the information contained herein are confidential and intended for our individual client's specifically authorized use.
This report is provided in accordance with and subject to the RK Consulting Services, Inc. Agreement. It is designed to be accurate and authoritative, based on information obtained from third parties that we believe to be reliable. RK Consulting Services, Inc. does not, however, warrant or guarantee in any way the accuracy, completeness or fairness of the
0.00
20.00
40.00
60.00
80.00
100.00
120.00
Aug-
15
Oct
-15
Dec-
15
Feb-
16
Apr-
16
Jun-
16
Aug-
16
Oct
-16
Dec-
16
Feb-
17
Apr-
17
Jun-
17
Aug-
17
Oct
-17
Dec-
17
Revenue Per Available Room (RevPAR)
COPYRIGHTED

Rolling 12 Month Day by Day Analysis
January 2015 - December 2017 Selected Hotel Set
Three Year Occupancy (%)Sun Mon Tue Wed Thu Fri Sat Total Year Chg
Jan 15 - Dec 15 34.8 53.1 66.8 64.5 63.1 72.5 79.2 62.5Jan 16 - Dec 16 35.9 54.9 68.6 66.2 64.9 75.8 80.8 63.9 1.4 2.32%Jan 17 - Dec 17 39.0 55.5 67.0 67.2 67.8 79.4 82.6 65.4 1.5 2.32%
Total 3 Yr 37.6 55.3 67.6 66.3 66.1 77.0 81.7 64.5Change from 2015 to 2016 1.1 1.8 1.8 1.7 1.8 3.3 1.6 1.4 Percentage 3% 3% 3% 3% 3% 5% 2% 2%Change from 2016 to 2017 3.1 0.6 (1.6) 1.0 2.9 3.6 1.8 1.5 Percentage 9% 1% -2% 1% 4% 5% 2% 2%
Three Year ADRSun Mon Tue Wed Thu Fri Sat Total Year Chg
Selected Hotel Set $116.99 $116.36 $118.17 $118.88 $118.87 $136.12 $137.49 $124.46Jan 16 - Dec 16 $116.70 $116.86 $118.60 $119.39 $117.25 $137.19 $140.54 $125.37 $0.91 0.73%Jan 17 - Dec 17 $116.33 $115.39 $117.17 $117.60 $117.12 $137.52 $142.16 $124.95 -$0.42 -0.33%
Total 3 Yr $116.59 $116.16 $117.94 $118.56 $117.47 $137.16 $140.68 $125.04Change from 2015 to 2016 -$0.29 $0.50 $0.44 $0.51 -$1.62 $1.07 $3.04 $0.91Percentage -0.2% 0.4% 0.4% 0.4% -1.4% 0.8% 2.2% 0.7%Change from 2016 to 2017 -$0.36 -$1.47 -$1.43 -$1.79 -$0.14 $0.32 $1.62 -$0.42Percentage -0.3% -1.3% -1.2% -1.5% -0.1% 0.2% 1.2% -0.3%
Three Year RevPARSun Mon Tue Wed Thu Fri Sat Total Year Chg
Aug 15 - Dec 15 $40.71 $61.79 $78.88 $76.73 $75.01 $98.69 $108.89 $79.22Jan 16 - Dec 16 $41.87 $64.11 $81.33 $79.06 $76.10 $104.06 $113.55 $80.17 $0.95 1.20%Jan 17 - Dec 17 $45.39 $64.05 $78.52 $79.04 $79.37 $109.23 $117.42 $81.76 $1.59 1.98%
Total 3 Yr $43.87 $64.29 $79.74 $78.64 $77.63 $105.62 $114.87 $80.66Change from 2015 to 2016 $1.16 $2.33 $2.45 $2.33 $1.09 $5.37 $4.66 $0.95Percentage 2.9% 3.8% 3.1% 3.0% 1.4% 5.4% 4.3% 1.2%Change from 2016 to 2017 $3.52 -$0.06 -$2.81 -$0.02 $3.28 $5.17 $3.87 $1.59Percentage 8.4% -0.1% -3.5% 0.0% 4.3% 5.0% 3.4% 2.0%
Source: Smith Travel Research See Appendix Number 2
Percent Chg
Percent Chg
Percent Chg
This report is provided in accordance with and subject to the RK Consulting Services, Inc. Agreement. It is designed to be accurate and authoritative, based on information obtained from third parties that we believe to be reliable. RK Consulting Services, Inc. does not, however, warrant or guarantee in any way the accuracy, completeness or fairness of the information provided. This report and the information contained herein are confidential and intended for our individual client's specifically authorized use.
This report is provided in accordance with and subject to the RK Consulting Services, Inc. Agreement. It is designed to be accurate and authoritative, based on information obtained from third parties that we believe to be reliable. RK Consulting Services, Inc. does not, however, warrant or guarantee in any way the accuracy, completeness or fairness of the information provided. This report and the information contained herein are
Page 39
COPYRIGHTED

Confidential March 16, 2018
Day of the Week Analysis - Competitive Set:
There are certain indicators within the competitive set which will reflect conditions that most likely exist in the overall travel market for the area of Columbia and Lancaster that may be helpful for the conclusions reached in the assumptions provided in this document. Here are the indicators which are considered:
1. Occupancy Percent - Rooms sold divided by rooms available. Occupancy is alwaysdisplayed as a percentage of rooms occupied.
2. ADR (Average Daily Rate) - A statistical unit that is used in the lodging industry. Thenumber represents the average rental income per paid occupied room in a given timeperiod.
3. RevPAR (Revenue per Available Room) - A performance metric in the hotel industry thatis calculated by dividing a hotel's total guestroom revenue by the room count and thenumber of days in the period being measured. Another way to calculate this metric is aformula that is the ADR multiplied by the Occupancy Percent ADR along with theproperty's occupancy are the foundations for the property's financial performance.
Page 40
These three metrics are the foundation in which all hotels are measured. In analyzing the Smith Travel Research (STR) report on the proceeding pages certain year over year results are determined. For a better understanding of the local area travel patterns, within the STR report is an analysis of the above indicators on average annually broken down by the individual days of the week. This information will allow the reader to see how the business levels (Occupancy Percent) and the price point (ADR) as well as the RevPAR performed during each day of the week on an annual basis. (The following tables were from Page 39 and Page 7 of Appendix 2) Table 1 below reflects the changes year over year of the Occupancy Percent by Day of the Week over a rolling 12 month period ending in December of each year. The changes from 2015 to 2017 were somewhat stable over the periods. The increase annually in 2015 from 2016 was 1.9 basis points or a 3% increase. The change annually from 2016 to 2017 is basically similar at 1.5 basis points again a 2% increase. This trend reflects a perceived stable market based on business levels with an annual increase of 2% in business levels over the last two years. This table also reflects the nights considered being more leisure base travel nights (Thursday to Saturday) have a higher business level compared to what is considered the corporate market (Sunday to Wednesday). This trend reveals a larger increase in the number of leisure travelers staying at the hotels in the competitive set than the business travelers who normally stay Sunday to Wednesday nights. Table 1
Three Year Occupancy (%) Sun Mon Tue Wed Thu Fri Sat Total Year
Jan 15 - Dec 15 34.8 53.1 66.8 64.5 63.1 72.5 79.2 62.0Jan 16 - Dec 16 35.9 54.9 68.6 66.2 64.9 75.8 80.8 63.9Jan 17 - Dec 17 39.0 55.5 67.0 67.2 67.8 79.4 82.6 65.4
Total 3 Yr 37.6 55.3 67.6 66.3 66.1 77.0 81.7 64.5Change from 2015 to 2016 1.1 1.8 1.8 1.7 1.8 3.3 1.6 1.9 Percentage 3% 3% 3% 3% 3% 5% 2% 3% Change from 2016 to 2017 3.1 0.6 (1.6) 1.0 2.9 3.6 1.8 1.5 Percentage 9% 1% -2% 1% 4% 5% 2% 2% COPYRIGHTED

Confidential March 16, 2018
Day of the Week Analysis - Competitive Set (Cont’d):
Table number 3 below reflects the changes year over year of the Revenue per Available Room (RevPAR). This table is merely a combination of the prior two tables presented because this metric is a formula that is the ADR multiplied by the Occupancy Percent ADR along with the property's occupancy are the foundations for the property's financial performance. In the year over year comparisons, the increase from 2016 to 2017 is greater by $1.59 or 2% compared to 2015 to 2016 annual increase of only $0.95 or 1.2%. This indicator seems to suggest is that there has been steady growth in the market over the last 36 month period from January 2015 to December 2017. Also, it should be noted, that even though there has been a steady increase in last 12 months in RevPAR; there was a larger increase in the Sundays through Wednesday in the period ending in December 2016 compared to the period ending in December 2017. This could be because there was change in the corporate rates being reduced in 2017. However overall the indicators reflect there is an opportunity for an additional 60 rooms in the market.
Page 41
Table 3Three Year RevPAR
Sun Mon Tue Wed Thu Fri Sat Total YearJan 15 - Dec 15 $40.71 $61.79 $78.88 $76.73 $75.01 $98.69 $108.89 $79.22Jan 16 - Dec 16 $41.87 $64.11 $81.33 $79.06 $76.10 $104.06 $113.55 $80.17Jan 17 - Dec 17 $45.39 $64.05 $78.52 $79.04 $79.37 $109.23 $117.42 $81.76
Total 3 Yr $43.87 $64.29 $79.74 $78.64 $77.63 $105.62 $114.87 $80.66Change from 2015 to 2016 $1.16 $2.33 $2.45 $2.33 $1.09 $5.37 $4.66 $0.95Percentage 2.9% 3.8% 3.1% 3.0% 1.4% 5.4% 4.3% 1.2%Change from 2016 to 2017 $3.52 -$0.06 -$2.81 -$0.02 $3.28 $5.17 $3.87 $1.59Percentage 8.4% -0.1% -3.5% 0.0% 4.3% 5.0% 3.4% 2.0%
Table 2 below reflects the changes year over year of the Average Daily Rate (ADR) by Day of the Week over a rolling 12 month period ending in December of each year. Interestingly the changes in the ADR from 2016 to 2017 were lower than 2015 to 2016. The decrease in 2016 from 2017 was $0.42 or a .03% decrease year over year in total; which is relatively flat. The changes in ADR from 2015 to 2016 in ADR were higher at $0.91 or a 0.7% increase annually. It should be noted that one of the reasons while the business levels were consistently increasing in Table 1 for 2016 to 2017 was probably because the ADR was relatively flat year over year in the competitive set of hotels. Even though the overall annual ADR is flat: there are some days with lower rates changes than other nights; during the nights of Sunday to Thursday the competitive set actually decreased the rates. This trend continues to show that the nights considered more leisure based nights (Friday and Saturday) saw comparable increases compared to Sunday t through Thursday nights. Table 2
Three Year ADR Sun Mon Tue Wed Thu Fri Sat Total Year
Jan 15 - Dec 15 $116.99 $116.36 $118.17 $118.88 $118.87 $136.12 $137.49 $124.46 Jan 16 - Dec 16 $116.70 $116.86 $118.60 $119.39 $117.25 $137.19 $140.54 $125.37 Jan 17 - Dec 17 $116.33 $115.39 $117.17 $117.60 $117.12 $137.52 $142.16 $124.95
Total 3 Yr. $116.59 $116.16 $117.94 $118.56 $117.47 $137.16 $140.68 $125.04 Change from 2015 to 2016 -$0.29 $0.50 $0.44 $0.51 -$1.62 $1.07 $3.04 $0.91 Percentage -0.2% 0.4% 0.4% 0.4% -1.4% 0.8% 2.2% 0.7% Change from 2016 to 2017 -$0.36 -$1.47 -$1.43 -$1.79 -$0.14 $0.32 $1.62 -$0.42 Percentage -0.3% -1.3% -1.2% -1.5% -0.1% 0.2% 1.2% -0.3%
COPYRIGHTED

Amenity Profile by Hotel; Competitive SetSelected Hotel Set
Property CharacteristicsComfort Inn
Lancaster County
Holiday Inn Express & Suites Lancaster Lititz
Hampton Inn & Suites Mount Joy Lancaster West
Fairfield Inn & Suites Lancaster
Country Inn & Suites Lancaster
Allow pets Y Y Y Y YBusiness center fax services Y Y Y Y YBusiness center internet access Y Y Y Y YBusiness center on premise Y Y Y Y YBusiness center PC for guest use Y Y Y Y YChildren's activities available N N N N NCoin laundry N Y N Y YConcierge N N N N NDry cleaning Y Y Y Y YExercise facilities on premise Y Y Y Y YExercise instructor on premise N N N N NFee for pets Y N Y N NGarage parking N N N N NGift Shop/Grab and Go Y Y Y Y YGolf on premises N N N N NIndoor Pool N Y Y Y YOutdoor Pool Y Y Y Y YLuxury/executive/concierge level Y Y Y Y YRoom service Y N N N NSpa on Property N N N N NStreet parking N N N N NTennis on premise N N N N NValet parking N N N N N
In Room Amenities2-line phone in all or some rooms Y Y Y Y YCable TV in all or some rooms Y Y Y Y YCD player available N N N N NCoffeemaker in all or some rooms Y Y Y Y YCribs available Y Y Y Y YDataport in all or some rooms Y Y Y Y YFax machine in all or some rooms N N N N NFree videos available N N N N NHigh speed internet in all or some rooms Y Y Y Y YHonor/Mini-Bar in all or some rooms N N N N NMicrowave in all or some rooms Y Y Y Y YPremium TV in all or some rooms Y Y Y Y YSprinklers in guest rooms Y Y Y Y YVCR available N N N N NVideo games available in guest rooms Y Y Y Y YWet bar in all or some rooms N N N N N
This report is provided in accordance with and subject to the RK Consulting Services, Inc. Agreement. It is designed to be accurate and authoritative, based on information obtained from third parties that we believe to be reliable. RK Consulting Services, Inc. does not, however, warrant or guarantee in any way the accuracy, completeness or fairness of the information provided. This report and the information contained herein are confidential and intended for our individual client's specifically authorized use.
Page 42
COPYRIGHTED

Amenity Profile by SegmentUnited States
Five Four Three Star Three Star Two One ExtendedProperty Characteristics Star Star w/ F&B w/out F&B Star Star StayAllow pets 35.77% 29.15% 55.38% 44.43% 58.61% 64.95% 80.16%Business center fax services 98.39% 97.16% 96.15% 94.84% 93.56% 94.70% 94.81%Business center internet access 87.21% 76.45% 52.91% 40.91% 40.45% 27.34% 44.59%Business center on premise 86.17% 61.97% 39.20% 26.93% 23.72% 15.11% 35.34%Business center PC for guest use 80.56% 56.43% 23.61% 15.53% 7.56% 8.20% 35.14%Children's activities available 29.41% 12.00% 17.09% 6.78% 10.80% 8.46% 7.69%Coin laundry 27.94% 64.17% 63.79% 53.96% 48.57% 53.63% 97.62%Concierge 88.36% 49.03% 18.64% 8.12% 6.84% 7.69% 24.36%Dry cleaning 100.00% 98.65% 82.17% 83.80% 61.81% 29.85% 98.80%Exercise facilities on premise 95.21% 89.95% 59.33% 49.32% 20.73% 15.52% 62.60%Exercise instructor on premise 22.22% 6.67% 3.17% 3.27% 2.22% 3.03% 6.49%Fee for pets 23.81% 25.58% 32.84% 27.49% 42.44% 40.00% 84.62%Garage parking 56.66% 31.86% 11.97% 2.90% 5.52% 1.85% 9.59%Gift Shop 88.44% 59.26% 26.48% 6.95% 8.00% 5.67% 28.10%Golf on premises 7.43% 3.33% 3.29% 1.02% 2.35% 1.94% 0.86%Indoor Pool 45.37% 46.49% 40.80% 32.64% 26.78% 19.53% 12.17%Outdoor Pool 61.49% 57.19% 66.13% 55.86% 56.16% 38.89% 85.48%Luxury/executive/concierge level 69.79% 36.11% 13.95% 2.02% 1.59% 1.53% 1.33%Room service 99.77% 93.17% 68.99% 15.76% 12.95% 9.77% 27.27%Spa on Property 23.28% 8.50% 9.37% 9.04% 9.42% 8.46% 10.26%Street parking 28.10% 24.77% 20.13% 14.01% 19.39% 19.82% 15.07%Tennis on premise 21.48% 11.28% 6.22% 1.31% 1.77% 1.95% 25.86%Valet parking 67.92% 32.94% 4.90% 0.97% 0.00% 2.78% 5.48%
In Room Amenities2-line phone in all or some rooms 80.60% 47.95% 26.60% 36.95% 13.64% 10.24% 42.86%Average crib fee $16.31 $11.88 $7.05 $6.82 $6.08 $5.58 $11.25Cable TV in all or some rooms 95.06% 94.26% 91.84% 93.20% 92.90% 93.43% 88.16%CD player available 16.76% 5.18% 1.65% 0.00% 0.00% 0.00% 4.00%Coffeemaker in all or some rooms 77.21% 90.85% 84.91% 88.54% 71.61% 57.02% 100.00%Cribs available 98.29% 97.69% 96.91% 96.46% 98.50% 95.96% 97.14%Dataport in all or some rooms 98.04% 98.56% 94.28% 96.07% 84.85% 78.72% 97.40%Fax machine in all or some rooms 44.97% 9.44% 5.94% 5.42% 8.62% 11.38% 0.00%Free videos available 4.77% 1.23% 3.01% 6.07% 6.41% 5.41% 6.58%High speed internet in all or some rooms 58.59% 38.28% 22.92% 21.19% 17.14% 10.57% 23.38%Honor/Mini-Bar in all or some rooms 48.39% 17.30% 3.44% 1.79% 1.69% 0.00% 0.00%Microwave in all or some rooms 29.51% 61.30% 62.01% 71.29% 67.09% 57.85% 100.00%Premium TV in all or some rooms 89.30% 80.18% 78.72% 88.27% 80.25% 78.15% 91.89%Sprinklers in guest rooms 97.71% 89.19% 51.50% 68.80% 45.24% 30.95% 67.65%VCR available 58.78% 38.11% 38.44% 35.24% 33.54% 29.41% 62.34%Video games available in guest rooms 44.06% 49.49% 31.02% 32.13% 19.83% 10.71% 26.47%Wet bar in all or some rooms 60.45% 54.65% 27.59% 25.29% 12.36% 12.80% 28.38%
OtherAirport transportation available 30.75% 46.51% 35.98% 26.63% 20.86% 24.81% 44.59%Average check-in time (24 hr clock) 3:15pm 3:00pm 2:45pm 2:45pm 2:45pm 2:00pm 3:00pmAverage check-out time (24 hr clock) 12:00pm 12:00pm 11:45am 11:30am 11:30am 11:15am 12:00pmAvg. Year Built 1975 1979 1974 1987 1982 1981 1986
Source: Smith Travel Research Page 43
This report is provided in accordance with and subject to the RK Consulting Services, Inc. Agreement. It is designed to be accurate and authoritative, based on information obtained from third parties that we believe to be reliable. RK Consulting Services, Inc. does not, however, warrant or guarantee in any way the accuracy, completeness or fairness of the information provided. This report and the information contained herein are confidential and intended for our individual client's specifically authorized use.
COPYRIGHTED

Pipeline Distribution Columbia, PA and Area
Source: Smith Travel Research
Page 44
Midscale W/O F&B 27%
Midscale W F&B 18% Economy
45%
Independent 10%
Distribution of 20 Closest Hotels by Chain Type (% of Rooms)
This report is provided in accordance with and subject to the RK Consulting Services, Inc. Agreement. It is designed to be accurate and authoritative, based on information obtained from third parties that we believe to be reliable. RK Consulting Services, Inc. does not, however, warrant or guarantee in any way the accuracy, completeness or fairness of the information provided. This report and the information contained herein are confidential and intended for our individual client's specifically authorized use.
COPYRIGHTED

Confidential March 16, 2018
Future Hotel Project in a 25 Mile Radius of Site: The research conducted for this study discovered four hotel projects within a 25 mile Radius that are either in the Pre-Planning, Planning, Construction or newly opened stages. There is a company called www.LodgingDevelopment.com website that specializes in researching and documenting hotel projects under various phases of construction. Details for the 2 projects identified are on the following pages. It should be noted that both these projects will not be competitors to the subject hotel. 1. The York County Industrial Development Authority has purchased the historic, 124-roomYorktowne Hotel. The authority intends to develop a plan to upgrade the property. Therenovation budget is $20 million. Hersha Hospitality Management will continue as manager
Page 45
COPYRIGHTED
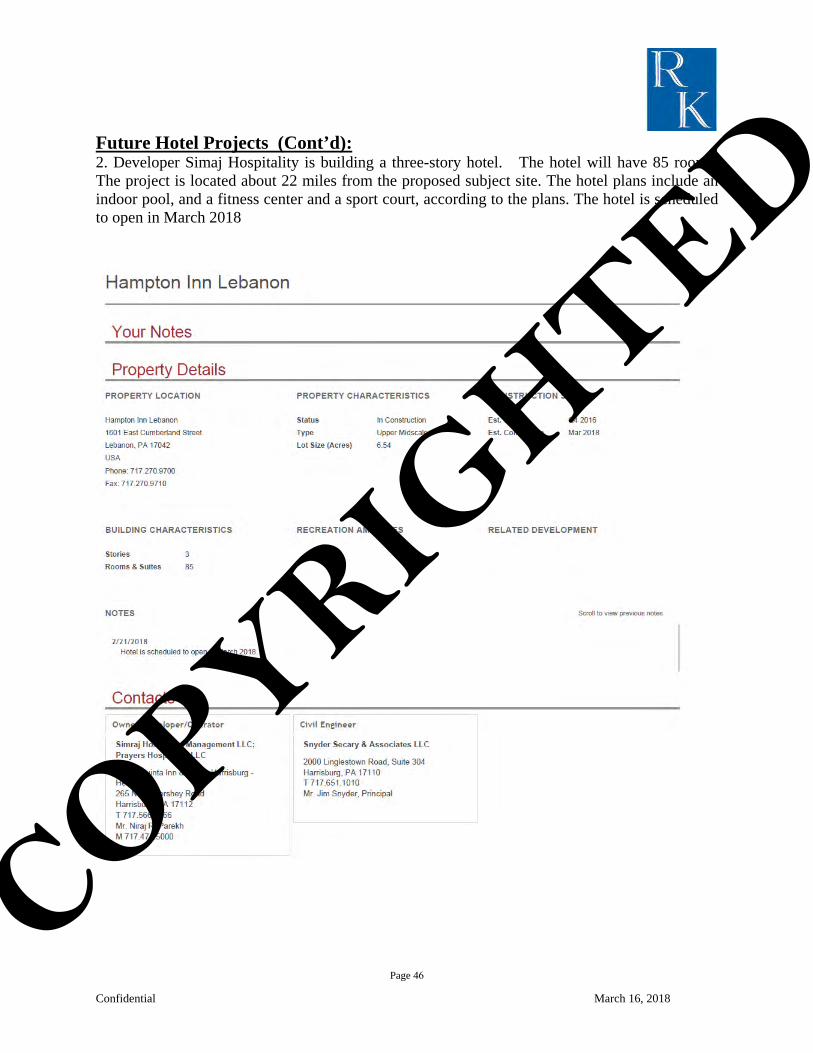
Confidential March 16, 2018
Future Hotel Projects (Cont’d): 2. Developer Simaj Hospitality is building a three-story hotel. The hotel will have 85 rooms.The project is located about 22 miles from the proposed subject site. The hotel plans include anindoor pool, and a fitness center and a sport court, according to the plans. The hotel is scheduledto open in March 2018
Page 46
COPYRIGHTED

Confidential March 16, 2018
Analysis of the Construction Cost The following page presents a preliminary analysis of the construction requirements for the proposed site. Analyzing costs of hotel projects incorporates a number of factors. First and foremost, the scope of the project must be determined, including, but not limited to, the structural and mechanical requirements, the quality of finish, and the project location. For the purpose of this analysis the projections of the hotel development project was for a Three Star Hotel. The cost analysis of hotel projects incorporates both our data and commercially available cost estimating references. The mid-range hard costs for most hotel projects are currently estimated to be approximately $135/sq. ft. The high-end luxury hotels have ranged from $225 to more than $550/sq. ft. for hard renovations costs alone depending on the geographical location of the project. The low to high development costs per room for each component (land, development, renovations, Furniture, Fixtures, and Equipment, operating capital and pre-opening) vary widely among the different types of hotels. However, the average cost percentage for each component is highly similar for all hotels. For example, land costs for all types of hotels runs 11% to 15% of the total project cost. The average allocation of budgeted costs for all type of hotels is:
13% for land 11% for development and soft costs 61% for site improvement and building renovations 12% for FF&E 3% for pre-opening and working capital 100% for total project costs
Typically site improvement work is excluded from the ranges, since some projects are erected in large cities, where others are constructed along with resort facilities. Furniture, Fixtures, and Equipment (FF&E) are also typically outside the hard renovations costs, as well as Soft Cost such as pre-opening costs, design and architectural initial fees, and consultations. This analysis does present all three categories (Site improvements, FFE and Soft Costs) The biggest variance from low to high costs falls in the luxury and resort category due to the extra time it takes for site acquisition, regulatory approvals, mitigation and higher quality renovations. As noted in the table on the next page development costs for four and five-star properties reflect the higher barriers to entry and higher quality improvements. The wide variation from low to high costs per room for all hotels are also due to differences in site characteristics, density, building & zoning codes, local labor and other renovations costs. For example, limited-service hotels may be more expensive to build in urban areas than full-service hotels in suburban areas. We compared the cost allocations for different types of hotels --- from economy to mid-priced to upscale and luxury. Upon close analysis, certain patterns emerge. Most interesting is the consistent allocation of the hotel development budget across the five cost components: (1) Land, (2) Development or soft costs, (3) Site Improvement & Building Renovations costs, (4) FF&Ecosts, and (5) Pre-Opening & Operating Capital --- for each of the hotel types.
Page 45
COPYRIGHTED

Confidential March 16, 2018
Analysis of the Construction Cost No uniform system of hotel development cost allocation exists. Hotel development costs are accounted for different ways depending upon tax implications, underwriting requirements and investment structures. For example, FF&E and construction finish work can overlap and differ from one project to another. Overall, there is a give & take among the cost components --- a project with a high land cost may have a lower construction cost. The following table shows the lowest, highest and average cost per room for the development of various service levels of hotel types.
HOTEL DEVELOPMENT COSTS
The analysis of the projections on the following page averages $103,370 per room for Development of the Proposed Hotel. This amount is significantly lower than the $152,900 Average for the Select Service Hotel noted in the Table above. This is primarily due to the current condition. The existing building is built out of brick and the developer has no intention of replacing that structure. The majority of the work will be occurring inside the building. Additional factor used in creating the project estimate is union wages are not considered for this project. This projection is based on estimated construction cost given the current economic conditions, and industry specific related expenses to be incurred during the renovations phase. This analysis does not in any manner represent the true actual development costs and will most definitely be subject to change should the current
economic condition dramatically change.
Page 46
Acquisition Soft Construction Total Working TotalType Costs Costs Costs FFE Costs Capital ProjectEconomy HotelsLowest $2,500 $1,200 $33,600 $1,200 $100 $41,300Highest $53,600 $17,900 $116,200 $17,900 $4,000 $184,900Average $10,900 $7,800 $63,000 $10,200 $1,600 $91,200Percent 12% 9% 69% 11% 2% 100%Select Service HotelsLowest $8,500 $7,500 $45,000 $15,000 $4,500 $80,500Highest $35,000 $41,700 $154,100 $35,000 $12,300 $278,100Average $3,100 $20,200 $90,200 $14,800 $3,500 $152,900Percent 2% 13% 59% 10% 2% 100%Full Service HotelsLowest $5,300 $1,100 $7,100 $5,500 $200 $19,200Highest $175,100 $137,300 $349,800 $43,100 $38,700 $694,700Average $45,700 $33,000 $190,300 $28,300 $13,600 $330,900Percent 14% 10% 58% 9% 4% 100%
Lowest $22,375 $33,125 $178,500 $45,500 $5,500 $285,000Highest $171,875 $180,875 $357,375 $130,750 $28,500 $869,375Average $60,625 $75,625 $252,625 $65,000 $12,400 $466,275Percent 13% 16% 54% 14% 3% 100%
Luxury Hotels & Resorts
Source: HVS/STR 2015/16
COPYRIGHTED

3/16/2018
Proposed Development 60 Guest Rooms Total 18,900 Sq FT (Average 315 Sq Ft)
29,379 Clarion Inn and Suites Est. Sq Ft Columbia, Pennsylvania (000's)
Incl 10.5K Sq Ft Estimated Est. Cost Est. Cost in Public Space Description Cost Per Room Per SF Percent
LandBuilding Acquisition (Estimated Value) 240.0 4,000 8.17 3.9%Site Improvements Parking 500.0 8,333 17.02 8.1%Total Land $740.0 12,333 25.19 11.9%
Building Costs Roofing & Waterproof 530.8 8,847 18.07 8.6%Miscellaneous Metals 145.2 2,421 4.94 2.3%Doors and Hardware 157.0 2,616 5.34 2.5%Finishes 144.8 2,331 4.93 2.3%Carpentry/Woods and Plastics 140.1 2,335 4.77 2.3%Elevators 571.6 9,526 19.46 9.2%Plumbing & HVAC 337.8 5,630 11.50 5.4%Pool/Recreation 386.0 6,434 13.14 6.2%Fire Protection/Sprinklers 104.8 1,746 3.57 1.7%Restaurant 437.1 7,284 14.88 7.0%Electrical 234.3 3,905 7.97 3.8%Building Costs $3,194.4 53,158 108.73 51.5%
Subtotals Hard Construction incl Land $3,934.4 65,492 133.92 63.4%Contingency
Project Contingency 5.00% 159.7 2,662 5.44 2.6%
Total Building $4,094.1 $68,154 $139.36 66.0%
Soft Goods/Furniture Fixtures and EquipmentCalculated $9,500 per Room 570.0 9,500 19.40 9.2%
Soft CostsArchitect/Engineers (Inc. Planning and Legal) 650.0 10,833 22.12 10.5%Intial Franchise Fees 40.0 667 1.36 0.6%Project Management 300.0 5,000 10.21 4.8%Builder's Insurance 200.0 3,333 6.81 3.2%Real Estate Taxes 8.0 133 0.27 0.1%Subtotal 1,198.0 19,967 40.78 19.3%
Direct Project Costs $5,862.1 $97,620 $199.5 94.5%Related CostsFinancing Costs
Bank Fees 25.0 417 0.85 0.4%Loan Fees (Set-up, Admin, Etc.) 35.0 583 1.19 0.6%Subtotal Financing Costs 55.0 1,000 1.87 0.9%
Pre-Opening Cost Pre Opening Budget (IT Training) 50.0 833 1.70 0.8%Pre Opening Inventory & Supplies (OSE) 100.0 1,667 3.40 1.6%Working Capital Initial Reserve 0.0 0 0.00 0.0%Pre Opening Budget 150.0 2,500 5.11 2.4%
Subtotal Related Costs 205.0 3,500.0 6.98 3.3%
Project and Related Costs 6,067.1 101,120 221.39 97.8%Construction Period Interest 135.0 2,250 4.60 2.2%
Total Cumulative Costs 6,202.1 103,370 211.11 100%
This report is provided in accordance with and subject to the Consulting Agreement. It is designed to be accurate and authoritative, based on information obtained from third parties that we believe to be reliable. RK Consulting Services, Inc. does not, however, warrant or guarantee in any way the accuracy, completeness or fairness of the information provided. This report and the information contained herein is confidential and intended for our individual client's specifically authorized use.
COPYRIGHTED

Confidential March 16, 2018
Notes to 10 Year Proforma: The 10 year proforma on the following pages was created using a conservative methodology. Below are the explanations of the assumptions applied to the proforma. AVERAGE RATE : Historically the area in and around Columbia, Pennsylvania generated Average Daily Rates (ADR) $65.00 for Limited Service hotels (Quality Inn, Comfort Inn, etc.) to $125.00 for Select Service Hotels (Holiday Inn Express) as noted in the STR Report. The starting ADR in the 10 year proforma is $117.50 primarily due to maintaining a conservative approach; compared to the $124.95 2017 Year End in the STR Report. (See page 35). The growth in the ADR is 3% annually until the hotel is stabilized in year 3. The increase year over year following year 3 is a 5% increase. OCCUPANCY PERCENT: Occupancy percentages are a large indicator in the hotel industry. The percentages in the proforma have the potential to reach as high as 65.0% in the third year and RevPAR (Revenue Per Available Room) of $80.25 with average room rates of $123.45 per night; it is expected the hotel will offer room rates averaging $85.00 per night weekends during the off season and $150 per night weekends during the season which is typically April through October. The 1st Year Occupancy Percent is 60.0% is conservative compared to the average percent of 64.5% YTD 2016 presented in the STR Report. The increase in the year over year is very conservative with 5% increase in the percent until the business levels stabilize in the 3rd full year at 65.0%. ROOMS DEPARTMENT: Departmental profit for rooms operations averages from 75% to 85% dependent on the level of business for the year. The proforma presented a profit of 80% in the stabilized year 3 was decided upon primarily due to a smaller payroll than many of the larger hotels. TELEPHONE: The amount presented in the proformas is $.50 per occupied with 2% of that revenue presented in profit. RESTAURANT LEASE REVENUE: Revenue in this category represents the Restaurant Lease for the hotel. In maintaining the conservative approach based on the current asking rents of $30.00 per/Year per Square Foot it is projected the lease space will rented out at $28.00/year per Sq. Ft on 3,000 Sq. Ft over a 10 year lease. OTHER REVENUE: Revenue in the category includes valet, business services, and vending operations which are the typical additional offerings in a hotel of this type. Also in this category is Room Rental Revenue from a boardroom which will be located on the first floor. The revenue is averaging $12,000 per year stabilized. UNDISTRIBUTED EXPENSES: Administrative and General Expenses for the 10 years are expected to be 7% of total revenue, primarily based on industry standards. Administrative and General (A&G) Expenses ranged from 4.5% to 12.5% of total revenue in the industry. A&G expenses include the labor expense for the Executive Office, Accounting, and 1.8% of total revenue for credit card commission. Sales and Marketing expenses for years 1 and 2 are 10% respectively for promoting the property; it then stabilizes to 6% in year 3. Other undistributed expenses include Repairs and Maintenance (R&M) costs which typically average 4.0% of total revenues. R&M Expenses will increase to 6% as the building gets older. Franchise Fees were added to Undistributed Expenses to show the expenses related to operating the hotel under the Clarion brand by Choice is projected to be 7.5% of Room Revenue.
Page 50
COPYRIGHTED

Confidential March 16, 2018
Notes to 10 Year Proforma (Cont’d): ENERGY COST: Energy cost for the years of operation is expected to range from 10% to 5% of total revenue. Historically Energy costs averaged $8.50 per occupied room in this area. This proforma is presenting a conservative room cost of $9.50 per occupied room due to current market conditions in the energy sector.
FIXED CHARGES, INSURANCE REAL ESTATE TAXES AND FF&E: Property tax for the first five years is estimated to be $125,000 based on a conservative approach with 10% increase every two years for inflation. Typically in this area the Real Estate Tax for Lodging and Commercial Use is not as excessive. Insurance for the first year is estimated to be $100,000. FF&E Reserve is calculated as 3% of total revenue for the first year and the second year, then 4% for the third year of the financial projections.
DEBT SERVICE: The assumptions taken in reference to the financing of the construction were based on an estimates detailed in each proforma as a cost per room for the construction estimate. The details of the annual amortization of the loan appear on the top of the first page of the proforma. The estimate provided in the detailed cost table on the top of the proforma has an assumption that a 20% down payment was required for the financing of the project; leaving 80% LTV to be financed. The terms of the financing are being presented as a standard 20 year mortgage term loan which is standard in the lodging industry. The interest rate presented is 4.75%; (this interest rate is based on a Term Sheet from EDC Finance dated 11/17/2017 which was provided by the Developer). It is assumed that a portion of this loan will be guaranteed under the SBA 504 loan program. There is no guarantee that interest rate will be available at the time of transaction and it is only being presented for calculation purposes only.
Page 51COPYRIGHTED

Hotel Feasibility Study
Clarion Inn and SuitesColumbia, Pennsylvania
Appendix1. CBRE Cap Rate Survey Hotels - 2017 First Half Philadelphia2. Smith Travel Historical Trend Report - Lancaster and Columbia PA3. Term Sheet First EDC Finance Corporation dated 11/11/20174. Article on Keystone Edge Website dated 02/20/2018
This report is provided in accordance with and subject to the RK Consulting Services, Inc. Agreement. It is designed to be accurate and authoritative, based on information obtained from third parties that we believe to be reliable. RK Consulting Services, Inc. does not, however, warrant or guarantee in any way the accuracy, completeness or fairness of the information provided. This report and the information contained herein are confidential and intended for our individual client's specifically authorized use. COPYRIGHTED

58© 2017 CBRE, Inc. |CBRE Research
MAPS
U.S. HOTEL SELECT/ECONOMY | KEY RATES CONT.
SELECT-SERVICE ECONOMY
CBD CAP RATES FOR STABILIZED PROPERTIES (%) CHANGE1
SUBURBAN CAP RATES
FOR STABILIZED PROPERTIES (%) CHANGE1
CBD CAP RATES FOR STABILIZED PROPERTIES (%) CHANGE1
SUBURBAN CAP RATES
FOR STABILIZED PROPERTIES (%) CHANGE1
TIE
R I
BOSTON 6.00 - 7.00 7.50 - 8.50 7.00 - 10.00 7.00 - 10.00
CHICAGO 8.00 - 9.00 8.00 - 9.00 8.50 - 10.50 8.75 - 10.75
N. CA: OAKLAND 8.50 - 10.50 8.00 - 9.00 9.50 - 11.50 9.50 - 11.50
N. CA: SAN FRANCISCO 8.00 - 9.00 9.50 - 10.50 8.50 - 10.50 9.50 - 11.50
N. CA: SAN JOSE 8.50 - 10.50 8.00 - 9.00 9.50 - 11.50 9.50 - 11.50
NY: N. NEW JERSEY 7.75 - 8.75 7.75 - 9.00 8.00 - 9.00 9.00 - 10.50
NY: NEW YORK CITY 6.00 - 7.75 7.75 - 9.25 8.00 - 8.50 9.00 - 11.00
S. CA: INLAND EMPIRE 8.00 - 9.50 8.00 - 9.50 8.50 - 10.00 8.50 -10.50
S. CA: LOS ANGELES 7.00 - 8.50 7.50 - 9.00 8.00 - 9.00 8.00 - 9.50
S. CA: ORANGE COUNTY 7.00 - 8.50 7.50 - 8.00 8.00 - 9.00 8.00 - 9.50
S. FL: FT. LAUDERDALE 8.00 - 9.00 8.50 - 9.50 8.50 - 9.50 9.00 - 10.00
S. FL: MIAMI 7.50 - 8.50 8.75 - 9.25 8.50 - 9.50 9.00 - 9.75
S. FL: WEST PALM BEACH 8.25 - 9.50 9.00 - 10.00 9.00 - 10.00 9.50 - 10.50
SAN DIEGO 7.00 - 8.50 7.50 - 9.00 8.00 - 9.00 8.00 - 9.50
SEATTLE 6.50 - 7.00 7.50 - 8.50 8.00 - 9.00 9.25 - 10.25
WASHINGTON, D.C. 6.00 - 7.00 7.75 - 9.00 7.00 - 8.00 8.50 - 9.00
SELECT-SERVICE ECONOMY
CBD CAP RATES FOR STABILIZED PROPERTIES (%) CHANGE1
SUBURBAN CAP RATES
FOR STABILIZED PROPERTIES (%) CHANGE1
CBD CAP RATES FOR STABILIZED PROPERTIES (%) CHANGE1
SUBURBAN CAP RATES
FOR STABILIZED PROPERTIES (%) CHANGE1
TIE
R I
I
ATLANTA 7.50 - 9.00 8.00 - 9.50 8.25 - 9.75 9.25 - 11.00
AUSTIN 6.75 - 7.75 7.25 - 8.25 8.00 - 10.50 8.50 - 11.00
BALTIMORE 7.00 - 8.00 8.50 - 9.50 7.50 - 9.00 8.00 - 9.50
DALLAS/FT. WORTH 7.25 - 8.25 7.25 - 8.25 8.50 - 11.00 8.50 - 10.50
DENVER 7.50 - 8.00 8.25 - 9.00 8.25 - 9.00 8.50 - 9.50
HOUSTON 7.75 - 8.75 8.25 - 9.25 8.50 - 11.25 8.75 - 11.25
LAS VEGAS 8.00 - 9.50 8.00 - 9.50 9.00 - 10.50 9.00 - 10.50
MINNEAPOLIS 7.75 - 9.00 8.25 - 10.00 7.75 - 10.00 8.75 - 10.75
NASHVILLE 8.00 - 8.50 8.50 - 9.00 9.50 - 10.00 � 9.50 - 10.00
ORLANDO 8.00 - 8.75 8.25 - 9.25 9.25 - 9.75 9.25 - 10.00
PHILADELPHIA 7.50 - 8.50 7.75 - 8.50 8.75 - 9.25 9.75 - 10.25
PHOENIX 7.50 - 8.50 7.75 - 8.75 9.00 - 10.25 9.25 - 10.50
PITTSBURGH 8.50 - 9.50 9.00 - 10.50 9.00 - 10.50 9.50 - 11.50
PORTLAND 7.50 - 8.50 8.00 - 8.75 8.75 - 9.50 9.00 - 9.75
1Compared wtih end of H2 2016. Changes less than 15 bps considered stable. All rates are rounded to the nearest 25 bps.
Source: CBRE Research. Markets represent metropolitan areas. For larger metros, tier designa-tion is based on the U.S. Census Bureau's combined statistical area (CSA)
retain the same tier designation as the CSA to which they belong. See tier methodology for further explanation.
INCREASE
DECREASE
STABLE
� N/A
OVERVIEW OFFICE INDUSTRIAL RETAIL MULTIFAMILY HOTEL CANADA APPENDIX
NORTH AMERICA CAP RATE SURVEY
FIRST HALF 2017
PHILADELPHIA 7.50 - 8.50PHILADELPHIA 7.50 - 8.50 7.75 - 8.50 8.75 - 9.25 9.75 - 10.25
COPY
RIGH
TED

56© 2017 CBRE, Inc. |CBRE Research
MAPS
U.S. HOTEL LUXURY/FULL SERVICE | KEY RATES
LUXURY FULL-SERVICE
CBD CAP RATES FOR STABILIZED PROPERTIES (%) CHANGE1
SUBURBAN CAP RATES
FOR STABILIZED PROPERTIES (%) CHANGE1
CBD CAP RATES FOR STABILIZED PROPERTIES (%) CHANGE1
SUBURBAN CAP RATES
FOR STABILIZED PROPERTIES (%) CHANGE1
TIE
R I
BOSTON 6.00 - 6.50 7.00 - 8.00 6.00 - 7.00 8.00 - 9.50
CHICAGO 6.75 - 7.00 7.75 - 8.50 7.00 - 9.00 7.50 - 8.25
N. CA: OAKLAND 7.50 - 8.50 7.50 - 8.50 8.00 - 9.00 7.00 - 8.00
N. CA: SAN FRANCISCO 6.00 - 7.00 7.00 - 8.00 7.00 - 8.00 8.00 - 9.00
N. CA: SAN JOSE 7.50 - 8.50 7.50 - 8.50 8.00 - 9.00 7.00 - 8.00
NY: N. NEW JERSEY 6.00 - 6.50 7.00 - 7.50 6.50 - 8.00 7.00 - 8.50
NY: NEW YORK CITY 4.25 - 5.25 6.00 - 7.50 5.75 - 6.75 6.75 - 8.50
S. CA: INLAND EMPIRE 7.50 - 8.50 8.00 - 9.00 8.00 - 9.00 8.00 - 9.50
S. CA: LOS ANGELES 5.50 - 7.50 6.00 - 7.50 6.50 - 8.00 7.00 - 8.00
S. CA: ORANGE COUNTY 5.50 - 7.50 6.00 - 7.50 6.50 - 8.00 7.00 - 8.00
S. FL: FT. LAUDERDALE 7.00 - 8.00 7.25 - 8.25 7.25 - 8.25 8.00 - 9.00
S. FL: MIAMI 6.00 - 7.00 6.75 - 7.50 6.75 - 7.75 7.75 - 8.75
S. FL: WEST PALM BEACH 7.25 - 7.75 6.75 - 8.25 7.75 - 8.75 8.50 - 9.50
SAN DIEGO 5.50 - 7.50 7.00 - 8.00 6.50 - 8.00 7.00 - 8.00
SEATTLE 5.75 - 6.25 6.50 - 7.50 6.00 - 6.50 7.50 - 8.50
WASHINGTON, D.C. 4.50 - 6.00 6.00 - 7.50 5.50 - 6.50 6.50 - 8.50
LUXURY FULL-SERVICE
CBD CAP RATES FOR STABILIZED PROPERTIES (%) CHANGE1
SUBURBAN CAP RATES
FOR STABILIZED PROPERTIES (%) CHANGE1
CBD CAP RATES FOR STABILIZED PROPERTIES (%) CHANGE1
SUBURBAN CAP RATES
FOR STABILIZED PROPERTIES (%) CHANGE1
TIE
R I
I
ATLANTA 6.25 - 8.00 6.75 - 8.25 7.00 - 8.50 7.50 - 9.00
AUSTIN 6.50 - 7.75 6.75 - 8.00 7.25 - 7.75 7.50 - 8.50
BALTIMORE 6.50 - 7.50 8.00 - 9.00 7.00 - 8.00 8.00 - 9.00
DALLAS/FT. WORTH 7.25 - 8.25 7.25 - 8.25 7.75 - 8.75 7.75 - 8.75
DENVER 6.50 - 7.00 7.00 - 7.50 7.00 - 7.50 8.00 - 8.50
HOUSTON 7.50 - 8.50 7.75 - 8.75 8.00 - 9.00 8.25 - 9.25
LAS VEGAS 7.00 - 8.00 7.25 - 8.25 7.75 - 8.75 7.75 - 8.75
MINNEAPOLIS 6.75 - 8.00 7.25 - 8.25 6.75 - 8.50 7.75 - 9.50
NASHVILLE 7.50 - 8.00 7.50 - 8.00 � 7.75 - 8.25 8.00 - 9.00
ORLANDO 6.00 - 7.50 6.25 - 7.75 6.75 - 8.00 7.00 - 8.50
PHILADELPHIA 6.00 - 6.50 6.50 - 7.00 7.25 - 8.00 7.50 - 8.25
PHOENIX 6.75 - 7.25 6.75 - 7.50 7.75 - 8.25 7.75 - 8.50
PITTSBURGH 7.00 - 8.00 7.50 - 8.50 8.00 - 9.00 8.50 - 10.00
PORTLAND 7.00 - 7.75 8.00 - 8.25 7.25 - 8.00 8.00 - 8.25
1Compared with end of H2 2016.Changes less than 15 bps considered stable. All rates are rounded to the nearest 25 bps.
Source: CBRE Research. Markets represent metropolitan areas. For larger metros, tier designation is based on the U.S. Census Bu-reau's combined statistical area
retain the same tier designation as the CSA to which they belong. See tier methodology for further explanation.
INCREASE
DECREASE
STABLE
� N/A
OVERVIEW OFFICE INDUSTRIAL RETAIL MULTIFAMILY HOTEL CANADA APPENDIX
NORTH AMERICA CAP RATE SURVEY
FIRST HALF 2017
PHILADELPHIA 6.00 - 6.50PHILADELPHIA 6.00 - 6.50 6.50 - 7.00 7.25 - 8.00 7.50 - 8.25
COPY
RIGH
TED

Trend # 955519_SADIM / Created February 15, 2018
Table of Contents 1Data by Measure 2Percent Change by Measure 3Percent Change by Year 4Twelve Month Moving Average 5Twelve Month Moving Average with Percent Change 6Day of Week Analysis 7Raw Data 8Classic 9Response Report 10Terms and Conditions 11Help 12
735 East Main Street, Hendersonville, TN 37075 Blue Fin Building, 110 Southwark Street, London SE1 OTAT: +1 615 824 8664 T: +44 (0)20 7922 1930 [email protected] www.str.com [email protected] www.str.com
Trend Report - Columbia, PA - Raposa 213August 2015 to December 2017 Currency : USD - US Dollar
The STR Trend Report is a publication of STR, Inc. and STR Global, Ltd., and is intended solely for use by paid subscribers. Reproduction or distribution of the STR Trend Report, in whole or part, without written permission is prohibited and subject to legal action. If you have received this report and are NOT a subscriber to the STR Trend report, please contact us immediately. Source: 2018 STR, Inc. / STR Global, Ltd. trading as “STR”.
COPYRIGHTED

Tab 2 - Data by MeasureColumbia, PA - Raposa 213Job Number: 955519_SADIM Staff: CW Created: February 15, 2018
Occupancy (%)January February March April May June July August September October November December Total Year Dec YTD
2015 72.1 67.8 71.4 60.2 46.72016 40.6 45.9 60.4 67.9 63.5 71.9 78.7 77.4 71.6 75.5 63.1 49.8 63.9 63.92017 50.3 55.2 59.7 65.8 66.5 72.2 75.1 75.5 72.5 73.7 63.4 54.7 65.4 65.4Avg 45.4 50.6 60.0 66.8 65.0 72.1 76.9 75.0 70.6 73.5 62.2 50.4 64.7 64.7
ADR ($)January February March April May June July August September October November December Total Year Dec YTD
2015 133.95 123.60 127.93 120.64 110.492016 111.69 107.78 118.36 123.27 124.06 133.60 142.45 134.89 125.23 127.39 122.24 111.71 125.37 125.372017 113.35 114.55 120.68 121.60 127.00 133.03 139.47 133.05 126.39 128.07 119.15 110.16 124.95 124.95Avg 112.61 111.48 119.52 122.45 125.57 133.32 140.99 133.97 125.11 127.79 120.67 110.77 125.16 125.16
RevPAR ($)January February March April May June July August September October November December Total Year Dec YTD
2015 96.63 83.76 91.36 72.66 51.632016 45.32 49.48 71.47 83.72 78.83 96.07 112.17 104.41 89.61 96.14 77.08 55.61 80.17 80.172017 56.96 63.27 72.01 79.96 84.50 96.11 104.78 100.42 91.62 94.37 75.58 60.27 81.76 81.76Avg 51.14 56.38 71.74 81.84 81.66 96.09 108.47 100.49 88.33 93.96 75.10 55.84 80.97 80.97
SupplyJanuary February March April May June July August September October November December Total Year Dec YTD
2015 13,733 13,290 13,733 13,290 13,7332016 13,733 12,404 13,733 13,290 13,733 13,290 13,733 13,733 13,290 13,733 13,290 13,733 161,695 161,6952017 13,733 12,404 13,733 13,290 13,733 13,290 13,733 13,733 13,290 13,733 13,290 13,733 161,695 161,695Avg 13,733 12,404 13,733 13,290 13,733 13,290 13,733 13,733 13,290 13,733 13,290 13,733 161,695 161,695
DemandJanuary February March April May June July August September October November December Total Year Dec YTD
2015 9,907 9,007 9,807 8,004 6,4182016 5,572 5,695 8,292 9,026 8,726 9,556 10,814 10,630 9,510 10,364 8,380 6,836 103,401 103,4012017 6,901 6,851 8,194 8,739 9,137 9,602 10,317 10,365 9,634 10,119 8,430 7,514 105,803 105,803Avg 6,237 6,273 8,243 8,883 8,932 9,579 10,566 10,301 9,384 10,097 8,271 6,923 104,602 104,602
Revenue ($)January February March April May June July August September October November December Total Year Dec YTD
2015 1,327,088 1,113,230 1,254,600 965,597 709,0962016 622,361 613,793 981,481 1,112,667 1,082,535 1,276,726 1,540,402 1,433,840 1,190,978 1,320,303 1,024,352 763,664 12,963,102 12,963,1022017 782,196 784,780 988,864 1,062,694 1,160,441 1,277,360 1,438,941 1,379,072 1,217,672 1,295,989 1,004,463 827,708 13,220,180 13,220,180Avg 702,279 699,287 985,173 1,087,681 1,121,488 1,277,043 1,489,672 1,380,000 1,173,960 1,290,297 998,137 766,823 13,091,641 13,091,641
The STR Trend Report is a publication of STR, Inc. and STR Global, Ltd., and is intended solely for use by paid subscribers. Reproduction or distribution of the STR Trend Report, in whole or part, without written permission is prohibited and subject to legal action. If you have received this report and are NOT a subscriber to the STR Trend report, please contact us immediately. Source: 2018 STR, Inc. / STR Global, Ltd. trading as “STR”.
COPYRIGHTED

Tab 3 - Percent Change from Previous Year - Detail by MeasureColumbia, PA - Raposa 213Job Number: 955519_SADIM Staff: CW Created: February 15, 2018
OccupancyJanuary February March April May June July August September October November December Total Year Dec YTD
2016 7.3 5.6 5.7 4.7 6.52017 23.9 20.3 -1.2 -3.2 4.7 0.5 -4.6 -2.5 1.3 -2.4 0.6 9.9 2.3 2.3Avg 23.9 20.3 -1.2 -3.2 4.7 0.5 -4.6 2.4 3.4 1.7 2.6 8.2 2.3 2.3
ADRJanuary February March April May June July August September October November December Total Year Dec YTD
2016 0.7 1.3 -0.4 1.3 1.12017 1.5 6.3 2.0 -1.4 2.4 -0.4 -2.1 -1.4 0.9 0.5 -2.5 -1.4 -0.3 -0.3Avg 1.5 6.3 2.0 -1.4 2.4 -0.4 -2.1 -0.3 1.1 0.1 -0.6 -0.1 -0.3 -0.3
RevPARJanuary February March April May June July August September October November December Total Year Dec YTD
2016 8.0 7.0 5.2 6.1 7.72017 25.7 27.9 0.8 -4.5 7.2 0.0 -6.6 -3.8 2.2 -1.8 -1.9 8.4 2.0 2.0Avg 25.7 27.9 0.8 -4.5 7.2 0.0 -6.6 2.1 4.6 1.7 2.1 8.0 2.0 2.0
SupplyJanuary February March April May June July August September October November December Total Year Dec YTD
2016 0.0 0.0 0.0 0.0 0.02017 0.0 0.0 0.0 0.0 0.0 0.0 0.0 0.0 0.0 0.0 0.0 0.0 0.0 0.0Avg 0.0 0.0 0.0 0.0 0.0 0.0 0.0 0.0 0.0 0.0 0.0 0.0 0.0 0.0
DemandJanuary February March April May June July August September October November December Total Year Dec YTD
2016 7.3 5.6 5.7 4.7 6.52017 23.9 20.3 -1.2 -3.2 4.7 0.5 -4.6 -2.5 1.3 -2.4 0.6 9.9 2.3 2.3Avg 23.9 20.3 -1.2 -3.2 4.7 0.5 -4.6 2.4 3.4 1.7 2.6 8.2 2.3 2.3
RevenueJanuary February March April May June July August September October November December Total Year Dec YTD
2016 8.0 7.0 5.2 6.1 7.72017 25.7 27.9 0.8 -4.5 7.2 0.0 -6.6 -3.8 2.2 -1.8 -1.9 8.4 2.0 2.0Avg 25.7 27.9 0.8 -4.5 7.2 0.0 -6.6 2.1 4.6 1.7 2.1 8.0 2.0 2.0
The STR Trend Report is a publication of STR, Inc. and STR Global, Ltd., and is intended solely for use by paid subscribers. Reproduction or distribution of the STR Trend Report, in whole or part, without written permission is prohibited and subject to legal action. If you have received this report and are NOT a subscriber to the STR Trend report, please contact us immediately. Source: 2018 STR, Inc. / STR Global, Ltd. trading as “STR”.
COPYRIGHTED

Tab 4 - Percent Change from Previous Year - Detail by YearColumbia, PA - Raposa 213Job Number: 955519_SADIM Staff: CW Created: February 15, 2018
Jan 16 Feb 16 Mar 16 Apr 16 May 16 Jun 16 Jul 16 Aug 16 Sep 16 Oct 16 Nov 16 Dec 16 Total Year Dec YTDOcc 7.3 5.6 5.7 4.7 6.5ADR 0.7 1.3 -0.4 1.3 1.1
RevPAR 8.0 7.0 5.2 6.1 7.7Supply 0.0 0.0 0.0 0.0 0.0
Demand 7.3 5.6 5.7 4.7 6.5Revenue 8.0 7.0 5.2 6.1 7.7
Jan 17 Feb 17 Mar 17 Apr 17 May 17 Jun 17 Jul 17 Aug 17 Sep 17 Oct 17 Nov 17 Dec 17 Total Year Dec YTDOcc 23.9 20.3 -1.2 -3.2 4.7 0.5 -4.6 -2.5 1.3 -2.4 0.6 9.9 2.3 2.3ADR 1.5 6.3 2.0 -1.4 2.4 -0.4 -2.1 -1.4 0.9 0.5 -2.5 -1.4 -0.3 -0.3
RevPAR 25.7 27.9 0.8 -4.5 7.2 0.0 -6.6 -3.8 2.2 -1.8 -1.9 8.4 2.0 2.0Supply 0.0 0.0 0.0 0.0 0.0 0.0 0.0 0.0 0.0 0.0 0.0 0.0 0.0 0.0
Demand 23.9 20.3 -1.2 -3.2 4.7 0.5 -4.6 -2.5 1.3 -2.4 0.6 9.9 2.3 2.3Revenue 25.7 27.9 0.8 -4.5 7.2 0.0 -6.6 -3.8 2.2 -1.8 -1.9 8.4 2.0 2.0
The STR Trend Report is a publication of STR, Inc. and STR Global, Ltd., and is intended solely for use by paid subscribers. Reproduction or distribution of the STR Trend Report, in whole or part, without written permission is prohibited and subject to legal action. If you have received this report and are NOT a subscriber to the STR Trend report, please contact us immediately. Source: 2018 STR, Inc. / STR Global, Ltd. trading as “STR”.
COPYRIGHTED

Tab 5 - Twelve Month Moving AverageColumbia, PA - Raposa 213Job Number: 955519_SADIM Staff: CW Created: February 15, 2018
Occupancy (%)January February March April May June July August September October November December
2016 62.8 63.1 63.5 63.7 63.92017 64.8 65.5 65.4 65.2 65.5 65.5 65.2 65.1 65.1 65.0 65.0 65.4
ADR ($)January February March April May June July August September October November December
2016 125.13 125.27 125.23 125.35 125.372017 125.30 125.55 125.74 125.60 125.85 125.80 125.43 125.23 125.34 125.40 125.15 124.95
RevPAR ($)January February March April May June July August September October November December
2016 78.58 79.06 79.47 79.83 80.172017 81.16 82.22 82.26 81.95 82.43 82.44 81.81 81.47 81.64 81.49 81.36 81.76
SupplyJanuary February March April May June July August September October November December
2016 161,695 161,695 161,695 161,695 161,6952017 161,695 161,695 161,695 161,695 161,695 161,695 161,695 161,695 161,695 161,695 161,695 161,695
DemandJanuary February March April May June July August September October November December
2016 101,547 102,050 102,607 102,983 103,4012017 104,730 105,886 105,788 105,501 105,912 105,958 105,461 105,196 105,320 105,075 105,125 105,803
Revenue ($)January February March April May June July August September October November December
2016 12,706,328 12,784,076 12,849,779 12,908,534 12,963,1022017 13,122,937 13,293,924 13,301,307 13,251,334 13,329,240 13,329,874 13,228,413 13,173,645 13,200,339 13,176,025 13,156,136 13,220,180
High value is boxed. Low value is boxed and italicized.
The STR Trend Report is a publication of STR, Inc. and STR Global, Ltd., and is intended solely for use by paid subscribers. Reproduction or distribution of the STR Trend Report, in whole or part, without written permission is prohibited and subject to legal action. If you have received this report and are NOT a subscriber to the STR Trend report, please contact us immediately. Source: 2018 STR, Inc. / STR Global, Ltd. trading as “STR”.
COPYRIGHTED

Tab 6 - Twelve Month Moving Average with Percent ChangeColumbia, PA - Raposa 213Job Number: 955519_SADIM Staff: CW Created: February 15, 2018
Date Occupancy ADR RevPar Supply Demand Revenue
This Year % Chg This Year % Chg This Year % Chg This Year % Chg This Year % Chg This Year % ChgAug 16 62.8 125.13 78.58 161,695 101,547 12,706,328Sep 16 63.1 125.27 79.06 161,695 102,050 12,784,076Oct 16 63.5 125.23 79.47 161,695 102,607 12,849,779Nov 16 63.7 125.35 79.83 161,695 102,983 12,908,534Dec 16 63.9 125.37 80.17 161,695 103,401 12,963,102Jan 17 64.8 125.30 81.16 161,695 104,730 13,122,937Feb 17 65.5 125.55 82.22 161,695 105,886 13,293,924Mar 17 65.4 125.74 82.26 161,695 105,788 13,301,307Apr 17 65.2 125.60 81.95 161,695 105,501 13,251,334May 17 65.5 125.85 82.43 161,695 105,912 13,329,240Jun 17 65.5 125.80 82.44 161,695 105,958 13,329,874Jul 17 65.2 4.6 125.43 0.4 81.81 5.0 161,695 0.0 105,461 4.6 13,228,413 5.0
Aug 17 65.1 3.6 125.23 0.1 81.47 3.7 161,695 0.0 105,196 3.6 13,173,645 3.7Sep 17 65.1 3.2 125.34 0.1 81.64 3.3 161,695 0.0 105,320 3.2 13,200,339 3.3Oct 17 65.0 2.4 125.40 0.1 81.49 2.5 161,695 0.0 105,075 2.4 13,176,025 2.5Nov 17 65.0 2.1 125.15 -0.2 81.36 1.9 161,695 0.0 105,125 2.1 13,156,136 1.9Dec 17 65.4 2.3 124.95 -0.3 81.76 2.0 161,695 0.0 105,803 2.3 13,220,180 2.0
The STR Trend Report is a publication of STR, Inc. and STR Global, Ltd., and is intended solely for use by paid subscribers. Reproduction or distribution of the STR Trend Report, in whole or part, without written permission is prohibited and subject to legal action. If you have received this report and are NOT a subscriber to the STR Trend report, please contact us immediately. Source: 2018 STR, Inc. / STR Global, Ltd. trading as “STR”.
COPYRIGHTED

Tab 7 - Day of Week AnalysisColumbia, PA - Raposa 213Job Number: 955519_SADIM Staff: CW Created: February 15, 2018 Table 1
Occupancy (%) Three Year Occupancy (%)Sun Mon Tue Wed Thu Fri Sat Total Month Sun Mon Tue Wed Thu Fri Sat Total Year
Jan - 17 32.2 43.2 51.4 52.8 48.1 61.1 69.1 50.3 Jan 15 - Dec 15 34.8 53.1 66.8 64.5 63.1 72.5 79.2 62.0Feb - 17 32.6 46.5 55.5 53.0 55.8 69.4 73.8 55.2 Jan 16 - Dec 16 35.9 54.9 68.6 66.2 64.9 75.8 80.8 63.9Mar - 17 27.9 48.3 57.4 56.7 60.0 76.3 87.6 59.7 Jan 17 - Dec 17 39.0 55.5 67.0 67.2 67.8 79.4 82.6 65.4Apr - 17 31.6 56.8 70.5 70.4 70.1 87.3 78.9 65.8 Total 3 Yr 37.6 55.3 67.6 66.3 66.1 77.0 81.7 64.5May - 17 42.3 51.4 67.7 67.2 62.6 83.4 94.5 66.5 Change from 2015 to 2016 1.1 1.8 1.8 1.7 1.8 3.3 1.6 1.9 Jun - 17 42.8 65.2 75.1 77.6 73.6 77.4 92.4 72.2 Percentage 3% 3% 3% 3% 3% 5% 2% 3%Jul - 17 52.2 66.9 75.5 83.4 81.0 88.3 84.2 75.1 Change from 2016 to 2017 3.1 0.6 (1.6) 1.0 2.9 3.6 1.8 1.5 Aug - 17 53.5 74.2 80.2 74.6 76.2 83.3 85.2 75.5 Percentage 9% 1% -2% 1% 4% 5% 2% 2%Sep - 17 50.5 62.4 73.9 72.2 73.2 81.2 88.0 72.5Oct - 17 46.2 59.4 74.2 84.2 81.2 87.4 93.6 73.7Nov - 17 27.2 47.5 64.2 61.1 71.7 89.4 81.3 63.4Dec - 17 29.9 44.8 57.3 55.5 57.3 71.6 65.9 54.7
Total Year 39.0 55.5 67.0 67.2 67.8 79.4 82.6 65.4
Table 2ADR Three Year ADR
Sun Mon Tue Wed Thu Fri Sat Total Month Sun Mon Tue Wed Thu Fri Sat Total YearJan - 17 116.80 107.66 108.46 108.19 106.72 119.15 123.73 113.35 Jan 15 - Dec 15 $116.99 $116.36 $118.17 $118.88 $118.87 $136.12 $137.49 $124.46Feb - 17 106.90 108.09 108.59 104.15 108.57 125.27 128.40 114.55 Jan 16 - Dec 16 $116.70 $116.86 $118.60 $119.39 $117.25 $137.19 $140.54 $125.37Mar - 17 108.84 108.04 110.14 111.41 113.48 132.18 139.49 120.68 Jan 17 - Dec 17 $116.33 $115.39 $117.17 $117.60 $117.12 $137.52 $142.16 $124.95Apr - 17 106.44 111.45 114.10 111.75 110.25 136.90 140.45 121.60 Total 3 Yr $116.59 $116.16 $117.94 $118.56 $117.47 $137.16 $140.68 $125.04May - 17 120.66 112.65 112.50 112.13 112.21 148.27 156.85 127.00 Change from 2015 to 2016 -$0.29 $0.50 $0.44 $0.51 -$1.62 $1.07 $3.04 $0.91Jun - 17 119.11 120.66 125.08 125.87 122.01 146.94 157.06 133.03 Percentage -0.2% 0.4% 0.4% 0.4% -1.4% 0.8% 2.2% 0.7%Jul - 17 131.38 132.19 134.33 134.19 133.00 151.67 152.88 139.47 Change from 2016 to 2017 -$0.36 -$1.47 -$1.43 -$1.79 -$0.14 $0.32 $1.62 -$0.42Aug - 17 121.40 125.87 129.31 128.15 127.78 148.51 147.17 133.05 Percentage -0.3% -1.3% -1.2% -1.5% -0.1% 0.2% 1.2% -0.3%Sep - 17 119.84 113.62 116.41 118.06 116.51 137.97 144.70 126.39Oct - 17 114.53 114.32 118.54 124.65 122.58 144.64 149.19 128.07Nov - 17 110.50 106.07 109.68 111.10 112.21 134.19 135.84 119.15Dec - 17 100.78 106.88 105.99 106.46 105.38 117.27 117.17 110.16
Total Year 116.33 115.39 117.17 117.60 117.12 137.52 142.16 124.95
Table 3RevPAR Three Year RevPAR
Sun Mon Tue Wed Thu Fri Sat Total Month Sun Mon Tue Wed Thu Fri Sat Total YearJan - 17 37.65 46.46 55.73 57.09 51.31 72.75 85.47 56.96 Jan 15 - Dec 15 $40.71 $61.79 $78.88 $76.73 $75.01 $98.69 $108.89 $79.22Feb - 17 34.87 50.26 60.24 55.25 60.60 86.96 94.71 63.27 Jan 16 - Dec 16 $41.87 $64.11 $81.33 $79.06 $76.10 $104.06 $113.55 $80.17Mar - 17 30.40 52.13 63.21 63.23 68.09 100.79 122.17 72.01 Jan 17 - Dec 17 $45.39 $64.05 $78.52 $79.04 $79.37 $109.23 $117.42 $81.76Apr - 17 33.64 63.27 80.49 78.64 77.28 119.52 110.78 79.96 Total 3 Yr $43.87 $64.29 $79.74 $78.64 $77.63 $105.62 $114.87 $80.66May - 17 51.07 57.88 76.13 75.38 70.23 123.59 148.26 84.50 Change from 2015 to 2016 $1.16 $2.33 $2.45 $2.33 $1.09 $5.37 $4.66 $0.95Jun - 17 50.95 78.72 93.88 97.67 89.79 113.77 145.19 96.11 Percentage 2.9% 3.8% 3.1% 3.0% 1.4% 5.4% 4.3% 1.2%Jul - 17 68.57 88.38 101.36 111.93 107.71 133.87 128.79 104.78 Change from 2016 to 2017 $3.52 -$0.06 -$2.81 -$0.02 $3.28 $5.17 $3.87 $1.59Aug - 17 64.95 93.41 103.68 95.58 97.38 123.70 125.41 100.42 Percentage 8.4% -0.1% -3.5% 0.0% 4.3% 5.0% 3.4% 2.0%Sep - 17 60.53 70.85 85.99 85.21 85.28 112.06 127.39 91.62Oct - 17 52.89 67.92 87.98 104.96 99.48 126.36 139.59 94.37Nov - 17 30.06 50.40 70.44 67.92 80.45 120.03 110.46 75.58Dec - 17 30.12 47.83 60.71 59.12 60.36 83.91 77.23 60.27
Total Year 45.39 64.05 78.52 79.04 79.37 109.23 117.42 81.76
The STR Trend Report is a publication of STR, Inc. and STR Global, Ltd., and is intended solely for use by paid subscribers. Reproduction or distribution of the STR Trend Report, in whole or part, without written permission is prohibited and subject to legal action. If you have received this report and are NOT a subscriber to the STR Trend report, please contact us immediately. Source: 2018 STR, Inc. / STR Global, Ltd. trading as “STR”.
COPYRIGHTED

Tab 8 - Raw DataColumbia, PA - Raposa 213Job Number: 955519_SADIM Staff: CW Created: February 15, 2018
Date Occupancy ADR RevPar Supply Demand Revenue Census & Sample %This Year % Chg
This Year % Chg
This Year % Chg This Year % Chg This Year % Chg This Year % Chg Census Props Census Rooms
% Rooms STAR Participants
Aug 15 72.1 133.95 96.63 13,733 9,907 1,327,088 5 443 100.0Sep 15 67.8 123.60 83.76 13,290 9,007 1,113,230 5 443 100.0Oct 15 71.4 127.93 91.36 13,733 9,807 1,254,600 5 443 100.0Nov 15 60.2 120.64 72.66 13,290 8,004 965,597 5 443 100.0Dec 15 46.7 110.49 51.63 13,733 6,418 709,096 5 443 100.0Jan 16 40.6 111.69 45.32 13,733 5,572 622,361 5 443 100.0Feb 16 45.9 107.78 49.48 12,404 5,695 613,793 5 443 100.0Mar 16 60.4 118.36 71.47 13,733 8,292 981,481 5 443 100.0Apr 16 67.9 123.27 83.72 13,290 9,026 1,112,667 5 443 100.0May 16 63.5 124.06 78.83 13,733 8,726 1,082,535 5 443 100.0Jun 16 71.9 133.60 96.07 13,290 9,556 1,276,726 5 443 100.0Jul 16 78.7 142.45 112.17 13,733 10,814 1,540,402 5 443 100.0
Aug 16 77.4 7.3 134.89 0.7 104.41 8.0 13,733 0.0 10,630 7.3 1,433,840 8.0 5 443 100.0Sep 16 71.6 5.6 125.23 1.3 89.61 7.0 13,290 0.0 9,510 5.6 1,190,978 7.0 5 443 100.0Oct 16 75.5 5.7 127.39 -0.4 96.14 5.2 13,733 0.0 10,364 5.7 1,320,303 5.2 5 443 100.0Nov 16 63.1 4.7 122.24 1.3 77.08 6.1 13,290 0.0 8,380 4.7 1,024,352 6.1 5 443 100.0Dec 16 49.8 6.5 111.71 1.1 55.61 7.7 13,733 0.0 6,836 6.5 763,664 7.7 5 443 100.0Jan 17 50.3 23.9 113.35 1.5 56.96 25.7 13,733 0.0 6,901 23.9 782,196 25.7 5 443 100.0Feb 17 55.2 20.3 114.55 6.3 63.27 27.9 12,404 0.0 6,851 20.3 784,780 27.9 5 443 100.0Mar 17 59.7 -1.2 120.68 2.0 72.01 0.8 13,733 0.0 8,194 -1.2 988,864 0.8 5 443 100.0Apr 17 65.8 -3.2 121.60 -1.4 79.96 -4.5 13,290 0.0 8,739 -3.2 1,062,694 -4.5 5 443 100.0May 17 66.5 4.7 127.00 2.4 84.50 7.2 13,733 0.0 9,137 4.7 1,160,441 7.2 5 443 100.0Jun 17 72.2 0.5 133.03 -0.4 96.11 0.0 13,290 0.0 9,602 0.5 1,277,360 0.0 5 443 100.0Jul 17 75.1 -4.6 139.47 -2.1 104.78 -6.6 13,733 0.0 10,317 -4.6 1,438,941 -6.6 5 443 100.0
Aug 17 75.5 -2.5 133.05 -1.4 100.42 -3.8 13,733 0.0 10,365 -2.5 1,379,072 -3.8 5 443 100.0Sep 17 72.5 1.3 126.39 0.9 91.62 2.2 13,290 0.0 9,634 1.3 1,217,672 2.2 5 443 100.0Oct 17 73.7 -2.4 128.07 0.5 94.37 -1.8 13,733 0.0 10,119 -2.4 1,295,989 -1.8 5 443 100.0Nov 17 63.4 0.6 119.15 -2.5 75.58 -1.9 13,290 0.0 8,430 0.6 1,004,463 -1.9 5 443 100.0Dec 17 54.7 9.9 110.16 -1.4 60.27 8.4 13,733 0.0 7,514 9.9 827,708 8.4 5 443 100.0
The STR Trend Report is a publication of STR, Inc. and STR Global, Ltd., and is intended solely for use by paid subscribers. Reproduction or distribution of the STR Trend Report, in whole or part, without written permission is prohibited and subject to legal action. If you have received this report and are NOT a subscriber to the STR Trend report, please contact us immediately. Source: 2018 STR, Inc. / STR Global, Ltd. trading as “STR”.
COPYRIGHTED

Tab 9 - ClassicColumbia, PA - Raposa 213Job Number: 955519_SADIM Staff: CW Created: February 15, 2018
Date Occupancy ADR RevPar Supply Demand Revenue Census & Sample %
This Year % Chg This Year % Chg This Year % Chg This Year % Chg This Year % Chg This Year % Chg Census Props Census Rooms% Rooms STAR
ParticipantsAug 15 72.1 133.95 96.63 13,733 9,907 1,327,088 5 443 100.0Sep 15 67.8 123.60 83.76 13,290 9,007 1,113,230 5 443 100.0Oct 15 71.4 127.93 91.36 13,733 9,807 1,254,600 5 443 100.0Nov 15 60.2 120.64 72.66 13,290 8,004 965,597 5 443 100.0Dec 15 46.7 110.49 51.63 13,733 6,418 709,096 5 443 100.0
Dec YTD 2015Total 2015
Jan 16 40.6 111.69 45.32 13,733 5,572 622,361 5 443 100.0Feb 16 45.9 107.78 49.48 12,404 5,695 613,793 5 443 100.0Mar 16 60.4 118.36 71.47 13,733 8,292 981,481 5 443 100.0Apr 16 67.9 123.27 83.72 13,290 9,026 1,112,667 5 443 100.0May 16 63.5 124.06 78.83 13,733 8,726 1,082,535 5 443 100.0Jun 16 71.9 133.60 96.07 13,290 9,556 1,276,726 5 443 100.0Jul 16 78.7 142.45 112.17 13,733 10,814 1,540,402 5 443 100.0
Aug 16 77.4 7.3 134.89 0.7 104.41 8.0 13,733 0.0 10,630 7.3 1,433,840 8.0 5 443 100.0Sep 16 71.6 5.6 125.23 1.3 89.61 7.0 13,290 0.0 9,510 5.6 1,190,978 7.0 5 443 100.0Oct 16 75.5 5.7 127.39 -0.4 96.14 5.2 13,733 0.0 10,364 5.7 1,320,303 5.2 5 443 100.0Nov 16 63.1 4.7 122.24 1.3 77.08 6.1 13,290 0.0 8,380 4.7 1,024,352 6.1 5 443 100.0Dec 16 49.8 6.5 111.71 1.1 55.61 7.7 13,733 0.0 6,836 6.5 763,664 7.7 5 443 100.0
Dec YTD 2016 63.9 125.37 80.17 161,695 103,401 12,963,102Total 2016 63.9 125.37 80.17 161,695 103,401 12,963,102
Jan 17 50.3 23.9 113.35 1.5 56.96 25.7 13,733 0.0 6,901 23.9 782,196 25.7 5 443 100.0Feb 17 55.2 20.3 114.55 6.3 63.27 27.9 12,404 0.0 6,851 20.3 784,780 27.9 5 443 100.0Mar 17 59.7 -1.2 120.68 2.0 72.01 0.8 13,733 0.0 8,194 -1.2 988,864 0.8 5 443 100.0Apr 17 65.8 -3.2 121.60 -1.4 79.96 -4.5 13,290 0.0 8,739 -3.2 1,062,694 -4.5 5 443 100.0May 17 66.5 4.7 127.00 2.4 84.50 7.2 13,733 0.0 9,137 4.7 1,160,441 7.2 5 443 100.0Jun 17 72.2 0.5 133.03 -0.4 96.11 0.0 13,290 0.0 9,602 0.5 1,277,360 0.0 5 443 100.0Jul 17 75.1 -4.6 139.47 -2.1 104.78 -6.6 13,733 0.0 10,317 -4.6 1,438,941 -6.6 5 443 100.0
Aug 17 75.5 -2.5 133.05 -1.4 100.42 -3.8 13,733 0.0 10,365 -2.5 1,379,072 -3.8 5 443 100.0Sep 17 72.5 1.3 126.39 0.9 91.62 2.2 13,290 0.0 9,634 1.3 1,217,672 2.2 5 443 100.0Oct 17 73.7 -2.4 128.07 0.5 94.37 -1.8 13,733 0.0 10,119 -2.4 1,295,989 -1.8 5 443 100.0Nov 17 63.4 0.6 119.15 -2.5 75.58 -1.9 13,290 0.0 8,430 0.6 1,004,463 -1.9 5 443 100.0Dec 17 54.7 9.9 110.16 -1.4 60.27 8.4 13,733 0.0 7,514 9.9 827,708 8.4 5 443 100.0
Dec YTD 2017 65.4 2.3 124.95 -0.3 81.76 2.0 161,695 0.0 105,803 2.3 13,220,180 2.0Total 2017 65.4 2.3 124.95 -0.3 81.76 2.0 161,695 0.0 105,803 2.3 13,220,180 2.0
The STR Trend Report is a publication of STR, Inc. and STR Global, Ltd., and is intended solely for use by paid subscribers. Reproduction or distribution of the STR Trend Report, in whole or part, without written permission is prohibited and subject to legal action. If you have received this report and are NOT a subscriber to the STR Trend report, please contact us immediately. Source: 2018 STR, Inc. / STR Global, Ltd. trading as “STR”.
COPYRIGHTED

Tab 10 - Response ReportColumbia, PA - Raposa 213Job Number: 955519_SADIM Staff: CW Created: February 15, 2018
STR Code Name of Establishment City & State Zip Code Class Aff DateOpen Date Rooms
Chg in Rms J F M A M J J A S O N D J F M A M J J A S O N D J F M A M J J A S O N D
55024 Comfort Inn Lancaster County Columbia, PA 17512 Upper Midscale Class Sep 2006 Sep 2006 60 ● ● ● ● ● ● ● ● ● ● ● ● ● ● ● ● ● ● ● ● ● ● ● ● ● ● ● ● ● ● ● ● ● ● ● ●54001 Holiday Inn Express & Suites Lancaster Lititz Lititz, PA 17543 Upper Midscale Class Dec 2005 Dec 2005 90 ● ● ● ● ● ● ● ● ● ● ● ● ● ● ● ● ● ● ● ● ● ● ● ● ● ● ● ● ● ● ● ● ● ● ● ●64016 Hampton Inn & Suites Mount Joy Lancaster West Manheim, PA 17545 Upper Midscale Class Aug 2015 Aug 2015 85 Y ● ● ● ● ● ● ● ● ● ● ● ● ● ● ● ● ● ● ● ● ● ● ● ● ● ● ● ● ●34619 Fairfield Inn & Suites Lancaster Lancaster, PA 17601 Upper Midscale Class May 1997 May 1997 130 ● ● ● ● ● ● ● ● ● ● ● ● ● ● ● ● ● ● ● ● ● ● ● ● ● ● ● ● ● ● ● ● ● ● ● ●42443 Country Inn & Suites Lancaster Lancaster, PA 17602 Upper Midscale Class Sep 2001 Sep 2001 78 ● ● ● ● ● ● ● ● ● ● ● ● ● ● ● ● ● ● ● ● ● ● ● ● ● ● ● ● ● ● ● ● ● ● ● ●
Total Properties: 5 443 ○ - Monthly data received by STR● - Monthly and daily data received by STRBlank - No data received by STRY - (Chg in Rms) Property has experienced a room addition or drop during the time period of the report.
201720162015
The STR Trend Report is a publication of STR, Inc. and STR Global, Ltd., and is intended solely for use by paid subscribers. Reproduction or distribution of the STR Trend Report, in whole or part, without written permission is prohibited and subject to legal action. If you have received this report and are NOT a subscriber to the STR Trend report, please contact us immediately. Source: 2018 STR, Inc. / STR Global, Ltd. trading as “STR”.
COPYRIGHTED

Tab 11 - Terms and ConditionsBefore purchasing this product you agreed to the following terms and conditions.In consideration of the mutual promises contained herein and for other good and valuable consideration, the receipt and sufficiency of which are hereby acknowledged, STR, Inc. ("STR"), STR Global, Ltd. ("STRG"), and the licensee identified elsewhere in this Agreement ("Licensee") agree as follows:
1. LICENSE1.1 Definitions.(a) "Agreement" means these Standard Terms and Conditions and any additional terms specifically set out in writing in the document(s) (if any) to which these Standard Terms and Conditions are attached or in which they are incorporated by reference, and, if applicable, any additional terms specifically set out in writing in any Schedule attached hereto.(b) "Licensed Materials" means the newsletters, reports, databases or other information resources, and all lodging industry data contained therein, provided to Licensee hereunder.1.2 Grant of License. Subject to the terms and conditions of this Agreement, and except as may be expressly permitted elsewhere in this Agreement, STR hereby grants to Licensee a non-exclusive, non-transferable, indivisible, non-sublicensable license to use, copy, manipulate and extract data from the Licensed Materials for its own INTERNAL business purposes only.1.3 Copies. Except as expressly permitted elsewhere in this Agreement, Licensee may make and maintain no more than two (2) copies of any Licensed Materials.1.4 No Service Bureau Use. Licensee is prohibited from using the Licensed Materials in any way in connection with any service bureau or similar services. "Service bureau" means the processing of input data that is supplied by one or more third parties and the generation of output data (in the form of reports, charts, graphs or other pictorial representations, or the like) that is sold or licensed to any third parties.1.5 No Distribution to Third Parties. Except as expressly permitted in this Agreement, Licensee is prohibited from distributing, republishing or otherwise making the Licensed Materials or any part thereof (including any excerpts of the data and any manipulations of the data) available in any form whatsoever to any third party, other than Licensee's accountants, attorneys, marketing professionals or other professional advisors who are bound by a duty of confidentiality not to disclose such information.1.6 Security. Licensee shall use commercially reasonable efforts to protect against unauthorized access to the Licensed Materials.1.7 Reservation of Rights. Licensee has no rights in connection with the Licensed Materials other than those rights expressly enumerated herein. All rights to the Licensed Materials not expressly enumerated herein are reserved to STR.2. DISCLAIMERS AND LIMITATIONS OF LIABILITY2.1 Disclaimer of Warranties. The licensed materials are provided to the licensee on an "as is" and "as available" basis. STR makes no representations or warranties of any kind, express or implied, with respect to the licensed materials, the services provided or the results of use thereof. Without limiting the foregoing, STR does not warrant that the licensed materials, the services provided or the use thereof are or will be accurate, error-free or uninterrupted. STR makes no implied warranties, including without limitation, any implied warranty of merchantability, noninfringement or fitness for any particular purpose or arising by usage of trade, course of dealing, course of performance or otherwise.2.2 Disclaimers. STR shall have no liability with respect to its obligations under this agreement or otherwise for consequential, exemplary, special, incidental, or punitive damages even if STR has been advised of the possibility of such damages. Furthermore, STR shall have no liability whatsoever for any claim relating in any way to any decision made or action taken by licensee in reliance upon the licensed materials.2.3 Limitation of Liability. STR's total liability to licensee for any reason and upon any cause of action including without limitation, infringement, breach of contract, negligence, strict liability, misrepresentations, and other torts, shall be limited to all fees paid to STR by the licensee during the twelve month period preceding the date on which such cause of action first arose.3. MISCELLANEOUS
3.1 Liquidated Damages. In the event of a violation of Section 1.5 of these Standard Terms and Conditions, Licensee shall be required to pay STR an amount equal to the sum of (i) the highest aggregate price that STR, in accordance with its then-current published prices, could have charged the unauthorized recipients for the Licensed Materials that are the subject of the violation, and (ii) the full price of the lowest level of republishing rights that Licensee would have been required to purchase from STR in order to have the right to make the unauthorized distribution, regardless of whether Licensee has previously paid for any lower level of republishing rights, and (iii) fifteen percent (15%) of the total of the previous two items. This provision shall survive indefinitely the expiration or termination of this Agreement for any reason.3.2 Obligations on Termination. Within thirty (30) days of the termination or expiration of this Agreement for any reason, Licensee shall cease all use of the Licensed Materials and shall return or destroy, at STR's option, all copies of the Licensed Materials and all other information relating thereto in Licensee's possession or control as of the such date. This provision shall survive indefinitely the expiration or termination of this Agreement for any reason. 3.3 Governing Law; Jurisdiction and Venue. This Agreement shall be governed by the substantive laws of the State of Tennessee, without regard to its or any other jurisdiction's laws governing conflicts of law. Any claims or actions regarding or arising out of this Agreement shall be brought exclusively in a court of competent jurisdiction located in Nashville, Tennessee, and the parties expressly consent to personal jurisdiction thereof. The parties also expressly waive any objections to venue.3.4 Assignment. Licensee is prohibited from assigning this Agreement or delegating any of its duties under this Agreement without the prior written consent of STR.3.5 Independent Relationship. The relationship between the parties is that of an independent contractor. Nothing in this Agreement shall be deemed to create an employer/employee, principal/agent, partnership or joint venture relationship.3.6 Notices. All notices required or permitted to be given hereunder shall be in writing and shall be deemed given i) when delivered in person, at the time of such delivery; ii) when delivered by facsimile transmission or e-mail, at the time of transmission (provided, however, that notice delivered by facsimile transmission shall only be effective if such notice is also delivered by hand or deposited in the United States mail, postage prepaid, registered, certified or express mail or by courier service within two (2) business days after its delivery by facsimile transmission); iii) when delivered by a courier service or by express mail, at the time of receipt; or iv) five (5) business days after being deposited in the United States mail, postage prepaid, registered or certified mail, addressed (in any such case) to the addresses listed on the first page of this Agreement or to such other address as either party may notify the other in writing.3.7 Waiver. No waiver of any breach of this Agreement will be deemed to constitute a waiver of any subsequent breach of the same or any other provision.
3.8 Entire Agreement. This Agreement constitutes the entire agreement of the parties with respect to the matters described herein, superseding in all respects any and all prior proposals, negotiations, understandings and other agreements, oral or written, between the parties.3.9 Amendment. This Agreement may be amended only by the written agreement of both parties.3.10 Recovery of Litigation Costs. If any legal action or other proceeding is brought for the enforcement of this Agreement, or because of an alleged dispute, breach, default or misrepresentation in connection with any of the provisions of this Agreement, the successful or prevailing party or parties shall be entitled to recover reasonable attorneys' fees and other costs incurred in that action or proceeding, in addition to any other relief to which it or they may be entitled.3.11 Injunctive Relief. The parties agree that, in addition to any other rights or remedies which the other or STR may have, any party alleging breach or threatened breach of this Agreement will be entitled to such equitable and injunctive relief as may be available from any court of competent jurisdiction to restrain the other from breaching or threatening to breach any of the provisions of this Section, without posting bond or other surety.3.12 Notice of Unauthorized Access. Licensee shall notify STR immediately upon Licensee's becoming aware of any facts indicating that a third party may have obtained or may be about to obtain unauthorized access to the Licensed Materials, and shall fully cooperate with STR in its efforts to mitigate the damages caused by any such breach or potential breach.3.13 Conflicting Provisions. In the event that any provision of these Standard Terms and Conditions directly conflicts with any other provision of the Agreement, the conflicting terms of such other provision shall control.3.14 Remedies. In addition to any other rights or remedies that STR may have, in the event of any termination by STR on account of a breach by Licensee, STR may, without refund, immediately terminate and discontinue any right of Licensee to receive additional Licensed Materials from STR.
COPYRIGHTED

115 East King Street, Lancaster, PA 17602Phone: (717) 397-4046
Borrower: Date:Company:
Project Site:
The following document will outline the terms and conditions of an SBA 504 financing proposal that can be considered by EDC Finance Corporation. While local review by EDC Finance Corporation is the first step required in the approval sequence, the loan will not be officially approved until a DebentureAuthorization is received from the SBA. Any lending costs/fees required by other financing sources and any legal costs not associated with the SBA 504 loan are not included in this summary and will be additional out-of-pocket expenses to the project. This proposal does not represent a commitment to lend and changes to the structure are possible until a Debenture Authorization is received.
SBA 504 Project Costs Expected EDC Finance / SBA Approval ConditionsReal Estate Acquisition $0 1) Receiving the collateral position as outlined on the Funding Structure below;
Building Construction $4,100,000 (as by D. Murphy) 2) Receiving the personal guarantees of all 20%+ owners of Borrower and Company (required)Site Work $250,000 (as by D. Murphy) and any spousal or additional guarantors as deemed necessary for approval;Appraisal $5,000 (estimate) 3) Receiving the Company as a corporate guarantor or co-borrower;
Environmental Study $2,500 (estimate-Phase I) 4) Receiving an acceptable appraisal for the project real estate within SBA 504 approval limits;Architect/Engineering $25,000 (as by D. Murphy) 5) Receiving an acceptable environmental report for the project real estate;
Debt Refinancing $69,000 (as by D. Murphy) 6) Receiving an acceptable bank commitment letter with a minimum term of 10 years, no cross-Demolition $75,000 (as by D. Murphy) collateralization, cross-default, or deem-at-risk provisions, and no early call feature;
Title Insurance & Endorsements $18,500 (estimate-1st & bridge loan) 7) Project will be required to adhere to lease requirements outlined below;Signage $30,000 (as by D. Murphy) 8) Receiving bank approval of a bridge loan for the net SBA 504 loan amount until project completion;
Furniture/Fixtures/Equipment $175,000 (as by D. Murphy) 9) The SBA 504 fixed interest rate is only set about 45 days after SBA 504 loan closing and is based Construction / Interim Loan Interest $0 upon the 10 year Treasury rate plus a swap. The most recent annual full term rate is shown below.
Contingency $150,000 (% of construction costs) 10) A declining prepayment penalty exists during the first half of the loan term, starting at note rate;TOTAL PROJECT COSTS $4,900,000 11) An attorney good standing opinion letter is required at closing or additional closing costs may apply;
12) Key-man life insurance is required on a case by case basis, pending credit analysis.13) Additional standard terms and conditions are included on page 3 of this document.14) Project feasability study would be required for underwriting;
EDC Project Funding StructureSource Net Amount Gross Amt* Interest Rate Term Amortize Annual D/SBank (Rate & Term Estimated) $2,450,000 $2,450,000 5.00% 10 20 $194,027 1st lien project site real estate, FF&E (cannot have a 7a guarantee)EDC Finance/SBA 504 $1,470,000 $1,505,000 4.50% 20 20 $114,287 2nd lien project site real estate, FF&ECash/Equity* $980,000 $999,495 NA $0 $0 NA Totals $4,900,000 $4,954,495 $308,314
* Gross loan and cash/equity amounts are outlined on page 2 of the report
*Budgeted soft costs such as Franchise Fee ($40k), Property Management System ($19.25k), and Training/Inventory ($82k)
are not SBA 504 eligible and would need to be funded separately in addition to the equity shown above.
Company Representative Initials & Date
30%20%
Cimarron Investments, LLCCimarron Investments, LLC
Proposal / Term Sheet
11/17/2017
CollateralPercent
12 N. Second Street, Columbia, PA 17512
50%
COPYRIGHTED

SBA 504 Estimated Cost of Capital & Fee Summary
The below summary should be used as an estimate for closing costs, fees, and effective interest rates associated with a
typical SBA 504 debenture project. Clients should complete their own official cost of capital calculations.
SBA 504 Loan (Net) Equity Requirement (Net)Net Debenture Proceeds $1,470,000 Project Equity Requirement $980,000
Fees Funded by Debenture Out-of-Pocket Fees at ClosingProcessing Fee (1.5%) $22,050 First Mortgage Fee (0.5% of first mortgage amount) $12,250Funding Fee (0.25%) $3,675 SBA 504 Attorney Fee $2,500Underwriters Fee (0.4%) $6,020 Notary & Recording Fees (approximate) $500Closing Fees Funded (Optional) $3,255 Less: Closing Fees Funded ($3,255)SBA Guarantee Fee (0.0%) $0 Title Insurance (SBA 504 loan only) $7,500
Debenture Funded Fees $35,000 SBA 504 Out-of-Pocket Fees (estimated) $19,495
SBA 504 Loan (Gross) Equity Requirement (Gross)TOTAL LOAN AMOUNT $1,505,000 TOTAL EQUITY AMOUNT $999,495
20 Year Effective Approximate Effective Annual Rate (%)Annual Interest Rate (%) Including Debenture Fees & Closing Costs
Current Full-Term Annual Interest Rate 4.50% 4.95%
Explanation:A project funding a $1,470,000 net
Monthly Annual Note Rate1 Bond Fees2 Total Effective debenture will automatically includeYear Balance Payment Principal 2.837% 1.367% Interest Annual Rate $35,000 in bond fees as part of theEnd $1,505,000.00 (<- Initial Loan Amount) loan. The out of pocket fees must
1 $1,448,272.82 $9,939.24 $56,727.18 $41,970.40 $20,573.35 $62,543.75 4.228% be paid in cash at loan settlement 2 $1,389,914.91 $9,939.24 $58,357.91 $40,339.66 $20,573.35 $60,913.01 4.285% and cannot be wrapped into the 3 $1,329,879.39 $9,939.24 $60,035.52 $38,662.05 $20,573.35 $59,235.40 4.347% debenture amount. Besides 4 $1,268,118.03 $9,939.24 $61,761.36 $36,936.21 $20,573.35 $57,509.56 4.418% benefitting from a reduced5 $1,204,581.22 $9,939.24 $63,536.81 $35,160.76 $20,573.35 $55,734.11 4.498% equity requirement, the borrower6 $1,139,217.92 $9,597.02 $65,363.30 $33,334.27 $16,466.63 $49,800.90 4.239% will pay an interest rate structure 7 $1,071,975.62 $9,597.02 $67,242.29 $31,455.28 $16,466.63 $47,921.90 4.323% that is fixed for the full-term of the8 $1,002,800.32 $9,597.02 $69,175.31 $29,522.27 $16,466.63 $45,988.89 4.420% loan.9 $931,636.43 $9,597.02 $71,163.88 $27,533.69 $16,466.63 $44,000.32 4.534%10 $858,426.81 $9,597.02 $73,209.63 $25,487.95 $16,466.63 $41,954.57 4.671% The estimated all-in full-term11 $783,112.63 $9,202.69 $75,314.18 $23,383.39 $11,734.69 $35,118.09 4.261% annual rate for the debenture12 $705,633.39 $9,202.69 $77,479.23 $21,218.34 $11,734.69 $32,953.03 4.407% would be approximately 4.95%.13 $625,926.87 $9,202.69 $79,706.52 $18,991.05 $11,734.69 $30,725.74 4.591% The all-in rate attempts to include14 $543,929.02 $9,202.69 $81,997.84 $16,699.73 $11,734.69 $28,434.42 4.831% the note interest, fees funded by 15 $459,573.99 $9,202.69 $84,355.03 $14,342.54 $11,734.69 $26,077.24 5.159% the debenture, and all out of pocket16 $372,794.01 $8,748.33 $86,779.98 $11,917.59 $6,282.38 $18,199.97 4.333% fees and closing costs as paid until 17 $283,519.38 $8,748.33 $89,274.64 $9,422.93 $6,282.38 $15,705.31 4.729% maturity, in order to approximate18 $191,678.36 $8,748.33 $91,841.01 $6,856.56 $6,282.38 $13,138.94 5.437% the full-term total cost of capital.19 $97,197.20 $8,748.33 $94,481.16 $4,216.41 $6,282.38 $10,498.79 7.065%20 ($0.00) $8,748.33 $97,197.20 $1,500.37 $6,282.38 $7,782.75 14.719% Official cost of capital calculations
TOTAL $0.00 $1,505,000.00 $468,951.47 $275,285.23 $744,236.70 4.50% need to be made by each client.
NOTES: 1 Note rate represents the most recent SBA 504 debenture 2 Bond fees are a fixed % rate, but are only recalculated at the beginning of each 5-year payment period
Interest CalculationExample SBA 504 Payment Summary Based on Current Rate
=
COPYRIGHTED

www.edcfinancecorp.com
Borrower: Date:Company:
Below are additional terms and conditions associated with every SBA 504 loan approval:
Interest Rates SBA 504 loans are funded by an SBA guaranteed bond issue on the secondary market. The final interest rate for an SBA 504 loan cannotbe determined until about 45 days after all project costs have been incurred and the borrower signs the SBA 504 loan closing documents.SBA 504 interest rates are based on the market Treasury rate plus a swap to achieve the fixed interest rate for the full term of the loan.
Lease Terms As per SBA 504 owner-occupied requirements, if a real estate holding entity is formed to own the project real estate, the real estateentity must lease 100% of the project property to the operating company(ies) listed in this document. If the project involves an existingbuilding, the operating company(ies) may sub-lease up to 49% of the property to unrelated tenants. If the project involves new construction, the operating company(ies) may lease up to 20% of the property to unrelated tenants on a long term basis and 20% to unrelated tenants on a short term basis (< 10 years). The master lease between the borrower and operating company(ies) must havea term, with operating company renewal options equaling the term of the SBA 504 loan plus 1 year. The master lease payments mustnot exceed debt payments plus real estate expenses (taxes, insurance, maintenance, etc.) without prior SBA approval.
Real Estate Taxes In order to close an SBA 504 loan, all real estate taxes due on title insured collateral for the loan must be paid. If your municipalityhas already issued the tax invoice for the next year, those taxes are considered due and will be collected at loan closing if not previously paid.
Construction Docs EDC Finance is required to submit third party construction and renovation estimates to SBA as part of the official loan application. Theborrower should begin work promptly to obtain third party proposals in order to not slow the application sequence. Borrowers are highlyencouraged to work with a qualified general contractor if renovation costs are more than just minor cosmetic improvements.
Refinance Rules If the SBA 504 project costs include debt refinance, the borrower certifies by signing below that to the best of their knowledge 85% or more of the original loan proceeds were used to acquire or improve an asset that would originally have been SBA 504 eligible. Inaddition, the borrower certifies they have been current on existing loan payments for at least the prior 12 months.
Fee Collection EDC Finance does not charge an application fee, as we believe in only collecting applicable fees when a loan approval has been delivered.Upon loan approval by SBA, two-thirds of the 1.5% loan processing fee shown on page 2 is due from the borrower. EDC Finance will collectan initial payment toward the loan processing fee equal to 0.5% of the First Mortgage amount (also shown on page 2). At SBA 504 loan closing,EDC Finance will pay the First Mortgage Fee from the initial payment received and will collect the balance of the processing fee from the grossdebenture amount. The initial loan payment is due to EDC Finance within 30 days of SBA loan approval or at the primary bank closing, whicheveroccurs sooner. If the borrower choses not to close the SBA 504 loan, the balance of the loan processing fee due will be submitted toEDC Finance within 30 days of notification of closing cancellation.
PROJECT As a representative of the Borrower OR Operating Company, I acknowledge I have reviewed the above proposal along with the ACKNOWLEDGEMENT: accompanying fee schedule and terms and conditions and request underwriting to commence for the proposed project:
Representative Signature Date
Terms & Conditions
Cimarron Investments, LLC 11/17/2017
Cimarron Investments, LLC
COPYRIGHTED

Rolling on the RiverBy Lee Stabert on February 20, 2018
Columbia, Lancaster County, is a town nestled along the mighty Susquehanna
River. Walk through downtown towards the water and you’ll pass historic
brick buildings, vintage storefronts and Victorian homes. You’ll see thriving
antique markets, a brewpub, a world-renowned museum and a stately
market hall.
Once you reach the Susquehanna, look right to see the borough’s new crown jewel: The
Columbia Crossing River Trails Center. Spread out a picnic and watch kayakers drift by
from its massive shaded deck. Launch your boat from the adjacent park or rent a bike
from the on-site outfitter. Inside, check out a rotating slate of exhibits highlighting local
history and culture. When you’re done, take a stroll along the recently opened Northwest
Lancaster County River Trail, a 14-mile-long recreational path that stretches north past
Marietta to Falmouth.
SUBSCRIBE
Get our monthly editions
EXPLORE PA MADE IN PA HIGHER ED SCIENCE & TECH BEN FRANKLIN ON:
Arts & Culture Outdoors Food & Drink PA Towns Travel Reuse/Rebuild
COPYRIGHTED

Columbia’s Historic Market House / photo: Lee Stabert
So Columbia has the stunning natural setting. It has the recreational assets. It has a
passionate small-business community. It has access to the 10 million people that visit
Lancaster annually. And it has an energy building across the county, a buzz about beer,
restaurants, arts, entertainment and startups. Now the goal is for Columbia is to get a
piece of that pie — to draw people here to spend, to play, to eat, to live and to work. It’s a
big job, but one that a host of local residents and organizations are taking on.
Coming Attractions
Columbia Economic Development Corporation (CEDC) President Keith Lutz was born and
raised in Columbia. He owns the Kleen-Rite Corporation, a wholesale distributor of car
wash supplies. The company employs 85 people, many who live in town.
“Columbia is a beautiful town,” says Lutz. “It’s easy to get around by foot, so that
intrigues a lot of people. Over the last decade, I’d say that the antique and arts
community has become very vibrant. If that piques your interest, our town is a must-do
stop if you’re visiting central Pennsylvania.”
COPYRIGHTED
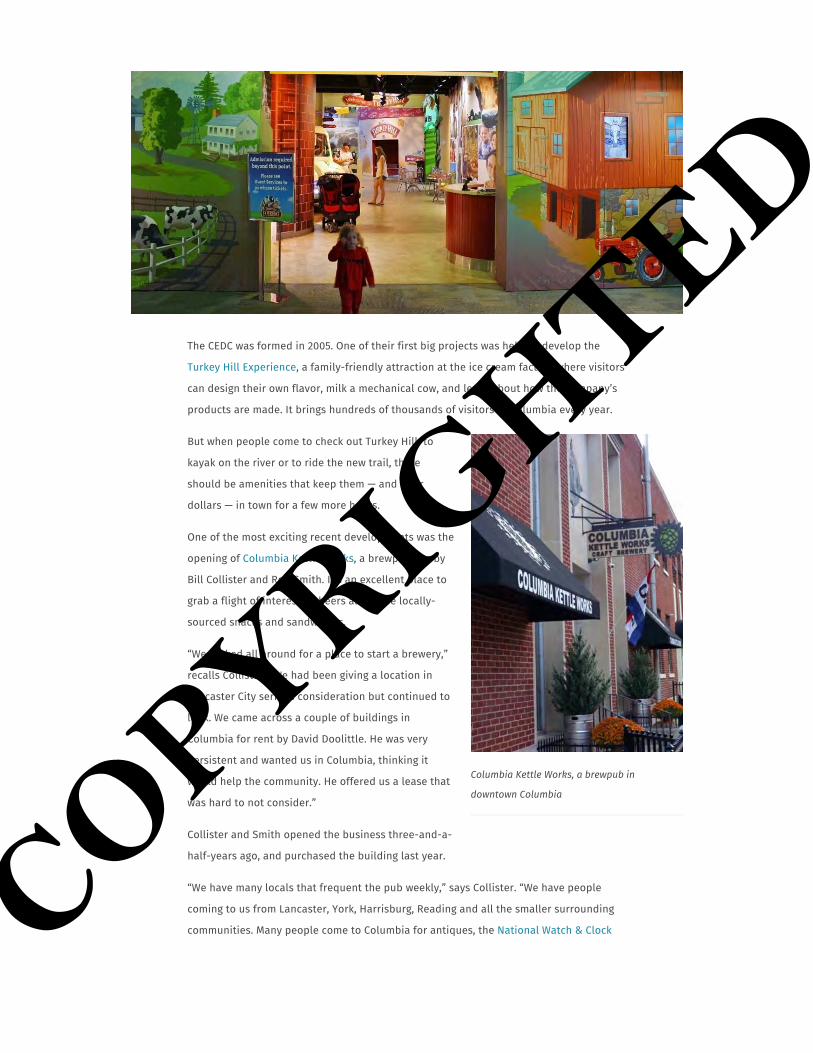
Columbia Kettle Works, a brewpub in
downtown Columbia
The CEDC was formed in 2005. One of their first big projects was helping develop the
Turkey Hill Experience, a family-friendly attraction at the ice cream factory where visitors
can design their own flavor, milk a mechanical cow, and learn about how the company’s
products are made. It brings hundreds of thousands of visitors to Columbia every year.
But when people come to check out Turkey Hill, to
kayak on the river or to ride the new trail, there
should be amenities that keep them — and their
dollars — in town for a few more hours.
One of the most exciting recent developments was the
opening of Columbia Kettle Works, a brewpub run by
Bill Collister and Rod Smith. It’s an excellent place to
grab a flight of interesting beers alongside locally-
sourced snacks and sandwiches.
“We looked all around for a place to start a brewery,”
recalls Collister. “We had been giving a location in
Lancaster City serious consideration but continued to
look. We came across a couple of buildings in
Columbia for rent by David Doolittle. He was very
persistent and wanted us in Columbia, thinking it
would help the community. He offered us a lease that
was hard to not consider.”
Collister and Smith opened the business three-and-a-
half-years ago, and purchased the building last year.
“We have many locals that frequent the pub weekly,” says Collister. “We have people
coming to us from Lancaster, York, Harrisburg, Reading and all the smaller surrounding
communities. Many people come to Columbia for antiques, the National Watch & Clock COPYRIGHTED

Columbia Kettle Works
The banks of the Susquehanna in Columbia
Museum, the river and the Turkey Hill Experience, and then end up at our place for
refreshments.”
Thanks to sterling Yelp reviews and a rabid online
community of beer enthusiasts, getting the word out
has been easier than expected.
“We rely on word of mouth and Facebook to contact
people about upcoming beer releases and events,” he
explains. “As far as finding us, when in the area or
prior to arriving, most people pull out a smart phone,
tablet or laptop, and search the area for places to eat
and things to do.”
The opening of the Northwest Lancaster County River Trail has already started paying
dividends for the brewpub.
“When [the trail] opened, we installed two bike racks out front,” says Collister. “Not long
after we added two more, plus we allow bikes to park inside. We also meet many hikers,
joggers and walkers.”
Columbia Kettle Works is planning to open a tasting room in downtown Lancaster City.
That increased visibility should help lure discerning drinkers to their flagship in
Columbia.COPYRIGHTED

“
The National Watch & Clock Museum in Downtown Columbia
Many people come to Columbia for antiques, the National Watch & Clock
Museum, the river and the Turkey Hill Experience, and then end up at our
place for refreshments.— Bill Collister, Columbia Kettle Works
Tourists can pass time in a brewpub, or they can ponder time at the National Watch &
Clock Museum. The institution opened to the public in 1977 with fewer than 1,000 items.
Currently, the collection features over 13,000 items — the largest horological library in
the world. The latest museum expansion occurred in 1999 and featured an entirely
redesigned exhibit space, as well as a two-story addition.
“We draw visitors from all over the world and expose them to the beauty and diversity of
not just Columbia, but of the entire region,” says Museum Director Noel Poirier.
The Museum has recently seen a dramatic increase in the number of families that visit—
they now make up almost a quarter of monthly visitors.
“There’s no question that the further development of the river trail, along with continued
development of the downtown area of Columbia will continue to draw visitors in greater COPYRIGHTED

Burning Bridge Antiques in Columbia
Burning Bridge Antiques in Columbia
numbers,” says Poirier. “I would love to see the further development of the downtown
area as a pedestrian-friendly shopping and dining destination.”
Shopping is already a strong suit — the town’s antique scene is a major lure. There are a
half-a-dozen markets, many housed in spaces as charming and historic as the items for
sale inside. One of the largest is Burning Bridge Antiques Market on Walnut Street. The
building, owned by the Herr family, was a coach factory in the late 1800s and then a
hardware store for 100 years before the current incarnation opened in 2005.
“On any given weekend, our large parking lot is a rainbow of license plates from all over,”
says manager Cindie Coleman.
Two hundred dealers rent space at Burning Bridge.
They sell everything from high-end jewelry to
industrial items, mid-century modern furniture and
architectural salvage. The business also supplies
props for movies and TV.
“We have a large customer base of regulars and repeat
customers that come from a vast geographical region
including Brooklyn, Texas, California and Canada,”
says Coleman. “We even have ‘regulars’ that come
from Japan, fill a box truck, and ship it back to Japan in
containers.”
“My wish list for Columbia is for everyone to continue to grow without losing the
historical importance of Columbia’s past,” she continues. “The existing businesses,
including all of the antique malls, are respectful of the historic buildings and factories COPYRIGHTED

Historic buildings in downtown Columbia
that they have converted…I would like to see more family-friendly businesses such as a
coffee shop and an ice cream shop. I would like to see boutiques and art-based
businesses. I would like to see more focus on rejuvenating Locust Street to create a more
walkable environment for our visitors.”
Columbia still has a wealth of stunning but underused spaces, and Lutz knows that there
is a lot of untapped potential in town. He also has a long wish list, including an upscale
restaurant and another brewpub.
“Additional brewpubs tend to do well together,” he says. “I think that would be a great
win. If we could develop some outdoor recreation businesses close to the river park or if
we could use the river park and trailhead to attract more businesses, that would be
wonderful. Once you do that, the possibility [grows] of some hospitality business — a
hotel or boutique hotel, maybe more B&Bs — opening to give people a place to stay.”
Happy Trails
When you talk to Columbia boosters, the 14-mile Northwest Lancaster County River Trail
is on everyone’s lips. After years of investment, the 10-foot-wide path runs from
Falmouth down to the Columbia Riverfront Park. People bike, walk, bring their dogs; it’s
ADA accessible. Local company Chiques Rock Outfitters sends riders out from Columbia COPYRIGHTED

The Northwest River Trail / photo: Susquehanna Heritage
River Park by bicycle. In Marietta (7.5 miles away), they trade two wheels for kayaks and
hit the river back to Columbia. There is conversation about connecting the trail to
existing networks that go as far as Washington, D.C.
It is the latest victory for a movement that goes back almost two decades — a complex,
impassioned effort to reconnect people to the river and its history.
Local economic development got a tremendous boost in 2001, when the ribbon of
landscapes and communities along both shores of the river in Lancaster and York
Counties was declared a Pennsylvania Heritage Area, a state designation bestowed by the
Pennsylvania Department of Conservation and Natural Resources (DCNR). The program
was launched in the late 1980s, with a focus on areas of the state with declining
industries (including the Lackawanna Valley, where the coal industry was receding, and
Pittsburgh, where steel was withering). With the designation comes a wealth of technical
support and funding opportunities.
The original title was the “Lancaster/York Heritage Region,” but the organization soon
realized that with a narrower focus, they could have a larger impact. They rebranded as
Susquehanna Heritage and began investing in land preservation, tourism, and wayfinding
tools such as maps, websites and informational signage.COPYRIGHTED

“
Columbia Crossing River Trails Center / photo: Susquehanna Heritage
The one place we could focus on that nobody really owns is the river. It’s
a border and a boundary, but also the thing that unites both counties.— Mark Platts, Susquehanna Heritage
“We spent five years working within that old identity and were spread pretty thin,” recalls
President Mark Platts. “The one place we could focus on that nobody really owns is the
river. It’s a border and a boundary, but also the thing that unites both counties. We
decided to change our name and focus on the river.”
Two years ago, the organization partnered with Columbia Borough to manage the
Columbia Crossing River Trails Center.
“We had 25,000 people through the doors during the first year of operation,” says Platts.
“The Northwest River Trail opened around the same time we started running the Center.
That trail has really been a boon for Columbia and Marietta. It makes the river accessible
in a way it wasn’t before.”
Another major player in getting the trail built was the Lancaster County Solid Waste
Management Authority (LCSWMA) — they own just over 1000 acres of land, including
parcels along the river needed to complete the route.
COPYRIGHTED

A view of the Susquehanna from Columbia / credit: Lee Stabert
“While this land’s primary purpose is to host various facilities, we also recognize that we
can use this land in a way that gives back to the community,” explains Kathryn Sandoe,
Deputy Chief of Community Relations at LCSWMA.
LCSWMA also worked towards another major change in Columbia, one that was less
glamorous than a new recreation amenity, but perhaps more impactful. Right off busy
Route 30 is an exit for Columbia; the roadway used to funnel traffic right through the
center of town. So for years the community dealt with heavy tractor-trailer and truck
traffic. After 10 years of work and planning, a bypass was built that takes those large
vehicles around downtown.
While traffic patterns were getting a revamp, the Columbia/Wrightsville Bridge was
getting a makeover. In 2003, Susquehanna Heritage partnered with Rivertownes PA USA, a
local, all-volunteer nonprofit group, to reinstall the span’s iconic vintage lights, which
were removed in the ’70s.
“It took 11 years, but everyone stuck with it,” recalls Platts. “It was a $2 million project.
And the lights went up and everybody loves them. It creates really unique character and
shows that we’re invested in making things nice. And I think when people see that,
they’re willing to spend their own money and invest in making things nice.”COPYRIGHTED

An aerial view of the riverfront park in Columbia / photo: Susquehanna Hertitage
So lights, trucks, trail, action: All these moves are small parts of a bigger puzzle. Over the
past two decades, the community has fought hard for resources and attention from the
county.
“When I first got here, we tried to get the Convention & Visitors Bureaus interested in
marketing the river,” recalls Platts. “And they were kind of like, ‘We see it as an
attraction, but where do we send people?’ You could go see the view from the riverfront
park, rent a kayak, but there wasn’t a lot of infrastructure in place. All that stuff has been
developed now. We have bike trails, we have parks, we have visitors centers, we have
more businesses catering to outdoor recreation.”
COPYRIGHTED

Learning about the history of the region / photo: Susquehanna Heritage
Three years ago, Susquehanna Heritage went back to Discover Lancaster and the York
Convention & Visitors’ Bureau with a simple message: It’s ready now.
“We showed them all the things you could see and do along the river,” recalls Platts. “So
now both Discover Lancaster and the York CVB are part of a group working with us and
other partners to develop the brand. Last year we launched
SusquehannaRiverlands.com [a visitor destination website] and a printed map guide.”
(In addition to the Heritage Area designation, DCNR established the Susquehanna
Riverlands Conservation Landscape, an environmental and outdoor recreation initiative
managed by the Lancaster County Conservancy. Susquehanna Heritage coordinates
tourism development for the Landscape.)
COPYRIGHTED

Kayakers on the Susquehanna River
Lancaster and York counties welcome around 10 million visitors per year, many of them
coming to see the Amish. Few realize that just twenty minutes from downtown Lancaster
City, you can be kayaking or fishing.
“If a visitor spends $200 per day, and we can get five percent of those 10 million [people]
to stay one more day — experience the river, kayak, go to antique shops, eat dinner, take
a hike, ride their bike — that’s $100 million that could be spent here rather than
somewhere else,” says Platts.
Moving Forward
Of course, bringing tourists and out-of-towners to Columbia is only part of the picture. To
grow a sustainable economy, it’s important to make the Borough somewhere people
want to live and build businesses. The economy of this area has been hit hard over the
last century, and reinvention isn’t always easy.
The school district is struggling and there is a housing shortage downtown. The CEDC’s
Lutz hopes that the town can spur more residential development, especially two-
bedroom/two-bathroom apartments that would “really click with a young professional.”
COPYRIGHTED

Historic buildings in downtown Columbia
Fortunately, the raw materials for success exist in Columbia. It’s a beautiful place —
dense, charming, historic, and friendly.
“I spend a bit of time in the Rivertowns,” says Sandoe. “Each one has a unique and
eclectic culture. They have a lot of pride in their community. It’s a welcoming place.”
“I have a 20-year-old son in college getting ready to graduate. He wants to be in a cool
place,” adds Platts. “I think the younger generation in particular isn’t just thinking about
the job, but ‘where do I want to live?’ Places across the country are competing now to be
that cool place. Well, Lancaster is really cool.”
And then there’s the river.
“We probably realized 20 years ago that [the town’s] economic well-being is always tied
to the river,” he continues. “That was originally through rafting and people bringing
lumber down the river, then it was canals, then it was railroads and industry that thrived
along the river. A lot of that disappeared, died out, or was modernized in a way that was
no longer a direct economic benefit to the river towns. But the river can be repackaged
and repositioned as a resource and a destination. The river is your past. And it’s also
your future.”COPYRIGHTED

LEE STABERT is editor-in-chief of Keystone Edge. Tell her your favorite things about
Columbia @stabert.
This story is part of a series on the evolving identity of Lancaster. See previous entries
here. This content was created in partnership with the Economic Development Company of
Lancaster County and partner organizations.
Lead image: Cruising under the Columbia/Wrightsville Bridge / photo: Susquehanna
Heritage
Preserving community character in the PA Wilds
Paths to Prosperity A paddlers paradise on the Mon River
Share
Tweet
Share via email
Region(s): South Central Categories
Arts & Culture, Beer, Explore PA,
Features, Food & Drink,
Lancaster, Outdoors, PA Towns,
Reuse/Rebuild, Travel
Tags
The New Lancaster
Related Posts
Share 340
0 Comments Sort by
Facebook Comments Plugin
Newest
Add a comment...
Keystone Elsewhere COPYRIGHTED