hospitality industryoctober 24,...
TRANSCRIPT

ICIC
I S
ecurit
ies –
Retail E
quit
y R
esearch
Init
iatin
g C
overage
October 24, 2019
Hospitality Industry
Tourism – Turning into integral part of lifestyle
In the past few years, the Indian tourism sector has experienced a sea
change in its landscape, with travel being considered an integral part of
one’s annual calendar. With income levels expected to rise along with
various initiatives by the Government of India to enable the travel & tourism
ecosystem, this should augur well for the hospitality industry. Strategic
initiatives include relaxed FDI policies, revamping of the ‘Incredible India’
campaign, various schemes viz. UDAN, PRASAD, National Heritage City
Development, Augmentation Yojana (HRIDAY) and extension of e-visa to
166 countries. The recent move by the government with regard to lowering
the e-visa fees and reducing GST rates for hotel rooms will again make India
a more attractive destination. Going ahead, all these factors are expected to
keep demand growth healthy. With supply growth slowing down, we believe
the industry is at the cusp of an uptrend.
Tourism remains key focus area of government
The Indian travel & tourism industry plays a significant role in the nation’s
growth through employment, revenue generation as well as foreign
exchange earnings. Being among the top 10 contributors to global travel and
tourism GDP, it plays a significant role in economic and social aspects,
generating $247.3 billion in 2018, growing by 6.7% and contributed 9.2% to
the Indian economy. The government has announced various initiatives in
enabling the travel and tourism initiatives. The latest moves were GST rate
reduction for hotels and lowering of visa fees. The fees under the new e-visa
scheme have been brought down substantially from $80-100 to $30-45.
Further, the recent GST rate reduction (from 28% to 18% for tariff above
| 7500 and from 18% to 12% for tariff below | 7500 for hotels) has made the
cost of tour in India cheaper and more competitive.
Industry to witness uptrend with demand outpacing supply
Demand for India’s hospitality sector will continue to benefit from under-
penetration of hotels in India vs. developed economies, moderation in new
room supply, improved connectivity, rising income levels and growing
service sector that will aid increased business travels. Inbound tourism is
also on a growth trajectory aided by favourable policies and developments
such as e-visa, expansion of visa on arrival facility, the Incredible India 2.0
campaign and better regional connectivity. The supply growth projection of
5% in the next five years would help keep occupancy levels healthy. Average
occupancy levels are expected to increase to 73% by FY23E, which should
create room for ARR improvement for the companies, going forward.
Chalet Hotels and Lemon Tree Hotels set to reap benefits
The hospitality sector was in troubled waters since late 2008 due to
substantial supply growth coupled with a slowdown in demand. Occupancy
has revived since FY14 and more notably from FY15, as demand conditions
have improved and new supply has slowed. The upward trend in RevPAR
has mainly been occupancy led and is expected to gain further momentum.
With supply slowing down and demand expected to improve with
government initiatives to boost tourism (e-visa, GST rate cuts, revamping
“Incredible India”), improving connectivity (UDAN scheme, road projects,
etc) an uptrend looks to be on the cards for the hospitality industry. We like
Chalet Hotels and Lemon Tree Hotels in this space. We initiate coverage on
Chalet Hotels with a HOLD rating and on Lemon Tree Hotels with a BUY
rating.
Key Highlights
Hospitality players staring at industry
uptrend
Government’s push towards tourism in
form of GST rate cuts, reduction in visa
charges and thrust to improve
connectivity to boost travel & tourism
Foreign tourist arrivals growing at 8.8%
CAGR over last five years
Demand growth expected to outpace
supply growth
Pan-India occupancies to reach 73% by
FY23E
Initiate coverage on Chalet Hotels and
Lemon Tree
Rating Matrix – Initiating Coverage
Company Rating Target Upside
Chalet Hotels HOLD 350 2.9%
Lemon Tree Hotels BUY 73 25.0%
Research Analyst
Rashesh Shah
Romil Mehta
ICICI Securities | Retail Research 2
ICICI Direct Research
Initiating Coverage | Hospitality Industry
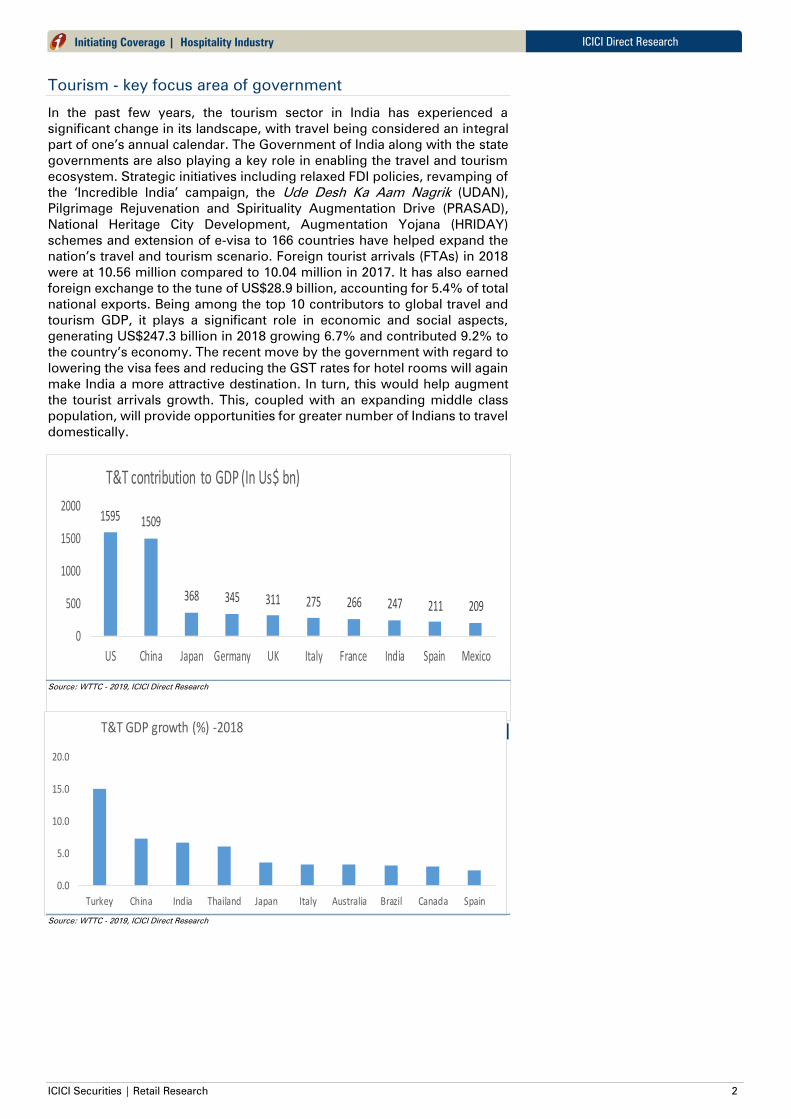
Tourism - key focus area of government
In the past few years, the tourism sector in India has experienced a
significant change in its landscape, with travel being considered an integral
part of one’s annual calendar. The Government of India along with the state
governments are also playing a key role in enabling the travel and tourism
ecosystem. Strategic initiatives including relaxed FDI policies, revamping of
the ‘Incredible India’ campaign, the Ude Desh Ka Aam Nagrik (UDAN),
Pilgrimage Rejuvenation and Spirituality Augmentation Drive (PRASAD),
National Heritage City Development, Augmentation Yojana (HRIDAY)
schemes and extension of e-visa to 166 countries have helped expand the
nation’s travel and tourism scenario. Foreign tourist arrivals (FTAs) in 2018
were at 10.56 million compared to 10.04 million in 2017. It has also earned
foreign exchange to the tune of US$28.9 billion, accounting for 5.4% of total
national exports. Being among the top 10 contributors to global travel and
tourism GDP, it plays a significant role in economic and social aspects,
generating US$247.3 billion in 2018 growing 6.7% and contributed 9.2% to
the country’s economy. The recent move by the government with regard to
lowering the visa fees and reducing the GST rates for hotel rooms will again
make India a more attractive destination. In turn, this would help augment
the tourist arrivals growth. This, coupled with an expanding middle class
population, will provide opportunities for greater number of Indians to travel
domestically.
Exhibit 1: T&T contribution to GDP (in US$ bn)
1595 1509
368 345 311 275 266 247 211 209
0
500
1000
1500
2000
US China Japan Germany UK Italy France India Spain Mexico
T&T contribution to GDP (In Us$ bn)
Source: WTTC - 2019, ICICI Direct Research
Exhibit 2: T&T GDP growth (%) - 2018
0.0
5.0
10.0
15.0
20.0
Turkey China India Thailand Japan Italy Australia Brazil Canada Spain
T&T GDP growth (%) -2018
Source: WTTC - 2019, ICICI Direct Research

ICICI Securities | Retail Research 3
ICICI Direct Research
Initiating Coverage | Hospitality Industry
Exhibit 3: Foreign tourist arrival growth
0.69 0.77 0.820.92
1.03 1.06
FY14 FY15 FY16 FY17 FY18 FY19
CAGR of 18.4% over FY14-19
FTAs (In cr)
Source: Ministry of Tourism, ICICI Direct Research
Exhibit 4: Foreign exchange earnings from tourism
20.2 21.1 22.927.7 28.6
19.3
2014 2015 2016 2017 2018 2019*
CAGR of 9% over 2014-2018
Foreign Exchange Earnings ($ billion)
Source: Ministry of tourism, ICICI Direct Research
Travel volumes, in terms of visits by domestic travellers, have grown at 9.5%
CAGR in the past five years. Although hotels and resorts in India get only a
small percentage of the overall domestic travel in the country, this segment
is an increasingly important demand generator for the hotel sector.
Exhibit 5: Domestic travellers increasing gradually
11425
12828
14320
16136 16525
18000
0
5000
10000
15000
20000
2013 2014 2015 2016 2017 2018
Dom
estic v
isitations (in Lakh)
Domestic tourist visits grew at CAGR of 9.5% during last 5 years
Source: Hotelivate - 2019, ICICI Direct Research
Demand growth potential is huge
Demand in India’s hospitality sector will continue to benefit from
Under-penetration of hotels in India compared to developing
economies, 2) moderation in new room supply
Improved road & rail connectivity
Rising income levels
Growing service sector that will aid increased business travels
Inbound tourism is also on a growth trajectory aided by favourable policies
and developments such as e-visa, expansion of visa on arrival facility, the
incredible India 2.0 campaign and better regional connectivity.
Significant room under-penetration
World USA China India
Total rooms (mn) 16.2 5.0 3.8 0.20
Population (mn) 7349 321 1379 1211
Penetration 2.20 15.58 2.76 0.17

ICICI Securities | Retail Research 4
ICICI Direct Research
Initiating Coverage | Hospitality Industry
Limited room supply growth to rev up occupancy
The hotel sector in India experienced a difficult period from late 2008, with
a double dip in occupancy. This was primarily due to the demand-supply
mismatch caused by substantial supply growth coupled with slowdown of
demand on the other hand. The occupancy rates across India remained
stagnant below 60% between FY09-15. During FY11 to FY15, 36,000 rooms
were added creating significant new capacity; simultaneously the economy
and demand patterns were weak. Occupancy has revived since the financial
year 2014 and more notably from the financial year 2016, as demand
conditions have improved and new supply has slowed. The upward trend in
RevPAR has mainly been occupancy led, and is expected to gain momentum
further due to limited capacity additions going forward. As a result, ARR
levels are expected to improve, slowly in some markets and more strongly
in some other markets which are already experiencing strong occupancy, as
demand and occupancy levels improve.
Exhibit 6: Room supply growth has been significantly high in past; cools down to single digits
7153
1
8431
3
9425
5
1071
77
10
76
95
1116
00
11
92
19
12
65
65
1333
59
1703
51
15.8% 17.9%
11.8% 13.7%
0.5%
3.6% 6.8% 6.2%5.4%
5.0%
0.0%
5.0%
10.0%
15.0%
20.0%
0
50000
100000
150000
200000
FY11 FY12 FY13 FY14 FY15 FY16 FY17 FY18 FY19 FY24E
Rooms supply to grow at 5% CAGR during FY19-24E vs. 9% CAGR during FY10-19
Rooms (LHS) Growth (RHS)
[[
Source: Hotelivate 2019, ICICI Direct Research
The supply growth projection of 5% over the next five years would help keep
occupancy levels healthy. We expect average occupancy levels to increase
to 73% by FY23E. This should help companies to improve their ARR
significantly, going forward.
Exhibit 7: Occupancies to improve on the back of gradual demand growth outpacing room addition growth
70.8
59.5 59.560.6
59.3
57.858.4 58.8
63.3
64.8
66.767.5
73.0
50
55
60
65
70
75
FY08 FY09 FY10 FY11 FY12 FY13 FY14 FY15 FY16 FY17 FY18 FY19 FY23E
Occupancy levels to improve going forward (%)
Source: STR, Horwath HTL, ICICI Direct Research
Incremental Room supply– City wise
Location CAGR (FY19-23E)
Chennai 0.4
New Delhi 1.2
Hyderabad 1.7
Pune 2.4
Agra 3.0
Bengaluru 4.9
Mumbai 5.5
Goa 5.6
Gurugram 5.7
Jaipur 6.6
Noida 6.9
Kolkata 8.3
Ahmedabad 10.8

ICICI Securities | Retail Research 5
ICICI Direct Research
Initiating Coverage | Hospitality Industry
Mumbai, Delhi, Goa – Top three in terms of RevPAR
With improved demand and a balanced supply environment post FY15, all
major markets witnessed an improvement in occupancy and ARRs in the
past five years. In terms of city wise performance, Mumbai, Delhi and Goa
remain the top three, achieving highest occupancy and ARRs among top 13
cities in India. While ARR growth of Bengaluru, Ahmedabad and Pune
continued to remain healthy, Hyderabad has emerged as a leader in terms
of growth in both levers i.e. ARR & occupancy. The increase can be
attributed to Grade A commercial set-ups that are commencing operations
in the city leading to steady flow of demand
Exhibit 8: Mumbai, Delhi, Goa most dense markets
Occupancy (%) FY14 FY15 FY16 FY17 FY18 FY19 5 yr CAGR (bps)
Mumbai 67.0 71.8 73.7 74.4 75.5 77.1 285
New Delhi 60.9 61.7 66.7 69.4 70.5 72.5 355
Bengaluru 57.7 58.1 65.7 65.9 68.3 66.0 272
Chennai 55.4 58.9 62.7 64.8 63.0 65.0 325
Hyderabad 51.7 57.1 59.3 63.7 66.3 70.3 634
Kolkata 70.2 67.8 69.3 70.9 70.2 70.8 17
Gurugram 58.8 61.1 63.7 66.3 67.9 68.8 319
Noida 53.5 48.0 51.0 56.2 54.9 60.0 232
Pune 57.4 61.3 65.6 64.1 68.2 69.9 402
Ahmedabad 52.7 53.9 55.6 61.1 63.8 63.9 393
Goa 68.7 69.7 70.2 71.3 70.0 71.8 89
Jaipur 54.3 54.5 60.8 64.4 67.6 67.9 457
Agra 60.4 61.5 57.7 59.6 66.2 67.0 210
Business Destinations
Leisure Destinations
Source: Hotelivate – 2019, ICICI Direct Research
Exhibit 9: Mumbai, Delhi, Goa also have highest ARRs, thus highest RevPARs as well
ARR (|) FY14 FY15 FY16 FY17 FY18 FY19 5 yr CAGR (%)
Mumbai 7,158 7,230 7,353 7,612 7,760 8,096 2.5
New Delhi 6,941 6,568 6,211 6,292 6,649 7,026 0.2
Bengaluru 5,379 5,368 5,392 5,598 5,823 6,339 3.3
Chennai 5,050 4,825 4,767 4,761 4,863 5,045 0.0
Hyderabad 4,556 4,535 4,741 4,880 4,924 5,217 2.7
Kolkata 5,739 5,734 5,607 5,814 5,904 5,853 0.4
Gurugram 6,569 6,241 6,253 6,382 6,113 6,346 -0.7
Noida 5,964 5,429 5,281 5,652 5,323 6,100 0.5
Pune 3,908 3,846 3,922 4,195 4,484 4,807 4.2
Ahmedabad 3,734 3,753 3,884 3,897 4,158 4,578 4.2
Goa 6,692 6,819 7,020 7,538 7,920 7,912 3.4
Jaipur 4,743 4,743 4,721 4,787 5,051 5,296 2.2
Agra 6,338 6,488 6,083 5,508 5,316 5,726 -2.0
Business Destinations
Leisure Destinations
Source: Hotelivate – 2019, ICICI Direct Research
RevPAR growth – City wise
RevPAR (|) 5 year CAGR (%)
Mumbai 5.4
New Delhi 3.8
Bengaluru 6.2
Chennai 3.2
Hyderabad 9.3
Kolkata 0.6
Gurugram 2.5
Noida 2.8
Pune 8.4
Ahmedabad 8.3
Goa 4.3
Jaipur 6.9
Agra 0.0
Leisure Destinations
Business Destinations
ICICI Securities | Retail Research 6
ICICI Direct Research
Initiating Coverage | Hospitality Industry
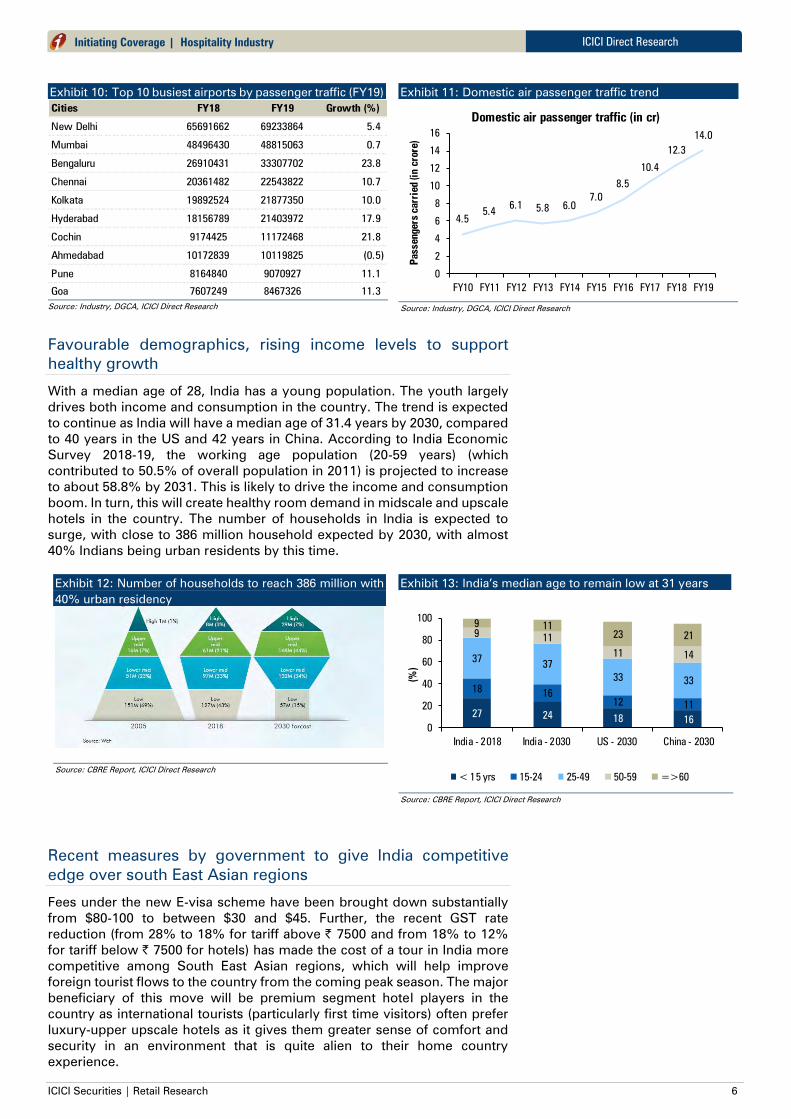
Exhibit 10: Top 10 busiest airports by passenger traffic (FY19)
Cities FY18 FY19 Growth (%)
New Delhi 65691662 69233864 5.4
Mumbai 48496430 48815063 0.7
Bengaluru 26910431 33307702 23.8
Chennai 20361482 22543822 10.7
Kolkata 19892524 21877350 10.0
Hyderabad 18156789 21403972 17.9
Cochin 9174425 11172468 21.8
Ahmedabad 10172839 10119825 (0.5)
Pune 8164840 9070927 11.1
Goa 7607249 8467326 11.3
Source: Industry, DGCA, ICICI Direct Research
Exhibit 11: Domestic air passenger traffic trend
4.5
5.46.1
5.8 6.0
7.0
8.5
10.4
12.3
14.0
0
2
4
6
8
10
12
14
16
FY10 FY11 FY12 FY13 FY14 FY15 FY16 FY17 FY18 FY19
Passengers c
arried (in crore)
Domestic air passenger traffic (in cr)
Source: Industry, DGCA, ICICI Direct Research
Favourable demographics, rising income levels to support
healthy growth
With a median age of 28, India has a young population. The youth largely
drives both income and consumption in the country. The trend is expected
to continue as India will have a median age of 31.4 years by 2030, compared
to 40 years in the US and 42 years in China. According to India Economic
Survey 2018-19, the working age population (20-59 years) (which
contributed to 50.5% of overall population in 2011) is projected to increase
to about 58.8% by 2031. This is likely to drive the income and consumption
boom. In turn, this will create healthy room demand in midscale and upscale
hotels in the country. The number of households in India is expected to
surge, with close to 386 million household expected by 2030, with almost
40% Indians being urban residents by this time.
Exhibit 12: Number of households to reach 386 million with
40% urban residency
Source: CBRE Report, ICICI Direct Research
Exhibit 13: India’s median age to remain low at 31 years
27 2418 16
1816
12 11
3737
3333
911
11 14
9 11
23 21
0
20
40
60
80
100
India - 2018 India - 2030 US - 2030 China - 2030
(%
)
< 15 yrs 15-24 25-49 50-59 =>60
Source: CBRE Report, ICICI Direct Research
Recent measures by government to give India competitive
edge over south East Asian regions
Fees under the new E-visa scheme have been brought down substantially
from $80-100 to between $30 and $45. Further, the recent GST rate
reduction (from 28% to 18% for tariff above | 7500 and from 18% to 12%
for tariff below | 7500 for hotels) has made the cost of a tour in India more
competitive among South East Asian regions, which will help improve
foreign tourist flows to the country from the coming peak season. The major
beneficiary of this move will be premium segment hotel players in the
country as international tourists (particularly first time visitors) often prefer
luxury-upper upscale hotels as it gives them greater sense of comfort and
security in an environment that is quite alien to their home country
experience.

ICIC
I S
ecurit
ies –
Retail E
quit
y R
esearch
Init
iatin
g C
overage
October 24, 2019
CMP: | 340 Target: | 350 ( 3%) Target Period: 12 months
Chalet Hotels (CHAHOT)
HOLD
Play on high-end hospitality…
Chalet Hotels, a part of the K Raheja Corp group, is an owner, developer and
asset manager of luxury upper upscale and upscale hotels. The company
has a stabilized room portfolio of 2331 keys comprising five operating
hotels, three in the Mumbai Metropolitan Region (MMR) and one each in
Hyderabad and Bengaluru. The company also owns ~8.7 lakh sq. ft. of retail
and commercial assets in Mumbai and Bengaluru. With hotel assets
stabilized aided by favourable demand supply dynamics in its core markets
in the hospitality segment, we factor in ~5% CAGR growth in RevPARs on
the back of 3.6% growth in ARRs between FY19-21E. Further, with additional
revenues kicking in from the commencement of operations of commercial
& retail assets in Mumbai, we expect total revenues to grow at 8% CAGR in
FY19-21E and EBITDA at a CAGR of 15% during the same period. With
limited headroom for growth from current hospitality assets, we initiate
coverage on Chalet with a HOLD rating.
Retail, commercial assets to be major growth contributors
Chalet Hotels’ hospitality portfolio has stabilized and ended FY19 with an
occupancy of 76% with a major growth trigger expected to come from
FY22E. The company’s retail and commercial assets would be the major
revenue drivers in next two years with the operationalization of The Business
Centre – Sahar (3.7 lakh sq. ft.) for which an agreement has been signed with
WPP Marketing to lease the property and The Orb - Retail (1.2 lakh sq. ft.)
where agreements have been signed with retailers. From the current (FY19)
contribution of 3% of the total income (ex-real estate), this segment’s share
is expected to increase to 8% by FY21E to ~| 95 crore.
Highest EBITDA margins among peers; to remain margin leader
Chalet Hotels is an asset developer and owner of hotel properties. While, It
does not own any hospitality brand, it signs management contracts with
major hospitality brands (currently all brands owned by Marriott
International) to manage its properties and pays charges in the form of
royalty (% of revenues), incentive fees (% of gross operating profit) and
reimbursements to the brand owner. These payments form ~8%-9% of
revenues. Most of its peers, clock EBITDA margins in the 20-30% range
while Chalet, despite not having its own brand and no revenues from
management contract (which its peers generate), has been generating
EBITDA margins in excess of 30% since FY17.
Valuation & Outlook
Chalet Hotels raised ~| 950 crore via IPO and reduced its debt significantly,
slicing its debt/EBITDA from 11.1x in FY18 to 4.8x in FY19. While Chalet’s
profitability is expected to improve over the next two years, its current hotels
portfolio has limited space for growth (Blended occupancy for FY19 was
76%). Thus the next major growth trigger is expected between FY22-24E
with addition of new hotels and commercial assets. As the company is
currently under capex mode, we initiate coverage with a HOLD rating and a
target price of | 350 valuing the company at 21x FY21E EV/EBITDA.
Key Financial Summary
Key Financials FY17 FY18 FY19 FY20E FY21E CAGR (FY19-21E)
Net Sales 706 796 987 1052 1147 8%
EBITDA 212 245 319 374 424 15%
EBITDA (%) 30.1 30.8 32.3 35.5 37.0
PAT (Adj) 138 -15 -6 144 213 NA
EPS (|) 6.7 -0.7 -0.3 7.0 10.4
EV/EBITDA 45.1 39.5 26.4 22.8 20.8
RoNW (%) 25.7 -19.2 -0.8 9.7 13.0
RoCE (%) 12.5 7.0 8.9 10.0 10.9
Source: ICICI Direct Research, Company
Stock Data
Amount
Market Capitalization | 6971
Debt (FY19) | 1546
Cash & Invest (FY19) | 83
EV | 8434
52 week H/L | 387/250
Equity cap | 205
Face value | 10
Particulars
Price Chart
6,000
8,000
10,000
12,000
14,000
0
100
200
300
400
Oct-19
Jul-19
Apr-19
Jan-19
Oct-18
Jul-18
Apr-18
Jan-18
Oct-17
Aug-17
May-17
Feb-17
Nov-16
Price (R.H.S) Nifty (L.H.S)
Key Highlights
Three hotels and two commercial
assets under construction – All to begin
operations from CY21
The Orb and Business Centre in Powai
to begin operations from FY20E
Demand-supply dynamics getting in
favour of hospitality industry
Initiate coverage on Chalet Hotels with
HOLD rating and target price of |
350/share
Research Analyst
Rashesh Shah
Romil Mehta

ICICI Securities | Retail Research 8
ICICI Direct Research
Initiating Coverage | Chalet Hotels
Company Background
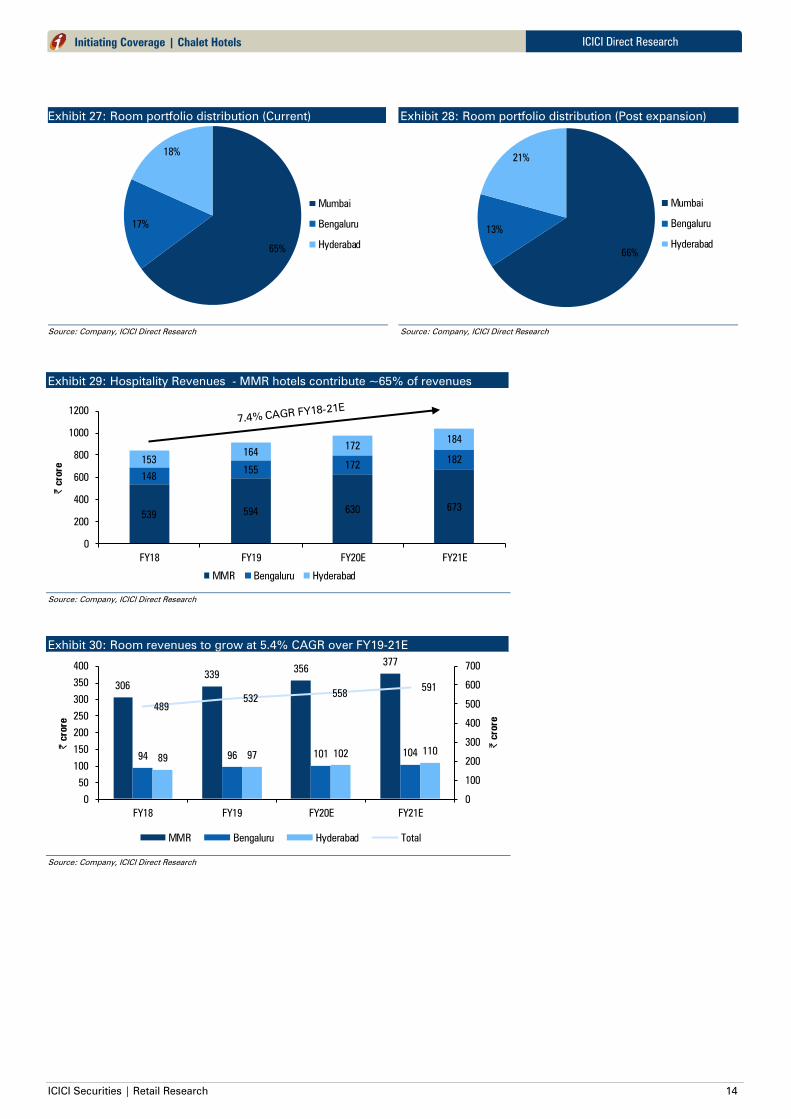
Owner of high-end properties at strategic locations
The company’s entire hotel portfolio is located in dense business districts of
MMR, Hyderabad and Bengaluru. Out of the total hotel portfolio of 2331 keys
across five hotels, 65% of the room portfolio is in Mumbai while the rest is
divided between Hyderabad and Bengaluru. All hotels are flagged under
global brands such as JW Marriott, Westin, Marriott, Renaissance and Four
Points by Sheraton, all of which are held by Marriott International and its
affiliates. Additionally, the company has ~8.7 lakh sq.ft. of retail and
commercial space, out of which ~5 lakh sq.ft. (Business Centre Sahar, The
Orb) would start generating revenues from FY20E.
Exhibit 14: Current room portfolio (65% in MMR)
Hotel NameLocation and size
of land parcel
No of roomsMonth of
opening
Nature of
Ownership
JW Marriott Sahar MumbaiSahar Mumbai
14.55 acres
588 Feb-15Freehold 100%
ownership
Bengaluru Marriott Hotel Whitefield
Whitefield,
Bengaluru
9.76 acres
391 Feb-13
Freehold 100%
ownership
The Westin Hyderabad Mindspace
Mindspace,
Hyderabad
3.1 acres
427 Dec-09
Freehold 100%
ownership
Renaissance Mumbai Convention
Centre Hotel and Lakeside Chalet
Powai Mumbai
15 acres
773 Jul-01Freehold 100%
ownership
Four Points By SheratonVashi, Navi
Mumbai
152 Jun-09 Leasehold
Total 2331
Source: Company, ICICI Direct Research
Exhibit 15: Commercial & Retail Portfolio
Project Name LocationLeasable Area (sq ft
in lakhs)
Operational Status Nature of ownership interest
Business Centre Sahar, Mumbai 3.74Leased to WPP Marketing
from September 2019
Freehold, 100% ownership
The Orb - Retail Sahar, Mumbai 1.23 To get operational in FY20E Freehold, 100% ownership
Bengaluru - Commerial Whitefield, Bengaluru 1.09 100% occupied by single tenant Freehold, 100% ownership
Inorbit Mall Bengaluru -
Retail
Whitefield, Bengaluru 2.60 Operational at full capacity Freehold, 100% ownership
Total 8.67
Source: Company, ICICI Direct Research

ICICI Securities | Retail Research 9
ICICI Direct Research
Initiating Coverage | Chalet Hotels
Exhibit 16: Current portfolio - A mix of Hospitality and Commercial & Retail assets
Source: Company, ICICI Direct Research
Exhibit 17: Micro-market dynamics and triggers
Source: Company, ICICI Direct Research

ICICI Securities | Retail Research 10
ICICI Direct Research
Initiating Coverage | Chalet Hotels
Historical performance of current hotel portfolio
Exhibit 18: Performance of Luxury upper upscale hotels
Particulars FY16 FY17 FY18
Number of keys 1771 2109 2176
ARR (|) 7723 7975 7979
Occupancy rate (%) 58.09% 65.99% 71.70%
RevPAR (|) 4486 5263 5721
Total Operating revenues (| crore) 515.2 631.5 788.4
Total Operating expenses (| crore) 342.7 402.7 471.7
EBITDA 172.5 228.8 316.7
EBITDA (%) 33% 36% 40%
Staff per Room 1.25 1.25 1.21
Source: Company, ICICI Direct Research
Exhibit 19: JW Marriott Mumbai Sahar
Particulars FY16 FY17 FY18
Number of keys (588 keys currenly) 585 585 585
ARR (|) 7735 8259 8499
Occupancy rate (%) 45.72% 65.13% 73.16%
RevPAR (|) 3536 5379 6218
Total Operating revenues (| crore) 149.4 204.8 242.3
Total Operating expenses (| crore) 111.7 135.1 144.6
EBITDA 37.8 69.7 97.7
EBITDA (%) 25% 34% 40%
No of meeting rooms 5 5 5
No of F&B outlets 3 3 3
Source: Company, ICICI Direct Research
Exhibit 20: Bengaluru Marriott Hotel Whitefield
Particulars FY17 FY18
Number of keys 324 391
Occupancy rate (%) 74.32% 76.79%
RevPAR (|) 6665 6619
Total Operating revenues (| crore) 125.4 147.7
Total Operating expenses (| crore) 78.9 80.5
EBITDA 46.4 67.2
EBITDA (%) 37% 46%
No of meeting rooms 2 2
Source: Company, ICICI Direct Research
Exhibit 21: The Westin Hyderabad Mindspace
Particulars FY16 FY17 FY18
Number of keys 427 427 427
ARR (|) 7654 7792 7973
Occupancy rate (%) 65.72% 68.64% 71.41%
RevPAR (|) 5030 5348 5694
Total Operating expenses (| crore) 83.5 86.8 88.9
EBITDA 54.1 58.2 63.7
EBITDA (%) 39% 40% 42%
No of meeting rooms 5 5 5
No of F&B outlets 4 4 4
Source: Company, ICICI Direct Research
Exhibit 22: Renaissance Hotel and Marriott Executive
Apartments
Particulars FY16 FY17 FY18
Number of keys 759 773 773
ARR (|) 7757 7340 7215
Occupancy rate (%) 63.33% 63.83% 69.18%
RevPAR (|) 4913 4685 4991
Total Operating revenues (| crore) 228.2 228.8 245.9
Total Operating expenses (| crore) 147.5 147.0 157.8
EBITDA 80.6 81.8 88.0
EBITDA (%) 35% 36% 36%
No of meeting rooms 9 9 9
No of F&B outlets 6 6 6
Source: Company, ICICI Direct Research
Exhibit 23: Four Points by Sheraton
Particulars FY16 FY17 FY18
Number of keys 150 150 152
ARR (|) 6494 6326 6435
Occupancy rate (%) 86.42% 86.14% 88.10%
RevPAR (|) 5612 5449 5669
Total Operating revenues (| crore) 49.2 49.2 51.1
Total Operating expenses (| crore) 30.6 30.4 29.2
EBITDA 18.6 18.8 22.0
EBITDA (%) 38% 38% 43%
No of meeting rooms 4 4 4
No of F&B outlets 3 3 3
Source: Company, ICICI Direct Research

ICICI Securities | Retail Research 11
ICICI Direct Research
Initiating Coverage | Chalet Hotels
Exhibit 24: Upcoming projects
Source: Company, ICICI Direct Research

ICICI Securities | Retail Research 12
ICICI Direct Research
Initiating Coverage | Chalet Hotels
Key Managerial Personnel & Directors
Ravi C Raheja – Promoter, Non-Executive Director
Ravi C Raheja is an alumnus of the London Business School with over 25
years’ experience across real estate, hospitality and retail. His multifarious
experience and inherent acumen for judging correctly, has led him to
spearhead business development for the real estate arm of the Group. Mr
Raheja is actively involved in charting the future growth of K Raheja Corp
Group and each of its businesses, while playing a key role in guiding the
hospitality and other divisions of the Group. Mr Raheja has held important
positions on several key forums, such as Mumbai Chairman of the Indian
Green Building Council and member of the World Economic Forum.
Neel C Raheja – Promoter, Non-Executive Director
Neel Raheja is a Graduate in Law from the Mumbai University, and an
alumnus of the Harvard Business School, Boston, Massachusetts. He has
been instrumental in setting up premium hotels in the country for the
company and been the cornerstone in establishing retail brands Shoppers
Stop, Inorbit Mall and Crossword. He is co-chair at CII National Committee
on Real Estate and Housing, Chairman, India Chapter of APREA, and was
President, NAREDCO West. He is also Vice Chairman of CORENET, and
Advisory Committee member of MCHI-CREDAI. Mr Raheja has been
appointed on the Government of India Committee to suggest changes in the
Special Economic Zone policy.
Sanjay Sethi – MD & CEO
Sanjay Sethi is a hotel management graduate from IHM Pusa. He is a
Certified Hotel Administrator (CHA) from American Hotel and Lodging
Educational Institute and has completed various management certifications
from IIM-Bangalore, XLRI and Cornel. He has over 30 years of experience
with leading Indian hotel chains, and across segments. Prior to joining
Chalet, Sanjay set up Berggruen Hotels in 2006 as promoter CEO and MD
along with Berggruen Holdings, New York. He worked with ITC Ltd as Chief
Operating Officer of their hotels division and The Indian Hotels Company as
a general manager to their hotel properties and area director for their
Hyderabad hotels.
Rajeev Newar – Executive Director and CFO
Rajeev Newar is a Chartered Accountant, Company Secretary and Bachelor
of Commerce (Honours) from Calcutta University. Over the past 27 years,
Mr Newar has held several leadership positions in finance. Prior to joining
Chalet Hotels, he was Vice President Finance with The Indian Hotels
Company and a Director on the Board of some of its subsidiaries. He has
been recognized on various forums and recently received recognition of
excellence at the CFO India Conference, 2019.
Hetal Gandhi - Chairman and Independent Director
Hetal Gandhi is a Chartered Accountant and has a bachelor’s degree in
commerce from the University of Mumbai. He is the co-founder and
managing director of Tano India Advisors Pvt Ltd (TIA). TIA is the India sub-
advisor for private equity funds set up and managed by Tano Capital, US for
investing in Indian companies. He was previously associated with a
diversified financial services company as its Head - Financial Services and
with Orix Auto and Business Solutions as its Chief Executive Officer. He has
over 31 years of experience in the financial services industry. Mr Gandhi has
been on the Board of Chalet since March 20, 2003 and was appointed an
Independent Director and Chairman of the company with effect from June
12, 2018.

ICICI Securities | Retail Research 13
ICICI Direct Research
Initiating Coverage | Chalet Hotels
Investment Rationale
Hospitality company but with DNA of real estate developer
Chalet Hotels is a part of the K Raheja Corp Group whose group companies
have extensive experience in developing large scale real estate and
commercial projects resulting in a strong understanding of the industry that
the company uses to identify suitable locations and opportunities. The
company also leverages this experience and relationships of these
companies with construction companies to develop hotels at optimal cost
and quality. With large FSI available on the lands along with effective design,
the company is able to construct hotels at costs and size per room that are
among the lowest in the industry.
Exhibit 25: Cost of setting-up a new hotel one of the lowest in industry
Hotel Location Number of keys Cost per room (| crore)
JW Marriott Sahar, Mumbai 577 1.4
ITC Royal Bengal Kolkata 456 3.1
ITC Narmada Ahmedabad 300 2
ITC Kohenur Hyderabad 271 2.9
Oberoi Rajgarh Dattia, MP 60 3.3
Source: Company, ICICI Direct Research
Capacity addition – MMR to remain dominant part of portfolio
Chalet plans to enhance its hospitality portfolio by 25% from the current
number of rooms. The company would be adding two hotels in MMR and
one in Hyderabad, all of which are expected to commence operations in
CY21. Further, to leverage additional FSI at some of its hotels, the company
has adopted the hotel-led mixed-use project development. Chalet is
currently developing commercial space in Powai, Mumbai along with an IT
Park in Whitefield, Bengaluru on unutilized land at the current hotels. In
CY21, the company would, thus, be adding 580 rooms across three hotels
and commercial projects with a leasable space of ~11 lakh sq.ft (Refer
exhibit 35). Thus, with additional assets getting into operations during CY21,
we expect the pace of revenue growth to increase to double digits in FY21E-
23E. Currently, out of 2331 keys, 1513 are in the MMR region (64.9% of the
room portfolio). Post expansion of the hotels portfolio, 1923 rooms would
be in the MMR region (66% of total room portfolio)
Exhibit 26: Upcoming pipeline of rooms
Location of Hotel No of rooms Expected Opening Ownership Interest Proposed brand
Hyderabad 170.0 Apr-2021 Leasehold rights Westin
Airoli, Navi Mumbai 260.0 Sep-2021 Leasehold rights Hyatt Regency
Powai, Mumbai 150.0 Sep-2021 100% ownership 'W'
Total 580.0
Total post expansion 2911.0
Hotels under development
Source: Company, ICICI Direct Research
JW Mariott Sahar, Mumbai was completed in FY15
at a cost of | 1.4 crore per room including land costs
According to the management estimates, funding all
the expansion (hotels and commercial spaces) will
entail a capital outlay of ~| 1250 crore and will be
spent over 3 years in the ratio of 25:35:45.
ICICI Securities | Retail Research 14
ICICI Direct Research
Initiating Coverage | Chalet Hotels
Exhibit 27: Room portfolio distribution (Current)
65%
17%
18%
Mumbai
Bengaluru
Hyderabad
Source: Company, ICICI Direct Research
Exhibit 28: Room portfolio distribution (Post expansion)
66%
13%
21%
Mumbai
Bengaluru
Hyderabad
Source: Company, ICICI Direct Research
Exhibit 29: Hospitality Revenues - MMR hotels contribute ~65% of revenues
539594 630 673
148155
172182153
164172
184
0
200
400
600
800
1000
1200
FY18 FY19 FY20E FY21E
| crore
MMR Bengaluru Hyderabad
Source: Company, ICICI Direct Research
Exhibit 30: Room revenues to grow at 5.4% CAGR over FY19-21E
306
339356
377
94 96 101 10489 97 102 110
489
532558
591
0
100
200
300
400
500
600
700
0
50
100
150
200
250
300
350
400
FY18 FY19 FY20E FY21E
| crore
| crore
MMR Bengaluru Hyderabad Total
Source: Company, ICICI Direct Research

ICICI Securities | Retail Research 15
ICICI Direct Research
Initiating Coverage | Chalet Hotels
Exhibit 31: F&B revenues to grow at 8% CAGR over FY19-21E
234
255272
294
53 5970 76
64 67 70 76
351
382
412
445
0
100
200
300
400
500
0
50
100
150
200
250
300
350
FY18 FY19 FY20E FY21E
| crore
| crore
MMR Bengaluru Hyderabad Total
Source: Company, ICICI Direct Research
Exhibit 32: ARRs to increase at 4% CAGR over FY19-21E
Average Room rate (|) FY18 FY19 FY20E FY21E
MMR 7634 8086 8369 8746
Bengaluru 8620 8756 9062 9380
Hyderabad 7973 8205 8533 8917
Combined 7862 8220 8515 8883
Source: Company, ICICI Direct Research
Exhibit 33: Occupancy rates to improve marginally over in
FY19-21E
Occupancy (%) FY18 FY19 FY20E FY21E
MMR 72.6% 76.0% 77.0% 78.2%
Bengaluru 76.8% 77.0% 78.0% 78.0%
Hyderabad 71.4% 76.0% 76.5% 78.8%
Combined 73.1% 76.2% 77.1% 78.3%
Source: Company, ICICI Direct Research
Exhibit 34: RevPAR to cross | 7500 by FY21E at 9.6% CAGR over FY19-21E
5,540
6,150
6,440
6,840
6,620
6,740
7,070
7,320
5,690
6,240
6,530
7,030
5,750
6,260 6,560
6,950
-
1,000
2,000
3,000
4,000
5,000
6,000
7,000
8,000
-
1,000
2,000
3,000
4,000
5,000
6,000
7,000
8,000
FY18 FY19 FY20E FY21E
||
MMR Bengaluru Hyderabad Combined
Source: Company, ICICI Direct Research

ICICI Securities | Retail Research 16
ICICI Direct Research
Initiating Coverage | Chalet Hotels
Commercial & retail segment revenue share to increase
Out of the existing capacity of ~8.7 lakh sq.ft. of commercial & retail assets,
~5 lakh sq.ft (The Orb and Business Centre, Sahar) to begin generating
revenues from FY20E (Refer Exhibit 15). Thus, the share in total revenues
(ex-real estate revenues) of the C&R segment is expected to improve from
2.8% of revenues in FY16 to a little over 8% by FY21E. We expect revenues
of this segment to grow at 58% CAGR in FY18-21E to | 95 crore with
occupancy levels near 90% by FY21E. Additionally, the company has a
pipeline of ~11 lakh sq.ft of commercial assets in Bengaluru and Mumbai.
Since these assets are expected to come on stream from FY22, we have not
built in revenues projections for the same in our model.
Exhibit 35: Upcoming Commercial & Retail assets
Project name Location
Total Built-up area
(sq. ft. in lakh)
Expected
Opening Nature of ownership interest
IT Building Phase II Bengaluru 4.0 Mar-2021 Freehold, 100% ownership
Powai Office Block Mumbai 7.0 Sep-2021 Freehold, 100% ownership
Total 11.0
Total post expansion 19.7
Commercial Projects under Development
Source: Company, ICICI Direct Research
Exhibit 36: The Orb and Business Centre to be leased from
FY20E
0.37
0.87 0.87 0.87
0.00
0.20
0.40
0.60
0.80
1.00
FY18 FY19 FY20E FY21E
million s
q. ft
Leasable area Leased area
Source: Company, ICICI Direct Research
Exhibit 37: Revenues from C&R segment to grow at 56%
CAGR over FY19-21E
23 24
39
67
95
90%92%
40%
65%
88%
0%
20%
40%
60%
80%
100%
0
20
40
60
80
100
FY17 FY18 FY19 FY20E FY21E
%
| crore
Revenues (| crore) Occupancy (%)
Source: Company, ICICI Direct Research
Exhibit 38: Share of C&R division to grow to 8.4% of revenues (ex real estate)
0%
20%
40%
60%
80%
100%
FY16 FY17 FY18 FY19 FY20E FY21E
Hospitality Commercial & Retail
Source: Company, ICICI Direct Research

ICICI Securities | Retail Research 17
ICICI Direct Research
Initiating Coverage | Chalet Hotels
Most profitable player in industry
None of the hotels owned by Chalet are managed by itself. It signs
management contract agreements with third parties to manage their hotels
and pays fees for the same that add up to ~8%-9% of total revenues.
Further, for a better performance, the company follows an active asset
management model where Chalet engages with the hotel management team
at each hotel to discuss budgeting, cost management initiatives and
operational & financial targets. The company also reviews the performance
of each hotel, conducts periodic meeting with the hotel management team,
holds discussion on pricing, renovation, etc. Chalet also optimises its
employee costs, which is among the biggest fixed costs of any hotel
company. The staff per room at the company’s hotels managed by third
parties at its luxury upper upscale and upscale properties as on March 31,
2017, were at 1.25 and 1.38, respectively, while the same for the industry
was at ~2 employees per room. Thus, owing to the above and despite not
having any management contract income, Chalet has been reporting highest
EBITDA margins among its listed peers.
Exhibit 39: Industry leader in terms of EBITDA margins
-
5.0
10.0
15.0
20.0
25.0
30.0
35.0
40.0
FY16 FY17 FY18 FY19 FY20E FY21E
(%
)
Chalet Hotels Indian Hotels EIH Limited TajGVK Hotels & Resorts
Source: Company, ICICI Direct Research
Exhibit 40: RoCE to improve over the coming years
12.5
7.0
8.9
10.010.9
0.0
2.0
4.0
6.0
8.0
10.0
12.0
14.0
FY17 FY18 FY19 FY20E FY21E
%
RoCE
RoCE
Includes significant non-recurring income
Source: Company, ICICI Direct Research
Exhibit 41: Industry best margins trend to continue
30.1
30.8
32.3
35.5
36.9
25.0
27.0
29.0
31.0
33.0
35.0
37.0
39.0
FY17 FY18 FY19 FY20E FY21E
%
EBITDA margins
Source: Company, ICICI Direct Research

ICICI Securities | Retail Research 18
ICICI Direct Research
Initiating Coverage | Chalet Hotels
Exhibit 42: Industry Tailwinds & Company Strength
Source: Company, ICICI Direct Research
Balance sheet to strengthen led by improving cash flows
From the IPO proceeds received in February, the company reduced its debt
significantly by cutting down on some of its long term as well as foreign
currency debt (thus reducing forex risk). The company repaid ~| 1370 crore
of debt during the year, and the foreign currency borrowing has reduced
significantly from $75.85 million as at the end of FY18 to $26.11 million by
the end of FY19. With these repayments, the Debt/EBITDA and D/E have
reduced to 4.8x and 1.1x, respectively, by the end of FY19. Going ahead,
Chalet would be spending ~| 1250 crore in the next two years to fund the
ongoing expansions of its hospitality and commercial assets. Higher cash
flows from the already operational properties and leasing out of Business
Centre Sahar & The Orb, are expected to result in an EBITDA CAGR of 15%
over FY19-21E. This is expected to lead to a reduction in debt/EBITDA further
to 4.5x by FY21E despite total debt rising from | 1546 crore in FY19 to ~|
1900 crore in FY21E.
Exhibit 43: D/E to remain stable over the next two years
5.6 5.5
1.1 1.0 1.1
0.0
1.0
2.0
3.0
4.0
5.0
6.0
7.0
FY17 FY18 FY19 FY20E FY21E
(x
)
Debt / Equity (x)
Source: Company, ICICI Direct Research
Exhibit 44: Debt/EBITDA set to improve led by ramp-up of
commercial & retail assets
12.4
11.1
4.84.2 4.5
0.0
2.0
4.0
6.0
8.0
10.0
12.0
14.0
FY17 FY18 FY19 FY20E FY21E
(x
)
Debt / EBITDA (x)
Source: Company, ICICI Direct Research

ICICI Securities | Retail Research 19
ICICI Direct Research
Initiating Coverage | Chalet Hotels
Ownership Summary
Exhibit 45: Top 10 Shareholders
Rank Name Last filing date % O/S Position (m) Change (m)
1 Casa Maria Properties L.L.P 30-Jun-19 8% 16.5 0.00
2 Raghukool Estate Development L.L.P. 30-Jun-19 8% 16.5 0.00
3 Capstan Trading L.L.P 30-Jun-19 8% 16.5 0.00
4 K Raheja Corporation 30-Jun-19 8% 16.2 0.00
5 Touchstone Properties and Hotels Pvt. Ltd. 30-Jun-19 7% 14.5 0.00
6 Cape Trading L.L.P 30-Jun-19 6% 13.1 0.00
7 Anbee Construction L.L.P. 30-Jun-19 6% 13.1 0.00
8 Ivory Properties & Hotels Pvt. Ltd. 30-Jun-19 6% 11.4 0.00
9 Reliance Nippon Life Asset Management Ltd 30-Jun-19 5% 11.2 0.47
10 Raheja (Neel Chandru) 30-Jun-19 5% 10.3 0.00
Source: Company, ICICI Direct Research, Thomson Reuters
Exhibit 46: Recent Activity
Investor NameValue
($mn)
Shares
(mn)
Investor NameValue
($mn)
Shares
(mn)
Reliance Nippon Life Asset Management Limited 2.15 0.47 Macquarie Funds Management Hong Kong Ltd. -0.73 -0.16
UTI Asset Management Co. Ltd. 1.00 0.22 SBI Funds Management Pvt. Ltd. -0.39 -0.08
Kuwait Investment Authority 0.92 0.20
FIL Investment Management (Australia) Limited 0.49 0.11
Fidelity International Asset Management Company (Korea) 0.30 0.06
Buys Sells
Source: Company, ICICI Direct Research, Thomson Reuters
Exhibit 47:
(in %) Feb-19 Mar-19 Jun-19 Sep-19
Promoter 71.41 71.41 71.41 71.41
FII 11.46 10.05 9.82 9.42
DII 10.99 15.87 16.08 17.69
Others 6.14 2.67 2.69 1.48
Source: Company, ICICI Direct Research

ICICI Securities | Retail Research 20
ICICI Direct Research
Initiating Coverage | Chalet Hotels
Risks & Concerns
Geographical concentration
A significant portion of the company’s revenues are derived from hotels
concentrated in a few geographical regions. Any adverse developments
impacting such hotels or regions could have an adverse effect on the
company’s business and operations.
Economic risks
The company operates in the luxury-upper upscale and upscale hotel
segments in India where the demand from business and MICE travelers is
highly dependent on the general economic performance in India. There has
been a history of rise and decline in demand for hotel rooms, in occupancy
levels and rates realized by owners and operators of hotels through
macroeconomic cycles. Variability of results through some of the cycles in
the past has been more severe due to changes in supply of hotel rooms.
Any future slowdown in economic growth could affect business and
personal discretionary spending levels, and lead to a decline in demand.
Relationship with hotel operators, leading hospitality brands
The company utilizes the brands of hotel operators and brand licensor to
operate and market the hotels. The company’s hotels are generally obliged
to pay periodic management fees, royalty fees, fees for technical services
and reimbursements for advertisement, marketing, promotion, sales &
software, among others. These payments to hotel operators and brand
licensors are based on a fixed percentage of gross revenue of the hotel as
well as a portion of gross operational profits, subject to certain exclusions
and adjustments. Any revision in the terms putting Chalet Hotels at a
disadvantage could severely impact the business. Also all the hotels
currently are managed by a single entity, Marriott International (along with
its affiliates). Deterioration in the relation with the entity or non-renewal of
contracts could have an impact on our estimates
Competition
Chalet operates in a highly competitive industry with success dependent on
its ability to compete on various factors such as attractiveness and quality
of its offerings, quality of accommodation, food & beverage, location, service
levels and amenities, together with the brand reputation of its brand
licensors. The company may also have to compete with any new hotel
properties that commence operations in the market in which it operates or
intend to commence operations.
Litigation of Bengaluru Residential Project
The company owns a property situated at Koramangala Industrial Layout,
Bengaluru where the company is developing a residential complex. While,
the project had received NOC from Hindustan Aeronautics Limited in 2011,
the same was cancelled in August 2013. Chalet Hotels filed a writ petition
before the Karnataka High Court challenging the same; the project continues
to remain under litigation. The company had already impaired the project by
~| 35 crore and also has made provisions for alterations (| 25 crore) and
refund/ compensation to the home buyers (~| 42 crore). To meet any costs,
expenses or liabilities towards the project, the promoters have subscribed
to 20000 non-cumulative non-convertible preference shares of ~| 1,00,000
each, aggregating to | 200 crore. Any fund requirement over this amount
would also be funded by the promoters in the future, if required. An adverse
order from the Karnataka High Court or penalties under RERA for non-
compliance could affect the company’s business and reputation.

ICICI Securities | Retail Research 21
ICICI Direct Research
Initiating Coverage | Chalet Hotels
Litigation of Vashi hotel land
The land where Chalet Hotels operates the Vashi, Navi Mumbai Hotel is a
leasehold land, allotted to K. Raheja Corp Private Limited (KRCPL) by CIDCO.
The allotment of land has been challenged by two public interest litigations
filed with the Bombay High Court, whereby the allotment was held illegal
and directed KRCPL to hand over the vacant possession of land to CIDCO.
KRCPL has filed a special leave petition with the Supreme Court and the
court has asked the parties to maintain status-quo and the SLP is currently
pending before the Supreme Court. The hotel has 152 rooms, ~7% of the
total rooms and has been operating at a healthy occupancy of above 85%
since 3 years and reporting a healthy performance. The carrying value of the
leasehold rights (already paid for) and hotel assets as on 31st March 2019
stood at ~| 50 crore. While we have assumed normalcy, adverse order by
the Supreme Court directing demolition of the hotel and handing over
possession of the premises to CIDCO could negatively impact our estimates.

ICICI Securities | Retail Research 22
ICICI Direct Research
Initiating Coverage | Chalet Hotels
Valuation & Outlook
Chalet Hotels has a strong presence in dense business districts with assets
strategically located in core business districts in the respective micro-
markets. Mumbai and Hyderabad are expected to see scarce growth in room
supply, which should augur well for occupancies and, hence, ARRs. Further,
association with leading hospitality player to manage its properties
combined with real estate expertise in selection of location and cost effective
construction will enable the company in achieving industry best returns and
profitability. Recent announcement of GST rate revision for hotels, is a shot
in the arm for the hospitality industry. Additionally, corporate tax cuts would
also help Chalet Hotels, as the company’s properties are located in major
business districts and corporate clients form a significant chunk of the total
revenue pie.
Debt, which was a concern, has been sliced significantly from internal
accruals and the proceeds from fresh issue of equity shares. The company
raised | 950 crore via IPO and utilized most proceeds to reduce its total debt,
thus slicing its debt/EBITDA from 11.1x in FY18 to 4.8x in FY19, which is
further expected to come down to 4.5x by FY21E despite capacity addition
plans. While improvement in profitability and debt coverage is expected, the
current hospitality portfolio has a limited room for growth. The current
pipeline of hotel and commercial assets should be the major growth triggers
going ahead, but are expected to start contributing to the company’s
performance from FY22E only. As the company is under the capex mode
we foresee limited upside and assign a HOLD rating to the company valuing
it at EV/EBITDA multiple of 21x on FY21E earnings. Thus we arrive at a target
price of | 350/share, implying an EV/room of ~| 4 crore.

ICICI Securities | Retail Research 23
ICICI Direct Research
Initiating Coverage | Chalet Hotels
Financial Summary
Exhibit 48: Profit & Loss Statement
(Year-end March) FY18 FY19 FY20E FY21E
Total operating Income 796 987 1052 1146
Growth (%) 12.7 24.1 6.6 8.9
Raw Material Expenses 76 137 144 154
Employee Expenses 128 145 156 169
Other Exp 347 386 378 400
Total Operating Expenditure 551 668 678 723
EBITDA 245 319 374 423
Growth (%) 15.3 30.4 17.2 13.1
Depreciation 112 115 136 136
Interest 212 266 139 119
Other Income 55.7 47.6 45.0 45.0
PBT -23.1 -14.3 143.5 212.9
Others -122 -4 0 0
Total Tax -52 -11 0 0
Reported PAT -93 -8 144 213
Adjusted PAT -15 -6 144 213
Growth (%) NA NA NA 48.3
EPS (|) -4.5 -0.4 7.0 10.4
Source: Company, ICICI Direct Research
Exhibit 49: Cash Flow Statement
(Year-end March) FY18 FY19 FY20E FY21E
Profit after Tax -92.9 -7.6 143.5 212.9
Add: Depreciation 111.6 115.4 136.4 136.1
(Inc)/dec in Current Assets 89.3 -76.4 -13.1 -6.1
Inc/(dec) in CL and Provisions -127.5 125.8 -15.1 10.6
CF from operating activities 76.5 331.9 345.9 427.6
(Inc)/dec in Investments 15.5 25.5 -216.2 -545.9
(Inc)/dec in Fixed Assets -62.1 -43.6 -55.3 -51.1
Others -78.1 233.7 3.8 -4.6
CF from investing activities -124.7 215.7 -267.7 -601.5
Issue/(Buy back) of Shares 117.2 937.5 -33.9 0.0
Inc/(dec) in loan funds 89.4 -1179.3 43.2 310.0
Dividend paid & dividend tax 0.0 0.0 0.0 0.0
Others -211.9 -265.7 -139.1 -119.2
CF from financing activities -5.2 -507.4 -129.8 190.8
Net Cash flow -1.5 51.0 -51.6 16.9
Opening Cash 33.2 31.7 82.6 31.0
Closing Cash 31.7 82.6 31.0 47.9
Source: Company, ICICI Direct Research
Exhibit 50: Balance Sheet
(Year-end March) FY18 FY19 FY20E FY21E
Liabilities
Equity Capital 171 205 171 171
Reserve and Surplus 324 1218 1361 1574
Total Shareholders funds 496 1425 1535 1748
Total Debt 2725 1546 1589 1899
Deferred Tax Liability 64 29 29 29
Minority Interest / Others 22 41 46 51
Total Liabilities 3306 3042 3199 3727
Assets
Gross Block 3558 3566 3725 4134
Less: Acc Depreciation 763 836 951 1067
Net Bloack 2795 2730 2773 3067
CWIP 22 34 151 342
Total Fixed Assets 2817 2764 2924 3409
Intangibles 24 23 22 21
Investments 9 10 10 10
Inventory 312 395 402 403
Debtors 55 48 55 60
Loans and Advances 235 2 2 2
Other Current Assets 72 72 68 73
Cash 32 83 31 48
Total Current Assets 706 599 557 585
Creditors 86 122 115 123
Provisions & Others 324 397 383 381
Total Current Liabilities 410 518 498 504
Net Current Assets 296 81 59 81
Others Assets 160 163 185 207
Application of Funds 3306 3042 3199 3727
Source: Company, ICICI Direct Research
Exhibit 51: Key Ratios
(Year-end March) FY18 FY19 FY20E FY21E
Per share data (|)
EPS -0.7 -0.3 7.0 10.4
Cash EPS 0.9 5.3 13.7 17.0
BV 24.2 69.4 74.7 85.1
DPS 0.0 0.0 0.0 0.0
Cash Per Share 1.5 4.0 1.5 2.4
Operating Ratios (%)
EBITDA Margin 30.8 32.3 35.5 37.0
EBIT Margin 23.7 25.5 26.9 29.0
PAT Margin -11.7 -0.8 13.6 18.6
Inventory days 169 131 138 128
Debtor days 19 19 18 18
Creditor days 39 38 41 38
Return Ratios (%)
RoE -19.2 -0.8 9.7 13.0
RoCE 7.0 8.9 10.0 10.9
RoIC 7.3 8.2 9.4 11.1
Valuation Ratios (x)
P/E NM NM 48.6 32.7
EV / EBITDA 39.5 26.4 22.8 20.8
EV / Net Sales 12.1 8.5 8.1 7.7
Market Cap / Sales 8.8 7.1 6.6 6.1
Price to Book Value 14.1 4.9 4.5 4.0
Solvency Ratios
Debt/EBITDA 11.1 4.8 4.2 4.5
Debt / Equity 5.5 1.1 1.0 1.1
Current Ratio 0.8 0.8 0.6 0.6
Quick Ratio 0.4 0.3 0.2 0.2
Source: Company, ICICI Direct Research

ICIC
I S
ecurit
ies –
Retail E
quit
y R
esearch
Init
iatin
g C
overage
October 24, 2019
CMP: | 58 Target: | 73 (25%) Target Period: 12 months
Lemon Tree Hotels (LEMTRE)
BUY
Leader in mid-market category upping its game
Lemon Tree Hotels is predominantly a midscale hotel player with a presence
in the economy and upper midscale as well. The company’s current
inventory of 5970 rooms (owned/leased and managed) is spread across 58
hotels in 35 cities. With ~11.8% share in the mid-market category, Lemon
Tree aims to consolidate a significant room inventory in the unbranded
category into the branded segment. The company plans to add rooms in the
upper-midscale (Lemon Tree Premier) and would also be entering the
upscale category in Mumbai and Udaipur with its new brand Aurika. While
the ongoing room addition plans (owned rooms) would require the
company to raise debt, it has also been leveraging its brand and adding
more rooms via management contracts (from 1841 rooms in FY19 to 4803
rooms by FY22E). With higher profitability, going ahead, led by management
contract and addition of upper-midscale and upscale hotels, debt/EBITDA is
expected to improve from 7.1x in FY19 to 5.1x by FY21E. We initiate
coverage on Lemon Tree with a BUY rating and target price of | 73.
Room inventory to cross 10000 mark by FY22E
Currently, Lemon Tree Hotels has a portfolio of 5970 rooms (owned/leased
and managed) across economy, midscale and upper-midscale. Over the
next three years, the company would be adding over 4680 rooms with a mix
of owned and management contract (Refer exhibit 57). With increasing share
of upper-midscale and upscale hotels, we expect ARRs to grow at 10.5%
CAGR in FY19-21E. Thus, we expect revenues to grow to | 940 crore by
FY21E, at a CAGR of 31% over FY19-21E.
Addition of high-end properties to further strengthen margins
Lemon Tree Hotels has a better cost structure than the industry with
operating costs being ~20% lower than the comparable peers in the
respective segment (Refer Exhibit 73). Additionally, out of the current
portfolio of owned & leased hotels, over ten hotels have been operational
for less than three years. Post stabilisation, these are expected to exhibit
strong improvement in RevPARs (Refer Exhibit 70, 72). With entry into the
dense markets of Mumbai with upper-midscale property and in the upscale
segment (Aurika MIAL, Aurika Udaipur), ARRs of the company are expected
to increase significantly from FY21E. Also, management contract income
will provide an additional fillip to profitability and returns. Hence, over FY19-
21E, we expect EBITDA to grow at 39% CAGR to | 326 crore.
Valuations & Outlook
The hospitality industry to continue to witness uptrend on the back of
improving demand, limited capacity addition and the government’s thrust
to boost tourism. Lemon Tree with its widespread portfolio is well poised to
benefit from the improving industry scenario. Though debt is expected to
pile up owing to addition of new properties, leverage concerns remain low
as significant debt repayment is expected to commence post completion of
the company’s capex cycle. We initiate coverage on the company with a
BUY rating and a target price of | 73.
Key Financial Summary
Key Financials FY17 FY18 FY19 FY20E FY21E CAGR (FY19-21E)
Net Sales 412 484 550 786 940 30.8%
EBITDA 116 136 169 263 326 39.1%
EBITDA (%) 28.3 28.1 30.7 33.5 34.7
PAT (Adj) -5.1 14.6 56.4 73.4 100.2 33.3%
EPS (|) -0.1 0.2 0.7 0.9 1.3
EV/EBITDA 46.3 41.1 34.2 23.4 18.7
RoNW (%) -0.6 1.8 6.7 8.1 10.1
RoCE (%) 3.9 4.6 5.5 6.8 7.8
Source: ICICI Direct Research, Company
Stock Data
Particulars Amount
Market Capitalization (| crore) 4609
Debt (FY19) (| crore) 1196
Cash & Investment (FY19) (| crore) 60
EV (| crore) 5774
52 week H/L | 89/47
Equity Capital (FY19) (| crore) 789
Face Value | 10
Price Chart
0
5,000
10,000
15,000
0
20
40
60
80
100
Oct-19
Jul-19
Apr-19
Jan-19
Oct-18
Jul-18
Apr-18
Jan-18
Oct-17
Aug-17
May-17
Feb-17
Nov-16
Price (R.H.S) Nifty (L.H.S)c
Key Highlights
Lemon Tree to add in excess of 4820
rooms over next three years
Keys Hotels acquisition to be
completed in H2FY20E
Stepping into upscale category and
also into student housing and co-living
Debt coverage to improve led by
stabilisation of hotels
Initiate coverage with BUY rating and
target price of | 73 per share
Research Analyst
Rashesh Shah
Romil Mehta

ICICI Securities | Retail Research 25
ICICI Direct Research
Initiating Coverage | Lemon Tree Hotels
Company Background
Exhibit 52: Lemon Tree History
Source: Company, ICICI Direct Research
Exhibit 53: Group ownership structure
Source: Company, ICICI Direct Research
Exhibit 54: Hotel inventory by segment and Lemon Tree brand position
Source: Company, ICICI Direct Research
Company aims to target unbranded 2 million rooms
and bring them into the branded space

ICICI Securities | Retail Research 26
ICICI Direct Research
Initiating Coverage | Lemon Tree Hotels
Inventory growth and current portfolio
Exhibit 55: Lemon Tree current portfolio of hotels
Brand Rooms Hotels
Lemon Tree Premier 2142 15
Lemon Tree Hotels 2506 33
Red Fox Hotels 1322 11
Total 5970 59
Source: Company, ICICI Direct Research
Exhibit 56: Added rooms at 17.9% CAGR in FY15-19
2801
3249
3698
4870
5411
0
1000
2000
3000
4000
5000
6000
FY15 FY16 FY17 FY18 FY19
Total Rooms
Source: Company, ICICI Direct Research
Key Managerial Person and Senior Management
Patanjali Govind Keswani – Chairman and Managing Director
Mr Keswani has a bachelor’s degree in electrical engineering from the Indian
Institute of Technology, New Delhi and a post-graduate diploma degree in
management from the Indian Institute of Management, Calcutta. He was a
Tata Administrative Services Officer and associated with the Taj Group of
hotels for 17 years, including as the SVP (special projects). Mr Keswani was
also associated with AT Kearney Ltd, New Delhi as its associated consultant
and director. At present, he is also the chairman of the Skill Council for
Persons with Disability and a founding member of the Sector Skill Council
for the hospitality, travel and tourism industry.
Rattan Keswani – Deputy Managing Director
Mr Keswani has a Bachelor’s degree in electrical engineering from Indian
Institute of Technology, New Delhi. He also has a postgraduate diploma
degree in management from Indian Institute of Management, Calcutta. He
was a Tata Administrative Services officer & Associated with Taj Group of
Hotels for 17 years, including SVP (Special Projects). He has also worked
with AT Kearney, New Delhi as its associate consultant and director.
Vikramjit Singh – President
Mr Singh has a Bachelor’s degree in Commerce from the University of Delhi
and a postgraduate diploma degree in Hotel Management and
Administration from the Taj Group of Hotels. He was appointed the Chief
Sales Officer with effect from May 21, 2014. Prior to this, he was an
entrepreneur. He has 21 years of experience in the hospitality industry.
Kapil Sharma – CFO
Mr Sharma has a Bachelor’s degree in Commerce from the University of
Delhi and is a qualified Chartered Accountant. He was appointed as the DGM
(Finance) with effect from December 1, 2004 and was designated as the CFO
with effect from September 18, 2014. Prior to this, he was with Leroy Somer
& Controls India Pvt Ltd as the head of Finance and Accounts and managed
the finance and accounts division with commercial responsibilities. He has
previously also worked with AFL Ltd as its Assistant Manager (finance) and
with Onida Finance Ltd as its manager. He has more than 22 years of
experience in the field of finance.
ICICI Securities | Retail Research 27
ICICI Direct Research
Initiating Coverage | Lemon Tree Hotels
Davander Tomar - Executive Vice-President, Corporate Affairs
Mr Tomar, age 56 years, has a Bachelor’s degree in Commerce from the
University of Delhi, a Bachelor’s degree in Law from the University of Delhi
along with a master’s degree in arts from the University of Delhi. He was
appointed the vice president, security and administration with effect from
September 25, 2002. He has previously also worked with Taj Group of Hotels
as the security manager of Taj Palace Hotel, New Delhi for 18 years. He has
over 30 years of experience in the hospitality industry.
JK Chawla – Executive VP Projects & Engineering Services
Mr Chawla has a diploma degree in electrical engineering from Pusa
Polytechnic, New Delhi. He was appointed the VP– Projects and Engineering
with effect from November 2002. Prior to this, he was with the Taj Group of
Hotels for 20 years. He has previously also worked with NTPC, Bharti Electric
Steel Company Ltd and Mother Dairy while holding various positions. He
has more than 40 years of experience in the field of engineering,
constructions and operations.

ICICI Securities | Retail Research 28
ICICI Direct Research
Initiating Coverage | Lemon Tree Hotels
Investment Rationale
Acquisition fuels strong pipeline of rooms
Lemon Tree, which currently has a portfolio of 5970 rooms (as of October
2019), would be adding ~4680 rooms both owned/leased and management
contract over 49 hotels in the next three years taking total count to 10651
rooms and 107 hotels. Out of the 4680 rooms to be added, 2962 would be
added under management contract, taking total rooms under management
contracts to 45% of the entire room portfolio. Further, the company, via its
subsidiary would be acquiring 100% stake in Berggruen Hotels Pvt Ltd,
which owns and manages 1910 rooms under the Keys brand (Refer Exhibit
60) for an EV of | 605 crore (debt - | 134 crore). The company launched its
303 room Lemon Tree Premier Mumbai Hotel that started operations from
Q2FY20 and Lemon Tree Premier, Kolkata a 142 room hotel has been
opened for guests from mid-October 2019. The company is also entering
the upscale segment and would be setting up two hotels under its new brand
“Aurika”, one each in Mumbai and Udaipur, totalling to 716 rooms (the
company is in the process of converting some commercial spaces, which
would further add 92 rooms to the Aurika Mumbai inventory). Lemon Tree
Hotels is expected to end FY22 with an owned/leased room inventory of
5848 rooms (Refer exhibit 64)
Exhibit 57: Total room portfolio to cross 10000 rooms
28013249
3689
48705411
8637
982010651
-500
1000
2500
4000
5500
7000
8500
10000
11500
13000
FY15 FY16 FY17 FY18 FY19 FY20E FY21E FY22E
Owned Leased Managed
Source: Company, ICICI Direct Research
Exhibit 58: Owned/leased rooms inventory to increase at
17.9% CAGR over FY19-22E
25272788 2855
32773570
5192 5192
5848
0
1000
2000
3000
4000
5000
6000
7000
FY15 FY16 FY17 FY18 FY19 FY20E FY21E FY22E
Number of rooms
Source: Company, ICICI Direct Research
Exhibit 59: Managed rooms to grow to 4803 rooms at a CAGR
of 37.7% over FY19-22E
274461
843
15931841
3445
46284803
0
1000
2000
3000
4000
5000
6000
FY15 FY16 FY17 FY18 FY19 FY20E FY21E FY22E
Number of rooms
Source: Company, ICICI Direct Research
Aurika, Udaipur
Aurika, MIAL (Representative Image)
Aurika, MIAL (Under construction)

ICICI Securities | Retail Research 29
ICICI Direct Research
Initiating Coverage | Lemon Tree Hotels
Exhibit 60: Keys brand to be used to consolidate unbranded hotel market
Keys Hotels
1910 rooms
(EV - | 605 crore)
Management contract -
974 rooms (14 cities)
Owned/Leased - 936 rooms
(6 cities)
Source: Company, ICICI Direct Research
Exhibit 61: Snapshot of room portfolio post current addition plans
Source: Company, ICICI Direct Research
Lemon Tree Premier, Kolkata
Lemon Tree Mountain Resort, Shimla
(Representative Image)
Lemon Tree Mountain Resort, Shimla (Under-
construction)
LTP Kolkata started operations in mid-October,
thus the current portfolio of LTP increases to 2142
rooms over 14 hotels and the pipeline reduces by
142 rooms and 1 hotel

ICICI Securities | Retail Research 30
ICICI Direct Research
Initiating Coverage | Lemon Tree Hotels
Exhibit 62: Strong management contract pipeline (excluding Keys portfolio)
Source: Company, ICICI Direct Research
Exhibit 63: Lemon Tree to have presence in more than 68 cities
Source: Company, ICICI Direct Research

ICICI Securities | Retail Research 31
ICICI Direct Research
Initiating Coverage | Lemon Tree Hotels
Enters student housing, co-living; partners with Warburg Pincus
Lemon Tree has had a very strong relationship with Warburg Pincus, since
the initial fund raising from the latter in 2006. With the fund’s life coming to
an end, Warburg Pincus sold its entire stake in the company. In December
2018, Lemon Tree signed an agreement for a JV with Warburg Pincus, to
enter the business of students housing and co-living, with Warburg Pincus
owning 70% stake in the JV. Lemon Tree would be holding 29% stake while
the balance would be held by Patanjali Keswani. The management expects
this segment to open up huge opportunities for growth. The JV would entail
total investment of ~| 3000 crore in the next 10 years in two phases. In the
initial stages, properties would be added through long term lease while the
management expects to set up 10000 beds in FY20 itself. These properties
would be under the Lemon Tree brand for which the company would be
charging fees to the JV, which will help the company generate additional
revenues over and above the share of profits from the JV. Since the
developments are at a nascent stage, we do not factor in any revenues from
this segment in our estimates.
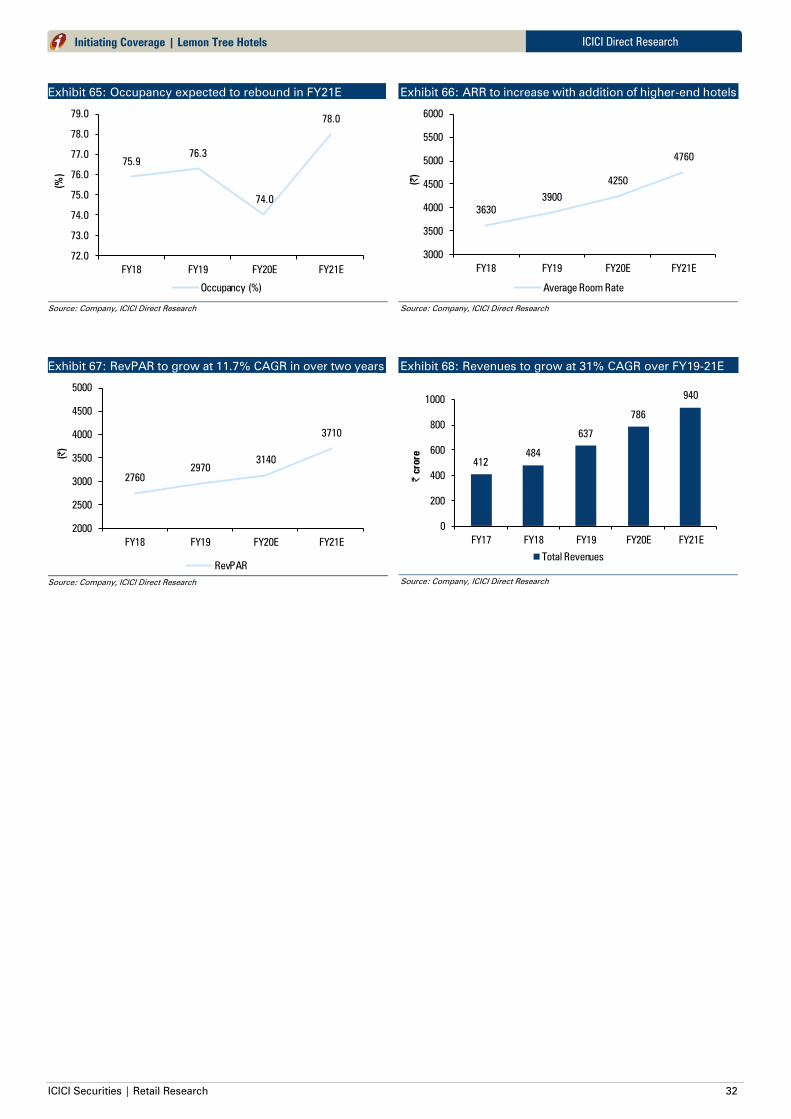
Revenues to clock 31% CAGR led by inventory addition
During FY20E, Lemon Tree’s portfolio of owned/leased rooms will increase
by 686 rooms over FY19 (In addition to Key Hotels portfolio), with most
hotels being in the upper-midscale and upscale segment, and one being in
the economy segment. Additionally, Keys Hotels’ portfolio is also expected
to be consolidated into the Lemon Tree group in H2FY20E. Keys Hotels
clocked revenues of | 87 crore in FY19. We expect Keys portfolio to cross
| 120 crore in crore by FY21E. Led by additional inventory, improved
RevPAR in existing hotels and higher ARRs in properties being added in
FY20E, Lemon Tree’s revenues are expected to grow at 31% CAGR over
FY19-21E to | 940 crore.
Exhibit 64: Owned/Leased hotel addition plans
Name/Location Rooms Expected opening Ownership (%)
End of FY19 3570
Addition during FY20:
LTP, Mumbai 303 Operational 58%
LTP, Kolkata 142 Operational 58%
RFH, Chandigarh 102 Operational Leased
Aurika, Udaipur 139 Oct-19/Nov-19 58%
Total addition (Ex-Keys) 686
Keys Hotels Inventory 936
End of FY20E 5192
Additions post FY20:
LT Mountain Resort, Shimla 69 Apr-21 100%
LT Vembanad Lake Resort, Alleppy, Kerala 10 Oct-21 100%
Aurika, MIAL 577 Nov-21 58%
Total Room addition 656
Total rooms by end of FY22 5848
Source: Company, ICICI Direct Research
Lemon Tree has applied to convert some commercial
spaces in Aurika, MIAL hotel to rooms. This will
increase the hotel’s inventory by 92 rooms to 669
and total inventory would reach 5940 rooms
Lemon Tree would consolidate Keys Hotels under its
own network. The target segment would be the mid
and economy segments. Expect improvement in
margins of Keys with improved RevPARs (owing to
improved presence through Lemon Tree’s existing
network) and lower corporate expenses
For 937 rooms (Kolkata, Shimla, Kerala, Aurika MIAL
and Aurika Udaipur) the company has estimated a
total capex of ~| 1250 crore, out of which it had
already spent | 635 crore as on 30th June 2019)
ICICI Securities | Retail Research 32
ICICI Direct Research
Initiating Coverage | Lemon Tree Hotels
Exhibit 65: Occupancy expected to rebound in FY21E
75.9
76.3
74.0
78.0
72.0
73.0
74.0
75.0
76.0
77.0
78.0
79.0
FY18 FY19 FY20E FY21E
(%
)
Occupancy (%)
Source: Company, ICICI Direct Research
Exhibit 66: ARR to increase with addition of higher-end hotels
3630
3900
4250
4760
3000
3500
4000
4500
5000
5500
6000
FY18 FY19 FY20E FY21E
(|)
Average Room Rate
Source: Company, ICICI Direct Research
Exhibit 67: RevPAR to grow at 11.7% CAGR in over two years
2760
2970
3140
3710
2000
2500
3000
3500
4000
4500
5000
FY18 FY19 FY20E FY21E
(|)
RevPAR
Source: Company, ICICI Direct Research
Exhibit 68: Revenues to grow at 31% CAGR over FY19-21E
412
484
637
786
940
0
200
400
600
800
1000
FY17 FY18 FY19 FY20E FY21E
| crore
Total Revenues
Source: Company, ICICI Direct Research

ICICI Securities | Retail Research 33
ICICI Direct Research
Initiating Coverage | Lemon Tree Hotels
EBITDA margins to continue to remain strong
Typically, a hotel property takes one to one and a half years to break even
at the EBITDA level and additional one and a half to two years to achieve
profit before tax (PBT) breakeven. Thus, stabilisation of a hotel property
takes about three years to stabilise, post which the RevPARs also start
showing significant improvement. Currently ~35% of the owned/leased
room portfolio of Lemon Tree has been operational for less than three years.
Historically, Lemon Tree’s hotels have shown strong improvement in its
profitability post stabilisation (Refer Exhibit 70). Additionally, management
contract revenues for Lemon Tree are expected to see a bump-up, as it has
a strong pipeline of rooms underway (Refer Exhibit 62, 75). Furthermore,
Lemon Tree’s operational costs are among the lowest in the industry
supported by several measures (Refer Exhibit 73). Thus, we expect EBITDA
margins to improve ~400 bps in FY19-21E to 34.7% led by stabilisation of
the current portfolio coupled with rising management contract revenues and
entry into dense markets with upper-midscale properties, leading to an
EBITDA growth of 39% CAGR over FY19-FY21E to | 326 crore.
Exhibit 69: Performance of hotels operating at different stages (Adult vs. Toddler vs. Infant)
Source: Company, ICICI Direct Research
Exhibit 70: Aggregate progression of four latest adult hotels
Source: Company, ICICI Direct Research
Exhibit 71: EBITDA margins to continue uptrend
116136
169
263
326
28.3 28.1
30.7
33.5
34.7
20
22
24
26
28
30
32
34
36
0
50
100
150
200
250
300
350
FY17 FY18 FY19 FY20E FY21E
(%
)
(| crore)
EBITDA (LHS) EBITDA margins (RHS)
Source: Company, ICICI Direct Research

ICICI Securities | Retail Research 34
ICICI Direct Research
Initiating Coverage | Lemon Tree Hotels
Exhibit 72: Progression of recent four hotels from infant to adult stage
Source: Company, ICICI Direct Research
Exhibit 73: Operating cost vs. Peers
Source: Company, ICICI Direct Research
Exhibit 74: Profitability movement of upper-midscale, midscale and economy hotels
1.2
1.3
1.3
1.5 1.5
1.0
1.2
1.3 1.3 1.3
1.3
1.3
1.5
1.6 1.6
1.0
1.1
1.2
1.3
1.4
1.5
1.6
1.7
FY15 FY16 FY17 FY18 FY19
(x
)
RevPAR to Operating costs per room ratio
Lemon Tree Premier Lemon Tree Hotels Red Fox Hotels
Source: Company, ICICI Direct Research

ICICI Securities | Retail Research 35
ICICI Direct Research
Initiating Coverage | Lemon Tree Hotels
Asset-light model to reduce leverage, improve return ratios
Lemon Tree intends to follow the asset light path to growth. Thus, with
stabilisation of its properties, the company transfers the ownership of the
hotel to its subsidiary Fleur Hotels, where the company owns ~58%. Thus
effectively, it encashes the remaining 42% stake. It would be transferring its
LTP Mumbai property to Fleur hotels. Further, to fund the acquisition of Keys
Hotels, the transfer of Mumbai Property would be considered capital
infusion (selling of 42% of the stake in LTP Mumbai)) along with subscription
to compulsorily convertible preference shares of Fleur Hotels for | 61 crore.
Similarly, upcoming hotels under the Aurika brand (Mumbai, Udaipur) and
the LTP Kolkata properties would also be transferred to Fleur Hotels. Also,
the company is adding more rooms under the management contract route,
leveraging its brand, thus improving its profitability and returns.
Exhibit 75: Rooms under management contract (% of total room portfolio) rising
1014
2333 34
4047 45
9086
7767 66
6053 55
0%
20%
40%
60%
80%
100%
FY15 FY16 FY17 FY18 FY19 FY20E FY21E FY22E
Managed Owned & Leased
Source: Company, ICICI Direct Research
Exhibit 76: Return ratios to improve, going ahead
1.8
6.7
8.1
10.3
4.6
5.5
6.8
7.6
0.0
2.0
4.0
6.0
8.0
10.0
12.0
0.0
2.0
4.0
6.0
8.0
10.0
12.0
FY18 FY19 FY20E FY21E
(%
)
(%
)
RoE (LHS) RoCE (RHS)
Source: Company, ICICI Direct Research
Exhibit 77: Coverage improving despite rising debt
1011
1196
1564
1674
7.47.1
5.9
5.1
0.0
1.0
2.0
3.0
4.0
5.0
6.0
7.0
8.0
0
200
400
600
800
1000
1200
1400
1600
1800
FY18 FY19 FY20E FY21E
(%
)
(| crore)
Total Debt (LHS) Debt/EBITDA (RHS)
Source: Company, ICICI Direct Research
Lemon Tree to have 10,651 rooms in its portfolio
spread across 107 hotels with 4,803 rooms under
management contracts by FY22

ICICI Securities | Retail Research 36
ICICI Direct Research
Initiating Coverage | Lemon Tree Hotels
Ownership Summary
Exhibit 78: Top 10 shareholders
Rank Name Last filing date % O/S Position (m) Change (m)
1 Spank Management Services Private L. 27-Aug-19 26% 207.7 0.03
2 APG Strategic Real Estate Pool NV 30-Jun-19 15% 118.7 0.00
3 RJ Corp Ltd. 24-Sep-19 5% 43.4 -10.00
4 Franklin Templeton Asset Management (India) Pvt. Ltd. 30-Sep-19 4% 34.3 10.54
5 Keswani (Patanjali) 30-Jun-19 4% 27.8 0.01
6 Sundaram Asset Management Company Limited 30-Sep-19 3% 21.5 7.59
7 Zaaba Capital Limited. 30-Jun-19 2% 17.4 1.16
8 Reliance Nippon Life Asset Management Limited 30-Sep-19 2% 17.2 17.18
9 Palms International Investments Ltd. 30-Jun-19 2% 16.1 -3.01
10 SBI Funds Management Pvt. Ltd. 30-Jun-19 2% 13.9 -42.92{
Source: Company, ICICI Direct Research, Thomson Reuters
Exhibit 79: Recent activity
Investor Name Value ($mn) Shares (mn) Investor Name Value ($mn) Shares (mn)
Reliance Nippon Life Asset Management
Limited
13.87 17.18 APG Asset Management N.V. -133.95 -114.90
Franklin Templeton Asset Management (India)
Pvt. Ltd.
8.51 10.54 SBI Funds Management Pvt. Ltd. -41.62 -42.92
Sundaram Asset Management Company
Limited
6.13 7.59 RJ Corp Ltd. -8.17 -10.00
Samsung Asset Management Co., Ltd. 3.50 3.00 Palms International Investments Ltd. -2.92 -3.01
Aberdeen Standard Investments (Asia) Limited 1.77 1.83 Alpine Woods Capital Investors, LLC -1.36 -1.27
Buys Sells
Source: Company, ICICI Direct Research, Thomson Reuters
Exhibit 80: Shareholding pattern
(in %) Sep-18 Dec-18 Mar-19 Jun-19 Sep-19
Promoter 30.84 30.89 30.89 30.89 31.24
FII 13.87 13.80 13.50 14.13 20.36
DII 8.37 8.36 8.95 10.27 18.61
Others 46.92 46.95 46.66 44.71 29.79
Source: Company, ICICI Direct Research

ICICI Securities | Retail Research 37
ICICI Direct Research
Initiating Coverage | Lemon Tree Hotels
Risk & Concerns
Slowdown in economic growth may impact business
A significant portion of the company’s business comes from large
corporates as well as MSME clients (65% of business). A slowdown in
business activities due to reasons known/unknown, could have an adverse
effect on the business and impede growth, impacting our ARR and
occupancy forecasts adversely.
Operating in competitive business environment
Lemon Tree mainly operates in the midscale segment and faces significant
competition from unbranded and unorganised players. Inability to increase
prices owing to competitive pressures could result in lower profitability and
hinder growth.
Delay in completion of projects
In the next two years, Lemon Tree has several hotels lined up to be opened,
both owned and under management contracts. Setting up hotels is
dependent on land acquisition and other regulatory approvals. While the
upcoming owned hotels have already acquired land and are under
construction, any delay in the construction of hotels or other approvals
could lead to revenue loss.
Issues relating to hotels under management contracts
The company has ~1840 rooms under management contracts which is
expected to reach 4862 rooms by FY22E. Any delay in commencement of
operations of the upcoming hotels for which the contract has been signed
could impact our estimates. Furthermore, maintaining the quality of the
hotels is the responsibility of the hotel owner. Any deterioration in services
or quality of hotel premises could harm the reputation of Lemon Tree brand.
Leverage levels
The company currently has a total debt of ~| 1200 crore in its books. Also,
it has 937 rooms underway to be added in the next two years for which the
company has already spent in excess of | 600 crore with the balance to be
spent in the next two to three years. While we expect leverage levels to
come down with stabilisation of current portfolio, adverse business
conditions could have a negative impact on leverage levels. With significant
capital already being deployed and further capital expenditure on its way,
any delay in commencement of upcoming properties could also lead to
further deterioration in leverage levels and would have an adverse effect on
cash flows as well.
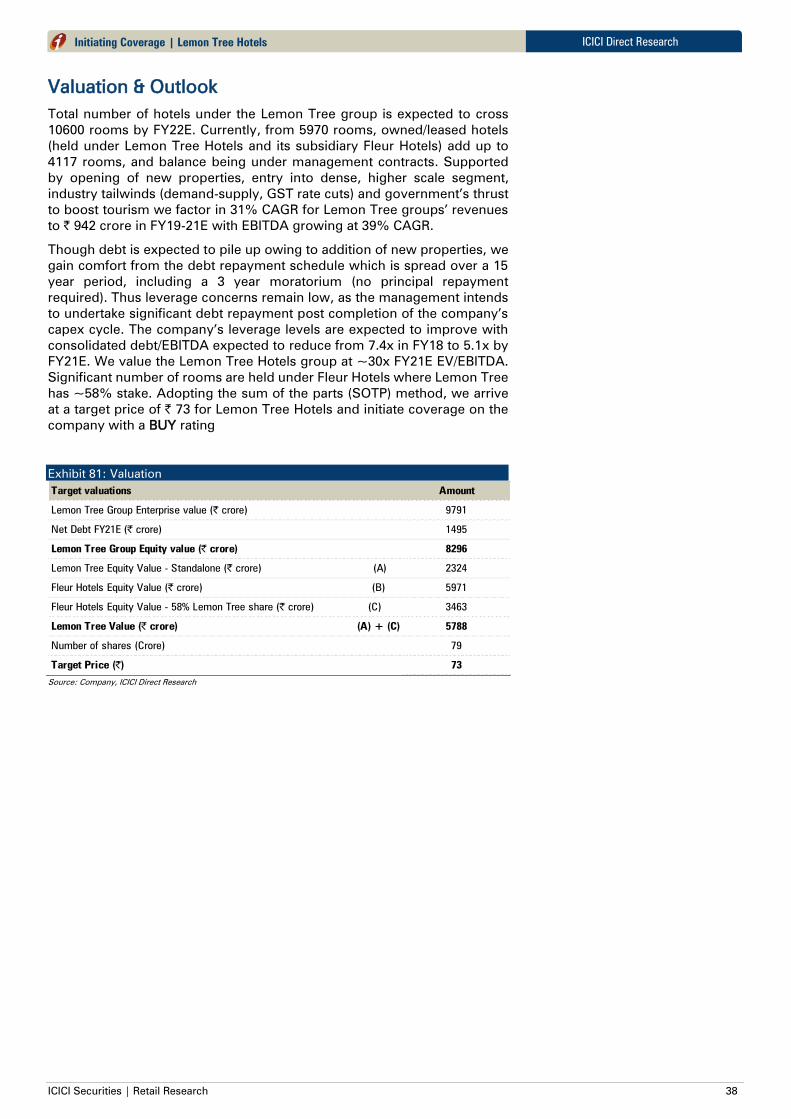
ICICI Securities | Retail Research 38
ICICI Direct Research
Initiating Coverage | Lemon Tree Hotels
Valuation & Outlook
Total number of hotels under the Lemon Tree group is expected to cross
10600 rooms by FY22E. Currently, from 5970 rooms, owned/leased hotels
(held under Lemon Tree Hotels and its subsidiary Fleur Hotels) add up to
4117 rooms, and balance being under management contracts. Supported
by opening of new properties, entry into dense, higher scale segment,
industry tailwinds (demand-supply, GST rate cuts) and government’s thrust
to boost tourism we factor in 31% CAGR for Lemon Tree groups’ revenues
to | 942 crore in FY19-21E with EBITDA growing at 39% CAGR.
Though debt is expected to pile up owing to addition of new properties, we
gain comfort from the debt repayment schedule which is spread over a 15
year period, including a 3 year moratorium (no principal repayment
required). Thus leverage concerns remain low, as the management intends
to undertake significant debt repayment post completion of the company’s
capex cycle. The company’s leverage levels are expected to improve with
consolidated debt/EBITDA expected to reduce from 7.4x in FY18 to 5.1x by
FY21E. We value the Lemon Tree Hotels group at ~30x FY21E EV/EBITDA.
Significant number of rooms are held under Fleur Hotels where Lemon Tree
has ~58% stake. Adopting the sum of the parts (SOTP) method, we arrive
at a target price of | 73 for Lemon Tree Hotels and initiate coverage on the
company with a BUY rating
Exhibit 81: Valuation
Target valuations Amount
Lemon Tree Group Enterprise value (| crore) 9791
Net Debt FY21E (| crore) 1495
Lemon Tree Group Equity value (| crore) 8296
Lemon Tree Equity Value - Standalone (| crore) (A) 2324
Fleur Hotels Equity Value (| crore) (B) 5971
Fleur Hotels Equity Value - 58% Lemon Tree share (| crore) (C) 3463
Lemon Tree Value (| crore) (A) + (C) 5788
Number of shares (Crore) 79
Target Price (|) 73
Source: Company, ICICI Direct Research

ICICI Securities | Retail Research 39
ICICI Direct Research
Initiating Coverage | Lemon Tree Hotels
Financial Summary
Exhibit 82: Profit & Loss Statement
(Year-end March) FY18 FY19 FY20E FY21E
Total operating Income 484.3 549.5 786.2 940.0
Growth (%) 18% 13% 43% 20%
Raw Material Expenses 43.6 49.8 69.2 82.5
Employee Expenses 109.6 120.5 150.7 176.3
Other Exp 194.9 210.4 303.0 354.9
Total Operating Expenditure 348.1 380.7 522.9 613.6
EBITDA 136.2 168.8 263.3 326.4
Growth (%) 16.9% 23.9% 56.0% 23.9%
Depreciation 52.6 54.1 86.7 97.5
Interest 78.4 84.7 93.8 109.0
Other Income 12.6 14.5 14.0 15.0
PBT 17.8 44.5 96.8 134.8
Others 0.0 0.0 0.0 0.0
Total Tax 3.8 -11.1 24.4 33.9
Reported PAT 14.0 55.6 72.4 100.9
Adjusted PAT 14.6 56.4 73.4 101.9
Growth (%) NA 2.9 0.3 0.4
Adjusted EPS (|) 0.2 0.7 0.9 1.3
Source: Company, ICICI Direct Research
Exhibit 83: Cash Flow Statement
(Year-end March) FY18 FY19 FY20E FY21E
Profit after Tax 14.6 56.4 73.4 101.9
Add: Depreciation 52.6 54.1 86.7 97.5
(Inc)/dec in Current Assets -51.1 -48.0 -27.3 -25.1
Inc/(dec) in CL and Provisions 30.0 69.7 32.2 17.0
CF from operating activities 109.4 177.7 250.2 290.3
(Inc)/dec in Other Non-Curr Assets 0.0 0.0 0.0 0.0
(Inc)/dec in Fixed Assets -302.4 -302.8 -781.2 -310.0
Others 57.9 13.8 34.7 18.2
CF from investing activities -244.5 -289.0 -746.5 -291.8
Issue/(Buy back) of Shares 5.2 2.9 0.0 0.0
Inc/(dec) in loan funds 212.4 184.5 368.2 110.0
Dividend paid & dividend tax 0.0 0.0 0.0 0.0
Others -79.0 -65.7 118.1 -94.0
CF from financing activities 138.6 121.7 486.3 16.0
Net Cash flow 3.4 10.4 -10.1 14.6
Opening Cash 17.6 21.0 31.4 21.3
Closing Cash 21.0 31.4 21.3 35.9
Source: Company, ICICI Direct Research
Exhibit 84: Balance Sheet
(Year-end March) FY18 FY19 FY20E FY21E
Liabilities
Equity Capital 786 789 789 789
Reserve and Surplus 28 86 153 245
Total Shareholders funds 815 875 942 1035
Total Debt 1011 1196 1564 1674
Deferred Tax Liability 4 0 0 0
Minority Interest / Others 429 432 637 646
Total Liabilities 2209 2480 3104 3304
Assets
Gross PPE 1599 1792 3097 3097
Less: Acc Depreciation 150 202 329 427
Net PPE 1449 1589 2768 2670
Investment Property 2 2 3 3
CWIP 556 664 180 490
Total Fixed Assets 2007 2256 2950 3163
Intangibles 12 12 12 12
Investments 47 52 50 50
Inventory 5 6 9 10
Debtors 53 84 102 116
Loans and Advances 0 0 0 0
Other Current Assets 47 46 53 56
Cash 21 31 21 36
Total Current Assets 138 197 214 253
Creditors 81 96 119 142
Provisions & Others 88 135 146 142
Total Current Liabilities 249 292 340 369
Net Current Assets -111 -95 -126 -115
Others Assets 254 255 218 194
Application of Funds 2209 2480 3104 3304
Source: Company, ICICI Direct Research
Exhibit 85: Key Ratios
(Year-end March) FY18 FY19 FY20E FY21E
Per share data (|)
Adjusted EPS 0.2 0.7 0.9 1.3
Cash EPS 0.9 1.4 2.0 2.5
BV 10.3 11.1 11.9 13.1
DPS 0.0 0.0 0.0 0.0
Cash Per Share 0.3 0.4 0.3 0.4
Operating Ratios (%)
EBITDA Margin 28.1 30.7 33.5 34.7
EBIT Margin 19.8 23.5 24.2 25.7
PAT Margin 3.0 10.3 9.3 10.7
Inventory days 3.9 3.8 3.4 3.6
Debtor days 31.6 45.5 43.4 42.4
Creditor days 53.4 58.8 49.8 49.1
Return Ratios (%)
RoE 1.8 6.7 8.1 10.1
RoCE 4.6 5.5 6.8 7.8
RoIC 5.4 4.2 5.0 4.8
Valuation Ratios (x)
P/E 316.7 81.8 62.8 46.0
EV / EBITDA 41.1 34.2 23.4 18.7
EV / Net Sales 11.6 10.5 7.8 6.5
Market Cap / Sales 9.5 8.4 5.9 4.9
Price to Book Value 5.7 5.3 4.9 4.5
Solvency Ratios
Debt/EBITDA 7.4 7.1 5.9 4.7
Debt / Equity 1.2 1.4 1.7 1.5
Current Ratio 0.6 0.7 0.6 0.7
Quick Ratio 0.5 0.7 0.6 0.7
Source: Company, ICICI Direct Research

ICICI Securities | Retail Research 40
ICICI Direct Research
Initiating Coverage | Lemon Tree Hotels
RATING RATIONALE
ICICI Direct endeavours to provide objective opinions and recommendations. ICICI Direct assigns ratings to its
stocks according to their notional target price vs. current market price and then categorizes them as Buy, Hold,
Reduce and Sell. The performance horizon is two years unless specified and the notional target price is defined as
the analysts' valuation for a stock
Buy: >15%
Hold: -5% to 15%;
Reduce: -15% to -5%;
Sell: <-15%
Pankaj Pandey
Head – Research
ICICI Direct Research Desk,
ICICI Securities Limited,
1st Floor, Akruti Trade Centre,
Road No 7, MIDC,
Andheri (East)
Mumbai – 400 093

ICICI Securities | Retail Research 41
ICICI Direct Research
Initiating Coverage | Lemon Tree Hotels
ANALYST CERTIFICATION
I/We, Rashesh Shah, CA, Romil Mehta, CA, Research Analysts, authors and the names subscribed to this report, hereby certify that all of the views expressed in this research report accurately reflect our views about the subject
issuer(s) or securities. We also certify that no part of our compensation was, is, or will be directly or indirectly related to the specific recommendation(s) or view(s) in this report. It is also confirmed that above mentioned Analysts of
this report have not received any compensation from the companies mentioned in the report in the preceding twelve months and do not serve as an officer, director or employee of the companies mentioned in the report.
Terms & conditions and other disclosures:
ICICI Securities Limited (ICICI Securities) is a full-service, integrated investment banking and is, inter alia, engaged in the business of stock brokering and distribution of financial products. ICICI Securities Limited is a SEBI registered
Research Analyst with SEBI Registration Number – INH000000990. ICICI Securities Limited SEBI Registration is INZ000183631 for stock broker. ICICI Securities is a subsidiary of ICICI Bank which is India’s largest private sector bank
and has its various subsidiaries engaged in businesses of housing finance, asset management, life insurance, general insurance, venture capital fund management, etc. (“associates”), the details in respect of which are available on
www.icicibank.com
ICICI Securities is one of the leading merchant bankers/ underwriters of securities and participate in virtually all securities trading markets in India. We and our associates might have investment banking and other business relationship
with a significant percentage of companies covered by our Investment Research Department. ICICI Securities generally prohibits its analysts, persons reporting to analysts and their relatives from maintaining a financial interest in the
securities or derivatives of any companies that the analysts cover.
Recommendation in reports based on technical and derivative analysis centre on studying charts of a stock's price movement, outstanding positions, trading volume etc as opposed to focusing on a company's fundamentals and, as
such, may not match with the recommendation in fundamental reports. Investors may visit icicidirect.com to view the Fundamental and Technical Research Reports.
Our proprietary trading and investment businesses may make investment decisions that are inconsistent with the recommendations expressed herein.
ICICI Securities Limited has two independent equity research groups: Institutional Research and Retail Research. This report has been prepared by the Retail Research. The views and opinions expressed in this document may or may
not match or may be contrary with the views, estimates, rating, target price of the Institutional Research.
The information and opinions in this report have been prepared by ICICI Securities and are subject to change without any notice. The report and information contained herein is strictly confidential and meant solely for the selected
recipient and may not be altered in any way, transmitted to, copied or distributed, in part or in whole, to any other person or to the media or reproduced in any form, without prior written consent of ICICI Securities. While we would
endeavour to update the information herein on a reasonable basis, ICICI Securities is under no obligation to update or keep the information current. Also, there may be regulatory, compliance or other reasons that may prevent ICICI
Securities from doing so. Non-rated securities indicate that rating on a particular security has been suspended temporarily and such suspension is in compliance with applicable regulations and/or ICICI Securities policies, in
circumstances where ICICI Securities might be acting in an advisory capacity to this company, or in certain other circumstances.
This report is based on information obtained from public sources and sources believed to be reliable, but no independent verification has been made nor is its accuracy or completeness guaranteed. This report and information herein
is solely for informational purpose and shall not be used or considered as an offer document or solicitation of offer to buy or sell or subscribe for securities or other financial instruments. Though disseminated to all the customers
simultaneously, not all customers may receive this report at the same time. ICICI Securities will not treat recipients as customers by virtue of their receiving this report. Nothing in this report constitutes investment, legal, accounting
and tax advice or a representation that any investment or strategy is suitable or appropriate to your specific circumstances. The securities discussed and opinions expressed in this report may not be suitable for all investors, who
must make their own investment decisions, based on their own investment objectives, financial positions and needs of specific recipient. This may not be taken in substitution for the exercise of independent judgment by any recipient.
The recipient should independently evaluate the investment risks. The value and return on investment may vary because of changes in interest rates, foreign exchange rates or any other reason. ICICI Securities accepts no liabilities
whatsoever for any loss or damage of any kind arising out of the use of this report. Past performance is not necessarily a guide to future performance. Investors are advised to see Risk Disclosure Document to understand the risks
associated before investing in the securities markets. Actual results may differ materially from those set forth in projections. Forward-looking statements are not predictions and may be subject to change without notice.
ICICI Securities or its associates might have managed or co-managed public offering of securities for the subject company or might have been mandated by the subject company for any other assignment in the past twelve months.
ICICI Securities or its associates might have received any compensation from the companies mentioned in the report during the period preceding twelve months from the date of this report for services in respect of managing or co-
managing public offerings, corporate finance, investment banking or merchant banking, brokerage services or other advisory service in a merger or specific transaction.
ICICI Securities encourages independence in research report preparation and strives to minimize conflict in preparation of research report. ICICI Securities or its associates or its analysts did not receive any compensation or other
benefits from the companies mentioned in the report or third party in connection with preparation of the research report. Accordingly, neither ICICI Securities nor Research Analysts and their relatives have any material conflict of
interest at the time of publication of this report.
Compensation of our Research Analysts is not based on any specific merchant banking, investment banking or brokerage service transactions.
ICICI Securities or its subsidiaries collectively or Research Analysts or their relatives do not own 1% or more of the equity securities of the Company mentioned in the report as of the last day of the month preceding the publication of
the research report.
Since associates of ICICI Securities are engaged in various financial service businesses, they might have financial interests or beneficial ownership in various companies including the subject company/companies mentioned in this
report.
ICICI Securities may have issued other reports that are inconsistent with and reach different conclusion from the information presented in this report.
Neither the Research Analysts nor ICICI Securities have been engaged in market making activity for the companies mentioned in the report.
We submit that no material disciplinary action has been taken on ICICI Securities by any Regulatory Authority impacting Equity Research Analysis activities.
This report is not directed or intended for distribution to, or use by, any person or entity who is a citizen or resident of or located in any locality, state, country or other jurisdiction, where such distribution, publication, availability or
use would be contrary to law, regulation or which would subject ICICI Securities and affiliates to any registration or licensing requirement within such jurisdiction. The securities described herein may or may not be eligible for sale in
all jurisdictions or to certain category of investors. Persons in whose possession this document may come are required to inform themselves of and to observe such restriction.