hope fear and - western washington university
TRANSCRIPT

C O M M I T T E E 1 0 0 . O R G
Hope Fearand
Full Report of C-100’s Survey onAmerican and Chinese Attitudes Toward Each Other

© 2008 Committee of 100
The report is prepared by the Committee of 100, with assistance from Zogby Internationaland Horizon Research Consultancy Group.
For electronic copies of this report, please visit www.Committee100.org.
The Committee of 100 is a national, non-partisan, 501(c)(3) organization. The informationsummarized here is based on the survey data and does not necessarily reflect the views ofthe Committee of 100, its members, its staff, or its funding organizations.
The Committee of 100 is deeply grateful to the Henry Luce Foundation for its supportof this project.
Committee of 100677 Fifth Avenue, 5th FloorNew York, NY 10022Phone: 212-371-6565Fax: 212-371-9009www.Committee100.org

Table of ContentsSUBJECT
Background …………………………………………………………………………….. 1
Executive Summary ……………………………………………………………………. 2Figures …………………………………………………………………………………. 12
Narrative Analysis ……………………………………………………………………... 16
Part I: Overall Impressions …………………………………………………….. 16
Impressions of Each Country ………………………………………………….. 16 Impressions of the People …………………………………………………....... 20 Impressions of Culture …………………………………………………………. 22 Impressions of the News Media ……………………………………………….. 23 Impacts on Respective Impressions …………………………………………… 23
Part II: China’s Rise and Its Implications for U.S.-China Relations …………….. 27
Assessing International Influence ……………………………………………… 27 Responding to the Rise of China ……………………………………………..... 29 Perspectives on the State of U.S.-China Relations …………………………….. 32
Part III: U.S.-China Common Issues …………………………………………….. 37
General Perceptions of Mutual Issues …………………………………………. 37 Investigation of Specific Shared Problems …………………………………….. 40 Assessing Congress’s Understanding of China ………………………………... 52
Part IV: Domestic Challenges and Values ……………………………………….. 55 Views on Domestic Issues ……………………………………………………... 55 Views on Immigration …………………………………………………….…… 60 Personal Goals …………………………………………………….…………… 62 Patriotism …………………………………………………….………………… 63
Methodology …………………………………………………….……………………... 65Sample Characteristics ……………………………………………….……………….... 67Appendix A: First Impression of China ……………………………………………….. 71Appendix B: First Impression of the U.S. ……………………………………….......... 72Appendix C: Top Issues Facing the U.S. ……………………………………………… 73Appendix D: Top Issues Facing China ………………………………………………... 74

QUESTIONS
1. General Feelings ………………………………………………………...……... 162. Elite’s Assessment of General Public’s Opinion ….……………………...…..... 173. Initial Thought ……………………………………………………………...….. 184. Relocation Appeal …………………...………………………………………… 195. Adoption …………………………………………………………………...…... 206. Marriage Approval ……………………………………………………………... 217. Cultural Impact ………………………………...………………………………. 228. Accuracy of Mutual Reporting …………………………...……………………. 239. Visitation ……………...……………………………………………………….. 2310. Change of Opinion Due to Visitation …………………….…………...……….. 2411. Change of Opinion Due to U.S.-led War on Terror …………………………… 2512. Media Sources for Different Population Groups ………………………………. 2513. Global Influence ...……………………………………………………………... 2714. Future World Superpower ...…………………………………………………… 2815. Future Leading Power in East Asia …………………………………………… 2816. China’s Growing Military Power ……………………………………………… 2917. China’s Growing Economy ………………………………...………………….. 3018. American Policy Toward China …………...………....………………………... 3119-25. Important Foreign Partner ...…………………………………………………… 3226. Current Trends in U.S.-China Relations ...……………………………………... 3327. Responsibility for Worsening of Relations ...…………………………………... 3428. Chinese Government’s Performance on Bilateral Relations ...………..……….. 3529. U.S. Government’s Performance on Bilateral Relations ...…………………….. 3530. Greatest Concerns about U.S.-China Relations .……………………………….. 3731. Common Interest ...…………………………………………………………….. 3832. Potential Conflicts ……………………………………………………………... 3933. U.S. Involvement in China-Taiwan Relations …………………………………. 4034. U.S. Military Obligations to Taiwan …………………………………………... 4035. Current Cross-Strait Relations ……………………………………………….… 4136. Solution to the Taiwan Issue …………………………………………………… 4237. Shared Benefit of Trade ………………………………………………………... 4238. Benefit from Low-Cost Chinese Products …………………………………….. 4339. Responsibility for Trade Deficit ……………………………………………….. 4440. Chinese Product Safety ……………………………………………………….... 4441. Outsourcing and Loss of American Jobs ...……………………………….…… 4542. Eliminating Outsourcing to China …………………………………………….. 4643. China’s Investment in Africa …………………………………………………... 4644. Greatest Concerns about Doing Business ……………………………………... 4745. Intellectual Property Rights in China …………………………………………... 4946. Impact of U.S. Immigration Policy ……………………………………………. 4947. China’s Future Role in the Global Economy …….……………………………. 5048. Global Warming Concerns …………………………………………………….. 51

49. Environmental Stewardship in China ………………………………………….. 5150. Environmental Stewardship in the U.S. ………………………………………... 5251. Access to Information on China in Congress …………………………………. 5252. Communication with Chinese Officials in Congress ……………………….…. 5353. Usefulness of Exchanging with Chinese Officials …………………………….. 5354. Communication with Chinese Americans in Congress ………………………... 5355. Usefulness of Exchanging with Chinese Americans ...……………………........ 5456. Mood of the Country ……………………..……………………………………. 5557. Most Pressing National Problems ……………………..………………………. 5658. China’s Emerging Middle Class ……………………..………………………… 5759. China’s Democracy ……………………..……………………………………... 5860. Impact of 2008 Beijing Olympics ……………………..……….………………. 5961. China’s Image during the 2008 Olympics ……………………...……………… 6062. Impact of Immigrants/Expatriates ……………………..……….……………… 6063. Opportunities for Immigrants/Expatriates ..…………………....……………… 6164. Current Life Goal ……………………..…………………….………………….. 6265. Level of Patriotism ……………………..…………………….………………... 63

1 2007 Committee of 100 Survey
BACKGROUNDBACKGROUND
The Committee of 100 (C-100) is a national non-partisan, non-profit membership organization comprised of prominent Chinese Americans in a broad range of professions. With their knowledge and experience, the Committee has dedicated its efforts to a dual mission: (1) encouraging constructive relations between the peoples of the United States and Greater China, and (2) encouraging the full participation of Chinese Americans in all aspects of American life.
C-100’s survey project began in 1994 and has released substantive public opinion reports to track the shift in attitudes among Americans toward Greater China. As a follow-up on the 2005 survey entitled “American Attitudes Toward China,” this year’s survey is unprecedented—a large-scale, multi-group, parallel polling of both Americans and Chinese about their opinions toward each other.
The objective of this study is to determine American attitudes toward China, and, as a “mirror,” find analogous results on Chinese attitudes toward America. The polls parallel each other by surveying the same or similar issues at the same time. This study is aimed to allow comparative analysis not only among some key groups in both countries, but also with the results of C-100’s previous 2005 survey. The target groups include the general public, opinion leaders, and business leaders in both countries, as well as a stand-alone sample of Congressional staffers in the U.S. The research has explored a broad array of issues shaping U.S.-China relations, ranging from American and Chinese overall impressions of each other to their views about important bilateral issues. The survey findings provide unique, comprehensive, and comparable information that can be shared, discussed and used to better understand the current state of U.S.-China relations and formulate recommendations on how to forge mutually beneficial partnerships for the future.
The study is co-chaired by C-100 members Cheng Li (Senior Fellow, Brookings Institution) and Frank H. Wu (Dean, Wayne State Law School), coordinated by C-100 Research Director Yong Lu, and is being conducted in collaboration with the polling firm Zogby International in the United States. The data for the China part are drawn from Horizon Research Consultancy Group’s own continuously self-sponsored and annually released survey on China’s global views—“The World in Chinese Eyes.”
The survey results were released on December 10, 2007 at the National Press Club in Washington, DC. A shorter version of the report (a summary of key findings) and other related materials can be found at www.Committee100.org.

Hope and Fear The Committee of 100’s survey—conducted in both the United States and China from August 18-September 19, 2007—reveals that American and Chinese mutual perceptions can be best described as a paradox of hope and fear. On one hand, a majority of citizens in the U.S. and China generally hold positive views of each other; both countries broadly recognize the importance of U.S.-China relations and sense their increasing economic interdependence. On the other hand, a strong majority of Americans view China’s growing economic and military power as a serious or potential threat, and nearly half of the Chinese feel that the U.S. is trying to prevent their country from becoming a great power.
The C-100 survey examined a broad segment of issue and policy areas of importance to both countries:
Economics / Trade: Both sides believe the most common interests lie in trade. Among Americans, trade is regarded as the most likely area of shared interests, yet it also ranks as the most likely source of conflict.
Product Safety: Favorability in the U.S. about China has fallen since 2005. This lower opinion of China may partly reflect recent media attention on the Chinese product safety issue. More than two-in-three Americans have reduced their confidence in Chinese-manufactured goods as a result of the food and toy contamination cases emanating from China.
Taiwan: For wide majorities in China, Taiwan is the greatest concern and the most likely source of conflict between the two nations. In the U.S., less than one-third of the general public, business and opinion leaders agree that the U.S. should intervene on behalf of Taiwan if a declaration of independence by Taiwan leads to military hostilities.
Environment / Climate Change: The survey also finds that majorities in both the U.S. and China—the world’s two largest producers of greenhouse gases that scientists believe are contributing to climate change—worry to some degree about global warming. The Chinese are more likely to be worried than the Americans. Americans rate both governments poorly on their respective performance in handling environmental issues. By contrast, the Chinese rate both governments positively.
Views on an Emerging China: As compared with C-100’s survey conducted in 2005, U.S. elite groups have largely shifted from thinking about China in terms of its government and more in terms of its emergence as a major player on the global economic stage.
22007 Committee of 100 Survey
EXECUTIVE SUMMARYEXECUTIVE SUMMARY

Views on America: At the mention of the United States, the Chinese mostly associate it with the war on terrorism. The Chinese regard the U.S. as the most important partner to China in the world today, however, most Chinese elites believe that the U.S. global influence has decreased or remained the same over the past ten years.
2008 Beijing Olympics: Both Americans and Chinese have very positive feelings about Beijing hosting the Games, agreeing that the Games will help improve China’s global image and economy.
Elites vs. General Public Views: Elites not only differ from the general public in both countries in terms of their views of the other nation, but also tend to misperceive the general public’s views of each other. For the U.S., elite groups underestimate the favorable views of China among the general public, while in China, elite groups overestimate the favorable views of the U.S. among the general public.
Hope: Overall Favorable Impressions & Increasing Interdependence
Majorities in the U.S. and China generally hold favorable impressions of each other. This is especially the case with Chinese elites, where 94% of business leaders and 86% of opinion leaders express positive opinions of the U.S. (see Figure 1 on page 12). Majorities of these elites in China say the U.S.-led war on terrorism has had little impact on their positive views toward the U.S. In the U.S., favorability of China has increased among Congressional staffers since 2005 (from 19% in 2005 to 35% today, shown in Figure 1). In both countries, younger people are more likely than other age groups to hold favorable views of each other.
U.S. opinion leaders, business leaders, and Congressional staffers have largely shifted from thinking of China in terms of its government (authoritarianism, communism and human rights issues) and more in terms of its global role (as an economic power, with the challenges and responsibilities this presents).
The American public tends to associate China with its large size, massive population, and unique culture, while business leaders, opinion leaders and Congressional staffers are more inclined to associate China with its growing economic power and increasing political and diplomatic stature.
By contrast, Chinese respondents’ first impressions of the U.S. most commonly focus on the U.S. war on terrorism, foreign policy, and landmark buildings and cities.
The United States generally welcomes China as having a more visible and important role in the international system. There is a wide consensus among all American samples that the U.S. accepts China’s status and seeks a collaborative relationship.
3 2007 Committee of 100 Survey

Certainly, the 2008 Summer Olympics in Beijing provides a great opportunity for China to demonstrate its important international role. Both Americans and Chinese have very positive feelings about Beijing’s hosting of the Games, agreeing that the Games will help improve China’s global image and economy. Pluralities in both countries also think hosting the Games will encourage China’s continuing integration with international norms. When asked what kind of national image China should focus most on projecting during the Games, both Americans and Chinese favor one of “a prosperous modern nation with a proud culture and history,” while the Chinese place equal importance on projecting an image of “a harmonious society.”
There is a broad consensus on both sides of the Pacific about the importance of bilateral relations:
From a list of seven nations, Americans rank China as the third most important partner, behind only England and Japan. Among Americans, Democrats rate China as second and Republicans rate China as fourth.
For the Chinese, the U.S. ranks first in importance, followed by Russia.
There is also a near universal approval that U.S.-China trade is mutually beneficial to each country’s respective economy (see Figure 2 on page 12). Strong majorities also agree that the low-cost goods from China benefit American consumers, including a slightly lower level of acceptance among union members in the U.S.
Business leaders in both countries have an optimistic outlook on China’s economic future: both predict that China will be the world’s largest exporter and the world’s largest consumer society within twenty years from now.
In terms of politics, the majority of Americans believe that China will eventually fully transition into a democracy, although most believe that this process may take more than twenty years. Both countries hold optimistic views on the rapid growth of China’s middle class and believe that the middle class will become the largest and most influential class in China in the future.
In addition, Americans and Chinese hold largely positive views of the other’s culture and people. Majorities in both countries say that the other nation’s culture has had a positive impact on their own nation. Americans have a more favorable opinion of American adoptions of Chinese children, and are more likely to support interracial (Chinese-American) marriages within their families than are the Chinese.
Of particular note, 16% of Americans say they can imagine themselves living in China someday, which is roughly the same number of Chinese who say they can imagine living in the U.S.
42007 Committee of 100 Survey

Fear: “China Threat” & U.S. Containment Policy
Despite generally favorable mutual perceptions and a universal approval of bilateral trade, more than 60% of all four U.S. samples regard China’s emergence as an economic power as either a serious or potential threat. However, the Chinese are more likely to believe that their country poses little or no threat to the American economic future, and about one-in-three elites think China could be an economic partner that will serve U.S. national interests (see Figure 3 on page 12).
With China’s growing economy, Americans are increasingly wary of losing jobs through outsourcing to China. Three-in-four Americans believe that China is responsible for the loss of U.S. jobs. Chinese respondents largely hold the opposite opinion. Among those Americans who believe that China causes job losses, a majority agree that the U.S. should not outsource manufacturing jobs to China, even if eliminating such outsourcing would result in higher prices for U.S. consumers.
Americans are also increasingly anxious about the growing strength of China’s military—three out of four Americans (75%) see China’s emergence as a military power posing either a serious or potential threat to the U.S. as compared with two out of three Americans (66%) in 2005 who held the same opinion. Most consider China to be more of a potential threat than a serious one.
Nearly all Americans believe that China’s influence has grown over the past ten years. By contrast, about half of the Chinese public and a majority of elites believe that U.S. global influence has decreased or remained about the same.
While a majority of Americans feel the U.S. will remain the leading superpower twenty years from now, fewer than 40% of the Chinese surveyed hold the same opinion. A majority of the Chinese public (55%) and business leaders (53%) believe China will be the world superpower in twenty years. Among Congressional staffers, who have the most negative views of China among all U.S. samples, there is a much higher percentage than in other groups in thinking about China as a “growing world power” or “future superpower.” When it comes to power and influence in the East Asian region twenty years from now, China clearly dominates among all respondents in both countries.
Most Americans believe that current U.S. policy accepts China’s status as a rising power and wants a collaborative relationship. However, nearly half of all the Chinese public, opinion leaders and business leaders feel that the U.S. is trying to prevent China from becoming a great power. In the U.S., Democrats (54%) are also less likely to agree that the U.S. accepts China’s global status than are Independents (66%) and Republicans (79%).
5 2007 Committee of 100 Survey

Key Issues Influencing U.S.-China Relations
Both sides see the most common interests lie in trade, energy, the environment, and security in the Asian-Pacific region (see Figure 6 on page 13). Among Americans, trade is regarded as the most likely area of shared interests, yet it also ranks as the most likely source of conflict. For
62007 Committee of 100 Survey
Elite Groups Out of Sync with the General Public
Elites not only differ from the general public in both countries in terms of their views of the other nation, but also tend to misjudge the general public’s views of each other. For the U.S., elite groups underestimate the favorable view of China by the general public, while for China, elite groups overestimate the public’s favorable views of the U.S.
- In China, opinion leaders and business leaders hold a far more favorable opinion of the U.S. than the general public. Among the general public, better-educated and wealthier people are more likely to hold favorable views of the U.S. The Chinese Communist Party members (74%) hold a more favorable opinion of the U.S. than those non-Party members (60%).
- In the U.S., Congressional staffers hold a much lower opinion of China than the other samples. The general public with a higher income are more likely to hold a negative opinion of China than those in the lower income bracket. Caucasian Americans are also more likely to hold an unfavorable opinion than Hispanic and African Americans.
- When asked to imagine how the general public views each other, the vast majority of U.S. business leaders (73%) and Congressional staffers (86%) believe the American public has an unfavorable opinion of China. In the survey of the general public, only 45% hold an unfavorable opinion, while the majority (52%) view China favorably. At the same time, 91% of Chinese business leaders believe the Chinese public holds a favorable opinion, but in fact, more than a quarter of the general public expresses an unfavorable opinion (see Figure 4 on page 13).
- Congressional staffers greatly diverge from the other samples on viewing the loss of American jobs to China as a big problem in U.S.-China relations, with only 12% of staffers surveyed citing this issue as compared to 41% of the U.S. public (see Figure 5 on page 13).
- Congressional staffers are far more likely than those in any other samples in the U.S. to agree that the U.S. government should take an active role in China-Taiwan relations (64%) and should intervene in the event of military hostilities between China and Taiwan following a declaration of Taiwan independence (49%). They are also more inclined than the U.S. public (50% vs. 15%) to view the Taiwan issue as a source of potential conflict between the U.S. and China.

wide majorities in China, Taiwan is believed to be the most likely source of conflict between the two nations.
Americans see the top issues of greatest concerns in the U.S.-China relationship as being:
Loss of American jobs to China Growing trade deficit with China China’s human rights situation
While the Chinese also share the concerns over trade and human rights issues, they name Taiwan as the biggest problem (see Figure 5 on page 13).
On the trade issue, Americans are more likely to blame their own government for the growing trade deficit with China, while opinion in China is evenly divided between blaming the American government and blaming both governments.
There are differing views between Americans and Chinese on the Taiwan issue:
Americans are evenly divided over whether their government should be involved in China-Taiwan relations. If a declaration of independence by Taiwan leads to military hostilities, support for intervention on behalf of Taiwan has dropped significantly since 2005 among U.S. business and opinion leaders. Less than one-third of the general public, business and opinion leaders in the U.S. agree that the U.S. should intervene on behalf of Taiwan.
The majority in China say the Taiwan issue should be resolved through peaceful unification as a result of expanded cross-strait exchange and communication. A majority or plurality of the Chinese public and elites are optimistic about the future of the Taiwan problem and believe that the issue is evolving toward a peaceful resolution.
More than two-in-three Americans have reduced confidence in Chinese-made goods as a result of the food and toy contamination cases emerging from China. In China, a plurality of the general public (44%) also say they have reduced confidence in their own products, although a majority of business and opinion leaders say their confidence in Chinese goods has not changed (see Figure 7 on page 14).
The recent media attention on the Chinese product safety issue, along with other political and economic problems, may have contributed to the decline of China’s image in the U.S. since the 2005 C-100 survey—7 percentage points lower among both the general public and opinion leaders, and 9 percentage points lower among business leaders (see Figure 1 on page 12).
7 2007 Committee of 100 Survey
Views on Addressing Environmental Challenges
Majorities in the U.S. and China—the two largest producers of greenhouse gases—expressed concern to some degree about climate change (see Figure 8 on page 14).
The Chinese surveyed are more likely to be worried, with 92% of opinion leaders and 89% of business leaders expressing a great deal or a fair amount of concern.
82007 Committee of 100 Survey
Doing Business Across the Pacific
Business leaders on both sides have an optimistic outlook on China’s economic future: both predict that China’s role in the global economy twenty years from now will be mostly defined as the world’s largest exporter and the world’s largest consumer society.
Key findings:
- American business leaders also feel that China will be a key destination for the outsourcing of manufacturing in twenty years, although Chinese business leaders do not share this opinion.
- Strong majorities of Americans and Chinese business leaders believe that China’s growing middle class will become the largest and most influential class in China in the future. Wealthy respondents and urban residents in China are more likely to share this view.
- American business leaders cite corruption, poor intellectual property rights protection, and bureaucratic interference as their greatest concerns when doing business with China. Chinese business leaders also rank corruption and bureaucratic interference in the top three, but feel an inadequate legal system is the biggest problem when doing business in their own nation.
- When asking Chinese business leaders about their concerns in doing business with the U.S., bureaucratic interference again ranks high, along with trade barriers and import measures as well as cultural and legal differences.
- A majority of American business leaders, especially those in the high-tech industry, believe China’s poor intellectual property rights protection has had a negative impact on foreign investment in China. However, Chinese business leaders do not share the same opinion.
- Clear majorities of all Americans surveyed view China’s expanded aid and investment in Africa as an opportunity for U.S.-China cooperation, rather than a threat to U.S. interests.

In the U.S., about 40% of the general public and elites express little or no concern about the problem. Only 37% of Republicans expressed concerns, as compared to three-quarters of Democrats and 70% of Independents.
Americans rate both governments poorly regarding their performance in addressing environmental issues, but particularly the Chinese government. In contrast, majorities in China rate both their government and the American government positively on this issue, with the American government receiving slightly higher ratings.
Current Trends in U.S.-China Relations
Respondents in both countries highly value the importance of the U.S.-China bilateral relationship. However, there emerged different viewpoints on the current state of this important relationship:
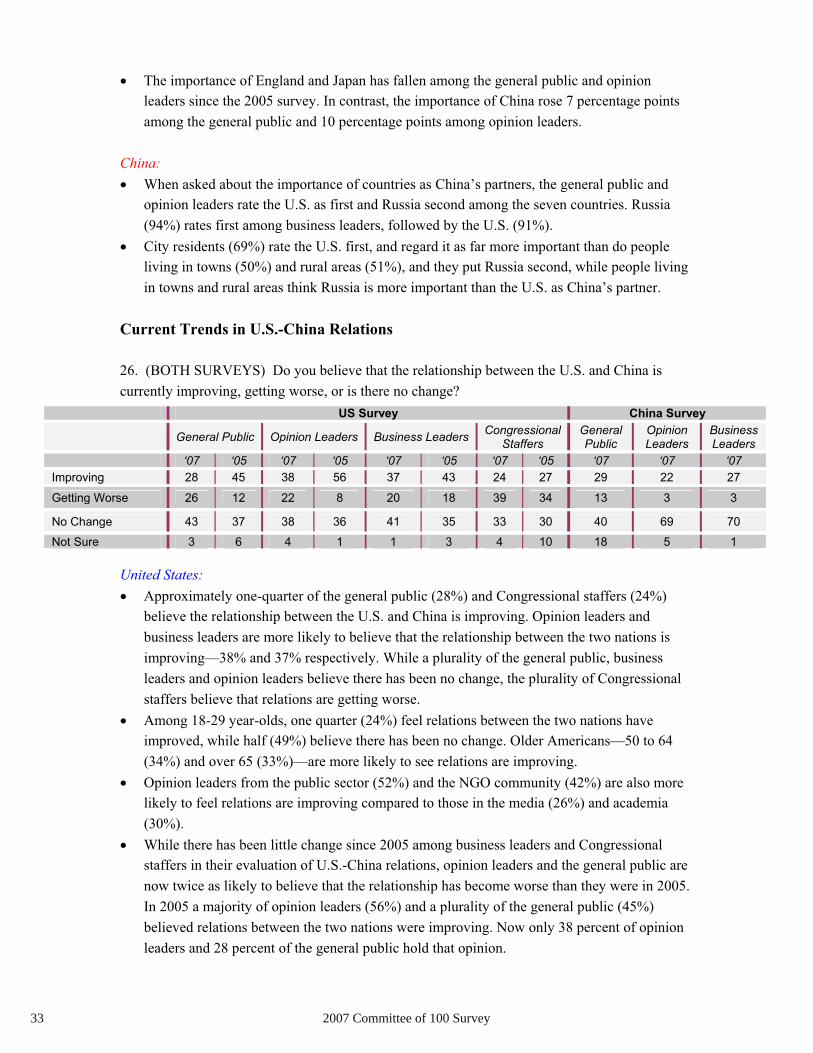
Though the majority of Americans believe that U.S.-China relations are either currently improving or remaining stable, there has been a marked decline in that opinion since 2005, especially among the general public and opinion leaders: roughly one-in-four respondents believe that the relationship has worsened, with both groups now twice as likely to believe so than they were in 2005.
Most Chinese respondents believe the bilateral relationship has changed little. Of those who feel the relationship is worsening, most Chinese blame the U.S. government, while U.S. opinion is divided over whom to fault.
More than 70% of all Americans give the Chinese government a negative performance rating when it comes to handling relations with the U.S. The majority of Chinese, however, holds the opposite opinion and is satisfied with their government’s performance.
Notably, clear majorities on both sides agree that the American government deserves a negative rating for its handling of relations with China—Americans are more likely to rate their government negatively in this context than the Chinese.
State of the Nation: Chinese Optimism, American Discontent
There are sharp differences in the way Chinese and Americans currently view the direction their respective countries are heading (see Figure 9 on page 14):
Chinese people are overwhelmingly satisfied with their national conditions—more than 88% of the general public and elites in China believe that China is headed on the right track. 94% of Communist Party members believe things in China are on the right track.
9 2007 Committee of 100 Survey

In sharp contrast, there is a widespread dissatisfaction in the U.S. about their national conditions and direction—three-in-five members of the general public, two-in-three Congressional staffers, and a majority of opinion and business leaders believe the U.S. is headed on the wrong track. Democrats (28%) are least likely to believe the country is on the right track. A third of Independents have the same opinion, while Republicans are evenly divided on the issue—48% believe the U.S. is on the right track, and 47% on the wrong track.
Although the two populations have very different views toward their national conditions, the survey finds that most Americans and Chinese rate themselves as highly patriotic individuals.
While a majority of Americans and Chinese agree on their primary life goal—to have a happy family life, the Chinese (42%) are five times more likely than Americans (8%) to express a desire for increased wealth, and Americans are more interested in living as they like.
Most Pressing National Problems
Jobs and the economy rank in the top two urgent issues in both countries (#1 in China, #2 in the United States).
For Americans, however, the war in Iraq remains the top issue, and the economy/jobs, health care and immigration round out the top four. Democrats and Independents rate the issues in the same order (war in Iraq/foreign policy; jobs and the economy; health care; immigration), while Republicans rate immigration third, ahead of health care.
For the Chinese, corruption and Taiwan rank directly below jobs and the economy, while the environment ranks high among business and opinion leaders. Notably, almost none of the Chinese general public mentions political reforms or democratization concerns, although 11% of opinion leaders cite these issues.
On the immigration issue, the majority of Americans believe that today’s Chinese immigrants will have a positive impact on American society in the long run. For most Chinese, Americans in China have little effect on their society. Americans also believe that the United States provides Chinese and Chinese Americans with an equal opportunity to live and work, whereas the Chinese largely feel that Americans in China enjoy superior treatment than do most Chinese. In addition, American business leaders are divided about whether current U.S. visa policy has interfered with their ability to hire foreign-born skilled professionals.
102007 Committee of 100 Survey

How to Improve U.S.-China Relations?
The dramatic rise in China’s global power and influence has the dual effect of encouraging cooperation between the U.S. and China in areas of common interest, while also being the source of increasing concerns to both nations. The Committee of 100’s survey suggests that sensitivities between the Americans and Chinese have heightened, and the shift in U.S. attitudes toward China is often due to major incidents emerging from U.S.-China trade, economic, political and diplomatic relations.
Furthermore, our survey finds a few factors that may help improve mutual attitudes:
Travel and visitations: Of the Americans and Chinese who have visited the other country, majorities hold a more favorable opinion of each other as a result. With the exception of Congressional staffers, however, less than a quarter of respondents from either the U.S. or China report that they have traveled to the other country. Opening up opportunities for the publics to travel abroad may help in encouraging more balanced cross-cultural perceptions.
Communication between Chinese Americans and U.S. Congress: Congressional staffers report that they have adequate access to relevant information about China and the state of U.S.-China relations, including majorities who say they have communicated directly with Chinese officials and Chinese Americans on U.S.-China issues. The staffers surveyed regard their contacts with Chinese Americans as more useful, however, than their contacts with Chinese government officials.
Objective news coverage of each other: Our data shows that neither the Chinese nor the American public believes that their country is accurately portrayed in the other country’s news media. Perhaps if steps are taken to present a more unbiased image of the other country in the media, the populations can gradually develop a better understanding of each other.
In the paradox of hope and fear revealed by the survey, even the most contentious issues between the U.S. and China imply that there are ever increasing opportunities for cooperation. The most urgent task for both countries is to increase dialogue, respect the core interests of the other side, and resolve differences and potential conflicts in a calm and timely manner. By advancing mutual understanding and learning from each other, the U.S. and China can then move toward further cooperation on key common issues and tipping the balance further in favor of hope—to the benefit of the U.S., China, and the global community in the 21st century.
11 2007 Committee of 100 Survey

Figure 1. U.S.-China Mutual Impressions: Favorable vs. Unfavorable Opinion
596363
19
5256
5435
6086
94
3537
3579
4543
4162
2611
6
6
12
32
53
143
1
1
0% 20% 40% 60% 80% 100%
General PublicOpinion Leaders
Business LeadersCongressional Staffers
General PublicOpinion Leaders
Business LeadersCongressional Staffers
General PublicOpinion Leaders
Business Leaders
US
Sur
vey
US
Sur
vey
Chi
naS
urve
y
2005
2007
Favorable Unfavorable Not Sure
Figure 2. Agreement on the Benefits of Bilateral Trade to Each Economy
72
85 83 85 82
99 99
27
16 17 15 7 1 11 1 0 0
11
0 00%20%40%60%80%
100%120%
General Public OpinionLeaders
BusinessLeaders
CongressionalStaffers
General Public OpinionLeaders
BusinessLeaders
US Survey China Survey
Agree Disagree Not Sure
Figure 3. Views of China’s Emergence as a Global Economic Power
25
29 31 32
13
5 6
40
31
37 39
31 30
39
7 7 5 4
23
30
20
25
32
25 25
17
32 33
4 2 1 0
17
3 2
0%
20%
40%
60%
General Public OpinionLeaders
BusinessLeaders
CongressionalStaffers
General Public OpinionLeaders
BusinessLeaders
US Survey China Survey
Serious Threat Potential Threat No Threat Economic Partner Not Sure
122007 Committee of 100 Survey

Figure 4. U.S.-China Mutual Impressions: Public Opinion vs. Elites’ Assessment
21
10
60
91
45
73
86
26
93 3 4
14
1
52
0%
20%
40%
60%
80%
100%
General Public BusinessLeaders'
Assessment
CongressionalStaffers'
Assessment
General Public BusinessLeaders'
Assessment
US Survey China Survey
Favorable Unfavorable Not Sure
Figure 5. U.S.-China: Areas of Greatest Concerns (Top 4)
U.S. Survey China Survey
41
35
27
17
31
50
28
23
39
33 29
23
12
27 25
18
0%
20%
40%
60%
80%
Loss of U.S.jobs to China
U.S. tradedeficit with
China
China’s humanrights situation
China’senvironmentaldegradation
General Public Opinion LeadersBusiness Leaders Congressional Staffers
40
20 18 15
59
15
35
17
53
16
33
18
0%
20%
40%
60%
80%
Taiwan China’senvironmentaldegradation
U.S. tradedeficit with
China
China’s energyconsumption
General Public Opinion Leaders Business Leaders
Figure 6. U.S.-China: Areas of Common Interest (Top 4)
U.S. Survey China Survey
71
20 16 13
77
17 23 22
73
23 17 21
64
20 23 29
0%
20%
40%
60%
80%
Trade China’sdomesticstability
Energy Security in theAsian-Pacific
region
General Public Opinion LeadersBusiness Leaders Congressional Staffers
55
24 24
12
68
15
24 26
73
37
26
13
0%
20%
40%
60%
80%
Trade Energy Environment Anti-terrorism
General Public Opinion Leaders Business Leaders
13 2007 Committee of 100 Survey

Figure 7. Loss of Confidence in Chinese Goods Due to Product Safety Concerns
68
87
79
89
44 48
38
30
13
21
10
40
53
63
2 1 1 1
16
0 00%
20%
40%
60%
80%
100%
General Public OpinionLeaders
BusinessLeaders
CongressionalStaffers
General Public OpinionLeaders
BusinessLeaders
US Survey China Survey
Agree Disagree Not Sure
Figure 8. Global Warming Concerns
29 26 27 28
20
48
38
32 34 35
31
49
44
51
20 23
28
19 19
6
10
20 18
10
22
7
2 10 1 0 0
5
0 1
0%
20%
40%
60%
GeneralPublic
OpinionLeaders
BusinessLeaders
CongressionalStaffers
GeneralPublic
OpinionLeaders
BusinessLeaders
US Survey China Survey
A Great Deal A Fair Amount Only a Little Not at All Not Sure
Figure 9. Current Mood of the Country: Right Track vs. Wrong Track
34 40 44
26
88 89 95
59 54 51
66
3 3 37 7 5 8 9 9 3
0%
20%
40%
60%
80%
100%
General Public OpinionLeaders
BusinessLeaders
CongressionalStaffers
General Public OpinionLeaders
BusinessLeaders
US Survey China Survey
Right Track Wrong Track Not Sure
142007 Committee of 100 Survey

15 2007 Committee of 100 Survey

NOTE:- The questions presented in the following analysis have been slightly re-ordered in an effort to better present the information.- Due to rounding, percentages may not total 100%.
Part I: Overall Impressions
1. Impressions of Each Country
General Feelings
1. (US SURVEY) How would you describe your impressions of China? (CHINA SURVEY) How would you describe your impressions of the U.S.?
United States:A majority of the general public (52%), opinion leaders (56%) and business leaders (54%) have a favorable opinion of China. Favorable opinion has, however, fallen among all three groups since 2005—7 percentage points among both the general public and opinion leaders, and 9 percentage points among business leaders. Congressional staffers are the only sample where the majority has an unfavorable opinion (62%), although the number having a favorable opinion has nearly doubled from 19% in 2005 to 35% today. Nearly two-thirds (64%) of the American public with the lowest income (less than $35,000) have a favorable opinion of China, as compared to 44 percent of those in the middle range ($35,000-$75,000) and 44 percent of those in the highest income range (more than $75,000). Opinion of China is highest in the East (57%) and lowest in the South (46%).
US Survey China SurveyGeneral Public
Opinion Leaders
BusinessLeaders
CongressionalStaffers
General Public
Opinion Leaders
BusinessLeaders
‘07 ‘05 ‘07 ‘05 ‘07 ‘05 ‘07 ‘05 ‘07 ‘07 ‘07
Very Favorable 12 9 10 15 15 17 3 1 13 28 34Somewhat Favorable 40 50 46 48 39 46 32 18 47 58 60
FAVORABLE 52 59 56 63 54 63 35 19 60 86 94Somewhat Unfavorable 27 26 33 28 26 29 46 63 20 10 5
Very Unfavorable 18 9 10 9 15 6 16 16 6 1 1UNFAVORABLE 45 35 43 37 41 35 62 79 26 11 6Not Sure 3 6 2 1 5 1 3 2 14 3 1
162007 Committee of 100 Survey
NARRATIVE ANALYSISNARRATIVE ANALYSIS

Hispanic Americans (74%) and African Americans (63%) are more likely to have a favorable opinion than are Caucasian Americans (47%). More than half of all males (58%) view China favorably, while less than half of all women (46%) have the same opinion.
China:A majority of the general public (60%), opinion leaders (86%) and business leaders (94%) have a favorable opinion of the United States. The percentage of the general public with negative views of the U.S. (26%) is significantly higher than that of opinion leaders (11%) and business leaders (6%). More than two-thirds (69%) of the Chinese public with a high income have a favorable opinion of the U.S., as compared to 63 percent of those in the middle income range and 60 percent of those in the low income range. Opinion of the U.S. is highest in the cities (79%) and lowest in the villages (53%). As educational levels increase, the general public’s opinion of the U.S. appears to improve. People with a high level of education (81%) are more likely to have a favorable opinion of the U.S. than are people with a medium level (72%) or a low level (53%) of education.Younger Chinese aged 18 to 29 years old (69%) express more positive opinions of the U.S. as compared with other age groups. 74% of the Chinese Communist Party members have a favorable opinion of the U.S., as compared to 60% of those non-Party members. The percentage of Party members with negative impressions (17%) is also notably lower than that of non-Party members (27%).
Elite’s Assessment of General Public’s Opinion
2. (ASKED OF AMERICAN BUSINESS LEADERS & CONGRESSIONAL STAFFERS) How would you describe the American public’s opinion of China? (ASKED OF CHINESE BUSINESS LEADERS) How would you describe the Chinese public’s opinion of the U.S.? 2007 Only US Survey China Survey
General Public*
BusinessLeaders’
Assessment
Congressional Staffers’
Assessment
General Public*
BusinessLeaders’
AssessmentVery Favorable 12 3 -- 13 24
Somewhat Favorable 40 18 10 47 67
FAVORABLE 52 21 10 60 91
Somewhat Unfavorable 27 41 64 20 6
Very Unfavorable 18 32 22 6 3
UNFAVORABLE 45 73 86 26 9
Not Sure 3 3 4 14 1
*General Public responses are taken from the first question.
17 2007 Committee of 100 Survey
United States: The vast majority of both business leaders (73%) and Congressional staffers (86%) believe the American public has an unfavorable opinion of China. In the survey of the general public, only 45% hold an unfavorable opinion, while the majority (52%) hold a favorable opinion.
China:Chinese business leaders appear to overestimate the Chinese public’s overall opinion of the United States: 91% of business leaders believe the Chinese public holds a favorable opinion, while more than a quarter of the Chinese public holds an unfavorable opinion of the U.S.
Initial Thought
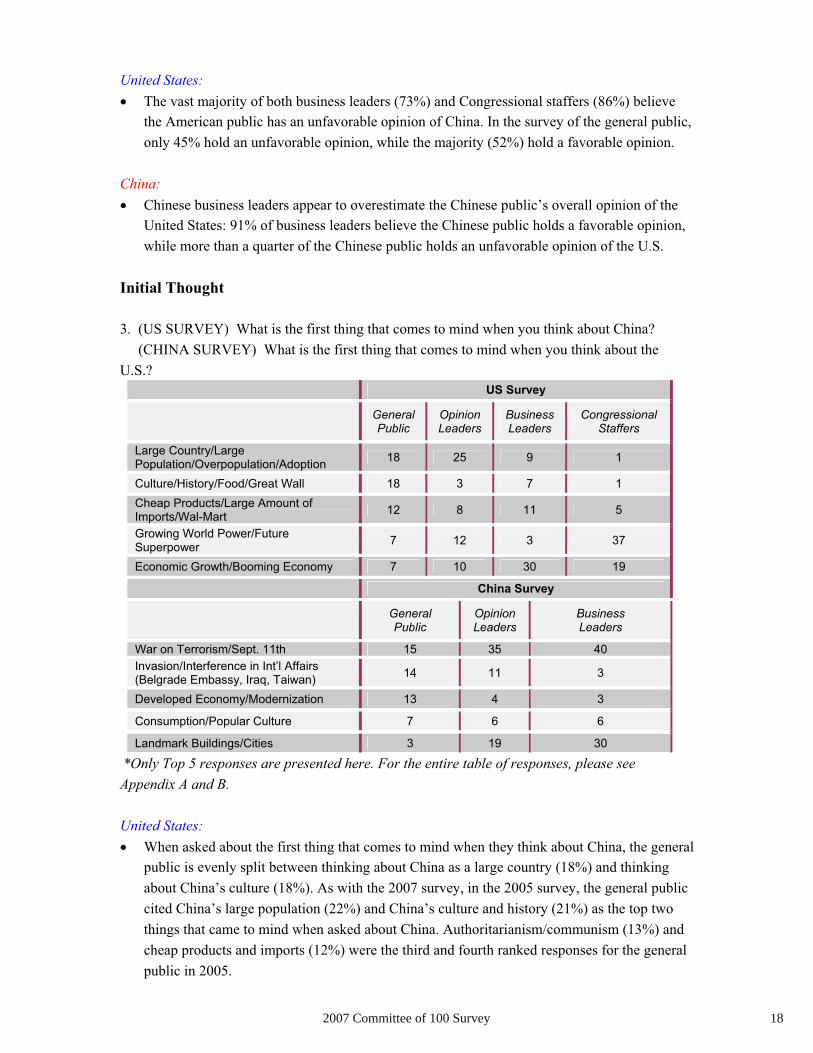
3. (US SURVEY) What is the first thing that comes to mind when you think about China? (CHINA SURVEY) What is the first thing that comes to mind when you think about the
U.S.?US Survey
General Public
Opinion Leaders
BusinessLeaders
Congressional Staffers
Large Country/Large Population/Overpopulation/Adoption 18 25 9 1
Culture/History/Food/Great Wall 18 3 7 1Cheap Products/Large Amount of Imports/Wal-Mart 12 8 11 5
Growing World Power/Future Superpower 7 12 3 37
Economic Growth/Booming Economy 7 10 30 19
China Survey
General Public
Opinion Leaders
BusinessLeaders
War on Terrorism/Sept. 11th 15 35 40Invasion/Interference in Int’l Affairs (Belgrade Embassy, Iraq, Taiwan) 14 11 3
Developed Economy/Modernization 13 4 3
Consumption/Popular Culture 7 6 6
Landmark Buildings/Cities 3 19 30
*Only Top 5 responses are presented here. For the entire table of responses, please see Appendix A and B.
United States: When asked about the first thing that comes to mind when they think about China, the general public is evenly split between thinking about China as a large country (18%) and thinking about China’s culture (18%). As with the 2007 survey, in the 2005 survey, the general public cited China’s large population (22%) and China’s culture and history (21%) as the top two things that came to mind when asked about China. Authoritarianism/communism (13%) and cheap products and imports (12%) were the third and fourth ranked responses for the general public in 2005.
182007 Committee of 100 Survey
Since the 2005 survey, thoughts among elite groups have largely shifted from thinking of China in terms of its government (authoritarianism/communism and human rights) and more in terms of its economy (cheap products, economic growth and growing power). Opinion leaders in 2005 were most likely to cite China’s economic growth (27%), followed by China’s massive population (20%), human rights (8%) and authoritarianism/communism (8%). Business leaders in 2005 most frequently cited economic growth (53%), the low cost of labor (18%), authoritarianism/communism (6%) and human rights (5%). Congressional staffers first cited authoritarianism/communism (32%), followed by economic growth (13%), human rights (13%), unfair trade practices (7%) and China’s population (7%). Opinion leaders in 2007 are most likely to cite China’s size (25%), with China’s status as a growing world power (12%) ranking second. The most common response among business leaders in 2007 is China’s economic growth (30%), followed by Chinese production of goods (11%). Congressional staffers today first think of China as a growing world power (37%), followed by China’s economic growth (19%). 29 percent of younger Americans aged 18 to 29 years old cite some aspect of the Chinese culture. Nearly one-in-four respondents in that age group mention China’s size, both in geography and population (24%). One-in-ten younger Americans (9%) first think of the recent situation involving toys with lead paint.
China:With regard to initial thoughts about the United States, business leaders and opinion leaders both focus primarily on the war on terrorism (40% and 35%, respectively) and landmark buildings/cities (30% and 19%, respectively). The general public’s thoughts are relatively scattered, concentrating on the war on terrorism (15%), foreign policy (14%) and developed economy/modernization (13%). Chinese aged 18-29 years old are more likely to associate America with consumption/popular culture than any other age groups, with 14% thinking of various elements of American popular culture such as street basketball, hip-hop and American fast food, as opposed to less than 5% in other age groups.
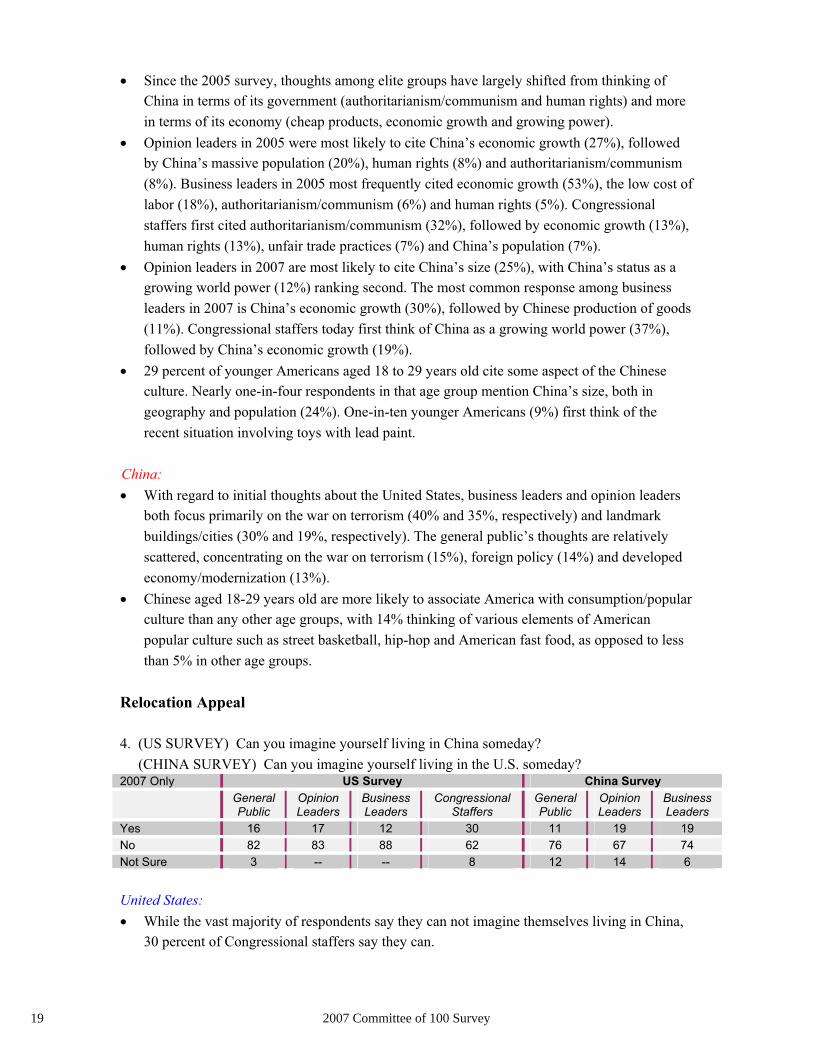
Relocation Appeal
4. (US SURVEY) Can you imagine yourself living in China someday? (CHINA SURVEY) Can you imagine yourself living in the U.S. someday? 2007 Only US Survey China Survey
General Public
Opinion Leaders
BusinessLeaders
Congressional Staffers
General Public
Opinion Leaders
BusinessLeaders
Yes 16 17 12 30 11 19 19No 82 83 88 62 76 67 74Not Sure 3 -- -- 8 12 14 6
United States: While the vast majority of respondents say they can not imagine themselves living in China, 30 percent of Congressional staffers say they can.
19 2007 Committee of 100 Survey

Respondents aged 18-29 are most likely to be open to the idea of living in China (31%). Only 2% of those aged 75 or older embrace the idea of living in China. College graduates are twice as receptive (19%) to living in China than high school graduates (9%).There is little variation among income levels about being receptive to living in China, but those making $50,000 to $75,000 are the least likely to embrace the idea (9%).
China:The percentage of opinion leaders and business leaders who can imagine themselves living in America is greater (both 19%) than that of the general public (11%). One-fifth of respondents aged 18-29 are open to the idea of living in the United States, a number notably higher than those of other age groups. Those with a higher level of education and higher income are more likely to imagine themselves living in the United States. Among those holding this view, people in the high income range account for 24%, as opposed to middle and low income ranges (12% and 9%, respectively); those with a higher level of education take up 28%, with middle and lower levels at 7% and 16%, respectively. The percentage of city residents who are receptive to living in the U.S. (17%) is higher than those in towns (13%) and rural areas (9%).
2. Impressions of the People
Adoption
5. (BOTH SURVEYS) American citizens adopted over 6,000 children from China in 2006. Do you think American adoption is mainly positive for the adopted Chinese children or mainly negative?2007 Only US Survey China Survey
General Public
Opinion Leaders
BusinessLeaders
Congressional Staffers
General Public
Opinion Leaders
BusinessLeaders
Mainly Positive 88 93 91 91 59 71 85Mainly Negative 8 5 6 4 18 10 4Not Sure 4 3 3 5 23 19 11
United States: The wide majority of the general public (88%), opinion leaders (93%), business leaders (91%) and Congressional staffers (91%) believe the adoption of Chinese children by Americans has been a mostly positive experience for those children.This opinion is most common among Americans between 18-29 (94%), those with incomes greater than $50,000 (93%) and African Americans (93%).
China:A majority of the general public (59%), opinion leaders (71%) and business leaders (85%) believe the adoption of Chinese children by Americans is a mostly positive thing.
202007 Committee of 100 Survey

Higher income and a better education correlate to a more positive attitude: 70% of people with a high income think positively about Chinese adoptions by Americans, 10 and 11 percentage points respectively above the numbers for those in the middle and low income range. 67% of people with a high level of education have a positive opinion, 3 and 10 percentage points respectively above the figures for those with middle and low levels of education.
Marriage Approval
6. (US SURVEY) Would you approve of your child marrying someone who is Chinese? (CHINA SURVEY) Would you approve of your child marrying someone who is American? 2007 Only US Survey China Survey
General Public
Opinion Leaders
BusinessLeaders
Congressional Staffers
General Public
Opinion Leaders
BusinessLeaders
Yes 80 86 90 89 45 53 74No 14 10 7 5 36 25 16Not Sure 6 5 3 6 20 23 10
United States: Four-in-five Americans (80%) would approve of their child marrying someone who is Chinese, as would nearly all opinion leaders (86%), business leaders (90%) and Congressional staffers (89%).Only two-thirds of Americans over the age of 65 (67%) would approve of such a marriage, as compared to 93 percent of Americans between 18 and 29. African Americans (96%) are also more likely to approve of their child marrying someone who is Chinese than are Caucasian Americans (76%).
China:74% of business leaders would approve of their child marrying an American, which is higher than that of opinion leaders (53%) and the general public (45%). Younger Chinese are more open to this issue. The younger they are, the more supportive they would be of their child’s marriage to an American (18-29: 55%; 30-39: 46%; 40-49: 41%; 50-60: 36%). Those with a higher level of education and income are more likely to support their child marrying an American: the percentage of those with a high income is respectively 14 and 18 percentage points above that of those in the middle and low income ranges. The percentage of those with a high level of education is respectively 11 and 22 percentage points above that of those with medium and low levels of education. Receptiveness to having a child marry an American is more common among the Chinese of Han ethnicity (45%) than other minority groups (39%). Those with religious beliefs (55%) would also support it more than those without any religious beliefs (43%).
21 2007 Committee of 100 Survey

3. Impressions of Culture
Cultural Impact
7. (US SURVEY) Would you say the impact of Chinese culture on the U.S. has been favorable or unfavorable, or has it had no impact? (CHINA SURVEY) Would you say the impact of American culture on China has been favorable or unfavorable, or has it had no impact?
2007 Only US Survey China Survey
General Public
Opinion Leaders
BusinessLeaders
Congressional Staffers
General Public
Opinion Leaders
BusinessLeaders
Very Favorable 12 8 8 6 8 7 4Somewhat Favorable 42 51 39 52 45 49 58FAVORABLE 54 59 47 58 53 56 62
Somewhat Unfavorable 13 16 13 9 11 6 6
Very Unfavorable 8 4 5 3 2 2 --
UNFAVORABLE 21 20 18 12 13 8 6
No Impact 23 21 34 26 14 21 27
Not Sure 2 2 2 4 22 15 6
United States: A majority of the general public (54%), opinion leaders (59%) and Congressional staffers (58%) believe that Chinese culture has had a favorable impact on the U.S., while a near majority of business leaders (47%) have the same opinion. Of younger Americans (18-29 year-olds), three-quarters (75%) believe Chinese culture has had a favorable impact. Americans making less than $35,000 (64%) are more likely to have a favorable opinion of the impact of Chinese culture, as are African Americans (64%) and those living in the West (61%).
China:A majority of the general public (53%), opinion leaders (56%), and business leaders (62%) believe American culture has had a favorable impact on China. What is noteworthy is that the percentage of the general public that finds it unfavorable (13%) is higher than that of opinion leaders (8%) and business leaders (6%). Of younger Chinese between 18 and 29 years old, 59% think American culture has had a favorable impact, notably higher than any of the other age groups. 62% of city residents have a favorable opinion of the impact of American culture. The percentage is slightly greater than that of town residents (58%), and clearly above that of rural residents (48%). Nearly one-in-three respondents in rural areas (30%) are not sure about this question.
222007 Committee of 100 Survey

4. Impressions of the News Media
Accuracy of Mutual Reporting
8. (US SURVEY) Do you think that the Chinese media portrays an accurate picture of the U.S.? (CHINA SURVEY) Do you think that the U.S. media portrays an accurate picture of China? 2007 Only US Survey China Survey
General Public
Opinion Leaders
BusinessLeaders
Congressional Staffers
General Public
Opinion Leaders
BusinessLeaders
Yes 14 6 11 1 15 20 44No 63 65 65 67 49 53 44Not Sure 24 29 24 32 36 27 12
United States: Approximately two-in-three respondents in each sample believe that the Chinese media does not accurately portray the United States.
China:Approximately half of the general public (49%) and opinion leaders (53%) believe that the American media does not present a truthful picture of China. The business leaders are evenly split about this issue (44% versus 44%).
5. Impacts on Respective Impressions
Change of Opinion Due to Visitation
9. (US SURVEY) Have you ever visited mainland China? (CHINA SURVEY) Have you ever visited the U.S.? 2007 Only US Survey China Survey
General Public
Opinion Leaders
BusinessLeaders
Congressional Staffers
General Public
Opinion Leaders
BusinessLeaders
Yes 6 18 19 38 1 21 23No 94 82 81 62 98 79 77
United States: Six percent of the general public reports having traveled to mainland China at some point in their lives. Approximately one-in-five opinion leaders and business leaders have visited mainland China. Nearly four-in-ten Congressional staffers say they have visited mainland China.
China:More than one-in-five opinion leaders and business leaders have visited the United States.Less than 1% of the general public has visited the U.S.
23 2007 Committee of 100 Survey
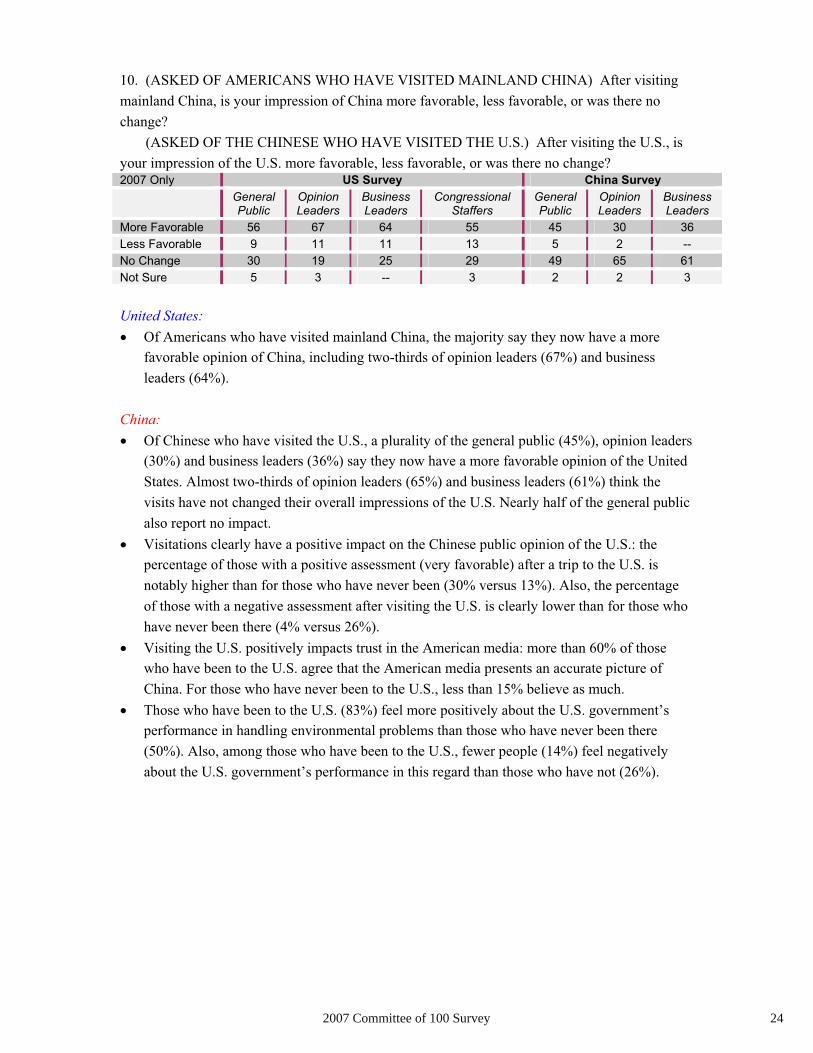
10. (ASKED OF AMERICANS WHO HAVE VISITED MAINLAND CHINA) After visiting mainland China, is your impression of China more favorable, less favorable, or was there no change? (ASKED OF THE CHINESE WHO HAVE VISITED THE U.S.) After visiting the U.S., is your impression of the U.S. more favorable, less favorable, or was there no change? 2007 Only US Survey China Survey
General Public
Opinion Leaders
BusinessLeaders
Congressional Staffers
General Public
Opinion Leaders
BusinessLeaders
More Favorable 56 67 64 55 45 30 36Less Favorable 9 11 11 13 5 2 --No Change 30 19 25 29 49 65 61Not Sure 5 3 -- 3 2 2 3
United States: Of Americans who have visited mainland China, the majority say they now have a more favorable opinion of China, including two-thirds of opinion leaders (67%) and business leaders (64%).
China:Of Chinese who have visited the U.S., a plurality of the general public (45%), opinion leaders (30%) and business leaders (36%) say they now have a more favorable opinion of the United States. Almost two-thirds of opinion leaders (65%) and business leaders (61%) think the visits have not changed their overall impressions of the U.S. Nearly half of the general public also report no impact. Visitations clearly have a positive impact on the Chinese public opinion of the U.S.: the percentage of those with a positive assessment (very favorable) after a trip to the U.S. is notably higher than for those who have never been (30% versus 13%). Also, the percentage of those with a negative assessment after visiting the U.S. is clearly lower than for those who have never been there (4% versus 26%). Visiting the U.S. positively impacts trust in the American media: more than 60% of those who have been to the U.S. agree that the American media presents an accurate picture of China. For those who have never been to the U.S., less than 15% believe as much. Those who have been to the U.S. (83%) feel more positively about the U.S. government’s performance in handling environmental problems than those who have never been there (50%). Also, among those who have been to the U.S., fewer people (14%) feel negatively about the U.S. government’s performance in this regard than those who have not (26%).
242007 Committee of 100 Survey

Change of Opinion Due to U.S.-led War on Terror
11. (CHINA SURVEY) Has the U.S.-led war on terror led you to have a more favorable or less favorable opinion of the U.S., or has there been no change? 2007 Only China Survey
General Public
Opinion Leaders
BusinessLeaders
More Favorable 10 14 25Less Favorable 32 31 23No Change 36 52 51Not Sure 22 3 1
China:More than half of opinion leaders and business leaders believe the war on terrorism has not changed their overall views of the U.S., and more than one-third of the general public holds the same view.The percentages of both the general public and opinion leaders who say “less favorable” are about 17 percentage points higher than those who say “more favorable.” For business leaders, near equal numbers view the war as having a positive impact (25%) and a negative impact (23%).
Media Sources for Different Population Groups
12. (US SURVEY) From which sources do you get much of your news about China? (CHINA SURVEY) From which sources do you get much of your news about the U.S.?
2007 Only US Survey China Survey General Public
Opinion Leaders
BusinessLeaders
Congressional Staffers
General Public
Opinion Leaders
BusinessLeaders
English TV 73 69 71 75 1 23 14Chinese TV 1 1 1 3 85 79 76
English Newspapers 50 67 75 91 1 22 11
Chinese Newspapers 2 1 4 -- 33 72 69
English Internet 37 55 65 79 1 33 19
Chinese Internet <1 -- 3 1 11 77 68
English Radio 29 46 45 49 1 10 6
Chinese Radio <1 -- -- -- 11 34 28
English News Magazines 24 46 64 81 1 17 12
Chinese News Magazines 1 1 2 -- 9 46 35
Text Messages 2 1 4 2 3 4 3
Other 3 1 1 14 1 3 1
United States: Respondents with less than a high school education are more likely to get their news about China from English-language TV (87%) than those who have finished college (67%).
25 2007 Committee of 100 Survey

People older than 65 are most likely to get their China news from English-language TV (85%), and are also more likely than other age groups to get information from English-language newspapers (54%). Those 18-29 are most likely to get the same information from English-language Web pages (52%). People earning $35,000 to $50,000 are most likely to get Chinese news from English-language TV (82%). Those earning $75,000 to $100,000 are slightly more inclined than other economic brackets to get their news from English-language magazines (35%).
China:85% of the general public uses Chinese-language TV as their primary source of information about America. Percentages of opinion and business leaders who use all forms of media (other than Chinese-language TV) are greater than the use by the general public. Over two-thirds of opinion and business leaders get information from Chinese-language newspapers and websites. More highly educated people obtain information on the U.S. through English-language media than do people with a middle or low level of education. Additionally, highly educated people more use Chinese websites, Chinese radio programs, Chinese magazines and text messages for information on the U.S. than do people with a middle or low level of education. More people with a high income obtain news on the U.S. through all forms of media than those in the middle or low-income range. There is especially a notable difference in the use of Chinese newspapers, Chinese websites and Chinese magazines.
262007 Committee of 100 Survey

Part II: China’s Rise and Its Implications for U.S.-China Relations
1. Assessing International Influence
Global Influence
13. (US SURVEY) How has China’s global influence changed over the past ten years? (CHINA SURVEY) How has the U.S. global influence changed over the past ten years? 2007 Only US Survey China Survey
General Public
Opinion Leaders
BusinessLeaders
CongressionalStaffers
GeneralPublic
Opinion Leaders
BusinessLeaders
Increased 81 95 91 99 35 33 34Decreased 5 1 3 -- 24 38 26Remained the Same 11 3 6 1 23 27 40
Not Sure 3 1 -- -- 18 2 1
United States: Large majorities of all four samples believe that China’s global influence has increased over the past ten years. That number is lowest among the general public (81%) and of that group, only 76% of 18 to 29 year olds believe China’s global influence has grown in that time.Most in the general public agree that China’s global influence has increased (81%), including those with a very favorable impression of China (74%) concurring with those who have a very unfavorable impression of the country (75%). The opinion that China’s influence is growing correlates with the respondent’s degree of education, as those with less than a high school education (76%), who finished high school (79%), received some college education (79%) are less likely to hold that opinion than are college graduates (86%).
China:All three samples are widely divided as to the changes in American international influence over the past decade: the percentages of those who think its influence has increased, decreased or remained unchanged are similar. The percentage of opinion leaders who think the influence has decreased is 12 and 14 percentage points higher than business leaders and the general public, respectively. Business leaders who think that influence has remained unchanged is 13 and 17 percentage points higher than opinion leaders and the general public. Among the general public, more people with a high income think U.S. international influence has increased over the past decade (46%) than those in the middle (35%) and low-income range (34%).
27 2007 Committee of 100 Survey

Future World Superpower
14. (BOTH SURVEYS) Which nation or political region do you think will be the world’s leading superpower twenty years from now? 2007 Only US Survey China Survey
General Public
Opinion Leaders
BusinessLeaders
Congressional Staffers
General Public
Opinion Leaders
BusinessLeaders
U.S. 49 62 69 73 20 38 36China 23 21 19 13 55 31 53E.U. 10 5 7 4 6 21 8Russia 5 2 2 -- 2 2 --India 2 5 1 1 <1 -- --Other 4 2 1 1 <1 1 --Not Sure 7 4 1 8 18 8 3
United States: A majority of Congressional staffers (73%), business leaders (69%), opinion leaders (62%) believe the United States will be the leading global superpower in twenty years. Nearly half of the general public (49%) has the same opinion. China ranks second among all four samples, but ranks highest among the general public (23%). Younger Americans (18-29 year-olds) rate the U.S. (36%) and China (17%) lower than the other age brackets and give greater weight to the E.U. (26%) and Russia (10%).
China:A majority of the general public (55%) and business leaders (53%) believe China will be the leading global superpower in twenty years, and 31% of opinion leaders agree. The percentage of opinion leaders selecting the U.S. (38%) is close to that of business leaders (36%), notably higher than the general public (20%). Younger Chinese (18-29 year-olds) give greater weight to the E.U. (10%) than other age groups.
Future Leading Power in East Asia
15. (BOTH SURVEYS) Which one of the following countries do you expect to have the greatest degree of influence in the East Asian region twenty years from now? 2007 Only US Survey China Survey
General Public
Opinion Leaders
BusinessLeaders
Congressional Staffers
General Public
Opinion Leaders
BusinessLeaders
China 47 70 56 85 68 86 85U.S. 17 13 21 7 8 3 4Japan 12 10 10 5 6 5 10South Korea 8 4 5 -- 1 1 1Russia 5 3 3 2 3 3 3Other 2 -- -- -- -- -- --Not Sure 9 2 5 1 14 3 3
282007 Committee of 100 Survey

United States: When asked which nation will have the greatest degree of influence in East Asia twentyyears from now, China ranks first among all four samples. Congressional staffers (85%) are most likely to hold that opinion, followed by opinion leaders (70%), business leaders (56%) and the general public (47%). The U.S. ranks second among all four samples, followed closely by Japan and South Korea.Among Americans with more than a college education, 60 percent believe China will be the most dominant regional power, followed by Japan (15%), the U.S. (8%) and South Korea (5%).
China:China ranks first among all three samples. The Chinese public is more likely to select the U.S. (8%) than business leaders (4%) and opinion leaders (3%). Business leaders (10%) are more likely to think Japan will be the dominant power in East Asia than the general public (6%) and opinion leaders (5%). More than 70% of those with a high level of education think China will become the most influential country in East Asia in twenty years. More people with a high level of education select China and Japan than those with a middle level of education. 74% of Communist Party members think China will become the most influential country in East Asia in twenty years, which is 6 percentage points higher than for non-Party members.
2. Responding to the Rise of China
China’s Growing Military Power
16. (US SURVEY) How do you view China’s emergence as a military power—as a serious threat to the U.S., a potential threat, no threat, or as an ally of the U.S.?
US Survey
General Public Opinion Leaders Business Leaders Congressional Staffers
‘07 ‘05 ‘07 ‘05 ‘07 ‘05 ‘07 ‘05Serious Threat 22 15 20 12 17 16 19 36
Potential Threat 53 51 54 67 62 71 68 55
No Threat 12 16 13 14 11 8 11 5
Ally 8 13 11 4 8 3 2 2Not Sure 5 6 3 3 3 3 -- 2
United States: More than three-quarters of all four samples view China’s emergence as a military power as a serious or potential threat. Compared with 2005, the percentage of those who view China’s military power as a serious threat rose by 7 percentage points among the general public and 8 percentage points among opinion leaders. The same rate held constant among business
29 2007 Committee of 100 Survey

leaders and fell 17 percentage points among Congressional staffers. The percentage of those who view China as an ally rose only among opinion leaders and business leaders.
China’s Growing Economy
17. (BOTH SURVEYS) How do you view China’s emergence as a global economic power—as a serious threat to the U.S., a potential threat, no threat, or as an economic partner of the U.S.?
US Survey China Survey
General Public Opinion Leaders Business Leaders Congressional Staffers
General Public
Opinion Leaders
BusinessLeaders
‘07 ‘05 ‘07 ‘05 ‘07 ‘05 ‘07 ‘05 ‘07 ‘07 ‘07Serious Threat 25 24 29 30 31 31 32 49 13 5 6
Potential Threat 40 36 31 38 37 49 39 34 31 30 39
No Threat 7 11 7 7 5 5 4 3 23 30 20
Economic Partner 25 25 32 24 25 12 25 25 17 32 33Not Sure 4 4 2 2 1 3 -- -- 17 3 2
United States: More than sixty percent of each of the four samples view China’s emergence as an economic power as a serious or potential threat. One-quarter (25%) of Congressional staffers, business leaders and the general public view China as an economic partner, while 32 percent of opinion leaders hold the same view. Compared with 2005, the percentage of respondents who view China as a serious economic threat remains unchanged, except among Congressional staffers, where it fell 17 percentage points. The percentage that view China as an economic partner remains unchanged among the general public and Congressional staffers, while it rose 8 percentage points among opinion leaders and 13 percentage points among business leaders since 2005. 35 percent of 18-29 year-olds view China as an ally, while 53 percent view China as a threat. Among business leaders, those in manufacturing (76%) and retail (70%) are more likely to see China as a serious or potential threat than are those in trade associations (61%). Only 8% of business leaders in manufacturing view China as an economic partner, while 18% of those in retail and 37% of those in trade associations hold the same opinion.
China:The percentage of the general public (13%) who see China’s growing economy as a serious threat to the U.S. is higher than the percentages of business leaders (6%) and opinion leaders (5%). About one-in-three opinion leaders and business leaders think China can become an economic partner to the United States. Younger Chinese (18-29 year-olds) are more likely to view China as an economic partner to the U.S. than other age groups (22%). Business leaders in foreign-invested enterprises and joint ventures are more inclined to see China as becoming an economic partner to the U.S. (40%) and see China as posing no threat to the U.S. (25%) than those in domestic enterprises (including state-owned enterprises, domestic enterprises with mixed ownerships and private enterprises). Business leaders in
302007 Committee of 100 Survey

SOEs (48%) and domestic enterprises with mixed ownership (50%) are more inclined to view China as a potential threat to the U.S.
American Policy Toward China
18. (BOTH SURVEYS) I will now read two statements. Please tell me which comes closest to your view. Statement A: The U.S. accepts China’s status as a rising power and wants a collaborative relationship. Statement B: The U.S. is trying to prevent China from becoming a great power. 2007 Only US Survey China Survey
General Public
Opinion Leaders
BusinessLeaders
Congressional Staffers
General Public
Opinion Leaders
BusinessLeaders
Statement A 64 81 75 74 32 42 51Statement B 32 17 22 15 45 48 44Not Sure 5 3 3 11 23 10 6
United States: There is a broad consensus among all samples that the U.S. accepts China’s status and seeks a collaborative relationship. Still, one-third of the general public feels that the U.S. is trying to prevent China from becoming a great power, including 48% of younger Americans between the ages of 18 and 29. Democrats are also less likely to agree that the U.S. accepts China’s status (54%) than are Independents (66%) and Republicans (79%). Most of the American public (64%) say the U.S. understands China’s status as a rising power and wants a collaborative relationship. Those who have either finished high school, finished some college or have finished college embrace this opinion almost evenly. Respondents who have not finished high school are most likely to say (62%) the U.S. is trying to prevent China from becoming a great power.
China:The percentage of business leaders who feel the U.S. accepts China’s status (51%) is higher than the percentage of those who believe the U.S. is trying to contain China (44%). However, among the Chinese public and opinion leaders, the percentage of those who believe the U.S. is trying to prevent China from becoming a world power is higher than the percentage of those who believe the U.S. accepts China’s increasing status. 39% of younger Chinese between the ages of 18-29 believe “the U.S. accepts China’s status and wants cooperation,” this percentage is higher than other age groups. 47% of 30-39 year-olds believe the U.S. is preventing China from becoming a great power; higher than other age groups.People with high and medium levels of education (38%) are more likely to agree that the U.S. accepts China’s status than those with a lower education (29%).
31 2007 Committee of 100 Survey

3. Perspectives on the State of U.S.-China Relations
Important Foreign Partner
19-25. (US SURVEY) I am going to read to you a list of countries. For each, please tell me if they are the most important, a very important, a somewhat important, or not an important partner to the U.S. in the world today. (CHINA SURVEY) I am going to read to you a list of countries. For each, please tell me if they are the most important, a very important, a somewhat important, or not an important partner to China in the world today.
US Survey China Survey
General Public
Opinion Leaders
BusinessLeaders
Congressional Staffers
General Public
Opinion Leaders
BusinessLeaders
‘07 ‘05 ‘07 ‘05 ‘07 ‘07Imp* 75 79 89 95 91 88 55 73 57
England Not Imp. 24 19 12 5 9 11 26 27 42Imp 59 64 75 89 79 78 46 76 79
Japan Not Imp. 38 34 25 11 21 20 35 24 20Imp 55 48 68 58 69 82 64 90 91China (US
survey) /US (China survey)
Not Imp. 44 50 33 39 31 17 19 10 8
Imp 53 58 63 58 63 60 24 33 26Israel
Not Imp. 44 39 36 41 37 39 51 66 72Imp 47 44 60 52 64 56 26 39 43Saudi
Arabia Not Imp. 49 52 39 47 36 41 48 60 56Imp 35 45 53 58 49 38 60 88 94
RussiaNot Imp. 62 53 47 41 51 60 20 12 5Imp 32 31 55 49 52 66 36 49 48
IndiaNot Imp. 64 63 45 50 48 32 43 50 51
*“Important” includes “Most Important” and “Very Important;” “Not Important” includes “Somewhat Important” and “Not Very Important.”
**In the 2005 survey, the word “ally” was used instead of “partner,” and the question options also included South Korea, Taiwan and France.
United States: Respondents were asked to rate the individual importance of seven countries to the United States—England, Japan, China, Israel, Saudi Arabia, Russia and India. England rates as the most important partner to the U.S. across all four samples and all subgroups. Japan rates second among the general public (59%), opinion leaders (75%), business leaders (79%), Independents (58%) and Republicans (66%). Japan rates third among Congressional staffers (78%) and fourth among Democrats (51%).China rates second among Democrats (56%) and Congressional staffers (82%) and third among the general public (55%), opinion leaders (68%) and business leaders (69%). Among Republicans, China rates fourth (51%), behind England, Japan and Israel.
322007 Committee of 100 Survey
The importance of England and Japan has fallen among the general public and opinion leaders since the 2005 survey. In contrast, the importance of China rose 7 percentage points among the general public and 10 percentage points among opinion leaders.
China:When asked about the importance of countries as China’s partners, the general public and opinion leaders rate the U.S. as first and Russia second among the seven countries. Russia (94%) rates first among business leaders, followed by the U.S. (91%). City residents (69%) rate the U.S. first, and regard it as far more important than do people living in towns (50%) and rural areas (51%), and they put Russia second, while people living in towns and rural areas think Russia is more important than the U.S. as China’s partner.
Current Trends in U.S.-China Relations
26. (BOTH SURVEYS) Do you believe that the relationship between the U.S. and China is currently improving, getting worse, or is there no change?
US Survey China Survey
General Public Opinion Leaders Business Leaders Congressional Staffers
General Public
Opinion Leaders
BusinessLeaders
‘07 ‘05 ‘07 ‘05 ‘07 ‘05 ‘07 ‘05 ‘07 ‘07 ‘07Improving 28 45 38 56 37 43 24 27 29 22 27
Getting Worse 26 12 22 8 20 18 39 34 13 3 3
No Change 43 37 38 36 41 35 33 30 40 69 70
Not Sure 3 6 4 1 1 3 4 10 18 5 1
United States: Approximately one-quarter of the general public (28%) and Congressional staffers (24%) believe the relationship between the U.S. and China is improving. Opinion leaders and business leaders are more likely to believe that the relationship between the two nations is improving—38% and 37% respectively. While a plurality of the general public, business leaders and opinion leaders believe there has been no change, the plurality of Congressional staffers believe that relations are getting worse.Among 18-29 year-olds, one quarter (24%) feel relations between the two nations have improved, while half (49%) believe there has been no change. Older Americans—50 to 64 (34%) and over 65 (33%)—are more likely to see relations are improving. Opinion leaders from the public sector (52%) and the NGO community (42%) are also more likely to feel relations are improving compared to those in the media (26%) and academia (30%).While there has been little change since 2005 among business leaders and Congressional staffers in their evaluation of U.S.-China relations, opinion leaders and the general public are now twice as likely to believe that the relationship has become worse than they were in 2005. In 2005 a majority of opinion leaders (56%) and a plurality of the general public (45%) believed relations between the two nations were improving. Now only 38 percent of opinion leaders and 28 percent of the general public hold that opinion.
33 2007 Committee of 100 Survey
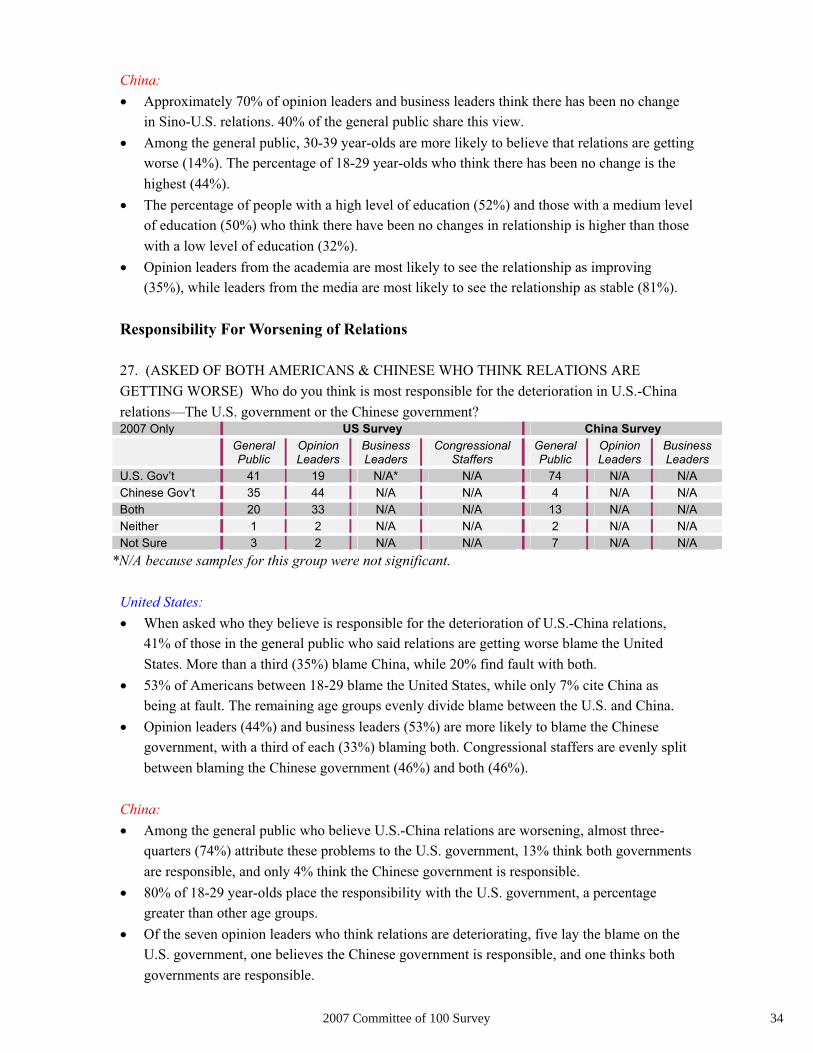
China:Approximately 70% of opinion leaders and business leaders think there has been no change in Sino-U.S. relations. 40% of the general public share this view. Among the general public, 30-39 year-olds are more likely to believe that relations are getting worse (14%). The percentage of 18-29 year-olds who think there has been no change is the highest (44%). The percentage of people with a high level of education (52%) and those with a medium level of education (50%) who think there have been no changes in relationship is higher than those with a low level of education (32%). Opinion leaders from the academia are most likely to see the relationship as improving (35%), while leaders from the media are most likely to see the relationship as stable (81%).
Responsibility For Worsening of Relations
27. (ASKED OF BOTH AMERICANS & CHINESE WHO THINK RELATIONS ARE GETTING WORSE) Who do you think is most responsible for the deterioration in U.S.-China relations—The U.S. government or the Chinese government?2007 Only US Survey China Survey
General Public
Opinion Leaders
BusinessLeaders
Congressional Staffers
General Public
Opinion Leaders
BusinessLeaders
U.S. Gov’t 41 19 N/A* N/A 74 N/A N/AChinese Gov’t 35 44 N/A N/A 4 N/A N/ABoth 20 33 N/A N/A 13 N/A N/ANeither 1 2 N/A N/A 2 N/A N/ANot Sure 3 2 N/A N/A 7 N/A N/A
*N/A because samples for this group were not significant.
United States: When asked who they believe is responsible for the deterioration of U.S.-China relations, 41% of those in the general public who said relations are getting worse blame the United States. More than a third (35%) blame China, while 20% find fault with both. 53% of Americans between 18-29 blame the United States, while only 7% cite China as being at fault. The remaining age groups evenly divide blame between the U.S. and China. Opinion leaders (44%) and business leaders (53%) are more likely to blame the Chinese government, with a third of each (33%) blaming both. Congressional staffers are evenly split between blaming the Chinese government (46%) and both (46%).
China:Among the general public who believe U.S.-China relations are worsening, almost three-quarters (74%) attribute these problems to the U.S. government, 13% think both governments are responsible, and only 4% think the Chinese government is responsible. 80% of 18-29 year-olds place the responsibility with the U.S. government, a percentage greater than other age groups. Of the seven opinion leaders who think relations are deteriorating, five lay the blame on the U.S. government, one believes the Chinese government is responsible, and one thinks both governments are responsible.
342007 Committee of 100 Survey

Government’s Performance on Bilateral Relations
28. (BOTH SURVEYS) How would you rate the Chinese government’s handling of its relations with the U.S.?
2007 Only US Survey China Survey
General Public
Opinion Leaders
BusinessLeaders
Congressional Staffers
General Public
Opinion Leaders
BusinessLeaders
Excellent 5 3 2 1 10 17 30Good 20 25 24 25 48 44 51POSITIVE 25 28 26 26 58 61 81Fair 43 50 50 45 25 34 14
Poor 27 21 21 29 2 3 5NEGATIVE 70 71 71 74 27 37 19Not Sure 6 3 3 -- 15 2 --
United States: Roughly one quarter of all four samples rate the Chinese government’s handling of relations with the U.S. as either excellent or good. Between 70% and 74% of each sample gives the Chinese government a negative rating, with Congressional staffers (29%) and the general public (27%) comprising highest percentages for a poor rating.Among the general public, Democrats (28%) and Independents (27%) hold a slightly more positive view of the Chinese governments handling of relations than do Republicans (19%).
China:A higher percentage of business leaders (81%) maintain a positive outlook on the Chinese government’s handling of Sino-U.S. relations as compared with opinion leaders (61%) and the general public (58%). Across all three groups, less than 6 percent give the Chinese government a poor rating.
29. (BOTH SURVEYS) How would you rate the U.S. government’s handling of its relations with China?
2007 Only US Survey China Survey
General Public
Opinion Leaders
BusinessLeaders
Congressional Staffers
General Public
Opinion Leaders
BusinessLeaders
Excellent 6 1 3 3 4 4 6Good 24 27 31 15 24 28 42POSITIVE 30 28 34 18 28 32 48Fair 40 53 51 52 41 53 42
Poor 26 18 15 30 14 13 8NEGATIVE 66 71 66 82 55 66 50Not Sure 3 2 1 -- 18 2 1
United States: When asked to rate the U.S. government’s handling of its relations with China, the American government receives a slightly more positive rating among business leaders (34%) and the
35 2007 Committee of 100 Survey

general public (30%) than the Chinese government. Opinion leaders (28%) rate both countries equally, while Congressional staffers take a more negative view of the American government’s efforts (82%) than the Chinese government’s efforts (74%).
China:Across the board, all three samples give lower average scores to the U.S. government than they do for their own government, with 55% of the general public, 66% of opinion leaders and 50% of business leaders giving a negative rating to the American government. A sizable percentage of opinion leaders (53%) think the government’s performance is fair, 11 and 12 percentage points respectively above the percentage of business leaders and the general public who hold this view.
362007 Committee of 100 Survey

Part III: U.S.-China Common Issues
1. General Perceptions of Mutual Issues
Greatest Concerns
30. (BOTH SURVEYS) What are your two greatest concerns about U.S.-China relations? 2007 Only US Survey China Survey
General Public
Opinion Leaders
BusinessLeaders
Congressional Staffers
General Public
Opinion Leaders
BusinessLeaders
Loss of U.S. jobs to China 41 31 39 12 5 4 4U.S. trade deficit with China 35 50 33 27 18 35 33China’s human rights situation (US survey)/The implementation of Chinese people’s legal rights (China survey)
27 28 29 25 8 6 19
China’s environmental degradation 17 23 23 18 20 15 16
China’s exchange rate policy 12 11 15 16 9 17 15
China’s military modernization 11 13 12 26 11 5 12
China’s energy consumption 9 15 14 24 15 17 18
Cultural differences 9 3 3 -- 4 4 8
U.S. military presence in Asia 6 4 5 5 10 15 13
China’s intellectual property infringement 5 10 12 15 7 1 7China’s responsibility in resolving the Darfur problem 4 1 3 4 1 1 --
Taiwan 3 7 3 20 40 59 53
Other 2 3 3 6 <1 3 --
Not sure 4 1 1 -- 31 4 1
*Percentages total more than 100% as respondents were asked to select the top two responses.
United States: The two greatest concerns about U.S.-China relations among the general public are the loss of U.S. jobs to China (41%) and the U.S. trade deficit with China (35%). These same two concerns are also the top two choices for business leaders (39% and 33%, respectively). Opinion Leaders hold those same two issues as most important, but in the reverse order—U.S. trade deficit (50%) and loss of jobs (31%). Congressional staffers are evenly divided among four issues: U.S. trade deficit (27%), China’s military modernization (26%), China’s human rights (25%) and China’s energy consumption (24%). Democrats (43%) and Republicans (48%) are most likely to cite the loss of U.S. jobs as the top issue, while Independents (37%) see the U.S. trade deficit as the greatest concern. Among opinion leaders, the trade deficit ranks as the most important issue, especially for those in the public sector (60%) and those in the media (50%).
37 2007 Committee of 100 Survey
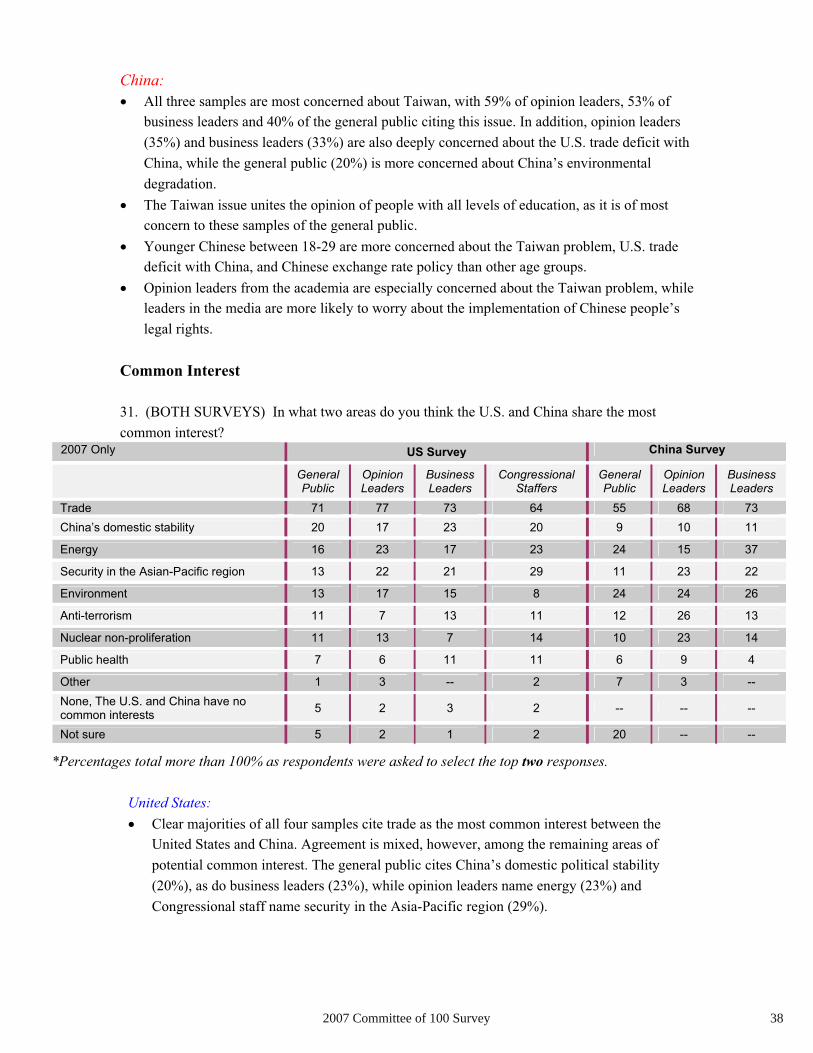
China:All three samples are most concerned about Taiwan, with 59% of opinion leaders, 53% of business leaders and 40% of the general public citing this issue. In addition, opinion leaders (35%) and business leaders (33%) are also deeply concerned about the U.S. trade deficit with China, while the general public (20%) is more concerned about China’s environmental degradation.The Taiwan issue unites the opinion of people with all levels of education, as it is of most concern to these samples of the general public. Younger Chinese between 18-29 are more concerned about the Taiwan problem, U.S. trade deficit with China, and Chinese exchange rate policy than other age groups.Opinion leaders from the academia are especially concerned about the Taiwan problem, while leaders in the media are more likely to worry about the implementation of Chinese people’s legal rights.
Common Interest
31. (BOTH SURVEYS) In what two areas do you think the U.S. and China share the most common interest?
2007 Only US Survey China Survey
General Public
Opinion Leaders
BusinessLeaders
Congressional Staffers
General Public
Opinion Leaders
BusinessLeaders
Trade 71 77 73 64 55 68 73China’s domestic stability 20 17 23 20 9 10 11
Energy 16 23 17 23 24 15 37
Security in the Asian-Pacific region 13 22 21 29 11 23 22
Environment 13 17 15 8 24 24 26
Anti-terrorism 11 7 13 11 12 26 13
Nuclear non-proliferation 11 13 7 14 10 23 14
Public health 7 6 11 11 6 9 4
Other 1 3 -- 2 7 3 --None, The U.S. and China have no common interests 5 2 3 2 -- -- --
Not sure 5 2 1 2 20 -- --
*Percentages total more than 100% as respondents were asked to select the top two responses.
United States: Clear majorities of all four samples cite trade as the most common interest between the United States and China. Agreement is mixed, however, among the remaining areas of potential common interest. The general public cites China’s domestic political stability (20%), as do business leaders (23%), while opinion leaders name energy (23%) and Congressional staff name security in the Asia-Pacific region (29%).
382007 Committee of 100 Survey

China:All three samples agree that trade is the area where China and the U.S. share the most interest, with 73% of business leaders, 68% of opinion leaders and 55% of the general public selecting trade. Among the remaining areas of potential common interest, the general public cites energy (24%) and the environment (24%). Business leaders select the same two issues, but put more emphasis on energy (37%) than the environment (26%), while the opinion leaders name anti-terrorism (26%), followed by the environment (24%). Opinion leaders (23%) and business leaders (22%) also cite security in the Asian-Pacific region as an important area of common interest.
Potential Conflicts
32. (BOTH SURVEYS) What are the two most likely sources of conflict between the U.S. and China in the near future?
2007 Only US Survey China Survey
General Public
Opinion Leaders
BusinessLeaders
Congressional Staffers
General Public
Opinion Leaders
BusinessLeaders
Trade 37 48 43 55 15 22 22Energy 26 20 23 36 10 24 17
Human rights 26 34 33 17 21 20 25
U.S. missile defense system 22 10 12 10 7 12 8
War in Iraq 19 7 18 2 8 2 6
Security in the Asian-Pacific region 16 19 14 7 17 19 21
Taiwan 15 27 18 50 54 74 71
Intellectual property rights 7 12 19 13 8 12 12
Anti-terrorism 6 9 11 -- 7 2 3
Tibet 2 4 1 -- 6 9 13
Other 2 5 2 6 7 3 1None, The U.S. and China are unlikely to have conflict 1 1 -- 1 1 -- --
Not sure 4 -- 1 -- 20 1 1
*Percentages total more than 100% as respondents were asked to select the top two responses.
United States: When asked to name the two most likely sources of conflict between China and the U.S., trade was rated highest among all four samples. The general public places equal weight on energy (26%) and human rights (26%) as the second most likely source of conflict, while business leaders and opinion leaders both rate human rights second. Congressional staffers, however, rate Taiwan as the second most likely source of conflict (50%), just under trade (55%).
China:The three samples see Taiwan as the area where China and the U.S. are most likely to have conflict: over 70% of opinion leaders and business leaders select this option, as do more than
39 2007 Committee of 100 Survey

half of the general public. Both the general public (21%) and business leaders (25%) rate human rights as the second most likely source of conflict, while opinion leaders cite energy (24%).Out of all the different age groups, younger Chinese (18-29 years old) are more concerned about the Taiwan issue (58%). They are also more likely to mention anti-terrorism (10%) and U.S. missile defense system (8%).
2. Investigation of Specific Shared Problems
Taiwan
(a) U.S. Involvement in China-Taiwan Relations
33. (US SURVEY) Please tell me whether you agree or disagree with the following statement: The U.S. should take an active role in China-Taiwan relations.
US Survey
General Public Opinion Leaders Business Leaders Congressional Staffers
‘07 ‘05 ‘07 ‘05 ‘07 ‘05 ‘07 ‘05Agree* 46 44 57 44 54 50 64 49
Disagree 50 47 40 53 44 47 27 28
Not Sure 4 9 4 4 2 3 9 24
*In 2005 the question was presented as “Yes/No” and asked about a “more active role.”
United States: A majority of Congressional staffers (64%), business leaders (54%) and opinion leaders (57%) agree the U.S. should take an active role in China-Taiwan relations, while less than half of the general public (46%) agrees. The rate of agreement has risen among all four samples since 2005, most notably among Congressional staff where there has been a 15 percentage point increase.There is little variation among subgroups, however, with Independents (53%) and males (53%) as more likely to agree with an active U.S. role.
(b) U.S. Military Obligations to Taiwan
34. (US SURVEY) If a declaration of independence by Taiwan leads to military hostilities, should the U.S. intervene on behalf of Taiwan?
US Survey
General Public Opinion Leaders Business Leaders Congressional Staffers
‘07 ‘05 ‘07 ‘05 ‘07 ‘05 ‘07 ‘05Yes 32 32 31 55 23 48 49 52
No 60 59 59 39 72 50 28 19
Not Sure 9 9 11 6 5 3 23 29
402007 Committee of 100 Survey

United States: Congressional staffers are more likely than those in any other sample to agree that the U.S. should intervene in the event of military hostilities between China and Taiwan following a declaration of Taiwanese independence. While nearly half of Congressional staffers (49%) support intervention, less than one-third of the general public (32%), opinion leaders (31%) and business leaders (23%) feel the same. Among subgroups, Independents (38%), men (42%) and those living in Western America (42%) are more likely to support intervention than are Republicans (21%), women (22%) and those in the South (25%) and East (28%).Opinion in the general public regarding U.S. involvement on behalf of Taiwan should they declare independence has not changed since the 2005 survey, with one-third (32%) still in support. Among business leaders and opinion leaders, however, support for intervention fell significantly—24 percentage points among opinion leaders and 25 percentage points among business leaders. The opinions of Congressional staffers remained largely unchanged.
(c) Current Cross-Strait Relations
35. (CHINA SURVEY) Which of the following do you think is the most accurate description of the current Cross-Strait situation?
2007 Only China Survey
General Public
Opinion Leaders
BusinessLeaders
Taiwan Issue is Evolving Toward Peaceful Resolution 53 41 53
Taiwan Issue Has Become a Deadlock 16 32 27
Taiwan Issue is Evolving Toward Military Conflict 12 17 12
None/Not Sure 19 9 8
China:The general public (53%) and business leaders (53%) are notably more optimistic about the present situation in the Taiwan Strait and believe the issue is evolving toward a peaceful resolution as compared to opinion leaders (41%). Opinion leaders (49%) are more pessimistic about this issue and think it has become a deadlock or that it is evolving toward military conflicts than are the general public (28%) and business leaders (39%). City residents (45%) are more pessimistic about the Taiwan issue, as opposed to their town (31%) and rural (21%) counterparts. Men (32%) tend to adopt a more optimistic attitude toward this issue than women (25%).
41 2007 Committee of 100 Survey

(d) Solution to the Taiwan Issue
36. (CHINA SURVEY) Among the following measures that China can take to resolve the Taiwan problem, which one do you think will be most appropriate? 2007 Only China Survey
General Public
Opinion Leaders
BusinessLeaders
Eventually Achieving Unification By Expanding Cross-Strait Exchanges 52 66 57
Forcing Taiwan to Return to China By Exerting Economic Pressure 17 10 21
Achieving Unification By Force 11 7 12
Observing Measures Taken by Taiwanese Authorities 6 12 9
Doing Nothing 1 1 --Not Sure 15 4 1
China:All samples regard achieving unification by expanding cross-strait exchanges as the most appropriate measure to resolve the Taiwan issue: 66% of opinion leaders, 57% of business leaders and 52% of the general public select this option. The percentage of business leaders who favor the use of force and economic pressure is higher than the other two groups. 60% of the Communist Party members favor achieving unification by expanding cross-strait exchanges, while 12% of them select unification by force; these two percentages are 8 and 2 percentage points above the percentages of non-Party members.
Trade
(a) Shared Benefit of Trade
37. (US SURVEY) Please tell me whether you agree or disagree with the following statement: Trade with China is beneficial to the U.S. economy. (CHINA SURVEY) Please tell me whether you agree or disagree with the following statement: Trade with the U.S. is beneficial to China’s economy.
US Survey China SurveyGeneral Public
Opinion Leaders
BusinessLeaders
CongressionalStaffers
General Public
Opinion Leaders
BusinessLeaders
‘07 ‘05 ‘07 ‘05 ‘07 ‘05 ‘07 ‘05 ‘07 ‘07 ‘07Strongly Agree 43 35 47 47 51 35 42 25 20 50 45Somewhat Agree 29 38 38 34 32 47 43 43 62 49 54AGREE 72 73 85 81 83 82 85 68 82 99 99Somewhat Disagree 10 12 7 8 9 11 10 19 6 1 1Strongly Disagree 17 14 9 7 8 7 5 2 1 0 0DISAGREE 27 26 16 15 17 18 15 21 7 1 1Not Sure 1 2 1 3 -- 1 -- 2 11 0 0
422007 Committee of 100 Survey

United States: Nearly three-quarters of respondents in each of the four samples agree that trade with China is beneficial to the U.S. economy, including more than 40% in each group who strongly agree. Agreement is lowest among the general public, but only 27 percent disagree with the statement. Compared to 2005, agreement is largely unchanged, except among Congressional staffers where the number rose by 17 percentage points.There is no significant variation by subgroup, including union membership.
China:Almost all opinion and business leaders (99%) agree that trade with the U.S. is beneficial to China’s economy. Similar to the U.S., agreement is lowest among the general public, but even then, only 7 percent disagree with the statement.
38. (BOTH SURVEYS) Please tell me whether you agree or disagree with the following statement: Products from China benefit American consumers because of their low cost.
United States: At least two-thirds of respondents in each sample agree that American consumers benefit in some way from Chinese-made products. Among the general public and Congressional staffers, agreement has risen since 2005 (4 and 18 percentage points, respectively), while at the same time, that rate has fallen among opinion and business leaders (13 and 9 percentage points, respectively).Just over half of union members (54%) agree that Chinese-made products benefit American consumers, as compared to 60 percent of non-union members.
China:86% of opinion leaders agree that Chinese-made products benefit Americans because of their low cost, 22 and 6 percentage points above the numbers for the general public and business leaders.
US Survey China SurveyGeneral Public
Opinion Leaders
BusinessLeaders
CongressionalStaffers
General Public
Opinion Leaders
BusinessLeaders
‘07 ‘05 ‘07 ‘05 ‘07 ‘05 ‘07 ‘05 ‘07 ‘07 ‘07Strongly Agree 32 28 30 37 41 28 33 15 17 36 22Somewhat Agree 35 35 35 41 27 49 43 43 47 50 58AGREE 67 63 65 78 68 77 76 58 64 86 80Somewhat Disagree 13 18 19 12 11 14 14 24 17 10 17Strongly Disagree 21 17 16 11 22 9 10 19 3 3 2DISAGREE 34 35 35 23 33 23 24 43 20 13 19Not Sure <1 3 1 -- -- 9 -- -- 16 1 0
43 2007 Committee of 100 Survey

(b) Responsibility for Trade Deficit
39. (BOTH SURVEYS) Who do you think is most responsible for the U.S.’s large trade deficit with China—The U.S. government or the Chinese government? 2007 Only US Survey China Survey
General Public
Opinion Leaders
BusinessLeaders
Congressional Staffers
General Public
Opinion Leaders
BusinessLeaders
U.S. Gov’t 65 58 43 18 35 39 36Chinese Gov’t 15 18 27 20 7 8 7Both 10 12 23 40 27 37 39Neither 3 8 6 20 3 7 3Not Sure 8 5 2 2 28 9 15
United States: More than half of the general public (65%) and opinion leaders (58%) believe the United States is most responsible for the large trade deficit with China, while a plurality of business leaders (43%) hold the same opinion. Among Congressional staffers, a plurality (40%) blames both nations, while near equal numbers blame China (20%) and the United States (18%).
China:A majority of all three samples think the U.S. government or both governments are responsible for U.S. trade deficit with China; those who think the Chinese government is responsible take up less than 9 percent.
Chinese Product Safety
40. (BOTH SURVEYS) Please tell me whether you agree or disagree with the following statement: Chinese food contamination cases have reduced your confidence in products made in China.
2007 Only US Survey China Survey
General Public
Opinion Leaders
BusinessLeaders
Congressional Staffers
General Public
Opinion Leaders
BusinessLeaders
Strongly Agree 52 64 65 53 9 16 10Somewhat Agree 16 23 14 36 35 32 28AGREE 68 87 79 89 44 48 38Somewhat Disagree 14 8 9 6 30 42 49Strongly Disagree 16 5 12 4 10 11 14DISAGREE 30 13 21 10 40 53 63Not Sure 2 1 1 1 16 0 0
United States: A wide majority of all respondents agree that food contamination cases have reduced their confidence in Chinese-made products, with a majority of each sample in strong agreement. Nearly two-thirds of business leaders (65%) and opinion leaders (64%) are in strong agreement.
442007 Committee of 100 Survey
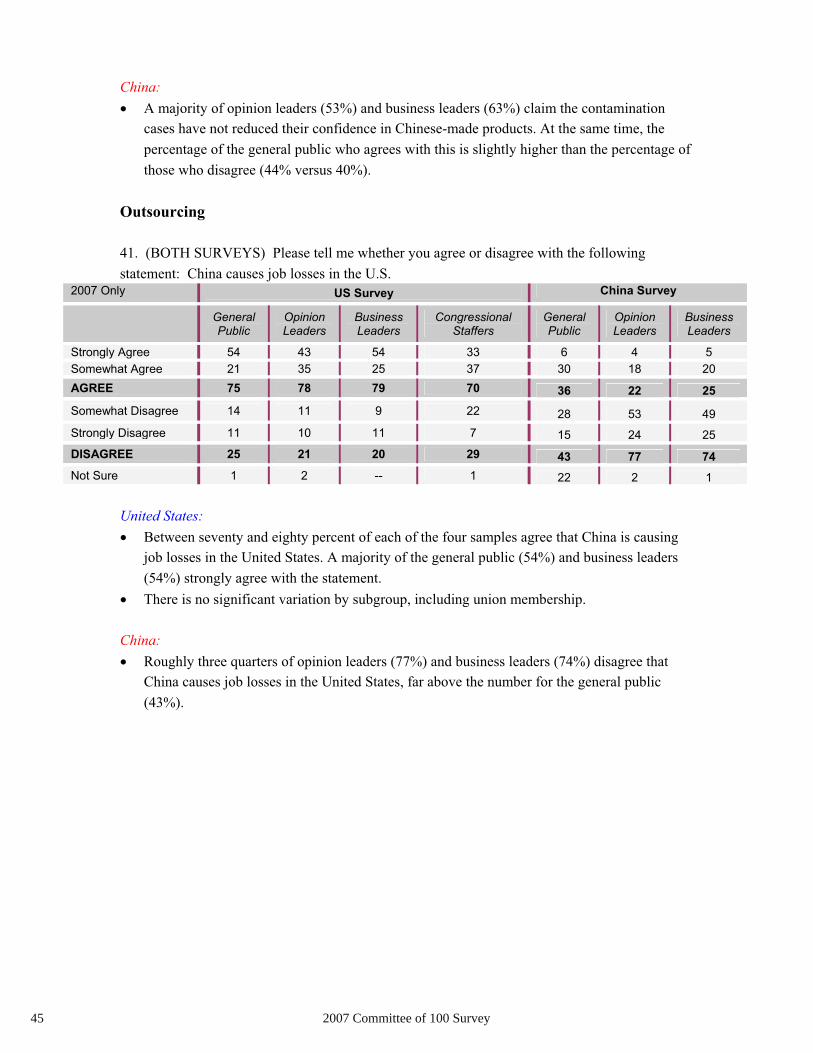
China:A majority of opinion leaders (53%) and business leaders (63%) claim the contamination cases have not reduced their confidence in Chinese-made products. At the same time, the percentage of the general public who agrees with this is slightly higher than the percentage of those who disagree (44% versus 40%).
Outsourcing
41. (BOTH SURVEYS) Please tell me whether you agree or disagree with the following statement: China causes job losses in the U.S.
2007 Only US Survey China Survey
General Public
Opinion Leaders
BusinessLeaders
Congressional Staffers
General Public
Opinion Leaders
BusinessLeaders
Strongly Agree 54 43 54 33 6 4 5Somewhat Agree 21 35 25 37 30 18 20AGREE 75 78 79 70 36 22 25Somewhat Disagree 14 11 9 22 28 53 49Strongly Disagree 11 10 11 7 15 24 25DISAGREE 25 21 20 29 43 77 74Not Sure 1 2 -- 1 22 2 1
United States: Between seventy and eighty percent of each of the four samples agree that China is causing job losses in the United States. A majority of the general public (54%) and business leaders (54%) strongly agree with the statement. There is no significant variation by subgroup, including union membership.
China:Roughly three quarters of opinion leaders (77%) and business leaders (74%) disagree that China causes job losses in the United States, far above the number for the general public (43%).
45 2007 Committee of 100 Survey
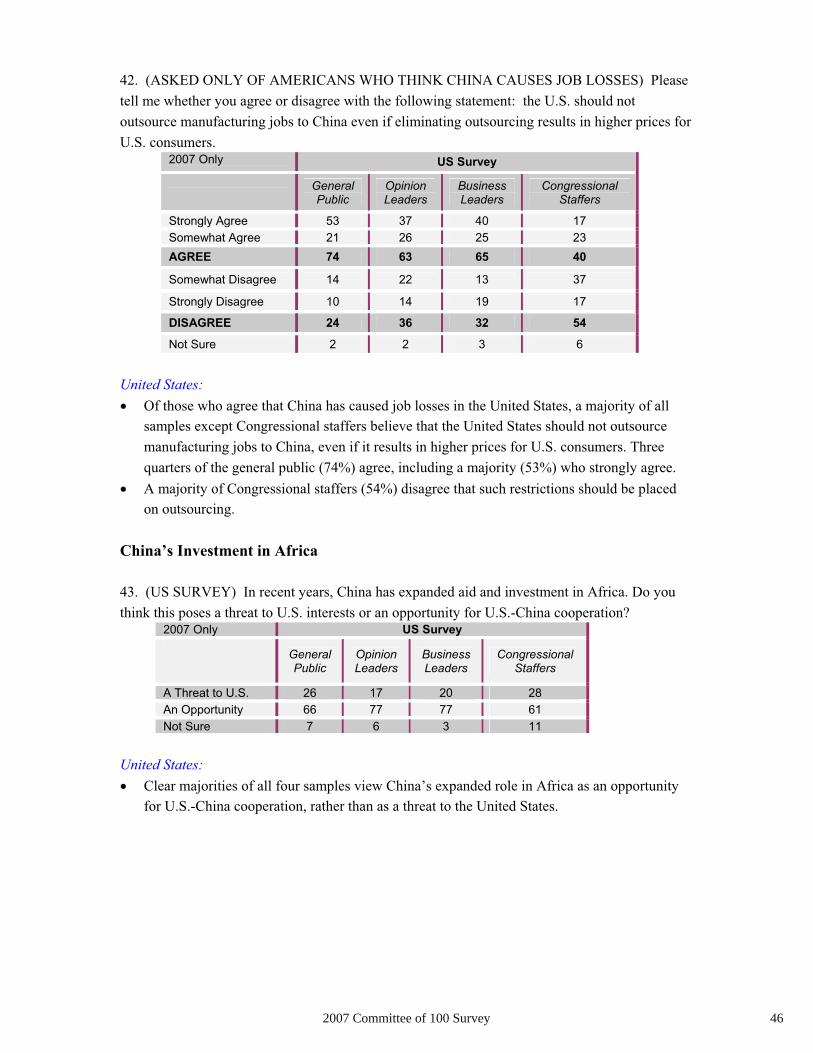
42. (ASKED ONLY OF AMERICANS WHO THINK CHINA CAUSES JOB LOSSES) Please tell me whether you agree or disagree with the following statement: the U.S. should not outsource manufacturing jobs to China even if eliminating outsourcing results in higher prices for U.S. consumers.
2007 Only US Survey
General Public
Opinion Leaders
BusinessLeaders
Congressional Staffers
Strongly Agree 53 37 40 17Somewhat Agree 21 26 25 23AGREE 74 63 65 40
Somewhat Disagree 14 22 13 37
Strongly Disagree 10 14 19 17
DISAGREE 24 36 32 54
Not Sure 2 2 3 6
United States: Of those who agree that China has caused job losses in the United States, a majority of all samples except Congressional staffers believe that the United States should not outsource manufacturing jobs to China, even if it results in higher prices for U.S. consumers. Three quarters of the general public (74%) agree, including a majority (53%) who strongly agree.A majority of Congressional staffers (54%) disagree that such restrictions should be placed on outsourcing.
China’s Investment in Africa
43. (US SURVEY) In recent years, China has expanded aid and investment in Africa. Do you think this poses a threat to U.S. interests or an opportunity for U.S.-China cooperation?
2007 Only US Survey
General Public
Opinion Leaders
BusinessLeaders
Congressional Staffers
A Threat to U.S. 26 17 20 28An Opportunity 66 77 77 61Not Sure 7 6 3 11
United States: Clear majorities of all four samples view China’s expanded role in Africa as an opportunity for U.S.-China cooperation, rather than as a threat to the United States.
462007 Committee of 100 Survey
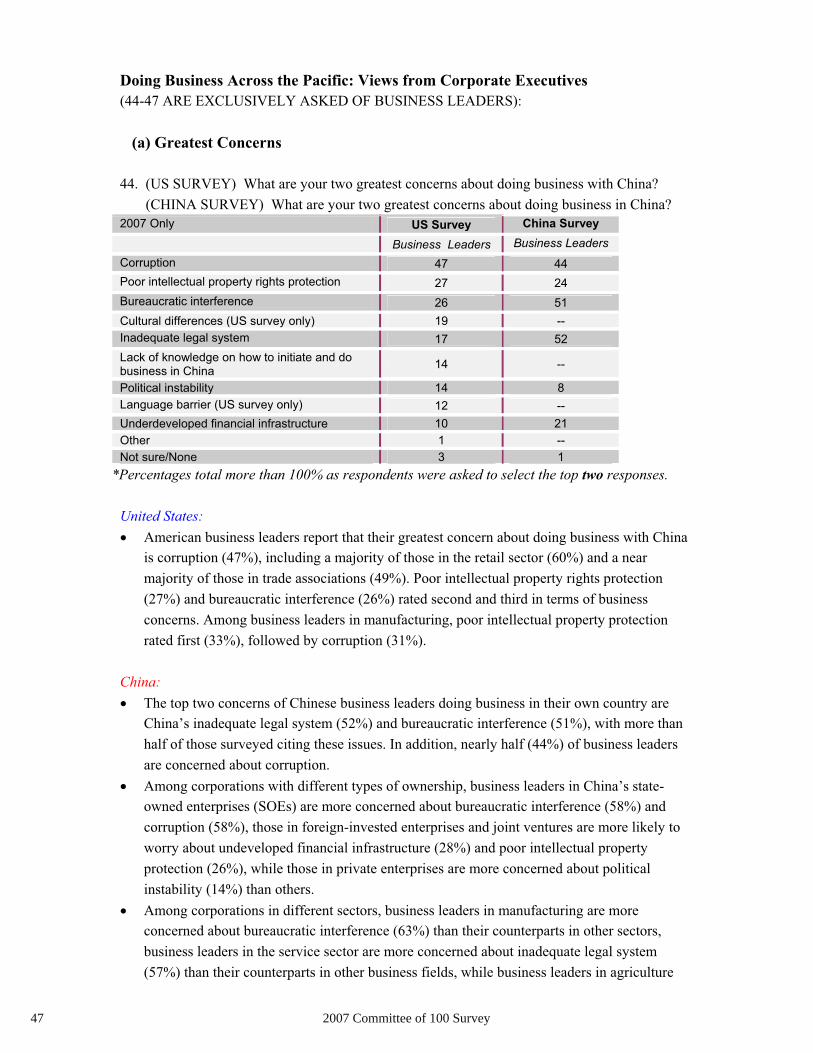
Doing Business Across the Pacific: Views from Corporate Executives (44-47 ARE EXCLUSIVELY ASKED OF BUSINESS LEADERS):
(a) Greatest Concerns
44. (US SURVEY) What are your two greatest concerns about doing business with China? (CHINA SURVEY) What are your two greatest concerns about doing business in China? 2007 Only US Survey China Survey
Business Leaders Business LeadersCorruption 47 44Poor intellectual property rights protection 27 24Bureaucratic interference 26 51Cultural differences (US survey only) 19 --Inadequate legal system 17 52Lack of knowledge on how to initiate and do business in China 14 --
Political instability 14 8Language barrier (US survey only) 12 --Underdeveloped financial infrastructure 10 21Other 1 --Not sure/None 3 1
*Percentages total more than 100% as respondents were asked to select the top two responses.
United States: American business leaders report that their greatest concern about doing business with China is corruption (47%), including a majority of those in the retail sector (60%) and a near majority of those in trade associations (49%). Poor intellectual property rights protection (27%) and bureaucratic interference (26%) rated second and third in terms of business concerns. Among business leaders in manufacturing, poor intellectual property protection rated first (33%), followed by corruption (31%).
China:The top two concerns of Chinese business leaders doing business in their own country are China’s inadequate legal system (52%) and bureaucratic interference (51%), with more than half of those surveyed citing these issues. In addition, nearly half (44%) of business leaders are concerned about corruption. Among corporations with different types of ownership, business leaders in China’s state-owned enterprises (SOEs) are more concerned about bureaucratic interference (58%) and corruption (58%), those in foreign-invested enterprises and joint ventures are more likely to worry about undeveloped financial infrastructure (28%) and poor intellectual property protection (26%), while those in private enterprises are more concerned about political instability (14%) than others.Among corporations in different sectors, business leaders in manufacturing are more concerned about bureaucratic interference (63%) than their counterparts in other sectors, business leaders in the service sector are more concerned about inadequate legal system (57%) than their counterparts in other business fields, while business leaders in agriculture
47 2007 Committee of 100 Survey

worry about poor intellectual property protection (41%) and fragile financial system (29%) more than any other sector.
(CHINA SURVEY) What are your two greatest concerns about doing business with the U.S.?
2007 Only China Survey Business Leaders
U.S. import measures (e.g. tariff protections, anti-dumping) 39
U.S. bureaucratic interference 34Differences in culture and customs 33Differences in laws and regulations 28Importance of product quality to Americans 17Complicated trade approval procedures 17Lack of knowledge about doing business in U.S. 10
Highly seasonable U.S. product markets 8Language barriers 7U.S. export measures (policies encouraging exports) 5
Not sure/None 3*Percentages total more than 100% as respondents were asked to select the top two responses.
China:U.S. import measures are the top concern of Chinese business leaders conducting business with the United States (39%). U.S. bureaucratic interference (34%) and differences in culture and customs (33%) come next. Business leaders with SOEs (43%) and foreign-invested enterprises/joint ventures (39%) are most concerned about U.S. import measures, while those with mixed-ownership domestic enterprises (50%) are most worried about US bureaucratic interference. Respondents from private enterprises (46%) are most concerned about different laws and regulations.Business leaders in the agricultural sector are more likely to worry about American import measures (59%) and bureaucratic interference (59%), those in the manufacturing sector are more likely to be concerned about the product quality control (18%), while those in the service sector are more likely to be concerned about differences in culture (39%) and regulations (37%).
482007 Committee of 100 Survey

(b) Intellectual Property Rights in China
45. (BOTH SURVEYS) Please tell me whether you agree with the following statement: China’s current intellectual property rights protection policy has a negative impact on foreign investment.
2007 Only US Survey China Survey
BusinessLeaders
BusinessLeaders
Strongly Agree 45 9
Somewhat Agree 24 26
AGREE 69 35
Somewhat Disagree 7 41
Strongly Disagree 11 21
DISAGREE 18 62
Not Sure 14 3
United States: More than two-thirds of business leaders (69%) agree that China’s problems with intellectual property protection have a negative impact on foreign investment in China, including 45% who strongly agree. Among business leaders in high tech industries, 77% agree with the statement with a majority (57%) in strong agreement.
China:The percentage of business leaders who disagree with the idea that China’s current intellectual property protection policy has negatively impacted international investment (62%) is notably higher than the percentage of those who agree (35%).
(c) Impact of U.S. Immigration Policy
46. (US SURVEY) Please tell me whether you agree with the following statement: Current U.S. visa policy has interfered with your ability to hire foreign-born skilled professionals.
2007 Only US Survey
BusinessLeaders
Strongly Agree 35Somewhat Agree 11
AGREE 46Somewhat Disagree 12
Strongly Disagree 33
DISAGREE 45Not Sure 9
United States: Business leaders are evenly divided over whether current U.S. visa policies have interfered with their ability to hire foreign-born skilled professionals. Overall, the number of business
49 2007 Committee of 100 Survey

leaders who say the U.S. visa policy has interfered with their ability to hire skilled, foreign-born professionals (46%), is about the same as those who have not had a problem (45%).
(d) China’s Future Role in the Global Economy
47. (BOTH SURVEYS) In your opinion, what will be China’s role in the global economy twenty years from now?
2007 Only US Survey China Survey BusinessLeaders
BusinessLeaders
World’s largest exporter 69 61Key destination for outsourcing manufacturing 65 30World’s largest consumer society 52 71Leader in developing high-tech products 47 14Key destination for outsourcing services 44 27
Other 2 --Not sure 1 1
*Percentages total more than 100% as respondents were asked to select the top two responses.
United States: Business leaders are evenly divided over what role China will take in the global economy twenty years from now. 69% of business leaders believe China will be the world’s largest exporter, while 65% believe China will be the key destination for outsourcing manufacturing.
China:In twenty years, 71% of business leaders think China will become the world’s largest consumer society, and 61% think China will become the world’s largest exporter. Less than one third of business leaders think China will become a key destination for outsourcing manufacturing (30%). Business leaders in manufacturing (74%) are more likely to believe China will become the world’s largest consumer society as compared to those in the service sector (64%). On the other hand, those in the service sector (71%) are more likely to believe China will become the world’s largest exporter as compared to those in the manufacturing sector (66%) who share this view.
502007 Committee of 100 Survey

The Environment
(a) Global Warming Concerns
48. (BOTH SURVEYS) How much do you personally worry about global warming—a great deal, a fair amount, only a little, or not at all? 2007 Only US Survey China Survey
General Public
Opinion Leaders
BusinessLeaders
Congressional Staffers
General Public
Opinion Leaders
BusinessLeaders
A Great Deal 29 26 27 28 20 48 38A Fair Amount 32 34 35 31 49 44 51Only a Little 20 23 28 19 19 6 10Not at All 20 18 10 22 7 2 1Not Sure <1 1 -- -- 5 -- 1
United States: A majority of all four samples worry about global warming (either a great deal or a fair amount). 61 percent of the general public worries about global warming, including three-quarters of Democrats (75%), 70 percent of Independents and only 37 percent of Republicans. Females are also more likely to worry about global warming (67%) than are males (54%), as are those between the ages of 18 and 29 (66%).
China:A large majority of both opinion leaders (92%) and business leaders (89%) worry about global warming (either a great deal or a fair amount). The general public, however, appears less worried (69%). The percentage of 18-29 year-olds (72%) worried about global warming is higher than other age groups.People with a high level of education (83%) are more worried about global warming, 20 percentage points above those with medium and low levels of education.
(b) Environmental Stewardship
49. (BOTH SURVEYS) How would you rate the Chinese government’s performance in handling environmental issues?
2007 Only US Survey China Survey
General Public
Opinion Leaders
BusinessLeaders
Congressional Staffers
General Public
Opinion Leaders
BusinessLeaders
Excellent 1 -- 1 -- 6 5 14Good 9 5 5 3 51 44 49POSITIVE 10 5 6 3 57 49 63
Fair 30 20 15 5 28 40 28
Poor 50 64 70 88 5 10 8
NEGATIVE 80 84 85 93 33 50 36
Not Sure 11 11 9 4 10 1 1
51 2007 Committee of 100 Survey

United States: More than 80 percent of all four samples give the Chinese government a negative rating on environmental performance. Of those who have visited mainland China, 15 percent give the Chinese government a positive rating, and 71 percent give the government a negative rating.
China:The majority of business leaders (63%) and the general public (57%) believe their government is doing a good job in addressing environmental issues, while nearly half of opinion leaders (49%) share this view.
50. (BOTH SURVEYS) How would you rate the American government’s performance in handling environmental issues?
2007 Only US Survey China Survey
General Public
Opinion Leaders
BusinessLeaders
Congressional Staffers
General Public
Opinion Leaders
BusinessLeaders
Excellent 7 1 3 10 5 11 12Good 22 27 27 19 46 52 69POSITIVE 29 28 30 29 51 63 81
Fair 44 50 48 50 21 23 12
Poor 26 24 21 21 5 8 5
NEGATIVE 70 74 69 71 26 31 17
Not Sure 1 -- -- -- 24 6 3
United States: The American government receives slightly higher ratings than the Chinese government for its performance on environmental issues, still less than a third of each of the four samples gives the government a positive rating.
China:The percentage of business leaders (81%) who think the U.S. government does a good job in environmental issues is higher than the percentages of opinion leaders (63%) and the general public (51%). Opinion leaders who think that the U.S. government does not do a good job (31%) outweigh both business leaders (26%) and the general public (17%).
3. Assessing Congress’s Understanding of China(51-55 ARE EXCLUSIVELY ASKED OF CONGRESSIONAL STAFFERS):
Access to Information on China
51. Please tell me whether you agree with the following statement: I feel my member of Congress and our Congressional office have access to enough relevant information about China and the state of U.S.-China relations.
522007 Committee of 100 Survey

US Survey 2007 Only
Congressional Staffers
Strongly Agree 28Somewhat Agree 49
AGREE 77Somewhat Disagree 14Strongly Disagree 6
DISAGREE 20Not Sure 3
A strong majority of Congressional staffers (77%) say they have enough access to information about China and U.S. relations. Only 20% of respondents said they did not have enough access to pertinent information.
Communication with Chinese Officials
52. Have you ever communicated directly with Chinese officials on U.S.-China issues?
Slightly more than half (55%) of Congressional staffers have been in contact with Chinese officials in regard to U.S. relations with China, as compared to those who have not (45%).
53. (ASKED ONLY OF CONGRESSIONAL STAFFERS WHO RESPONDED “YES” TO THE PREVIOUS QUESTION) On a scale of 1 to 5 with 1 being “not at all useful” and 5 being “highly useful,” how would you rate the usefulness of your exchange with Chinese officials?
2007 Only US Survey
Congressional Staffers(1) Not at All Useful 16(2) 20
(3) 27
(4) 27
(5) Highly Useful 7
Not Sure 2
Those who have made exchanges with Chinese officials report mixed feelings as to its effectiveness, with 34% saying it was a positive and helpful experience and 36% saying it was not that helpful.
Communication with Chinese Americans
54. Have you ever communicated directly with Chinese Americans on U.S.-China issues?
53 2007 Committee of 100 Survey

Most Congressional staffers (64%) report having contacted Chinese Americans with regard to U.S.-China issues. About one-third (34%) say they have not contacted Chinese Americans about issues between the two countries.
55. (ASKED ONLY OF CONGRESSIONAL STAFFERS WHO RESPONDED “YES” TO THE PREVIOUS QUESTION) On a scale of 1 to 5 with 1 being “not at all useful” and 5 being “highly useful,” how would you rate the usefulness of your exchange with Chinese Americans?
2007 Only US Survey Congressional
Staffers(1) Not at All Useful --(2) 3
(3) 39
(4) 34
(5) Highly Useful 23
More than half (57%) of all those who interacted with Chinese Americans about U.S.-China issues say the exchange was helpful. Only three percent of respondents say the contact lacked any real usefulness.
542007 Committee of 100 Survey
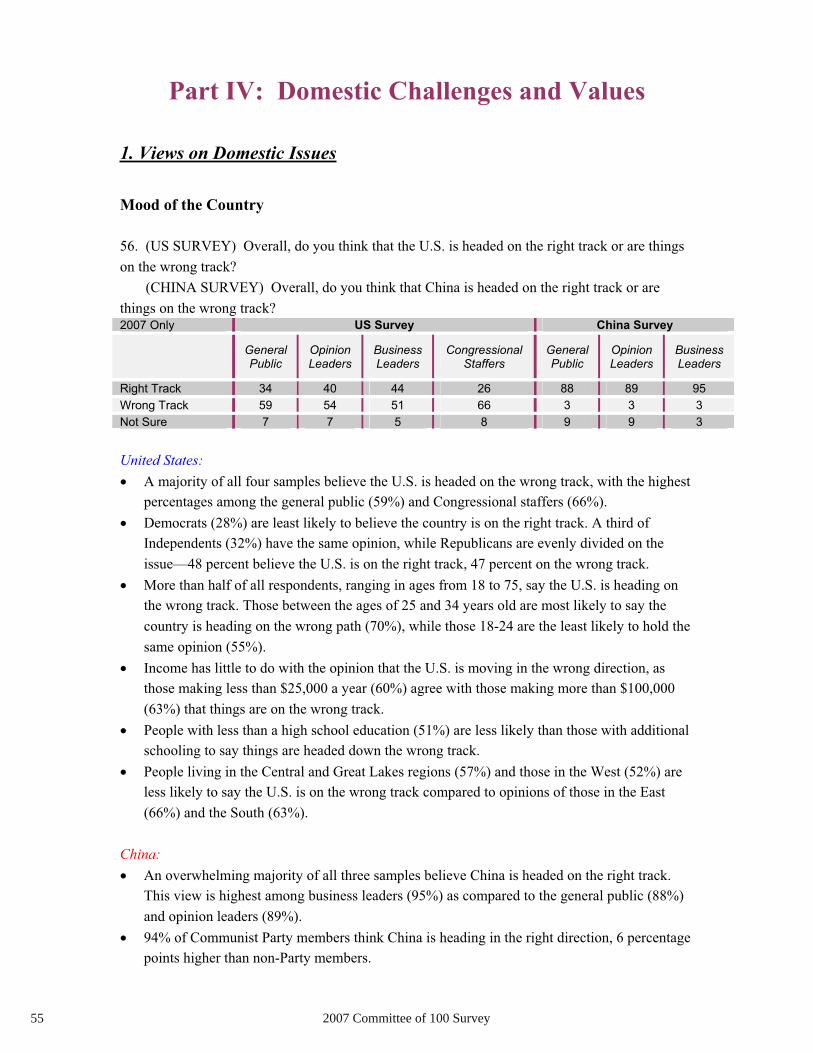
Part IV: Domestic Challenges and Values
1. Views on Domestic Issues
Mood of the Country
56. (US SURVEY) Overall, do you think that the U.S. is headed on the right track or are things on the wrong track? (CHINA SURVEY) Overall, do you think that China is headed on the right track or are things on the wrong track? 2007 Only US Survey China Survey
General Public
Opinion Leaders
BusinessLeaders
Congressional Staffers
General Public
Opinion Leaders
BusinessLeaders
Right Track 34 40 44 26 88 89 95Wrong Track 59 54 51 66 3 3 3Not Sure 7 7 5 8 9 9 3
United States: A majority of all four samples believe the U.S. is headed on the wrong track, with the highest percentages among the general public (59%) and Congressional staffers (66%).Democrats (28%) are least likely to believe the country is on the right track. A third of Independents (32%) have the same opinion, while Republicans are evenly divided on the issue—48 percent believe the U.S. is on the right track, 47 percent on the wrong track. More than half of all respondents, ranging in ages from 18 to 75, say the U.S. is heading on the wrong track. Those between the ages of 25 and 34 years old are most likely to say the country is heading on the wrong path (70%), while those 18-24 are the least likely to hold the same opinion (55%). Income has little to do with the opinion that the U.S. is moving in the wrong direction, as those making less than $25,000 a year (60%) agree with those making more than $100,000 (63%) that things are on the wrong track. People with less than a high school education (51%) are less likely than those with additional schooling to say things are headed down the wrong track. People living in the Central and Great Lakes regions (57%) and those in the West (52%) are less likely to say the U.S. is on the wrong track compared to opinions of those in the East (66%) and the South (63%).
China:An overwhelming majority of all three samples believe China is headed on the right track. This view is highest among business leaders (95%) as compared to the general public (88%) and opinion leaders (89%). 94% of Communist Party members think China is heading in the right direction, 6 percentage points higher than non-Party members.
55 2007 Committee of 100 Survey
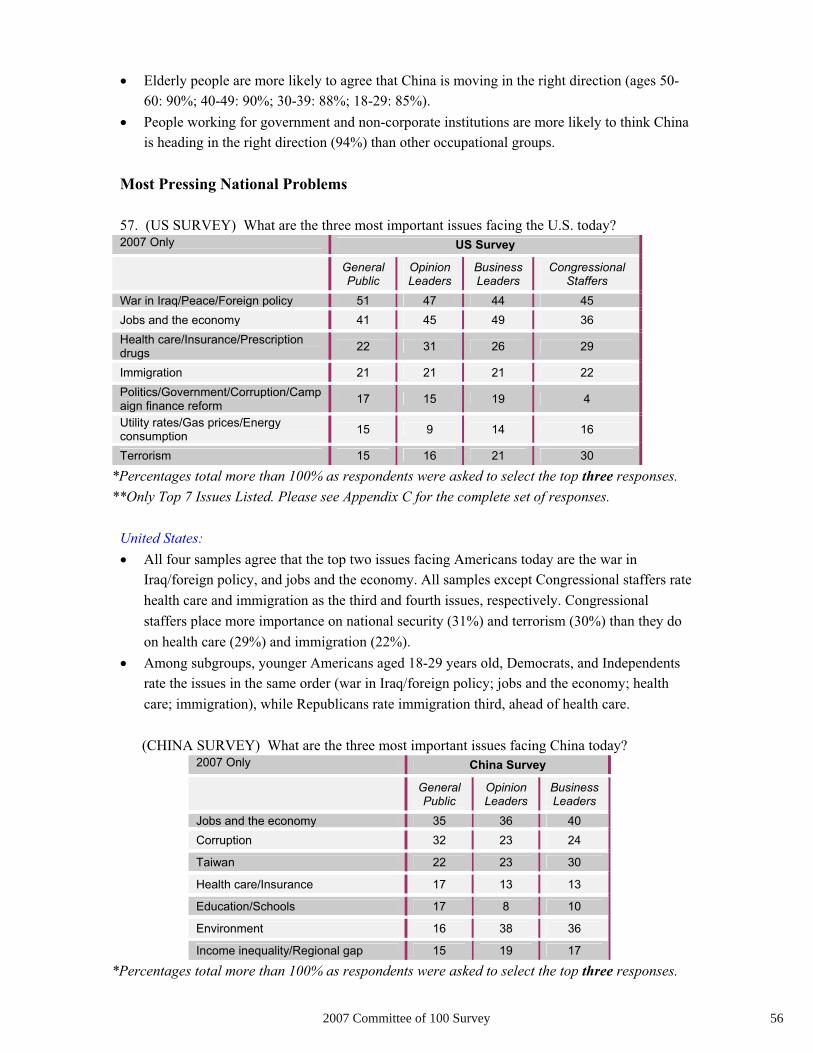
Elderly people are more likely to agree that China is moving in the right direction (ages 50-60: 90%; 40-49: 90%; 30-39: 88%; 18-29: 85%). People working for government and non-corporate institutions are more likely to think China is heading in the right direction (94%) than other occupational groups.
Most Pressing National Problems
57. (US SURVEY) What are the three most important issues facing the U.S. today? 2007 Only US Survey
General Public
Opinion Leaders
BusinessLeaders
Congressional Staffers
War in Iraq/Peace/Foreign policy 51 47 44 45Jobs and the economy 41 45 49 36Health care/Insurance/Prescription drugs 22 31 26 29
Immigration 21 21 21 22Politics/Government/Corruption/Campaign finance reform 17 15 19 4
Utility rates/Gas prices/Energy consumption 15 9 14 16
Terrorism 15 16 21 30
*Percentages total more than 100% as respondents were asked to select the top three responses. **Only Top 7 Issues Listed. Please see Appendix C for the complete set of responses.
United States:All four samples agree that the top two issues facing Americans today are the war in Iraq/foreign policy, and jobs and the economy. All samples except Congressional staffers rate health care and immigration as the third and fourth issues, respectively. Congressional staffers place more importance on national security (31%) and terrorism (30%) than they do on health care (29%) and immigration (22%).Among subgroups, younger Americans aged 18-29 years old, Democrats, and Independents rate the issues in the same order (war in Iraq/foreign policy; jobs and the economy; health care; immigration), while Republicans rate immigration third, ahead of health care.
(CHINA SURVEY) What are the three most important issues facing China today? 2007 Only China Survey
General Public
Opinion Leaders
BusinessLeaders
Jobs and the economy 35 36 40Corruption 32 23 24
Taiwan 22 23 30
Health care/Insurance 17 13 13
Education/Schools 17 8 10
Environment 16 38 36
Income inequality/Regional gap 15 19 17
*Percentages total more than 100% as respondents were asked to select the top three responses.
562007 Committee of 100 Survey

**Only Top 7 Issues Listed. Please see Appendix D for the complete set of responses.
China:The general public (35%) and business leaders (40%) rate jobs and economy as the most critical issue facing China, while opinion leaders (38%) see the environment as the most pressing issue. Among the remaining important issues, the general public rates corruption (32%) and Taiwan (22%) as the second and third problems, opinion leaders cite jobs and the economy (36%), corruption (23%) and Taiwan (23%), while business leaders rate the environment as second (36%) and Taiwan as third (30%).11 percent of opinion leaders cite political reforms or democratization, while almost none of the general public shares this concern. More opinion leaders and business leaders mention the inadequate legal system and fragile financial system as important problems facing China. 18-29 year-old Chinese rank Taiwan, the environment, energy consumption, education, crime and social welfare higher than other age groups. A sizable percentage of 50-60 year-olds see corruption and social security as important issues. People with high and medium levels of education see Taiwan, education, health care, the environment, and income inequality as important issues, higher than those with lower levels of education. People with a high income are more likely to worry about education, health care, the environment and energy, as compared to those in the middle and low-income range. People in the middle-income range are more likely to be concerned about the social security system. 46% of city residents and 51% of town residents regard jobs and the economy as the most critical issues, higher than for rural residents (28%). City residents (23%) and town residents (21%) are more concerned about income inequality than rural residents (10%).
China’s Emerging Middle Class
58. (BOTH SURVEYS) Please tell me whether you strongly agree, somewhat agree, somewhat disagree, or strongly disagree with the following statement: China’s growing middle class will become the most influential class in China.
2007 Only US Survey China Survey
General Public
Opinion Leaders
BusinessLeaders
Congressional Staffers
General Public
Opinion Leaders
BusinessLeaders
Strongly Agree 38 50 46 24 4 12 15Somewhat Agree 34 34 34 52 45 54 72AGREE 72 84 80 76 49 66 87
Somewhat Disagree 14 8 7 14 22 20 8
Strongly Disagree 10 8 12 5 2 10 4
DISAGREE 24 16 19 19 24 30 12
Not Sure 4 2 1 5 28 3 1
57 2007 Committee of 100 Survey

United States: More than 70 percent of all four samples believe China’s growing middle class will, in the future, become the most influential class in China. There is no significant variation among subgroups, including income.
China:More business leaders (87%) agree with this statement than opinion leaders (66%) and the general public (49%)As income level increases, people appear to be more likely to agree with this view, with 68% of people with a high income agreeing that China’s middle class will become the most influential.More city residents (70%) agree with the statement than town residents (53%) or rural residents (40%). More than 65% of middle and senior business executives, staffers in government and non-corporate institutions and general white-collars agree with the statement, higher than other occupational groups.
China’s Democracy
59. (US SURVEY) In your opinion, how long will it take China to transition into a democracy? 2007 Only US Survey
General Public
Opinion Leaders
BusinessLeaders
Congressional Staffers
Less than 10 years 10 3 5 410-20 years 28 30 29 26More than 20 years 24 37 37 45Never 35 29 29 15Not sure 4 2 1 10
United States: Respondents in all four samples are evenly divided on when China will transition into a democracy, if ever. More than a third of the general public (35%) believes that change will never occur, as do 29 percent of both business and opinion leaders. A slight plurality of Congressional staffers (45%), business leaders (37%) and opinion leaders (37%) believe that it will take more than 20 years to fully transition. Among 18 to 29 year-old Americans, only 18 percent believe that China will never transition to democracy and 20 percent believe it will take less than 10 years. Independents (28%) are also less likely to believe China will never make the transition, as compared to Republicans (41%).Of those who have visited China, one-quarter (26%) believe that China will never transition to democracy, while nearly half (47%) believe it will take more than twenty years.
582007 Committee of 100 Survey

2008 Beijing Olympics
60. (BOTH SURVEYS) As you may know, the 2008 Summer Olympics will be held in Beijing, China. How do you think the Olympics will most impact China? 2007 Only US Survey China Survey
General Public
Opinion Leaders
BusinessLeaders
Congressional Staffers
General Public
Opinion Leaders
BusinessLeaders
Improve China’s Economy 65 57 82 30 56 67 69
Improve China’s Global Image 59 72 84 57 54 73 77
Make China More Integrated with International Norms
27 29 39 26 40 41 55
Hurt China’s Image 8 7 11 6 4 4 1No Impact 2 3 2 10 1 -- --Other 2 2 1 9 <1 -- --Not Sure 2 1 1 5 9 1 1
*Percentages total more than 100% as respondents were asked to select the top two responses.
United States: There is wide agreement among all four samples that the 2008 Olympics will both improve China’s economy and its global image. The general public is, however, more likely to think that the Olympics will have a positive economic impact, while the remaining three samples believe that the greatest effect will be the improvement of China’s global image.
China:The three samples agree that the 2008 Olympics will have a positive impact on China: More than 70% of opinion and business leaders and 54% of the general public think hosting the Games will improve China’s international image. Nearly 70% of opinion and business leaders and 56% of the general public believe hosting the Games will promote China’s economic development. 55% of business leaders think that by hosting the Games, China will become more integrated with international laws and regulations, with about 40% of opinion leaders and the general public sharing this view.
59 2007 Committee of 100 Survey

61. (BOTH SURVEYS) In your opinion, which of the following images should China focus most on projecting during the 2008 Olympics? 2007 Only US Survey China Survey
General Public
Opinion Leaders
BusinessLeaders
Congressional Staffers
General Public
Opinion Leaders
BusinessLeaders
A prosperous modern nation with a proud culture and history
43 39 52 31 26 40 31
Peaceful development 23 13 12 6 23 14 19A responsible stakeholder in the int’l system
18 37 27 53 11 21 17
A harmonious society 11 7 7 3 30 22 33No impact -- -- -- -- -- -- --Other 2 1 -- 1 -- -- --Not Sure 4 4 2 6 10 3 --
United States: A majority of business leaders (52%) and a plurality of the general public (43%) and opinion leaders (39%) feel that China should project an image of “a prosperous modern nation with a proud culture and history” during the 2008 Beijing Olympics. A majority of Congressional staffers (53%) on the other hand believe China should project itself as “a responsible stakeholder in the international system.” This image was second among all other groups, except the general public, among whom 23 percent believe China’s image should be one of a “peaceful development.”
China:When asked about what kind of national image China should present during the 2008 Beijing Olympics, opinion leaders (40%) tend to select “a prosperous modern nation with a proud culture and history,” while business leaders (33%) and the general public (30%) favor ”a harmonious society.” The percentage of the general public (23%) who select ”peaceful development” is higher than the other two groups, while opinion leaders (21%) opt for “a responsible stakeholder in the international system” more often.More people with lower levels of education (24%) chose “peaceful development” than did people with medium (21%) or higher levels (20%). More people with higher education (40%) select ”a harmonious society” than do those with medium (36%) or low levels of education (26%).
2. Views on Immigration
Impact of Immigrants/ Expatriates
62. (US SURVEY) In the long run, will the Chinese immigrants in America today make American society better or worse, or will they have no effect?
602007 Committee of 100 Survey

(CHINA SURVEY) In the long run, will Americans residing in China today make Chinese society better or worse, or will they have no effect? 2007 Only US Survey China Survey
General Public
Opinion Leaders
BusinessLeaders
Congressional Staffers
General Public
Opinion Leaders
BusinessLeaders
Better 46 70 50 80 38 44 39Worse 13 3 12 2 10 2 1No Effect 36 24 35 14 33 50 56Not Sure 4 4 3 4 19 5 3
United States: A strong majority of Congressional staffers (80%) and opinion leaders (70%) believe that Chinese immigrants in the United States will make American society better. Half of business leaders (50%) and a plurality of the general public (46%) have the same opinion.
China:About half of business leaders (56%) and opinion leaders (50%) and one third (33%) of the general public think American residents in China will have no impact on the society. A plurality of the respondents (about 40%) think they will have a positive impact in the long run.People with a high income hold a more positive opinion of the impact of Americans in China. More people in the low-income range think they will have no impact or will make Chinese society worse.The percentage of single people (45%) who are positive about Americans in China is higher than that of married people (38%) and widowed/divorced/separated (37%).
Opportunities for Immigrants/Expatriates
63. (US SURVEY) How would you rate the level of opportunity that the U.S. provides for the Chinese and Chinese Americans to live and work in the U.S.?
2007 Only US Survey General Public
Opinion Leaders
BusinessLeaders
Congressional Staffers
Equal 48 53 63 50Somewhat Equal 34 37 25 29Not Very Equal 7 5 6 12No at All Equal 6 2 3 1Not Sure 5 4 3 8
United States: Almost all respondents in each of the four samples believe the United States offers equal or somewhat equal opportunity for Chinese and Chinese Americans to live and work in the United States.
61 2007 Committee of 100 Survey

(CHINA SURVEY) Do you think the Americans living and working in China enjoy different treatment from the Chinese?
2007 Only China Survey General Public
Opinion Leaders
BusinessLeaders
Superior 55 79 65Inferior 6 2 3Totally Equal 25 16 31Not Sure 14 3 1
China:79% of opinion leaders, 65% of business leaders and 55% of the general public believe Americans receive superior treatment in China.The percentage of people in the high-income range who think Americans in China receive superior treatment (64%) is higher than the percentages of those in the middle (58%) or low-income range (52%). Among different ethnic groups, more people of Han ethnicity (53%) think Americans in China receive superior treatment than do other ethnic groups (36%).
3. Personal Goals
Current Life Goal
64. (ASKED ONLY OF THE AMERICAN & CHINESE GENERAL PUBLIC) Which of the following comes closest to your current personal goal in life?
2007 Only US Survey China Survey General Public
General Public
To have a happy family 72 54To live as I like 38 28To have a successful career 23 16To work on behalf of society 15 10
To get rich 8 42
To enhance social status 3 16Other 4 1Not sure 1 3
*Percentages total more than 100% as respondents were asked to select the top two responses.
United States: When asked about their personal goal in life, nearly three-quarters of the general public (72%) said they would like to have a happy family life.While a majority of all age groups agree that having a happy family is the most important personal goal, young people aged 18-29 are most likely to be concerned about a successful career (43%). Having a happy family is also the most reported among all education levels, with respondents having a high school education most likely to agree (79%).
622007 Committee of 100 Survey

People making $75,000 to $100,000 are least worried (3%) about amassing wealth. Women (80%) outnumber men (64%) in making a happy family their number one priority.
China:The primary personal goals of the Chinese are having a happy family (54%) and getting rich (42%). Young people aged 18-29 are more concerned about social status, career, and to live as they like, while older people tend to care about amassing wealth and having a happy family. People with a high level of education (41%) are more concerned about having a successful career than those with medium (22%) or low levels of education (10%). People with the least education (47%) are more likely to say they want to get rich, and people with average education (40%) are more likely to say they want to live as they like.Women (57%) outnumber men (49%) in wanting a happy family, while men outnumber women in wanting a successful career, higher social status, and to work on behalf of society. More city residents aspire “to enhance social status,” “to live as I like” and “to work on behalf of society” than those living in towns and rural areas. More rural residents seek “to have a happy family” than those in urban areas.
4. Patriotism
Level of Patriotism
65. (BOTH SURVEYS) On a scale of 1 to 5 where 1 is “not at all patriotic” and 5 is “highly patriotic,” how would you rate your patriotism?2007 Only US Survey China Survey
General Public
Opinion Leaders
BusinessLeaders
Congressional Staffers
General Public
Opinion Leaders
BusinessLeaders
(1) Not at All 4 2 9 -- 0 0 0(2) 4 3 1 6 1 0 1(3) 16 10 5 6 24 12 9(4) 22 24 23 31 24 36 40(5) Highly Patriotic 54 62 61 54 47 50 51Not Sure 1 1 1 3 4 1 0
United States:When asked to rate their patriotism on a scale of one to five, a majority of all four samples rated themselves as highly patriotic (a five on the scale). Three-quarters of the general public (76%) consider themselves to be patriotic (a four or a five), as compared to more than four-in-five opinion leaders (86%), business leaders (84%) and Congressional staffers (85%).
China:For self-assessment of patriotism, 91% of business leaders and 86% of opinion leaders consider themselves to be patriotic (a four or a five), higher than the general public (71%) who think so.
63 2007 Committee of 100 Survey

People with religious beliefs (76%) think they are more patriotic than people do not have any religious beliefs (72%).
642007 Committee of 100 Survey

United States:Sample Size Sample Error (%) Field Work Dates
General Public 1200 +/- 2.9 8/20/07 - 9/4/07 Opinion Leaders 200 +/- 7.1 8/20/07 – 9/19/07Business Leaders 150 +/- 8.2 8/20/07 - 9/14/07Congressional Staffers 100 +/- 10 8/20/07 – 9/14/07
The survey of the United States was conducted by Zogby International, a world-renowned polling firm based in Utica, New York. Zogby International surveys employ sampling strategies in which selection probabilities are proportional to population size within area codes and exchanges. Up to ten calls are made to reach a sampled phone number. Cooperation rates are calculated using one of AAPOR’s approved methodologies1 and are comparable to other professional public-opinion surveys conducted using similar sampling strategies.2 Zogby International’s sampling and weighting procedures also have been validated through its political polling: more than 95% of the firm’s polls have come within 1% of actual election-day outcomes. The sample compositions are as follows:
(a) General Public: The survey was conducted between August 20 and September 4, 2007 through telephone interviews with a nationwide, statistically representative general population sample consisting of 1,200 American adults (18 years of age and older). Weighting by region, party, age, race, religion, gender is used to adjust for non-response. The margin of error is plus or minus 2.9 percentage points.
(b) Opinion Leaders: The survey was conducted between August 20 and September 19, 2007 through telephone interviews with a sample of 200 opinion elites nationwide. The sample represents influential leaders from the media (25%), academia (25%), NGOs (25%), and public sector (25%). Within each grouping, respondents were randomly selected from Zogby International’s proprietary, public, and purchased lists, and were screened for familiarity with U.S-China relations. The margin of error is plus or minus 7.1 percentage points.
(c) Business Leaders: The survey was conducted between August 20 and September 14, 2007 through telephone interviews with a sample of 150 business elites nationwide. The sample was based on executives and senior level decision makers from a cross-section of American corporations with over 500 employees, and was also randomly drawn from trade associations, trade groups, lobby firms, chambers of commerce and economic development groups. The margin of error is plus or minus 8.2 percentage points.
1 See COOP4 (p.38) in Standard Definitions: Final Dispositions of Case Codes and Outcome Rates of Surveys. The American Association for Public Opinion Research (2000).
2 Cooperation Tracking Study: April 2003 Update, Jane M. Sheppard & Shelly Haas. The Council for Marketing & Opinion Research (CMOR), Cincinnati, Ohio (2003).
65 2007 Committee of 100 Survey
METHODOLOGYMETHODOLOGY
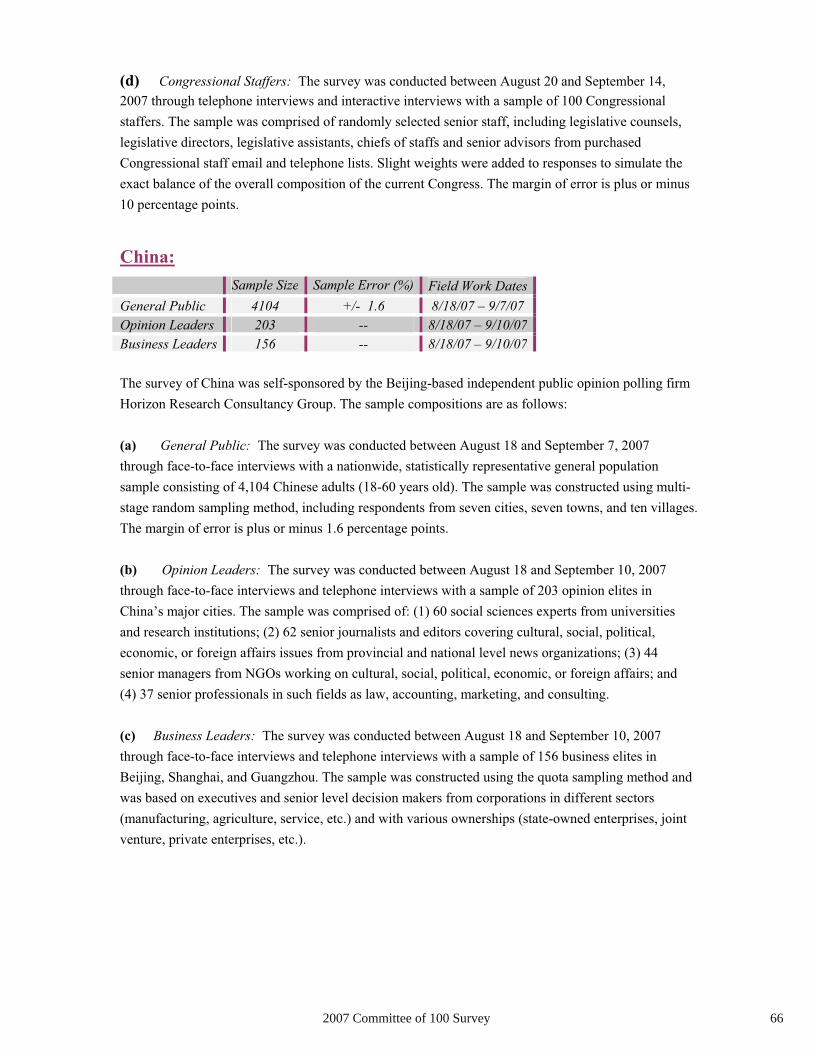
(d) Congressional Staffers: The survey was conducted between August 20 and September 14, 2007 through telephone interviews and interactive interviews with a sample of 100 Congressional staffers. The sample was comprised of randomly selected senior staff, including legislative counsels, legislative directors, legislative assistants, chiefs of staffs and senior advisors from purchased Congressional staff email and telephone lists. Slight weights were added to responses to simulate the exact balance of the overall composition of the current Congress. The margin of error is plus or minus 10 percentage points.
China:Sample Size Sample Error (%) Field Work Dates
General Public 4104 +/- 1.6 8/18/07 – 9/7/07 Opinion Leaders 203 -- 8/18/07 – 9/10/07Business Leaders 156 -- 8/18/07 – 9/10/07
The survey of China was self-sponsored by the Beijing-based independent public opinion polling firm Horizon Research Consultancy Group. The sample compositions are as follows:
(a) General Public: The survey was conducted between August 18 and September 7, 2007 through face-to-face interviews with a nationwide, statistically representative general population sample consisting of 4,104 Chinese adults (18-60 years old). The sample was constructed using multi-stage random sampling method, including respondents from seven cities, seven towns, and ten villages. The margin of error is plus or minus 1.6 percentage points.
(b) Opinion Leaders: The survey was conducted between August 18 and September 10, 2007 through face-to-face interviews and telephone interviews with a sample of 203 opinion elites in China’s major cities. The sample was comprised of: (1) 60 social sciences experts from universities and research institutions; (2) 62 senior journalists and editors covering cultural, social, political, economic, or foreign affairs issues from provincial and national level news organizations; (3) 44 senior managers from NGOs working on cultural, social, political, economic, or foreign affairs; and (4) 37 senior professionals in such fields as law, accounting, marketing, and consulting.
(c) Business Leaders: The survey was conducted between August 18 and September 10, 2007 through face-to-face interviews and telephone interviews with a sample of 156 business elites in Beijing, Shanghai, and Guangzhou. The sample was constructed using the quota sampling method and was based on executives and senior level decision makers from corporations in different sectors (manufacturing, agriculture, service, etc.) and with various ownerships (state-owned enterprises, joint venture, private enterprises, etc.).
662007 Committee of 100 Survey
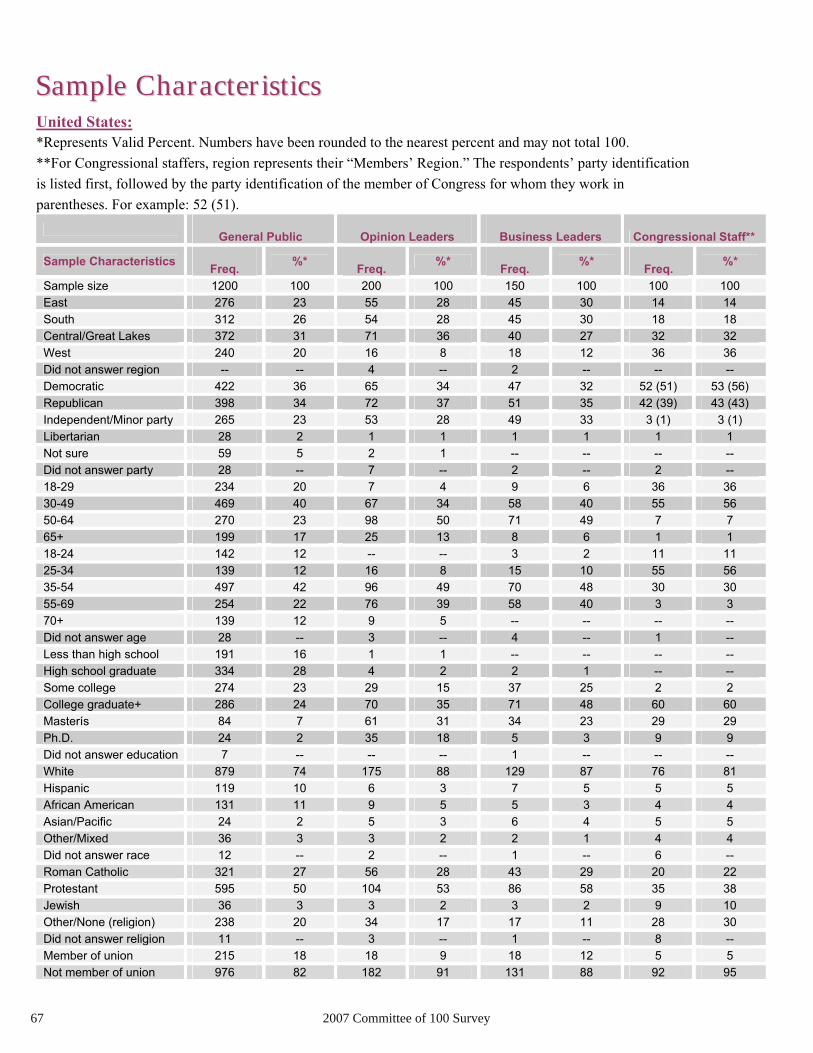
General Public Opinion Leaders Business Leaders Congressional Staff**
Sample Characteristics Freq. %* Freq. %* Freq. %* Freq. %*
Sample size 1200 100 200 100 150 100 100 100East 276 23 55 28 45 30 14 14South 312 26 54 28 45 30 18 18Central/Great Lakes 372 31 71 36 40 27 32 32West 240 20 16 8 18 12 36 36Did not answer region -- -- 4 -- 2 -- -- --Democratic 422 36 65 34 47 32 52 (51) 53 (56) Republican 398 34 72 37 51 35 42 (39) 43 (43) Independent/Minor party 265 23 53 28 49 33 3 (1) 3 (1) Libertarian 28 2 1 1 1 1 1 1Not sure 59 5 2 1 -- -- -- --Did not answer party 28 -- 7 -- 2 -- 2 --18-29 234 20 7 4 9 6 36 3630-49 469 40 67 34 58 40 55 5650-64 270 23 98 50 71 49 7 765+ 199 17 25 13 8 6 1 118-24 142 12 -- -- 3 2 11 1125-34 139 12 16 8 15 10 55 5635-54 497 42 96 49 70 48 30 3055-69 254 22 76 39 58 40 3 370+ 139 12 9 5 -- -- -- --Did not answer age 28 -- 3 -- 4 -- 1 --Less than high school 191 16 1 1 -- -- -- --High school graduate 334 28 4 2 2 1 -- --Some college 274 23 29 15 37 25 2 2College graduate+ 286 24 70 35 71 48 60 60Masterís 84 7 61 31 34 23 29 29Ph.D. 24 2 35 18 5 3 9 9Did not answer education 7 -- -- -- 1 -- -- --White 879 74 175 88 129 87 76 81Hispanic 119 10 6 3 7 5 5 5African American 131 11 9 5 5 3 4 4Asian/Pacific 24 2 5 3 6 4 5 5Other/Mixed 36 3 3 2 2 1 4 4Did not answer race 12 -- 2 -- 1 -- 6 --Roman Catholic 321 27 56 28 43 29 20 22Protestant 595 50 104 53 86 58 35 38Jewish 36 3 3 2 3 2 9 10Other/None (religion) 238 20 34 17 17 11 28 30Did not answer religion 11 -- 3 -- 1 -- 8 --Member of union 215 18 18 9 18 12 5 5Not member of union 976 82 182 91 131 88 92 95
United States:*Represents Valid Percent. Numbers have been rounded to the nearest percent and may not total 100. **For Congressional staffers, region represents their “Members’ Region.” The respondents’ party identification is listed first, followed by the party identification of the member of Congress for whom they work in parentheses. For example: 52 (51).
Sample CharacteristicsSample Characteristics
67 2007 Committee of 100 Survey

United States cont.
General Public Opinion Leaders Business Leaders Congressional Staff**
Sample Characteristics Freq. %* Freq. %* Freq. %* Freq. %*
Sample size 1200 100 200 100 150 100 100 100Less than $25,000 240 23 6 4 -- -- -- --$25,000-$34,999 136 13 6 4 4 3 7 7$35,000-$49,999 188 18 19 11 17 12 11 12$50,000-$74,999 196 19 30 18 31 23 21 22$75,000-$99,999 113 11 38 23 20 15 11 12$100,000 or more 169 16 70 41 65 47 45 47Did not answer income 157 -- 31 -- 13 -- 5 --Male 578 48 122 61 71 47 86 86Female 622 52 78 39 79 53 14 14Managerial 111 9 N/A N/A N/A N/A N/A N/AMedical 50 4 N/A N/A N/A N/A N/A N/AProfessional/Technical 155 13 N/A N/A N/A N/A N/A N/ASales 45 4 N/A N/A N/A N/A N/A N/AClerical 20 2 N/A N/A N/A N/A N/A N/AService 56 5 N/A N/A N/A N/A N/A N/ABlue-Collar/Production 81 7 N/A N/A N/A N/A N/A N/ATeacher/Education 67 6 N/A N/A N/A N/A N/A N/AMilitary 8 1 N/A N/A N/A N/A N/A N/AStudent 64 6 N/A N/A N/A N/A N/A N/AHomemaker 128 11 N/A N/A N/A N/A N/A N/AUnemployed/Retired 276 23 N/A N/A N/A N/A N/A N/AOther 121 10 N/A N/A N/A N/A N/A N/ADid not respond occupation 17 -- N/A N/A N/A N/A N/A N/ARetail N/A N/A N/A N/A 50 33 N/A N/AManufacturing N/A N/A N/A N/A 49 33 N/A N/ATrade Assoc/etc. N/A N/A N/A N/A 51 34 N/A N/AHigh-Tech Business N/A N/A N/A N/A 67 45 N/A N/ANot-High Tech Business N/A N/A N/A N/A 83 55 N/A N/A20-49 Employees N/A N/A N/A N/A 38 25 N/A N/A50-99 Employees N/A N/A N/A N/A 8 5 N/A N/A100-499 Employees N/A N/A N/A N/A 5 3 N/A N/A500-999 Employees N/A N/A N/A N/A 67 45 N/A N/A1000+ Employees N/A N/A N/A N/A 32 21 N/A N/AChief of Staff N/A N/A N/A N/A N/A N/A 24 24Press Secretary N/A N/A N/A N/A N/A N/A 14 14Committee Staff N/A N/A N/A N/A N/A N/A 8 8Foreign Policy/Trade LA N/A N/A N/A N/A N/A N/A 40 40Legislative Director N/A N/A N/A N/A N/A N/A 14 14NGO N/A N/A 50 25 N/A N/A N/A N/AAcademia N/A N/A 50 25 N/A N/A N/A N/APublic sector N/A N/A 50 25 N/A N/A N/A N/AMedia N/A N/A 50 25 N/A N/A N/A N/AMarried 680 57 148 75 111 75 43 44Single, never married 261 22 30 15 11 7 47 49Divorced/Widow/Separated 233 20 20 10 27 18 5 5Civ. union/Dom. partner 13 1 -- -- -- -- 2 2
682007 Committee of 100 Survey
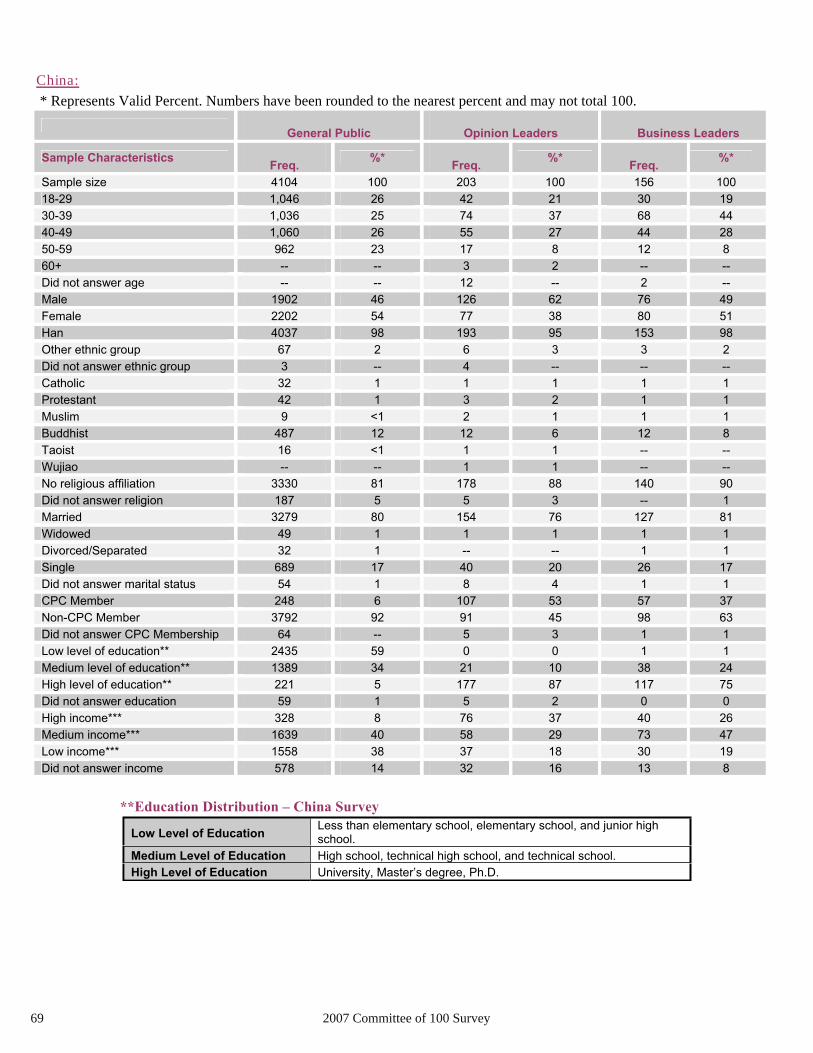
**Education Distribution – China Survey
Low Level of Education Less than elementary school, elementary school, and junior high school.
Medium Level of Education High school, technical high school, and technical school. High Level of Education University, Master’s degree, Ph.D.
69 2007 Committee of 100 Survey
China: * Represents Valid Percent. Numbers have been rounded to the nearest percent and may not total 100.
General Public Opinion Leaders Business Leaders
Sample Characteristics Freq. %* Freq. %* Freq. %*
Sample size 4104 100 203 100 156 10018-29 1,046 26 42 21 30 1930-39 1,036 25 74 37 68 4440-49 1,060 26 55 27 44 2850-59 962 23 17 8 12 860+ -- -- 3 2 -- --Did not answer age -- -- 12 -- 2 --Male 1902 46 126 62 76 49Female 2202 54 77 38 80 51Han 4037 98 193 95 153 98Other ethnic group 67 2 6 3 3 2Did not answer ethnic group 3 -- 4 -- -- --Catholic 32 1 1 1 1 1Protestant 42 1 3 2 1 1Muslim 9 <1 2 1 1 1Buddhist 487 12 12 6 12 8Taoist 16 <1 1 1 -- --Wujiao -- -- 1 1 -- --No religious affiliation 3330 81 178 88 140 90Did not answer religion 187 5 5 3 -- 1Married 3279 80 154 76 127 81Widowed 49 1 1 1 1 1Divorced/Separated 32 1 -- -- 1 1Single 689 17 40 20 26 17Did not answer marital status 54 1 8 4 1 1CPC Member 248 6 107 53 57 37Non-CPC Member 3792 92 91 45 98 63Did not answer CPC Membership 64 -- 5 3 1 1Low level of education** 2435 59 0 0 1 1Medium level of education** 1389 34 21 10 38 24High level of education** 221 5 177 87 117 75Did not answer education 59 1 5 2 0 0High income*** 328 8 76 37 40 26Medium income*** 1639 40 58 29 73 47Low income*** 1558 38 37 18 30 19Did not answer income 578 14 32 16 13 8

702007 Committee of 100 Survey
China cont.
General Public Opinion Leaders Business Leaders
Sample Characteristics Freq. %* Freq. %* Freq. %*
Sample size 4104 100 203 100 156 100Government, non-corporateinstitutions, military, police 35 1 N/A N/A N/A N/A
Middle and senior executive 191 5 N/A N/A N/A N/AWhite-collar (clerical staff in government, non-corporateinstitutions and corporations)
215 5 N/A N/A N/A N/A
Blue-collar (technical staff, service staff) 537 13 N/A N/A N/A N/A
Unemployed/Retired 150 4 N/A N/A N/A N/AStudents (full-time) 83 2 N/A N/A N/A N/ASelf-employed (individual owners,vendors) 260 6 N/A N/A N/A N/A
Farmer 2611 64 N/A N/A N/A N/AOther 22 1 N/A N/A N/A N/AClass I Academia(professors of social sciences)
N/A N/A 30 15 N/A N/A
Class II Academia(scholars at social sciences research institutions)
N/A N/A 30 15 N/A N/A
Media N/A N/A 62 31 N/A N/A
NGO N/A N/A 44 22 N/A N/A
Professional services N/A N/A 37 18 N/A N/A
State-owned enterprises N/A N/A N/A N/A 40 26
Domestic enterprises with mixed ownerships
N/A N/A N/A N/A 22 14
Private enterprises N/A N/A N/A N/A 37 24
Foreign-invested enterprises and joint ventures
N/A N/A N/A N/A 57 37
Agriculture sector N/A N/A N/A N/A 17 11Manufacturing sector N/A N/A N/A N/A 49 31Service sector N/A N/A N/A N/A 90 58
***Income Distribution - China Survey General Public
CityTier-1 City Tier-2 City
Town Rural AreaOpinion Leaders Business Leaders
High Income 9,001 yuan andabove
7,001 yuan andabove
4,501 yuan andabove
2,501 yuanand above
10,001 yuan andabove
20,001 yuan andabove
MediumIncome
3,001 - 9,000yuan
2,001 - 7,000yuan
1,501 - 4,500yuan
801 - 2,500 yuan
6,001 - 10,000 yuan
9,001 - 20,000 yuan
Low Income 3,000 yuan andbelow
2,000 yuan andbelow
1,500 yuan andbelow
800 yuanand below
6,000 yuan andbelow
9,000 yuan andbelow
(Note: Tier-1 cities include Beijing, Shanghai and Guangzhou; Tier-2 cities include Wuhan, Chengdu,Shenyang, and Xi’an. All income refers to monthly household income.)

AAPPPPEENNDDIIXX AA:: FFiirrsstt IImmpprreessssiioonn ooff CChhiinnaa ((AAllll RReessppoonnsseess))
The First Thing that Comes to Mind When the Americans Think about China:
2007 Only US Survey
General Public
Opinion Leaders
BusinessLeaders
Congressional Staffers
Large Country/Large Population/Overpopulation/Adoption 18 25 9 1
Culture/History/Food/Great Wall 18 3 7 1Cheap Products/Large Amount of Imports/Wal-Mart 12 8 11 5
Growing World Power/Future Superpower 7 12 3 37
Economic Growth/Booming Economy 7 10 30 19Outsourcing/Cheap Labor/Loss of U.S. Jobs 6 4 13 3
Authoritarian/Communist/Mao 6 5 1 2
Trade Imbalance/U.S. Trade Deficit/Debt 4 8 7 10
Growing Threat/Rival 4 2 3 12
Lead in Toys/Lead Consumption 4 6 4 1Human Rights Violations/Falun Gong/Tibet/Tiananmen Square 3 5 3 3
Tainted Food/Pet Food 2 6 9 --
Pollution/Energy Consumption 2 2 2 2
Other 6 7 -- 4
Not Sure 4 2 1
71 2007 Committee of 100 Survey

AAPPPPEENNDDIIXX BB:: FFiirrsstt IImmpprreessssiioonn ooff tthhee UU..SS.. ((AAllll RReessppoonnsseess))
First Thing That Comes to Mind When the Chinese Think about the United States:
2007 Only China Survey
General Public Opinion Leaders Business Leaders
War on Terrorism/Sept. 11th 15 35 40Invasion/Interference in Int’l Affairs (Belgrade Embassy, Iraq, Taiwan) 14 11 3
Developed Economy/Modernization 13 4 3
Consumption/Popular Culture 7 6 6
Landmark Buildings/Cities 3 19 30
Power/Superpower 6 3 1
Bad Nationalism (Arrogance) 5 2 3Science and Technology/Advanced Military 4 6 5
American Celebrities 2 1 3
Sound Political Institutions 1 2 --
Sino-U.S. Relations/Civil Exchanges 1 -- --
National Symbols (Flag, Dollar, English) 1 3 1Special Domestic Events (Lewinsky Scandal, etc.) 1 1 1
American Spirit (Freedom, Democracy, Rule of Law) 1 4 1
Americans (Physical Characteristics) 1 -- --Good Nationalism (Open-minded, Hospitable, Generous) <1 2 --
Economy/Financial Crisis <1 1 1
Energy <1 1 --
Academics/Thoughts <1 -- 1
Trade Friction with China -- -- 1
Other 1 -- --
Not Sure 25 1 1
722007 Committee of 100 Survey

AAPPPPEENNDDIIXX CC:: TToopp IIssssuueess FFaacciinngg tthhee UU..SS.. ((AAllll RReessppoonnsseess))
Pressing Problems Facing the U.S. in American Eyes: 2007 Only US Survey
General Public
Opinion Leaders
BusinessLeaders
Congressional Staffers
War in Iraq/Peace/Foreign policy 51 47 44 45Jobs and the economy 41 45 49 36Health care/Insurance/Prescription drugs 22 31 26 29
Immigration 21 21 21 22Politics/Government/Corruption/ Campaign finance reform 17 15 19 4
Utility rates/Gas prices/Energy consumption 15 9 14 16
Terrorism 15 16 21 30
Education/Schools 12 19 13 20
Environment 11 15 13 11
Morality/Values 10 11 10 6
Government budget/Spending/Deficit 10 8 7 22Welfare/Child care/Homelessness/ Housing/Poverty 8 4 4 2
National security 5 9 14 31
Crime/Drugs/Violence/Gun control 4 4 10 --
Racism 3 2 1 2
Social security/Elderly 3 3 6 6
Income inequality 2 2 2 6
Abortion 2 1 -- 1
AIDS and other infectious diseases <1 1 3 --
Other 13 14 3 2
Not sure/None 2 2 1 --
*Percentages total more than 100% as respondents were asked to select the top threeresponses.
73 2007 Committee of 100 Survey

AAPPPPEENNDDIIXX DD:: TToopp IIssssuueess FFaacciinngg CChhiinnaa ((AAllll RReessppoonnsseess))
Pressing Problems Facing China in Chinese Eyes: 2007 Only China Survey
General Public Opinion Leaders Business Leaders
Jobs and the economy 35 36 40Corruption 32 23 24
Taiwan 22 23 30
Health care/Insurance 17 13 13
Education/Schools 17 8 10
Environment 16 38 36
Income inequality/Regional gap 15 19 17
Social security/Elderly 15 11 15
Energy consumption 10 15 19
Crime/Drugs/Violence 10 5 5Welfare/Child care/Homelessness/ Housing/Poverty 9 9 12
National security 6 1 --
Inadequate legal system 5 16 21
Social instability 5 2 6Population control/Abortion/Unbalanced gender ratio/Population resources
4 12 9
Morality/Values 4 6 4Lack of legitimate rights of migrant workers from rural China in coastal cities
4 1 3
Terrorism 4 1 1
Fragile financial system 2 12 12HIV/AIDS and other infectious diseases 2 1 2
Political reforms/Democratization -- 11 3
Technology/Innovation/IPR -- 5 4
Diplomacy/Peace/Sino-U.S. Relations -- 4 1
International trade/Exports -- 3 3
Living standard/Quality of life -- 3 1
Other <1 5 7
Not Sure/None 29 11 6
*Percentages total more than 100% as respondents were asked to select the top three responses.
742007 Committee of 100 Survey

AABBOOUUTT UUSS
75
Zogby International Zogby International is a leading marketing, opinion research and consulting firm, considered one of the most preeminent in the field. Founded by John Zogby, President & CEO, in 1984, Zogby International conducts a wide range of opinion research that includes politics and current affairs, social values, consumer habits, and global trends. In addition to domestic polling and market research, Zogby polls on political, consumer and cultural issues throughout the world, including Latin America, Asia, Eastern and Western Europe, the Middle East, and Africa. www.Zogby.com
Horizon Research Consultancy GroupHorizon Research Consultancy Group has become a leading research and consulting firm during China’s transition from planned economy to market economy. Horizon Group has four subsidiaries: Horizon Research (market research) founded in 1992, Progress Strategy (strategic consulting) founded in 2000, Horizonkey.com (online studies) founded in 1999, and Vision Investment (investment consulting) founded in 2002. As exclusive representatives of ESOMAR and AMCF (Association of Management Consulting Firms) in China, Horizon Group has established four global research consultancy networks. www.Horizon-China.com
Milestones for Committee of 100 Previous SurveysApril 1994 National Survey: “American Attitudes Toward the People’s Republic of China” (Wirthlin Worldwide)
April 2001National Survey: “American Attitudes Toward Chinese Americans & Asian Americans” (Martilla Communications Group & Yankelovich Partners)
January-April 2005National Survey: “American Attitudes Toward China” (Zogby International)
View all C-100 surveys at: www.Survey.Committee100.org
Committee of 100The Committee of 100 (C-100) is a national non-partisan, non-profit membership organization comprised of prominent Chinese Americans in a broad range of professions. With their knowledge and experience, the Committee has dedicated its efforts to a dual mission: (1) encouraging constructive relations between the peoples of the United States and Greater China, and (2) encouraging the full participation of Chinese Americans in all aspects of American life. C-100 was co-founded in 1990 by I.M. Pei, Yo-Yo Ma, and other distinguished Chinese Americans. They recognized the need for an organization that brings a strong Chinese American perspective to critical issues pertaining to Asian Americans and Sino-U.S. relations. “Seeking common ground while respecting differences” is the precept guiding all Committee actions. www.Committee100.org

NOTESNOTES

NOTESNOTES


C O M M I T T E E 1 0 0 . O R G