hoopalytics deck manual
TRANSCRIPT

WIN MORE POSSESSIONS
WIN MORE POSSESSIONS
BASKETBALL COACHES ARE PAID TO WIN GAMES
BASKETBALL COACHES
DO NOT ALWAYS
MAKE WINNING DECISIONS
WIN MORE POSSESSIONS
MONEYBALL IS NEW SCHOOL
COACHING IS OLD SCHOOL
Jay Cipoletti::[email protected]

WIN MORE POSSESSIONS
BIG DATA DRIVES BIG WINS
DALLAS MAVERICKS
&
MIAMI HEAT
Jay Cipoletti::[email protected]
WIN MORE POSSESSIONS
TRANSLATION PLEASE
“NOBODY ON THE STAFF
CAN SNIFF THIS.”
Jay Cipoletti::[email protected]

WIN MORE POSSESSIONS
WHAT IS A POSSESSION WORTH?
~132 POSSESSIONS PER GAME
~4,584 POSSESSIONS PER SEASON
$1,389 PER POSSESSION
$286,963 PER WINJay Cipoletti::[email protected]
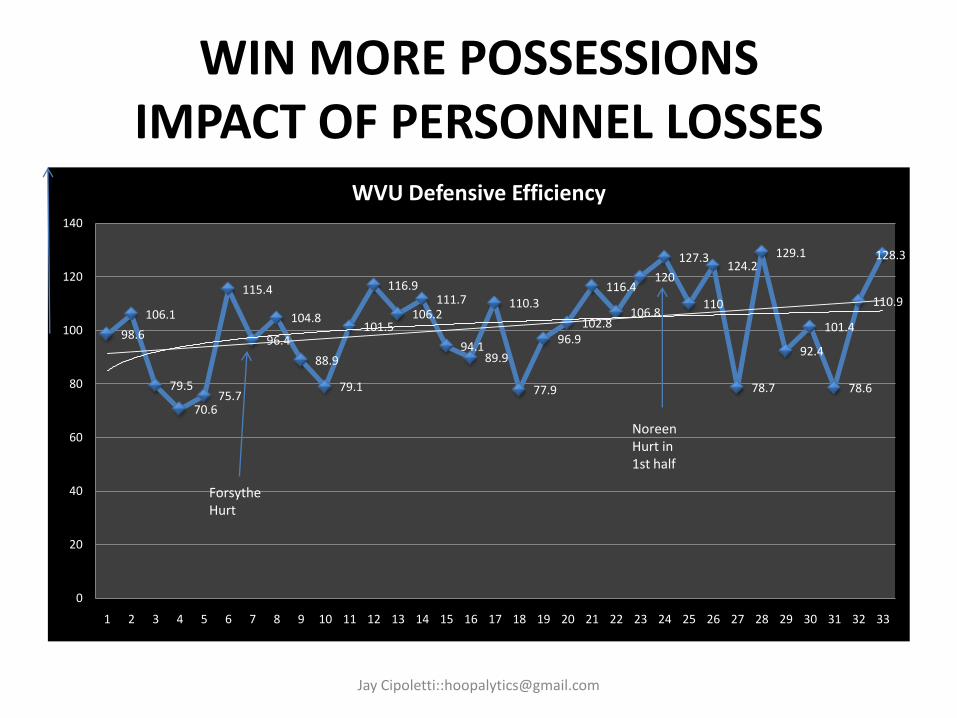
WIN MORE POSSESSIONSIMPACT OF PERSONNEL LOSSES
Jay Cipoletti::[email protected]
98.6
106.1
79.5
70.675.7
115.4
96.4
104.8
88.9
79.1
101.5
116.9
106.2111.7
94.189.9
110.3
77.9
96.9102.8
116.4
106.8
120
127.3
110
124.2
78.7
129.1
92.4
101.4
78.6
110.9
128.3
0
20
40
60
80
100
120
140
1 2 3 4 5 6 7 8 9 10 11 12 13 14 15 16 17 18 19 20 21 22 23 24 25 26 27 28 29 30 31 32 33
WVU Defensive Efficiency
Forsythe Hurt
Noreen Hurt in 1st half
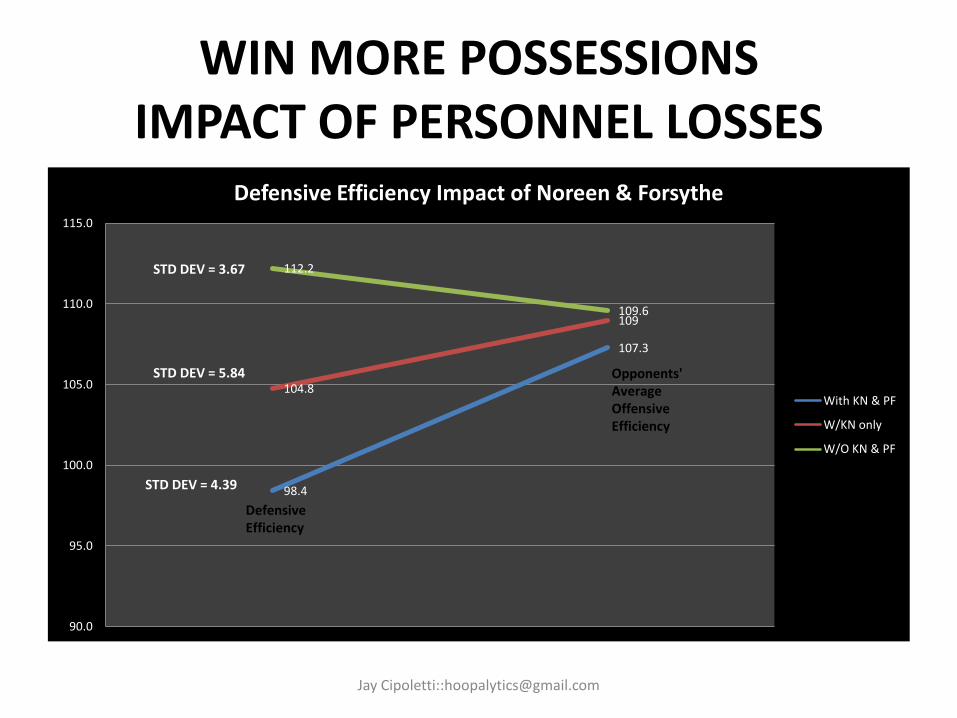
WIN MORE POSSESSIONSIMPACT OF PERSONNEL LOSSES
Jay Cipoletti::[email protected]
98.4
107.3
104.8
109
112.2
109.6
90.0
95.0
100.0
105.0
110.0
115.0
Defensive Efficiency Impact of Noreen & Forsythe
With KN & PF
W/KN only
W/O KN & PF
DefensiveEfficiency
Opponents'Average OffensiveEfficiency
STD DEV = 3.67
STD DEV = 5.84
STD DEV = 4.39

WIN MORE POSSESSIONSDO WHAT WE DO BEST
Jay Cipoletti::[email protected]
0.96
0.98
1
1.02
1.04
1.06
1.08
1.1
1.12
1.14
1.16
:02-:08 (402) :09 - :16 (559) :17 - :24 (645) :25 - :32 (343) :32+ (115)
Points Per Possession by Time of Possession Range
WIN MORE POSSESSIONS
WINS TO DATE
TEAMRANKINGS.COM CONTEST
(STATGEEK IDOL)
WESTMONT HIGH SCHOOL
WIN MORE POSSESSIONS
GOING FORWARD
HOOPALYTICS.COM
MIT SLOAN SPORTS ANALYTICS ABSTRACT
AUTOMATE DATA COLLECTION
PRODUCT PROTOTYPES

WIN MORE POSSESSIONS
JAY CIPOLETTI
TWITTER:@HOOPALYTICS
304-610-7881/304-389-3099
WIN MORE POSSESSIONS
APPENDIX
WHY ANALYTICS?
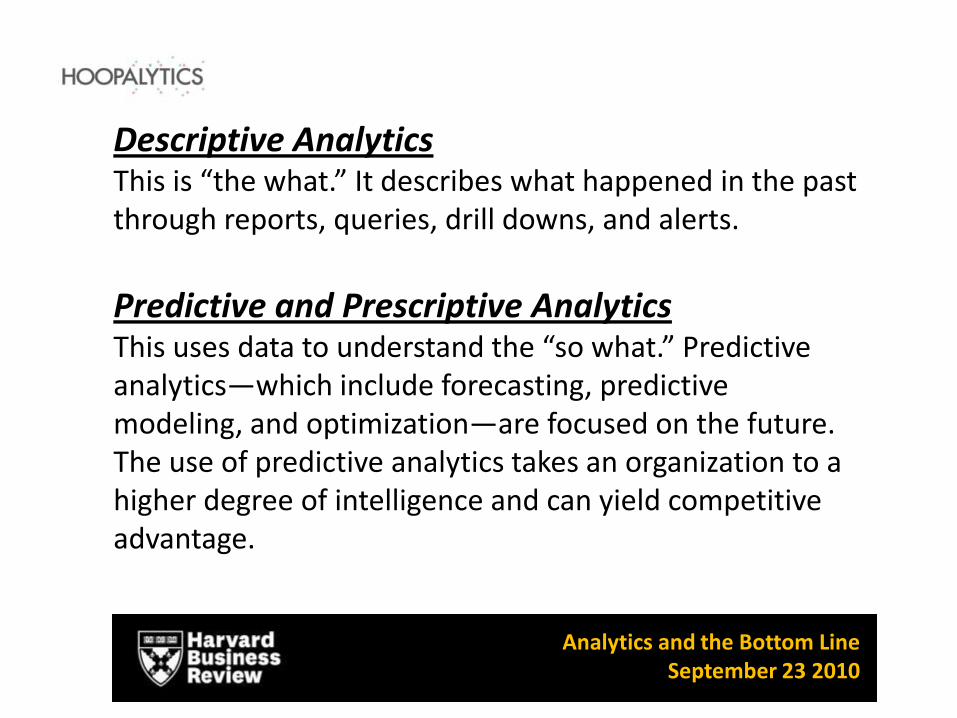
Descriptive AnalyticsThis is “the what.” It describes what happened in the past through reports, queries, drill downs, and alerts.
Predictive and Prescriptive Analytics This uses data to understand the “so what.” Predictive analytics—which include forecasting, predictive modeling, and optimization—are focused on the future. The use of predictive analytics takes an organization to a higher degree of intelligence and can yield competitive advantage.
Analytics and the Bottom LineSeptember 23 2010
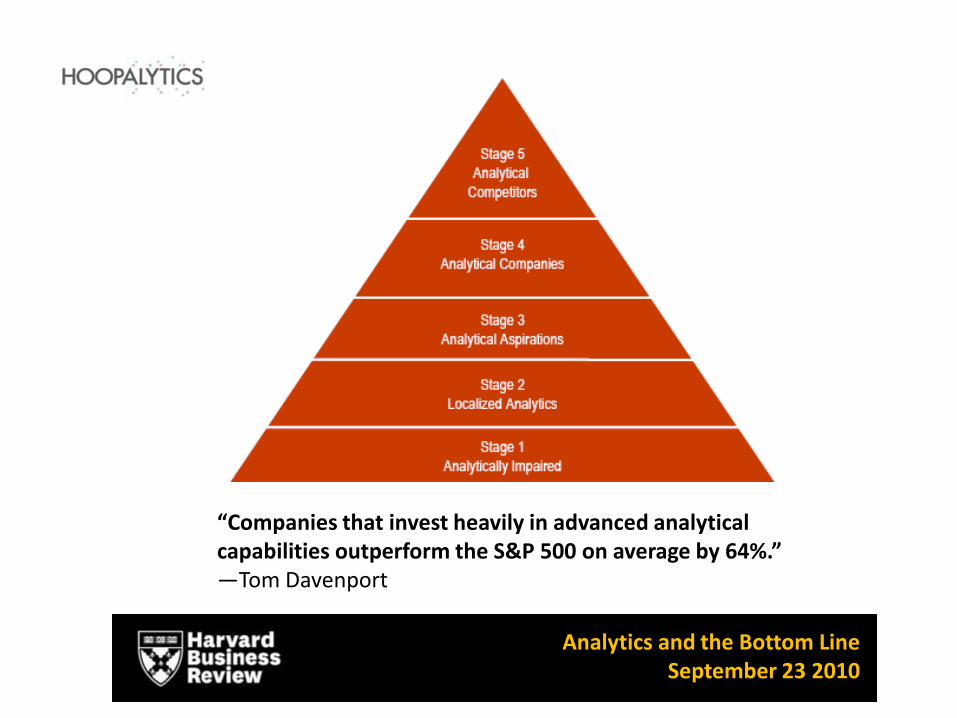
“Companies that invest heavily in advanced analytical capabilities outperform the S&P 500 on average by 64%.”—Tom Davenport
Analytics and the Bottom LineSeptember 23 2010
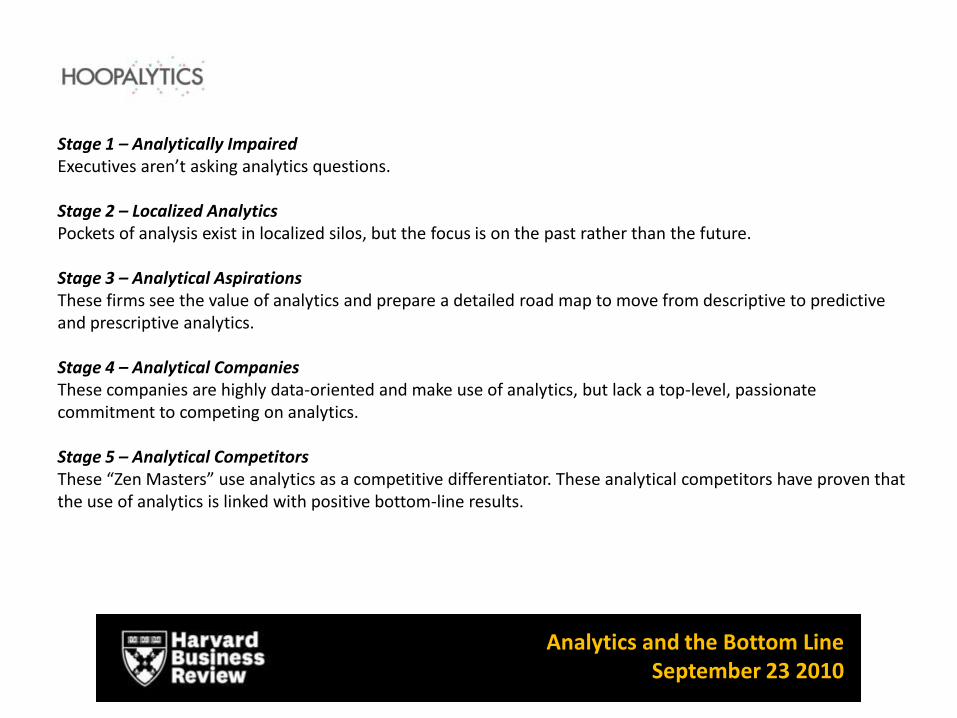
Stage 1 – Analytically ImpairedExecutives aren’t asking analytics questions.
Stage 2 – Localized AnalyticsPockets of analysis exist in localized silos, but the focus is on the past rather than the future.
Stage 3 – Analytical AspirationsThese firms see the value of analytics and prepare a detailed road map to move from descriptive to predictive and prescriptive analytics.
Stage 4 – Analytical Companies These companies are highly data-oriented and make use of analytics, but lack a top-level, passionate commitment to competing on analytics.
Stage 5 – Analytical CompetitorsThese “Zen Masters” use analytics as a competitive differentiator. These analytical competitors have proven that the use of analytics is linked with positive bottom-line results.
Analytics and the Bottom LineSeptember 23 2010