honiara urban resilience & climate action...
TRANSCRIPT

Page | i
With support of UN-HABITAT’s Cities and Climate Change Initiative | RMIT University Climate Change Adaptation Program
2016
Honiara Urban Resilience & Climate Action Plan
A joint strategy for the Honiara City Council and the Solomon Islands Government

ii
Honiara Urban Resilience & Climate Action Plan (2016)
Lead Authors: Alexei Trundle and Darryn McEvoy, RMIT University Climate Change Adaptation Program, Melbourne.
Reviewers: Bernhard Barth, Liam Fee, Steve Likaveke, UN-Habitat
Report developed for the United Nations Human Settlements Programme (UN-Habitat) Cities and Climate Change
Initiative (CCCI)
Research conducted in partnership with Honiara City Council, Guadalcanal Provincial Government Council, Solomon
Islands Government Agencies (Ministry for Land, Housing & Survey, Ministry for Environment, Climate Change &
Disaster Management, Solomon Islands National Statistics Office), as well as numerous community and non-
government organisations present and operating in the Greater Honiara Area.
This work is licensed under a Creative Commons Attribution-ShareAlike 4.0 International License
http://creativecommons.org/licenses/by-sa/4.0/

iii
Honiara Urban Resilience & Climate Action Plan
A joint strategy for the Honiara City Council and the Solomon Islands Government
With the support of:

iv

v
Foreword
The Honiara Urban Resilience and Climate Action Plan (HURCAP) aims to enhance the resilience of Honiara. It is the outcome of a concerted effort by many different stakeholders with an interest in the sustainability of our capital city, from national and municipal government to local communities. It recognises that there are many challenges facing the urban resilience agenda and that each of us, whether as policymakers or as Honiara residents, has a part to play.
Honiara has always been, and continues to be, at risk of natural hazards such as earthquakes, tsunamis and tropical cyclones due to its unique location. In more recent times, rapid urbanization is stretching the city’s ability to accommodate the increase of rural-urban migrants moving to Honiara in search of a better life. This large movement of people towards the capital city has led to the rapid growth of informal settlements in and around Honiara. Due to poor housing conditions, the residents of these areas are highly vulnerable to natural hazards. Addressing the resilience needs of vulnerable communities is central to this Action Plan.
As we look to the future, climate change will exacerbate the multitude of risks the city and its residents face, through the impact of more intense extreme events or longer term stresses such as sea level rise, a reduction in the quantity and quality of the city’s drinking water supply, or ocean acidification which damages local ecosystems and reduces our access to food for consumption or sale. Climate change will also worsen existing challenges such as poverty and inequality.
The complicated mix of climate and non-climate vulnerability causes was recognised in the development of the HURCAP. It sets out an integrated approach to addressing priority issues in Honiara relating to development, disaster risk reduction, and climate change adaptation. Indeed, addressing development problems in the informal settlements, and elsewhere in the city, will not only reduce the impact of natural hazards now but will also provide a valuable platform for implementing climate change adaptation measures and enhancing community resilience into the future.
This plan sets out an innovative framework for action that brings together previously disconnected agendas and involves multi-level actions that can be supported, and owned, by many different groups in the city. The priority needs and responses – at the city-wide, ward, and community level - have been developed in close collaboration with city and national Government, local communities, NGOs, and a variety of other interested stakeholder groups. This multi-level participatory approach reflects the strong and effective long-term partnerships that are needed to support Honiara’s path towards a sustainable and resilient future.
The diversity of urban community ownership of the action plan lends HURCAP its strength and is fully endorsed. The multi-partner approach to resilience building for the city will be led and coordinated with the full support of the Honiara City Council, Ministry of Lands, Housing and Survey, and the Ministry of Environment, Climate Change, Disaster Management and Meteorology.
Lord Mayor
Honiara City Council
Minister for Lands, Housing & Survey
Solomon Islands Government
Minister for Environment, Climate Change, Disaster
Management & Meteorology
Solomon Islands Government

vi
Acknowledgements
The Honiara Urban Resilience & Climate Action Plan was authored by Alexei Trundle and Darryn McEvoy, RMIT
University, Climate Change Adaptation Program, Melbourne as part of the support that the United Nations Human
Settlements Programme (UN-Habitat) provides to Pacific Island national and local governments under its Cities and
Climate Change Initiative (CCCI). Overall Project management was provided by Bernhard Barth of the Regional Office for
Asia and the Pacific.
The process of developing the Honiara Urban Resilience and Climate Action Plan was deliberately designed to be
stakeholder-led, and as a consequence has benefited from valuable inputs from many local sources. Though too
numerous to mention individually, the authors fully acknowledge all the contributions that have informed this action
plan for Honiara.
Particular thanks go to Honiara City Council, the Ministry of Lands, Housing and Survey (especially the Physical Planning
Unit), and the Ministry of Environment, Climate Change and Disaster Management, for their valued expert input to the
stakeholder engagement processes, and their continuing support for the urban resilience agenda. Representation from
Guadalcanal Province was also very much appreciated in the consideration of important cross-boundary issues.
The contributions from civil society organisations (such as Development Services Exchange) and from the vulnerability
hotspot communities themselves constitute an important component of the action plan. The input from local
community groups and individuals ensure that this document is firmly embedded in the local realities faced by Honiara.
These contributions are acknowledged and appreciated.
Constructive engagement with international organisations with a presence in Honiara (UNDP and the World Bank being
of particular note) has also added value to the compilation of this document. It is intended that a range of local and
international organisations will continue to contribute to improving the resilience of Honiara into the future.
An early draft of this document which had ensued from these consultations was presented to a two day city
consultation in August 2015 in which 70 stakeholders verified the findings and made significant contributions to the
Honiara action plan.
Finally, special thanks go to the local representative for UN-Habitat, Steve Likaveke, for supporting the local
engagement activity, providing access to the informal settlements, and for providing critical inputs into the community
discussions.

vii
Executive Summary
Honiara, the capital city of the Solomon Islands, faces a myriad of resilience challenges. Not only is the city already
exposed to multiple natural hazards, a changing climate will amplify many of the adverse impacts into the future. At the
same time, rapid urbanization - most obviously expressed through the growth of informal settlements in urban and
peri-urban areas - is heightening community exposure and sensitivity to a range of climate and non-climate shocks and
stresses.
In order to begin addressing these critical urban challenges, an initial vulnerability assessment was conducted as part of
the UN-Habitat ‘Cities and Climate Change Initiative’. Published just before the major 2014 Honiara flood event, the
assessment had identified some of the most vulnerable informal settlements; and these were the communities that
were worst impacted by the event. This experience of a recent natural disaster reinforced the need for actions to make
communities in the city, particularly the urban poor, more resilient to other shocks and stresses in the current day and
into the future.
To address this agenda, the vulnerability assessment was followed up by local adaptation planning activity that was
designed to identify key issues, and establish priority objectives, for enhanced community resilience. This process was
carried out in close collaboration with key stakeholders at different levels across the city (community, ward, and city-
level); involving representatives from national, provincial and city government, NGOs, as well as members of
vulnerability ‘hotspot’ communities. The Honiara Urban Resilience and Climate Action Plan (HURCAP) represents the
culmination of the program of adaptation planning activity and sets out a portfolio of adaptation actions that can be
implemented to directly contribute to resilience building in Honiara.
Priority actions that were identified through the participatory planning processes have been categorised according to
10 high-level thematic strands. The themes include: 1) Urban Planning & Land Development, 2) Housing, 3)
Infrastructure, 4) Water, Sanitation and Waste, 5) Ecosystem Services and Coastal Processes; 6) Human Health and
Well-being; 7) Communication: Awareness and Education, 8) Livelihoods and Behaviour Change, 9) Disaster
Preparedness and Response, and 10) Governance and Partnerships. These categories are considered useful for framing
adaptation processes and actions at multiple scales across the city.
Whilst the original intention was to develop a climate change adaptation plan, it became evident through engagement
with local stakeholders that climate change is only one driver affecting the vulnerability of poor communities in Honiara.
Existing exposure to climate variability (cyclones) and natural hazard extreme events (earthquakes and tsunamis)
meant that disaster risk reduction principles also needed to be accounted for i.e. considering the impacts of immediate
shocks as well as longer term stresses. Furthermore, Honiara has significant development needs relating to inadequate
infrastructure and housing stock, and in the case of some informal settlements, even access to basic essential services
such as water and energy.
Addressing these immediate development needs is therefore strongly reflected in this broader urban resilience and
climate action plan which integrates climate change adaptation, disaster risk reduction, and development goals. The
implementation of actions will not only reduce community exposure and sensitivity to shocks and stresses but will also
result in a more solid socio-economic foundation for longer-term climate adaptation.

viii
List of Organisations and Acronyms
ADB – Asian Development Bank
CCA – Climate Change Adaptation
CCAP – Climate Change Adaptation Program
CCCI – UN-Habitat’s Cities and Climate Change Initiative
CLGF – Commonwealth Local Government Forum
DRR/M – Disaster Risk Reduction / Management
FTE – Fixed Term Estate
GPG – Guadalcanal Provincial Government
HURCAP – Honiara Urban Resilience and Climate Action Plan
JICA – Japan International Cooperation Agency
LUPS – Land Use Planning Scheme
MECCDM – Ministry for the Environment, Climate Change and Disaster Management
MEHRD – Ministry of Education & Human Resources Development
MoFR – Ministry of Forestry and Research
MHA – Ministry of Home Affairs
MHMS – Ministry of Health and Medical Services
MID – Ministry of Infrastructure and Development
MLHS – Ministry of Lands, Housing and Survey
MWCY – Ministry of Women, Children and Youth
NCCP – National Climate Change Policy
NDMO – National Disaster Management Office
NHL – National Health Lab
PACCSAP – Pacific-Australia Climate Change Science and Adaptation Planning Program
PCRAFI – Pacific Catastrophe Risk Assessment and Financing Initiative
PSUP – Participatory Slum Upgrading Programme
RCP – Representative Concentration Pathway
REP – Rapid Employment Program
RMIT – Royal Melbourne Institute of Technology
RSIP – Royal Solomon Islands Police Force
SICC – Solomon Islands Chamber of Commerce
SIDS – Small Island Developing States
SIMS – Solomon Islands Meteorological Service
SINSO – Solomon Islands National Statistics Office
SOPAC – SPC Applied Geoscience and Technology Division
SPC – Secretariat of the Pacific Community
TOL – Temporary Occupation License
UN-Habitat – United Nations Human Settlement Programme
WDC – Ward Development Committee
WBG – World Bank Group

ix
TABLE OF CONTENTS
Table of Contents ..................................................................................................................................................................ix
1. Background: Planning a Resilient Honiara under a Changing Climate .............................................................................. 1
1.1 Plan Rationale ............................................................................................................................................................ 1
1.1.1 Plan Development Process & Context ................................................................................................................ 1
1.1.2 The UN-Habitat Planning for Climate Change Process ........................................................................................ 2
1.2 A Participatory Approach ........................................................................................................................................... 4
1.3 Urban Planning Context ............................................................................................................................................. 5
2. City Profile & Climate Vulnerability .................................................................................................................................. 7
2.1 City Structure, Demographics & Governance ............................................................................................................. 7
2.2 Vulnerability Assessment Framework....................................................................................................................... 12
2.3 Exposure to Climate-related Hazards ....................................................................................................................... 13
2.3.1 Average Annual Climate Conditions .................................................................................................................. 13
2.3.2 Extreme Weather Events and Spatial Variability .............................................................................................. 14
2.3.3 Climate Trends and Projected Climate Change ................................................................................................. 15
2.4 Socio-Economic Sensitivity & Critical Infrastructure ................................................................................................. 18
2.4 Adaptive Capacity: Institutions, Policy and Community Structures .......................................................................... 24
2.6 Vulnerability Hotspots .............................................................................................................................................. 27
2.6.1 Community Vulnerability Hotspots ................................................................................................................... 28
2.6.2 Critical Infrastructure & Sectors ........................................................................................................................ 30
3. City-wide Adaptation & Urban Resilience Objectives ..................................................................................................... 33
3.1 From Issues to Objectives ......................................................................................................................................... 33
3.2 Objective Categories ................................................................................................................................................. 34
3.2.1 Urban Planning and Land Development Objectives .......................................................................................... 35
3.2.2 Housing ............................................................................................................................................................. 35
3.2.3 Infrastructure .................................................................................................................................................... 36
3.2.4 Water, Sanitation and Waste ............................................................................................................................ 37
3.2.5 Ecosystem Services and Coastal Processes ....................................................................................................... 38
3.2.6 Human Health and Well-being .......................................................................................................................... 38
3.2.7 Communication: Awareness and Education ..................................................................................................... 39
3.2.8 Livelihoods and Behaviour Change ................................................................................................................... 40
3.2.9 Disaster Preparedness and Response ............................................................................................................... 40
3.2.10 Governance and Partnerships ......................................................................................................................... 41

x
4. Urban Resilience & Adaptation Action Planning............................................................................................................. 42
4.1 Honiara City-wide Actions ........................................................................................................................................ 42
4.1.1 Urban Planning and Land Development ........................................................................................................... 42
4.1.2 Housing ............................................................................................................................................................. 44
4.1.3 Infrastructure .................................................................................................................................................... 45
4.1.4 Water, Sanitation and Waste ............................................................................................................................ 46
4.1.5 Ecosystem Services and River and Coastal Processes ....................................................................................... 48
4.1.6 Human Health and Wellbeing ........................................................................................................................... 49
4.1.7 Communication, Awareness and Education ..................................................................................................... 50
4.1.8 Livelihoods and Behaviour Change ................................................................................................................... 51
4.1.9 Disaster Risk Reduction and Management ....................................................................................................... 52
4.1.10 Governance and Partnerships ......................................................................................................................... 53
4.2 Ward Level Adaptation Profiles & Actions ................................................................................................................ 55
4.2.1 Nggosi Ward: Profile and Adaptation Actions ................................................................................................... 56
4.2.2 Rove-Lengakiki Ward: Profile and Adaptation Actions ..................................................................................... 58
4.2.3 Mbumburu Ward: Profile and Adaptation Actions ........................................................................................... 60
4.2.4 Cruz Ward: Profile and Adaptation Actions ...................................................................................................... 62
4.2.5 Vavaea Ward: Profile and Adaptation Actions .................................................................................................. 65
4.2.6 Vuhokesa Ward: Profile and Adaptation Actions .............................................................................................. 68
4.2.7 Mataniko Ward: Profile and Adaptation Actions .............................................................................................. 70
4.2.8 Kola’a Ward: Profile and Adaptation Actions .................................................................................................... 72
4.2.9 Kukum Ward: Profile and Adaptation Actions .................................................................................................. 74
4.2.10 Naha Ward: Profile and Adaptation Actions ................................................................................................... 76
4.2.11 Vura Ward: Profile and Adaptation Actions .................................................................................................... 78
4.2.12 Panatina Ward: Profile and Adaptation Actions ............................................................................................. 80
4.3 Hotspot Community Actions ..................................................................................................................................... 82
Ontong Java Hotspot Community-level Actions: ....................................................................................................... 82
Aekafo Planning Zone, Kola’a Hotspot Community-level Actions: ............................................................................ 84
Kukum Fishing Village Hotspot Community-level Actions: ........................................................................................ 86
5. Communication: Awareness Raising and Education ....................................................................................................... 88
6. Resourcing: Options & Opportunities ............................................................................................................................. 90
7. Monitoring & Evaluation ................................................................................................................................................. 92
8. References ...................................................................................................................................................................... 93

xi
List of Figures
Figure 1: Outline of the second phase activities involved in the development of HURCAP ................................................ 2
Figure 2: Publicly Available UN-Habitat Climate Change Vulnerability Assessments in the Pacific...................................... 2
Figure 3: UN-Habitat Planning for Climate Change high-level structure .............................................................................. 3
Figure 4: Planning for Climate Change stakeholder & community activities ....................................................................... 4
Figure 5: Study area delineated by ward and associated peri-urban surrounds .................................................................. 7
Figure 6: Solomon Islands historical and SINSO-projected population & average annual growth rates .............................. 8
Figure 7: Honiara population growth estimates 1999-2009 by 1999 Enumeration Area ..................................................... 9
Figure 8: Relative population distribution by ward 1999 & 2009 ....................................................................................... 10
Figure 9: Percentage of total enumeration area population less than 15 years old, 2009 ................................................ 10
Figure 10: Illustration of the vulnerability framework ........................................................................................................ 12
Figure 11: Honiara Monthly Average Rainfall and Temperature ........................................................................................ 13
Figure 12: Honiara Long-term rainfall variability and trends by season ............................................................................. 14
Figure 13: Identified Climate-related Hazard Areas ........................................................................................................... 15
Figure 14: Long-term rainfall trends in Honiara by ENSO Status ........................................................................................ 16
Figure 15: Long-term temperature trends, Honiara ........................................................................................................... 16
Figure 16: Projected Change to Annual Mean Temperatures in the Solomon Islands ....................................................... 17
Figure 17: Projected Change to Annual Rainfall in the Solomon Islands ............................................................................ 18
Figure 18: Projected Mean Sea Level Rise in the Solomon Islands ..................................................................................... 18
Figure 19: Informal Settlement Zones as determined by MLHS & UN-Habitat Country Team .......................................... 19
Figure 20: Informal housing structures outside of ITZs in Mataniko Ward ........................................................................ 20
Figure 21: Population Density by Enumeration Area, 2009 ................................................................................................ 20
Figure 22: Households with unsealed or no sanitary/toilet facilities, 2009 ....................................................................... 21
Figure 23: (L) Informal secondary water connection (C) Kitchen Facilities in Kola’a (R) Natural Spring for Washing ........ 22
Figure 24: Households with Access to Metered Water, 2009 ............................................................................................ 22
Figure 25: Households with Access to Electricity, 2009 ...................................................................................................... 23
Figure 26: Households with Makeshift, Improvised or Traditional Roofing by EA, 2009 ................................................... 24
Figure 27: Adaptive Capacity Assessment by Workshop Participants, May 2015 .............................................................. 25
Figure 28: Household mobile phone ownership rates by Enumeration Area, 2009 ........................................................... 26
Figure 29: Internet-connected Households by Enumeration Area, 2009 ........................................................................... 27
Figure 30: Vulnerability Hotspot – Model Structure & Inputs ............................................................................................ 27
Figure 31: Vulnerability Hotspots across Honiara............................................................................................................... 28
Figure 32: Pollution in the riverbed Vara Creek, Aekafo Planning Area, December 2014 .................................................. 29
Figure 33: Kola’a ISZ topography (L) & example of housing responses (R)......................................................................... 29
Figure 34: Septic tank collection truck pumping effluent into the Honiara Landfill ........................................................... 30
Figure 35: View of the Point Cruz Port Facilities and Fuel Depot ....................................................................................... 32
Figure 36: Objective Identification Workshops: NDMO (L) & Kola’a ISZ (R) ....................................................................... 33
Figure 37: Issue Identification by Stakeholders by break-out group frequency & category .............................................. 34
Figure 38: City-wide HURCAP Objectives – Urban Planning and Land Development ......................................................... 35

xii
Figure 39: City-wide HURCAP Objectives – Housing ........................................................................................................... 36
Figure 40: City-wide HURCAP Objectives – Infrastructure.................................................................................................. 36
Figure 41: City-wide HURCAP Objectives – Water, Sanitation and Waste ......................................................................... 37
Figure 42: City-wide HURCAP Objectives – Ecosystem Services and Coastal Processes .................................................... 38
Figure 43: City-wide HURCAP Objectives – Human Health and Well-being ....................................................................... 38
Figure 44: City-wide HURCAP Objectives – Communication: Awareness & Education ...................................................... 39
Figure 45: City-wide HURCAP Objectives – Behaviour Change ........................................................................................... 40
Figure 46: City-wide HURCAP Objectives – Disaster Preparedness and Response ............................................................. 40
Figure 47: City-wide HURCAP Objectives – Governance and Partnerships ........................................................................ 41
Figure 48: Ward divisions across Honiara City .................................................................................................................... 55
Figure 49: Honiara Urban Resilience and Adaptation Forum Ward Break-out Activities (August 2015) ........................... 55
Figure 50: Nggosi Ward – Key Statistics and City Comparison ........................................................................................... 56
Figure 51: Nggosi Ward-specific Actions and Vulnerability Profile ..................................................................................... 57
Figure 52: Rove-Lengakiki Ward – Key Statistics and City Comparison .............................................................................. 58
Figure 53: Rove-Lengakiki Ward-specific Actions and Vulnerability Profile ....................................................................... 59
Figure 54: Mbumburu Ward – Key Statistics and City Comparison .................................................................................... 60
Figure 55: Mbumburu Ward-specific Actions and Vulnerability Profile ............................................................................. 61
Figure 56: Cruz Ward – Key Statistics and City Comparison ............................................................................................... 62
Figure 57: Cruz Ward-specific Actions and Vulnerability Profile ........................................................................................ 64
Figure 58: Vavaea Ward – Key Statistics and City Comparison........................................................................................... 65
Figure 59: Vavaea Ward-specific Actions and Vulnerability Profile .................................................................................... 67
Figure 60: Vuhokesa Ward – Key Statistics and City Comparison....................................................................................... 68
Figure 61: Vuhokesa Ward-specific Actions and Vulnerability Profile ................................................................................ 69
Figure 62: Mataniko Ward – Key Statistics and City Comparison ....................................................................................... 70
Figure 63: Mataniko Ward-specific Actions and Vulnerability Profile ................................................................................ 71
Figure 64: Kola’a Ward – Key Statistics and City Comparison ............................................................................................ 72
Figure 65: Kola’a Ward-specific Actions and Vulnerability Profile ...................................................................................... 73
Figure 66: Kukum Ward – Key Statistics and City Comparison ........................................................................................... 74
Figure 67: Kukum Ward-specific Actions and Vulnerability Profile .................................................................................... 75
Figure 68: Naha Ward – Key Statistics and City Comparison .............................................................................................. 76
Figure 69: Naha Ward-specific Actions and Vulnerability Profile ....................................................................................... 77
Figure 70: Vura Ward – Key Statistics and City Comparison ............................................................................................... 78
Figure 71: Vura Ward-specific Actions and Vulnerability Profile ........................................................................................ 79
Figure 72: Panatina Ward – Key Statistics and City Comparison ........................................................................................ 80
Figure 73: Panatina Ward-specific Actions and Vulnerability Profile ................................................................................. 81

1
1. BACKGROUND: PLANNING A RESILIENT HONIARA UNDER A CHANGING CLIMATE
1.1 PLAN RATIONALE
Small Islands Developing States (SIDS) in the Pacific region have historically been exposed to a wide range of both
climate-driven and geologically-related hazards; facing significant year-to-year variability in rainfall, weather extremes,
and an ever-present risk of tectonic activity potentially leading to earthquakes and tsunamis. In addition to this, rapidly-
increasing tropical ocean temperatures compound the sea level threats to low-lying islands, with observed rates of
increases in sea level in the region often well above global averages. As a consequence, saline intrusion into water
tables is compromising subsistence food crops, pressurising rural lifestyles and traditional ways of life. A combination of
overfishing, plastics pollution, and warming-driven bleaching events are also impacting coral reefs and fish stocks;
another key livelihood sector, tourism, offers an income source for island residents.
Major cities such as Honiara provide an alternative set of livelihood options for rural-dwellers; in particular through
greater economic opportunities, services and education facilities. Over the last two decades this has led to significant
rural-urban migration and rapid rates of urbanisation; with limited local capacity to meet the growing demand for
urban infrastructure, job creation, health, education and basic services. Given current day development needs in the
city, as well as having to plan for inevitable urban growth in the future, actions to adapt to climate change need to be
embedded within this broader urban development context.
As a result of the many challenges facing the city, this plan has been widened in scope to address urban resilience
beyond just climate change adaptation, and as such has been titled the Honiara Urban Resilience and Climate Action
Plan (HURCAP). This aligns with the new strategy for resilient development in the Pacific region, which seeks to
“strengthen the resilience of Pacific Island communities to the impacts of slow and sudden onset natural hazards by
developing more effective and integrated ways to address climate and disaster risks, within the context of sustainable
development” (SPC and SPREP 2015, p2).
1.1.1 PLAN DEVELOPMENT PROCESS & CONTEXT
This document concludes the second phase of UN-Habitat CCCI’s Planning for Climate Change (PfCC) Honiara Process,
with the first phase culminating in the release of a Climate Change Vulnerability Assessment for the city in early 2014
(UN-Habitat 2014a). The first phase Vulnerability Assessment was formally endorsed by the Honiara City Council and
the two Solomon Islands Government (SIG) focal ministries (MLHS & MECCDM) in August 2015, with the Lord Mayor
and the respective SIG Ministers committing to work across scales of government in the development and
implementation of this Urban Resilience and Climate Action Plan. An overview of the key milestones and outputs from
the HURCAP process is outlined in Figure 1 below.
As set out in the Solomon Islands National Climate Change Policy 2012-2017 the development of Adaptation Strategies
and Vulnerability Assessments for Honiara is an explicit policy priority for the country [NCCP 8.3.1(3)(i)]. This legislation
provides a clear directive for urgent action to reduce the climate risks that the city and other urban areas face
(MECCDM 2012, p21). As such, the HURCAP provides a valuable and timely platform for implementing adaptation and
resilience-building actions for Honiara. For example, ecosystem-based adaptation actions [highlighted in NCCP policy
directive 8.3.1(3)(h)], have been prioritised and proposed by community, government, and civil society representatives
throughout a series of workshops and the Honiara Adaptation Planning Forum held in 2015.

2
Figure 1: Outline of the second phase activities involved in the development of HURCAP
1.1.2 THE UN-HABITAT PLANNING FOR CLIMATE CHANGE PROCESS
The UN-Habitat Cities and Climate Change Initiative (CCCI) seeks to integrate climate change preparedness and
mitigation activities within cities in developing countries across the globe. As part of this agenda, CCCI is in the process
of developing climate change assessments and strategies in over 300 cities in the Asia-Pacific region, following the
stages set out in Planning for Climate Change: A Strategic, Values-based Approach for Urban Planners (UN-Habitat
2014b). A number of Climate Vulnerability Assessment reports from the first Phase of this process are available to the
public on the UN-Habitat website, with those in the Pacific Region shown in Figure 2. It is intended that these reports
will provide a baseline for comparison between cities, and allow for collaboration and sharing of climate change
adaptation planning techniques and approaches.
Figure 2: Publicly Available UN-Habitat Climate Change Vulnerability Assessments in the Pacific
The Planning for Climate Change approach (PfCC) consists of four cyclical modules, structured to enhance compatibility
with the ongoing and iterative nature of urban planning structures and action plan implementation. A high-level
overview of the approach, as well as some of the core step-by-step activities and suggested timelines is shown in Figure
3, with the steps specific to Phase 2 highlighted in blue.

3
Although PfCC Steps 4 through 6 were the focus of the HURCAP development process, the ongoing widening of
stakeholder engagement and participatory input (Step 2), as well as engagement with other adaptation-related
initiatives and implementation programs (such as the development of the Honiara Land Use Planning Scheme
(SPC/HCC/MLHS), and the Honiara Flood Risk Management project (WBG)) were also critical to ensuring the plans
currency and maximising stakeholder ‘buy-in’. Additional data availability, new policies and plans, as well as the
community’s experience through the April 2014 floods, were also integrated into the original vulnerability assessment
(Steps 1 and 3). These updates are detailed in Section 2 of this Action Plan.
UNH CCCI Planning Process Stage Activities & Key Issues Timeline
Module A: What is Happening?
Step 1: Getting Started Desk-based review of publicly available documents, data gaps
2 to 3-months, with review of literature as new policies & documents emerge.
Step 2: Stakeholders and Participation
Best facilitated with in-country ‘champions’ who can act as local contact points/co-ordinators.
An ongoing task over the course of the project, with several days of meetings at the beginning to get organized.
Step 3: Vulnerability Assessment Integration of community viewpoints with climate and non-climate data.
A 1 or 2-day workshop followed by several months to a year of study.
Module B: What Matters Most?
Step 4: Issues & Objectives Activities and community engagement will vary.
From a 1-day workshop with stakeholders, to several months or more.
Module C: What Can We Do About It?
Step 5: Identify Options Depends heavily on level of engagement, expertise and funds.
Initial options can often be identified in a 1 or 2-day workshop.
Step 6: Option Assessment
More comprehensive assessment can take several months.
Options can be evaluated in a 1 or 2-day workshop plus advance preparation.
Step 7: Implementation
Actual implementation timelines will vary depending upon the scale and scope of the actions.
Depending on organizational capacity, development of the final Climate Change Action Plan can take months.
Module D: Are We Doing It?
Step 8: Monitor and Evaluate M&E processes required and need extensive mainstreaming for ongoing data collection.
Initial framework could be developed in a 1-day workshop. Development of full plan will likely take 1 or 2 months.
Step 9: Adjust and Modify As climate impacts evolve and change, corresponding adaptation actions may require modification.
Ongoing.
Figure 3: UN-Habitat Planning for Climate Change high-level structure
The effective implementation of climate adaptation actions will require the support (and leadership) of local
communities as well as differing levels of government. This action plan has been structured to map to departmental
jurisdictions, objectives, and multiple scales of government. The 12 urban wards are considered to have considerable
potential for resilience actions, with engagement through Ward Development Committees (WDCs) and local social
networks. With English literacy rates in Honiara estimated to be around 86%, use of alternative verbal, theatrical and
Pijin-based communication and engagement approaches will be a critical aspect of the PfCC process as it continues into
the next implementation-focused phase. Section 5 of this Action Plan goes into more detail on some of the approaches

4
for building broader awareness of the HURCAP, as well as a deeper stakeholder and community understanding of the
issues and potential approaches related to urban resilience and climate change adaptation.
1.2 A PARTICIPATORY APPROACH
Development of this strategy was underpinned by participatory, bottom-up engagement approaches and input, with all
adaptation and resilience-enhancing actions being identified and developed by community representatives and local
stakeholders. The data around climate vulnerabilities that informed this process was developed through the integration
of quantitative datasets with community-based observations of past events and recent changes, allowing for critical
consideration of both community and scientific understandings of climate variability and change.
Figure 4 shows some of the activities conducted across the city throughout 2014/15, which in total involved over 280
individuals representing informal settlements, government, youth, donor organisations, NGOs, utilities and business
groups. These activities culminated in a two-day forum, attended by 93 community members who provided high-level
input to the plan through open forums and project presentations; and informing the ward-level actions that form the
basis of the action component of this plan (Section 4).
Figure 4: Planning for Climate Change stakeholder & community activities (Photo Credits: Mullett & Trundle)
With approximately a third of the city’s population living outside of government-tenured land, and strong cultural and
social networks and community leadership structures providing the basis of much of the response to the April 2014
floods, it is clear that participatory action planning is already deeply embedded within Honiara’s daily life. The HURCAP
aims to provide a model for building existing knowledge, approaches, and social structures into the formal governance
mechanisms for the city.

5
1.3 URBAN PLANNING CONTEXT
From a legislative perspective, urban planning in the Solomon Islands falls under the Town and Country Planning Act
(1996), which provides for local planning scheme development for the entirety of the Honiara Town Council’s
jurisdiction, as well as adjacent areas of Lengo and Saghalu in Guadalcanal Province (outside of the boundaries of
customary land). Governance within the Honiara municipal area is determined through the Honiara City Act (1999),
with the structure of the Honiara City Council (HCC) set out in more detail in Section 2.1. The amended Land and Titles
Act (1996) provides the basis for land releases and zoning within the municipal boundary, under the directives of the
newly-established Land Board which consists of representatives from HCC, the Ministry for Land, Housing and Survey
(MLHS), and permanent secretaries of a number of relevant ministries. MLHS is also responsible for the ongoing
implementation of a city-wide initiative to subdivide and formalise the large areas of land settled on illegally, or
through short-term temporary occupation licenses (TOLs), with the support of the UN-Habitat Participatory Slum
Upgrading Programme (PSUP).
Updating the HCC Local Planning Scheme was a key preliminary recommendation of the Honiara Climate Vulnerability
Assessment (UN-Habitat 2014a, p43). This task has subsequently been completed, with the Honiara Local Planning
Scheme 2015 (LUPS) gazetted in October 2015 following a lengthy period of public and expert consultation. In addition
to enhanced regulations around protection of service and utility network access routes and infrastructure, the LUPS
explicitly aims to prevent unsafe development in areas exposed to natural hazards under both current conditions and
projected climate change (including a coastal and riverine flooding overlay, and engineering requirements in areas with
a gradient steeper than 45 degrees). The scheme also outlines areas for future urban expansion, urban greenspace
reserves, and a structure plan for the city centre (including open space and a potential rezoning of the Point Cruz
industrial area).
Urban planning processes interact with national climate change legislation through the Solomon Islands National
Climate Change Policy 2012-2017, which sets out a number of high-level policy directives for the communication,
development and mainstreaming of climate change adaptation approaches and actions (outlined in Section 1.1).
Central to this within the urban context is policy directive 8.8.1(c), which requires the national government to:
“…strengthen coordination and consultation between government Ministries and Provincial governments to ensure that climate
change funding via the government or NGOs support the implementation of this policy and includes provincial government, Honiara
City Council and community representatives in the project cycle stages” (MECDM 2012, p35).
Other related SIG policies and strategies include the National Development Strategy 2011-2020 (which contains
initiatives such as the Honiara Road and Bridge Improvement programme and the Tina River Hydropower Scheme), as
well as standalone initiatives such as the development of an urban health policy and the relocation of the National
Referral Hospital. An updated National Development Strategy was launched in April 2016, with five headline objectives:
Sustained and inclusive economic growth.
Poverty alleviated across the whole of the Solomon Islands, basic needs addressed and food security improved,
and benefits of development more equitably distributed.
All Solomon Islanders have access to quality health and education.
Resilient and environmentally sustainable development with effective disaster risk management, response and
recovery.
Unified nation with stable and effective governance and public order.
The municipality operates eight portfolios: education; land and planning; works and transport; trade and commerce;
law enforcement; finance administration; health and environment; and youth, sports and women. Although each of
these portfolios has relevance to urban planning, climate change, and urban resilience, the Honiara City Council 5-Year
6
Strategic Plan 2014-2018 provides the overarching framework for urban planning across the city at a local government
scale. The city wide vision and mission statements, as contained with this document, are as follows:
HCC Vision Statement: For the City of Honiara to be acknowledged as a clean, safe, harmonious,
environmentally-responsible, prosperous and resilience capital city providing a high quality of life for its multi-
cultural community and its visitors.
HCC Mission Statement: For the City to work in partnership with the community to deliver a range of high
standard facilities and services, and to improve the quality of life for its citizens.
The HURCAP development process has attempted to align initiatives with the 8-point development agenda set out in
the HCC Strategic Plan, allowing actions to maximise and reinforce existing or proposed projects (such as, for instance,
waste water treatment at the Ranadi dump site, and cleaning programs for the Mataniko River). The HURCAP will also
set out specific tasks to more broadly defined Strategic Plan projects, such as the improved resilience of vulnerable
communities (Project No. 3.8, 2017).

7
2. CITY PROFILE & CLIMATE VULNERABILITY
Honiara’s city-wide Climate Change Vulnerability Assessment was completed in early 2014, following a year and a half
of extensive consultation with community members, government experts and stakeholder groups (UN-Habitat 2014a).
The following section of the plan summarises the findings of this assessment, as well as integrating supplementary
information and data collated during the second phase of the PfCC-Honiara project including new quantitative socio-
economic information at a sub-ward level (Trundle & McEvoy 2015). Similarly, preliminary identification of key
adaptation actions in the Vulnerability Assessment Report (UN-Habitat 2014a, p37) was used to inform the adaptation
options outlined in Section 4 of this action plan.
Shortly after the release of the Honiara Climate Change Vulnerability Assessment, a prolonged period of heavy rain in
April 2014 led to a significant flood event that resulted in 22 fatalities, displacement over 9,000 residents, destruction
of 675 homes, and an estimated total damage bill of US$108.9 million. Additional information arising from this event
has been considered in the actions and the findings embedded within this plan.
2.1 CITY STRUCTURE, DEMOGRAPHICS & GOVERNANCE
Figure 5: Study area delineated by ward and associated peri-urban surrounds
HCC has jurisdiction over the municipal area, as shown in Figure 5, encompassing approximately 23 square kilometres
of rugged hills and valleys rising up from the northern coastline of Guadalcanal Island. Honiara is the capital city of –
and the only city in – the Solomon Islands, although there are a number of urban-classified townships and settlements
on other islands across the archipelago (such as Gizo, Noro, Munda and Auki), as well as peri-urban wards on the city
fringe within Guadalcanal Province (Tandai and Malango). The Honiara municipal area is divided into 12 wards, each of
which is represented by a single elected councillor. The remaining council positions are comprised of four members
appointed by the Minister for Home Affairs – of which one is a female councillor put forward by the Solomon Islands
Council for Women – the three members of parliament that represent the Honiara city area, and the premier of
Guadalcanal Province (CLGF 2012).

8
From a population of less than 20,000 at the country’s Independence in 1978 the city has grown rapidly to an estimated
87,000 residents in 2015, despite civil unrest disrupting rural-urban migration in the early 2000s (SINSO 2011). While
the growth rate of the municipal population has slowed over time, peri-urban areas around the city have continued to
grow rapidly, including the Guadalcanal wards of Tandai and Malango which grew at an annual rate of 16.4% over the
decade prior to 2009. Figure 6 depicts total population growth and average annual growth rates for urban areas, rural
areas, and the Honiara municipality over the last four decades, as well as the official projections for a medium
population growth scenario to 2050. Notably, the disrupted process of urbanisation in the Solomon Islands following
the 1999 census limits the capacity to project future trends. Fieldwork conducted as part of the HURCAP process
suggests that rural-urban migration has accelerated, and may continue at significantly higher rates than those projected
in the SINSO ‘Constant Migration’ scenario shown below.
Figure 6: Solomon Islands historical and SINSO-projected population & average annual growth rates
Although Honiara’s population growth rate has slowed in recent years, a sizeable area of land within the municipal
boundary could yet be developed, particularly in the southern sections of the Kola’a and Panatina wards (see Figure 5).
However, growth in these areas has been limited by a lack of road access, utilities and government land releases. This
has contributed to the growing share of the city’s population living in informal settlements – in temporary or makeshift
housing – now estimated to house 35 – 40 percent of the municipality’s total population. This figure is likely to increase
yet further if not addressed through relocation and formalisation of tenure. This process, which is already underway,
includes the transfer of Temporary Occupation Licenses (TOLs)1 and un-licensed or lapsed settlement areas into Fixed
Term Estates (FTEs). UN-Habitat currently supports SIG and HCC through the Participatory Slum Upgrading Programme
which includes the development of a comprehensive settlements upgrading strategy which incorporates the
recommendations of this strategy. This will not be a simple exercise however as community negotiations, surveying,
and relocation of informal settlements that obstruct road access and utilities access or are in areas at high risk from
natural hazards requires extensive administrative support and planning time.
1 Temporary Occupation Licenses were established prior to national independence during the 1960s, and were designed to allow construction of non-permanent housing on a short-term, annual basis for a minimum fee, with no access to services and utilities. Collection of these fees and regulation of TOL zones has lapsed for a number of years, with only 2% of informal settlers holding a valid, current license in 2005 (UN-Habitat 2014a, p20).

9
As shown in Figure 7, spatial analysis of the growth patterns across the city over the decade preceding the 2009 census
shows that Honiara’s urban footprint continues to expand, with the population in the more established areas of central
and eastern Honiara largely stable (Trundle & McEvoy 2015). A breakdown by wards highlights this distinct spatial
distribution, with population growth since 1999 focused within Nggosi (5.7% p.a.), Mbumburu (5.0% p.a.) and Panatina
(4.7% p.a.), while Cruz and Naha shrunk significantly (at rates of -6.3 and -6.0 percent per annum respectively) (Trundle
& McEvoy 2015). In contrast the peri-urban provincial area of Tandai grew by 25.75% annually to reach a total
population of 10,083 by 2009.
Figure 7: Honiara population growth estimates 1999-2009 by 1999 Enumeration Area (Trundle & McEvoy 2015)
As shown in Figure 8, ward populations have shifted significantly since their establishment, and legislative review to
adjust proportionality of representation is long overdue. Although the development of this action plan involved the
identification of climate adaptation and resilience-enhancing actions at a ward and sub-ward level, it is recognised that
these sub-municipal structures will need to undergo revision to better reflect the shifting sizes of their constituencies,
as well as the increasing demand for new infrastructure as the newer ‘fringe’ urban development areas grow and are
given formal tenure arrangements. At a national level, the rapid increase in residents within the municipal area has also
led to Honiara’s three national electorates representing nearly double the number of constituents of their rural
counterparts (SINSO 2011).

10
Figure 8: Relative population distribution by ward 1999 & 2009
The pull factors of jobs, education and access to the global economy has attracted a large number of young people
from the provinces to Honiara; in all, 58% of the city’s population is less than 25 years old, a third of the population
being less than 15 years of age. While the number of young people aged 15-25 is distributed relatively evenly across
wards (with the exception of Cruz, which has only a third of its population within the youth age bracket), the
distribution of children is more distinct. As shown in Figure 9, young families are concentrated in the same growth areas
evident in Figure 7, namely Nggosi and Panatina.
Figure 9: Percentage of total enumeration area population less than 15 years old, 2009 (Trundle & McEvoy 2015)
This ‘youth bulge’ represents both a challenge and an opportunity for the city. Although the limited number of jobs
available has led to high levels of youth unemployment (with associated issues such as heightened occurrences of anti-
social behaviour), the concentration of education institutions, youth groups and strong social networks provides a
strong capacity for engagement with an active and creative section of the community. Training programs such as the

11
Rapid Employment Project (REP) provide pilot examples of how these sectors of the community can be involved
productively in the development of Honiara’s urban infrastructure, while at the same time providing jobs and training
opportunities (World Bank 2015a).

12
2.2 VULNERABILITY ASSESSMENT FRAMEWORK
As outlined in Section 1.1 of this Action Plan, Planning for Climate Change: A Strategic, Values-based Approach for
Urban Planners sets out a cyclical 4 module framework for assessing, prioritising, and acting on climate change
challenges within urban environments. Central to this approach is developing an understanding of the relationship of
the urban system to current and future climate impacts; determined through spatial, sectoral and social analysis of the
city and its components’ vulnerability to climate-related shocks and stresses.
Consistent with internationally recognised methodologies, vulnerability has been analysed through three component
parts; a product of (1) exposure and (2) sensitivity, which are counteracted by (3) adaptive capacity. This theoretical
framework is commonly expressed as an equation, as shown below:
Vulnerability = Exposure x Sensitivity
Adaptive Capacity
Examples of measures that were used to assess each of these components are highlighted in Figure 10.
Figure 10: Illustration of the vulnerability framework
‘Exposure’ refers to the extent, frequency, and severity of the climate-related shocks and stresses that the city
faces, such as the low lying areas likely to be inundated by sea level rise, or the chance of a category 5 cyclone
hitting the city in any given year.
‘Sensitivity’ is defined as the factors that determine how affected the city will be when such an event hits; for
instance, the young, sick and elderly are more at risk during a heatwave, while weaker buildings are more
likely to collapse during a severe storm event.
‘Adaptive capacity’ relates to the ability of the city, its institutions, and its citizens to respond to such an event,
whether through formal disaster response arrangements (such as NDMO evacuation centres), or through
social, traditional or informal means (for example, relying on relatives and kinship for temporary housing and
support following the April 2014 floods).

13
All three of these variables also change over time, with trends and projections for socio-economic factors (sensitivity) as
well as shifts in social, government and institutional characteristics (adaptive capacity) to be considered in parallel with
projected shifts in exposure to climate-related shocks and stresses driven both by climate change and more immediate
(largely locally-driven) environmental modifications (such as upstream deforestation increasing riverine flood exposure).
2.3 EXPOSURE TO CLIMATE-RELATED HAZARDS
2.3.1 AVERAGE ANNUAL CLIMATE CONDITIONS
Honiara is located 9°25’59” south of the equator at a longitude of 159°56’59” East, and has a two-season tropical
monsoon climate. Annual temperatures show little variation month to month, with minimum and maximum daily
temperatures ranging on average from 22.0°C to 23.5°C and 30.1°C to 30.7°C respectively (SIMS, BoM & CSIRO 2013). In
contrast, rainfall varies distinctly on an annual basis, with 70% of average annual rainfall falling within the November-
April wet season (known as Komburu), while rainfall during the dry season (or Ara) averages only 110mm per month
(see Figure 11 below).
Figure 11: Honiara Monthly Average Rainfall and Temperature (data sourced from SIMS)
Despite these long-term averages showing distinct rainfall patterns and temperature stability, the location of the
Solomon Islands at the juncture of the South Pacific Convergence Zone, the Inter-tropical Convergence Zone, and the
West Pacific Monsoon leads to significant inter-annual variability, particularly in terms of total annual rainfall. This
variation is attributed to shifts in these regional systems, such as to the movement of hot and cold water across the
Pacific associated with the El Niño-Southern Oscillation. The extent of this inter-annual variation is shown in Figure 12,
with total annual rainfall in 1969 recorded as roughly three times that of the previous year (3300mm, followed by
1110mm in 1970).

14
Figure 12: Honiara Long-term rainfall variability and trends by season (data sourced from SIMS)
2.3.2 EXTREME WEATHER EVENTS AND SPATIAL VARIABILITY
As a product of the city’s tropical climate and the converging regional climate systems – as discussed in Section 2.3.1 –
Honiara faces a range of extreme weather phenomena which have varying impact across the city.
Extreme rainfall events can lead to both localised flash flooding and severe riverine flooding as a product of the large
catchment areas that lie upstream of the city. The most extreme such event on record was the April 2014 Floods,
caused by peak daily rainfall of 318mm (3rd
of April 2014). This extreme event resulted in the deaths of 22 people and
the estimated displacement of 10,000, with over 1,000 of those displaced still housed in evacuation centres by the 25th
of June (OCHA 2014). Urban infrastructure, such as roads and bridges, were impacted and homes – many of them
informal – were also washed away. Access to clean drinking water was a major concern following the event for at least
half of the 50,000 estimated to have been affected by the flood.
Although long-term daily rainfall records are not available for the area, modelling-based analysis suggests that this
equates to more rainfall than expected in a 1-in-100 year event (Lal & Thurairajah 2011). Rainfall has also been
associated with the risk of landslips in the more rugged areas of the city, as well as riverbank erosion and the spread of
vector-borne diseases. Riverine flood risk areas for the April 2014 floods have been included in Figure 13, however
spatial information on flash flooding hotspots and riverine flood risk areas for more frequent return periods is not
available. Areas of landslip risk also require further analysis, particularly in relation to the Honiara Local Planning
Scheme, which has placed regulatory restrictions and requirements on building sites located on gradients steeper than
45 degrees (MLHS & HCC 2015).
Most coastal areas along the northern edge of the city lack natural or artificial defences from storm surges and tropical
cyclones, with those areas of the city likely to be impacted by a five metre storm surge height shown in Figure 13.
Tropical cyclones are seasonally most likely to occur between November and April, with on average one cyclone passing
within 400km of Honiara each year. Tropical Cyclone occurrence varies significantly year-to-year, however, ranging

15
from five in 1971/72 to none in other years (SIMS, BoM & CSIRO 2013). Cyclones are twice as likely to pass in close
proximity to Honiara during El Niño conditions as they are during a La Niña event. Exposure to other impacts resulting
from tropical cyclone events such as extreme winds are also likely to impact the coastal areas of the city, as well as the
ridgeline and north-facing housing in the city’s interior. Housing located on southerly-facing slopes below the ridgeline
is least likely to be impacted.
Although coastal erosion risk areas are also shown in Figure 13, a more extensive area was identified in community
consultations, with additional erosion evident at Kukum Fishing Village and Ontong Java Settlement. Such changes were
observed to be driven by storm surge events and extreme wave action during tropical cyclones.
Figure 13: Identified Climate-related Hazard Areas (data sourced from MLHS, UN-Habitat and MECCDM)
Extreme heat events – particularly in the form of hot night-time temperatures – were noted by community members as
having some impact on particular communities, supported by SIMS data showing a strong increase in the number of
very hot day-time and night-time temperatures over the last two decades. These extreme heat conditions are
worsened in high-density areas, where a lack of through-flow prevents cooling through sea breezes and natural air
circulation.
Drought and coral bleaching events have historically had a secondary impact on the city by reducing the availability of
food, livelihood products, and water, while also driving rural-to-urban migration. However, exposure to these events is
not spatially specific to the Honiara municipal area.
2.3.3 CLIMATE TRENDS AND PROJECTED CLIMATE CHANGE
Trends in annual rainfall and average temperatures in Honiara are shown in Figure 14 and Figure 15. The overall trend
in annual rainfall is not statistically significant; however, a clear warming trend is evident across mean, maximum and
minimum air temperatures. Sea surface temperatures show a similar warming trend, increasing at a rate of 0.12°C per
decade since the 1970s (SIMS, BoM & CSIRO 2013).

16
Seasonal and daily rainfall trends are not clear, although the number of rainy days experienced in Honiara has
decreased slightly (3.75 less rainy days per decade). As noted in Section 2.3.2, extreme temperatures have shifted
significantly, with night-time extremes showing a strong increase in unusually hot minimum temperatures, and a similar
decrease in extremely cool night-time minimums.
Satellite observations of near-shore sea level rise around Guadalcanal shows an increase of more than double the
global average, rising at an average rate of 8mm per year since 1993 (SIMS, BoM & CSIRO 2013 p.206).
Analysis of trends in tropical cyclone occurrence and intensity is not recommended at the country level in the Pacific.
Figure 14: Long-term rainfall trends in Honiara by ENSO Status (data sourced from PACCSAP 2014)
Figure 15: Long-term temperature trends, Honiara (data sourced from PACCSAP 2014)
Future climate projections are based on Representative Concentration Pathways (RCPs), which reflect different
warming scenarios dependent on the level of global emissions over time. These scenarios are then applied to Global
Climate Models (GCMs) resulting in a range of possible future climate projections. The agreement between these
17
models – as well as their consistency with the underlying science and observations – is reflected in the confidence
levels that are applied as determined by the Pacific-Australian Climate Change Science and Adaptation Planning
Program (comprising climate science experts from the Australian Bureau of Meteorology and the Commonwealth
Science and Industry Research Organisation). The bracketed range used in the figures below shows the range of these
modelled outputs (excluding outliers beyond 5-95% agreement), with change relative to a 20-year period centred
around 1995.
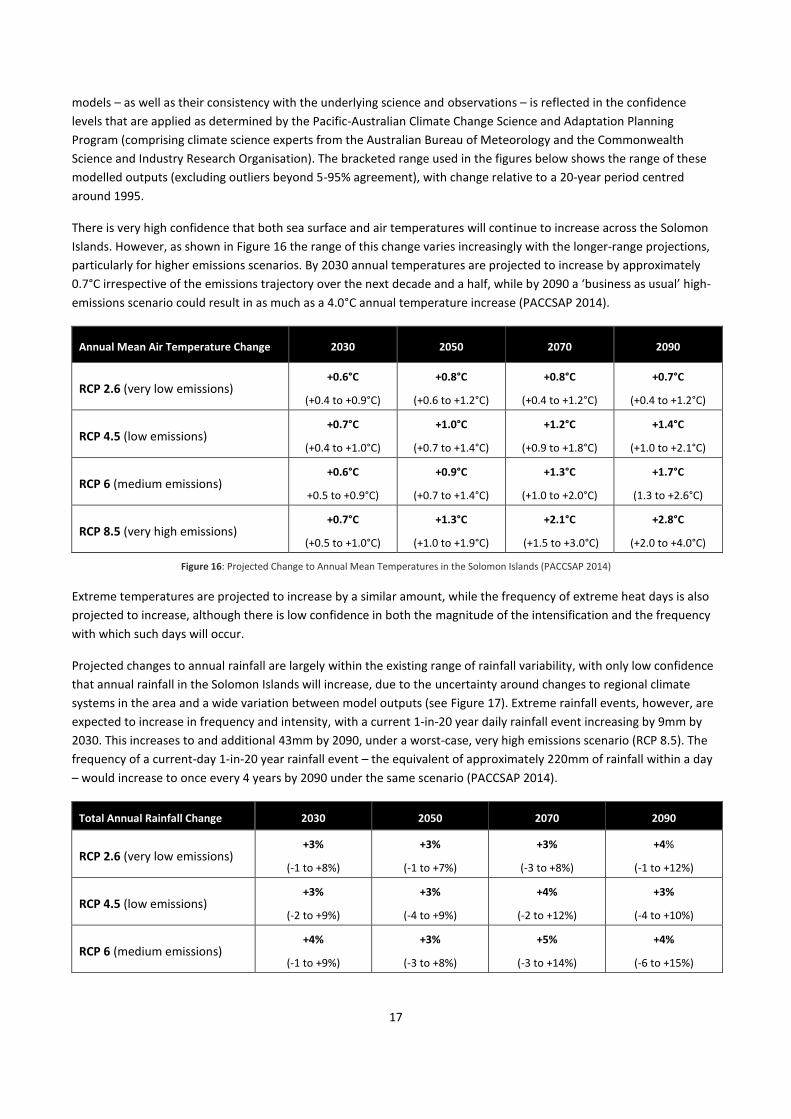
There is very high confidence that both sea surface and air temperatures will continue to increase across the Solomon
Islands. However, as shown in Figure 16 the range of this change varies increasingly with the longer-range projections,
particularly for higher emissions scenarios. By 2030 annual temperatures are projected to increase by approximately
0.7°C irrespective of the emissions trajectory over the next decade and a half, while by 2090 a ‘business as usual’ high-
emissions scenario could result in as much as a 4.0°C annual temperature increase (PACCSAP 2014).
Annual Mean Air Temperature Change 2030 2050 2070 2090
RCP 2.6 (very low emissions) +0.6°C
(+0.4 to +0.9°C)
+0.8°C
(+0.6 to +1.2°C)
+0.8°C
(+0.4 to +1.2°C)
+0.7°C
(+0.4 to +1.2°C)
RCP 4.5 (low emissions) +0.7°C
(+0.4 to +1.0°C)
+1.0°C
(+0.7 to +1.4°C)
+1.2°C
(+0.9 to +1.8°C)
+1.4°C
(+1.0 to +2.1°C)
RCP 6 (medium emissions) +0.6°C
+0.5 to +0.9°C)
+0.9°C
(+0.7 to +1.4°C)
+1.3°C
(+1.0 to +2.0°C)
+1.7°C
(1.3 to +2.6°C)
RCP 8.5 (very high emissions) +0.7°C
(+0.5 to +1.0°C)
+1.3°C
(+1.0 to +1.9°C)
+2.1°C
(+1.5 to +3.0°C)
+2.8°C
(+2.0 to +4.0°C)
Figure 16: Projected Change to Annual Mean Temperatures in the Solomon Islands (PACCSAP 2014)
Extreme temperatures are projected to increase by a similar amount, while the frequency of extreme heat days is also
projected to increase, although there is low confidence in both the magnitude of the intensification and the frequency
with which such days will occur.
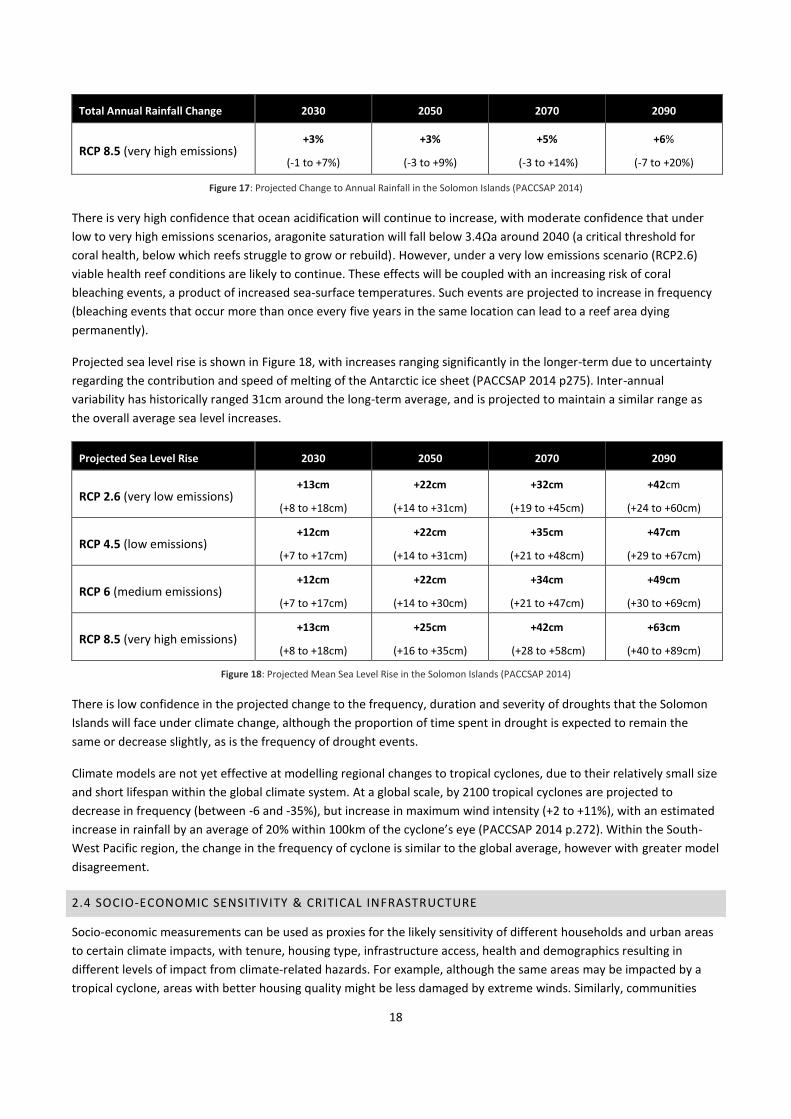
Projected changes to annual rainfall are largely within the existing range of rainfall variability, with only low confidence
that annual rainfall in the Solomon Islands will increase, due to the uncertainty around changes to regional climate
systems in the area and a wide variation between model outputs (see Figure 17). Extreme rainfall events, however, are
expected to increase in frequency and intensity, with a current 1-in-20 year daily rainfall event increasing by 9mm by
2030. This increases to and additional 43mm by 2090, under a worst-case, very high emissions scenario (RCP 8.5). The
frequency of a current-day 1-in-20 year rainfall event – the equivalent of approximately 220mm of rainfall within a day
– would increase to once every 4 years by 2090 under the same scenario (PACCSAP 2014).
Total Annual Rainfall Change 2030 2050 2070 2090
RCP 2.6 (very low emissions) +3%
(-1 to +8%)
+3%
(-1 to +7%)
+3%
(-3 to +8%)
+4%
(-1 to +12%)
RCP 4.5 (low emissions) +3%
(-2 to +9%)
+3%
(-4 to +9%)
+4%
(-2 to +12%)
+3%
(-4 to +10%)
RCP 6 (medium emissions) +4%
(-1 to +9%)
+3%
(-3 to +8%)
+5%
(-3 to +14%)
+4%
(-6 to +15%)
18
Total Annual Rainfall Change 2030 2050 2070 2090
RCP 8.5 (very high emissions) +3%
(-1 to +7%)
+3%
(-3 to +9%)
+5%
(-3 to +14%)
+6%
(-7 to +20%)
Figure 17: Projected Change to Annual Rainfall in the Solomon Islands (PACCSAP 2014)
There is very high confidence that ocean acidification will continue to increase, with moderate confidence that under
low to very high emissions scenarios, aragonite saturation will fall below 3.4Ωa around 2040 (a critical threshold for
coral health, below which reefs struggle to grow or rebuild). However, under a very low emissions scenario (RCP2.6)
viable health reef conditions are likely to continue. These effects will be coupled with an increasing risk of coral
bleaching events, a product of increased sea-surface temperatures. Such events are projected to increase in frequency
(bleaching events that occur more than once every five years in the same location can lead to a reef area dying
permanently).
Projected sea level rise is shown in Figure 18, with increases ranging significantly in the longer-term due to uncertainty
regarding the contribution and speed of melting of the Antarctic ice sheet (PACCSAP 2014 p275). Inter-annual
variability has historically ranged 31cm around the long-term average, and is projected to maintain a similar range as
the overall average sea level increases.
Projected Sea Level Rise 2030 2050 2070 2090
RCP 2.6 (very low emissions) +13cm
(+8 to +18cm)
+22cm
(+14 to +31cm)
+32cm
(+19 to +45cm)
+42cm
(+24 to +60cm)
RCP 4.5 (low emissions) +12cm
(+7 to +17cm)
+22cm
(+14 to +31cm)
+35cm
(+21 to +48cm)
+47cm
(+29 to +67cm)
RCP 6 (medium emissions) +12cm
(+7 to +17cm)
+22cm
(+14 to +30cm)
+34cm
(+21 to +47cm)
+49cm
(+30 to +69cm)
RCP 8.5 (very high emissions) +13cm
(+8 to +18cm)
+25cm
(+16 to +35cm)
+42cm
(+28 to +58cm)
+63cm
(+40 to +89cm)
Figure 18: Projected Mean Sea Level Rise in the Solomon Islands (PACCSAP 2014)
There is low confidence in the projected change to the frequency, duration and severity of droughts that the Solomon
Islands will face under climate change, although the proportion of time spent in drought is expected to remain the
same or decrease slightly, as is the frequency of drought events.
Climate models are not yet effective at modelling regional changes to tropical cyclones, due to their relatively small size
and short lifespan within the global climate system. At a global scale, by 2100 tropical cyclones are projected to
decrease in frequency (between -6 and -35%), but increase in maximum wind intensity (+2 to +11%), with an estimated
increase in rainfall by an average of 20% within 100km of the cyclone’s eye (PACCSAP 2014 p.272). Within the South-
West Pacific region, the change in the frequency of cyclone is similar to the global average, however with greater model
disagreement.
2.4 SOCIO-ECONOMIC SENSITIVITY & CRITICAL INFRASTRUCTURE
Socio-economic measurements can be used as proxies for the likely sensitivity of different households and urban areas
to certain climate impacts, with tenure, housing type, infrastructure access, health and demographics resulting in
different levels of impact from climate-related hazards. For example, although the same areas may be impacted by a
tropical cyclone, areas with better housing quality might be less damaged by extreme winds. Similarly, communities

19
which are dependent on fishing for livelihoods or income will be most sensitive to coral bleaching events that result in a
depletion of fish stocks.
The initial analysis of climate sensitivity is contained in the Honiara Climate Change Vulnerability Assessment (UN-
Habitat 2014a) but has been complemented by analysis and mapping of the 2009 National Census data at a sub-ward
level across the city. Additionally, transect walks and community workshops in Kola’a, Ontong Java Settlement and
Kukum Fishing Village provided further local information on climate sensitivity at the household level.
Figure 19: Informal Settlement Zones as determined by MLHS & UN-Habitat Country Team (MLHS / UNH 2014)
As can be seen in Figure 19, Informal Settlement Zones (ISZs) comprise almost 15% of the city’s total land area, and
contain an estimated 28% of the city’s population2. In addition to these zones, informal housing structures can be found
throughout the city on road reserves and other accessible un-populated areas, such as the national cemetery and the
botanical gardens (pers. comm., HCC December 2014).
Two examples of these untenured structures are shown in Figure 20. Both are limited in terms of their structural
integrity as well as being located in areas that were exposed to flooding in 2014.
2 This figure is derived from analysing 2009 census data household spatial reference points, estimating household size by respective Enumeration
Area averages. Point-specific data was not able to be accessed due to confidentiality concerns. It is noted that some areas of formal tenure may be
contained within the shaded areas of Figure 19, which are intended to be illustrative only.

20
Figure 20: Informal housing structures outside of ITZs in Mataniko Ward (Photo Credit: Trundle)
Almost half of Panatina Ward’s total population (48.6%) is contained within ISZs, while Kola’a Ward comprises a
similarly large ISZ population (39.9% of its total ward constituency). 20-30% of Nggosi, Vavaea, Mataniko and Vura’s
populations also reside within these zones.
ISZs have a significantly higher population density than the rest of the city (52.7 residents per hectare compared with
26.8 city-wide), which increases sensitivity to extreme heat, and worsens health-related issues such as vector- and
water-borne disease. Other urban areas with notably high population density are Ontong Java settlement (also known
as Lord Howe Settlement) in Mataniko Ward (218 residents per hectare), and Fishing Village in Panatina Ward (112
residents per hectare), as shown in Figure 21. In both of these areas, the unplanned built form was noted to be
preventing on-shore breezes from penetrating the settlements, worsening issues associated with extreme heat days
that were being observed by community members (pers. comm., May 2015 consultation).
Figure 21: Population Density by Enumeration Area, 2009 (Trundle & McEvoy 2015)

21
A second aspect of sensitivity that cuts across multiple climate hazards is access to and quality of sanitation. This has
the potential to compound the immediate impacts of flooding with the spread of disease, and can lead to underlying
health conditions that also heighten sensitivity to extreme heat events. Furthermore, seepage into groundwater has
the potential to put the city’s water supply at risk, as well as affecting local water sources (see, for example, the natural
spring water source shown in Figure 23, which is used by the majority of the surrounding community). The distribution
of households which lack sealed sewerage facilities, based on 2009 data, is shown in Figure 22.
Figure 22: Households with unsealed or no sanitary/toilet facilities, 2009 (Trundle & McEvoy 2015)
Over a third of households in Vuhokesa and a similar percentage of Naha ward residents (31.5%) have either unsealed
or no toilet facilities. Hotspot areas in larger wards are offset by more established, connected locations, which generally
correspond to formal land tenure. City-wide, roughly 17% of households lack access to these basic sanitation services.
Approximately 30% of the city is connected to the Solomon Water sewerage network (UN-Habitat 2014a p.16).
In areas lacking sealed sewerage facilities, site visits identified a number of improvised sanitation approaches. In ISZs
unsealed pit toilets are commonplace, while the gravity-fed sewerage system for connected areas is noted to have
consistent leakage issues, with 16 outfalls discharging directly into the ocean. Improvised facilities for washing are often
located near waterways or the ocean, such as the kitchen area and communal shower/washing site shown in Figure 23.
In coastal zones, community members were identified as washing in the ocean and were also observed washing kitchen
items and clothing in waterways.

22
Figure 23: (L) Informal secondary water connection (C) Kitchen Facilities in Kola’a (R) Natural Spring for Washing
One quarter of households across the city lack formal metered access to potable drinking water, although as shown
above, unauthorised secondary water connections are commonplace particularly within ISZs. Panatina and Rover-
Lengakiki Wards have the lowest levels of potable water access (63.6% and 68.9% respectively), with the distribution of
metered water access across the city shown in Figure 24. The city’s official water supply is sourced from a combination
of groundwater sources and freshwater springs, located within or adjacent to the city boundary, with the city’s main
water supply located upstream of Nggosi ward within the White River catchment (Kongulai Spring).
Figure 24: Households with Access to Metered Water, 2009 (Trundle & McEvoy 2015)
Access to the SIEA electricity grid follows a similar pattern across the city, shown in Figure 25, with the exception of
significantly lower access rates in Nggosi Ward (53.6%). Vuhokesa ward recorded the lowest rate of SIEA connections

23
per household (48.0%), while Kola’a, Panatina and Vavaea all fell within the 55-65% electricity access range. It was
noted during site analysis that housing constructed with traditional materials were not permitted to be connected to
the grid, limiting access to some customary sites along the Mataniko River, as well as a number of informal settlements.
In total roughly two-thirds of households in Honiara have electricity access, although a number of off-grid houses were
observed to be using small solar panels to generate power for devices such as mobile phones.
The city’s power supply is heavily dependent on imported diesel, which, combined with transport fuel, accounts for
roughly 30% of the country’s goods imports by cost, and 80% of SIEA’s expenditure (MMERE 2014). Based on 2013
figures Honiara’s power supply consumes an estimated 16.2 million litres of diesel annually. Port access and diesel
storage in Cruz, as well as the continuing operation of the city’s two power stations, is therefore critical following an
extreme weather event.
As noted in the Honiara Vulnerability Assessment, previous tropical cyclone events have brought down power lines,
resulting in power outages. A one-megawatt photovoltaic rooftop array supplements the diesel generators, with back-
up generators located at most government ministries and other key infrastructure facilities. A number of small-scale
hydro stations are also currently being refurbished, and are due to return to operation in 2016.
Figure 25: Households with Access to Electricity, 2009 (Trundle & McEvoy 2015)
Makeshift and improvised roofing increases sensitivity to tropical cyclone, extreme wind and flood events, with poorly
constructed housing structures along the Mataniko River collapsing during the 2014 floods; resulting in large debris that
damaged downstream infrastructure. Poor quality roofing can also lead to heightened risk in extreme heat, reducing
shading of walls and insulation of inside spaces. As can be seen in Figure 26 these houses are concentrated in ISZs,
where a lack of formal tenure was noted to prevent investment in stronger housing designs and materials.

24
Figure 26: Households with Makeshift, Improvised or Traditional Roofing by EA, 2009 (Trundle & McEvoy 2015)
2.4 ADAPTIVE CAPACITY: INSTITUTIONS, POLICY AND COMMUNITY STRUCTURES
Adaptive capacity is a measure of the resources, institutional and community structures, and knowledge networks and
skills that are able to be used or activated in response to a shock or long-term stress. Adaptive capacity counteracts the
heightened vulnerability resulting from exposure and sensitivity, and can be similarly considered in terms of spatial
variation within the city, as well as across the city as a whole. Adaptive capacity can be categorised as being:
Autonomous, where there is no targeted response to climate stimuli, but gradual market, ecological and
behavioural shifts that occur spontaneously over time;
Collective, whereby households, groups and community organisations work with their own social structures
and kastom networks; and
Institutional, which refers to formal governance arrangements, policies and capacity.
A rapid assessment of city-wide adaptive capacity was conducted by a series of stakeholder groups in 2015, including
the Honiara City Council, Solomon Water, the National Disaster Management Office, as well as youth and NGO
representatives, and hotspot communities. The outcomes of this are shown in Figure 27, and supplement the outcomes
of the 2012 city consultation workshop, which provided the baseline for assessing adaptive capacity in the Honiara
Vulnerability Assessment (UN-Habitat 2014a p.15).

25
Figure 27: Adaptive Capacity Assessment by Workshop Participants, May 2015
Access to finance is an issue at both community and household levels, as well as across national government agencies.
As noted in the PCRAFI Disaster Risk Financing and Insurance Country Note, disaster relief through the National Disaster
Council has a limited national budgetary allocation (US$305,250 in 2013), which has a 77 percent chance of being
exceeded in a given year. This results in heavy dependency on international recovery funds and limits preparatory and
preventative actions (World Bank 2015b). At a household level, 32% of the population fall below the Basic Needs
Poverty Line (UN-Habitat 2014a p.15). These results are consistent with the 2012 workshop findings that access to
finance is both a critical limitation to city wide adaptive capacity, as well as resourcing community and household-level
resilience building measures.
Similarly, the vulnerability of critical infrastructure to climate-related events – such as cross-city bridges, the National
Referral Hospital, and Honiara International Airport – was viewed as seriously limiting institutional responses following
a natural disaster event such as a tropical cyclone. The lack of effective back-up electricity generators for mobile phone
communications was also identified as an area of critical response infrastructure that would have a knock-on effect in
reducing collective adaptive capacity.
Important components of city-wide adaptive capacity are related to the ability to communicate (both in terms of formal
institutional communication procedures, and collective social response measures), and stakeholder and community
awareness of climate-related natural hazards. Existing community leadership structures, particularly through kastom
networks and ward-level committees, were identified as being effective following historical disaster events, with a
number of the residents displaced due to the April 2014 floods being quickly re-housed through kinship networks,
families and church groups.
Although the number of existing strategies and plans was seen as being a city-wide strength, the implementation,
effectiveness, and awareness of these documents in both key government agencies and the community as a whole was
noted to be limiting. Other areas, such as the awareness of decision-makers of climate change and the adequacy of
critical infrastructure, were inconsistently assessed by different stakeholder groups (as shown in grey in Figure 27),
suggesting that improved communication between agencies could directly enhance Honiara’s institutional adaptive
capacity across levels of government, stakeholders and non-government actors.

26
The impact of the 2014 floods also emphasised the need for effective Disaster Risk Reduction (DRR) actions, not only in
terms of responses such as evacuation but also institutional and community preparedness (land use planning, hazard
zoning and enforcement, adequate drainage systems, communication of risks etc.). To assess its preparedness for
future disasters, HCC invited ICLEI and UNISDR to facilitate a workshop in March 2016 using the UNISDR’s Local
Government Self-Assessment process (LGSA) for Disaster Risk Reduction to assess preparedness and to articulate a
basis on which to develop future disaster risk reduction plans (UNISDR/ICLEI 2016). Findings from the workshop
indicated that there were strong community connections that could be called upon and that DRR training is delivered in
some communities by the NDMO, as well as NGOs. It was also felt that the new Local Planning Scheme could limit
inappropriate development in high risk areas and that the current review of the National Disaster Management Plan
provides a good opportunity for HCC to engage with the national level to develop their own plan. However, it was also
noted that there is a lack of a formal structure in HCC for DRR, and a lack of clarity of roles and responsibilities within
HCC (and between agencies), and coordination and cooperation between agencies and with the community on DRR is
perceived to be poor.
As with sensitivity and exposure, adaptive capacity varies significantly across the city. Informal settlements, as outlined
in Section 2.4, lack many of the institutional support structures available to households with tenure; however they have
strong community networks that contribute to collective adaptive capacity strength. Other factors, such as
communications access, similarly correspond to access to utilities and other institutions. For instance mobile phone
access, shown in Figure 28, correlates closely to informal neighbourhoods and other sensitive locations.
In contrast, measures of access to luxury services, such as wired internet access, can demonstrate sections of the
community with a high level of adaptive capacity, both directly in terms of the ability to autonomously respond and
self-finance, and indirectly through access to institutional response mechanisms such as government websites and
international networks. Although internet connectivity across the city was generally very low at the last census,
localities with concentrations of higher income households can be seen in Figure 29, with the south-eastern hillside
areas of Nggosi, central Kola’a above Chinatown, and Cruz exhibiting these characteristics.
Figure 28: Household mobile phone ownership rates by Enumeration Area, 2009 (Trundle & McEvoy 2015)

27
Figure 29: Internet-connected Households by Enumeration Area, 2009 (Trundle & McEvoy 2015)
2.6 VULNERABILITY HOTSPOTS
In order to identify those communities and sectors most vulnerable to climate impacts, a Vulnerability Hotspot Model
was developed integrating the features described in both the original Honiara Vulnerability Assessment and the
additional variables outlined in this HURCAP (Figure 30).
Figure 30: Vulnerability Hotspot – Model Structure & Inputs

28
Thresholds for enumeration-area classification were determined for seven of the 2009 census variables which were
seen as critical for socio-economic sensitivity to climate impacts. These seven variables were overlayed, and areas with
one or more thresholds passed were then highlighted. Localities that grew at a rate of 15% or above per annum over
the previous decade were taken into account, in addition to the overcrowding issues identified in high-density zones,
informal settlement zones, and critical infrastructure. The outputs of this integrated analysis are shown in Figure 31.
Figure 31: Vulnerability Hotspots across Honiara
2.6.1 COMMUNITY VULNERABILITY HOTSPOTS
As a consequence of the April 2014 floods the Honiara Vulnerability Assessment hotspot communities were reviewed,
with the previously identified sites subject to site visits and community consultation sessions. However, the destruction
of the Koa Hill housing area meant that this community was omitted from the assessment. On the basis of the
vulnerability hotspot model shown above, two additional areas were also identified, as can be seen in Figure 31; these
are recommended for follow-up site visits, profiling, and analysis.
Ontong Java Settlement (1), also referred to as Lord Howe Settlement, remains one of the highest priority hotspot
areas, being located at the mouth of the Mataniko River and 0.5 metres below the current high-water mark. The
community faces additional hazards such as heavily polluted internal drainage systems, overpopulated high density
housing, and a lack of basic sanitation and proximity to sewerage outfalls from the National Referral Hospital (which has
limited waste treatment capabilities). Saline water-logging was preventing planting of gardens within the community,
as well as the digging of pit-latrines. Extreme night-time temperatures were also identified as being an issue, with sea-
breezes prevented from penetrating into the settlement due to overcrowding.
Kukum Fishing Village (2), is located in Vura Ward adjacent to the Kukum highway along a thin strip of coastline that
has been heavily eroded in past cyclone events. The dependence on fisheries for livelihoods further heightens the
community’s vulnerability to the marine impacts of climate change, while the community experiences similar issues to
Ontong Java Settlement with a neighbouring sewerage outfall polluting the local environment. Health risks associated
with water pollution and poor rubbish collection services were also noted by community members, which were
worsened by the high population density and overcrowding in the area.

29
The Aekafo Planning Area (3) in Kola’a Ward includes the two ISZs of Matariu and Jericho; hotspots highlighted in the
Honiara Vulnerability Assessment. This area has limited road access and no formal connection to utilities and services,
resulting in severe pollution along the riverine valley and significant risk from disease due to a lack of basic sanitation
(see Figure 23 in Section 2.4, and Figure 32 below). A large portion of the area is also potentially at risk of landslip, with
houses built without formal approval or under TOLs, resulting in variable structural quality, and little to no government
regulation (see Figure 33).
Figure 32: Pollution in the riverbed Vara Creek, Aekafo Planning Area, December 2014 (Photo: Trundle)
Figure 33: Kola’a ISZ topography (L) & example of housing responses (R) (Photo: Trundle)
The two additional vulnerability hotspots identified through socio-economic analysis and hazard mapping are located in
rapid growth Informal Settlement Zones, adjacent to Honiara’s municipal boundaries. The White River (4) area along
Nggosi Ward’s western boundary grew rapidly in the decade preceding the 2009 census, and has limited electricity and
sanitation access (although the proximity to a natural spring water source upstream of White River has resulted in

30
higher than average metered water connectivity). Limited mobile phone access and a significant presence of makeshift
or traditional housing types suggest that further investigation of this locality is warranted.
Similarly, the rapid cross-border population growth observed along Panatina Ward’s southern boundary suggests that
Mamulele & Kombito 2 & 3 (Hotspot 5) also meet the criteria of vulnerability hotspots, and require further on-the-
ground analysis and engagement. These areas have very low metered water and electricity access, high levels of
makeshift or traditional housing materials, and a housing density above 75 persons per hectare. These housing areas
are also rapidly encroaching on the catchment areas around the Kombito water source, with the adjacent boreholes
and spring water site as shown in Figure 31.
2.6.2 CRITICAL INFRASTRUCTURE & SECTORS
In addition to housing and household-level issues, critical components of the city’s infrastructure are also heightening
Honiara’s vulnerability to current day climate-related events, many of which will be worsened by climate change. The
potential impact of critical infrastructure failure was highlighted during the April 2014 floods, where damage to the
city’s main through road and bridges across the Mataniko River severely reduced cross-city access. The locations of the
critical infrastructure assets most vulnerable to climate impacts are shown in Figure 31. Infrastructure ‘deficits’ were
also confirmed by the Honiara City Council Disaster Risk Reduction Self-Assessment workshop (UNISDR / ICLEI 2016),
which highlighted that critical infrastructure, schools, and health facilities are not designed to cope with extreme events,
and the maintenance of public infrastructure is poor. In addition, building codes do not necessarily integrate disaster
risk, and need to be better enforced.
Although not a spatial hotspot as such, the lack of sanitation across the city heightens the vulnerability of the city to
climate impacts, with flooding, health issues and the use of urban springs and water sources for washing, drinking and
garden irrigation interacting with effluent and other pollution. As shown in Figure 23 earlier in this Action Plan, the
close proximity of poorly-maintained sewer outfalls to settlements, waterways and the city’s heavily-used coastline
limit any reduction in these risks even in those areas where sanitation is prevalent. During fieldwork, effluent from
pumped septic systems was observed being deposited into the city’s landfill site without treatment (see Figure 34).
Waterway pollution and debris throughout the city present a more general risk to downstream infrastructure and
inhabitants.
Figure 34: Septic tank collection truck pumping effluent into the Honiara Landfill (Photo: Trundle)
31
The Ranadi Landfill Site is on the city’s eastern border with Guadalcanal Province, in an area prone to coastal erosion
and riverine flooding, and potentially exposed to severe storm surges. The existing site has limited protection and is
likely to be leaching chemical products, hazardous waste, and septic effluent into the soil and waterways that surround
it. Healthcare waste is burned in an open pit at the site, as neither the National Hospital nor the Landfill has an
incinerator. Although remediation of the Ranadi site is currently underway, an alternative site will also be needed in the
near future due to limited capacity to collect the estimated 29,000 tons of waste generated in Honiara annually, an
estimated 40-50% of which is organic (ADB 2014). The 75% of waste that is not currently collected by HCC is largely
burnt or dumped in waterways, with incentive-based recycling schemes operating for aluminium cans and glass bottles.
The National Referral Hospital is critical to post-disaster response, but is heavily exposed to climate impacts due to its
low-lying coastal location. Emergency access is also heavily affected by road congestion along the Kukum
Highway/Mendana Avenue. The process of relocating the hospital is currently underway, with exposure to climate
hazards – both of the site and its access routes – being considered in the site selection process. The sewage outfall that
is adjacent to both the hospital and the Ontong Java Settlement exacerbates the hotspot’s impact on surrounding
settlements.
Inconsistent availability and a general lack of household access to the city’s electricity supply presents a vulnerability
both at a household level and within government departments during an emergency response, with back-up generators
at government departments dependent on the same diesel fuel supplies as the city’s two power stations. Failure to
stockpile sufficient diesel supplies, if coupled with disruptions to shipping or port access, could therefore have
catastrophic implications for the city’s economy, government services, and communications. Short-term power
disruptions have flow-on impacts to the city’s services sector, which provides the bulk of non-government employment
and wage-based income.
Honiara International Airport is located to the east of the municipal zone and acts as the key entry point for tourist
visitors (approximately 5,500 annually), around half of which are Australians (SINSO 2015). The industry is driven by
diving sites, particularly the World War II wrecks located offshore of Honiara in Ironbottom Sound. However, reef diving
and ecotourism is a growing sector that will itself be vulnerable to climate impacts. The airport is located alongside the
flood zone of the Lunga River and is also potentially exposed to inundation and damage from severe storm surges (UN-
Habitat 2014a).
The location of the national Honiara Port Facilities within the central CBD, as well as the city’s main fuel depot (see
Figure 35), contributes additional congestion to the city’s main road, with much of Honiara’s imported goods requiring
transport to the Ranadi industrial area. Proposals to rehabilitate Point Cruz and provide public open space along the
shoreline are contained within the Honiara Local Planning Scheme 2015 (a lack of open space and public access to the
coast were highlighted by workshop and forum participants).
Mendana Avenue/Kukum Highway is currently at capacity with average vehicle speeds reducing to below 10kmph past
the Honiara Central Market (JICA 2014), worsened by the four-lane arterial road reducing to two lanes across the
mouth of the Mataniko River. Projects are currently underway to duplicate the Mataniko River Bridge, with
investigative studies looking at the possibility of a CBD bypass road further inland (MLHS & HCC 2015).
Schools and educational facilities across the city were employed as evacuation centres during the April 2014 floods,
however the role of schools as critical evacuation facilities during disaster response was viewed by many stakeholders
as having a negative impact – in terms of education disruption and facilities damage – rather than an asset. Deployment
of alternative forms of evacuation centre facilities is discussed in the planning component of this Action Plan.
Additional critical infrastructure components and sectors are set out in more detail in the 2014 Honiara Vulnerability
Assessment Report (UN-Habitat 2014a).

32
Figure 35: View of the Point Cruz Port Facilities and Fuel Depot (Photo: Trundle)

33
3. CITY-WIDE ADAPTATION & URBAN RESILIENCE OBJECTIVES
3.1 FROM ISSUES TO OBJECTIVES
Climate adaptation and urban resilience objectives were developed through a participatory workshop series conducted
in May 2014, which engaged a broad cross-section of government stakeholders and committees, civil society
organisations, youth, and community members in each of the identified vulnerability hotspots3. In total over 180
individual stakeholders were directly involved in objective-setting and planning activities, representing a broad cross-
section of the community, government decision-makers, and non-government organisations. Project activities included
training of 15 NDMO personnel, the participation of 21 youth representatives, and engagement with five donor
organizations, nine local NGOs, and four national government departments. Five councillors and ten local government
department heads also took part in the HCC workshop. Despite efforts to ensure equal gender representation, women
represented only 26% of the stakeholders engaged, but accounted for 35% of the hotspot community participants. It is
recommended that resilience activities engage explicitly with women’s groups in early phases of development to rectify
this imbalance.
Following a presentation on the climate change vulnerability of Honiara, as well as discussion regarding the local
vulnerabilities that the relevant stakeholders or community have experienced, workshops were split into break-out
groups that were directed to transform their key issues into high-level objectives. Actions that could assist in achieving
each of these objectives were then identified and prioritised. Examples of the breakout activities being conducted are
shown in Figure 36 below.
Figure 36: Objective Identification Workshops: NDMO (L) & Kola’a ISZ (R) (Photo Credit: Trundle & McEvoy)
Discussions of said issues were heavily focused on waste and water management, as well as the underlying pressure of
rapid urbanisation and population growth (as outlined in Section 2.1). Although not all of these issues were directly
climate-related, it was noted that the impacts of the April 2014 floods had been significantly worsened by upstream
debris. Furthermore, plastic pollution in waterways exacerbated localised flooding by preventing the drainage system
from functioning properly. Similarly, a lack of land tenure prevented regulation of building quality and controls, leading
to heightened sensitivity to climate impacts and development in hazard-exposed zones, while population pressures in
high density zones were suggested to worsen the potential for community violence. A visualisation of the main
community and stakeholder issues is shown in Figure 37.
Although not always cited as an ‘issue’, a lack of understanding of which issues were driven or amplified by
anthropogenic climate change, and which issues were directly attributable to local human intervention (or,
3 Due to the destruction of the Koa Hill informal settlement through the April 2014 Floods, only Kukum Fishing Village, Ontong Java/Lord Howe Settlement and the Kola’a ISZ groups were able to participate in this activity.

34
alternatively, existing climate variability or geo-hazards) was acknowledged to be problematic. For instance, increasing
occurrence of localised flooding was attributed to climate change by some participants, despite no clear trend in rainfall
events being present (see Section 2.4). Correct attribution to more likely causes – drainage systems blocked by plastic
rubbish, the presence of informal settlements in at risk areas, and deforestation upstream – can empower the local
population by demonstrating that local actions to counter these causes are possible, in contrast to reducing global
emissions for which Honiara has minimal responsibility and limited capacity to influence. Other issues, such as
community violence, were not immediately attributed as being linked to climate change; this is not necessarily the case.
For instance, extreme heat conditions have been shown to result in increased levels of domestic violence in the United
States (Doherty & Clayton 2011).
Figure 37: Issue Identification by Stakeholders by break-out group frequency & category
3.2 OBJECTIVE CATEGORIES
Objectives were developed by each break-out group on the basis of the issues that they identified, and subsequently
grouped and categorised by the project team. Ten thematic areas emerged from the participatory approach:
1. Urban Planning & Land Development
2. Housing
3. Infrastructure
4. Water, Sanitation and Waste
5. Ecosystem Services and Coastal Processes
6. Human Health and Well-being
7. Communication: Awareness and Education
8. Livelihoods and Behaviour Change
9. Disaster Preparedness and Response
10. Governance and Partnerships
These objective categories contain up to nine individual high-level objectives, which form the basis of the actions set
out in this Urban Resilience and Climate Action Plan (Section 4). The proposed lead organisation(s) – as well as potential
implementation partners for the initiative – are listed in the tables below, as well as the strength of the link between

35
the objective and the city’s exposure to current climate variability and projected climate change (four ticks representing
the strongest link to both current and projected climate impacts).
3.2.1 URBAN PLANNING AND LAND DEVELOPMENT OBJECTIVES
1. Urban Planning and Land Development Climate
Related (1-4)
Stakeholder-proposed
Implementation Partners
1.1 Adequate land supply and land release strategy Land Board, HCC, MLHS, MID, MECCDM,
MHMS, Chiefs, Chinese Assn, WDCs, GPG
1.2 Reduction in informal settlements MLHS, UN-Habitat, Chiefs, WDCs, CDCs,
Land Board
1.3 Effective land use planning scheme MLHS, Police Force, HCC, MID, SIEA,
SIWA
1.4 Zoning of landslide and flood-prone areas HCC, MLHS, WB-REP, Chiefs, Elders, MID,
WHO
1.5 Protection of water easements and catchment areas SIWA, MLHS, HCC, MECCDM, Community
Leaders, MID
1.6 Relocation strategy for at-risk households MLHS, Land Board, HCC, SIRC, MHA
1.7 Reduced water-logging MID, MLHS, HCC, I/NGOs
Figure 38: City-wide HURCAP Objectives – Urban Planning and Land Development
As noted in the updated Honiara Local Planning Scheme (2015), although a number of plans for the city have been set
out since the declaration of the current Honiara town boundary in 1981, implementation of these development
schemes has generally lagged behind population growth and lacked a strategic vision for the forward development of
the city. Correspondingly, a substantial share of stakeholder and community respondents believed that improving this
aspect of the city was the most critical objective in reducing Honiara’s climate vulnerability and improving its urban
resilience. Objectives at a city-scale were categorised in two broad ways: better planning for current and future climate-
related natural hazards (Objectives 1.4-1.7 in Figure 38), and a more anticipatory, fully-implemented strategic process
for managing the city’s rapid urban growth (Objectives 1.1-1.3). Many objectives correspond to the recently-endorsed
joint HCC-MLHS Local Planning Scheme, and will be able to be achieved through integration of these parallel agendas.
3.2.2 HOUSING
2. Housing Climate Related
(1-4)
Stakeholder-proposed
Implementation Partners
2.1 Flood-proofed housing and buildings MLHS, MID, HCC, SIWA, CDCs
2.2 Housing safe from cyclones (location & design) MLHS, MID, HCC, SIWA, CDCs, FTEs,
CCPB, MECCDM, Chiefs
2.3 Climate-resilient building standards and codes MLHS, MID, MECCDM, HCC, Police,
International Donors
2.4 Households with land title/registration MLHS, MID, HCC, UN-Habitat

36
2.5 Fire-resistant buildings MLHS, Fire Service, DP, NGOs, HCC,
SIEA, MPHS
2.6 Access to essential services SIWA, SIEA, HCC, MID, MLHS,
Donor/Funders
Figure 39: City-wide HURCAP Objectives – Housing
Within the urban setting, improvement of housing quality, and the ability of residential areas to cope with climate
impacts, was viewed as a critical area for reducing the city’s overall vulnerability, and protecting Honiara’s population
and their livelihoods in the event of a climate-related or natural disaster. With roughly half (46%) of the city’s housing
based on a single-storey, timber frame construction model, a number of opportunities exist to transfer climate-resilient
housing construction techniques from elsewhere in the Asia-Pacific region, by partnering with external expertise.
Although MLHS has been proposed as the implementation partner for many of the objectives set out in Figure 39, the
need for partnerships for expert input, as well as technical support by utilities such as SIWA and SIEA, was emphasised
in consultations.
3.2.3 INFRASTRUCTURE
3. Infrastructure Climate Related
(1-4)
Stakeholder-proposed
Implementation Partners
3.1 Climate-resilient and functional public and critical
infrastructure
MID, HCC, SIWA, SIEA, Telekom,
MECCDM, NDMO,
Donors/Funders
3.2 Development of an efficient and well-maintained road
network MID, HCC, Donors/Funders
3.3 Low-carbon transport options MID, HCC, MECCDM, MMHS
3.4 Stormwater drainage infrastructure to manage river flooding MID, SIWA, HCC, MLHS,
Donors/Funders, MECCDM
3.5 Erosion protection of waterfront and river banks MID, MLHS, HCC MoFR
3.6 Cooler living spaces and walkways HCC, MoFR, MLHS, MID
Figure 40: City-wide HURCAP Objectives – Infrastructure
Beyond the residential sector, all stakeholders and community representatives recognised that there was a significant
infrastructure deficit across the city in terms of both a backlog of maintenance of existing infrastructure assets (some of
which were identified as being no longer functional), and additional assets required by the city’s rapidly growing
population. As identified in Figure 40, many of these initiatives will need to be led by the Ministry of Infrastructure and
Development, with the support of local authorities, external experts and critically ODA funding support. A number of
objectives in the infrastructure also reflect community and stakeholder aspirations for the city, including low-carbon
transport (reflecting the high levels of congestion and pollution that characterise the city’s arterial road network), and
enhanced public spaces, which are viewed as ‘win-win’ areas for the city with health, tourism, productivity and
environmental benefits. ODA and other funding opportunities for supporting these large-scale initiatives are further
discussed in Section 6 of this plan.

37
3.2.4 WATER, SANITATION AND WASTE
4. Water, Sanitation and Waste Climate Related
(1-4)
Stakeholder-proposed
Implementation Partners
4.1 Functional sanitation systems SIWA, HCC, MID, Int. Partners,
MLHS, MHMS, MECCDM
4.2 Effective rubbish disposal and collection systems HCC, Communities, MLHS
4.3 A climate hazard-safe, long-term, waste disposal site HCC, MHMS, MALS, MECCDM
4.4 Clean drinking water access for all residents SIWA, HCC, GPG, NHL
4.5 Effective and well-maintained drainage systems SIWA, HCC, MID, World Bank,
Community leaders, CDCs
4.6 Development of a plastics recycling scheme HCC, Plastic supply companies,
CDCs, JICA, SICC
4.7 Reduction in coastal/river pollution Community Leaders, HCC,
MECCDM, MHMS
4.8 Water catchment planning, including sustainable use of
groundwater resources
MLHS, SIWA, HCC, GPG,
MECCDM, Community Leaders
4.9 Clarify water source/catchment land ownership Land Board, MLHS, SIWA,
Community Leaders, GPG
Figure 41: City-wide HURCAP Objectives – Water, Sanitation and Waste
As reflected in the issues diagram in Figure 37, water access, sanitation and waste were consistently viewed as the
sectors that required the most urgent action in the face of climate-related shocks, rapid population growth, and a cycle
of hygiene and health-related issues related to disease transmission. Although many of these objectives are not directly
driven by climate, they provide a wide range of existing hazards and risks that are severely worsened – or exacerbate
the impacts of – climate-related extreme events such as cyclones or extreme rainfall. A partnership between the
community, the municipal council, and the relevant utility was seen as critically important in achieving these objectives,
with the prospect of setting up a joint working group specific to this area led by representatives from these three
groups. Investments in water, sanitation and waste infrastructure were also seen as being needed to be met ‘half-way’
by the community that would benefit from them, with behaviour-based objectives (e.g. 4.7, Figure 41) underpinning
the function and ongoing maintenance of any improvements in infrastructure. As noted in the SIWA workshop,
however, limitations in resourcing and legislative jurisdiction would require external financial support and/or novel
community-level partnerships if implementation was to be rolled out at scale.

38
3.2.5 ECOSYSTEM SERVICES AND COASTAL PROCESSES
5. Ecosystem Services and Coastal Processes Climate Related
(1-4)
Stakeholder-proposed
Implementation Partners
5.1 Understanding and enhancing local ecosystem services MECCDM, SPREP, UN-Habitat
MoFR, HCC, CDCs, DSE
5.2 Revegetation & protection of existing urban forest,
vegetation and ecosystem assets
HCC, MoFR, MECCDM, MID, DSE,
Community Leaders
5.3 Enhanced agricultural production and reduced imported food
dependency MoAL, MoF, HCC, GPG, DSE
5.4 Preparedness for coral bleaching and marine change MECCDM, Tourism operators,
Fishermen, HCC, MEHRD
5.5 Coastal settlements safe from sea level rise impacts MLHS, HCC, Community leaders,
MID, Donors
5.6 Coastal settlement protection from tsunamis MID, NDMO, MLHS, HCC,
Community Leaders
5.7 Management of coastal erosion hotspots MID, MLHS, HCC, MECCDM
Figure 42: City-wide HURCAP Objectives – Ecosystem Services and Coastal Processes
As noted in Section 2.6 of this plan, marine and land-based ecosystem services make up a significant share of household
livelihoods in Honiara, and compensate for shortfalls in infrastructure and utilities (for instance, the natural springs
shown in Figure 23). Protection and enhancement of these services is therefore a core objective of this plan, and
extends across government institutions (though particularly within MECCDM). Potential linkages with other ecosystem
based adaptation agendas are discussed in Section 6, while hybrid models that integrate hard infrastructure (such as
sea walls and breakers) will require engagement and partnership with MID, key international donors and the private
sector.
3.2.6 HUMAN HEALTH AND WELL-BEING
6. Human Health and Well-being Climate Related
(1-4)
Stakeholder-proposed
Implementation Partners
6.1 Clean, healthy and safe environment HCC, MHMS, Community
leaders, CDCs, MID
6.2 Strategies for managing exposure to extreme heat HCC, MHMS, MLHS, MoFR,
Community leaders
6.3 Effective health policies and accessible facilities MHMS, MID, HCC, GPG
6.4 Improve climate-related health awareness campaigns MHMS, MEHRD, HCC, DSE
6.5 Reduced risk of loss of life in event of a tsunami NDMO, Community Leaders,
MECCDM, MID
6.6 Reduced incidence of disease MHMS, HCC, DSE , CDCs
6.7 Reduced environmentally-driven health issues MHMS, HCC, CDCs, DSE
Figure 43: City-wide HURCAP Objectives – Human Health and Well-being

39
The health and well-being of Honiara’s residents is a wide-reaching goal within the HURCAP, and relates to both the
underlying vulnerability of the city’s population to climate impacts (where at-risk citizens such as the sickly and disabled
often have a higher sensitivity), as well as direct, climate-related health issues (for instance Objective 6.2 in Figure 43).
Objectives relate to education, environmental conditions, facilities, and high-level well-being goals, and will
predominantly need implementation leadership from within MHMS. Existing health education programs can also be
leveraged to spread a wider awareness of climate-related health impacts, building on existing engagement of MHMS
staff in the HURCAP design phase, as well as HCC health staff.
3.2.7 COMMUNICATION: AWARENESS AND EDUCATION
7. Communication: Awareness and Education Climate Related
(1-4)
Stakeholder-proposed
Implementation Partners
7.1 Education on environmental risks DSE, SIDT, MECCDM, HCC,
MHMS, MLHS, SINU, MEHRD
7.2 Promotion of non-written climate communications to reach
all members of the community
MECCDM, RMIT, DSE, VBM, UN-
Habitat, CDCs, Churches
7.3 Improved community understanding and awareness of local
climate change impacts
HCC, CDCs, DSE, Churches,
MEHRD, MECCDM
7.4 Well-resourced disaster risk reduction, response and
management awareness programs, and community engagement
NDMO, MECCDM, Donors/
Funders, HCC
7.5 Monitoring / surveillance systems for disease MHMS, HCC, CDCs
Figure 44: City-wide HURCAP Objectives – Communication: Awareness & Education
The need to build a wider level of community ‘climate literacy’ was both evident in responses, and in the initial
introductory component of the workshops themselves. In particular, the lack of easily-understandable non-written
modes of climate communications, including posters, drama, radio-shows and dance, was noted by all hotspot
communities, and during the NGO and youth workshops. As a result, RMIT University has already initiated some pilot
work in this area in partnership with DSE and VBM. However, in order to access all communities across the city,
capacity will need to be built in these areas within HCC, as well as the NGO community as a whole (via umbrella bodies
such as DSE, as shown in Figure 44).

40
3.2.8 LIVELIHOODS AND BEHAVIOUR CHANGE
8. Livelihoods and Behaviour Change Climate Related
(1-4)
Stakeholder-proposed
Implementation Partners
8.1 Sustainable rates of urban population growth MHMS, Churches, DSE, HCC,
CDCs, MWCY, MEHRD
8.2 Manage urban migration Provincial Governments, GPG,
HCC, MEHRD, MID
8.3 Reduce traffic congestion and car dependency MLHS, MPWS, MID, HCC
8.4 Create jobs that enhance climate resilience MEHRC, MECCDM, HCC, MWCY,
MoF, SINU
8.5 Reduce community violence RSIP, Community leaders, HCC,
MWCY
Figure 45: City-wide HURCAP Objectives – Behaviour Change
Objectives relating to behaviour change are arguably some of the hardest to achieve in any setting, however reducing
rapid rates of population growth in the Solomon Islands in particular is central to national stability and development,
while rural-to-urban migration can be seen to be one of the underlying challenges from which the shortfalls in urban
infrastructure, land tenure and housing quality arise. Novel and sustained strategies will be needed to achieve the
objectives set out above (Figure 45), with cross-sector partnerships and an emphasis on community groups and leaders
in areas such as church groups, education programmes, and also wider reach strategies such as decentralisation of
services and establishment of ‘pull’ factors in townships other than Honiara. Within the city, government agencies will
need to facilitate shifts to more sustainable transport options, as well as provide the policies and incentives that
encourage climate-resilience related job opportunities.
3.2.9 DISASTER PREPAREDNESS AND RESPONSE
9. Disaster Preparedness and Response Climate Related
(1-4)
Stakeholder-proposed
Implementation Partners
9.1 Regularly updated disaster action plan NDMO, HCC, MECCDM
9.2 Early warning systems and communication to all communities NDMO, HCC, MID, MECCDM
Community Leaders, DSE
9.3 Provision of emergency shelters MID, NDMO, Community
leaders, CDCs, UN-Habitat
Figure 46: City-wide HURCAP Objectives – Disaster Preparedness and Response
Preparedness for, management of and response to extreme weather events is strongly integrated with existing Disaster
Risk Management processes, which fall largely within the jurisdiction of the NDMO, as well as the HCC disaster
management team. Although the focus of this plan is broadly on climate-related impacts, the strengthening of these
existing institutions through mutually-beneficial objectives and the integration of planning processes and resources was
strongly supported by both government-level stakeholders and the communities on the ground that require effective
assistance in a post-disaster context, regardless of the strength of the link to climate change. Opportunities for
integration with DRM work, such as the ICLEI/UNISDR Disaster Resilience Scorecard process, are detailed further in
Section 6 of this plan, with existing links to hotspot communities built through the HURCAP process potential avenues

41
for implementation of mutually beneficial actions (such as development of emergency shelters as proposed in Figure
46).
3.2.10 GOVERNANCE AND PARTNERSHIPS
10. Governance and Partnerships Climate Related
(1-4)
Stakeholder-proposed
Implementation Partners
10.1 Enhanced government, utility and business linkages through
Community Development Committees
CDCs, HCC, SIWA, SIEA, MLHS,
SICC, MECCDM
10.2 Intra-Ministry task force to mainstream urban climate
resilience planning OPMC, All SIG Ministries
10.3 Enhanced partnership working between Ministries, HCC and
Ward Development Councils
HCC, MECCDM, MLHS, MID,
WDCs
10.4 Strengthen governance capacity HCC, MECCDM, MLHS, MID,
WDCs
10.5 Establish community committees for land use planning HCC, MLHS, Land Board, WDCs,
CDCs
10.6 Integrate water catchment plan with community structures MLHS, SIWA, Community
Leaders, MECCDM, CDCs, HCC
10.7 Empowerment of women, youth and other disadvantaged
groups HCC, MYWC, DSE
Figure 47: City-wide HURCAP Objectives – Governance and Partnerships
Governance processes and partnerships sit across the other nine objective areas, and, although not explicitly a
response to climate change, the strengthening of government capacity will address a key weakness in the city’s overall
adaptive capacity (as set out in Figure 27). In particular, opportunities were noted for building cross-government
coordination of climate-related activities (both within and outside of Honiara), with models such as Vanuatu’s National
Advisory Board for Climate Change and Disaster Risk Reduction available to be learnt from within the region.
Beyond national government engagement, strengthening the hierarchy of governance all the way down to the
community level would better allow existing community networks and resources to be mobilized, which would greatly
benefit other objective areas (for instance, achievement of Objective 10.6 in Figure 47 would significantly strengthen
the ability to meet objectives set out in areas such as Water, Sanitation and Waste, and Ecosystem Services & Coastal
Processes).
A combined partnership in this area from HCC, OPMC and community leaders is seen as critical to ensuring that the
HURCAP actions are mainstreamed effectively and spread across the different community groups and stakeholders
within the city.

42
4. URBAN RESILIENCE & ADAPTATION ACTION PLANNING
This chapter showcases a portfolio of specific actions that were identified through local stakeholder engagement
processes. These include a high-level workshop involving the Honiara City Council, which was held to scope out
interventions at the city-wide scale, as well as a series of community workshops, which were used to identify the most
important local actions as nominated by the inhabitants of vulnerability hotspot areas. The potential actions are
grouped according to the objective categories set out in the previous section, and linked to specific objectives where
relevant. Actions relating to urban planning, water, waste and sanitation, and governance processes emerged as the
most prevalent at the city-scale. Each of the vulnerability hotspots highlighted actions specific to their location, as well
as addressing more common issues relating to development and informal settlements across the city.
Proposed actions for city-wide actions were subject to further scrutiny at an expert workshop held in Honiara in July
2016. This workshop involved many of the named lead partners, allowing for potential actions to be debated and
confirmed, implementation leaders to be suggested (and revised from original stakeholder suggestions in some
instances), and any additional actions put forward for inclusion in the action plan. The following tables highlight the
identified actions, including consideration of timing, priority, cost and lead implementation organisations.
Organisational abbreviations used in the tables are as follows:
CDC – Community Development
Committee
MWCY – Ministry of Women,
Children and Youth
DSE – Development Services
Exchange (CSO)
NDMO – National Disaster
Management Office
HCC – Honiara City Council
OPMC – Office of the Prime
Minister and Cabinet
G Prov – Guadalcanal Province
RSIP – Royal Solomon Islands
Police Force
JICA – Japan International
Cooperation Agency
SICC – Solomon Islands Chamber
of Commerce
MECCDM – Ministry for the
Environment, Climate Change and
Disaster Management
SIEA – Solomon Islands Electricity
Authority
MEHRD – Ministry of Education &
Human Resources Development
SIMS – Solomon Islands
Meteorological Service
MFR – Ministry of Forestry and
Research
SIWA – Solomon Islands Water
Authority
MFT – Ministry of Finance and
Treasury
SINSO – Solomon Islands National
Statistics Office
MHA – Ministry of Home Affairs
SPC – Secretariat of the Pacific
Community
MHMS – Ministry of Health and
Medical Services
SPREP – Secretariat of the Pacific
Regional Environment Program
MID – Ministry of Infrastructure
and Development
TCPB – Town and Country
Planning Board
MLHS – Ministry of Lands,
Housing and Survey
UNH – United Nations Human
Settlement Programme
MMERE – Ministry of Mines,
Energy and Rural Electrification
WB – World Bank
4.1 HONIARA CITY-WIDE ACTIONS
4.1.1 URBAN PLANNING AND LAND DEVELOPMENT
Urban growth continues to be fast, at current growth rates it is expected that the population within the boundaries will
increase from an estimated 87,000 in 2015 to 120,000 by 2030. Climate change impacts on rural and fishing
communities are likely to add to the push factors with economic development in Honiara adding to pull factors, likely
accelerating urban growth. Peri-urban growth along the outside boundary of Honiara (in Guadalcanal Province) has
recently been much faster than within the city, further accelerating the growth of greater Honiara. These drivers will
likely contribute to the growth of settlements in hazard-prone areas. Further, the population pressure, if not properly
managed, will increase climate sensitivities, through further environmental degradation (deforestation, coastal and
riverine ecosystems), increasing the likelihoods of floods. Actions include the mapping of hazards, and the designation

43
of no-build zones in hazard prone areas. Climate change considerations also need to be mainstreamed into all levels of
policy.
1. City-wide Urban Planning & Land
Development Actions
Object-
ive(s)
Resilience Area(s) Implementation Factors
Climate DRR Urban Timing Priority Cost Lead(s)
HCA1.1 Integrate climate change into Informal
Settlements Upgrading strategies, plans and
actions and ensure that all TOL to FTE
conversions are in areas outside of high
climate/natural hazard risk zones, as well as
utility access, recreational and public use
zones.
1.2, 1.4 Medium
Term High $$$$ MLHS
HCA1.2 Develop a city-wide map of hazard
zones which informs TOL to FTE conversions as
well as municipal, utility and
growth/development plans.
1.4, 1.5,
4.8, 5.2,
5.5, 5.6,
10.6
Short
Term High $$$$ MLHS
HCA1.3 Ensure that the Honiara Local Planning
Scheme 2015/the emerging Planning and
Development Act (replacing the Town and
Country Planning Act) fully recognize the
recommendations and actions of this plan.
1.1, 1.2,
1.3, 1.5 On-going Med $$$$ MLHS
HCA1.4 Conduct a whole-of-govt. review to
identify areas for mainstreaming of climate
change considerations across urban policy.
1.3, 10.2 Short
Term Low $$$$ MECCDM
HCA1.5 Strengthen community engagement at
sub-ward and ward levels in local resilience
planning and LPS implementation.
1.3 Short
Term High $$$$ MLHS
HCA1.6 Develop an urban heat reduction
approach, including low-cost design options,
open/green space and urban forest
enhancements for the city.
1.3, 2.3,
3.1, 3.6,
5.1, 5.2,
6.2
Medium
Term Med $$$$
HCC/
MLHS
HCA1.7 Assess the feasibility of converting all
or part of the National Referral Hospital site to
a climate-sensitive public reserve, including
restoration of the coastal zone, drainage
enhancements and reforestation.
1.4, 1.5,
3.4, 4.5,
4.7, 5.2,
5.7, 6.2
Short
Term Med $$$$
MHMS/
HCC
HCA1.8 Develop, implement and publicly
communicate water catchment management
plans for the city’s water supply source areas.
1.5, 4.8 Short
Term High $$$$
MLHS/
MECCDM
HCA1.9 Develop a relocation policy/strategy
for at-risk households based on intensive
community and stakeholder consultations.
1.6 Short
Term High $$$$
MLHS /
MECCDM
HCA1.10 Integrate ecosystem strategies (ridge
to reef) into all planning initiatives, and
develop a coastal zone management plan, as
well as a water catchment protection plan.
1.5; 4.8 Short
Term Med $$$$
HCC /
MECCDM

44
HCA1.11 Review the urban drainage network
and develop a climate-sensitive and
community-led integrated drainage,
distributed water capture and re-use master
plan and explore regional funding
models/opportunities for upgrades.
1.7, 4.4,
4.8 10.6
Long
Term Med $$$$
MID/
SIWA
4.1.2 HOUSING
The quality of much of the building stock in Honiara is poor and many of the informal settlements are located in high
risk areas. The upgrading of informal settlements, land use zoning, and improving access to services, are central to this
theme. It would also be beneficial to carry out further community profiles and vulnerability assessments to better
inform future resilience actions.
2. City-side Housing Actions Object-
ive(s)
Resilience Area(s) Implementation Factors
Climate DRR Urban Timing Priority Cost Lead(s)
HCA2.1 Expand the Informal Settlement
Upgrading programme, prioritising avoidance
of climate-vulnerable, hazard-exposed areas.
1.2, 2.1,
2.4, 2.6,
10.1
Short
Term High $$$$
MLHS/
UNH
HCA2.2 Conduct a representative survey on
compliance of existing housing stock with
bylaws and codes.
2.1, 2.2.,
2.3, 10.4
Short
Term Low $$$$ HCC
HCA2.3 Establish a Building Audit Programme
for enforcing codes, improving existing building
stock and defending high-risk exclusion zones,
and ensure enforcement of building ordinance.
2.1, 2.2,
2.3, 2.5,
8.4, 10.4
Medium
Term Med $$$$ HCC
HCA2.4 Integrate a climate hazard component
into the TOL/FTE upgrading process.
2.1, 2.3,
2.4, 2.5
Short
Term Med $$$$
MLHS/
UNH / SPC
HCA2.5 Review utility connection rules for
traditional housing and explore low-cost, off-
grid options for energy, water and sanitation.
2.5, 2.6 Medium
Term Low $$$$
G Prov/
Utilities
HCA2.6 Conduct additional vulnerability
assessments for ‘hotspot’ zones (e.g. Nggosi
and South-east Panatina).
1.6, 2.1,
2.2, 7.1
Short
Term High $$$$ UNH

45
4.1.3 INFRASTRUCTURE
Discussions for the infrastructure theme focussed on water, transport and energy. The location of the Point Cruz port
facility, and associated fuel storage, was also noted as problematic due to exposure to natural hazards and limitations
to urban growth.
3. City-wide Infrastructure Actions Object-
ive(s)
Resilience Area(s) Implementation Factors
Climate DRR Urban Timing Priority Cost Lead(s)
HCA3.1 Conduct a feasibility assessment for
the relocation of Point Cruz heavy industry and
associated port facilities and fuel storage,
taking into account natural hazards and urban
growth.
1.3, 3.1,
3.5, 5.1,
5.5, 5.7,
8.3
Short
Term Med $$$$
MLHS/
MID/
MMERE
HCA3.2 Explore design options for climate-
sensitive public open space and commercial
opportunities around the Point Cruz site.
3.1, 3.5,
5.2
Medium
Term Low $$$$
HCC/
MLHS/
Port Auth.
HCA3.3 Assess the total capacity of existing
potable water assets relative to ‘worst case’
rapid population growth scenarios.
3.1, 3.4 Short
Term High $$$$
SIWA/
MECCDM
/ MMERE
HCA3.4 Enhance community-integrated water
efficiency and maintenance regimes for water
infrastructure.
3.1, 3.4 Medium
Term High $$$$
MMERE /
SIWA/
HCA3.5 ‘Future proof’ North-South access
routes to inland growth areas allowing for
grade-duplication on key arterial routes.
1.3, 3.1,
3.2, 8.3,
Short
Term High $$$$
MLHS/
HCC/
Lands
Board
HCA3.6 Develop a detailed assessment of a
city-bypass as set out in the LPS, accounting for
natural hazards, climate impacts and pop.
growth.
1.3, 3.1,
3.2, 8.3
Medium
Term High $$$$
MID/
MLHS/
HCC /
G Prov
HCA3.7 Implement an active city
transportation strategy, including better public
transportation, pavement enhancements,
shading through green infrastructure and pilot
programmes to encourage bicycle use.
3.1, 3.3,
3.6, 6.6,
8.3, 8.4
Short
Term Med $$$$ HCC/ MID
HCA3.8 Incentivise and engage small
businesses in the importation of small-scale
solar to diversify energy sources, allow
decentralised use of low-energy appliances
such as mobile phones, and promote bicycles.
3.1, 6.4,
6.5, 7.2,
8.4, 9.2,
10.1
Short
Term Med $$$$
MECCDM/
MID /
MMERE /
MFT
HCA3.9 Establish a street tree planting
programme along major access routes for
urban cooling and beautification, and protect
the urban forest protection through
community engagement and law enforcement.
3.6, 5.2 Medium
Term Med $$$$
HCC/
MECCDM
/ MFT

46
HCA3.10 Identify, support and stimulate local
businesses in low-cost household water
capture and storage alternatives.
3.1, 3.4,
3.5, 4.4,
4.5, 4.8
Short
Term High $$$$
MID/
MECCDM
4.1.4 WATER, SANITATION AND WASTE
These are perhaps the most critical issues in the short to medium term for residents of Honiara, and there are also key
links to initiatives in action sections 1 and 2 (in terms of water use and catchment issues). A city-wide review of
sanitation would provide a useful baseline.
4. City-wide Water, Sanitation & Waste
Actions
Object-
ive(s)
Resilience Area(s) Implementation Factors
Climate DRR Urban Timing Priority Cost Lead(s)
HCA4.1 Conduct comprehensive review of
Honiara’s stormwater drainage network and
outfalls, accounting for sea level risk and
rainfall change.
4.1, 4.2,
4.5, 4.7,
4.8, 5.5,
5.7
Short
Term High $$$$ MID/ HCC
HCA4.2 Enhancement of drainage systems,
including improved links to community-
driven drainage programmes.
4.1, 4.5,
4.7, 4.8,
5.5, 5.7
Medium
Term Med $$$$ MID/ HCC
HCA4.3 Explore the feasibility of a reticulated
sewerage system.
4.1, 4.5,
4.7, 4.8,
5.5, 5.7
Short
Term Med $$$$ SIWA
HCA4.4 Review household sanitation systems
across the city’s riparian zones and water
catchment areas.
4.1, 4.7,
4.8, 6.1
Short
Term High $$$$
HCC /
MECCDM
HCA4.5 Roll-out low-cost sealed sanitation
options in hotpots areas identified in HCA4.3.
2.6, 4.1,
4.7, 4.8,
6.1, 6.3,
6.6, 6.7
Short
Term High $$$$
HCC /
MHMS /
WASH
NGOs
HCA4.6 Explore feasibility of and interest in
community-level investment in shared septic
tank systems, co-funded by government.
4.1, 4.7,
4.8, 6.1,
10.3
Short to
Medium
Term
Med $$$$ SIWA
HCA4.7 Review compliance of commercial
developments with sanitation-related
legislation and identify options for policy
improvement within Building Ordinance.
4.1, 4.7,
4.8, 6.1,
10.1
Short to
Medium
Term
Med $$$$ HCC/
SIWA
HCA4.8 Develop and implement a city-wide
integrated solid waste management strategy
in consultation with CDCs and international
experts.
2.6, 4.2,
4.6, 4.7,
10.1, 10.3
Short
Term High $$$$
MECCDM
/ HCC
HCA4.9 Pilot organic waste composting and
garden re-use initiatives applied rurally
across SI in key waste hotspots across the
city through CDC/HCC/NGO partnerships.
2.6, 4.2,
4.7, 5.1,
5.3, 10.1,
10.7
Short
Term Med $$$$
HCC /
DSE/
MLHS4
4 There is potential to integrate pilot projects by Gurafesu on organic waste composting / gardening. Ref: http://www.adb.org/sites/default/files/publication/42662/solid-waste-management-solomon-islands.pdf

47
HCA4.10 Develop an organic waste collection
program for the Central Market (public –
private partnership).
4.2, 4.7,
10.1
Short
Term Med $$$$
HCC / JICA
/ private
sector
HCA4.11 Carry out a feasibility study into
options for reducing the use of plastic bags.
4.2, 4.6,
10.1,
Short
Term Med $$$$
HCC / JICA
/ SICCI /
MECCDM
HCA4.12 Approach key international
suppliers of plastics with possible partnership
options for a plastics recycling scheme.
4.2, 4.6,
10.1, 10.3
Medium
Term Med $$$$
HCC /
MECCDM
/ SICCI
HCA4.13 Identify and reserve a climate and
natural hazard secure future site for
relocating the municipal landfill, taking into
account urban growth patterns and
projections.
1.3, 2.6,
3.1, 4.3,
4.7, 10.3
Medium
Term High $$$$
HCC /
MLHS /
MECCDM
HCA4.14 Ensure that climate change impacts
and potential natural disaster risks are being
considered in the remediation works of the
Renadi Landfill site and map out future
upgrade schedules as required.
1.3, 2.6,
3.1, 4.3,
4.7
Short
Term Med $$$$
HCC /
JICA/
MECCDM
HCA4.15 Build in the potential for methane
recovery at a new municipal waste landfill
site.
3,1, 4.2,
10.4
Medium
Term Low $$$$
HCC /
MECCDM
/ SIEA
HCA4.16 Review the filtration technologies
used at reservoir tanks and extraction
sources to provide better quality water as
part of ongoing improvements in water
quality.
2.6, 4.4 Short
Term Low $$$$
SIWA /
MHMS
HCA4.17 Install public water taps in key
public spaces within water-poor
communities and the city centre (CSO fund).
2.6, 4.4 Short
Term Med $$$$
HCC /
SIWA
HCA4.18 Establish a community-led,
government supported ‘Water Care’ body for
cleaning up and revegetating riverine areas,
waterways and coastal zones.
1.7, 4.7,
8.4, 10.3,
10.4, 10.7
Medium
Term Med $$$$
HCC /
SIWA /
DSE /
MECCDM

48
4.1.5 ECOSYSTEM SERVICES AND RIVER AND COASTAL PROCESSES
It was recognised in the expert workshop that the riparian environment was equally important as the coastal zone
therefore the theme heading was altered to account for this. Important legislation was noted as the Rivers and Waters
Act, Protected Areas Act, Botanist Act, SIWA Act and the Forest Act; and there are also links to a new SPREP Ecosystem
Services project as well as a SPC GEF5 ‘ridge to reef’ project. There are also important connections with tourism but
currently there is no integrated management plan for the coast.
5. City-wide Actions: Ecosystem Services,
Riparian & Coastal Processes
Object-
ive(s)
Resilience Area(s) Implementation Factors
Climate DRR Urban Timing Priority Cost Lead(s)
HCA5.1 Assess natural resources across the
city, their use by communities, and develop
resource management plans.
5.1, 10.4 Short
Term Med $$$$
SPREP/
MECCDM
/ NGOs /
HCC /
TCPB
HCA5.2 Integrate ecosystem services and
Ecosystem-based Adaptation (EbA) actions into
Water Catchment Management Plans.
1.5, 4.4,
4.8, 5.1
Medium
Term Med $$$$
MECCDM/
HCC /
SIWA /
SPREP
HCA5.3 Map the city’s urban vegetation using
satellite imagery/LANDSAT, identifying priority
areas and opportunities for urban forest
enhancement/plantings.
1.7, 3.6,
5.2, 6.2,
8.4, 10.6
Short
Term Med $$$$
MECCDM/
HCC /
MFR
HCA5.4 Assess historical changes to the city’s
coastal morphology, including recent infill and
protection impacts on surrounding residential
zones, in partnership with coastal
communities. Future threats also need to be
considered.
1.3, 1.5,
1.7, 5.1,
5.4, 5.5,
5.7, 7.3
Short
Term High $$$$
MECCDM/
MLHS
/HCC
HCA5.5 Conduct community engagement
around coastal and river bank protection
options.
5.1, 5.5,
5.7, 7.3
Short
Term High $$$$
MECCDM/
MLHS/
HCC/
NGOs /
WB
HCA5.6 Building on HCA 5.4, 5.5, Develop and
implement a Coastal Management Plan,
applying hybrid EbA and engineered protection
measures. Also consider potential to link to
Honiara Beautification scheme.
1.7, 3.5,
4.8, 5.1,
5.2
Medium
to Long
Term
High $$$$
MECCDM/
HCC /MID
/ SPREP
HCA5.7 Create regulatory provisions that take
into account and compensate for changes to
coastal erosion processes beyond coastal
development sites.
1.3, 2.1,
2.3, 3.5,
5.2, 5.4,
5.5, 5.7
Short
Term Low $$$$
HCC/
MLHS /
TCPB
HCA5.8 Pilot community-led tree-planting
programmes within urban coastal and riverine
areas with ongoing monitoring of changes
(links to urban agriculture and food security).
3.5, 5.7 Short
Term Med $$$$
MECCDM/
CDCs
/HCC /
SPREP

49
4.1.6 HUMAN HEALTH AND WELLBEING
Concerns were raised about the impact of climate change on human health (heat and vector-borne disease), but a
major focus was the consideration of new site assessments for the national referral hospital relocation and new
incinerators for hospital waste. All actions were adjusted to short term during the expert workshop.
6. City-wide Human Health & Well-being
Actions
Object-
ive(s)
Resilience Area(s) Implementation Factors
Climate DRR Urban Timing Priority Cost Lead
HCA6.1 Conduct a scoping study into extreme
heat impacts on
hospitalisation/morbidity/mortality, as well as
presentations to health clinics across Honiara
(to help with planning of referral pathways).
6.2 Short
Term Low $$$$
MHMS/
MECCDM/
HCC
HCA6.2 Host a ‘Climate & Health Expo’ for the
public, with a focus on climate-related health
risks and communicable/vector-borne diseases
(this was noted as ongoing).
6.1, 6.3,
6.4, 7.1,
7.3, 10.7
Short
Term Med $$$$
HCC/
MHMS/
MECCDM
HCA6.3 Conduct a climate and natural hazard
risk assessment of the new National Referral
Hospital site, incorporating potential risk
treatments and consideration of access routes
during a disaster event (ongoing – relocation
task force).
2.6, 3.1,
6.1, 6.3,
6.5, 6.6
Short
Term High $$$$ MHMS
HCA6.4 Secure funding and ongoing budget
allocation for incinerators for healthcare waste
(new sites are being subject to feasibility
assessments).
1.5, 4.2,
6.1, 6.7,
10.4
Short
Term High $$$$
HCC /
MHMS
HCA6.5 Review National Referral Hospital and
medical facilities/clinic waste disposal
procedures.
6.1, 6.7 Short
Term Med $$$$
MHMS /
HCC
HCA6.6 Improve and maintain a spatial/GIS
database of vector-borne disease
presentations in and around the city, and
communicate to community members through
CDCs (ongoing, possible collaboration with the
Met Office).
6.3, 7.5,
10.3
Short
Term Med $$$$
MHMS/
HCC
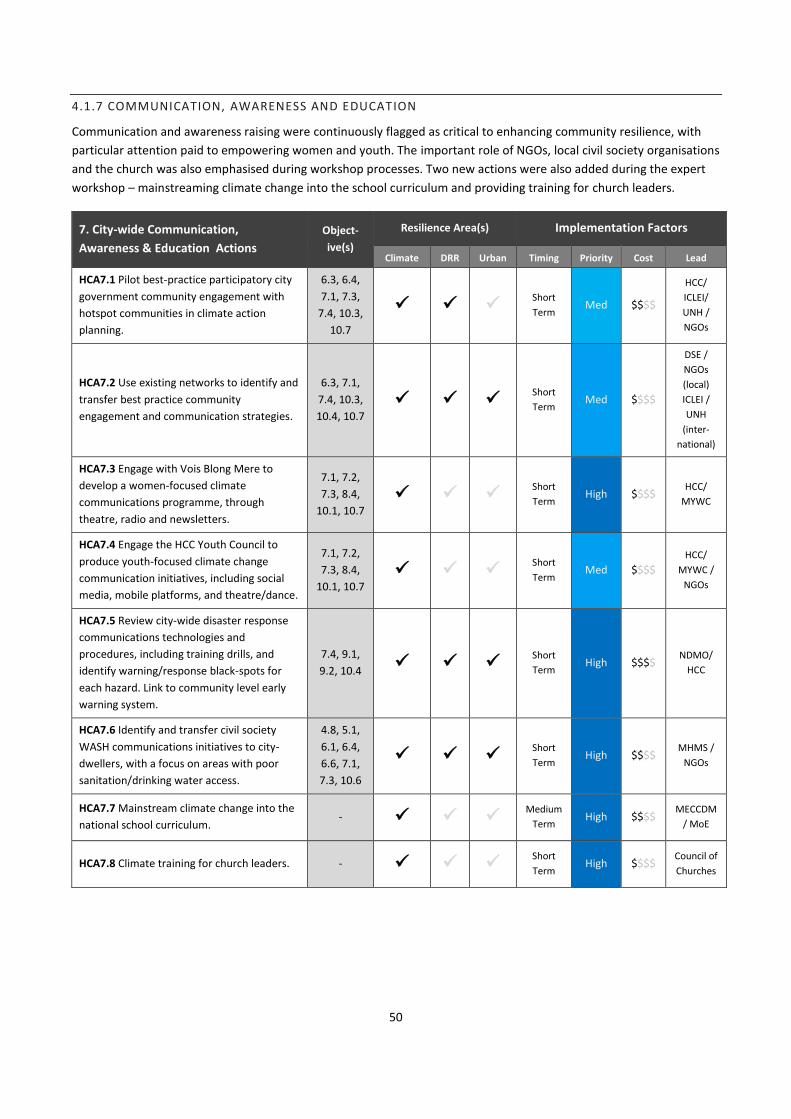
50
4.1.7 COMMUNICATION, AWARENESS AND EDUCATION
Communication and awareness raising were continuously flagged as critical to enhancing community resilience, with
particular attention paid to empowering women and youth. The important role of NGOs, local civil society organisations
and the church was also emphasised during workshop processes. Two new actions were also added during the expert
workshop – mainstreaming climate change into the school curriculum and providing training for church leaders.
7. City-wide Communication,
Awareness & Education Actions
Object-
ive(s)
Resilience Area(s) Implementation Factors
Climate DRR Urban Timing Priority Cost Lead
HCA7.1 Pilot best-practice participatory city
government community engagement with
hotspot communities in climate action
planning.
6.3, 6.4,
7.1, 7.3,
7.4, 10.3,
10.7
Short
Term Med $$$$
HCC/
ICLEI/
UNH /
NGOs
HCA7.2 Use existing networks to identify and
transfer best practice community
engagement and communication strategies.
6.3, 7.1,
7.4, 10.3,
10.4, 10.7
Short
Term Med $$$$
DSE /
NGOs
(local)
ICLEI /
UNH
(inter-
national)
HCA7.3 Engage with Vois Blong Mere to
develop a women-focused climate
communications programme, through
theatre, radio and newsletters.
7.1, 7.2,
7.3, 8.4,
10.1, 10.7
Short
Term High $$$$
HCC/
MYWC
HCA7.4 Engage the HCC Youth Council to
produce youth-focused climate change
communication initiatives, including social
media, mobile platforms, and theatre/dance.
7.1, 7.2,
7.3, 8.4,
10.1, 10.7
Short
Term Med $$$$
HCC/
MYWC /
NGOs
HCA7.5 Review city-wide disaster response
communications technologies and
procedures, including training drills, and
identify warning/response black-spots for
each hazard. Link to community level early
warning system.
7.4, 9.1,
9.2, 10.4
Short
Term High $$$$
NDMO/
HCC
HCA7.6 Identify and transfer civil society
WASH communications initiatives to city-
dwellers, with a focus on areas with poor
sanitation/drinking water access.
4.8, 5.1,
6.1, 6.4,
6.6, 7.1,
7.3, 10.6
Short
Term High $$$$
MHMS /
NGOs
HCA7.7 Mainstream climate change into the
national school curriculum. -
Medium
Term High $$$$
MECCDM
/ MoE
HCA7.8 Climate training for church leaders. - Short
Term High $$$$
Council of
Churches

51
4.1.8 LIVELIHOODS AND BEHAVIOUR CHANGE
Discussions on this theme centred on strengthening the regions to encourage devolved urban growth (and reduce
migration into Honiara), to improve pedestrian access/safety, promote Rapid Employment Program activities across the
city, and to integrate climate change considerations into vocational training.
8. City-wide Actions: Livelihoods &
Behaviour Change
Object-
ive(s)
Resilience Area(s) Implementation Factors
Climate DRR Urban Timing Priority Cost Lead(s)
HCA8.1 Create an inter-ministry taskforce,
including the provinces, for examining
migration drivers and identifying
decentralisation approaches to encourage
urban growth in provincial centres and
secondary towns.
1.1, 1.2,
2.6, 3.1,
8.2, 10.2
Medium
Term High $$$$
OPMC/
MLHS/
Provinces
/ HCC
HCA8.2 Review projected urban growth rates
based on MLHS data and post-census SINSO
survey information.
1.1, 8.1,
8.2, 10.4
Short
Term Med $$$$
MLHS/
SINSO/
UNH
HCA8.3 Review vehicle import standards and
examine a vehicle import tax to fund road
upgrades and maintenance, with incentives
for lower emission vehicles.
3.2, 6.1,
8.3, 10.4
Medium
Term Med $$$$
MID/
Customs /
SICC
HCA8.4 Assess pedestrian infrastructure in
key walking routes around the city centre
and invest in upgrades for congested sites,
unsurfaced routes and high safety risk areas
(also make provisions for elderly and
disabled).
3.2, 6.1,
8.3
Medium
Term High $$$$
MID/
CDCs/
MLHS/
HCC
HCA8.5 Expand the Rapid Employment
Program to target community resilience
actions in other HURCAP hotspots, low-
income and informal community areas.
3.1, 6.1,
8.4
Short
Term Med $$$$
World
Bank/
MID/ HCC
HCA8.6 Build climate impacts modules into
vocational training and education
programmes focusing on climate resilience
skills shortage areas.
7.3, 7.4,
8.4, 8.5,
10.4, 10.7
Medium
Term High $$$$
MoE/
MECCDM/
RMIT

52
4.1.9 DISASTER RISK REDUCTION AND MANAGEMENT
Resilience to natural disasters is a key concern for Honiara. A UNISDR self-assessment exercise for disaster risk
reduction is currently being conducted with HCC by ICLEI and will identify the main institutional strengths and
weaknesses, and ultimately lead to key recommendations for actions. Awareness raising in schools and a Honiara mock
disaster response day were added as additional actions.
9. City-wide Disaster Risk Reduction &
Management Actions
Object-
ive(s)
Resilience Area(s) Implementation Factors
Climate DRR Urban Timing Priority Cost Lead(s)
HCA9.1 Update the HCC Disaster Operation
Plan based on the outcomes of the UNISDR
Resilience Toolkit and ICLEI capacity building
programme.
9.1, 10.3,
10.4
Medium
Term High $$$$
HCC/
ICLEI/
NDMO
HCA9.2 Develop the digitization of hazard
maps for the city for landslide, flood,
tsunami, coastal erosion and storm surge
risks, and collate in one accessible location.
1.4, 1.6,
7.1, 9.1
Short
Term Med $$$$
MECCDM/
MLHS
/HCC /
NDMO /
SOPA
HCA9.3 Create an at-risk household rapid
response taskforce for assisting hazard-prone
communities located in the areas identified
in HCA8.2, linked to CDCs and WDCs.
7.4, 9.2,
10.3, 10.4,
10.7
Medium
Term High $$$$
NDMO/
HCC
HCA9.4 Assess the coverage of emergency
shelters across the Greater Honiara area and
identify additional shelter sites required to
cover 100% of the city’s residents.
7.1, 9.3,
10.4
Short
Term High $$$$
MLHS/
NDMO/
HCC / MID
HCA9.5 Integrate HCA8.3’s taskforce with
early warning systems, built in all at-risk
communities for relevant hazards (with a
coordinator for each ward).
9.2, 10.2,
10.3, 10.4
Medium
Term High $$$$
NDMO/
HCC/
CDCs /
Police and
Fire
services /
NGOs
HCA9.6 Embed DRR personnel within all
major ministries at a national level, contact
points across departments within HCC, and
conduct NDMO-led training with WDCs.
9.1, 10.2,
10.4
Medium
Term High $$$$
OPMC/
NDMO/
HCC
HCA9.7 Initiate a DRR awareness programme
in schools.
7.7, 9.1,
9.2
Medium
Term High $$$$
HCC /
Police and
Fire
Brigade
HCA9.8 Set aside a day for Honiara-wide
disaster response exercises.
9.3, 9.5,
9.6, 7.2
Medium
Term High $$$$
HCC /
Police and
Fire
Brigade

53
4.1.10 GOVERNANCE AND PARTNERSHIPS
Climate change does not respect boundaries and requires multi-sectoral actions, therefore horizontal and vertical
integration of policies and actions is critical. A governance structure that ensures planning, implementation and
monitoring of the implementation of this action plan will be critically important.
10. City-wide Actions: Governance &
Partnerships
Object-
ive(s)
Resilience Area(s) Implementation Factors
Climate DRR Urban Timing Priority Cost Lead(s)
HCA10.1 Constitute a multi-stakeholder
steering group for implementation of the
HURCAP, including core members from
HCC, MLHS, MECDM and Guadalcanal
province as well as implementing partners
and other key stakeholders. To also involve
regular public – private discussions of
opportunities.
1.3, 10.2,
10.4
Short
term High $$$$
OPMC/
HCC/
MECCDM/
MLHS/
GProv.
HCA10.2 Ensure vertical governance
through engagement with Ward Advisory
Groups and Ward Councillors as well as
sub-ward structures such as Community
Development Councils.
1.3, 10.1 Medium
Term Low $$$$
SINSO/
MLHS/
UNH/ HCC
HCA10.3 Develop a formal mechanism for
managing cross-boundary urban resilience
issues between Guadalcanal province and
HCC.
1.1, 1.3, 8.1,
10.3, 10.4
Short
Term Med $$$$
HCC/
GProv /
MLHS
HCA10.4 Develop transparent information
systems for HURCAP funding and
implementation, as well as M&E and
engage Transparency Solomon Islands
(TSI).
7.1, 7.5,
10.4, 10.7
Medium
Term High $$$$
OPMC/
TSI
HCA10.5 Develop a climate change
resilience upskilling programme for ward
councillors, community leaders and
engaged stakeholders.
8.4, 10.3,
10.4
Medium
Term Med $$$$
HCA10.6 Develop climate change training
and knowledge exchange programmes
between HCC staff and urban
municipalities.
10.1, 10.2,
10.4
Medium
Term Low $$$$
HCA10.7 Scope donor country options for
funding support and volunteer positions in
DRR and Urban Climate Resilience related
portfolios within HCC departments.
10.1, 10.2,
10.4
Short
Term Med $$$$
HCA10.8 Create a formal procedure
engaging non-government actors and
representatives in all HURCAP actions,
including civil society, women, youth,
churches and disability organisations.
10.1,
10.2,10.4,
10.7
Short
Term High $$$$
HCC/ DSE/
Churches/
Youth/
Women

54
HCA10.9 Develop a professional training
programme for planners and other urban
and related professionals in support of this
action plan.
Medium
Term Med $$$$
SINU
MLHS
HCA10.10 Develop a training programme
for climate change programme
management including M&E for mid-level
management in partnering institutions.
Medium
Term Med $$$$
HCA10.11 Develop city-to-city partnerships
in particular within the Capital Cities
partnership.
Medium
Term Med $$$$
HCC/
other
Melanesia
n Capitals,
Australian
and NZ
cities
HCA10.12 Mainstream Climate Change into
all Honiara legislation, plans, policies and
programmes in particular the corporate
plan and relevant bi-laws.
Medium
Term Med $$$$ HCC/
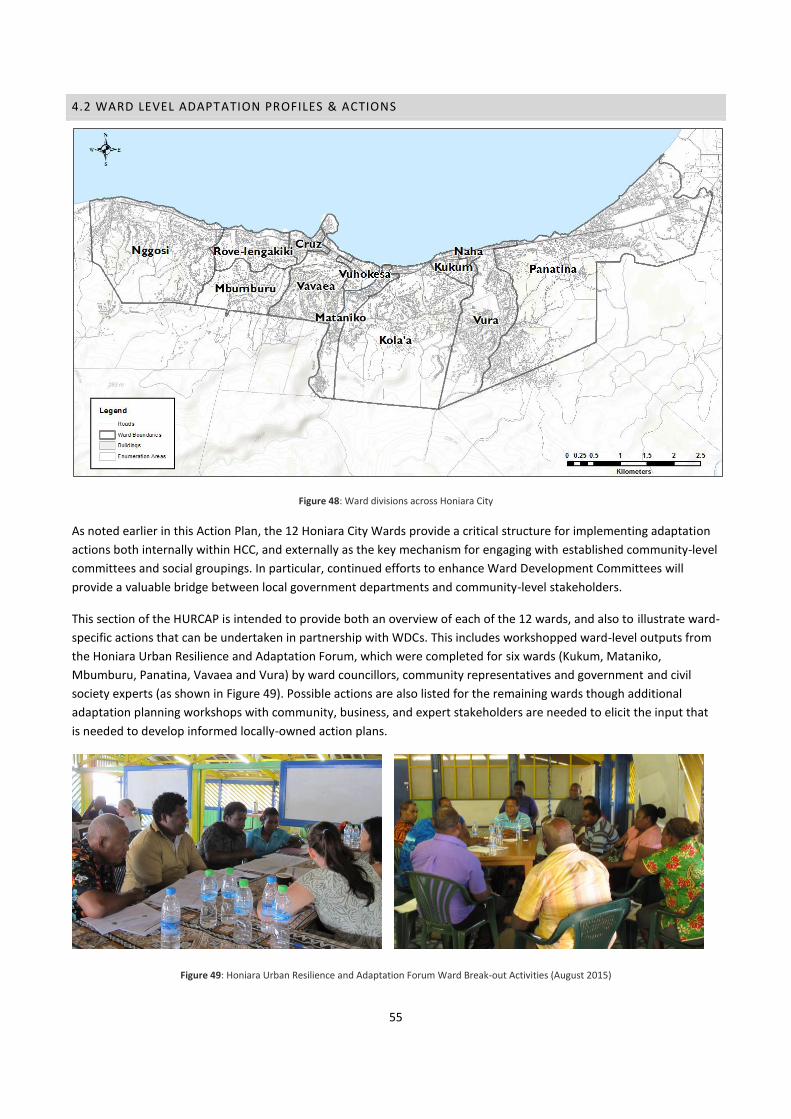
55
4.2 WARD LEVEL ADAPTATION PROFILES & ACTIONS
Figure 48: Ward divisions across Honiara City
As noted earlier in this Action Plan, the 12 Honiara City Wards provide a critical structure for implementing adaptation
actions both internally within HCC, and externally as the key mechanism for engaging with established community-level
committees and social groupings. In particular, continued efforts to enhance Ward Development Committees will
provide a valuable bridge between local government departments and community-level stakeholders.
This section of the HURCAP is intended to provide both an overview of each of the 12 wards, and also to illustrate ward-
specific actions that can be undertaken in partnership with WDCs. This includes workshopped ward-level outputs from
the Honiara Urban Resilience and Adaptation Forum, which were completed for six wards (Kukum, Mataniko,
Mbumburu, Panatina, Vavaea and Vura) by ward councillors, community representatives and government and civil
society experts (as shown in Figure 49). Possible actions are also listed for the remaining wards though additional
adaptation planning workshops with community, business, and expert stakeholders are needed to elicit the input that
is needed to develop informed locally-owned action plans.
Figure 49: Honiara Urban Resilience and Adaptation Forum Ward Break-out Activities (August 2015)
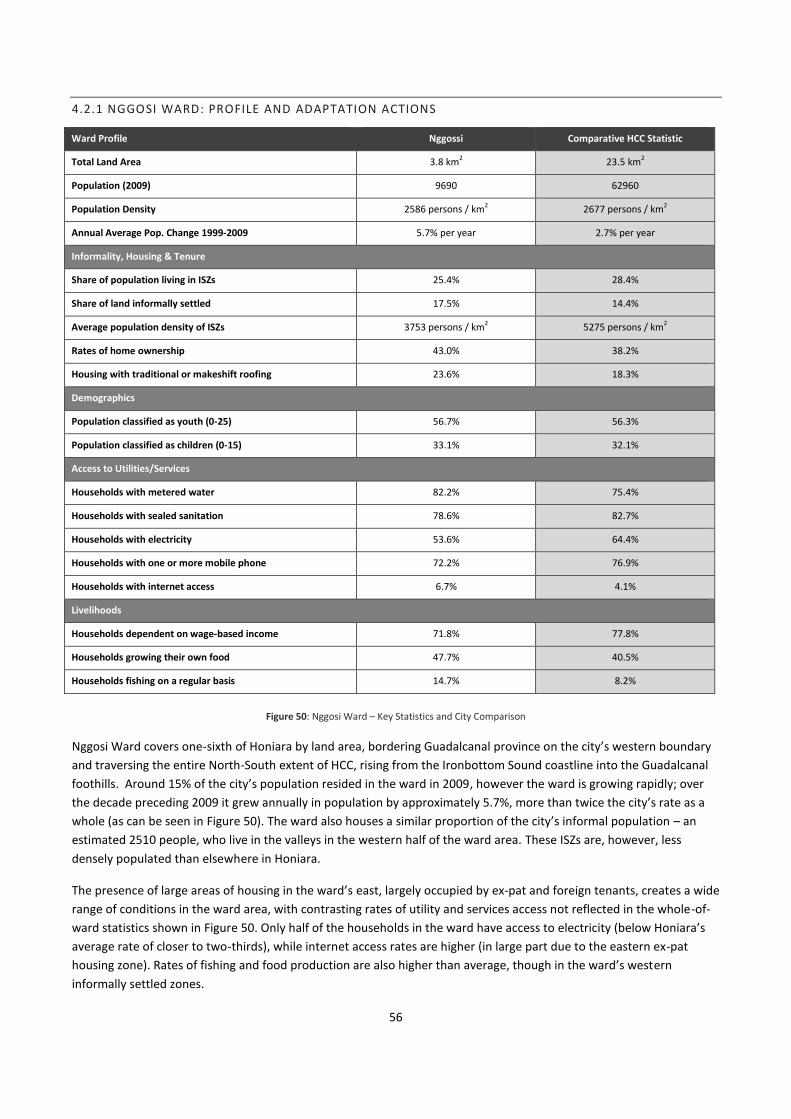
56
4.2.1 NGGOSI WARD: PROFILE AND ADAPTATION ACTIONS
Ward Profile Nggossi Comparative HCC Statistic
Total Land Area 3.8 km2 23.5 km2
Population (2009) 9690 62960
Population Density 2586 persons / km2 2677 persons / km2
Annual Average Pop. Change 1999-2009 5.7% per year 2.7% per year
Informality, Housing & Tenure
Share of population living in ISZs 25.4% 28.4%
Share of land informally settled 17.5% 14.4%
Average population density of ISZs 3753 persons / km2 5275 persons / km2
Rates of home ownership 43.0% 38.2%
Housing with traditional or makeshift roofing 23.6% 18.3%
Demographics
Population classified as youth (0-25) 56.7% 56.3%
Population classified as children (0-15) 33.1% 32.1%
Access to Utilities/Services
Households with metered water 82.2% 75.4%
Households with sealed sanitation 78.6% 82.7%
Households with electricity 53.6% 64.4%
Households with one or more mobile phone 72.2% 76.9%
Households with internet access 6.7% 4.1%
Livelihoods
Households dependent on wage-based income 71.8% 77.8%
Households growing their own food 47.7% 40.5%
Households fishing on a regular basis 14.7% 8.2%
Figure 50: Nggosi Ward – Key Statistics and City Comparison
Nggosi Ward covers one-sixth of Honiara by land area, bordering Guadalcanal province on the city’s western boundary
and traversing the entire North-South extent of HCC, rising from the Ironbottom Sound coastline into the Guadalcanal
foothills. Around 15% of the city’s population resided in the ward in 2009, however the ward is growing rapidly; over
the decade preceding 2009 it grew annually in population by approximately 5.7%, more than twice the city’s rate as a
whole (as can be seen in Figure 50). The ward also houses a similar proportion of the city’s informal population – an
estimated 2510 people, who live in the valleys in the western half of the ward area. These ISZs are, however, less
densely populated than elsewhere in Honiara.
The presence of large areas of housing in the ward’s east, largely occupied by ex-pat and foreign tenants, creates a wide
range of conditions in the ward area, with contrasting rates of utility and services access not reflected in the whole-of-
ward statistics shown in Figure 50. Only half of the households in the ward have access to electricity (below Honiara’s
average rate of closer to two-thirds), while internet access rates are higher (in large part due to the eastern ex-pat
housing zone). Rates of fishing and food production are also higher than average, though in the ward’s western
informally settled zones.

57
Nggosi Ward-specific Actions
Nggosi ward was unable to complete the ward-level exercise at the Honiara Urban Resilience and Climate Adaptation
Forum in August 2015. As such, the actions listed here relate to specific critical infrastructure and expert input, as well
as more general observations relating to key hazards and informal settlement upgrading. The first action recommended
for this ward area is to complete the ward-level activity, in partnership with the Ward Development Committee, HCC
and UN-Habitat. Further ward-level actions are proposed below, and are spatially referenced in the map in Figure 51.
W1.1 Develop a tsunami and tropical cyclone warning system and evacuation programme in partnership with coastal
communities and the NDMO.
As shown in Figure 50 a large number of coastal residents inhabit a high risk zone for inundation. A specific
plan for this hazard exposure hotspot needs to be developed to ensure the safe evacuation of these citizens in
the event of a storm surge or tsunami wave.
W1.2 Establish a working group to manage cross-border population growth into Guadalcanal province, as well as
dependency on local springs and bore holes for water.
The dependence of the water supply for the local ISZs’ drinking and washing water is extremely high in the
western section of this ward, and SIWA identified these bore holes as being at critical risk from encroachment,
particularly due to the lack of sealed sanitation in these encroaching settlements.
W1.3 Conduct a study of households and housing structures living within the river floodplain.
More data is required to determine the high risk flood zones in the White River riparian area.
W1.4 Establish an upgrading programme for the White River Informal Settlement Zones
As part of ongoing PSUP work the formalisation of those ISZ structures outside of service access routes and
hazard zones will allow connection of utilities and better construction standards, reducing climate sensitivity.
Figure 51: Nggosi Ward-specific Actions and Vulnerability Profile

58
4.2.2 ROVE-LENGAKIKI WARD: PROFILE AND ADAPTATION ACTIONS
Ward Profile Rove-Lengakiki Comparative HCC Statistic
Total Land Area 1.0 km2 23.5 km2
Population (2009) 2336 62960
Population Density 2388.4 persons / km2 2677 persons / km2
Annual Average Pop. Change 1999-2009 0.7% per year 2.7% per year
Informality, Housing & Tenure
Share of population living in ISZs 0.0% 28.4%
Share of land informally settled 0.0% 14.4%
Average population density of ISZs N/A 5275 persons / km2
Rates of home ownership 27.5% 38.2%
Housing with Traditional or Makeshift Roofing 6.6% 18.3%
Demographics
Population classified as youth (0-25) 53.5% 56.3%
Population classified as children (0-15) 30.0% 32.1%
Access to Utilities/Services
Households with metered water 68.9% 75.4%
Households with sealed sanitation 98.2% 82.7%
Households with electricity 90.1% 64.4%
Households with one or more mobile phone 79.0% 76.9%
Households with internet access 6.6% 4.1%
Livelihoods
Households dependent on wage-based income 85.0% 77.8%
Households growing their own food 43.7% 40.5%
Households fishing on a regular basis 15.9% 8.2%
Figure 52: Rove-Lengakiki Ward – Key Statistics and City Comparison
Housing 2336 residents and covering approximately one square kilometre, Rove-Lengakiki is one of the city’s most
stable wards with no informal settlement zones and a population growth rate well below the Honiara average at 0.7%
per annum (see Figure 52). It has a low rate of home ownership, but almost all households have sealed sanitation
facilities and electricity. Internet access and mobile phone ownerships are above the city average, however connectivity
to metered water is lower than elsewhere in Honiara.
Almost double the percentage of residents living within Rove-Lengakiki participate in fishing relative to the rest of
Honiara, however 85% of the ward’s households depend on wage-based income, reflecting extensive areas of
government housing and ex-pat rental stock.
Rove-Lengakiki Ward-specific Actions
Rove-Lengakiki ward was unable to complete the ward-level exercise at the Honiara Urban Resilience and Climate
Adaptation Forum in August 2015. As such, the actions listed here relate to specific critical infrastructure and expert
input, as well as more general observations relating to key hazards and informal settlement upgrading.

59
The first action recommended for this ward area is to complete the ward level activity, in partnership with the Ward
Development Committee, HCC and UN-Habitat. Additional recommended ward-level actions are as follows:
W2.1 Rehabilitate and/or relocate the sewer outfall as part of a city-wide outfall upgrade programme.
As identified elsewhere in this Action Plan the outfalls into Ironbottom Sound are in a state of disrepair and
allow raw sewerage to enter the ocean at the coastline.
W2.2 Investigate at-risk housing located on sloped and unstable areas, taking into account the nearby water source
and the new Land Use Planning Scheme regulations for construction on areas steeper than 45 degrees.
Although sparsely populated, a significant area of the ward was identified in earlier analysis to be at high risk
of landslides. These areas, and others with a significant gradient, should be mapped out using a digital
elevation model for further investigation and housing in these zones assessed by engineers.
W2.3 Develop a tsunami and tropical cyclone warning system and evacuation programme in partnership with coastal
businesses and the NDMO.
Non-residential areas along the coastline include recreational facilities and hotels, which require different
approaches in the development of tsunami and storm surge evacuation plans and warning systems.
W2.4 Investigate the potential for creating public open and green space with waterfront access as part of
rehabilitation of government building sites.
In all stakeholder consultations the lack of publicly accessible waterfront and open space was seen as a key
limit to the city, and would benefit local residents, boost tourism opportunities, and provide a natural buffer
from climate risks through ecosystem-based adaptation and climate-sensitive design.
Figure 53: Rove-Lengakiki Ward-specific Actions and Vulnerability Profile

60
4.2.3 MBUMBURU WARD: PROFILE AND ADAPTATION ACTIONS
Ward Profile Mbumburu Comparative HCC Statistic
Total Land Area 1.2 km2 23.5 km2
Population (2009) 3581 62960
Population Density 2940.3 persons / km2 2677 persons / km2
Annual Average Pop. Change 1999-2009 5.0% per year 2.7% per year
Informality, Housing & Tenure
Share of population living in ISZs 0.9% 28.4%
Share of land informally settled 0.5% 14.4%
Average population density of ISZs 6127.7 persons / km2 5275 persons / km2
Rates of home ownership 32.0% 38.2%
Housing with Traditional or Makeshift Roofing 17.2% 18.3%
Demographics
Population classified as youth (0-25) 55.0% 56.3%
Population classified as children (0-15) 30.% 32.1%
Access to Utilities/Services
Households with metered water 78.0% 75.4%
Households with sealed sanitation 80.1% 82.7%
Households with electricity 68.4% 64.4%
Households with one or more mobile phone 86.5% 76.9%
Households with internet access 5.6% 4.1%
Livelihoods
Households dependent on wage-based income 80.1% 77.8%
Households growing their own food 47.0% 40.5%
Households fishing on a regular basis 5.1% 8.2%
Figure 54: Mbumburu Ward – Key Statistics and City Comparison
Mbumburu is an inland ward which houses around 6% of Honiara’s total population, but is one of the city’s fastest
growing areas due to significant unoccupied areas of developable land on the ward’s south-eastern boundary. The
ward’s inhabitants have slightly higher than average levels of utilities and services access, higher rates of household
gardening, but lower rates of fishing commensurate with their inland location.
The ward contains very small areas of officially classified Informal Settlement Zones, encompassing less than half a
percent of Mbumburu’s land area. However, settlement issues are understood to exist around the local water source
and bore hole area. Mbumburu also contains an area of high landslide risk on which a number of houses are located.
Mbumburu Ward-specific Actions
Proposed adaptation and resilience-building actions for Mbumburu Ward were developed as part of the Honiara Urban
Resilience and Climate Adaptation Forum held in Honiara in August 2015. Participants included the ward councillor,

61
community representatives and stakeholders from a range of civil society organisations, government departments and
donor groups.
W3.1 Conduct community consultations on use of the local water source and create a protective zone determining
appropriate use within its catchment area.
Given the ward’s above average population growth, the long-term protection of one of the city’s key water
sources is critical, and requires local community engagement and ownership.
W3.2 Investigate at-risk housing located on sloped and unstable areas, taking into account the nearby water source
and the new Land Use Planning Scheme regulations for construction on areas steeper than 45 degrees.
Landslide studies are out of date and can be improved in terms of detail and relevance to the new clauses
present in the Land Use Planning Scheme through application of existing data (Honiara Digital Elevation
Model).
W3.3 Profile cross-border growth into Guadalcanal province, and manage customary leasing arrangements with local
communities.
Given the previous social tensions and unrest resulting from encroachment of city residents into customary
land areas, managing the relationships beyond the formal city boundary in partnership with Guadalcanal
Province and the National Solomon Islands Government is critical to ensure stability and security in Honiara.
Figure 55: Mbumburu Ward-specific Actions and Vulnerability Profile

62
4.2.4 CRUZ WARD: PROFILE AND ADAPTATION ACTIONS
Ward Profile Cruz Comparative HCC Statistic
Total Land Area 0.3 km2 23.5 km2
Population (2009) 98 62960
Population Density 416.8 persons / km2 2677 persons / km2
Annual Average Pop. Change 1999-2009 -6.3% per year 2.7% per year
Informality, Housing & Tenure
Share of population living in ISZs 0.0% 28.4%
Share of land informally settled 0.0% 14.4%
Average population density of ISZs N/A 5275 persons / km2
Rates of home ownership 5.9% 38.2%
Housing with Traditional or Makeshift Roofing 5.9% 18.3%
Demographics
Population classified as youth (0-25) 34.9% 56.3%
Population classified as children (0-15) 17.7% 32.1%
Access to Utilities/Services
Households with metered water 100.0% 75.4%
Households with sealed sanitation 100.0% 82.7%
Households with electricity 100.0% 64.4%
Households with one or more mobile phone 76.5% 76.9%
Households with internet access 17.6% 4.1%
Livelihoods
Households dependent on wage-based income 76.5% 77.8%
Households growing their own food 70.6% 40.5%
Households fishing on a regular basis 17.6% 8.2%
Figure 56: Cruz Ward – Key Statistics and City Comparison
A summary of the profile of Cruz ward is shown above in Figure 56. At only 0.3 km2 Cruz is the second smallest ward
even though it comprises the city’s central business district, it contained only 98 permanent residents in the 2009
census, 170 less than in 1999.
There are no informal settlements within Cruz ward, and the area has full access to utilities and the highest rate of
household internet access in the city. Home ownership, however, is extremely low (5.9% of households), with lower
than average youth and child population levels.
Other notable features of the ward include a portion of the port area and recreational berths, a number of the city’s
major hotels, the central bank, ministries and the police headquarters.

63
Cruz Ward-specific Actions
Cruz ward was unable to complete the ward-level exercise at the Honiara Urban Resilience and Climate Adaptation
Forum in August 2015. As such, the actions listed here relate to specific critical infrastructure and expert input, as well
as more general observations relating to key hazards and informal settlement upgrading.
The first action recommended for this ward area is to complete the ward level activity, in partnership with the Ward
Development Committee, HCC and UN-Habitat. Other ward-level actions identified through stakeholder workshops and
expert consultations include:
W4.1 Identify areas for street tree planting to beautify the main street through the CBD, with the aim of shading
pedestrian areas and improving stormwater absorption.
A number of participants recalled earlier streetscapes along the Kukum Highway that provided shade and
points of interest for visitors to the city. These also have the potential to reduce rainfall run-off in heavy rain
events, and reduce air pollutants from traffic.
W4.2 Explore the potential for public access open space creation through Port rehabilitation works as part of
buffering from storm surge damage. Include rehabilitation works for the sewer outfall.
Modifications have been proposed for much of the port area to integrate a level of public waterfrontage in the
CBD – in the short term, this access could be provided on the western edge of Point Cruz with minimal
disruption to the Port Authority. This could also improve inundation risk through incorporation of ecosystem-
based adaptation options such as mangroves and floodable areas.
W4.3 Analyse drainage issues and localised flooding on streets in the CBD area, both in terms of traffic disruption
and pedestrian access.
No mapping has been undertaken of localised flooding issues in the city. This would allow targeted drainage
improvement works and project funding submissions to donors.
W4.4 Extend street planting, drainage remediation works and improved pedestrian access to secondary roads in the
CBD area.
Beyond the Kukum highway, key pedestrian routes could be enhanced by covering open drains with footpaths,
improving safety and disability access, while also encouraging alternative low-emissions forms of commuting.

64
Figure 57: Cruz Ward-specific Actions and Vulnerability Profile

65
4.2.5 VAVAEA WARD: PROFILE AND ADAPTATION ACTIONS
Ward Profile Vavaea Comparative HCC Statistic
Total Land Area 1.5 km2 23.5 km2
Population (2009) 6767 62960
Population Density 4434.5 persons / km2 2677 persons / km2
Annual Average Pop. Change 1999-2009 0.1% per year 2.7% per year
Informality, Housing & Tenure
Share of population living in ISZs 29.7% 28.4%
Share of land informally settled 17.8% 14.4%
Average population density of ISZs 7419.7 persons / km2 5275 persons / km2
Rates of home ownership 31.3% 38.2%
Housing with Traditional or Makeshift Roofing 18.8% 18.3%
Demographics
Population classified as youth (0-25) 54.9% 56.3%
Population classified as children (0-15) 30.6% 32.1%
Access to Utilities/Services
Households with metered water 79.6% 75.4%
Households with sealed sanitation 95.8% 82.7%
Households with electricity 64.8% 64.4%
Households with one or more mobile phone 77.6% 76.9%
Households with internet access 4.0% 4.1%
Livelihoods
Households dependent on wage-based income 79.0% 77.8%
Households growing their own food 25.9% 40.5%
Households fishing on a regular basis 6.4% 8.2%
Figure 58: Vavaea Ward – Key Statistics and City Comparison
Vavaea is a diverse ward, including the industrial port area, stevedoring and fuel depot zones, the Honiara central
market, and an extensive residential area extending southward to the Guadalcanal border. It is also one of the city’s
most densely populated wards, housing over 10% of Honiara’s population in only 1.5km2. This large area is, however,
relatively stable in terms of population change, growing at an average of only 0.1% per year between 1999 and 2009.
Almost a third of Vavaea’s population lives in ISZs, much of which were destroyed in the April 2014 floods (the ward
includes the Koa Hill area on the western bank of the Mataniko River). These areas are extremely densely populated,
and are growing across the border into Guadalcanal Province on the ward’s south-western boundary. Access to utilities
and services are broadly consistent with the rest of Honiara, with the exception of high rates of improved sanitation.
The absence of surveyed household points in the Koa Hill area in the 2009 census, however, suggests that ISZ
inhabitants may not be sufficiently represented in this data (see Figure 61).
66
Vavaea Ward-specific Actions
Proposed adaptation and resilience-building actions for Vavaea Ward were developed as part of the Honiara Urban
Resilience and Climate Adaptation Forum held in Honiara in August 2015. Participants included the ward councillor,
community representatives and stakeholders from a range of civil society organisations, government departments and
donor groups.
W5.1 Develop a medium-term plan for relocating fuel tanks away from the CBD, including site remediation and
creation of a public recreational space.
This site has the potential to be transformed into a key community asset with rehabilitation works, and at
present may be a key risk during a tropical cyclone event.
W5.2 Create a long-term plan for flood-sensitive use of the Koa Hill area destroyed in the April 2014 floods, such as
sports fields or community gardens.
Informal settlements are already encroaching on the floodplain area. Without an appropriate use, developed
in partnerships with the community, the same risk to housing a lives is likely to repeat during the next severe
storm event.
W5.3 Develop a community engagement programme with informal settlements adjacent to the floodplain to
communicate flood risk and prevent further settlement in at-risk areas.
Linked to W5.2, an ongoing engagement strategy with adjacent households is critical, employing tools such as
FTE and the UN-Habitat Participatory Slum Upgrading Programme (PSUP).
W5.4 Profile the cross-border informal settlement and manage customary leasing arrangements with local
communities and Guadalcanal Province.
Engagement in partnership between Guadalcanal Province, HCC and community leaders.
W5.5 Conduct a localised climate risk assessment of the Honiara Central market, and consult with traders on interest
in decentralised market options across the city.
The market provides a critical source of food, income and employment for residents of the city.

67
Figure 59: Vavaea Ward-specific Actions and Vulnerability Profile
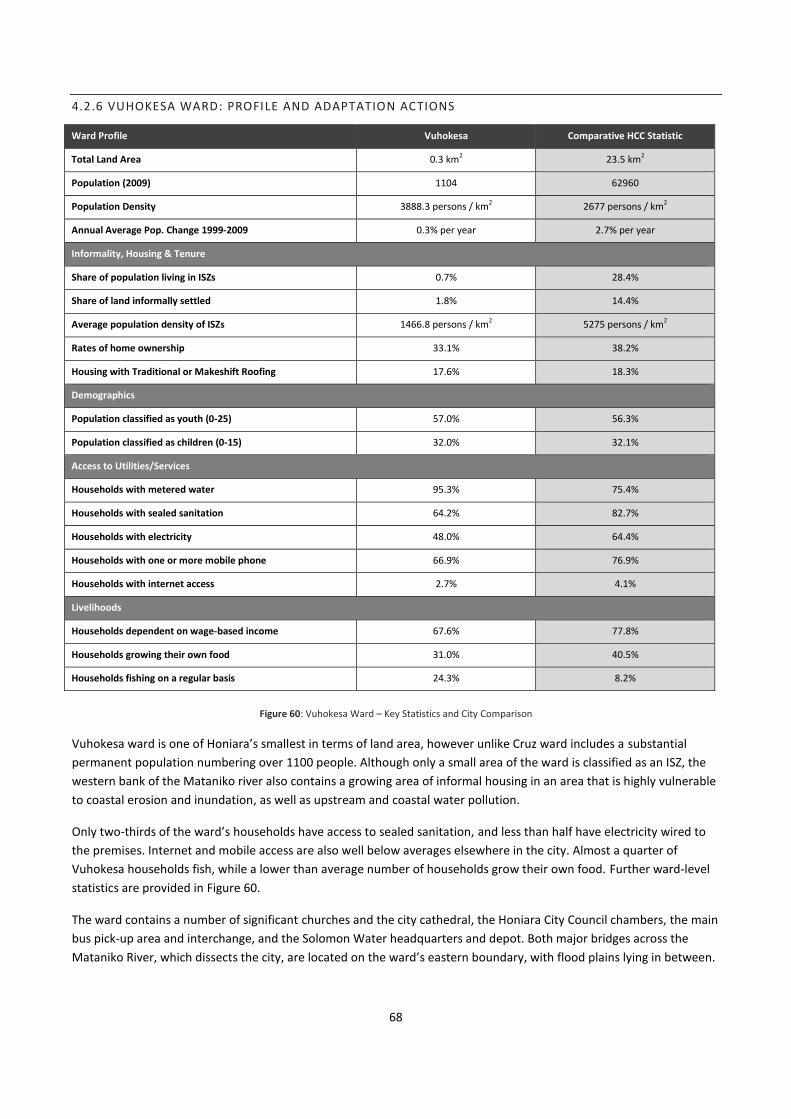
68
4.2.6 VUHOKESA WARD: PROFILE AND ADAPTATION ACTIONS
Ward Profile Vuhokesa Comparative HCC Statistic
Total Land Area 0.3 km2 23.5 km2
Population (2009) 1104 62960
Population Density 3888.3 persons / km2 2677 persons / km2
Annual Average Pop. Change 1999-2009 0.3% per year 2.7% per year
Informality, Housing & Tenure
Share of population living in ISZs 0.7% 28.4%
Share of land informally settled 1.8% 14.4%
Average population density of ISZs 1466.8 persons / km2 5275 persons / km2
Rates of home ownership 33.1% 38.2%
Housing with Traditional or Makeshift Roofing 17.6% 18.3%
Demographics
Population classified as youth (0-25) 57.0% 56.3%
Population classified as children (0-15) 32.0% 32.1%
Access to Utilities/Services
Households with metered water 95.3% 75.4%
Households with sealed sanitation 64.2% 82.7%
Households with electricity 48.0% 64.4%
Households with one or more mobile phone 66.9% 76.9%
Households with internet access 2.7% 4.1%
Livelihoods
Households dependent on wage-based income 67.6% 77.8%
Households growing their own food 31.0% 40.5%
Households fishing on a regular basis 24.3% 8.2%
Figure 60: Vuhokesa Ward – Key Statistics and City Comparison
Vuhokesa ward is one of Honiara’s smallest in terms of land area, however unlike Cruz ward includes a substantial
permanent population numbering over 1100 people. Although only a small area of the ward is classified as an ISZ, the
western bank of the Mataniko river also contains a growing area of informal housing in an area that is highly vulnerable
to coastal erosion and inundation, as well as upstream and coastal water pollution.
Only two-thirds of the ward’s households have access to sealed sanitation, and less than half have electricity wired to
the premises. Internet and mobile access are also well below averages elsewhere in the city. Almost a quarter of
Vuhokesa households fish, while a lower than average number of households grow their own food. Further ward-level
statistics are provided in Figure 60.
The ward contains a number of significant churches and the city cathedral, the Honiara City Council chambers, the main
bus pick-up area and interchange, and the Solomon Water headquarters and depot. Both major bridges across the
Mataniko River, which dissects the city, are located on the ward’s eastern boundary, with flood plains lying in between.

69
Vuhokesa Ward-specific Actions
Vuhokesa ward was unable to complete the ward-level exercise at the Honiara Urban Resilience and Climate
Adaptation Forum in August 2015. As such, the actions listed here relate to specific critical infrastructure and expert
input, as well as more general observations relating to key hazards and informal settlement upgrading.
The first action recommended for this ward area is to complete the ward level activity, in partnership with the Ward
Development Committee, HCC and UN-Habitat. Additional actions, based on expert input and workshops, include:
W6.1 Engage the waterfront informal settlement in a consultative process similar to other hotspot zones, identifying
community priorities and key vulnerabilities.
To be conducted in partnership with UN-Habitat, MLHS and the landowners, building on the experiences of the
local community and their established social structures. Discuss potential for a relocation programme.
W6.2 Formalise protection of the floodplain area on the west bank of the Mataniko in partnership with the Physical
Planning Division of MLHS and HCC.
Including examination of the impact of bank modification on the waterfront housing of Chinatown, and
downstream settlements at the river mouth.
W6.3 Integrate debris modelling and improved pedestrian access to the ongoing upgrading of the bridge as a critical
cross-city alternative during flood events.
With this bridge to provide a critical secondary cross-city river crossing, consideration of the high amount of
pedestrian traffic dependent on the cross should be integrated into planning for its duplication.
W6.4 Conduct Water Quality Monitoring on an ongoing basis.
To ensure the safety of settlement dwellers downstream at the river mouth.
Figure 61: Vuhokesa Ward-specific Actions and Vulnerability Profile

70
4.2.7 MATANIKO WARD: PROFILE AND ADAPTATION ACTIONS
Ward Profile Mataniko Comparative HCC Statistic
Total Land Area 0.8 km2 23.5 km2
Population (2009) 4192 62960
Population Density 5111.7 persons / km2 2677 persons / km2
Annual Average Pop. Change 1999-2009 4.5% per year 2.7% per year
Informality, Housing & Tenure
Share of population living in ISZs 19.5% 28.4%
Share of land informally settled 11.0% 14.4%
Average population density of ISZs 9044.6 persons / km2 5275 persons / km2
Rates of home ownership 43.7% 38.2%
Housing with Traditional or Makeshift Roofing 21.0% 18.3%
Demographics
Population classified as youth (0-25) 55.5% 56.3%
Population classified as children (0-15) 33.4% 32.1%
Access to Utilities/Services
Households with metered water 75.3% 75.4%
Households with sealed sanitation 73.8% 82.7%
Households with electricity 67.2% 64.4%
Households with one or more mobile phone 77.5% 76.9%
Households with internet access 2.2% 4.1%
Livelihoods
Households dependent on wage-based income 75.8% 77.8%
Households growing their own food 33.8% 40.5%
Households fishing on a regular basis 6.8% 8.2%
Figure 62: Mataniko Ward – Key Statistics and City Comparison
Mataniko ward traverses the eastern bank of the Mataniko River from the southern Honiara boundary with
Guadalcanal province to the northern coastline along Ironbottom Sound. Housing around 7% of the city’s population,
Mataniko is also one of the most densely populated wards; at 5112 inhabitants per kilometre squared it has a
population density twice the rest of the city. Almost 10% of land is classified as informal: 9045 persons/km2.
At the river mouth, Ontong Java Settlement extends from the Kukum Highway to the boundary of the National Referral
Hospital, facing pressures from coastal erosion and riverine flooding. Chinatown, which provides commercial and light
industrial services for the city and houses a number of civil society organisations, is limited in terms of space but has
severe exposure to flood damage, as demonstrated in the April 2014 floods.
Informal settlements in the centre of the ward lack road access and sit on the juncture of the river and eastern
tributaries that carry waste and effluent downstream from informal settlements in neighbouring Kola’a. Sewer outfalls
into the river on the ward’s western edge are other key infrastructure features, with a water source on the southern
boundary with Guadalcanal province.

71
Mataniko Ward-specific Actions
Proposed adaptation and resilience-building actions for Mataniko Ward were developed as part of the Honiara Urban
Resilience and Climate Adaptation Forum held in Honiara in August 2015. Participants included the ward councillor,
community representatives and stakeholders from a range of civil society organisations, government departments and
donor groups.
Additional input has been provided based on critical infrastructure analysis and hazard exposure data, with further
actions developed by expert stakeholders and the UN-Habitat team.
W7.1 Examine structural risks to Chinatown trader buildings along the eastern bank of the Mataniko River for future
flood events.
Extensive damage to riverbank structures in Chinatown remains evident following the April 2014 floods. A
review of the current regulations for this waterfront zone, as well as a structural assessment of existing
properties, should be conducted given the critical role of the downstream bridge.
W7.2 Integrate consideration of climate risks (heat, flooding and landslide) into Slum Upgrading Programme
initiatives in the ISZ.
A focus on granting ToL and FTE outside of high risk hazard zones, in addition to utility and road access.
W7.3 Conduct a study of the sewerage outfalls and explore options to treat or pipe downstream.
With extensive housing along the river downstream, these outfalls are no longer appropriately located.
W7.4 Develop a protection plan for the local water source from encroaching urban growth, including an engagement
plan with local informal communities.
Potential to follow models such as the Tagabe Watch Catchment Management Committee in Port Vila. Explore
opportunities to move the sourcing of water further upstream.
Figure 63: Mataniko Ward-specific Actions and Vulnerability Profile

72
4.2.8 KOLA’A WARD: PROFILE AND ADAPTATION ACTIONS
Ward Profile Kola’a Comparative HCC Statistic
Total Land Area 4.9 km2 23.5 km2
Population (2009) 9857 62960
Population Density 2001.5 persons / km2 2677 persons / km2
Annual Average Pop. Change 1999-2009 3.5% per year 2.7% per year
Informality, Housing & Tenure
Share of population living in ISZs 39.9% 28.4%
Share of land informally settled 16.5% 14.4%
Average population density of ISZs 4828.7 persons / km2 5275 persons / km2
Rates of home ownership 47.7% 38.2%
Housing with Traditional or Makeshift Roofing 22.3% 18.3%
Demographics
Population classified as youth (0-25) 56.9% 56.3%
Population classified as children (0-15) 32.2% 32.1%
Access to Utilities/Services
Households with metered water 75.7% 75.4%
Households with sealed sanitation 84.4% 82.7%
Households with electricity 61.4% 64.4%
Households with one or more mobile phone 75.7% 76.9%
Households with internet access 4.4% 4.1%
Livelihoods
Households dependent on wage-based income 80.5% 77.8%
Households growing their own food 38.8% 40.5%
Households fishing on a regular basis 4.1% 8.2%
Figure 64: Kola’a Ward – Key Statistics and City Comparison
Kola’a ward contains one-fifth of Honiara’s land area and 16% of its population, including some of its most climate-
vulnerable households (the Aekafo Planning area, for example, as shown in Figure 65). A relatively low overall ward
density due to large areas of unoccupied land in the ward’s south masks an east-west band of ISZs which are severely
deficient in infrastructure, prone to flooding and landslides, and are expanding rapidly. A number of new subdivisions
are located along Kola’a’s eastern boundary.
Levels of utilities access and livelihood sources closely match the city overall, with the exception of fishing rates which
are below average. Key infrastructure in Kola’a ward includes the soon to be relocated National Referral Hospital, the
Lawson Tama Stadium, and a series of springs which provide washing and drinking water to the ISZ communties.
Kola’a Ward-specific Actions
Kola’a ward was unable to complete the ward-level exercise at the Honiara Urban Resilience and Climate Adaptation
Forum in August 2015. As such, the actions listed here relate to specific critical infrastructure and expert input, as well
as more general observations relating to key hazards and informal settlement upgrading.

73
The first action recommended for this ward area is to complete the ward level activity, in partnership with the Ward
Development Committee, HCC and UN-Habitat. A number of hotspot-specific actions are not included here, as they are
discussed in subsequent sections of the HURCAP. Expert identified ward-level actions are as follows:
W8.1 Hospital site development options to include waterfront access for public open space, green infrastructure.
Including sewerage outfall upgrading and explore the opportunities for potential waterfront mangrove (or
other suitable trees) planting.
W8.2 Analyse existing landslip risk, and develop maps of yet-to-be-developed areas with gradients >45°.
Extensive informal housing is at risk in the Aekafo Planning Area, particularly in areas that are newly settled
(post-April 2014). For yet-to-be-developed zones there is the potential to make prospective settlers
understand that they won’t be granted ToL in these areas in advance of housing establishment.
W8.3 Investigate funding and institutional resourcing for a health clinic for the area.
Residents have identified a critical health services gap through workshops and the forum, with discussions to
follow the National Referral Hospital relocation process.
W8.4 Re-establish an access road, including some housing relocation.
The re-establishment of a road in the valley will allow waste removal, easier community access and
introduction of utilities infrastructure such as electricity and piped water.
W8.5 Pilot low-cost sealed sanitation options and community-based river clean-up programme.
With sewerage currently entering the water table and river, improved sanitation is critical for human health
and well-being, both of the local population and those downstream in Mataniko Ward. Plastics pollution also
creates a secondary environmental risk and is reducing water flow, leading to stagnation and vector-based
disease exposure.
Figure 65: Kola’a Ward-specific Actions and Vulnerability Profile

74
4.2.9 KUKUM WARD: PROFILE AND ADAPTATION ACTIONS
Ward Profile Kukum Comparative HCC Statistic
Total Land Area 0.3 km2 23.5 km2
Population (2009) 1705 62960
Population Density 5189.1 persons / km2 2677 persons / km2
Annual Average Pop. Change 1999-2009 -1.3% per year 2.7% per year
Informality, Housing & Tenure%
Share of population living in ISZs 0.0% 28.4%
Share of land informally settled 0.0% 14.4%
Average population density of ISZs N/A 5275 persons / km2
Rates of home ownership 28.8% 38.2%
Housing with Traditional or Makeshift Roofing 2.1% 18.3%
Demographics
Population classified as youth (0-25) 54.2% 56.3%
Population classified as children (0-15) 30.4% 32.1%
Access to Utilities/Services
Households with metered water 87.6% 75.4%
Households with sealed sanitation 98.3% 82.7%
Households with electricity 91.4% 64.4%
Households with one or more mobile phone 83.3% 76.9%
Households with internet access 2.6% 4.1%
Livelihoods
Households dependent on wage-based income 82.0% 77.8%
Households growing their own food 29.6% 40.5%
Households fishing on a regular basis 8.6% 8.2%
Figure 66: Kukum Ward – Key Statistics and City Comparison
At only 0.3km2 Kukum ward is one of the smallest in Honiara, but also one of the highest in terms of population density.
With no formally classified ISZs, the number of households with traditional or makeshift roofing is extremely low, and
none of the enumeration areas in the ward cross any of the vulnerability thresholds (as shown in Figure 67).
Electrification, metered water access, and sealed sanitation rates are all well above the Honiara average (see Figure 66).
In addition to a limited number of households, a number of businesses are located within the ‘at risk’ coastal zone.
Sewer outfalls are also located at either end of the ward’s coastline.
Rates of home ownership in the area are lower than elsewhere in the city (less than 30% of households), and the ward
is currently reducing in overall population, reducing at an average of 1.3% per year between 1999 and 2009. Backyard
food production rates are also below the overall Honiara averages.

75
Kukum Ward-specific Actions
Proposed adaptation and resilience-building actions for Kukum Ward were developed as part of the Honiara Urban
Resilience and Climate Adaptation Forum held in Honiara in August 2015. Participants included the ward councillor,
community representatives and stakeholders from a range of civil society organisations, government departments and
donor groups.
Additional input has been provided based on critical infrastructure analysis and hazard exposure data, with further
actions developed by expert stakeholders and the UN-Habitat team.
W9.1 Develop a commercial and business climate awareness and risk planning roundtable in partnership with SICCI.
Private sector engagement stands to mutually benefit both the city and country as a whole through economic
productivity, as well as the financial returns of the business community.
W9.2 Sewer outfall upgrades and pipe maintenance.
As noted in other ward profiles the degradation of outfalls and piping is leading to septic intrusion across the
city. These outfalls are less critical than others due to reduced proximity to residential areas dependent on the
ocean for washing, bathing and recreation.
W9.3 Ongoing maintenance of the sea wall, with consideration of external erosion impacts.
Potential to include hybrid ecosystem-based adaptation options and mangrove plantings.
W9.4 Sports field upgraded drainage, tree plantings and rubbish collection.
Potential to provide rubbish collection point and recycling services for the wider community at these facilities.
Figure 67: Kukum Ward-specific Actions and Vulnerability Profile

76
4.2.10 NAHA WARD: PROFILE AND ADAPTATION ACTIONS
Ward Profile Naha Comparative HCC Statistic
Total Land Area 0.1 km2 23.5 km2
Population (2009) 348 62960
Population Density 4535.6 persons / km2 2677 persons / km2
Annual Average Pop. Change 1999-2009 -6.0% per year 2.7% per year
Informality, Housing & Tenure
Share of population living in ISZs 0.0% 28.4%
Share of land informally settled 0.0% 14.4%
Average population density of ISZs N/A 5275 persons / km2
Rates of home ownership 9.3% 38.2%
Housing with Traditional or Makeshift Roofing 13.0% 18.3%
Demographics
Population classified as youth (0-25) 57.9% 56.3%
Population classified as children (0-15) 36.5% 32.1%
Access to Utilities/Services
Households with metered water 98.1% 75.4%
Households with sealed sanitation 68.5% 82.7%
Households with electricity 81.5% 64.4%
Households with one or more mobile phone 74.1% 76.9%
Households with internet access 0.0% 4.1%
Livelihoods
Households dependent on wage-based income 79.7% 77.8%
Households growing their own food 5.6% 40.5%
Households fishing on a regular basis 5.6% 8.2%
Figure 68: Naha Ward – Key Statistics and City Comparison
Naha is the smallest of Honiara’s 12 wards by area, measuring only 0.1km2. Its population of 348 residents in 2009 is
also a reduction from the 1999 census of around 6% per year, as shown in Figure 68. There are no recorded informal
settlements in Naha, however home ownership rates are very low (9.3%) relative to elsewhere in the city.
Access to utilities is varied, with electrification above average but sealed sanitation only being available to two-thirds of
residents. Rates of household backyard food production are also much lower than the overall city average.
A number of malls and businesses occupy the coastal zone of the ward north of the Kukum Highway, with shopfronts
occupying the southern side of the highway in the ward’s east. Although the coastline is heavily modified due to sea
walls, these areas are likely to be at risk in the event of a severe storm surge or tsunami.

77
Naha Ward-specific Actions
Naha ward was unable to complete the ward-level exercise at the Honiara Urban Resilience and Climate Adaptation
Forum in August 2015. As such, the actions listed here relate to specific critical infrastructure and expert input, as well
as more general observations relating to key hazards and informal settlement upgrading.
The first action recommended for this ward area is to complete the ward level activity, in partnership with the Ward
Development Committee, HCC and UN-Habitat.
W10.1 Street tree planting programme and drainage/permeability upgrade.
Expanded use of street trees has the potential to create shade, reduce air pollutants and maximise stormwater
uptake through permeable surfaces, thereby reducing stormwater runoff.
W10.2 Conduct detailed survey analysis of coastal inundation potential.
The lack of a sea wall at this site creates the potential for deeper inundation in the event of a storm surge
Figure 69: Naha Ward-specific Actions and Vulnerability Profile

78
4.2.11 VURA WARD: PROFILE AND ADAPTATION ACTIONS
Ward Profile Vura Comparative HCC Statistic
Total Land Area 2.2 km2 23.5 km2
Population (2009) 9240 62960
Population Density 4084.5 persons / km2 2677 persons / km2
Annual Average Pop. Change 1999-2009 1.5% per year 2.7% per year
Informality, Housing & Tenure
Share of population living in ISZs 20.1% 28.4%
Share of land informally settled 12.3% 14.4%
Average population density of ISZs 6673.8 persons / km2 5275 persons / km2
Rates of home ownership 34.1% 38.2%
Housing with Traditional or Makeshift Roofing 9.7% 18.3%
Demographics
Population classified as youth (0-25) 56.4% 56.3%
Population classified as children (0-15) 31.5% 32.1%
Access to Utilities/Services
Households with metered water 77.7% 75.4%
Households with sealed sanitation 88.6% 82.7%
Households with electricity 77.0% 64.4%
Households with one or more mobile phone 83.2% 76.9%
Households with internet access 2.3% 4.1%
Livelihoods
Households dependent on wage-based income 80.3% 77.8%
Households growing their own food 32.2% 40.5%
Households fishing on a regular basis 7.2% 8.2%
Figure 70: Vura Ward – Key Statistics and City Comparison
Covering almost 10% of Honiara, Vura ward contains around 15% of the city’s population with around one-fifth living in
informal settlements (as shown in Figure 70 above). These ISZs border some of the city’s most quickly growing
Enumeration Areas (EAs growing by 15% per annum between 1999 and 2009 are shown below in Figure 70).
Problematically, these areas are both expanding into customary land in Guadalcanal province, and also encroaching on
two of the city’s critical bore holes, which supply a large area with drinking water.
The ward’s eastern border is made up of a critical north-south road that provides access to the city for many of the
ward’s residents, as well as those from neighbouring Panatina. One of the city’s sewer outfalls is located at the ward’s
narrow coastal strip.
Vura Ward-specific Actions
Proposed adaptation and resilience-building actions for Vura Ward were developed as part of the Honiara Urban
Resilience and Climate Adaptation Forum held in Honiara in August 2015. Participants included the ward councillor,

79
community representatives and stakeholders from a range of civil society organisations, government departments and
donor groups.
Additional input has been provided based on critical infrastructure analysis and hazard exposure data, with further
actions developed by expert stakeholders and the UN-Habitat team. A collation of these actions is provided below:
W11.1 Develop a land release strategy for the ward with a fixed timeline for implementation.
Targeted at rapid growth areas, Vura has the potential to model community-funded affordable housing
schemes, which could potentially follow similar low-cost, climate resilient building approaches and financing
models used in Fiji and elsewhere in the Pacific.
W11.2 Use the major north-south arterial road to build a new major drain for the ward.
This would address a number of issues identified by participants in terms of localised flooding without majorly
disrupting or relocating large areas of housing. Other services could also be ‘piggy-backed’ onto the works
programme.
W11.3 Re-establish ToL to FTE conversion programme in new settlement areas.
To be conducted in partnership with MLHS and UN-Habitat’s PSUP process.
W11.4 Sewer outfall upgrades and pipe maintenance.
As noted in other ward profiles, the degradation of outfalls and piping is leading to septic intrusion across the
city.
Figure 71: Vura Ward-specific Actions and Vulnerability Profile

80
4.2.12 PANATINA WARD: PROFILE AND ADAPTATION ACTIONS
Ward Profile Panatina Comparative HCC Statistic
Total Land Area 7.0 km2 23.5 km2
Population (2009) 13269 62960
Population Density 1970.2 persons / km2 2677 persons / km2
Annual Average Pop. Change 1999-2009 4.7% per year 2.7% per year
Informality, Housing & Tenure
Share of population living in ISZs 48.6% 28.4%
Share of land informally settled 17.9% 14.4%
Average population density of ISZs 5341.3 persons / km2 5275 persons / km2
Rates of home ownership 37.7% 38.2%
Housing with Traditional or Makeshift Roofing 20.3% 18.3%
Demographics
Population classified as youth (0-25) 57.7% 56.3%
Population classified as children (0-15) 33.3% 32.1%
Access to Utilities/Services
Households with metered water 63.6% 75.4%
Households with sealed sanitation 75.0% 82.7%
Households with electricity 57.2% 64.4%
Households with one or more mobile phone 73.9% 76.9%
Households with internet access 3.0% 4.1%
Livelihoods
Households dependent on wage-based income 76.8% 77.8%
Households growing their own food 51.1% 40.5%
Households fishing on a regular basis 6.8% 8.2%
Figure 72: Panatina Ward – Key Statistics and City Comparison
Panatina contains 30% of Honiara’s land area, and over a fifth of the city’s population, as shown in Figure 72 above.
Almost half of these inhabitants live informally, in particular in ISZs along the ward’s south-western edge (see Figure 73),
however the population density of the ward remains low due to areas of land that can be developed in the ward’s
south-east. Large cross-border settlements are encroaching into Guadalcanal, as well as the two bore holes discussed in
reference to Vura Ward. The high share of ISZs is reflected in lower than average utilities access and a higher
dependency on backyard food production.
In addition to these large residential zones, the north-east of Panatina consists of a mixed industrial zone, docking
facilities, a large shopping district and the city’s golf course. Extensive additional sports and recreational facilities are
co-located on the southern side of the Kukum Highway, along with the Solomon Islands National University and the
King George VI National High School.
The city’s only landfill site is located at the north-eastern edge of Panatina, with this site and much of the coastal light
industry exposed to potential risk from coastal inundation in the event of a tropical cyclone.

81
Panatina Ward-specific Actions
Proposed adaptation and resilience-building actions for Panatina Ward were developed as part of the Honiara Urban
Resilience and Climate Adaptation Forum held in Honiara in August 2015. Participants included the ward councillor,
community representatives and stakeholders from a range of civil society organisations, government departments and
donor groups.
Additional input has been provided based on critical infrastructure analysis and hazard exposure data, with further
actions developed by expert stakeholders and the UN-Habitat team. Panatina ward also includes the Fishing Village
Hotspot, which is addressed separately in Section 4.3.
W12.1 Community consultation and profiling of cross-border growth into Guadalcanal Province.
As discussed in earlier ward profiles, the tensions relating to customary land rights require a high level of
sensitivity and need to be managed to ensure that the capacity of the city to manage climate impacts is not
compromised.
W12.2 Develop a protection plan for the local water source from encroaching urban growth, including an
engagement plan with local informal communities.
Potential to follow models such as the Tagabe Watch Catchment Management Committee in Port Vila. Explore
opportunities to move the sourcing of water further upstream.
W12.3 Integrate sewer outfall upgrading with an industrial coastal pollution monitoring and awareness programme.
Intended to provide a basis for overall improvement in coastal management practices.
W12.4 Rehabilitate leaching waste from the landfill site and identify a less hazard-prone medium term alternative,
along with appropriate management processes and other associated facilities (including sewerage).
The city as a whole has a need for long-term waste management (and recycling) options, as well as green
waste reduction.
Figure 73: Panatina Ward-specific Actions and Vulnerability Profile

82
4.3 HOTSPOT COMMUNITY ACTIONS
Three community workshops were held in areas that are considered the most vulnerable in Honiara (though many of
the findings from this activity may also be relevant to other areas of the city). Workshop activities were structured to
enable group discussions that first led to the identification and agreement of the main issues and objectives, and then
the prioritisation of associated actions that would contribute to increased resilience in their communities. The
objectives are categorised under the thematic areas for consistency, followed by a prioritised list of local actions
(indicated in cases when priority had been assigned). It is important to note that these actions may cut across thematic
categories e.g. actions for overcrowding could either involve alternative land for relocation (urban planning and land
development) or proper planning and design of houses (housing).
ONTONG JAVA HOTSPOT COMMUNITY-LEVEL ACTIONS:
The Ontong Java community is located on the coast at the mouth of the Mataniko River. The majority of issues that
were raised relate to either being on the coast, flooding and need for improved drainage, or alternatively to general
development deficits which are worsened by their location. As a consequence, availability of alternative land for
resettlement was considered a primary action across multiple issues / objectives.
Ontong Java Settlement – Community
Proposed Actions by Local Objective
Area
Linked
City-wide
Objective
Areas
Key Area Addressed: Implementation Factors
Climate DRR Urban Timing Priority Cost Lead(s)
i) Improved flood risk management and drainage
OJH1.1 Build proper drainage 1, 2, 4 M.T. Med $$$$ SIWA
OJH1.2 Reinforce the seawall 1, 3, 5 S.T. Med $$$$ MID
OJH1.3 Re-route main drain 1, 3, 4 M.T. Med $$$$ SIWA
OJH1.4 Local rubbish mgmt. scheme 1, 4, 8 S.T. High $$$$ CDC
ii) Reduce water logging
OJH2.1 Improve drainage 3, 4, 9 S.T. Med $$$$ SIWA
OJH2.2 Water tanks for all houses 2, 3, 4 M.T. Med $$$$ MID
OJH2.3 Improved sanitation 3, 4, 5 M.T. Low $$$$ SIWA
OJH2.4 Infilling of settlement area 1, 2, 3 L.T. Low $$$$ HCC
iii) Provide access to additional land/provision in an inland location to compensate for overcrowding
OJH3.1 Alternative land for relocation 1, 2, 10 M.T. High $$$$ MLHS
OJH3.2 Funding mechanism/source for land 1, 2, 10 M.T. High $$$$ OPMC
OJH3.3 Community engagement to
discourage in-migration from Ontong Java 1, 8, 10 S.T. Med $$$$ CDC
OJH3.4 Family planning education campaign 7, 6, 10 S.T. Med $$$$ MYWS
OJH3.5 Proper planning/design of housing 1, 2 M.T. Low $$$$ MLHS
OJH3.6 Enable cross-cultural inter-marriage
to enable access to alternative land 2, 7, 8 L.T. Low $$$$ GPG

83
iv) Manage coastal erosion and protection measures at waterfront and river bank
OJH4.1 Hybrid coastal defence approaches
(e.g wave-breakers, mangrove plantings,
infill)
3, 4, 5 L.T. High $$$$ MID
v) Increase preparedness for coral bleaching
OJH5.1 Education & awareness raising 7, 9, 10 S.T. Med $$$$ MECCDM
vi) Reduce external and internal water pollution (coastal and riverine)
OJH6.1 Prohibit riverine dumping of waste 4, 7, 8 M.T. High $$$$ HCC
OJH6.2 Mataniko river clean-up project 4, 5, 8 S.T High $$$$ HCC
OJH6.3 HCC sewage treatment plant 1, 3, 4 L.T. High $$$$ HCC
OJH6.4 Proper hospital waste treatment 3, 4, 10 S.T. High $$$$ MHMS
vii) Facilitate better rubbish disposal
OJH7.1 HCC rubbish collection scheme 1, 4, 10 M.T. Med $$$$ HCC
OJH7.2 Education & awareness raising 7, 8, 10 S.T Med $$$$ CDC
viii) Manage exposure to extreme heat
OJH8.1 Plant more trees 5, 7, 10 S.T. High $$$$ CDC
OJH8.2 Allow for airflow 1, 2, 6 M.T. Med $$$$ MLHS
OJH8.3 Raise houses 2, 8, 9 L.T. Low $$$$ CDC
OJH8.4 Build cool rest houses 2, 9, 10 S.T. Low $$$$ MLHS
OJH8.5 Monitor elderly and young people 6, 7, 10 S.T. High $$$$ CDC
ix) Reduce environmentally-driven health issues
OJH9.1 Conduct a local health expo
(including the likely impact of climate change
on vector-borne disease)
7, 8, 10 S.T High $$$$ MHMS
OJH9.2 Health awareness campaign 6, 7, 8 M.T. Low $$$$ MHMS
OJH9.3 Promote healthier living/diet 6, 7, 8 M.T Low $$$$ MHMS

84
AEKAFO PLANNING ZONE, KOLA’A HOTSPOT COMMUNITY-LEVEL ACTIONS:
Kola’a is situated in steep, hilly terrain upstream from Ontong Java and as a consequence many of the issues that were
identified by local community members were linked to flood and landslide risks, accessibility, infrastructure deficits, as
well as limited rubbish disposal and poor sanitation (the overwhelming majority of actions were linked to water,
sanitation and waste).
Aekafo Planning Zone, Kola’a –
Community Proposed Actions by Local
Objective Area
Links to
City-wide
Objective
Areas
Key Area Addressed: Implementation Factors
Climate DRR Urban Timing Priority Cost Lead(s)
i) Prohibit housing in flood risk/landslide prone areas
APH1.1 Enforce planning scheme compliance
through community structures 1, 8, 10 S.T. High $$$$ CDC
APH1.2 Effective town planning by HCC 1, 7, 8 S.T. High $$$$ HCC
APH1.3 Community education and
awareness raising around climate hazards 7, 8 S.T. High $$$$ MECCDM
APH1.4 Remove housing in at risk areas 1, 2, 9 M.T. High $$$$ MLHS
APH1.5 Develop and advocate local actions
based on the HURCAP & VAA 1, 10 S.T. High $$$$ CDC
APH1.6 Impose penalty fees for breaches of
building location code 1, 2, 8 M.T. Med $$$$ HCC
ii) Develop better quality housing
APH2.1 Identify low-cost housing options 2 M.T High $$$$ MLHS
APH2.2 Community-level housing plans 2, 10 M.T. Med $$$$ CDC
APH2.3 Identify financial support options 2, 10 S.T. Med $$$$ MLHS
APH2.4 Develop community by-laws 2, 8, 10 M.T. Med $$$$ CDC
iii) Increase number of households with land titles/registration
APH3.1 Land use & housing assessment 1, 2 S.T. High $$$$ MLHS
APH3.2 Deploy FTE across the community 1, 2, 10 M.T. High $$$$ MLHS
APH3.3 Legal enforcement of building code 2, 8 M.T. High $$$$ MLHS
APH3.4 Awareness raising of the issues 2, 7 M.T. Med $$$$ MLHS
iv) Improve road system
APH4.1 Infrastructure plan for roads 1, 3 M.T. High $$$$ MLHS
APH4.2 Technical support from SIG 3, 10 S.T. Med $$$$ MID

85
v) Improve sanitation & drainage
APH5.1 Community education and
awareness raising 4, 6, 7 M.T. High $$$$ SIWA
APH5.2 Enforce compliance through
community support 4, 7, 10 M.T. High $$$$ CDC
APH5.3 Local sanitation and drainage plan 1, 4, 10 S.T. Med $$$$ SIWA
APH5.4 Seek financial support 4, 10 S.T. Med $$$$ CDC
APH5.5 Technical support from HCC, SIWA,
SIG, UN, donors & civil society 4, 10 S.T. Med $$$$ SIG
APH5.6 Build septic tanks 3, 4, 6 L.T. High $$$$ MID
APH5.7 Build improved/resilient drop-pit
toilets 3, 4, 6 S.T. High $$$$ MID
vi) Improve rubbish disposal & waste management
APH6.1 HCC rubbish collection 4, 10 S.T. Med $$$$ HCC
APH6.2 Community awareness program 4, 7, 8 M.T. Med $$$$ MECCDM
APH6.3 Proper bins with road access 1, 4, 10 S.T. High $$$$ HCC
APH6.4 Waste legislation 1, 8, 10 M.T. High $$$$ HCC
APH6.5 Cleaning rules for poultry houses 1, 2, 4 S.T. Low $$$$ CDC
APH6.6 Proper fencing for livestock 3, 4, 6 M.T. Low $$$$ CDC
APH6.7 Consult authorities on health-
focused awareness raising options 4, 6, 7 S.T. Med $$$$ CDC
vii) Provide clean drinking water
APH7.1 Roll-out water tanks 2, 3, 4 M.T. High $$$$ MID
APH7.2 Installation of pipes by SIWA 3, 10 M.T. High $$$$ SIWA
APH7.3 Advocate for dam construction 1, 3, 10 L.T. Low $$$$ CDC
viii) Increase public health
APH8.1 Education on healthy lifestyles 6, 7 S.T. High $$$$ MHMS
APH8.2 Construct satellite health centres 3, 6, 10 M.T Med $$$$ MHMS
APH8.3 Public clean-up programme 4, 6, 10 S.T. Low $$$$ MECCDM
ix) Provide education on environmental risks
APH9.1 Community awareness raising 7, 9, 10 S.T. High $$$$ MECCDM
APH9.2 Enforce compliance through
community support 1, 8, 10 S.T. Low $$$$ CDC
x) Encourage a zero violence community
APH10.1 Stop home-brew production 8, 10 S.T Med $$$$ RSIP
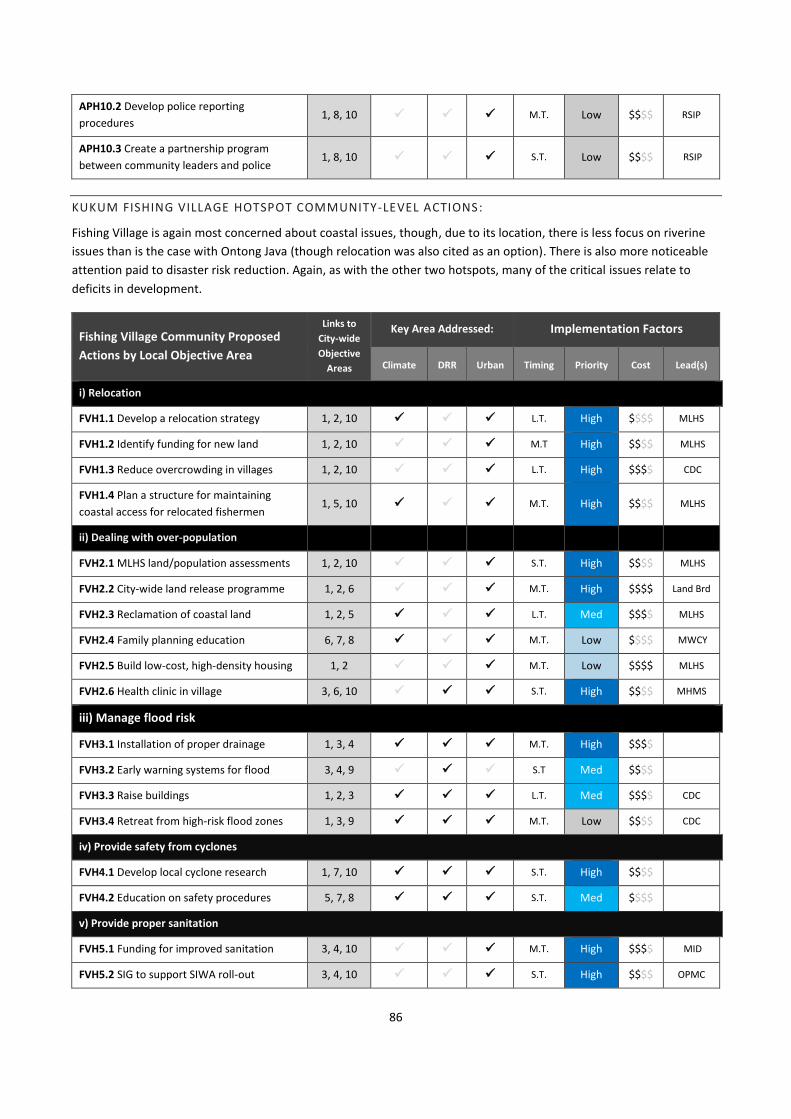
86
APH10.2 Develop police reporting
procedures 1, 8, 10 M.T. Low $$$$ RSIP
APH10.3 Create a partnership program
between community leaders and police 1, 8, 10 S.T. Low $$$$ RSIP
KUKUM FISHING VILLAGE HOTSPOT COMMUNITY-LEVEL ACTIONS:
Fishing Village is again most concerned about coastal issues, though, due to its location, there is less focus on riverine
issues than is the case with Ontong Java (though relocation was also cited as an option). There is also more noticeable
attention paid to disaster risk reduction. Again, as with the other two hotspots, many of the critical issues relate to
deficits in development.
Fishing Village Community Proposed
Actions by Local Objective Area
Links to
City-wide
Objective
Areas
Key Area Addressed: Implementation Factors
Climate DRR Urban Timing Priority Cost Lead(s)
i) Relocation
FVH1.1 Develop a relocation strategy 1, 2, 10 L.T. High $$$$ MLHS
FVH1.2 Identify funding for new land 1, 2, 10 M.T High $$$$ MLHS
FVH1.3 Reduce overcrowding in villages 1, 2, 10 L.T. High $$$$ CDC
FVH1.4 Plan a structure for maintaining
coastal access for relocated fishermen 1, 5, 10 M.T. High $$$$ MLHS
ii) Dealing with over-population
FVH2.1 MLHS land/population assessments 1, 2, 10 S.T. High $$$$ MLHS
FVH2.2 City-wide land release programme 1, 2, 6 M.T. High $$$$ Land Brd
FVH2.3 Reclamation of coastal land 1, 2, 5 L.T. Med $$$$ MLHS
FVH2.4 Family planning education 6, 7, 8 M.T. Low $$$$ MWCY
FVH2.5 Build low-cost, high-density housing 1, 2 M.T. Low $$$$ MLHS
FVH2.6 Health clinic in village 3, 6, 10 S.T. High $$$$ MHMS
iii) Manage flood risk
FVH3.1 Installation of proper drainage 1, 3, 4 M.T. High $$$$
FVH3.2 Early warning systems for flood 3, 4, 9 S.T Med $$$$
FVH3.3 Raise buildings 1, 2, 3 L.T. Med $$$$ CDC
FVH3.4 Retreat from high-risk flood zones 1, 3, 9 M.T. Low $$$$ CDC
iv) Provide safety from cyclones
FVH4.1 Develop local cyclone research 1, 7, 10 S.T. High $$$$
FVH4.2 Education on safety procedures 5, 7, 8 S.T. Med $$$$
v) Provide proper sanitation
FVH5.1 Funding for improved sanitation 3, 4, 10 M.T. High $$$$ MID
FVH5.2 SIG to support SIWA roll-out 3, 4, 10 S.T. High $$$$ OPMC

87
FVH5.3 Hygiene education program 4, 6, 7 S.T. Med $$$$ MHMS
FVH5.4 Awareness raising on health risks 4, 6, 7 M.T. Med $$$$ MHMS
FVH5.5 More public toilets 1, 3, 6 M.T. Low $$$$ HCC
vi) Provide access to drinking water
FVH6.1 Installation of public water taps 1, 3, 4 M.T. High $$$$ SIWA
FVH6.2 Installation of piping 1, 3, 4 M.T. High $$$$ SIWA
FVH6.3 Provision of water tanks 2, 3, 4 M.T. Med $$$$ MID
vii) Ensure proper rubbish disposal
FVH7.1 Proper landfill site 1, 3, 4 M.T Low $$$$ HCC
FVH7.2 HCC rubbish collection 1, 4, 10 S.T. High $$$$ HCC
FVH7.3 Remove upstream river pollution 4, 5, 6 S.T. Med $$$$ MECCDM
viii) Build protection from sea level rise & coastal erosion
FVH8.1 Build seawall 1, 3, 5 M.T. High $$$$ MID
FVH8.2 Sea breakers 1, 3, 5 M.T. Low $$$$ MID
ix) Reduce coastal pollution
FVH9.1 HCC wastewater treatment plant 1, 3, 4 M.T. High $$$$ HCC
FVH9.2 Clean up beach pollution 4, 5, 10 S.T. High $$$$ CDC
FVH9.3 Divert sewerage line 1, 3, 4 M.T. High $$$$ SIWA
x) Reduce risk of fire
FVH10.1 Buy generator/sea water pump 3, 4, 5 S.T. High $$$$ CDC
FVH10.2 HCC fire service infrastructure 1, 3, 9 M.T. Med $$$$ HCC
xi) Protect from tsunami
FVH11.1 NDMO warning system/siren 3, 7, 9 S.T. High $$$$ NDMO
FVH11.2 Community awareness program 7, 9, 10 S.T. Low $$$$ NDMO
xii) Protect from cyclone
FVH12.1 Plant mangroves 5, 9 S.T. Med $$$$ MECCDM
FVH12.1 Develop cyclone warning system 3, 7, 9 S.T. Med $$$$ NDMO
FVH12.3 Link community to NDMO 9, 10 M.T. Low $$$$ CDC

88
5. COMMUNICATION: AWARENESS RAISING AND EDUCATION
Being aware of current day vulnerabilities to shocks and stresses, and possible climate-related risks in the future, are
vital first steps in formulating adaptation responses and implementing actions that will enhance community resilience
(i.e. what are we adapting to?). The development of this urban resilience and climate adaptation action plan for
Honiara was therefore deliberately designed to be stakeholder-led, ensuring that traditional knowledge and local
experience not only informed the identification of key vulnerabilities but also contributed to an overarching resilience
framework and the compilation of local and city-wide actions (how are we going to adapt, and who will be responsible
for leadership?).
It was intended that this bottom-up approach would encourage local ownership of the action plan, as well as
contributing to the goals of the National Climate Change Policy on Education, Awareness and Capacity Building (8.7), in
particular the need to ‘strengthen the capacity and partnerships of national and provincial government agencies,
national institutions, NGOs, churches and all Solomon Island communities to undertake vulnerability and adaptation
and disaster risk reduction assessments for different sectors and geographic areas’.
Integrating the local knowledge base with the latest science was an important component in the development of the
Honiara action plan; this was founded on an understanding that looking solely to the past when planning for the future
is no longer an option given the significant new challenges that will be posed by a combination of urbanisation trends
and the impacts of global environmental change. Indeed, whilst local knowledge was valuable in informing community
discussions about recent weather events and current day development needs, scientific knowledge and data needed to
be introduced when considering future risks. This required, for example, the translation of complex – and uncertain
climate scenarios into formats that could be easily understood by a wide range of stakeholders. This integration of DRR,
immediate development needs, and CCA knowledge was a complicated process, though a necessary one to bring
together the consideration of multiple shocks and stresses within a comprehensive urban resilience framework of
action for the city.
Good facilitation was critical to support this assessment and planning process, to ensure that relevant information was
introduced and understood, and to provide a transparent platform for dialogue and knowledge sharing that was open
to a multitude of different voices. This recognises that planning for resilience is as much about creating spaces for
learning and the sharing of experiences as it is about the actual implementation of physical measures.
One important finding from the engagement process was the need to clearly differentiate between impacts which were
climate-driven (and hence could amplify over time due to the effects of climate change), those which were climate-
influenced, and those which were predominantly human-driven. Three different examples, drawn from the community
engagement process, highlight the importance of communicating the underlying drivers of impacts in order to raise
community awareness and to plan the interventions that will be most effective in the local context.
The first of these relates to the 2014 flood event that impacted the Mataniko River area most severely. Although there
was a significant rainfall event the severity of impacts were not a result of climate change per se, rather it can be
reasonably argued that a combination of human influences were the root cause of the disaster; including deforestation
in the upper reaches of the catchment allowing rapid run-off, large amounts of plastic waste blocking the drainage
channels, and the presence of informal settlers in the lower flood risk areas. Targeting action towards these human
factors will contribute to the reduction of risk to future heavy rain events.
The second example, showcasing climate influence, is that of excess heat at night. Whilst heat is a climate-related
hazard that is being influenced by climate change, this ‘urban’ problem is also being exaggerated by densification of
settlements and the blocking of breezes that have provided natural ventilation in the past. Recreating wind corridors
for affected settlements is therefore one possible remedial action.

89
The final example relates to ocean warming and increasing acidification. This is directly related to a warming world and
there is little that can be done to avoid the impacts on coral reefs that will become increasingly evident in the short-to-
medium term. Given the likely significant impacts on the marine environment once critical thresholds are passed,
resilience building responses will therefore need to consider livelihood diversification options for those most affected.
Bearing these three examples in mind, it is important that communication strategies ensure that clear messages about
climate change, and other drivers, are produced and disseminated to inform appropriate responses.
Whilst this resilience framework for action has been developed for Honiara using local knowledge; ongoing education,
awareness raising activities, and communication of climate (and non-climate) risks that impact on the resilience of the
city, continue to be needed. Communication is particularly important when engaging with those groups not normally
involved with decision-making processes or with those who are the most vulnerable to shocks in society e.g. informal
settlers, women, and youth. In such cases, key messages from this Action Plan – and other scientific sources - will need
to be distilled and disseminated using other more accessible formats in order for the findings to resonate more strongly
with local communities. It is not only a case of translating evidence from a scientific document to put messages across
in simpler English, resources will also need to be made available in the local Pidgin dialect to ensure that dissemination
of knowledge is widespread and accessible by all sections of Honiara’s communities.
Given local literacy rates there is also value in investigating modes of non-written communication to disseminate
information e.g. the use of radio shows to empower vulnerable groups, to embed climate risks and resilience into
theatre plays that travel between communities, and to educate school children about key resilience challenges (e.g.
integration of climate change into school curricula), are all innovative communication methods and tools that have
been used successfully in the Solomon Islands and the broader Pacific region in other contexts. In this regard, youth
groups offer great potential for training and introducing creative new ways of raising awareness across society in
Honiara.
Ultimately, effective communication is vital to raising the awareness of risks with individuals and communities, and
subsequently informing actions that strengthen city and community resilience. As noted, this can be in the context of
translating scientific information into formats suitable for local resilience planning, however improvements in
communication across departments of Government and between different levels of Government will also be of benefit
to the urban resilience agenda in Honiara.
Ward Councils - due to their closeness to day to day community life – are likely to have an important knowledge
brokerage role to play in communicating climate risks and supporting the implementation of adaptation measures at
the local scale. Building the capacity to act in this important awareness raising role will be needed, but local level
governance structures that connect most closely with local communities are important actors in progressing towards a
more resilient Honiara. As outlined in the National Climate Change Policy, ‘climate change will impact all sectors and
levels of society and (…) it is everyone’s business and shall be addressed in an integrated and holistic manner’.
Efforts at improving the communication of climate risks and support for public awareness raising campaigns need to be
a central component of the urban resilience and climate adaptation action plan. Building capacity to respond to shocks
and stresses, across all of Honiara society, is vital if actions are to be equitable and sustainable over time.

90
6. RESOURCING: OPTIONS & OPPORTUNITIES
Whilst knowledge about potential shocks and stresses is needed to inform resilience strengthening actions, in many
(though not all) instances the ability to act – particularly in relation to infrastructure interventions (e.g. the transport
network) - will be dependent on being able to access the necessary financial resources. Given its status as a Small Island
Developing State, accessing international funds will be one of the primary avenues for accessing finance for resilience
measures in Honiara and the Solomon Islands. Many national and international donor agencies and financing
organisations have a strong presence in the region, and offer opportunities for grants and loans for projects that
promote social, economic, and environmental well-being. These include national donors with an interest in the region,
such as USAID, Australian DFAT, NZAID and JICA, as well as regional and international funding bodies such as the Asian
Development Bank and the World Bank. It is therefore important that the SI Government continues to strengthen its
coordination with these donor and funding partners, to ensure that international bi-lateral funds can be mobilised in
support of the urban resilience agenda.
International multi-lateral funds for climate change programmes are also available through high-level mechanisms. One
example is the Adaptation Fund, set up as a result of the Kyoto Protocol and financed through contributions to the
Clean Development Mechanism. UN-Habitat is accredited as an implementing agency for this scheme. Indeed, the
Solomon Islands was a former recipient of such funds in 2011 for a climate adaptation programme focusing on the
agricultural sector, in a multi-lateral relationship with UNDP.
More recently, a new Green Climate Fund (GCF) - under the auspices of the UN Framework Convention on Climate
Change - has been introduced to support adaptation and mitigation efforts in developing countries. This became
operational in May 2015, shortly before the Conference of the Parties in Paris (COP21).The GCF is intended to ‘promote
the paradigm shift towards low-emission and climate-resilient development pathways by providing support to
developing countries to limit or reduce their greenhouse gas emissions and to adapt to the impacts of climate change,
taking into account the needs of those developing countries particularly vulnerable to the adverse effects of climate
change. National ownership is intended to be central to the GCF approach’.
In November 2015, the GCF approved USD 169 million for the first eight projects, which included two private sector and
two mitigation projects, and six public sector projects focusing on adaptation or crosscutting mitigation and
adaptation. Fiji was awarded one of these initial projects, with a focus on urban water supply and wastewater
management. Once the substantive funding pledges by the developed countries are met, it is expected that the GCF will
become the main multilateral financing mechanism for poorer countries to support their climate actions. According to
their mandate, ‘all developing country Parties to the Convention are eligible to receive resources from the GCF. The
GCF gives recipient countries access to funding through accredited national, sub-national and regional implementing
entities and intermediaries (including NGOs, government ministries, national development banks, and other domestic
or regional organizations that can meet the Fund’s standards). Countries can also access funding through accredited
international and regional entities (such as multilateral and regional development banks and UN agencies) under
international access. Private sector entities can also be accredited as implementing entities’.
The Secretariat for the Pacific Regional Environment Program (SPREP) was awarded the status of regional accredited
entity for the GCF in 2015, and will play an important intermediary role for the Solomon Islands and the wider Pacific
region in accessing these new funds in the short term.
Adaptation measures needed to reduce vulnerability and enhance community resilience in Honiara, as identified by
local communities themselves, have been used to populate this urban resilience and climate action plan. As such, the
HURCAP provides a valuable and up-to-date evidence-base in support of applications that aim to access international
funds through both bi-lateral and multi-lateral financial mechanisms.

91
Although international finance will obviously be of enormous benefit to progressing the urban resilience agenda in
Honiara, it is also important to recognise that there are many other resilience strengthening opportunities available
that can be acted upon, at least to some degree, without outside assistance. Indeed, many of the actions that have
been identified – urban planning, informal settlements, water, sanitation and waste – fall under the remit of urban
development and have already been earmarked for action as part of the Honiara City Council Five-Year Strategic Plan.
In other instances, mainstreaming of climate change considerations may be needed e.g. ensuring climate resilient
development in respect of new infrastructure and housing. Again, such actions are relevant to the National Climate
Change Policy and can form the basis of cross-cutting policies.
Finally, there are numerous opportunities that can be considered ‘low-lying fruit’ and could be the subject of early
attention, particularly in relation to adaptation as a ‘process’. Low-cost initiatives could include a range of capacity
building measures (particularly targeting vulnerable groups, harnessing the potential of youth, etc.), as well as efforts to
improve local governance arrangements and partnerships for a more resilient Honiara.
In terms of capacity building, there would also be value in exploring the role of local universities to support capacity
building initiatives; including the potential for new teaching, learning and research partnerships with other universities
in the region. Taking advantage of such ‘bottom-up’ opportunities have already been recognised in the National Climate
Change Policy which highlights the need to ‘promote and implement community based programmes and actions within
a cooperative framework to strengthen social capital, skills and resilience as an adaptation strategy’.
The Urban Resilience and Climate Action Plan for Honiara has not only collated a portfolio of actions for the city it also
provides a useful overarching framework which can act as a coordinating mechanism for multiple, previously discrete,
projects in Honiara. Each individual project can potentially add value to Honiara’s goal of increased resilience (at little
or no cost to HCC or government departments), and can be mapped and integrated with the HURCAP where possible
and relevant.
For instance, given the city’s continuing development needs, WASH programmes and projects implemented by NGOs
can be referred to in the context of ‘water, sanitation and waste’ theme. Ongoing work by UN-Habitat as part of the
Participatory Slum Upgrade Program (PSUP) seeks to strengthen community, city, and national key stakeholders’
capacities in participatory slum upgrading, and can make valuable contributions to the ‘urban planning and land
development’ theme. A new five-year programme ‘Pacific Ecosystem-based Adaptation to Climate Change’,
implemented by SPREP, will also get underway in 2016 with Honiara as a case study, and can contribute to resilience
responses under the ‘Ecosystem Services’ theme.
Furthermore, longer term engagement (as is the case with both the existing UN-Habitat and SPREP projects) can help to
build the capacity of local communities to plan and implement vulnerability assessments and locally-specific action
plans. Clearly, there are a multitude of opportunities to promote urban resilience actions and messages without the
need for substantive new funds. However, effective coordination of these different activities will be crucial to ensure
maximum impact on the ground.
Finally, being part of regional and international networks can enable Honiara to benefit from shared experiences in the
planning and implementing of resilience measures at low cost, and even in some cases with a level of financial and
administrative support. As well as being part of the UN-Habitat Cities and Climate Change Initiative, HCC is also
represented on the ICLEI regional network for Oceania, and submitted a joint application with Port Vila (Vanuatu) at the
end of 2015 to become one of the Rockefeller 100 Resilient Cities (though was unfortunately unsuccessful). Being
involved in international urban networks such as these can foster new opportunities for improved resilience planning,
action, and local capacity building.

92
7. MONITORING & EVALUATION
Resilience needs to be understood as a dynamic characteristic of a city; one that will continue to change as a
consequence of urbanization processes and local and global environmental change. Hence, monitoring and evaluation
will be needed to measure the progress of HURCAP actions, to look for opportunities to improve processes and
implementation, and also to ensure that the action plan keeps pace with rapid change in the urban environment.
It is recommended that monitoring activity accounts not only for the implementation – and effectiveness – of actions,
but also the processes involved. This will contribute to transparency of the HURCAP, as well as providing a regular
assessment of how well issues of equity are being addressed e.g. gender balance, involvement of local communities in
decision-making etc. To this end, it would be useful to develop and maintain an urban resilience database that is able to
document activity, store disaggregated data, monitor processes, and evaluate the success of implemented actions.
Ownership of the HURCAP is led by a high-level collaboration between HCC, MLHS and MECCDM, evidenced by a cross-
government strategic management team responsible for providing leadership of the urban resilience agenda. However,
given that there are many opportunities for resilience strengthening at the local level it is also important that effective
communication and feedback mechanisms are established between the HURCAP management team and a range of
different local actors, from ward councillors through to civil society groups. As with the National Climate Change Policy,
a similar requirement for all Government agencies, NGOs, churches, private sector organizations and communities that
are involved with implementing programmes and projects, to register and provide annual reports should be considered
as a mechanism for coordinating and monitoring the progress of resilience actions.
Promoting an effective urban resilience strategy for Honiara will require a regular assessment of related activity. It is
therefore also recommended that an annual monitoring report on processes and outcomes is produced and
disseminated to all partners and interested parties, with opportunities for feedback and suggestions for improvements.
As is common practice, an evaluation of the implementation of HURCAP after a five year period will also be needed to
gauge effectiveness and efficiency against the objectives and actions that have been set out in this first urban resilience
and climate adaptation action plan for the city.

93
8. REFERENCES
ADB (2014) Solid Waste Management in the Pacific: Solomon Islands Country Snapshot
http://www.adb.org/sites/default/files/publication/42662/solid-waste-management-solomon-islands.pdf
CLGF (2012) CLGF in the Pacific
http://www.clgfpacific.org/userfiles/1/files/Solomon%20Islands%20local%20government%20profile%202011-12.pdf
Doherty, T. J. & S. D. Clayton (2011) The psychological impacts of global climate change, American Psychologist, 66, 265-276.
JICA (2014) Preparatory survey for Kukum Highway Upgrade project in the Solomon Islands
http://open_jicareport.jica.go.jp/pdf/12184222_01.pdf
Lal, P. N., & Thurairajah, V. (2011) Making informed adaptation choices: A case study of climate proofing road infrastructure in the
Solomon Islands. Retrieved from: https://www.environment.gov.au/system/files/resources/67fb2472-ae17-4b88-adb6-
62a0c0859940/files/iucn-infrastructure-solomon-islands-case-study.pdf
Ministry of Environment Climate Change Disaster Management and Meteorology (MECDM) (2012) Solomon Islands National Climate
Change Policy 2012-2017. Retrieved from http://www.gcca.eu/sites/default/files/catherine.paul/si_climate_change_policy.pdf
Ministry of Lands Housing & Survey (MLHS), & Honiara City Council (HCC) (2015) Honiara Local Planning Scheme 2015. Honiara,
Solomon Islands. Retrieved from http://www.honiaracitycouncil.com/wp-content/uploads/2014/09/Honiara-Local-Planning-
Scheme-2015.pdf
Ministry of Mines, Energy and Rural Electrification (MMERE) (2014) Solomon Islands National Energy Policy
http://prdrse4all.spc.int/production/system/files/volume1_solomon_islands_national_energy_policy.pdf
OCHA (2014) Solomon Islands: Flash Floods - Humanitarian Snapshot (as of 25 June 2014). Retrieved from:
http://reliefweb.int/report/solomon-islands/solomon-islands-flash-floods-humanitarian-snapshot-25-june-2014
PACCSAP (2014) Climate Variability, Extremes and Change in the Western Tropical Pacific: New Science and Updated Country Reports
2014, Solomon Islands. http://www.pacificclimatechangescience.org/wp-
content/uploads/2014/07/PACCSAP_CountryReports2014_Ch13SolomonIs_WEB_140710.pdf
SIMS, BoM & CSIRO (2013) Current and future climate of the Solomon Islands http://www.pacificclimatechangescience.org/wp-
content/uploads/2013/06/13_PCCSP_Solomon_Islands_8pp.pdf
SINSO (2011) 2009 Census data by wards.
http://www.statistics.gov.sb/component/advlisting/?view=download&format=raw&fileId=413
SINSO (2015) Prism http://www.spc.int/prism/solomons/index.php/sinso-documents?view=download&fileId=114
SPC and SPREP (2015) Strategy for Climate and Disaster Resilient Development in the Pacific. SPC, Fiji. Retrieved from:
http://www.pacificdisaster.net/dox/SRDP_Executive_summary.pdf
Trundle & McEvoy (2015) Honiara socio-economic Atlas, unpublished dataset.
UN-Habitat (2014a) Climate Change Vulnerability Assessment, Honiara, Solomon Islands. Nairobi: United Nations Human Settlements
Programme.
UN-Habitat (2014b) Planning for Climate Change: A Strategic, Values-based Approach for Urban Planners - Guidance Document. (B.
Barth, M. A. Cea, L. Fee, K. Koch, L. Nesbitt, & V. Quinlan, Eds.) (1st ed.). Nairobi: United Nations Human Settlements Programme.
World Bank (2015a) Solomon Islands Rapid Employment Project Implementation Status and Results Report: Sequence 7.
World Bank (2015b) Disaster Risk Financing and Insurance - Country Note, Solomon Islands.

94
ma
The Honiara Urban Resilience and Climate Action Plan is the
culmination of a comprehensive and participatory process involving
national and local government, NGOs, informal settlement
communities, women’s and youth groups, academia and the private
sector. The plan sets out a portfolio of actions that can be
implemented by the City of Honiara and the Government of
Solomon Islands to directly contribute to urban resilience in the
national capital.
This document complements the Honiara Climate Change
Vulnerability Assessment, and addresses the complex situation
confronting climate change and urban resilience in Honiara. In
addition to actions that build resilience vis-à-vis climate variability
and other natural hazards the action plan incorporates current
vulnerabilities. Addressing immediate needs is therefore strongly
reflected in the Honiara Urban Resilience and Climate Action Plan.
UN-Habitat’s Cities and Climate Change Initiative promotes
enhanced climate change mitigation and adaptation in developing
country cities. This document is an output of the Cities and Climate
Change Initiative activities in support of the government and people
of Honiara, Solomon Islands.