hong kong’s expanding role as an offshore rmb centre peter pang deputy chief executive hong kong...
TRANSCRIPT

Hong Kong’s Expanding Role as an Hong Kong’s Expanding Role as an
Offshore RMB CentreOffshore RMB Centre
Peter PangDeputy Chief ExecutiveHong Kong Monetary Authority22 February 2011
Goldman Sachs Global Macro Conference
2
390
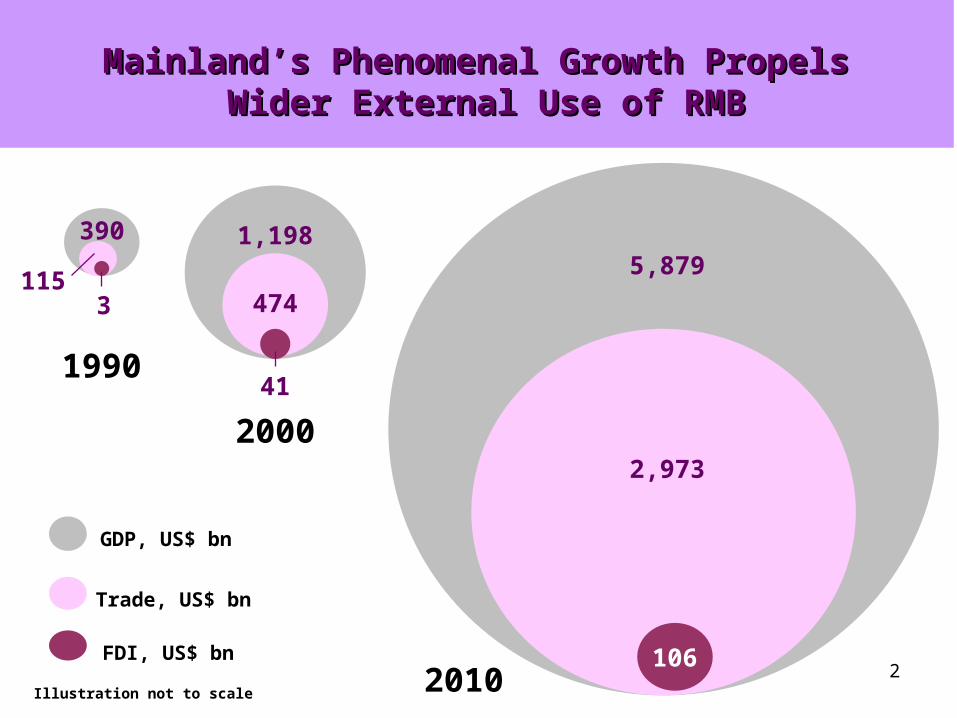
Mainland’s Phenomenal Growth Propels Mainland’s Phenomenal Growth Propels Wider External Use of RMBWider External Use of RMB
5,879
2,973
106
1,198
115
41
3 474
GDP, US$ bn
Trade, US$ bn
FDI, US$ bn
1990
2000
2010Illustration not to scale
3
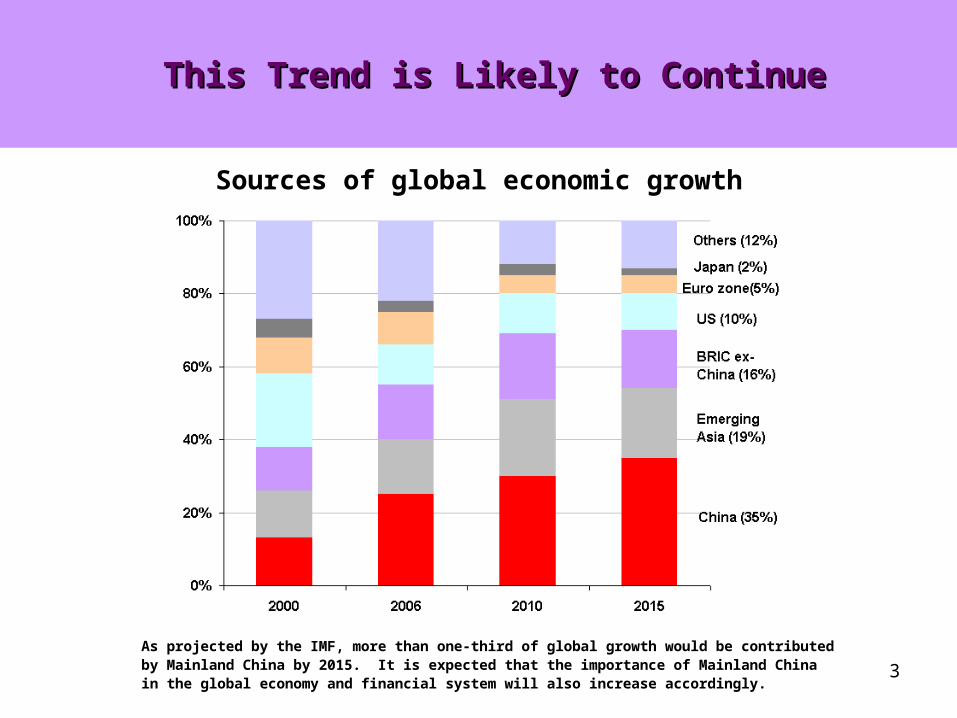
This Trend is Likely to ContinueThis Trend is Likely to Continue
As projected by the IMF, more than one-third of global growth would be contributed by Mainland China by 2015. It is expected that the importance of Mainland China in the global economy and financial system will also increase accordingly.
Sources of global economic growth
4
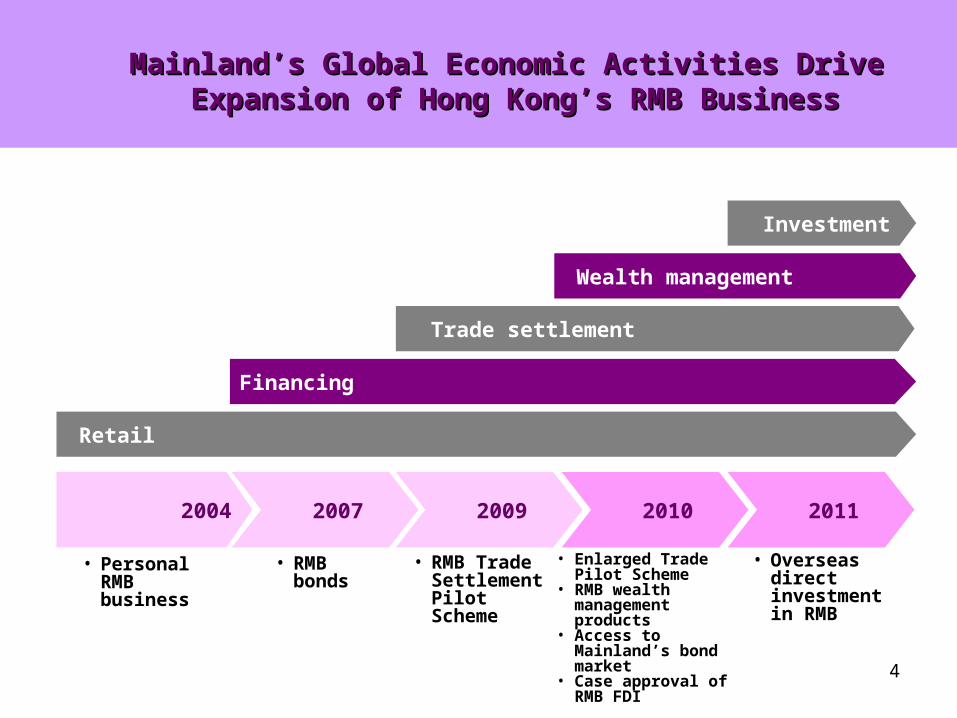
2007 2004
• Personal RMB business
• RMB bonds
• RMB Trade Settlement Pilot Scheme
• Enlarged Trade Pilot Scheme
• RMB wealth management products
• Access to Mainland’s bond market
• Case approval of RMB FDI
Retail
Financing
Trade settlement
Mainland’s Global Economic Activities Drive Mainland’s Global Economic Activities Drive Expansion of Hong Kong’s RMB BusinessExpansion of Hong Kong’s RMB Business
2009 2010 2011
• Overseas direct investment in RMB
Wealth management
Investment
5
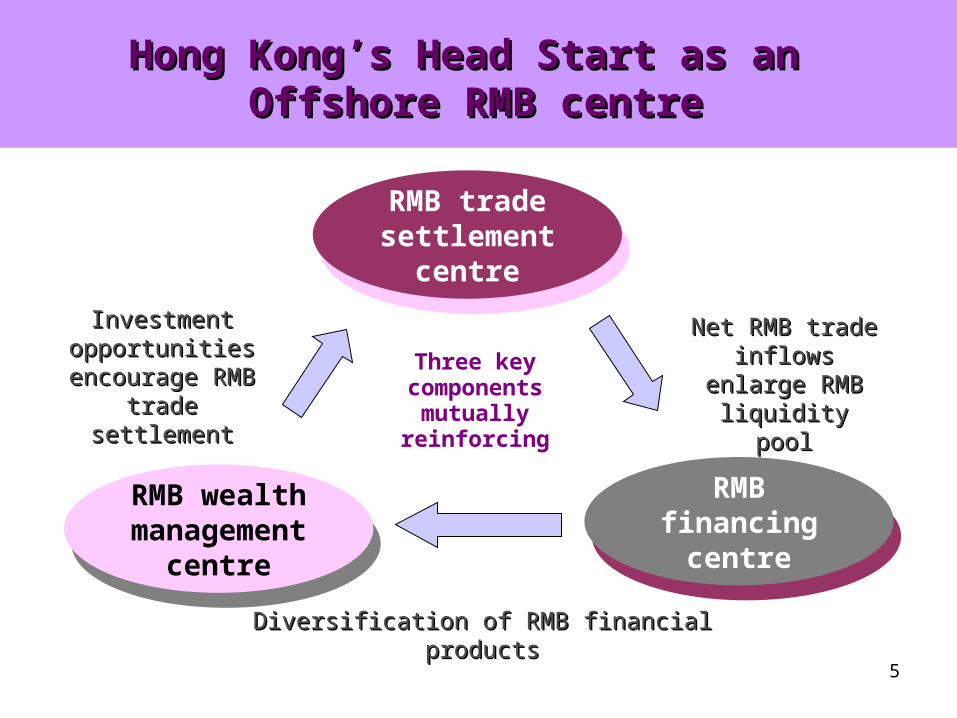
Hong Kong’s Head Start as an Hong Kong’s Head Start as an Offshore RMB centreOffshore RMB centre
Three key components mutually
reinforcing
Net RMB trade Net RMB trade inflows enlarge inflows enlarge
RMB liquidity poolRMB liquidity pool
Diversification of RMB financial productsDiversification of RMB financial products
Investment Investment opportunities opportunities
encourage RMB encourage RMB trade settlementtrade settlement
RMB trade settlement
centre
RMB wealth management
centre
RMB financing
centre
6
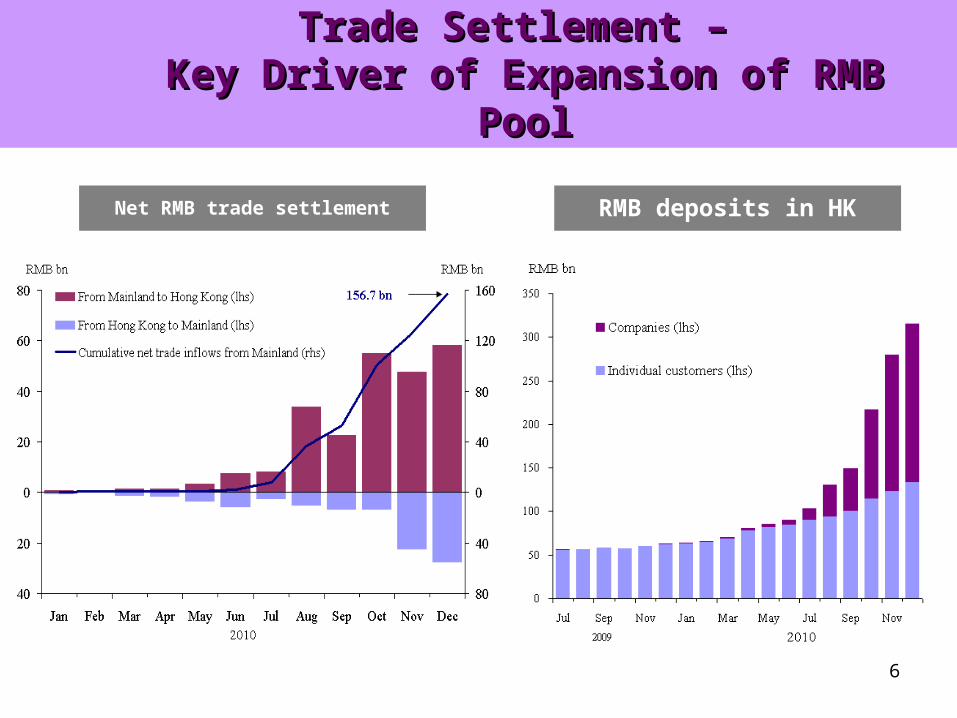
Trade Settlement – Trade Settlement – Key Driver of Expansion of RMB PoolKey Driver of Expansion of RMB Pool
RMB deposits in HKNet RMB trade settlement
7
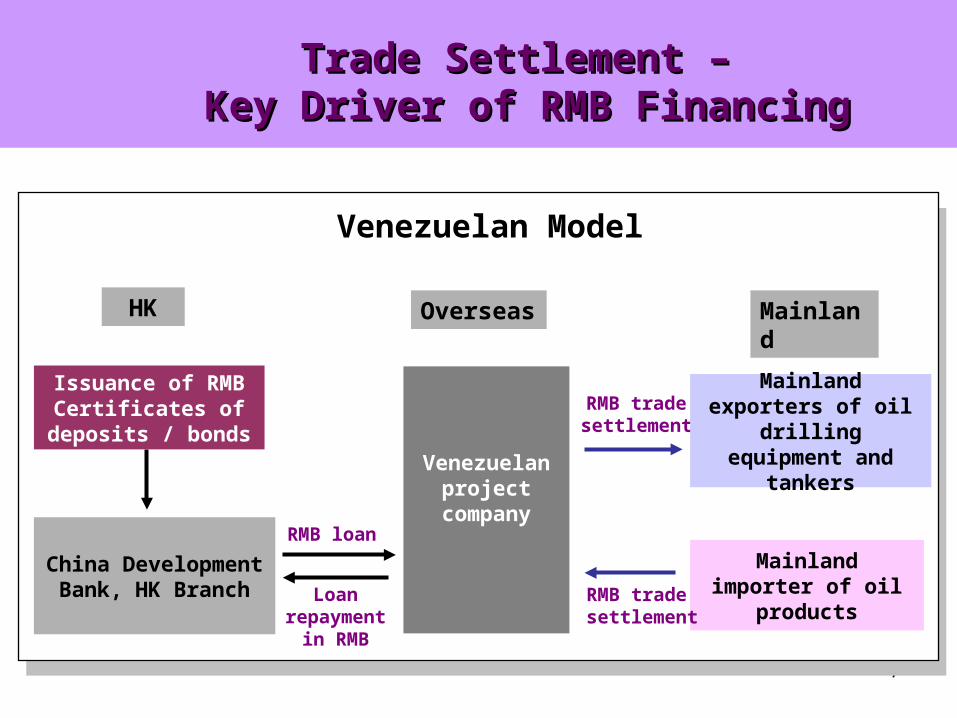
Trade Settlement – Trade Settlement – Key Driver of RMB FinancingKey Driver of RMB Financing
RMB trade settlement
Mainland importer of oil products
Venezuelan project
company
Mainland exporters of oil drilling equipment
and tankers
RMB loan
RMB trade settlement
China Development Bank, HK Branch
MainlandOverseasHK
Issuance of RMB Certificates of
deposits / bonds
Loan repayment in
RMB
Venezuelan Model
8
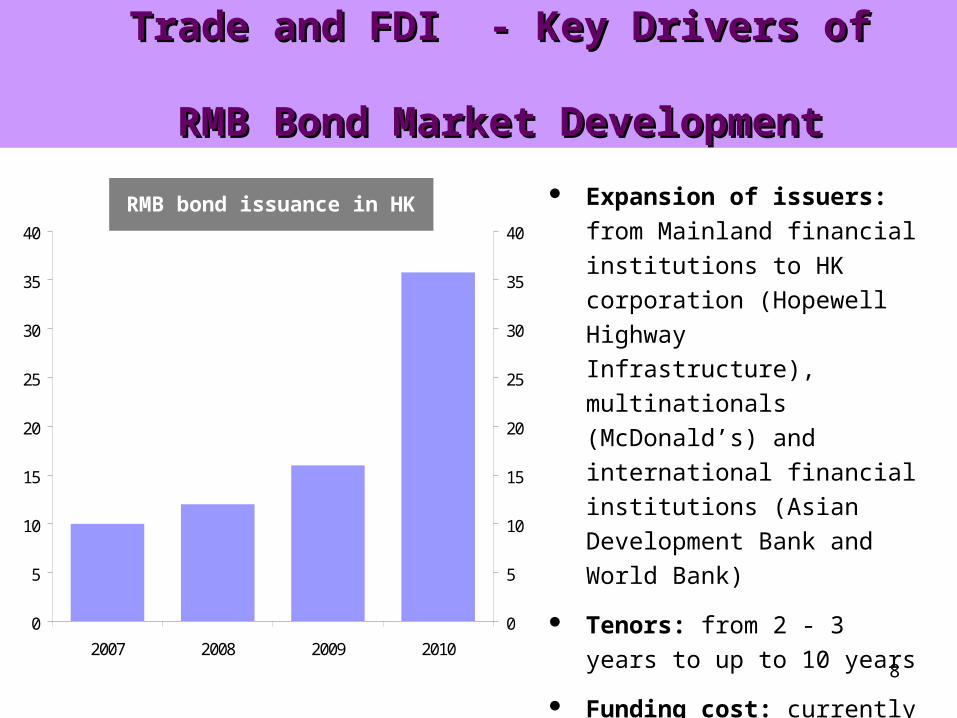
Trade and FDI - Key Drivers of Trade and FDI - Key Drivers of RMB Bond Market DevelopmentRMB Bond Market Development
Expansion of issuers: from
Mainland financial institutions
to HK corporation (Hopewell
Highway Infrastructure),
multinationals (McDonald’s)
and international financial
institutions (Asian Development
Bank and World Bank)
Tenors: from 2 - 3 years to up
to 10 years
Funding cost: currently lower
than that in the onshore market0
5
10
15
20
25
30
35
40
2007 2008 2009 2010
0
5
10
15
20
25
30
35
40
RMB bn RMB bnRMB bond issuance in HK

9
Further reinforcing two-way cross border flow of RMB and the link between offshore RMB market with China’s real
economic activities
The Next Development Focus – The Next Development Focus – RMB Direct InvestmentRMB Direct Investment
Mainland
Hong Kong
RMB trade
settlement
by
Mainland
importers
RMB
Outward
Direct
Investment
RMB
Foreign
Direct
Investment
RMB trade
settlement
by
Mainland
exporters
10
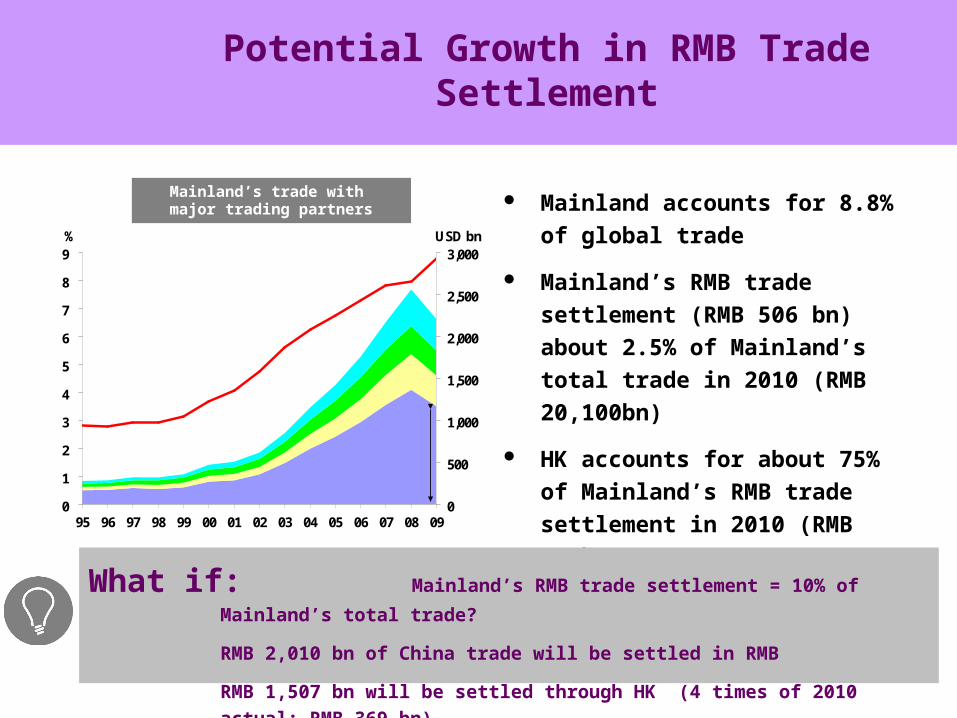
Potential Growth in RMB Trade Settlement
Mainland accounts for 8.8% of
global trade
Mainland’s RMB trade settlement
(RMB 506 bn) about 2.5% of
Mainland’s total trade in 2010
(RMB 20,100bn)
HK accounts for about 75% of
Mainland’s RMB trade settlement
in 2010 (RMB 506bn)
What if: Mainland’s RMB trade settlement = 10% of Mainland’s total trade?
RMB 2,010 bn of China trade will be settled in RMB
RMB 1,507 bn will be settled through HK (4 times of 2010 actual: RMB 369 bn)
0
1
2
3
4
5
6
7
8
9
95 96 97 98 99 00 01 02 03 04 05 06 07 08 09
USD bn
0
500
1,000
1,500
2,000
2,500
3,000%
China's trade value as ashare of world total (lhs)
Asia
EU
US
Others
8.8%
1,172(53.1%)
Mainland’s trade with major trading partners
11
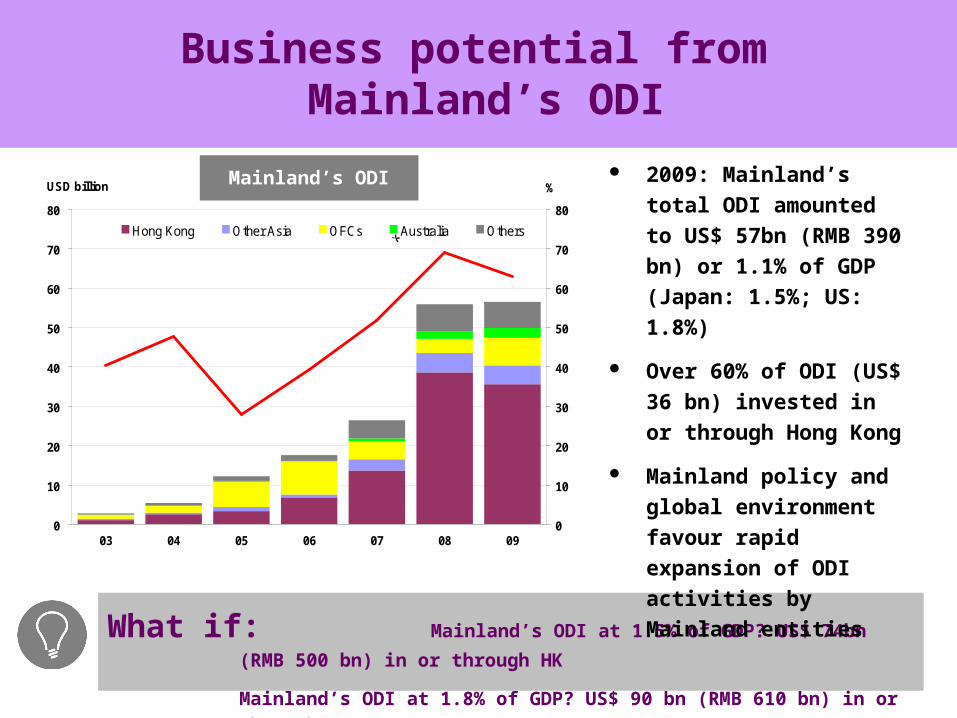
What if: Mainland’s ODI at 1.5% of GDP? US$ 74bn (RMB 500 bn) in or through HK
Mainland’s ODI at 1.8% of GDP? US$ 90 bn (RMB 610 bn) in or through HK
Business potential from Mainland’s ODI
0
10
20
30
40
50
60
70
80
03 04 05 06 07 08 09
USD billion
0
10
20
30
40
50
60
70
80
%
Hong Kong Other Asia OFCs Australia Others
Share of Hong Kong(rhs)
(lhs)
Mainland’s ODI
*
2009: Mainland’s total ODI
amounted to US$ 57bn
(RMB 390 bn) or 1.1% of
GDP (Japan: 1.5%; US:
1.8%)
Over 60% of ODI (US$ 36
bn) invested in or through
Hong Kong
Mainland policy and
global environment favour
rapid expansion of ODI
activities by Mainland
entities
12
0
20
40
60
80
100
120
86 88 90 92 94 96 98 00 02 04 06 08
USD billion
0
10
20
30
40
50
60
70
80
90
100
%
Hong Kong Virgin Islands Japan US Others
Share of Hong Kong (rhs)
(lhs)
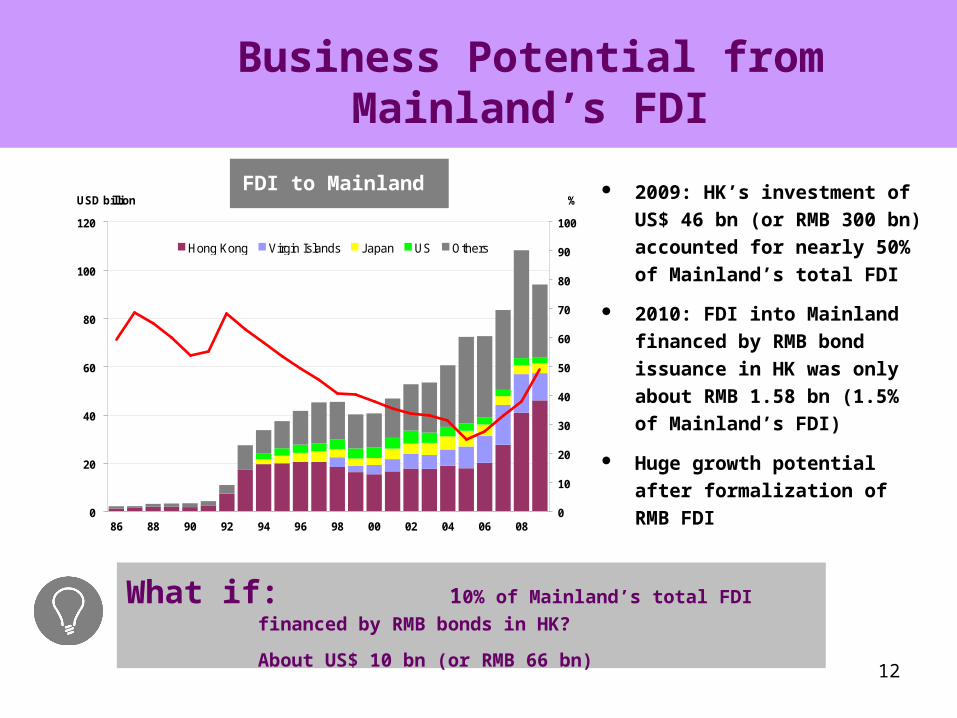
Business Potential fromMainland’s FDI
FDI to Mainland 2009: HK’s investment of
US$ 46 bn (or RMB 300 bn)
accounted for nearly 50% of
Mainland’s total FDI
2010: FDI into Mainland
financed by RMB bond
issuance in HK was only
about RMB 1.58 bn (1.5% of
Mainland’s FDI)
Huge growth potential after
formalization of RMB FDI
What if: 10% of Mainland’s total FDI financed by RMB bonds in HK?
About US$ 10 bn (or RMB 66 bn)

13
Multi-currency and multi-functional financial platform Buy / sell RMB of reasonable size Unique RMB RTGS clearing platform outside Mainland Unique RMB conversion window Growing and largest pool of RMB liquidity outside of
Mainland The only RMB bond market outside Mainland Dual channel for trade settlement: Clearing Bank and a
large network of Correspondent Banks Increasing range of RMB financial products outside
Mainland
Why Hong Kong