hong kong banking report 2018 - assets.kpmg · hang seng’s nim improved to 1.94 percent (an...
TRANSCRIPT
Hong Kong Banking Report 2018
kpmg.com/cn
Innovating for the future

ContentsIntroduction 3
Overview 4
Growth in Asia: Risk and regulatory considerations 14
Raising the standard of conduct in global wholesale markets 16
The Belt and Road Initiative: Hong Kong banks to play a key role 22
Managed Services: the way forward 26
Strengthening Hong Kong’s role as a regional booking centre 28
An increasing focus on best execution 30
Welcoming the development of virtual banks in Hong Kong 32
Embracing change to drive effective compliance 34
Unlocking the power of data to combat financial crime 36
A digitally-enabled approach to Non-Financial Regulatory Reporting 38
Integrating cybersecurity into a broader digital strategy 40
Cracking the code for a successful customer experience 42
Shaping the workforce of the future 46
Driving transformation with tax technology 48
Financial highlights and performance rankings 51
About KPMG 78
Contact us 79
2 | Hong Kong Banking Report 2018
© 2018 KPMG, a Hong Kong partnership and a member firm of the KPMG network of independent member firms affiliated with KPMG International Cooperative (“KPMG International”), a Swiss entity. All rights reserved.
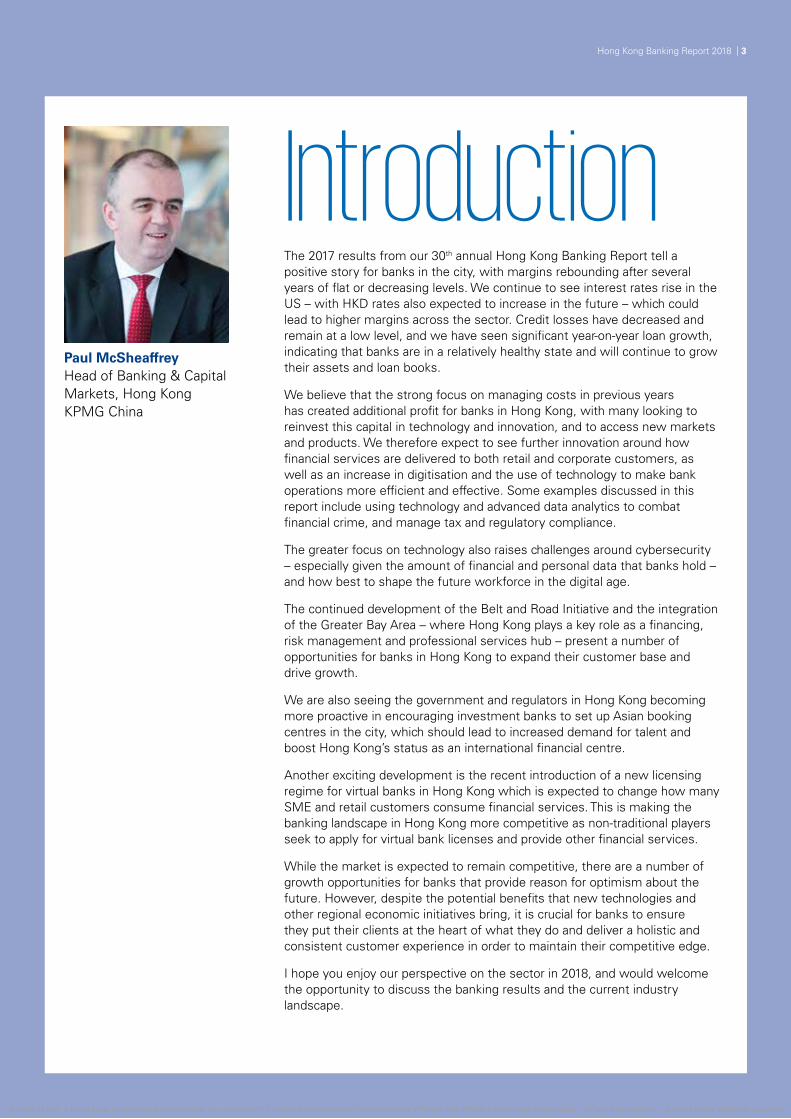
The 2017 results from our 30th annual Hong Kong Banking Report tell a positive story for banks in the city, with margins rebounding after several years of flat or decreasing levels. We continue to see interest rates rise in the US – with HKD rates also expected to increase in the future – which could lead to higher margins across the sector. Credit losses have decreased and remain at a low level, and we have seen significant year-on-year loan growth, indicating that banks are in a relatively healthy state and will continue to grow their assets and loan books.
We believe that the strong focus on managing costs in previous years has created additional profit for banks in Hong Kong, with many looking to reinvest this capital in technology and innovation, and to access new markets and products. We therefore expect to see further innovation around how financial services are delivered to both retail and corporate customers, as well as an increase in digitisation and the use of technology to make bank operations more efficient and effective. Some examples discussed in this report include using technology and advanced data analytics to combat financial crime, and manage tax and regulatory compliance.
The greater focus on technology also raises challenges around cybersecurity – especially given the amount of financial and personal data that banks hold – and how best to shape the future workforce in the digital age.
The continued development of the Belt and Road Initiative and the integration of the Greater Bay Area – where Hong Kong plays a key role as a financing, risk management and professional services hub – present a number of opportunities for banks in Hong Kong to expand their customer base and drive growth.
We are also seeing the government and regulators in Hong Kong becoming more proactive in encouraging investment banks to set up Asian booking centres in the city, which should lead to increased demand for talent and boost Hong Kong’s status as an international financial centre.
Another exciting development is the recent introduction of a new licensing regime for virtual banks in Hong Kong which is expected to change how many SME and retail customers consume financial services. This is making the banking landscape in Hong Kong more competitive as non-traditional players seek to apply for virtual bank licenses and provide other financial services.
While the market is expected to remain competitive, there are a number of growth opportunities for banks that provide reason for optimism about the future. However, despite the potential benefits that new technologies and other regional economic initiatives bring, it is crucial for banks to ensure they put their clients at the heart of what they do and deliver a holistic and consistent customer experience in order to maintain their competitive edge.
I hope you enjoy our perspective on the sector in 2018, and would welcome the opportunity to discuss the banking results and the current industry landscape.
Paul McSheaffreyHead of Banking & Capital Markets, Hong KongKPMG China
Introduction
Hong Kong Banking Report 2018 | 3
© 2018 KPMG, a Hong Kong partnership and a member firm of the KPMG network of independent member firms affiliated with KPMG International Cooperative (“KPMG International”), a Swiss entity. All rights reserved. © 2018 KPMG, a Hong Kong partnership and a member firm of the KPMG network of independent member firms affiliated with KPMG International Cooperative (“KPMG International”), a Swiss entity. All rights reserved.

1 The analysis is based on financial institutions registered with the Hong Kong Monetary Authority.2 The top 10 locally incorporated licensed banks mentioned in this article are the 10 banks with the highest total assets among all
locally incorporated banks as at 31 December 2017.3 NIM is either quoted from public announcements of financial statements, or calculated based on annualised net interest income
and interest-bearing assets or total assets, depending on the availability of information.
Paul McSheaffreyHead of Banking & Capital Markets, Hong Kong, KPMG China
Rita WongPartner, Financial ServicesKPMG China
Terence FongPartner, Financial ServicesKPMG China
2017 was a strong year for Hong Kong’s banking sector, with notable growth driven by robust exports and strong domestic demand, as well as an increase in global expansion. The Hong Kong economy grew by 3.8 percent in 2017, compared to 2.1 percent in 2016. This is also reflected in the strong performance of the city’s banking sector. Total assets of all licensed banks grew by 8.1 percent, compared to 5.6 percent in 2016. The operating profit before impairment charges of all licensed banks also increased by 13 percent to HK$229 billion from HK$203 billion in 2016.
Hong Kong’s prominent role in facilitating China’s 13th Five-Year Plan, the Belt and Road Initiative and the Greater Bay Area, as well as the surge in digital innovation, present significant growth opportunities for banks. Strong growth in loan portfolios, including to mainland Chinese entities, and improved net interest margins resulted in robust revenue growth. Overall credit quality improved with impaired loan ratios and cost-to-income ratios decreasing in 2017. This has generally led to higher profitability for banks in Hong Kong compared to 2016.
In this report, we present an analysis1 of some key metrics for the top 10 locally incorporated licensed banks2 in Hong Kong. Please note that we have conducted this analysis on a legal entity basis, and where banks have a dual entity structure in Hong Kong (e.g. a branch and an incorporated authorised institution) we have not combined the results.
Net interest marginFollowing the three interest rate hikes by the US Federal Reserve in March, June and December 2017, the Hong Kong Monetary Authority (HKMA) adjusted the Base Rate upward from 1 percent in 2016 to 1.75 percent in 2017. However, retail deposit rates for banks in Hong Kong remained low during 2017, resulting in a slower increase of funding costs. This contributed to the improved net interest margin (NIM)3 and profitability of the surveyed banks in 2017.
Overview
4 | Hong Kong Banking Report 2018
© 2018 KPMG, a Hong Kong partnership and a member firm of the KPMG network of independent member firms affiliated with KPMG International Cooperative (“KPMG International”), a Swiss entity. All rights reserved.

4 HSBC consolidated results include Hang Seng and its other Asia operations.
5 Hang Seng 2017 Annual Report - p.27, https://www.hangseng.com/cms/fin/file/statement/ar_2017_
full_en.pdf6 HSBC 2017 Annual Report and Accounts - p.10, http://www.personal.hsbc.com.hk/1/PA_esf-ca-app-content/
content/about/financial-information/regulatory-disclosures/pdf/HBAP_ARA_2017_e.pdf
7 CITIC 2017 Annual Report - p.21, https://www.cncbinternational.com/_document/about-us/
interim-and-annual-reports/en/2017/annual_report.pdf8 ICBC (Asia) 2017 Annual Report – p.137-138, http://v.icbc.com.cn/userfiles/Resources/ICBC/haiwai/Asia/
download/EN/2018/annual_report_en18.pdf
0%
1%
2% 1.94%1.88%
1.73%1.65% 1.59% 1.57% 1.56%
1.27%
1.02%1.15%
Hang
Seng
HSBCCITI
CBEA
Nanya
ngDBS
BOC (HK)
SCB
ICBC (A
sia)
CCB (Asia
)
2017 2016
Source: Extracted from individual banks’ financial and public statements
Net interest margin
The average NIM across the surveyed licensed banks increased by 6 basis points compared to 2016. In comparison, the average NIM for the top 10 licensed banks for 2017 increased to 1.54 percent from 1.43 percent in 2016, with nine out of the top 10 banks posting an increase in NIM. Hang Seng Bank Limited (Hang Seng) and The Hongkong and Shanghai Banking Corporation Limited (HSBC)4 had the highest NIM among the top 10 locally licensed banks as at 31 December 2017.
Hang Seng’s NIM improved to 1.94 percent (an increase of 9 basis points compared from 2016), mainly driven by the optimisation of its asset and liability structure and a wider customer deposit spread as interest rates rose.5 HSBC’s NIM stood at 1.88 percent (an increase of 13 basis points from 2016), mainly due to higher margins from its Hong Kong and mainland China activities. Despite the lending spread in mainland China narrowing, HSBC’s NIM in mainland China increased, driven by a higher yield from portfolio mix changes, and a higher re-investment yield coupled with lower funding costs. In Hong Kong, the bank’s improved NIM was driven by wider customer deposit spreads and higher re-investment yields, coupled with a change in its asset portfolio mix.6
Among the top 10 locally incorporated banks, China CITIC Bank International Limited (CITIC) recorded the largest increase in NIM (26 basis points), while the NIM of Industrial and Commercial Bank of China (Asia) Limited (ICBC (Asia)) remained flat in 2017 compared to 2016.
CITIC’s NIM increased from 1.47 percent in 2016 to 1.73 percent in 2017, primarily due to closer collaboration with its parent bank and higher asset yields.7
The flat NIM experienced by ICBC (Asia) appears to be due to a decrease in the ratio of interest-bearing assets with long-term maturity, which tend to carry higher interest rates, to total assets. The ratio of long-term maturity assets to total assets decreased from 6.55 percent in 2016 to 6.13 percent in 2017.8
With US interest rates likely to continue to increase in 2018, we expect that interest rates in Hong Kong will rise as currency flows out and narrows the gap between US Dollar and HK Dollar interest rates.
Hong Kong Banking Report 2018 | 5
© 2018 KPMG, a Hong Kong partnership and a member firm of the KPMG network of independent member firms affiliated with KPMG International Cooperative (“KPMG International”), a Swiss entity. All rights reserved. © 2018 KPMG, a Hong Kong partnership and a member firm of the KPMG network of independent member firms affiliated with KPMG International Cooperative (“KPMG International”), a Swiss entity. All rights reserved.

9 Cost-to-income ratio is calculated as total operating expenses divided by total operating income.
10 CITIC 2017 Annual Report - p.14, https://www.cncbinternational.com/_document/about-us/
interim-and-annual-reports/en/2017/annual_report.pdf11 BEA 2017 Annual Report - p. 6, https://www.hkbea.com/pdf/en/about-bea/investor-
communication/annual-and-interim-reports/2017/E_2017%20Annual%20Report.PDF
12 HSBC Annual Report 2017 - p.10, http://www.personal.hsbc.com.hk/1/PA_esf-ca-app-content/
content/about/financial-information/regulatory-disclosures/pdf/HBAP_ARA_2017_e.pdf
Cost-to-income ratios
0%
10%
20%
30%
40%
50%
60%
70%
23.4%
28.4%30.5%
38%40.3% 41.5% 43.5%
47.4%
65.3%
50.0%
ICBC (A
sia)
BOC (HK)
Hang
Seng
Nanya
ng
CCB (Asia
)
CITIC
HSBCDBS
BEASCB
2017 2016
Source: Extracted from individual banks’ financial and public statements
CostsDigitisation and automation continue to be a key focus for banks to manage costs and improve customer experience. A number of banks indicated that they increased their spending on innovation in 2017. Total operating costs of the surveyed licensed banks in Hong Kong increased by 6.8 percent. However, there was an improvement in the overall average cost-to-income ratio9 of the surveyed banks compared to 2016, as income increased by a greater amount. The average cost-to-income ratio of the surveyed banks for the year ended 2017 stood at 42.5 percent, compared to 47.9 percent in 2016.
The total operating income of the top 10 surveyed banks increased by 10.4 percent, partially offset by a 6.9 percent increase in total operating expenses. The average cost-to-income ratio of these top 10 banks improved to 40.8 percent in 2017, compared to 43.0 percent in 2016.
CITIC recorded the largest increase in operating costs (12.7 percent) in 2017, mainly due to its continued investment in human resources and technology to match the growth of its new business. Its cost-to-income ratio fell by 3.6 percentage points to 40.3 percent due to robust growth in income.10 Among the top 10 surveyed banks, The Bank of East Asia, Limited (BEA) recorded the largest decrease in operating costs of 1.7 percent and decrease in cost-to-income ratio of 8 percentage points during 2017. The bank is in the second year of a three-year cost saving plan.11
HSBC recorded an 8.4 percent increase in operating costs, driven by IT, professional and consultancy expenses to support business growth, coupled with higher staff costs and investments in regulatory and compliance programmes.12
Among the top 10 locally incorporated banks, Standard Chartered Bank (Hong Kong) Limited (SCB) recorded the most significant increase in its cost-to-income ratio and continued to have the highest cost-to-income ratio of 65.3 percent in 2017. SCB’s cost-to-income ratio increased by 4.5 percentage points, mainly attributed to its 12.5 percent increase in operating expenses, compared to its 4.8 percent increase in operating income. ICBC (Asia) continued to have the lowest cost-to-income ratio of 23.4 percent in 2017, although its cost-to-income ratio rose by 1.3 percentage points from 2016.
We expect the trend of increasing investment in technology and innovation to continue in the short to medium term.
6 | Hong Kong Banking Report 2018
© 2018 KPMG, a Hong Kong partnership and a member firm of the KPMG network of independent member firms affiliated with KPMG International Cooperative (“KPMG International”), a Swiss entity. All rights reserved.

13 HSBC Annual Report 2017 - p.11, http://www.personal.hsbc.com.hk/1/PA_esf-ca-app-content/content/about/financial-information/regulatory-disclosures/pdf/HBAP_ARA_2017_e.pdf
Loans and advancesBanks’ total loans and advances increased in 2017, with many noting that this was due to the opportunities arising from the Belt and Road Initiative and the development of the Greater Bay Area. Strong demand in the property market also contributed to the increase in gross loans and advances. As at the end of 2017, the total loans and advances of the surveyed banks increased by 14.9 percent compared to 2016. This is a significant improvement compared to the previous year, where we noted a 3.4 percent increase in total loans and advances in 2016.
Total loans and advances reached HK$8,468 billion as at 31 December 2017, up from last year’s total of HK$7,371 billion. Commercial loans, mortgage lending and loans for use outside Hong Kong continue to represent 87 percent of total loans, consistent with 2016.
Commercial loans continue to be the largest portion of total loans and advances, accounting for 37.4 percent of the total, similar to the proportion in 2016. The second-largest portion is loans for use outside Hong Kong, accounting for 32.4 percent of total loans and advances, a slight increase from 31.6 percent in 2016. The proportion of mortgages decreased slightly from 18.6 percent in 2016 to 17.6 percent in 2017. Credit card, other personal loans and trade finance accounted for 1.9 percent, 5.3 percent and 5.5 percent of total loans and advances, respectively, at the end of 2017.
HSBC and Bank of China (Hong Kong) Limited (BOC (HK)) continue to be the dominant players in the lending market, accounting for 53.5 percent of the total loans outstanding as at 31 December 2017.
Among the top 10 surveyed banks, gross loans and advances increased from HK$6,640 billion to HK$7,644 billion, an increase of 15.1 percent compared to 2016. All top 10 survey banks recorded an increase in gross loans and advances.
HSBC’s gross loans and advances increased by 17.4 percent to HK$3,342 billion, largely driven by an increase in corporate and commercial lending, as well as growth in residential mortgages and other personal lending.13
0
1,000
500
1,500
2,000
2,500
3,000
3,500
4,000 3,342
1,186808
488 482 461289 237 155196
HSBC
BOC (HK)
Hang
Seng
BEA
ICBC (A
sia)
SCB
CCB (Asia
)
CITIC
Nanya
ngDBS
2017 2016
Loans
Source: Extracted from individual banks’ financial and public statements
HK$ bn
Hong Kong Banking Report 2018 | 7
© 2018 KPMG, a Hong Kong partnership and a member firm of the KPMG network of independent member firms affiliated with KPMG International Cooperative (“KPMG International”), a Swiss entity. All rights reserved. © 2018 KPMG, a Hong Kong partnership and a member firm of the KPMG network of independent member firms affiliated with KPMG International Cooperative (“KPMG International”), a Swiss entity. All rights reserved.

14 BOC (HK) 2017 Annual report – p.31, http://www.bochk.com/dam/bochk/desktop/top/aboutus/ir/
docs/finreport/bochkholdings/2017ar/e101_Fullset.pdf15 CCB (Asia) Annual Financial Results 2017, http://www.asia.
ccb.com/hongkong/doc/about_us/newsroom/20180423-financial-results.pdf
16 Impaired loan ratio is calculated as impaired loans and advances divided by gross loans and advances to customers.
BOC (HK)’s gross loans and advances increased by 18.1 percent to HK$1,186 billion in 2017. This was a result of the bank capitalising on opportunities arising from the Belt and Road Initiative and other development plans.14 The bank recorded a significant increase in loans to the property development sector of HK$26 billion, or 35.8 percent, from 2016.
China Construction Bank (Asia) Corporation Limited (CCB (Asia)) and Nanyang Commercial Bank, Limited (Nanyang) experienced notable loan growth of 23.5 percent and 22.4 percent, respectively, in 2017.
Nanyang’s gross loans and advances as at 31 December 2017 stood at HK$237 billion, compared to HK$193 billion at the end of 2016, which was mainly driven by the growth in commercial loans and loans for use outside Hong Kong. CCB (Asia)’s gross loans and advances as at 31 December 2017 stood at HK$289 billion, compared to HK$234 billion at the end of 2016, which was mainly driven by an increase in commercial lending.15
BEA experienced the lowest growth to its loan portfolio, with an increase in gross loans and advances of 4.6 percent in 2017 – from HK$466 billion at the end of 2016 to HK$488 billion as at the end of 2017.
Credit qualityHong Kong’s economy remained robust during 2017, with credit quality generally improving for the surveyed banks. Overall, the impaired loan ratio16 for banks in Hong Kong showed an improvement in 2017, with the average impaired loan ratio of the surveyed banks improving from 0.65 percent in 2016 to 0.52 percent as at the end of 2017.
For the top 10 surveyed banks, the average impaired loan ratio stood at 0.68 percent for 2017, a decrease from 0.82 percent in 2016. HSBC’s gross loans and advances and impaired advances accounted for around 40 percent of the total gross advances and total impaired advances. The credit quality of HSBC improved and remained strong, with the impaired loans ratio standing at 0.53 percent at the end of 2017, compared to 0.68 percent at the end of 2016.
0.22%
1.06%
Impaired loan ratio
0%
0.5%
1.0%
1.5%
2.0%
2.5%
3.0%
0.12%
0.43%
1.26%
BOC (HK)
CCB (Asia
)
Hang
Seng
Nanya
ng
ICBC (A
sia)
HSBCSCB
CITIC
BEADBS
2017 2016
Source: Extracted from individual banks’ financial and public statements
0.24%
0.53%0.66% 0.68%
1.58%
8 | Hong Kong Banking Report 2018
© 2018 KPMG, a Hong Kong partnership and a member firm of the KPMG network of independent member firms affiliated with KPMG International Cooperative (“KPMG International”), a Swiss entity. All rights reserved.

17 DBS 2017 Annual Report – p.38, https://www.dbs.com/iwov-resources/pdf
hongkong/2017Annual.pdf 18 CITIC 2017 Annual Report – p.14, https://www.cncbinternational.com/_document/about-us/
interim-and-annual-reports/en/2017/annual_report.pdf
Despite reporting the highest impaired loan ratio among the top 10 surveyed banks, DBS Bank (Hong Kong) Limited (DBS) had the most significant improvement to its impaired loans ratio, decreasing to 1.58 percent at the end of 2017 from 2.48 percent in 2016. There was a reduction of impaired loans across all sectors.17
CITIC recorded the largest deterioration of its impaired loan ratio, increasing from 0.96 percent in 2016 to 1.26 percent in 2017. This was due to a more prudent provisioning policy adopted by the bank in light of China’s economic restructuring programme to reduce financial leverage.18 CCB (Asia) also posted a deteriorated impaired loan ratio of 0.22 percent, increasing by 11 basis points from 2016, although this remains a very low impaired loan ratio.
Non-bank mainland China exposureThe ongoing expansion of mainland Chinese companies domestically and abroad continue to present non-bank mainland China growth opportunities for banks in Hong Kong. Exposure to non-bank mainland China-related business of the surveyed banks increased by 15 percent as at the end of 2017, compared to 7 percent growth in 2016.
In aggregate, non-bank mainland China exposure for the top 10 surveyed banks grew by 13.9 percent in 2017, with most of the top 10 banks recording growth in this area. This increase was primarily attributed to the double-digit growth of HSBC, BOC (HK), CCB (Asia), Nanyang, SCB and DBS. This contrasts with the results in 2016, where the non-PRC banks reduced or stabilised their exposure.
Among the top 10 surveyed banks, HSBC reported the highest growth in the amount of non-bank mainland China exposure, increasing by HK$158 billion (or 25 percent) to HK$790 billion in 2017. SCB reported the highest percentage growth of non-bank mainland China exposure, increasing by 31 percent to HK$131 billion in 2017. Of the top 10 banks surveyed, BOC (HK), CCB (Asia), Nanyang and DBS also experienced double-digit growth to their non-bank mainland China exposure during 2017, with increases of HK$73 billion (or 13.8 percent), HK$50 billion (or 30 percent), HK$36 billion (or 22.3 percent) and HK$5 billion (or 21.5 percent), respectively.
Non-bank mainland China exposure
Source: Extracted from individual banks’ financial and public statements
0
200
400
600
800 790
598
358280
216
241
198 160
26
131
HSBC
BOC (HK)
ICBC (A
sia)
BEA
CCB (Asia
)
Hang
Seng
Nanya
ng SCBCITI
CDBS
2017 2016
HK$ bn
Hong Kong Banking Report 2018 | 9
© 2018 KPMG, a Hong Kong partnership and a member firm of the KPMG network of independent member firms affiliated with KPMG International Cooperative (“KPMG International”), a Swiss entity. All rights reserved. © 2018 KPMG, a Hong Kong partnership and a member firm of the KPMG network of independent member firms affiliated with KPMG International Cooperative (“KPMG International”), a Swiss entity. All rights reserved.

Estimated impact to net assets when HKFRS 9 is adopted
Source: Extracted from individual banks’ financial and public statements
0.0%
-2.59%
-1.58%
-1.08% -1.00% -0.96%-0.97%-0.83%
-0.56%
-0.18%
-0.49%
CITIC
Nanya
ngDBS
BOC (HK)
SCBHSBC
CCB (Asia
)BEA
Hang
Seng
ICBC (A
sia)
-0.5%
-1.0%
-1.5%
-2.0%
-2.5%
-3.0%
Out of the top 10 surveyed banks, only ICBC (Asia) and BEA reported a decrease of their non-bank mainland China exposure. ICBC (Asia) and BEA reported a reduction of HK$1 billion (or 0.3 percent) and HK$8 billion (or 2.9 percent), respectively, from 31 December 2016.
Impact of HKFRS 9HKFRS 9, Financial Instruments, which took effect on 1 January 2018, is having a fundamental impact on the financial position of banks in Hong Kong. The biggest change is the new forward-looking impairment methodology with the concept of “expected credit loss” replacing the existing “incurred credit loss” model. The immediate impact is likely to be larger and more volatile allowances for loans and advances, and a decrease in the net assets of banks. Another key component of HKFRS 9 is the change in the classification and measurement of financial instruments which may have a mixed effect on changes to the net assets and profitability of banks. In general we expect to see banks record a reduction in net assets when adopting HKFRS 9. The magnitude of the decrease, however, is subject to the nature and contractual terms of the financial instruments held by different banks.
The top 10 surveyed banks disclosed the estimated impact on net assets as a result of the adoption of HKFRS 9 in their financial statements as at 31 December 2017. Our analysis shows an estimated reduction in net assets of HK$14,681 million, or 0.92 percent of total net assets of these banks. CITIC reported the largest percentage of reduction (2.59 percent), while ICBC (Asia) reported the lowest percentage of reduction (0.18 percent).
For CITIC, the estimated reduction in net assets amounted to HK$1,127 million, representing an estimated increase of impairment allowances (net of taxes) from new impairment models. ICBC (Asia) reported the lowest impact on HKFRS 9 with an estimated reduction of net assets of HK$164 million. This represents an estimated reduction of net assets of HK$503 million due to new impairment models and an estimated increase of net assets of HK$339 million resulting from the re-classification of debt instruments from held-to-maturity (HTM) to fair value through other comprehensive income (FVOCI).
10 | Hong Kong Banking Report 2018
© 2018 KPMG, a Hong Kong partnership and a member firm of the KPMG network of independent member firms affiliated with KPMG International Cooperative (“KPMG International”), a Swiss entity. All rights reserved.

Seven out of the top 10 surveyed banks reported the impact on their capital ratios to be insignificant as at 31 December 2017. BOC (HK) estimated its total capital ratio to decrease by 10 basis points, while BEA19 and Nanyang reported an estimated decrease in their CET1 capital ratio of 18 and 34 basis points, respectively.
10. Assess effect on
customers
1. Calculation of the numbers
2. Integration into risk management
process and modelling teams
3. Understand business impacts & integrate into
pricing, etc.
4. Establish a process for regular production
(data mapping, systems, procedures)
5. Integrate into overall provisioning
processes
6. Integrate into regulatory
capital calculation
7. Establish robust governance structure & controls & model validation standards
8. Determine appropriate disclosures
9. Ready explanations to
market, analysts, shareholders
HKFRS 9 implementation status in Hong Kong
Source: KPMG
Michael MontefortePartner, Financial Risk ManagementKPMG China
19 The impact disclosed by BEA is the before tax effect.
HKFRS 9 real-time in Hong Kong Over the past two to three years, banks in Hong Kong have been preparing for the implementation of the new accounting standard. Particularly challenging has been the HKFRS 9 new requirement for banks to build new models or significantly enhance existing credit risk models. Risk and finance teams have been busy building, testing and fine-tuning HKFRS 9 impairment models right up to the implementation deadline.
Based on our implementation assessment across a number of banks in Hong Kong, there are areas where the banks have made progress and some areas that still need further work, as shown in the figure below. Most banks in Hong Kong have already constructed routine processes to calculate the numbers and transmit the results to their capital and impairment reporting. However, what has been overlooked throughout the implementation is a deep understanding of the commercial and strategic impacts of the new accounting standard. The participation in HKFRS 9 projects and understanding the impacts of new impairment models by the business has often been a second priority.
On track Delayed Not ready yet
Hong Kong Banking Report 2018 | 11
© 2018 KPMG, a Hong Kong partnership and a member firm of the KPMG network of independent member firms affiliated with KPMG International Cooperative (“KPMG International”), a Swiss entity. All rights reserved. © 2018 KPMG, a Hong Kong partnership and a member firm of the KPMG network of independent member firms affiliated with KPMG International Cooperative (“KPMG International”), a Swiss entity. All rights reserved.

The impact of HKFRS 9 on a bank’s own customers should not be neglected. Some customer and product types will have features that require higher Expected Credit Losses (ECL) than others. It is important that banks can explain to their larger corporate clients that may be impacted by the accounting change what has happened (i.e. loan pricing changes).
Furthermore, some banks that have a higher proportion of ‘stage 1’ assets relative to their peers will have a lower overall impairment charge on loans, which may have some unintended consequences in customer behaviour. Whether or not a lower proportion of ‘stage 1’ instruments is truly reflective of credit quality in the book, or more aggressive modelling choices may also tilt the playing field.
For many banks, the HKFRS 9 impairment level impacts for non-retail corporate loans have been larger than the impacts on retail loans. Corporate loan books tend to have a higher concentration of large exposures with relatively longer maturities, and are consequently more sensitive to changes in model input parameters such as Probability of Default (PD) and Loss Given Default (LGD). However, there are some segments on the retail side that have also exhibited significant impacts. The increase in impairment allowance is medium to high for credit cards and trade bills as these segments tend to have higher PDs / LGDs, and also a higher proportion of ‘stage 2’ assets. However, the HKFRS 9 increase in provision amounts for secured retail loans tend to be much smaller. Banks will need to review and incorporate these impacts into strategic planning, product design and marketing, and portfolio management strategies – for example, banks could decide to focus on clients with a lower probability of ‘stage 2’ migration, or on designing products that have features attracting lower ECL.
Product-level impacts in Hong Kong
Source: KPMG
1
2
4
5 6
73
medium
mediumlow
high
Incr
easi
ng
Mat
uri
ty (
No
n-S
tag
e 1)
Increasing Credit Risk (PD x LGD)
IFRS 9 Impairments Impacts
5
2
3
4
7
1
6
High Potential Impact
Non-Retail Wholesale Corporate Loans
Credit Cards
FI and Bank Loans
Trade Bills
Debt Securities
Other Retail
Sovereign Claims
Medium to High Potential Impact
Low Potential Impact
Modelling choices have also varied across the market. Particularly noticeable is a wide range of ‘stage 2’ triggers adopted in Hong Kong for assessing “Significant Increases in Credit Risk”. The choices include: use of absolute credit ratings, changes in lifetime PD, changes in 12 month PD, credit rating downgrades, early warning indicators, watch list indicators, and special mention grading. The current lack of ‘ex-post’ internal historical data has furthermore complicated efforts to perform robust validation and back-testing exercises on the effectiveness of such choices. Without these types of tests performed, it is impossible for banks to determine whether or not volatility and increases in impairments are truly due to changes in credit risk.
12 | Hong Kong Banking Report 2018
© 2018 KPMG, a Hong Kong partnership and a member firm of the KPMG network of independent member firms affiliated with KPMG International Cooperative (“KPMG International”), a Swiss entity. All rights reserved.

Modelling choices20 The impact due to forward-looking economic scenarios has been quite limited in Hong Kong due to the relatively stable economic environment and banks’ expectations on future economic growth. For some banks, the impact is less than a 5 percent uplift on the calculated impairment figures, while for others the impact is an adjustment that is slightly lowering the ECL from base case. The variety of models adopted has also been quite broad in Hong Kong, ranging from basic economic scalar models to more complex regression approaches. Although the number of economic scenarios modelled has clearly converged to three scenarios in Hong Kong, a much more varied number in scenarios is visible in Europe.
As the impacts of HKFRS 9 implementation work their way through the credit landscape in Hong Kong, banks should move quickly to adjust their lending strategies. Furthermore, it is imperative that robust back-testing and validation routines be set up to help banks understand where the models are working and where they are not. Efforts spent to produce more accurate estimates and ECL models may give early adopters a competitive advantage. In fact, astute institutions are already working on their second generation of HKFRS 9 models.
Source: KPMG
1
1
48
Number of forward-looking economic scenarios used by banks in EU
3 scenarios 4 scenarios 5 scenarios 50 scenarios
1
5
Number of forward-looking economic scenarios used by banks in HK
20 Based on a sample of banks in Hong Kong (6) and Europe (14)
Hong Kong Banking Report 2018 | 13
© 2018 KPMG, a Hong Kong partnership and a member firm of the KPMG network of independent member firms affiliated with KPMG International Cooperative (“KPMG International”), a Swiss entity. All rights reserved. © 2018 KPMG, a Hong Kong partnership and a member firm of the KPMG network of independent member firms affiliated with KPMG International Cooperative (“KPMG International”), a Swiss entity. All rights reserved.
Growth in Asia: Risk and regulatory considerations
Simon ToppingPartner, Regulatory AdvisoryKPMG China
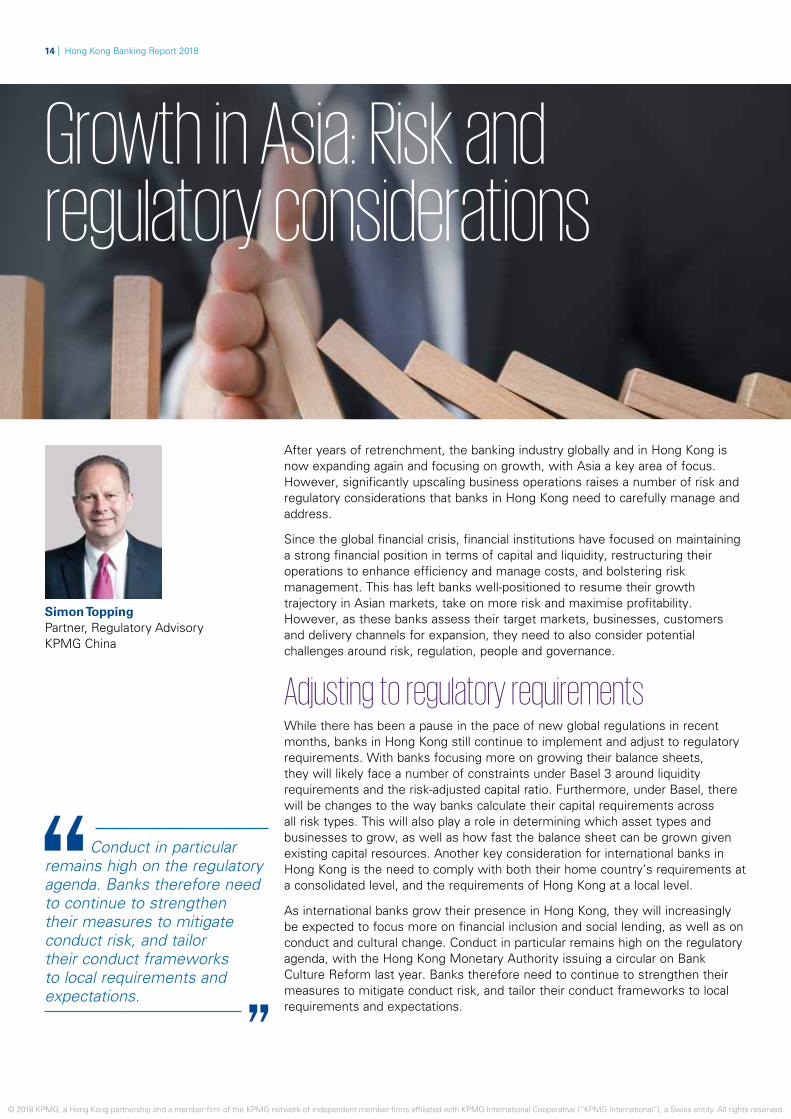
After years of retrenchment, the banking industry globally and in Hong Kong is now expanding again and focusing on growth, with Asia a key area of focus. However, significantly upscaling business operations raises a number of risk and regulatory considerations that banks in Hong Kong need to carefully manage and address.
Since the global financial crisis, financial institutions have focused on maintaining a strong financial position in terms of capital and liquidity, restructuring their operations to enhance efficiency and manage costs, and bolstering risk management. This has left banks well-positioned to resume their growth trajectory in Asian markets, take on more risk and maximise profitability. However, as these banks assess their target markets, businesses, customers and delivery channels for expansion, they need to also consider potential challenges around risk, regulation, people and governance.
Adjusting to regulatory requirementsWhile there has been a pause in the pace of new global regulations in recent months, banks in Hong Kong still continue to implement and adjust to regulatory requirements. With banks focusing more on growing their balance sheets, they will likely face a number of constraints under Basel 3 around liquidity requirements and the risk-adjusted capital ratio. Furthermore, under Basel, there will be changes to the way banks calculate their capital requirements across all risk types. This will also play a role in determining which asset types and businesses to grow, as well as how fast the balance sheet can be grown given existing capital resources. Another key consideration for international banks in Hong Kong is the need to comply with both their home country’s requirements at a consolidated level, and the requirements of Hong Kong at a local level.
As international banks grow their presence in Hong Kong, they will increasingly be expected to focus more on financial inclusion and social lending, as well as on conduct and cultural change. Conduct in particular remains high on the regulatory agenda, with the Hong Kong Monetary Authority issuing a circular on Bank Culture Reform last year. Banks therefore need to continue to strengthen their measures to mitigate conduct risk, and tailor their conduct frameworks to local requirements and expectations.
Conduct in particular remains high on the regulatory agenda. Banks therefore need to continue to strengthen their measures to mitigate conduct risk, and tailor their conduct frameworks to local requirements and expectations.
14 | Hong Kong Banking Report 2018
© 2018 KPMG, a Hong Kong partnership and a member firm of the KPMG network of independent member firms affiliated with KPMG International Cooperative (“KPMG International”), a Swiss entity. All rights reserved.

In addition, the pursuit of faster growth in Asia after a lengthy period of retrenchment implies a significant re-orientation of banks’ management and staff towards a more expansionary mindset. Senior management will need to devote significant attention to managing growth in different markets and sectors, and ensuring that their employees – especially front-line staff – demonstrate proper conduct and treat clients fairly.
The challenges to growthA stronger focus on growth also means that banks need to monitor and manage credit risk, and enhance their people, processes and systems capabilities to deal with internal operational risk, as well as external macroeconomic and geopolitical risk. Furthermore, many banks will be seeking to grow their business and capabilities on the back of China’s Belt and Road Initiative and other national economic policies, which could also create new investment exposures that need to be taken into consideration.
The growth of regional economies in Asia is also creating a bigger market and significant opportunities for banks in Hong Kong. However, as some international banks seek to grow their presence in certain markets, this could trigger local players to respond by offering more competitive prices – which would reduce their margins – or by encouraging local customers to eschew international banks in favour of domestic institutions. Banks expanding into foreign markets will therefore need to prepare for a backlash from local players, and consider whether to position themselves as a global or local bank in these new markets.
Another trend over the past few years has been the growing number of consumers who are diversifying to new providers, delivery and transaction methods, often associated with online services and the latest technologies. Existing banks need to assess how best to transform their businesses to enhance their products and services, improve their range of delivery channels, and make themselves more current and attractive to an increasingly demanding and digitally-focused customer.
Overall, a renewed focus on growth is a positive sign for the banking industry in Hong Kong, with the development of the China market and the Asian region presenting significant opportunities for both local and international financial institutions. As banks continue to raise the bar on their growth objectives, they need to keep in mind that the regulators are likely to monitor whether these organisations are taking on considerable excess risk, and whether the appropriate systems and controls are in place to manage this growth. The successful banks will be the ones that carefully balance their growth objectives with a strong awareness and focus on managing the related regulations and risks in both existing and new markets, sectors and business lines.
Existing banks need to assess how best to transform their businesses to enhance their products and services, improve their range of delivery channels, and make themselves more current and attractive to an increasingly demanding and digitally-focused customer.
Hong Kong Banking Report 2018 | 15
© 2018 KPMG, a Hong Kong partnership and a member firm of the KPMG network of independent member firms affiliated with KPMG International Cooperative (“KPMG International”), a Swiss entity. All rights reserved. © 2018 KPMG, a Hong Kong partnership and a member firm of the KPMG network of independent member firms affiliated with KPMG International Cooperative (“KPMG International”), a Swiss entity. All rights reserved.

Gerry HarveyCEO, FICC Markets Standards Board
Craig BeeversSenior Technical Advisor, FICC Markets Standards Board
Raising the standard of conduct in global wholesale markets
The FICC Markets Standards Board (FMSB) is a market-led organisation constituted following the recommendations of the UK Fair and Effective Markets Review (FEMR), which was conducted by HM Treasury, the Bank of England and the FCA in 2015. The FMSB is unique in its membership, comprising all sectors and users of global Fixed Income, Currencies and Commodities (FICC) markets, with more than 200 senior market practitioners from 50 firms and organisations engaged in FMSB working groups and committees. The FMSB has a number of objectives designed to raise the standard of conduct in wholesale FICC markets and assess market conduct and structural vulnerabilities.
Gerry Harvey, CEO of the FMSB, and Craig Beevers, Senior Technical Advisor at the FMSB, discuss recent trends and developments around conduct, practical methods for identifying and preventing misconduct, the impact of technology on market practices, and the key areas of focus for the FMSB in the coming years.
Existing regulatory approaches to conduct have tended to fall into two camps: principles-based and rules-based. High-level principles provide regulatory flexibility and make broad statements about the direction of regulatory guidance, but provide insufficient practical details to guide practice in the actual marketplace. Detailed legalistic rules risk being incomprehensible to individual traders and cannot possibly cover all of the detailed scenarios that arise in dynamic wholesale markets. It is rare that the answer to the question “Can I do this deal?” can be found by reference to a statute or rulebook.
In examining the drivers behind recent conduct failures, the FEMR noted that “there has often been a lack of market-wide agreement on the standards of market practice implied by regulations and market codes.” It also said that “the style and structure of current regulatory and other standards sometimes makes it difficult for market practitioners to understand how the standards apply to specific market practices.” What is acceptable and unacceptable in daily conduct and practice is implied by, but is not listed in, rules. Rules may mean that certain practices are permissible (or not), but they do not describe what those practices are.
Good regulation and a strong legal framework are necessary prerequisites, but something more is needed to deliver fair and effective market outcomes. Regulations and the law cannot provide the detailed, granular guidance required by market practitioners to eliminate ambiguity as to acceptable conduct in live operating markets. This needs to be determined by senior market and technical experts from all sides of the wholesale markets, and by debating and agreeing
16 | Hong Kong Banking Report 2018
© 2018 KPMG, a Hong Kong partnership and a member firm of the KPMG network of independent member firms affiliated with KPMG International Cooperative (“KPMG International”), a Swiss entity. All rights reserved.
best practice standards that balance the different interests of market makers, users and infrastructure providers. This is a key objective for the FMSB, and indeed how it develops new standards in practice.
Regulators have adjusted their approach to the management of conduct issues, emphasising the importance of the interaction between behaviour, conduct, governance and culture. The development of this approach requires a focus on market conduct, and not just on processes and “rules”. Firms operating in wholesale markets are also developing new methodologies for managing conduct risk.
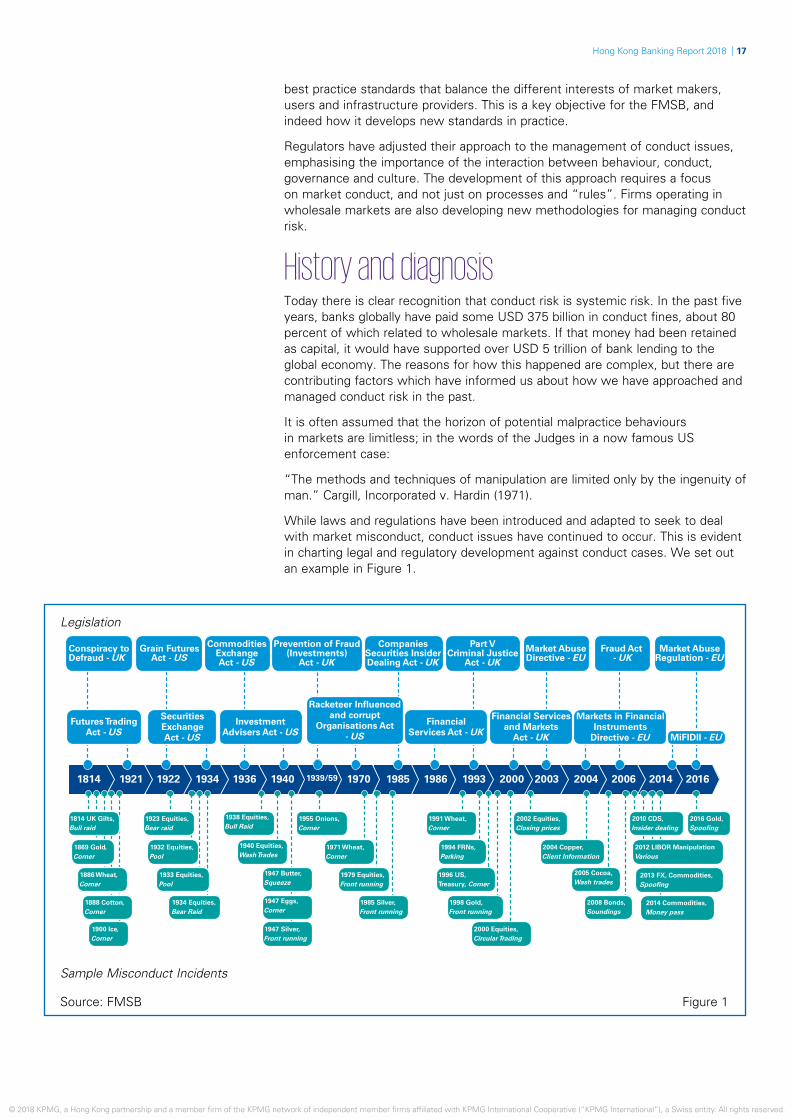
History and diagnosisToday there is clear recognition that conduct risk is systemic risk. In the past five years, banks globally have paid some USD 375 billion in conduct fines, about 80 percent of which related to wholesale markets. If that money had been retained as capital, it would have supported over USD 5 trillion of bank lending to the global economy. The reasons for how this happened are complex, but there are contributing factors which have informed us about how we have approached and managed conduct risk in the past.
It is often assumed that the horizon of potential malpractice behaviours in markets are limitless; in the words of the Judges in a now famous US enforcement case:
“The methods and techniques of manipulation are limited only by the ingenuity of man.” Cargill, Incorporated v. Hardin (1971).
While laws and regulations have been introduced and adapted to seek to deal with market misconduct, conduct issues have continued to occur. This is evident in charting legal and regulatory development against conduct cases. We set out an example in Figure 1.
Figure 1Source: FMSB
Legislation
Sample Misconduct Incidents
1814 1921 1922 1934 1936 1940 1970 1985 1986 1993 2000 2003 2004 2006 2014 20161939/59
Conspiracy toDefraud - UK
Grain FuturesAct - US
Commodities ExchangeAct - US
Prevention of Fraud (Investments)
Act - UK
CompaniesSecurities InsiderDealing Act - UK
Part V Criminal Justice
Act - UKMarket AbuseDirective - EU
Fraud Act - UK
Market AbuseRegulation - EU
Futures Trading Act - US
1814 UK Gilts,Bull raid
1923 Equities,Bear raid
1938 Equities,Bull Raid
1955 Onions,Corner
1991 Wheat,Corner
2010 CDS,Insider dealing
2016 Gold,Spoofing
2002 Equities,Closing prices
2004 Copper,Client Information
2012 LIBOR ManipulationVarious
2013 FX, Commodities,Spoofing
2014 Commodities,Money pass
2005 Cocoa,Wash trades
2008 Bonds,Soundings
1932 Equities,Pool
1940 Equities,Wash Trades
1971 Wheat,Corner
1994 FRNs,Parking
1996 US,Treasury, Corner
1998 Gold,Front running
2000 Equities,Circular Trading
1979 Equities,Front running
1985 Silver,Front running
1947 Butter,Squeeze
1947 Eggs,Corner
1947 Silver,Front running
1933 Equities,Pool
1934 Equities,Bear Raid
1869 Gold,Corner
1886 Wheat,Corner
1888 Cotton,Corner
1900 Ice,Corner
Securities Exchange Act - US
Investment Advisers Act - US
FinancialServices Act - UK
Markets in FinancialInstruments
Directive - EU MiFIDII - EU
Financial Services and Markets
Act - UK
Racketeer Influenced and corrupt
Organisations Act - US
Hong Kong Banking Report 2018 | 17
© 2018 KPMG, a Hong Kong partnership and a member firm of the KPMG network of independent member firms affiliated with KPMG International Cooperative (“KPMG International”), a Swiss entity. All rights reserved. © 2018 KPMG, a Hong Kong partnership and a member firm of the KPMG network of independent member firms affiliated with KPMG International Cooperative (“KPMG International”), a Swiss entity. All rights reserved.
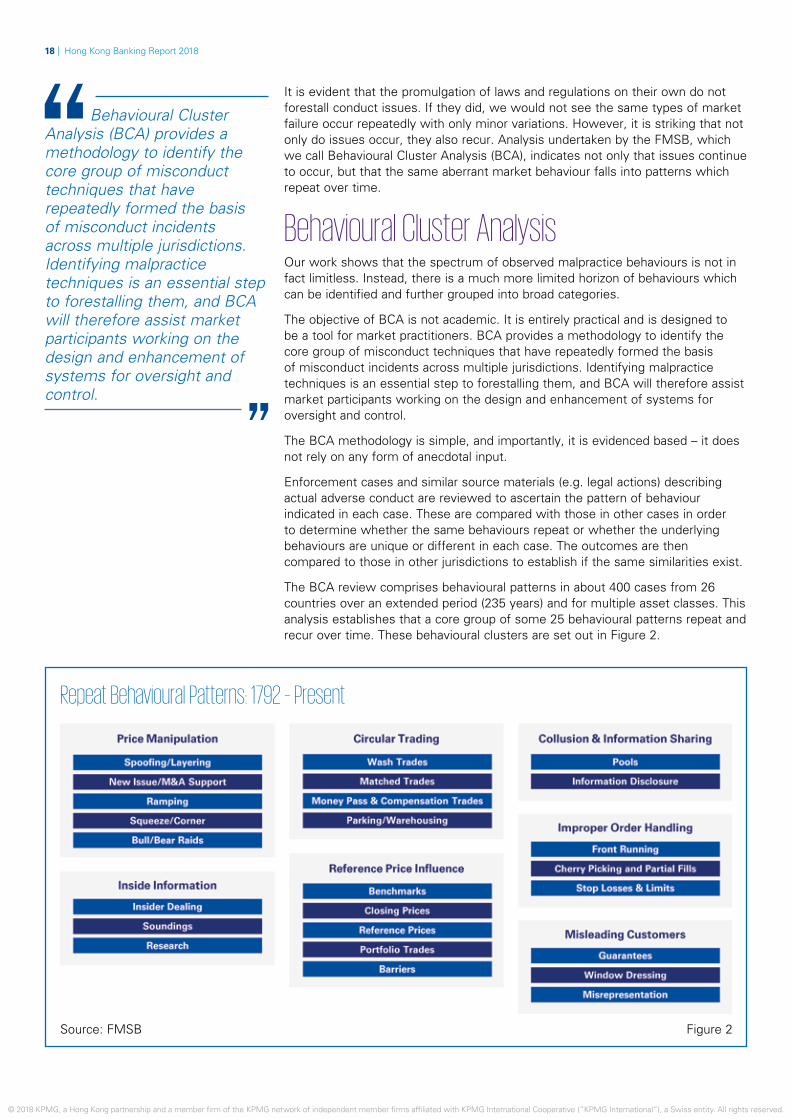
It is evident that the promulgation of laws and regulations on their own do not forestall conduct issues. If they did, we would not see the same types of market failure occur repeatedly with only minor variations. However, it is striking that not only do issues occur, they also recur. Analysis undertaken by the FMSB, which we call Behavioural Cluster Analysis (BCA), indicates not only that issues continue to occur, but that the same aberrant market behaviour falls into patterns which repeat over time.
Behavioural Cluster Analysis Our work shows that the spectrum of observed malpractice behaviours is not in fact limitless. Instead, there is a much more limited horizon of behaviours which can be identified and further grouped into broad categories.
The objective of BCA is not academic. It is entirely practical and is designed to be a tool for market practitioners. BCA provides a methodology to identify the core group of misconduct techniques that have repeatedly formed the basis of misconduct incidents across multiple jurisdictions. Identifying malpractice techniques is an essential step to forestalling them, and BCA will therefore assist market participants working on the design and enhancement of systems for oversight and control.
The BCA methodology is simple, and importantly, it is evidenced based – it does not rely on any form of anecdotal input.
Enforcement cases and similar source materials (e.g. legal actions) describing actual adverse conduct are reviewed to ascertain the pattern of behaviour indicated in each case. These are compared with those in other cases in order to determine whether the same behaviours repeat or whether the underlying behaviours are unique or different in each case. The outcomes are then compared to those in other jurisdictions to establish if the same similarities exist.
The BCA review comprises behavioural patterns in about 400 cases from 26 countries over an extended period (235 years) and for multiple asset classes. This analysis establishes that a core group of some 25 behavioural patterns repeat and recur over time. These behavioural clusters are set out in Figure 2.
Behavioural Cluster Analysis (BCA) provides a methodology to identify the core group of misconduct techniques that have repeatedly formed the basis of misconduct incidents across multiple jurisdictions. Identifying malpractice techniques is an essential step to forestalling them, and BCA will therefore assist market participants working on the design and enhancement of systems for oversight and control.
Source: FMSB Figure 2
Repeat Behavioural Patterns: 1792 – Present
18 | Hong Kong Banking Report 2018
© 2018 KPMG, a Hong Kong partnership and a member firm of the KPMG network of independent member firms affiliated with KPMG International Cooperative (“KPMG International”), a Swiss entity. All rights reserved.

The analysis does not focus on particular markets or asset classes but all markets and asset classes to which the source materials relate (see Figure 3).
American Depositary Receipts Equity Index Futures Non-fat Dry MilkAsset Backed Securities Equity Options Onion FuturesBitcoin Non-Deliverable Forwards Equity Warrants Orange juice FuturesBrent Oil Ethanol Futures PalladiumCheese Futures Eurodollar Derivatives PlatinumCocoa Futures Eurozone Government Bonds Potato FuturesCoffee Futures Floating Rate Notes Property FuturesCollateralised Debt Obligations FX Futures Repurchase AgreementsContracts for Difference FX Options Rice FuturesConvertible Bonds Gas Oil SilverCopper Gilts Soybean MealCorn Global Depository Receipts Soybean OilCorporate Bonds Gold SoybeansCredit Default Swaps Japanese Government Bond futures Spot FXEggs Lead Sunflower Seed FuturesElectricity LIBOR US TreasuriesEmerging Market Bonds Mortgage Backed Securities Volatility Index FuturesEmerging Market Warrants Municipal Bonds WheatEquity Natural Gas WTJ Oil
BCA: Summary of thematic findingsThe BCA has yielded a number of thematic findings:
Finding 1: There are a limited number of repeat behavioural patterns. Review of source materials indicates that there are some 25 behavioural patterns evident in market misconduct cases. These patterns are recurring.
Finding 2: These behavioural patterns are jurisdictionally and geographically neutral. These behavioural patterns do not respect national or jurisdictional boundaries. They are evident internationally.
Finding 3: The same behavioural patterns occur in different asset classes. These behavioural patterns are not specific to particular asset classes. The same patterns are evident in different asset classes. This is rational: asset classes do not generate conduct risks – people do.
Finding 4: Behaviours adapt to new technologies and market structures. Technology is not new – it has been a feature for markets for years, and as such there is a corresponding body of evidence of conduct malpractice in the screen-based trading environment. These behaviours are not new – they are known behaviours that have adapted to new media.
Source: FMSB Figure 3
Markets and Asset Classes
Hong Kong Banking Report 2018 | 19
© 2018 KPMG, a Hong Kong partnership and a member firm of the KPMG network of independent member firms affiliated with KPMG International Cooperative (“KPMG International”), a Swiss entity. All rights reserved. © 2018 KPMG, a Hong Kong partnership and a member firm of the KPMG network of independent member firms affiliated with KPMG International Cooperative (“KPMG International”), a Swiss entity. All rights reserved.

Care needs to be taken with what is meant by electronic trading. We need to distinguish between human-initiated trading on an electronic platform that has rules designed to stop some types of malpractice written into the software the trader uses, and algorithmic trading where humans are removed from the initiation of the trade. In both cases, there is a major difficulty with the hypothesis that bad conduct can be coded out.
Markets in transitionSince the 1990s, and particularly in the past decade, electronic trading of FICC products and new post-trade protocols (e.g. central clearing) have grown significantly. A further consideration in relation to conduct is the growing impact that technology is having on market structures and practice. Patterns of malpractice repeat, but they also adapt to new market structures.
It has been suggested that moving trading markets to electronic platforms addresses conduct risk, and that computers are substitutes for humans and misconduct can be “coded out”. Care needs to be taken with what is meant by electronic trading, and we need to distinguish between human-initiated trading on an electronic platform that has rules designed to stop some types of malpractice written into the software the trader uses, and algorithmic trading where humans are removed from the initiation of the trade. In both cases, there is a major difficulty with the hypothesis that bad conduct can be coded out.
Electronic trading platforms have been operating for some time, and we therefore already have a corresponding body of enforcement cases relating to misconduct in the electronic trading environment. Electronic trading does not automatically eliminate market abuse and misconduct. Some types of long-established manipulation techniques evident in voice markets have simply migrated to electronic markets. There are enforcement cases on record involving wash trades, spoofing and layering, the use of algorithms to manipulate closing and reference prices, circular trading, front running and the use of social media to pass inside information and to conduct bull and bear raids. These behaviours are not new – they are known behaviours that have adapted to new media. Similarly, any of these patterns of behaviour can be coded into an algorithm that then commits abusive trading on behalf of its operator.
20 | Hong Kong Banking Report 2018
© 2018 KPMG, a Hong Kong partnership and a member firm of the KPMG network of independent member firms affiliated with KPMG International Cooperative (“KPMG International”), a Swiss entity. All rights reserved.

Emerging vulnerabilitiesOne of the strategic goals of the FMSB is to analyse and report on emerging vulnerabilities in FICC markets.
Just as old techniques have adapted to changes in market structures, new structures may give rise to the potential for new vulnerabilities. We are considering possibilities in this space, but given the pace of change, these and similar topics represent a major strand of FMSB work over the next two to three years. Some examples include the following:
• In voice markets, participants have over time developed extensive controls governing the approval, development and introduction of new products. In electronic markets, the equivalent controls may be less well established. Further, electronic market controls need to cover novel types of risk – for example, relating to the age and quality of computer code, the documentation, change management and testing of that code in development and live environments, and safe repositories for source copies of code.
• Concerns that algorithmic trading engines can malfunction (e.g. by creating “flash” and “splash” crashes) have led to the deployment of a variety of controls intended to mitigate such problems – for example, “kill switches” and “speed bumps”.
• Algorithmic, and particularly high frequency trading, is an increasingly important category of electronic trading and source of pricing and liquidity in electronic FICC markets. Controls over the development and deployment of algorithmic engines are therefore particularly critical to the effective functioning of the market, and the fairness of pricing and liquidity provision by market makers.
• Electronic markets generate significant volumes of market data. Issues ranging from the accuracy of time stamps to the visibility (or lack) of market depth, latency of reporting of executed orders and the quality and capability of market data infrastructure, can all have a potential impact on the fairness and effectiveness of electronic markets for their users.
Considerations such as these arise against a backdrop of a rapidly changing regulatory environment, which can itself generate uncertainties and the potential for unforeseen consequences. The FMSB will continue to focus much of its attention on these topics over the next two to three years.
Hong Kong Banking Report 2018 | 21
© 2018 KPMG, a Hong Kong partnership and a member firm of the KPMG network of independent member firms affiliated with KPMG International Cooperative (“KPMG International”), a Swiss entity. All rights reserved. © 2018 KPMG, a Hong Kong partnership and a member firm of the KPMG network of independent member firms affiliated with KPMG International Cooperative (“KPMG International”), a Swiss entity. All rights reserved.

The development of China’s Belt and Road Initiative (BRI) – which spans more than 70 countries – is expected to be a major driver of long-term investment, trade and economic development in the region. The financing of BRI projects and the role of financial institutions will be important elements in the initiative, and Hong Kong’s status as an international finance centre presents significant opportunities for the city’s banks to expand their operations and grow.
The BRI is expected to be driven through two basic and complementary waves of business activity. The first wave involves the planning and development of hard physical assets – transport networks, telecom towers and power plants, for example – and subsequent industrial and commercial real estate and residential development. This is expected to stimulate a second wave of enhanced connectivity and economic and social development, which will see the formation of dynamic new consumer economies, enhanced financial systems, increased tourism and socio-economic development across Belt and Road markets.
Assessing the opportunities and risksWhile governments and policy banks have been the traditional financiers of emerging markets projects, a number of international and Chinese banks are exploring BRI opportunities. This includes the direct provision of financing to projects, as well as offering financial services to construction contractors, suppliers and others in the infrastructure and real estate supply chain. Through this activity, we expect to see a growing pool of companies and individuals who require financing and cash management, payments and remittance services. As a major international financial centre in the fast-growing Asian region, Hong Kong has a significant opportunity to position itself as the financial services hub for the BRI.
As projects mature, the funding from governments, the Asian Infrastructure Investment Bank and other policy banks could be replaced by bank lending. Given the specialised nature of project finance and the diverse risk factors across BRI markets, we expect commercial banks to take a cautious approach towards expansion and investment in new BRI markets. This will include capacity building in local markets as well as developing project feasibility models and analyses that consider location-specific factors. When selecting projects, these groups will be focused on analysing sovereign level risks of the different markets, and in their early stages of new market entry are expected to focus on countries with higher sovereign credit ratings and stable political environments.
Michael Camerlengo Director, Infrastructure AdvisoryKPMG China
Paul McSheaffreyHead of Banking & Capital Markets, Hong KongKPMG China
The Belt and Road Initiative: Hong Kong banks to play a key role
22 | Hong Kong Banking Report 2018
© 2018 KPMG, a Hong Kong partnership and a member firm of the KPMG network of independent member firms affiliated with KPMG International Cooperative (“KPMG International”), a Swiss entity. All rights reserved.

21 http://www.nielsen.com/content/dam/nielsenglobal/apac/docs/reports/2014/Nielsen-ASEAN2015.pdf
We would also expect debt capital markets to be a source of take-out funding for policy banks. This approach may suit various parties better as risk can be more diversified and ultimate buyers, such as insurance companies, get access to longer-term assets.
In addition, the growth of economies along the Belt and Road has the potential to create retail, wealth management and asset management opportunities for financial institutions in Hong Kong. In particular, the ASEAN region could be a key focus area for banks, with a healthy growth rate, a young workforce, and a middle class population that is projected to reach 400 million by 2020.21 Many banks in Hong Kong already possess a strong investment and business track record in the ASEAN market, and could seek to expand their existing operations in the region.
The development of the BRI is also expected to generate opportunities for the provision of other financing and investment products. A policy agreement signed in December 2017 between Hong Kong and the National Development Reform Commission includes a focus area on ensuring Hong Kong is adopted as a BRI platform for financing solutions such as infrastructure finance, green bonds and RMB trade. In particular, we expect RMB funding to play an important role in BRI activity, with Hong Kong well-positioned as a leading centre for global offshore RMB. This is likely to present more opportunities for banks in Hong Kong to facilitate the further internationalisation of the RMB by helping stakeholders along the entire value chain convert and use the currency for their investments.
Furthermore, with the initial phase of the BRI focused on the development of infrastructure and real assets, this is expected to lead to subsequent financing demand, including for green bonds and green finance as projects mature and initial funding is repaid. This is also reinforced by the Hong Kong Government’s increasing focus on the development of a regional green finance and green bonds market based out of Hong Kong.
While governments and policy banks have been the traditional financiers of emerging markets projects, a number of international and Chinese banks are exploring Belt and Road Initiative opportunities. This includes the direct provision of financing to projects, as well as offering financial services to construction contractors, suppliers and others in the infrastructure and real estate supply chain.
Five major goals of the Belt and Road Initiative1. Policy co-ordination: Multi-country collaboration to solve problems and develop policy solutions that will drive long-term social and economic development of BRI countries.
2. Facilities connectivity: The prioritisation of construction needs to support the improved flow of people and goods. This involves removing barriers to transport connectivity through the development of new infrastructure and improvements to existing links.
3. Unimpeded trade: Reduced trade barriers and tariffs, achieving lower trade and investment costs and improvements to industry supply chains across national borders.
4. Financial integration: Greater monetary policy co-ordination of BRI countries, improved local currency settlement and exchange systems, and enhanced effectiveness of financial, regulatory and risk management frameworks.
5. People-to-people bonds: Strengthening relations between the people of BRI countries and the promotion of increased awareness and cultural understanding.
Source: National Development and Reform Commission, People’s Republic of China
Hong Kong Banking Report 2018 | 23
© 2018 KPMG, a Hong Kong partnership and a member firm of the KPMG network of independent member firms affiliated with KPMG International Cooperative (“KPMG International”), a Swiss entity. All rights reserved. © 2018 KPMG, a Hong Kong partnership and a member firm of the KPMG network of independent member firms affiliated with KPMG International Cooperative (“KPMG International”), a Swiss entity. All rights reserved.

The Greater Bay Area as a launch pad for the Belt and Road InitiativeOther regional initiatives such as the Greater Bay Area (GBA) – which aims to economically and socially integrate the nine cities in Guangdong’s Pearl River Delta, as well as Hong Kong and Macau – are expected to transform the region into a hub for facilitating the BRI. The efficient combination of capital, financial services, technology and innovation and advanced manufacturing capabilities of the cities in the GBA continues to create a solid foundation for businesses within the region to pursue outbound opportunities along the Belt and Road.
In addition to the financing and capital raising opportunities presented by the further development of the GBA, banks in Hong Kong have the opportunity to capitalise on the region’s aim to transform into a global technology and innovation hub. By leveraging technological advancement and start-up collaboration, banks in Hong Kong and the Greater Bay Area are expected to have an opportunity to play a leading role in developing the fintech space for Asian and other Belt and Road markets.
Ultimately, the key policy objectives of the BRI are to encourage trade and collaboration, enhance financial integration and facilitate greater connectivity of the region. While the initial wave of BRI activity is focused on the development of real assets, the knock-on opportunities for financial institutions across sectors and markets will only continue to grow. With both public and private investment pouring into the BRI, banks in Hong Kong need to tailor a comprehensive growth strategy to leverage the city’s strengths as an international finance centre to capitalise on these opportunities. It is also essential for these banks to carefully select which geographic markets to enter, and consider whether to offer a full suite of banking services or focus on deal-based opportunities in these markets.
We expect RMB funding to play an important role in Belt and Road Initiative activity, with Hong Kong well-positioned as a leading centre for global offshore RMB. This is likely to present more opportunities for banks in Hong Kong to facilitate the further internationalisation of the RMB by helping stakeholders along the entire value chain convert and use the currency for their investments.
24 | Hong Kong Banking Report 2018
© 2018 KPMG, a Hong Kong partnership and a member firm of the KPMG network of independent member firms affiliated with KPMG International Cooperative (“KPMG International”), a Swiss entity. All rights reserved.

Hong Kong Banking Report 2018 | 25
© 2018 KPMG, a Hong Kong partnership and a member firm of the KPMG network of independent member firms affiliated with KPMG International Cooperative (“KPMG International”), a Swiss entity. All rights reserved. © 2018 KPMG, a Hong Kong partnership and a member firm of the KPMG network of independent member firms affiliated with KPMG International Cooperative (“KPMG International”), a Swiss entity. All rights reserved.

As operational and regulatory complexity increases and competitive pressure grows, financial institutions are on the lookout for different solutions to help deliver business outcomes beyond cost reduction. Attention is turning to how technology-enabled managed services can be used as a value-based outcome and delivery focused alternative to traditional outsourcing approaches.
Banks have for a long time used outsource service providers to improve resource allocation and business efficiencies in non-core activities. Business process outsourcing (BPO), which refers to the contracting of operations or responsibilities of a specific process, is one popular form of outsourcing. The primary gain from early models was cost, including arbitrage through location. Less attention was given to remodelling existing processes and introducing technology solutions to create sustainable outsourcing.
At KPMG our clients are increasingly looking for rapid mobilisation of solutions combining our subject matter expertise, tools, technology and operational excellence. Using KYC and customer due diligence as an example, the change from largely people augmentation to support existing processes to technology-enabled solutions delivered and managed by third parties has been rapid. Moreover, we are seeing challenges in areas traditionally considered in-house domains, such as tax compliance services, opening up a new way of thinking in working with third parties. Banks recognise that they don’t need to do everything themselves anymore and are turning from traditional service provider models to find strategic partners who can make a real difference to outcomes and provide discipline to move the dial.
With the regulatory environment continuing to emphasise the need for greater data accuracy coupled with a demand for more customer data for analytics, banks are still spending significant time and effort on data remediation and ongoing maintenance. Much of this effort still sits with the front line. It is a similar story across the entire industry, with valuable resources being diverted away from supporting business growth and serving the customer’s needs.
This combination of regulatory and business pressure is driving banks to look for solutions to perform data remediation in a more transparent, consistent, efficient and sustainable manner. The increased demands are prompting banks to rethink whether the conventional approach to outsourcing is sufficient to meet their business needs. Managed services can, depending on the service provider’s
Banks in Hong Kong are increasingly on the lookout for technology-enabled solutions to help deliver business outcomes beyond cost reduction. Managed services is swiftly emerging as a value-based alternative to traditional outsourcing.
Rupert ChamberlainCEO, Managed ServicesKPMG China
Managed Services: the way forward
26 | Hong Kong Banking Report 2018
© 2018 KPMG, a Hong Kong partnership and a member firm of the KPMG network of independent member firms affiliated with KPMG International Cooperative (“KPMG International”), a Swiss entity. All rights reserved.

capabilities, also integrate other processes and subject expertise, including anti-money laundering, regulations (including taxation), banking, financial services, tech and innovation. This holistic approach is often complemented by a customer outreach component, which sets it apart from traditional outsourcing methods. It is no longer about the cheapest service provider, but finding partners that can add value.
Regulators are keeping a close watch on the growing complexities and operational integration between financial institutions and service providers. Services can involve a significant transfer of operational control in critical tasks from banks to third-party vendors, leading to data protection, privacy and infringement concerns. All of these matters need to be well controlled with appropriate oversight by the banks.
A well-planned managed services strategy should therefore take into account the past, present and future regulatory landscape in order to obtain the necessary approvals for projects and help ensure their smooth implementation in the long term. Design of internal controls and governance structures is also a key part of maintaining a successful operation.
The time is right for banks to take a fresh look at their operations. In spite of the many considerations, the benefits that might be attainable from an effective managed services strategy are potentially significant. In addition to benefitting from the access to flexible and scalable resource and strong process expertise, banks in Hong Kong may finally be able to free up front line resources to support a growth agenda and ensure the needs of customers are met.
Regulators are keeping a close watch on areas concerning data protection, privacy and infringement. A well-planned managed services strategy needs to take into account the past, present and future regulatory landscape.
The case for managed services A typical managed services project can range from months to years. Given that a significant amount of upfront investment is needed to initiate a project, banks need to consider carefully whether managed services is the right approach by answering the following questions:
1) Would the failure of this function/process increase enterprise risk?
2) Would this activity differentiate you from your competitors?
3) Does this task requires highly specialised technical expertise?
4) Do the technical skills required demonstrate a high velocity of change?
Managed services can be the optimal method if the majority of answers are yes. If not, conventional outsourcing methods might already be sufficient.
Source: KPMG Research
Hong Kong Banking Report 2018 | 27
© 2018 KPMG, a Hong Kong partnership and a member firm of the KPMG network of independent member firms affiliated with KPMG International Cooperative (“KPMG International”), a Swiss entity. All rights reserved. © 2018 KPMG, a Hong Kong partnership and a member firm of the KPMG network of independent member firms affiliated with KPMG International Cooperative (“KPMG International”), a Swiss entity. All rights reserved.

Financial institutions globally have begun to rethink their legal entity booking arrangements. With the right strategies and policies, Hong Kong has a chance of strengthening its regional booking centre credentials as the industry shifts away from a single global booking entity model.
Traditionally, London and New York are the prime locations for booking securities and related derivatives transactions for major global financial institutions. While Hong Kong hosts many global banks and possesses a strong economic and business infrastructure, the level of booking activity in the city is some way behind the other major international financial centres.
The latest regulatory and macroeconomic developments globally, however, are creating new opportunities for Hong Kong to break the status quo. The implementation of MiFID II, for example, is having a significant impact on the financial services landscape, in particular on those international banks that use a single global entity, usually in the UK, Europe or the US, to book their global businesses.
In the past, banks benefitted from this approach as it was more capital efficient to centralise activity in a single entity. That has been changing as a result of developments in regulatory capital standards, the introduction of ring-fencing requirements in some jurisdictions as well as the impact of Brexit which is requiring some institutions to rethink their European booking arrangements. Furthermore, MiFID II has placed a significant additional burden on the Asian businesses of those global banks that use European entities for global booking. This is due to the extra-territorial nature of many of the MiFID II obligations which apply to the Asian activities booked in the European booking entity. These changes have narrowed the cost advantages of using a single global booking entity over using local Asian booking centres for Asian businesses.
New transfer pricing regulations in Hong Kong have added to the complexity. Transfer pricing arrangements now need to be documented, which can be cumbersome for banks with global booking models.
There is a growing consensus in the market that the historic model of using a single global booking entity in New York or London may no longer be the most optimal approach given the recent regulatory constraints and developments.
Tom Jenkins Head of Financial Risk ManagementKPMG China
Strengthening Hong Kong’s role as a regional booking centre
28 | Hong Kong Banking Report 2018
© 2018 KPMG, a Hong Kong partnership and a member firm of the KPMG network of independent member firms affiliated with KPMG International Cooperative (“KPMG International”), a Swiss entity. All rights reserved.

Hong Kong has the ambition and attributes to become the Asian booking centre of choice. If successful, this would facilitate the city’s long term development and boost its standing as an international financial centre.
Understanding MiFID IIMiFID II imposes requirements on financial market participants that revolve around enhancing investor protection, market transparency and corporate governance. It requires changes in market infrastructure and provides supervisors with additional powers.
It covers financial services businesses operating in the European Economic Area (EEA). The legislation also affects banks elsewhere by virtue of having a licensed branch in the EEA or dealing with EEA counterparties, products and trading venues. Branches of EEA firms operating outside the region are also required to comply with certain MiFID II requirements.
Due to the wide scope of regulations, impact on existing business models and the need of involvement as well as coordination of many areas and business units, catering to the requirements of MiFID II can be complex and time-consuming.
Source: KPMG Research
The business case for banks to establish Asian booking centres for their activities in the region is gaining momentum. This is driven by Asia’s potential as a key growth driver of the global economy in the coming decades as well as the global regulatory focus on improving corporate governance.
Regulators are also in favour of banks adopting local booking entities as it allows for easier supervision instead of having to oversee traders and other front office professionals who might otherwise be based in a different time zone. The Hong Kong Monetary Authority (HKMA), in particular, is encouraging banks to set up in Hong Kong and has specifically said they will expedite the applications of those that will be adopting internal models for capital purposes.
On the back of these developments, Hong Kong has the attributes to position itself as the premier Asian booking centre. The city enjoys a unique comparative advantage over its regional rivals such as Singapore and Tokyo due to its relationship with mainland China. With the right strategy and policies, it has the potential to become the first choice booking destination for China-affiliated financial institutions that are expanding abroad as well as other banks looking for a replacement for their existing booking centres.
The HKMA has acted swiftly towards this as seen by its Banking (Amendment) Ordinance 2018 in February. The amendment addressed a key issue in the Ordinance, which did not take into account the netting of risk between physical equities, equities swaps and other types of derivatives.
While efforts have been made to refine Hong Kong’s financial regime, more can still be done to strengthen the city’s market infrastructure. This involves improving the information system and operating procedures for securities transactions, in particular cross-border transactions. An effective and efficient market infrastructure could allow buyers, sellers and intermediaries to execute transactions reliably and economically. Achieving this would require a deepening in collaboration between regulators, financial institutions and other market stakeholders.
Enhancing Hong Kong’s role as the premier Asian booking centre will facilitate the city’s long term development. The increased asset pool, liquidity and amount of securities trading will encourage more business activity in Hong Kong, which in turn will create additional job opportunities and boost its standing as an international financial centre.
Hong Kong Banking Report 2018 | 29
© 2018 KPMG, a Hong Kong partnership and a member firm of the KPMG network of independent member firms affiliated with KPMG International Cooperative (“KPMG International”), a Swiss entity. All rights reserved. © 2018 KPMG, a Hong Kong partnership and a member firm of the KPMG network of independent member firms affiliated with KPMG International Cooperative (“KPMG International”), a Swiss entity. All rights reserved.

With Hong Kong’s Securities and Futures Commission (SFC) increasing its focus on best execution through thematic reviews and a recently issued Circular, banks in the city should actively seek to implement a comprehensive framework to deliver consistent best execution for their clients.
In January this year, the SFC issued a Circular setting out guidance on the standards of conduct and internal controls around delivering best execution – the duty of licensed corporations acting on behalf of investors to ensure that they execute client orders on the best available terms. This follows a thematic review that was launched in November 2016, which assessed the effectiveness of market practices in delivering best execution.
The guidance provided in the Circular is aligned with international trends in best execution, and is a welcome development in Hong Kong as it emphasises a greater regulatory focus on ensuring market integrity and the protection of investors.
The six pillars of best executionThe Circular provides further guidance on six pillars of best execution: governance and management supervision; best execution factors; the applicability of best execution; the responsibilities of execution staff; controls and monitoring; and arrangements with affiliates and third parties.
We believe that governance is the first and most important factor for banks in Hong Kong to consider at this stage in order to develop a robust best execution framework that is holistic and fit for purpose. In this regard, policies and procedures regarding best execution should be established to cover different types of financial instruments, including both listed and over-the-counter products, and should be reviewed and updated on a regular basis.
If they have not done so already, banks should seek to establish working groups to examine existing processes, perform gap analyses and review their overall ownership structure, roles and responsibilities of best execution. While it is important to ensure there is an overall governance committee with sufficient seniority to sign off on best execution, there is also a need to establish working groups that are lower-level and closer to the actual execution to really understand the processes front to back.
David Lonergan Director, Risk ConsultingKPMG China
An increasing focus on best execution
30 | Hong Kong Banking Report 2018
© 2018 KPMG, a Hong Kong partnership and a member firm of the KPMG network of independent member firms affiliated with KPMG International Cooperative (“KPMG International”), a Swiss entity. All rights reserved.

Another key topic is the applicability of carve-outs, under which banks are not required to apply all aspects of their best execution framework for certain services, within certain parameters. The SFC’s Circular indicates that while carve-outs are allowed for principal transactions, there needs to be a well-founded basis for it, with appropriate governance in place, as well as transparency and disclosure to clients.
To enhance their overall best execution frameworks, banks in Hong Kong should consider utilising technology solutions around transaction cost analysis (TCA) appropriate for the size and complexity of their business. We continue to see an increasing number of banks reaching out to external providers of TCA solutions to help enhance their execution capabilities.
Another hot topic in the market is how best execution applies to affiliate parties. The Circular stresses that banks should ensure they conduct adequate and regular due diligence on their affiliated parties that they use for execution, to ensure the best outcomes are received by their end clients and manage conflicts of interest.
Ongoing monitoringLooking ahead, the SFC has stated that it will continue to monitor and focus on best execution practices and may propose further measures. With this in mind, it is also important for market participants to understand that best execution is not a new requirement in Hong Kong and that irrespective of the setup, size or scale of the organisation, the duty of ensuring best execution ultimately falls upon all licensed corporations.
This is particularly important as Hong Kong’s financial market has become more complex, and the proliferation of electronic trading and the advancement of products including over-the-counter derivatives are adding to this complexity.
In addition, best execution remains high on the agenda globally as a result of a renewed focus on better conduct practices following the global financial crisis. The introduction of the Markets in Financial Instruments Directive II (MiFID II) in January this year drove a wave of work globally. However, banks need to ensure that their best execution frameworks are locally tailored for Hong Kong.
Banks in the city should ensure that they put in place the right governance, controls and monitoring processes around best execution, enabled by TCA and other technology solutions appropriate for the size and complexity of their business. It is also essential for them to carefully review their procedures for assessing third parties and affiliates, regularly educate employees on their roles and responsibilities, and conduct regular reviews of their framework to ensure consistent best execution delivery.
If they have not done so already, banks should seek to establish working groups to examine existing processes, perform gap analyses and review their overall ownership structure, roles and responsibilities of best execution.
Hong Kong Banking Report 2018 | 31
© 2018 KPMG, a Hong Kong partnership and a member firm of the KPMG network of independent member firms affiliated with KPMG International Cooperative (“KPMG International”), a Swiss entity. All rights reserved. © 2018 KPMG, a Hong Kong partnership and a member firm of the KPMG network of independent member firms affiliated with KPMG International Cooperative (“KPMG International”), a Swiss entity. All rights reserved.

The Hong Kong Monetary Authority’s (HKMA) latest initiative to facilitate the establishment of virtual banks in the city could be instrumental in promoting fintech and innovation, and redefining customer experience.
The HKMA views the development of virtual banks – which deliver retail banking services through the internet or other electronic channels instead of physical branches – as an important initiative to bring Hong Kong into a new era of smart banking, and as a significant factor in the long-term success of the city’s banking sector.
In February it launched a consultation on proposed revisions to the Guideline on Authorization of Virtual Banks issued in 2000. This was followed by the results of the consultation and the final version of the revised guidelines which was published at the end of May. A key revision includes an indication that non-financial firms may apply to open a virtual bank that is supported by a strong parent – not necessarily a financial institution – to provide managerial, financial and technology support. This revision changes the original guidelines, which required virtual banks to be at least 50 percent owned by a well-established bank or other financial institution.
Enhancing customer-focused digital servicesThe revised guidelines open the door for new players to set up a virtual bank in Hong Kong, and we are already seeing significant interest from a range of companies, including fintech start-ups, large technology companies and other large corporates. The HKMA indicated in their 30 May press release that they have received expressions of interest from more than 50 potential applicants. The nature of virtual banks will likely create an advantage from a cost perspective, and will also help drive financial inclusion in Hong Kong by targeting the retail segment, including small and medium-sized enterprises.
While many traditional banks already have well-developed mobile and online banking platforms, we anticipate that allowing technology companies to set up virtual banks will significantly raise standards in the industry and enhance the sophistication of the technology used.
These new entrants should provide significant impetus for traditional banks to innovate, work with innovative start-ups, forge strategic partnerships and adopt the latest fintech solutions and technologies to enhance their service offering and improve customer experience. Hong Kong’s close proximity to Shenzhen – where some of the world’s most innovative fintech developments are taking place – is
James Harte Director, Global Strategy GroupKPMG China
Tom JenkinsPartner, Financial ServicesKPMG China
Welcoming the development of virtual banks in Hong Kong
32 | Hong Kong Banking Report 2018
© 2018 KPMG, a Hong Kong partnership and a member firm of the KPMG network of independent member firms affiliated with KPMG International Cooperative (“KPMG International”), a Swiss entity. All rights reserved.

further enabling both incumbents and new entrants to study and capitalise on these opportunities. This benefit is enhanced by the ongoing development of the Greater Bay Area in Southern China, where a key focus is the transformation of the region into a global technology and innovation hub.
Many fintech companies have developed innovative technology that can enhance the overall customer experience, lower the costs of financial products and facilitate the granting of loans to consumers who otherwise do not have the credit history to obtain finance from traditional banks. This could significantly boost financial inclusion and encourage traditional banks to further develop their own platforms and customer-focused digital services, thereby raising the bar across the entire banking sector in Hong Kong.
A new approach to risk managementWhile the revised guidelines will encourage the development of virtual banks, the HKMA remains focused on ensuring that the new entrants meet the regulations that apply to existing banks, particularly around capital, risk management and governance requirements. From our experience working with a number of digital and challenger banks in mainland China, Europe, the US and Australia, we find that their strong emphasis on technological innovation, agile development and simple and targeted products require a new and dynamic approach to conduct and risk management.
With technology at the core of a virtual bank’s operations, the risk profile of a start-up virtual bank will vary from traditional banks. For example, while a successful cyber attack is a serious matter for an established traditional bank, it could strike a fatal blow to the reputation of a virtual bank. Furthermore, given the greater use of open application programming interfaces and partnerships with third parties, data protection is another area which needs to be carefully addressed. In an environment where all customers will soon be able to withdraw money in an instant online (and are used to doing so), any issues are amplified.
Meanwhile, from a conduct perspective, there are also new risks arising from the targeting of potentially vulnerable customer segments which have previously been underserved by traditional financial institutions.
Adopting a new approach to risk management can also bring benefits to both virtual banks and traditional banks, as well as their customers. For example, technology used to on-board customers and address know your customer and anti-money laundering requirements can be integrated with the overall platform in a much more efficient way. This would allow virtual banks to operate safely, and could also benefit a number of existing banks that have established electronic platforms to reduce the costs of their risk and compliance structure.
For their part, Hong Kong’s regulators will also need to consider adapting some of the existing regulatory requirements to address this new approach to risk management, balancing the need to maintain a safe banking system against an imperative to encourage innovation, enhanced customer service and financial inclusion.
With the revised guidelines generating significant interest in the market, the companies that apply for a virtual bank licence need to ensure that they carefully develop an appropriate business plan to put in place all of the systems, controls and processes to meet the HKMA’s requirements. Existing financial institutions should also view the emergence of virtual banks as a catalyst to innovate, adopt new technologies, and enhance their online and mobile platforms to improve customer experience and boost the overall competitiveness of Hong Kong’s banking industry.
Overall, we believe that the establishment of virtual banks is a welcome development that will lead to significant new opportunities for the banking sector in Hong Kong. In ten years, we may see a very different competitive landscape, with a healthy mix of new entrants and traditional players offering an exciting new customer experience and further propelling Hong Kong’s status as a regional fintech innovation hub.
From our experience working with a number of digital and challenger banks in mainland China, Europe, the US and Australia, we find that their strong emphasis on technological innovation, agile development and simple and targeted products require a new and dynamic approach to conduct and risk management.
Many fintech companies have developed innovative technology that can enhance the overall customer experience, lower the costs of financial products and boost financial inclusion. This could encourage traditional banks to further develop their own platforms and customer-focused digital services, thereby raising the bar across the entire banking sector in Hong Kong.
Hong Kong Banking Report 2018 | 33
© 2018 KPMG, a Hong Kong partnership and a member firm of the KPMG network of independent member firms affiliated with KPMG International Cooperative (“KPMG International”), a Swiss entity. All rights reserved. © 2018 KPMG, a Hong Kong partnership and a member firm of the KPMG network of independent member firms affiliated with KPMG International Cooperative (“KPMG International”), a Swiss entity. All rights reserved.

Amid ongoing regulatory scrutiny in Hong Kong, driving an effective compliance function remains mission critical. Banks are increasingly relying on their compliance teams to keep abreast of risk and regulatory change, and work with the front line of the business to ensure that risks are identified, understood, owned and managed. Rapid technological and socio-political change is also driving the transformation of risk at an unprecedented speed. Banks therefore need to ensure that skills and capability development in control functions, including compliance, is able to keep up with this pace of change.
After-the-fact analyses indicate that the financial cost of non-compliance far outweighs the cost of compliance. In addition to potential fines, sanctions and losses in productivity and revenue, non-compliance can cause significant reputational damage to an organisation, which can have a negative impact on its share price and overall market value. Social media enables rapid and large-scale consumer activism, which is increasing the vulnerability of firms’ reputations and brand value. At the same time, ongoing cost pressure means that all investment, including that in the compliance function, should be carefully assessed.
What is the value of compliance? The global financial crisis has brought about a swift evolution of the way in which compliance risk is identified and managed. Among other changes, regulatory focus on management accountability has brought risk ownership home to the front office with unprecedented clarity, in many instances leading to the creation of first-line risk functions. This has inevitably led to some element of duplication and a lack of clarity of responsibilities between the first and the second line. Getting the operating model right in terms of the positioning and responsibilities of the compliance function is essential for financial institutions in Hong Kong. Banks need to evaluate how compliance – as part of the second line of defence – is defined in practical terms, and ensure that everyone in the organisation understands their role in terms of identifying, understanding and managing risk and compliance.
There is also a strong sense that compliance can no longer afford to identify all issues after the fact. Use cases for effective risk management through the innovative use of predictive analytics exist – we have seen some large banks pilot analytics initiatives to predict operational breakdowns in IT systems, and leverage behavioural data to manage potential credit and conduct risk. There is an increasing expectation that compliance should utilise these same techniques in order to give management a more predictive view of risk to enable pre-emptive and efficient mitigation.
Susanne Steyn Director, Risk ConsultingKPMG China
Embracing change to drive effective compliance
34 | Hong Kong Banking Report 2018
© 2018 KPMG, a Hong Kong partnership and a member firm of the KPMG network of independent member firms affiliated with KPMG International Cooperative (“KPMG International”), a Swiss entity. All rights reserved.
Transitioning towards digitisationWe continue to see the digitisation of the front office as banks seek to provide customers with new digital platforms in order to meet evolving demand and remain competitive. For their part, compliance functions at financial institutions need to consider how to deal with digitisation on two fronts. First, in terms of the execution of their mandate, compliance functions should assess whether digitisation creates new risk, changes the way risks manifest or their potential impact, and therefore how to monitor and detect risk. Second, in terms of their own programmes, they need to use disruptive technologies in a more innovative fashion in order to achieve greater coverage.
Some banks in Hong Kong are starting to think smarter and more carefully about their compliance frameworks, and are adopting disruptive technologies and solutions to minimise compliance costs and increase efficiency. By leveraging data analytics and the latest technologies, compliance teams can increase their coverage, offer a real-time identification of risk and provide actionable insights to senior management, enabling them to focus on the areas that pose the greatest risk to the organisation.
Shaping the compliance workforce of the futureAs Hong Kong banks and their compliance functions continue to digitise, they also need to consider how to best shape the skills and capabilities of their future compliance workforce to become more effective in the new digital era.
One key area of focus is on the integration of a multigenerational workforce in the compliance function. The onset of new technologies is creating a need to find an optimal workforce balance between technology capabilities and the more traditional legal and compliance expertise. Banks should therefore actively seek to identify digital change agents and employ new tech-savvy talent, while providing adequate training to their existing compliance workforce on how to effectively utilise data analytics and new technologies. By successfully leveraging the unique skills and expertise of a multigenerational workforce, compliance departments can help manage costs, achieve greater coverage and keep pace with the rapid transformation of risk.
In this regard, we continue to work with a number of financial institutions in Hong Kong on delivering comprehensive compliance transformation. This includes supporting risk frameworks within the organisation and analysing how these risks translate into a digitalised framework, as well as the resulting impact of this transformation on compliance resources. We also continue to provide technology services around the utilisation of digital labour, big data and predictive analytics to make compliance programmes more effective and forward-looking.
We believe that the successful banks in the long run will be the ones that leverage their compliance functions to define a forward-looking view of risk, are clear on the accountabilities for the identification and management of regulatory risk at all levels of the organisation, and are able to harness emerging technologies to speed up the cycle of risk identification and remediation.
To maximise the value of the compliance department, they should be encouraged and given the tools to become more predictive and forward-looking. This requires leveraging data analytics to enable compliance functions to collect, manage and understand data, and transform it into meaningful actionable insights to inform business strategy.
The onset of new technologies is creating a need to find an optimal workforce balance between technology capabilities and the more traditional legal and compliance expertise. Banks should therefore actively seek to identify digital change agents and employ new tech-savvy talent, while providing adequate training to their existing compliance workforce on how to effectively utilise data analytics and new technologies.
Hong Kong Banking Report 2018 | 35
© 2018 KPMG, a Hong Kong partnership and a member firm of the KPMG network of independent member firms affiliated with KPMG International Cooperative (“KPMG International”), a Swiss entity. All rights reserved. © 2018 KPMG, a Hong Kong partnership and a member firm of the KPMG network of independent member firms affiliated with KPMG International Cooperative (“KPMG International”), a Swiss entity. All rights reserved.

For the past few years, financial institutions globally have been challenged on a continuous basis to step up their efforts to meet regulatory requirements and expectations and avoid regulatory reprimands and fines in the area of financial crime compliance. This rather reactive approach to compliance often meant that institutions resorted to tactical solutions to address immediate deficiencies, as opposed to strategic thinking to develop a sustainable financial crime risk management programme. We believe there is a need to shift from reactive compliance to proactive risk management and preventing anticipated risks. A key component of this is the way the institution leverages its data.
While customer data obtained as part of Know Your Client (KYC) in customer on-boarding processes is leveraged to perform risk assessments and determine the level of ongoing monitoring, many financial institutions run transaction monitoring and sanctions screening programmes as separate operations, often using disparate systems, with little to no integration of post-evaluation information.
Institutions that have become aware of the need to harness customer and transactional data in tandem have started to deploy technology capable of linking the KYC databases and transaction monitoring databases for a more integrated approach to evaluate customer risk holistically. The value to be derived from customer and transactional data is not only in financial crime risk management. It can and should contribute to client lifecycle management, enhancing customer experience, and supporting the institution’s growth initiatives.
Data analytics and machine learningOver the past year, data analytics and machine learning have made significant in-roads into the financial crime risk space. Close to 35 percent of our client advisory work was delivered with data analytics or machine learned analytics, and this proportion is growing fast.
Many financial institutions in Hong Kong have deployed automated transaction monitoring solutions that run on the basis of pre-set rules of known money laundering typologies to trigger alerts of potentially suspicious transactions, which are flagged for investigation. While financial institutions ramped up resources to investigate potentially suspicious cases, the low conversion rate of cases worth investigating poses questions on the system’s effectiveness in detecting true
Rani KamaruddinPartner, AML & Sanctions Services, Hong KongKPMG China
Kyran McCarthyPartner, Asia-Pacific Head of AML & Sanctions ServicesKPMG China
Unlocking the power of data to combat financial crime
36 | Hong Kong Banking Report 2018
© 2018 KPMG, a Hong Kong partnership and a member firm of the KPMG network of independent member firms affiliated with KPMG International Cooperative (“KPMG International”), a Swiss entity. All rights reserved.

anomalies. Coupled with the fact that money launderers continue to advance in methods of money laundering which mostly perfectly circumvent the pre-set rules, we are now using data analytics as a means to perform rigorous analysis and scrutiny of the system settings of scenarios, thresholds and parameter values.
Looking ahead, the use of data analytics can be leveraged as follows:
• To complement the current methods of monitoring customer transactions by helping banks to identify patterns of suspicious behaviour that could be indicative of money laundering or terrorist financing.
• To perform tuning of the transaction monitoring system settings. Through data analytics on historical data sets, the thresholds and parameter values are reviewed against the system settings to enable the tuning of the system settings.
• As more data points are collected on customer behaviour and transactional behaviour, data analytics can be leveraged to perform a more comprehensive analysis of the customer holistically. This should enrich the customer profile and provide the institution insight to support client lifecycle management, financial crime risk management and its overall growth agenda.
• To help review and optimise the operation model for alert investigations. With the use of machine learning algorithms, a model can be trained to perform analytics of the characteristics of the alert to determine whether the alert is considered to require investigations by human operators or can be closed on the basis of the criteria analysed. Additional insights, for example the use of certain transaction types/products and services, can be derived from the same analysis.
Regulatory supportFor their part, Hong Kong’s regulators have voiced their support for banks to explore smarter ways of operationalising controls in financial crime. They also continue to emphasise the importance of maintaining effective risk management processes, as well as up-to-date and complete customer data.
There is also an emerging acceptance that there is greater value to be gained from focusing on how to use data to manage financial crime risk, as well as an openness to using new technologies to enrich a customer’s profile for purposes beyond financial crime risk management. While regulators are showing their intent to foster innovation, the challenge is that the rapid development of new technology is often outpacing regulatory change. As a result, regulators would benefit from support from the banking industry to better understand the risks and benefits of new technologies in the context of how it can assist with enhancing the management of financial crime risk.
The value to be derived from customer and transactional data is not only in financial crime risk management. It can and should contribute to client lifecycle management, enhancing customer experience, and supporting the institution’s growth initiatives.
As more data points are collected on customer behaviour and transactional behaviour, data analytics can be leveraged to perform a more comprehensive analysis of the customer holistically. This should enrich the customer profile and provide the institution insight to support client lifecycle management, financial crime risk management and its overall growth agenda.
Hong Kong Banking Report 2018 | 37
© 2018 KPMG, a Hong Kong partnership and a member firm of the KPMG network of independent member firms affiliated with KPMG International Cooperative (“KPMG International”), a Swiss entity. All rights reserved. © 2018 KPMG, a Hong Kong partnership and a member firm of the KPMG network of independent member firms affiliated with KPMG International Cooperative (“KPMG International”), a Swiss entity. All rights reserved.

Amid increasing global and local regulatory scrutiny, banks in Hong Kong can expect to see a greater focus – and potentially more fines – on Non-Financial Regulatory Reporting (NFRR). The introduction of the Markets in Financial Instruments Directive (MiFID II) at the start of 2018 is also placing a greater emphasis on reporting obligations. Banks should therefore seek to invest in quality assurance (QA), automation and data analytics to enhance their reporting processes, reduce costs and minimise the risk of misreporting.
The regulatory focus on NFRR – which covers reports typically produced by functions outside the finance area of an organisation, including transactional, position, compliance and front office reporting – extends to SFC enforcement and HKEX inspections. While the fines in Hong Kong are relatively low by global standards, significant cost and management attention is required to deal with issues.
Some banks in Hong Kong are revisiting their infrastructure and controls frameworks in this area. For example, a number of banks use multiple legacy systems and data sources to compile their NFRR returns and continue to face a number of challenges around enhancing their NFRR processes. The processes often contain manual overlays and there are risks around underlying data quality which increase the chance of reporting inaccuracies. Furthermore, the level of governance and awareness around NFRR continues to vary vastly across organisations due to the decentralised nature of report production across departments and locations.
A focus on QA, automation and data analyticsWhile these challenges are not new, many banks are still operating on a reactive basis, putting in place manual processes and system fixes to remediate an issue only once it has been identified. However, we are starting to see some banks in Hong Kong becoming more proactive, as they look at how to leverage digital solutions to become more strategic around diagnosing and enhancing their NFRR capabilities.
Firstly, establishing QA – such as the regular testing of specific high-risk reports – for NFRR is a key factor. In particular, independent testing capabilities to provide comfort on a regular basis of report output is a very powerful diagnostic tool. This will be an increasingly important area for banks going forward, with the extra layer of control and review providing value to those with MIC responsibilities who may have ownership of production for certain reports.
Establishing quality assurance – such as the regular testing of specific high-risk reports – for NFRR is a key factor. In particular, independent testing capabilities to provide comfort on a regular basis of report output is a very powerful diagnostic tool. This will be an increasingly important area for banks going forward, with the extra layer of control and review providing value to those with MIC responsibilities who may have ownership of production for certain reports.
Catherine Young Director, Risk ConsultingKPMG China
A digitally-enabled approach to Non-Financial Regulatory Reporting
38 | Hong Kong Banking Report 2018
© 2016 KPMG, a Hong Kong partnership and a member firm of the KPMG network of independent member firms affiliated with KPMG International Cooperative (“KPMG International”), a Swiss entity. All rights reserved.

Another area to explore in reducing the regulatory risks around NFRR is robotic process automation (RPA), which can help remove certain manual processing elements related to the amalgamation of data from multiple data sources and legacy systems. This would in turn reduce costs and minimise the regulatory and operational risks of misreporting as a result of manual errors. In addition, a lot of these processes lend themselves to RPA because they are quite specific and clearly defined, making it easy for banks to isolate and compartmentalise the tasks they want the bots to perform.
Data and analytics present another key opportunity for banks to enhance their NFRR processes. Some banks do not currently have adequate management information or data from which to understand where the risks in NFRR lie. By leveraging comprehensive data analytics solutions, they can gain greater insight into where there may be high risks of misreporting, and can focus their remediation efforts and manage the process more effectively.
While data and analytics solutions present a significant opportunity for banks to improve their NFRR processes, it is also essential to maintain the quality of data to ensure robust NFRR. Therefore, in addition to automating report production, banks should seek to implement exception management and other management information reporting to support the NFRR processes, identify data quality issues that need fixing such as dropped data feeds, and provide cross-checks on data quality.
In the current environment where the pace of new regulation is slowing, banks are starting to focus more of their attention on achieving faster growth. However, as these organisations actively pursue their growth agenda, they need to ensure that their regulatory and change management processes and their associated costs are in order and managed effectively.
With greater scrutiny and enforcement expected around NFRR in Hong Kong, senior management at banks need to take an active role in pulling together a strategic vision and a holistic, digitally-enabled framework to improve the firms’ overall NFRR capabilities. This should include a greater focus on leveraging RPA and data analytics tools and technologies, enhancing overall NFRR governance across all departments, and clearly defining and documenting responsibilities and procedures to maintain an efficient, controlled reporting process.
Robotic process automation can help remove certain manual processing elements related to the amalgamation of data from multiple data sources and legacy systems. This would in turn reduce costs and minimise the regulatory and operational risks of misreporting as a result of manual errors.
Data and analytics present another key opportunity for banks to enhance their NFRR processes. Some banks do not currently have adequate management information or data from which to understand where the risks in NFRR lie. By leveraging comprehensive data analytics solutions, they can gain greater insight into where there may be high risks of misreporting, and can focus their remediation efforts and manage the process more effectively.
Hong Kong Banking Report 2018 | 39
© 2018 KPMG, a Hong Kong partnership and a member firm of the KPMG network of independent member firms affiliated with KPMG International Cooperative (“KPMG International”), a Swiss entity. All rights reserved. © 2016 KPMG, a Hong Kong partnership and a member firm of the KPMG network of independent member firms affiliated with KPMG International Cooperative (“KPMG International”), a Swiss entity. All rights reserved.

Hong Kong’s banking industry is undergoing significant change as financial institutions seek to invest in the latest technologies to help transform their businesses and remain competitive. However, the speed and scale of new technology development and adoption is creating new cybersecurity risks, and banks need to ensure that they proactively take steps to strengthen their resilience against cyber-attacks.
Becoming cyber resilient Many banks in Hong Kong are starting to embrace innovative and emerging technologies such as mobile, robotic process automation (RPA), blockchain and Open application programming interfaces (Open APIs). Embracing such technologies allows banks to reduce operating costs, increase competitiveness and enhance customer experience. Having the vision, speed and agility to adopt new technologies is crucial for existing banks, as fintech providers and new entrants to the market are increasingly leveraging digital platforms and solutions to disrupt conventional business models. However, this is also creating a fast-evolving cyber threat landscape where the potential financial and reputational damage caused by cyber-attacks is increasing exponentially.
Banks in Hong Kong therefore need to ensure that they embed cyber risk management processes into all digital initiatives and adopt a robust cyber resilience strategy. For its part, the Hong Kong Monetary Authority (HKMA) launched the Cybersecurity Fortification Initiative (CFI) at the end of 2016 to bolster cyber resilience among the city’s banks and in the broader financial services sector.
Achieving meaningful cyber resilience requires broad acknowledgement that the banking industry as a whole must be prepared to deal with cyber crises that cannot be easily predicted. It also requires building up robust cyber threat intelligence capabilities to gather and analyse both internal and external information, and implement cyber crisis management processes. Furthermore, banks should collaborate and share information industry-wide to help prevent attacks and respond to cyber incidents faster, which is one area that has been promoted through the CFI’s Cyber Intelligence Sharing Platform.
Bhagya PereraDirector, IT AdvisoryKPMG China
Patrick WongDirector, IT AdvisoryKPMG China
Henry ShekHead of IT Advisory Risk ConsultingKPMG China
Integrating cybersecurity into a broader digital strategy
40 | Hong Kong Banking Report 2018
© 2018 KPMG, a Hong Kong partnership and a member firm of the KPMG network of independent member firms affiliated with KPMG International Cooperative (“KPMG International”), a Swiss entity. All rights reserved.

As banks strengthen their cyber resilience capability, they need to consider how best to prioritise cybersecurity investments in not just protection, but also in the ability to detect, respond and recover from cyber incidents in an effective and timely manner. Leading banks are channelling investments in cybersecurity to protect what really matters, to enhance customer experience and provide confidence to continue along the digital journey.
As banks continue to team up with fintech and technology partners to deliver services more efficiently for customers, it is important to keep in mind that every new third-party relationship and digital connection increases cyber risks. This could include the risk of data breaches, disruptions to critical banking systems and services, and the loss of public confidence in digital banking channels. Therefore, as banks open up to this larger ecosystem, beyond complying with regulatory requirements, putting in place holistic third-party security risk management processes is important. In particular, focusing on security monitoring of third-party connections, products and services, understanding end-to-end supply chain threat scenarios and embedding third-party security risk assessments in every key digital initiative is essential.
Keeping the focus on the customerWith technology at their fingertips in all aspects of their daily lives, customers are increasingly looking for a more personalised, digitally-focused banking experience that offers them a seamless and efficient service. In addition, the emergence of virtual banks that are now allowed to set up in Hong Kong will redefine customer experience, and boost competition in the market. While banks continue to improve digital banking services and their overall digital journey, it is essential for them to ensure that corresponding cybersecurity strategies are ultimately focused on the customer. This means efficiently balancing the delivery of a seamless customer experience with the provision of a secure environment for investments, data and other personal information.
One way this can be done is through adopting a new approach to customer identity and access management (CIAM). This includes designing holistic CIAM architecture to enable multi-digital channel customer interactions, implementing and integrating CIAM solutions for personalised customer authentication, developing processes for supporting proper governance, and integrating CIAM with financial fraud monitoring systems. Upcoming initiatives such as the launch of a Faster Payment System – which allows banks and stored value facility operators to provide real-time payment services – further highlights the importance of boosting real-time fraud detection capabilities and overall cyber resilience in the entire banking ecosystem.
While regulatory initiatives like the CFI are providing banks in Hong Kong with an improved framework to evaluate risk exposure and ensure better prevention, detection and response capabilities, we believe that the banking sector should continue to strive to strengthen overall cyber resilience.
The banks that are able to complement the adoption of new technologies with sound cybersecurity and resilience strategies will be best positioned to transform their business models, increase operational efficiencies, and instil greater confidence among customers and other stakeholders.
All investments in cybersecurity should be channelled to protect what really matters, enable business and provide confidence to continue along the digital journey.
While banks continue to improve digital banking services and their overall digital journey, it is essential for them to ensure that corresponding cybersecurity strategies are ultimately focused on the customer. This means efficiently balancing the delivery of a seamless customer experience with the provision of a secure environment for investments, data and other personal information.
Hong Kong Banking Report 2018 | 41
© 2018 KPMG, a Hong Kong partnership and a member firm of the KPMG network of independent member firms affiliated with KPMG International Cooperative (“KPMG International”), a Swiss entity. All rights reserved. © 2018 KPMG, a Hong Kong partnership and a member firm of the KPMG network of independent member firms affiliated with KPMG International Cooperative (“KPMG International”), a Swiss entity. All rights reserved.

Amidst technology-driven disruption and innovation in the financial services industry, banks in Hong Kong are still working out how to provide excellent experiences for their customers in order to maintain their competitive edge.
In spite of Hong Kong’s status as a leading international finance centre, the customer experience around banking continues to lag behind other sectors as well as developed economies.
The city’s banks have yet to crack the code for a successful customer experience. Many are instead relying on existing, reliable conventions that are becoming less relevant as new business models, technologies and generations of customers enter the picture. It is understandable that banks find this difficult as they are operating in a process-intensive, historic and heavily regulated industry.
One area where decision makers in Hong Kong banks have yet to fully consider is the service quality of organisations beyond the financial sector. This is important as customers compare their banking experiences against services offered by other industries such as retail or healthcare. For example, if an individual is able to enjoy a convenient, efficient and personalised shopping experience, their “expectations” of banking services would naturally be of a similar level.
This is not to say banks in Hong Kong are not investing to improve their customer experience. In recent years, many lenders have been actively mapping out customer journeys and digitalising their operations. However, their efforts are overly focused on specific processes or customer touch points. To truly transform their customer experience, banks in Hong Kong need to wipe the slate clean and put customers at the heart of their thinking.
The clock is ticking following recent guidelines by the Hong Kong Monetary Authority (HKMA) to encourage the development of virtual banks. These new entrants by definition will be leveraging technology and digital solutions, which are almost certain to offer a more seamless and improved banking experience.
In addition, the implementation of the Greater Bay Area initiative will bring about a new wave of clients that are accustomed to services in the mainland – a large portion of which are digitalised and customer-centric. Similarly, Hong Kong as a city is increasingly focused on technology and innovation, which is driving more industries to accelerate their investments in this area.
Isabel ZisselsbergerHead of Customer and Operations and Financial ManagementKPMG China
James Harte Director, Global Strategy GroupKPMG China
Cracking the code for a successful customer experience
42 | Hong Kong Banking Report 2018
© 2018 KPMG, a Hong Kong partnership and a member firm of the KPMG network of independent member firms affiliated with KPMG International Cooperative (“KPMG International”), a Swiss entity. All rights reserved.

In order to adapt to the increasingly digitalised and competitive operating landscape, our research suggests that banks should consider their customer experience around six core principles – personalisation, expectations, integrity, resolution, time and effort as well as empathy. These Six Pillars consider a range of pragmatic and emotional factors to define customer experience excellence. They are present in every leading customer brand we have examined worldwide, whilst absent from those that have failed to transform:
One area where decision makers in Hong Kong banks have yet to fully consider is the service quality of organisations beyond the financial sector. If an individual is able to enjoy a convenient, efficient and personalised shopping experience, their “expectations” of banking services would naturally be of a similar level.
KPMG’s six pillars of customer excellence
PersonalisationUsing individualised attention to drive an emotional connection
ExpectationsManaging, meeting and exceeding customer expectations
IntegrityBeing trustworthy and engendering trust
ResolutionTurning a poor experience into a great one
Time and EffortMinimising customer effort and creating frictionless processes
EmpathyAchieving an understanding of the customer’s circumstances to drive deep rapport
Source: KPMG Nunwood
Hong Kong Banking Report 2018 | 43
© 2018 KPMG, a Hong Kong partnership and a member firm of the KPMG network of independent member firms affiliated with KPMG International Cooperative (“KPMG International”), a Swiss entity. All rights reserved. © 2018 KPMG, a Hong Kong partnership and a member firm of the KPMG network of independent member firms affiliated with KPMG International Cooperative (“KPMG International”), a Swiss entity. All rights reserved.

Personalisation is critical for the transformation of the sector. At its most basic level, it allows customers to name their accounts and set up custom alerts. More sophisticated processes can leverage the multitude of data banks have at hand and grant them a deep understanding of customer preferences to tailor services as well as experiences that are unique to the individual. The use of this proprietary data and analytics ought to create opportunities to refine offerings around each customer with a high level of granularity, although many banks in Hong Kong are still struggling to harness real value from their data.
Tailored services are an even more critical component of private banking and wealth management – a key focus area of many banks in Hong Kong. Mainland Chinese high-net worth individuals are the key to growth in this space, and they are already accustomed to a plethora of sophisticated investment platforms. If Hong Kong banks are to fully capitalise on the wealth flowing out of mainland China, they will need to empower client-facing staff with the necessary technology, software and hardware. Banks will need to make sure they strike the right balance between compliance and customer experience. Relationship manager enablement will be at the heart of this.
The pillar on “resolution” is another area where banks are often found lacking and can lead to unfavourable reputation of a bank’s customer experience when something goes wrong. Predictive analytics of potential complaints as well as root cause analysis across all interaction mediums are some of the solutions financial institutions can employ to address such concerns. However, banks need to realise that it is also the manner in which a problem is handled – with empathy and speed – that is crucial to a good customer experience.
44 | Hong Kong Banking Report 2018
© 2018 KPMG, a Hong Kong partnership and a member firm of the KPMG network of independent member firms affiliated with KPMG International Cooperative (“KPMG International”), a Swiss entity. All rights reserved.
Even though banks will need to bring in digital elements to improve analysis and access, they have to also be conscious of potential cybersecurity risks as well as the collection, use and protection of customer information. The pursuit of “integrity” is a fine balancing act between providing a robust and a secure digital banking experience.
Another challenging pillar to get right is empathy. An abstract concept that varies for different individuals, organisations and industries; building empathy tends to be generally associated with human interactions. This brings up a crucial question as we enter the digital age: how can banks ensure the services they provide are able to maintain the same level of emotional attachment?
Being able to offer a rich customer experience in the midst of all the technological changes can be a challenging and daunting task. Such transformations are usually complex and require a total revamp of a bank’s operating model, mentality and culture. Starting from a ‘blank page’ is usually the best way to stimulate radical thinking.
However, the potential return is far greater than the level of investment needed and this could redefine the role of banking in Hong Kong. Pursuing a few pillars in isolation will not unlock the real dividends from customer experience. Rather, banking leaders must equip their businesses to deliver against all six pillars in order to prepare and succeed in the customer age.
Even though banks will need to bring in digital elements to improve analysis and access, they have to also be conscious of potential cybersecurity risks as well as the collection, use and protection of customer information. It is a fine balancing act between providing a robust and a secure digital banking experience.
Hong Kong Banking Report 2018 | 45
© 2018 KPMG, a Hong Kong partnership and a member firm of the KPMG network of independent member firms affiliated with KPMG International Cooperative (“KPMG International”), a Swiss entity. All rights reserved. © 2018 KPMG, a Hong Kong partnership and a member firm of the KPMG network of independent member firms affiliated with KPMG International Cooperative (“KPMG International”), a Swiss entity. All rights reserved.

As banks in Hong Kong continue to digitise through robotic process automation, machine learning and cognitive platforms, they also need to carefully consider how these technologies will affect the skills, responsibilities and overall composition of their workforce.
Organisations are changing in response to digital disruption, and many banks are realising that the current shape and size of their workforce is not necessarily what they will need in the future. It is increasingly clear that human and digital labour will coexist, and the focus now is on effectively integrating and managing a hybrid human-digital workforce to grow the business and remain competitive.
An evolving workforce structure In addition to reducing operating costs, automation and cognitive technologies can enhance the skills, expertise and productivity of the human workforce. In fact, instead of replacing jobs, the onset of these technologies is likely to enable the human workforce to spend more time on strategic analysis, building customer relationships and other higher-value tasks. In addition, new technologies can help develop new products and services, which will need people to help maintain and market to customers.
When considering the adoption of automation and other technologies, banks need to also ensure that they analyse the implications of their business and technology strategies on their employees. This involves understanding how the size and composition of the workforce is likely to evolve over time, and implementing a comprehensive and flexible talent strategy to ensure that the workforce can be shaped effectively to meet the business needs of the future. Indeed we are moving from a relatively fixed world where leaders matched people to defined roles, to a rapidly changing world where leaders will match skills to work.
To this end, it is important to note that technology is not the only disruptor to the banking industry – the composition of the workforce structure is changing too. People are living longer, for example, which is leading to a more multigenerational workforce within organisations. Banks therefore need to revisit their employee value propositions and optimise them to attract, motivate and retain the different segments of the workforce.
Instead of replacing jobs, the onset of automation and cognitive technologies is likely to enable the human workforce to spend more time on strategic analysis, building customer relationships and other higher-value tasks.
Peter Outridge Head of People & Change AdvisoryKPMG China
Shaping the workforce of the future
46 | Hong Kong Banking Report 2018
© 2018 KPMG, a Hong Kong partnership and a member firm of the KPMG network of independent member firms affiliated with KPMG International Cooperative (“KPMG International”), a Swiss entity. All rights reserved.
In addition, we are seeing many traditional jobs being impacted by the ‘gig economy’, which consists of part-time, temporary and freelance jobs. The rise of the gig economy gives organisations more flexibility to scale their workforce up and down based on specific projects and their short-term needs. However, this also complicates workforce planning around finding the optimal size, shape and composition of the workforce.
We believe these trends are contributing to the transformation of the traditional model of workforce planning into ‘workforce shaping’, which requires organisations to become more agile and responsive to the needs of the moment. The use of workforce analytics can also help banks shape their workforce by providing real-time insight into individual, team, and organisation-wide employee performance.
Leading from the frontAs the pace of technological change continues to accelerate in Hong Kong’s financial services industry, the challenge for senior management is to figure out how to adapt to this change and transform their workforce to remain competitive in the market. It is also important for leaders to understand that the adoption of technologies and solutions needs to align firmly with the broader business strategy, and that automating activities just because it is possible might not always be the best option. For example, the implementation of more cognitive solutions also requires greater coordination and governance in order to realise widespread benefits. Furthermore, there may also be brand and reputational issues to consider when implementing technologies such as robotics, especially for customer-facing activities.
We therefore recommend that senior management and people leaders at banks actively engage in an organisation-wide/function-wide process of assessing how their workforce needs to evolve in terms of nature of work, skills, size and structure to effectively deliver on their business objectives in the most effective manner possible.
Successfully integrating and managing a hybrid human-digital workforce will require decisive and proactive leadership, and a willingness to adapt to, and successfully lead people through change to transition to new ways of working, while maintaining employee engagement and a focus on the business. Especially during a time of rapid change, envisioning and shaping the banking workforce of the future is crucial. It is therefore more important than ever for senior management to inspire, empower and equip their workforce with the right skills, culture, structure and vision to ensure the long-term growth and success of their organisations.
We are moving from a relatively fixed world where leaders matched people to defined roles, to a rapidly changing world where leaders will match skills to work.
The rise of the gig economy gives organisations more flexibility to scale their workforce up and down based on specific projects and their short-term needs. However, this also complicates workforce planning around finding the optimal size, shape and composition of the workforce.
Hong Kong Banking Report 2018 | 47
© 2018 KPMG, a Hong Kong partnership and a member firm of the KPMG network of independent member firms affiliated with KPMG International Cooperative (“KPMG International”), a Swiss entity. All rights reserved. © 2018 KPMG, a Hong Kong partnership and a member firm of the KPMG network of independent member firms affiliated with KPMG International Cooperative (“KPMG International”), a Swiss entity. All rights reserved.

22 Survey of participants attending the International Tax Review Asia Tax Forum in Singapore on 3 May 2018. Responses were anonymous and carried out through the use of an App.
For many financial institutions, the dominant form of ‘technology’ they deploy in their tax function right now is Microsoft Excel – a tool developed over 30 years ago. Further, a recent survey22 of in-house tax managers in the Asia Pacific region highlighted that only 11 percent of organisations were already deploying some form of automation technology in their tax function processes, and perhaps more staggeringly, the same survey showed that only nine percent of organisations have ‘well controlled’ data needed for tax compliance.
This needs to change. But why?A number of regulatory developments and enhanced tax administration capabilities are triggering the need for automation, and of greater accuracy in data flows and reporting. Consider the following:
1. Tax authorities around the world are increasingly moving towards real-time (or near real-time) tax reporting, especially by financial institutions given they are custodians of significant transactional data for the economy as a whole.
2. Historically tax audits were often a function of random selection. That is no longer the case. Tax authorities are deploying data and analytics solutions to target higher risk taxpayers for extra attention. Their ability to find the proverbial ‘needle in the haystack’ is immeasurably greater than before.
3. Closer to home, the introduction of transfer pricing rules in Hong Kong to tackle Base Erosion and Profit Shifting (BEPS) and more automated exchanges of information between tax authorities have added to the operational challenges of tax functions, strengthening the business case to invest in technology-based solutions.
4. There are many regional tax functions situated in Hong Kong who need to manage the needs of the tax authorities throughout the region. Jurisdictions such as Australia, mainland China and Singapore are all imposing significantly enhanced reporting obligations on taxpayers.
Consequently, the tax functions of financial institutions in Hong Kong are under increasing pressure to ensure the data they provide is accurate, complete and on-time. This can be challenging considering the wealth of transactional, consumer and other third-party data financial institutions possess.
Lachlan Wolfers Head of Tax TechnologyKPMG China
John TimpanyPartner, TaxKPMG China
Driving transformation with tax technology
48 | Hong Kong Banking Report 2018
© 2018 KPMG, a Hong Kong partnership and a member firm of the KPMG network of independent member firms affiliated with KPMG International Cooperative (“KPMG International”), a Swiss entity. All rights reserved.

At the moment, significant amounts of time and effort are being spent on what can be generally classified as routine manipulation of data and information extraction in order to meet various tax obligations. However, technologies such as automated compliance software, data and analytics tools which utilise predictive analytics, and even robotic process automation (RPA) can help to automate manual processes, freeing up resources to be better spent on supporting higher value added tasks for the business.
This is crucial as the banking industry is beginning to emerge from a decade of risk management, having concentrated a large portion of their resources towards cleaning up internal systems, processes and balance sheets following the 2007-2008 global financial crisis.
Banks in Hong Kong are expected to pursue a stronger growth agenda in the next five years. Technology provides tax functions with the opportunity to facilitate that growth, while ensuring that risks are managed without any significant headcount increase.
How technology can help tax functions
Technology transformation in tax needs to benefit the organisation in terms of helping to identify savings, areas of non-compliance, and efficiency gains and should ideally move the tax function up the value chain so that they become business partners to the organisation they are serving. Embedding technology solutions into tax functions can generally be broken down into four areas:
1) Compliance-related solutionsSolutions that help to prepare or file tax returns more efficiently, accurately and in a highly automated manner. These solutions can help with either specific taxes, or with the full range of tax returns including VAT filings, Corporate Income Tax filings and stamp duty.
2) Insights-related solutionsSolutions that provide greater insights into the accuracy of tax-related data in order to identify potential tax risks up-front and spot errors or inaccuracies in tax reporting. Examples include software solutions which provide sophisticated data and analytics to identify errors in tax reporting or to analyse the margins of products for transfer pricing purposes and assist with the identification of permanent establishment risks.
3) Process management solutionsSolutions that help to manage either a specific process or an end-to-end process. Specifically, these are solutions which help to manage workflow within a tax function. Examples include tools that help track the tax return preparation and approvals, or which facilitate transparency and ‘dashboarding’ for reporting to senior management.
4) Accessories, components or infrastructureThese refer to the hardware or software solutions which are built into an organisation’s tax technology system. Examples would include solutions that manage the data extraction process or help to deliver data visualisations as well as data storage such as cloud computing.
Source: KPMG Research
Hong Kong Banking Report 2018 | 49
© 2018 KPMG, a Hong Kong partnership and a member firm of the KPMG network of independent member firms affiliated with KPMG International Cooperative (“KPMG International”), a Swiss entity. All rights reserved. © 2018 KPMG, a Hong Kong partnership and a member firm of the KPMG network of independent member firms affiliated with KPMG International Cooperative (“KPMG International”), a Swiss entity. All rights reserved.

The reality is that more often than not, tax functions have had to obtain data from systems that are not always compatible, resulting in time-consuming processes that are also prone to error. Tax functions need to be on the front foot in driving changes in data collection as new systems are deployed.
Banks in Hong Kong are expected to pursue a stronger growth agenda in the next five years and tax functions will need to support their organisations’ expansion as well as the subsequent creation of new products and opportunities. Technology provides the opportunity to free up resources currently dedicated to routine process oriented tasks, so as to facilitate that growth, while ensuring that risks are managed without any significant headcount increase.
For an industry that is deeply rooted in manually-oriented tasks, to transform their in-house tax functions into a technologically-enabled team requires a journey over a period of time. This often begins with people.
Typically most tax functions serving financial institutions comprise tax professionals with an accounting or finance background. Increasingly, a more diverse skillset is required, including the ability to work with IT professionals and data scientists. Training to facilitate the tax team in using technology and in automating processes is required, rather than just relying on the ‘way it has always been done’.
Systems used in the data collection and tax reporting processes need to be carefully considered. How fit for purpose are they? Do they provide the necessary data for tax purposes? How can the data which is often kept in multiple systems be brought together?
The reality is that more often than not, tax functions have had to obtain data from systems that are not always compatible, resulting in time-consuming processes that are also prone to error. Tax functions need to be on the front foot in driving changes in data collection as new systems are deployed.
While full digital transformation of a bank’s tax function is likely to be achieved only in the longer term, financial institutions need to start embarking on the tax technology journey today. If change does not begin now, then the value of the tax function will diminish over time. The tax function will cease to be able to fully support the organisation’s growth agenda, and moreover, they will cease to be able to manage organisational tax risk, and will not be able to fulfil their obligations to tax authorities.
50 | Hong Kong Banking Report 2018
© 2018 KPMG, a Hong Kong partnership and a member firm of the KPMG network of independent member firms affiliated with KPMG International Cooperative (“KPMG International”), a Swiss entity. All rights reserved.

Financial highlightsPerformance rankings:• Licensed banks
• Restricted licence banks
• Deposit-taking companies
• Foreign bank branches
Hong Kong Banking Report 2018 | 51
© 2018 KPMG, a Hong Kong partnership and a member firm of the KPMG network of independent member firms affiliated with KPMG International Cooperative (“KPMG International”), a Swiss entity. All rights reserved. © 2018 KPMG, a Hong Kong partnership and a member firm of the KPMG network of independent member firms affiliated with KPMG International Cooperative (“KPMG International”), a Swiss entity. All rights reserved.
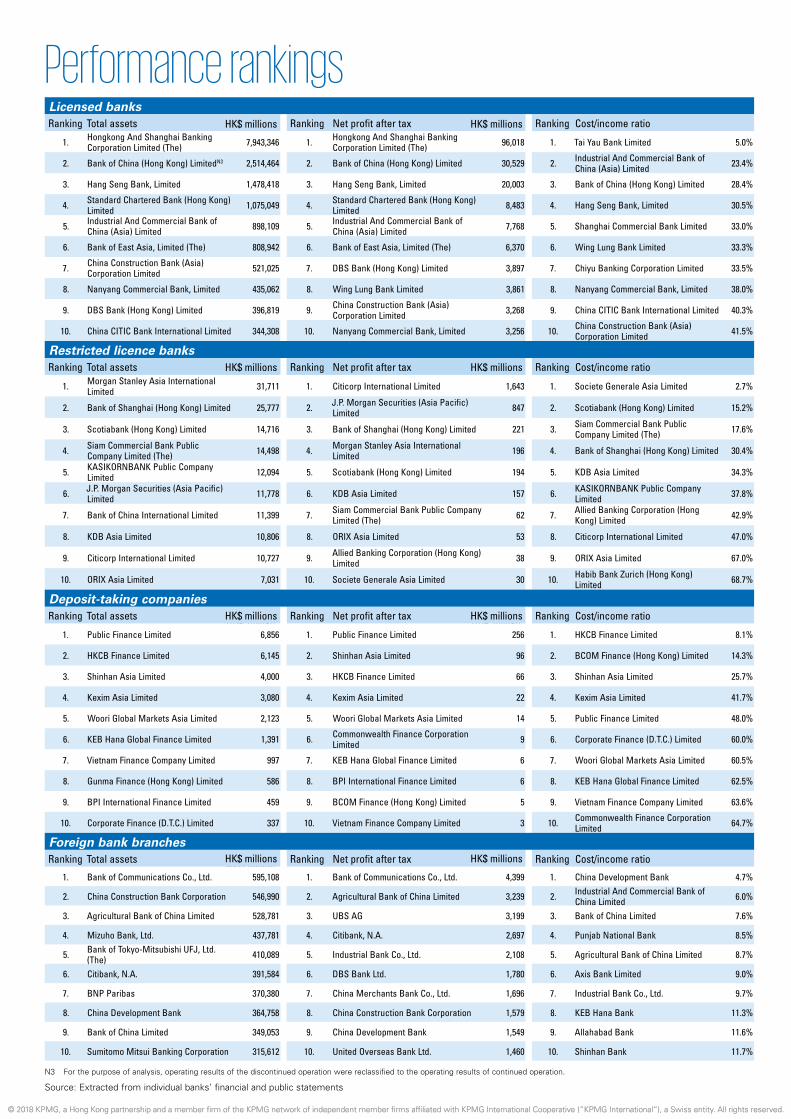
HKD million
HKD million
HKD million
Licensed banksRanking Total assets Ranking Net profit after tax Ranking Cost/income ratio
1. Hongkong And Shanghai Banking Corporation Limited (The) 7,943,346 1. Hongkong And Shanghai Banking
Corporation Limited (The) 96,018 1. Tai Yau Bank Limited 5.0%
2. Bank of China (Hong Kong) LimitedN3 2,514,464 2. Bank of China (Hong Kong) Limited 30,529 2. Industrial And Commercial Bank of China (Asia) Limited 23.4%
3. Hang Seng Bank, Limited 1,478,418 3. Hang Seng Bank, Limited 20,003 3. Bank of China (Hong Kong) Limited 28.4%
4. Standard Chartered Bank (Hong Kong) Limited 1,075,049 4. Standard Chartered Bank (Hong Kong)
Limited 8,483 4. Hang Seng Bank, Limited 30.5%
5. Industrial And Commercial Bank of China (Asia) Limited 898,109 5. Industrial And Commercial Bank of
China (Asia) Limited 7,768 5. Shanghai Commercial Bank Limited 33.0%
6. Bank of East Asia, Limited (The) 808,942 6. Bank of East Asia, Limited (The) 6,370 6. Wing Lung Bank Limited 33.3%
7. China Construction Bank (Asia) Corporation Limited 521,025 7. DBS Bank (Hong Kong) Limited 3,897 7. Chiyu Banking Corporation Limited 33.5%
8. Nanyang Commercial Bank, Limited 435,062 8. Wing Lung Bank Limited 3,861 8. Nanyang Commercial Bank, Limited 38.0%
9. DBS Bank (Hong Kong) Limited 396,819 9. China Construction Bank (Asia) Corporation Limited 3,268 9. China CITIC Bank International Limited 40.3%
10. China CITIC Bank International Limited 344,308 10. Nanyang Commercial Bank, Limited 3,256 10. China Construction Bank (Asia) Corporation Limited 41.5%
Restricted licence banksRanking Total assets Ranking Net profit after tax Ranking Cost/income ratio
1. Morgan Stanley Asia International Limited 31,711 1. Citicorp International Limited 1,643 1. Societe Generale Asia Limited 2.7%
2. Bank of Shanghai (Hong Kong) Limited 25,777 2. J.P. Morgan Securities (Asia Pacific) Limited 847 2. Scotiabank (Hong Kong) Limited 15.2%
3. Scotiabank (Hong Kong) Limited 14,716 3. Bank of Shanghai (Hong Kong) Limited 221 3. Siam Commercial Bank Public Company Limited (The) 17.6%
4. Siam Commercial Bank Public Company Limited (The) 14,498 4. Morgan Stanley Asia International
Limited 196 4. Bank of Shanghai (Hong Kong) Limited 30.4%
5. KASIKORNBANK Public Company Limited 12,094 5. Scotiabank (Hong Kong) Limited 194 5. KDB Asia Limited 34.3%
6. J.P. Morgan Securities (Asia Pacific) Limited 11,778 6. KDB Asia Limited 157 6. KASIKORNBANK Public Company
Limited 37.8%
7. Bank of China International Limited 11,399 7. Siam Commercial Bank Public Company Limited (The) 62 7. Allied Banking Corporation (Hong
Kong) Limited 42.9%
8. KDB Asia Limited 10,806 8. ORIX Asia Limited 53 8. Citicorp International Limited 47.0%
9. Citicorp International Limited 10,727 9. Allied Banking Corporation (Hong Kong) Limited 38 9. ORIX Asia Limited 67.0%
10. ORIX Asia Limited 7,031 10. Societe Generale Asia Limited 30 10. Habib Bank Zurich (Hong Kong) Limited 68.7%
Deposit-taking companiesRanking Total assets Ranking Net profit after tax Ranking Cost/income ratio
1. Public Finance Limited 6,856 1. Public Finance Limited 256 1. HKCB Finance Limited 8.1%
2. HKCB Finance Limited 6,145 2. Shinhan Asia Limited 96 2. BCOM Finance (Hong Kong) Limited 14.3%
3. Shinhan Asia Limited 4,000 3. HKCB Finance Limited 66 3. Shinhan Asia Limited 25.7%
4. Kexim Asia Limited 3,080 4. Kexim Asia Limited 22 4. Kexim Asia Limited 41.7%
5. Woori Global Markets Asia Limited 2,123 5. Woori Global Markets Asia Limited 14 5. Public Finance Limited 48.0%
6. KEB Hana Global Finance Limited 1,391 6. Commonwealth Finance Corporation Limited 9 6. Corporate Finance (D.T.C.) Limited 60.0%
7. Vietnam Finance Company Limited 997 7. KEB Hana Global Finance Limited 6 7. Woori Global Markets Asia Limited 60.5%
8. Gunma Finance (Hong Kong) Limited 586 8. BPI International Finance Limited 6 8. KEB Hana Global Finance Limited 62.5%
9. BPI International Finance Limited 459 9. BCOM Finance (Hong Kong) Limited 5 9. Vietnam Finance Company Limited 63.6%
10. Corporate Finance (D.T.C.) Limited 337 10. Vietnam Finance Company Limited 3 10. Commonwealth Finance Corporation Limited 64.7%
Foreign bank branchesRanking Total assets Ranking Net profit after tax Ranking Cost/income ratio
1. Bank of Communications Co., Ltd. 595,108 1. Bank of Communications Co., Ltd. 4,399 1. China Development Bank 4.7%
2. China Construction Bank Corporation 546,990 2. Agricultural Bank of China Limited 3,239 2. Industrial And Commercial Bank of China Limited 6.0%
3. Agricultural Bank of China Limited 528,781 3. UBS AG 3,199 3. Bank of China Limited 7.6%
4. Mizuho Bank, Ltd. 437,781 4. Citibank, N.A. 2,697 4. Punjab National Bank 8.5%
5. Bank of Tokyo-Mitsubishi UFJ, Ltd. (The) 410,089 5. Industrial Bank Co., Ltd. 2,108 5. Agricultural Bank of China Limited 8.7%
6. Citibank, N.A. 391,584 6. DBS Bank Ltd. 1,780 6. Axis Bank Limited 9.0%
7. BNP Paribas 370,380 7. China Merchants Bank Co., Ltd. 1,696 7. Industrial Bank Co., Ltd. 9.7%
8. China Development Bank 364,758 8. China Construction Bank Corporation 1,579 8. KEB Hana Bank 11.3%
9. Bank of China Limited 349,053 9. China Development Bank 1,549 9. Allahabad Bank 11.6%
10. Sumitomo Mitsui Banking Corporation 315,612 10. United Overseas Bank Ltd. 1,460 10. Shinhan Bank 11.7%
N3 For the purpose of analysis, operating results of the discontinued operation were reclassified to the operating results of continued operation.
Source: Extracted from individual banks’ financial and public statements
HK$ millions
HK$ millions
HK$ millions
HK$ millions
HK$ millions
HK$ millions
HK$ millions
HK$ millions
Performance rankings
© 2018 KPMG, a Hong Kong partnership and a member firm of the KPMG network of independent member firms affiliated with KPMG International Cooperative (“KPMG International”), a Swiss entity. All rights reserved. © 2018 KPMG, a Hong Kong partnership and a member firm of the KPMG network of independent member firms affiliated with KPMG International Cooperative (“KPMG International”), a Swiss entity. All rights reserved.

Licensed banksRanking Return on equity Ranking Growth in assets Ranking Growth in net profit after tax
1. Tai Yau Bank Limited 37.5% 1. Chiyu Banking Corporation Limited 55.5% 1. Tai Yau Bank Limited 4016.7%
2. Hang Seng Bank, Limited 13.7% 2. Nanyang Commercial Bank, Limited 24.7% 2. Tai Sang Bank Limited 500.0%
3. Bank of China (Hong Kong) Limited 13.6% 3. OCBC Wing Hang Bank Limited 22.7% 3. DBS Bank (Hong Kong) Limited 107.1%
4. Hongkong And Shanghai Banking Corporation Limited (The) 13.4% 4. Chong Hing Bank Limited 18.9% 4. Bank of East Asia, Limited (The) 80.7%
5. Standard Chartered Bank (Hong Kong) Limited 12.1% 5. DBS Bank (Hong Kong) Limited 13.7% 5. Citibank (Hong Kong) Limited 36.5%
6. Citibank (Hong Kong) Limited 11.1% 6. Industrial And Commercial Bank of China (Asia) Limited 12.4% 6. Shanghai Commercial Bank Limited 27.1%
7. Wing Lung Bank Limited 11.0% 7. China CITIC Bank International Limited 12.4% 7. Public Bank (Hong Kong) Limited 24.7%
8. DBS Bank (Hong Kong) Limited 10.6% 8. Bank of China (Hong Kong) Limited 12.0% 8. Hang Seng Bank, Limited 23.4%
9. Shanghai Commercial Bank Limited 9.7% 9. Wing Lung Bank Limited 11.6% 9. Nanyang Commercial Bank, Limited 18.5%
10. Chong Hing Bank Limited 9.4% 10. Citibank (Hong Kong) Limited 10.9% 10. OCBC Wing Hang Bank Limited 17.6%
Restricted licence banksRanking Return on equity Ranking Growth in assets Ranking Growth in net profit after tax
1. Citicorp International Limited 20.7% 1. Banc of America Securities Asia Limited 141.5% 1. J.P. Morgan Securities (Asia Pacific)
Limited 8370.0%
2. J.P. Morgan Securities (Asia Pacific) Limited 13.6% 2. Citicorp International Limited 37.8% 2. Morgan Stanley Asia International
Limited 931.6%
3. Morgan Stanley Asia International Limited 11.4% 3. ORIX Asia Limited 29.1% 3. Goldman Sachs Asia Bank Limited 200.0%
4. Societe Generale Asia Limited 9.8% 4. Bank of Shanghai (Hong Kong) Limited 22.4% 4. Bank of Shanghai (Hong Kong) Limited 75.4%
5. Allied Banking Corporation (Hong Kong) Limited 8.4% 5. J.P. Morgan Securities (Asia Pacific)
Limited 11.0% 5. KASIKORNBANK Public Company Limited 71.4%
6. KDB Asia Limited 7.2% 6. Goldman Sachs Asia Bank Limited 9.2% 6. Citicorp International Limited 69.2%
7. KASIKORNBANK Public Company Limited 5.5% 7. Nippon Wealth Limited 7.7% 7. ORIX Asia Limited 60.6%
8. Bank of Shanghai (Hong Kong) Limited 5.1% 8. KDB Asia Limited 7.3% 8. Habib Bank Zurich (Hong Kong)
Limited 57.1%
9. Habib Bank Zurich (Hong Kong) Limited 4.0% 9. KASIKORNBANK Public Company
Limited 2.9% 9. Allied Banking Corporation (Hong Kong) Limited 40.7%
10. Scotiabank (Hong Kong) Limited 3.7% 10. Bank of China International Limited -0.4% 10. Nippon Wealth Limited 18.5%
Deposit-taking companiesRanking Return on equity Ranking Growth in assets Ranking Growth in net profit after tax
1. Public Finance Limited 16.2% 1. Shinhan Asia Limited 31.0% 1. BPI International Finance Limited 100.0%
2. HKCB Finance Limited 12.9% 2. Woori Global Markets Asia Limited 21.4% 2. Gunma Finance (Hong Kong) Limited 100.0%
3. Commonwealth Finance Corporation Limited 8.2% 3. Kexim Asia Limited 13.9% 3. Corporate Finance (D.T.C.) Limited 100.0%
4. Shinhan Asia Limited 6.6% 4. Commonwealth Finance Corporation Limited 13.3% 4. Vietnam Finance Company Limited 50.0%
5. Kexim Asia Limited 5.1% 5. Vietnam Finance Company Limited 11.4% 5. Commonwealth Finance Corporation Limited 28.6%
6. BPI International Finance Limited 3.2% 6. BPI International Finance Limited 7.7% 6. Kexim Asia Limited 22.2%
7. Vietnam Finance Company Limited 3.0% 7. KEB Hana Global Finance Limited 5.1% 7. Shinhan Asia Limited 21.5%
8. Corporate Finance (D.T.C.) Limited 2.1% 8. BCOM Finance (Hong Kong) Limited 2.5% 8. Public Finance Limited 21.3%
9. BCOM Finance (Hong Kong) Limited 2.1% 9. Public Finance Limited 2.3% 9. Woori Global Markets Asia Limited 7.7%
10. Woori Global Markets Asia Limited 1.7% 10. Gunma Finance (Hong Kong) Limited 2.1% 10. BCOM Finance (Hong Kong) Limited 0.0%
Foreign bank branchesRanking Growth in assets Ranking Growth in net profit after tax
1. LGT Bank AG 121.2% 1. ABN AMRO Bank N.V. 1742.9%
2. Commerzbank AG 88.9% 2. First Abu Dhabi Bank PJSC 1433.3%
3. Bank Julius Baer & Co. Ltd. 73.3% 3. National Australia Bank Limited 1352.9%
4. NATIXIS 63.3% 4. BNP Paribas 1336.3%
5. Bank J. Safra Sarasin AG 52.0% 5.DZ Bank AG Deutsche Zentral-Genossenschaftsbank, Frankfurt AmMain
971.4%
6. Bank of America, National Association 48.1% 6. Canara Bank 900.0%
7. Banco Santander, S.A. 46.8% 7. Credit Suisse AG 846.7%
8. O-Bank Co., Ltd 45.8% 8. Bank J. Safra Sarasin AG 710.0%
9. Shinhan Bank 45.0% 9. Bank of Singapore Limited 666.7%
10. Sumitomo Mitsui Trust Bank, Limited 44.7% 10. Banco Bilbao Vizcaya Argentaria S.A. 640.0%
N3 For the purpose of analysis, operating results of the discontinued operation were reclassified to the operating results of continued operation.
Source: Extracted from individual banks’ financial and public statements
Hong Kong Banking Report 2018 | 53
© 2018 KPMG, a Hong Kong partnership and a member firm of the KPMG network of independent member firms affiliated with KPMG International Cooperative (“KPMG International”), a Swiss entity. All rights reserved. © 2018 KPMG, a Hong Kong partnership and a member firm of the KPMG network of independent member firms affiliated with KPMG International Cooperative (“KPMG International”), a Swiss entity. All rights reserved. © 2018 KPMG, a Hong Kong partnership and a member firm of the KPMG network of independent member firms affiliated with KPMG International Cooperative (“KPMG International”), a Swiss entity. All rights reserved.

Financial highlights
Income statement Size and strength measuresHK$ millions Year ended Net interest
incomeNon-
interest income
Operating expenses
Operating profit before
impairment charges
Loan impairment
charges/(recovery)
Other items Profit before tax
Net profit after tax Total assets Gross advances to customers
Impairment allowances
against customer advances
Total deposits from customers
Total equity Capital adequacy ratio
Liquidity ratio
1 Bank of China (Hong Kong) Limited N3 31-Dec-17 32,245 14,780 13,345 33,680 1,074 3,797 36,385 30,529 2,514,464 1,185,812 4,084 1,774,611 229,687 20.4% 135.6%*
2 Bank of Communications (Hong Kong) Limited 31-Dec-17 - - 6 (6) - - (6) (6) 303 - - - 292 N/A N/A
3 Bank of East Asia, Limited (The) 31-Dec-17 11,832 5,184 8,067 8,949 1,742 1,788 7,565 6,370 808,942 487,685 3,437 571,684 101,214 17.8% 151.7%*
4 China CITIC Bank International Limited 31-Dec-17 5,395 2,478 3,174 4,699 1,391 41 3,287 2,808 344,308 196,287 1,523 271,472 43,557 20.3% 177.6%*
5 China Construction Bank (Asia) Corporation Limited 31-Dec-17 4,945 2,463 3,076 4,332 368 (29) 3,937 3,268 521,025 289,498 1,315 353,269 59,317 17.8% 187.5%*
6 Chiyu Banking Corporation Limited 31-Dec-17 950 476 477 949 62 12 899 752 84,089 43,301 246 63,279 9,563 19.8% 143.0%*
7 Chong Hing Bank Limited 31-Dec-17 2,318 392 1,354 1,356 372 727 1,709 1,565 163,747 86,698 724 118,759 17,434 17.6% 40.7%#
8 Citibank (Hong Kong) Limited 31-Dec-17 3,239 3,764 4,135 2,868 128 - 2,740 2,324 180,867 74,049 228 154,202 21,421 30.3% 42.4%#
9 Dah Sing Bank Limited 31-Dec-17 3,893 1,431 2,528 2,796 271 (28) 2,497 2,084 219,778 123,330 685 162,726 26,117 18.7% 44.0%#
10 DBS Bank (Hong Kong) Limited 31-Dec-17 5,931 3,400 4,667 4,664 (9) (25) 4,698 3,897 396,819 154,829 1,666 327,483 38,670 18.8% 126.8%*
11 Fubon Bank (Hong Kong) Limited 31-Dec-17 1,216 323 950 589 68 180 693 583 98,484 48,753 289 62,068 14,368 19.4% 50.5%#
12 Hang Seng Bank, Limited 31-Dec-17 24,577 10,780 10,768 24,589 1,042 127 23,674 20,003 1,478,418 808,170 1,597 1,074,837 152,079 20.1% 209.5%*
13 Hongkong And Shanghai Banking Corporation Limited (The) 31-Dec-17 110,237 76,099 81,067 105,269 4,330 14,680 115,619 96,018 7,943,346 3,342,025 13,045 5,138,272 752,986 18.9% 153.6%*
14 Industrial And Commercial Bank of China (Asia) Limited 31-Dec-17 10,052 3,053 3,064 10,041 559 41 9,481 7,768 898,109 461,127 4,397 496,312 91,686 16.6% 144.6%*
15 Nanyang Commercial Bank, Limited 31-Dec-17 5,994 1,654 2,903 4,745 914 30 3,847 3,256 435,062 236,734 2,037 325,416 52,089 18.5% 159.3%*
16 OCBC Wing Hang Bank Limited 31-Dec-17 4,409 1,292 2,963 2,738 (28) 65 2,831 2,408 320,925 182,900 649 222,459 36,553 16.1% 44.1%#
17 Public Bank (Hong Kong) Limited 31-Dec-17 1,380 224 852 752 149 - 603 495 42,193 29,304 80 34,095 5,717 19.2% 49.0%#
18 Shanghai Commercial Bank Limited 31-Dec-17 3,100 1,508 1,520 3,088 59 50 3,079 2,431 184,531 78,647 350 146,953 25,545 18.9% 45.6%#
19 Standard Chartered Bank (Hong Kong) Limited 31-Dec-17 12,007 12,890 16,257 8,640 (85) 2,436 9,945 8,483 1,075,049 482,017 1,150 883,899 74,428 18.2% 158.0%*
20 Tai Sang Bank Limited 31-Dec-17 11 24 20 15 - 27 42 42 1,861 162 - 1,135 702 86.0% 80.8%#
21 Tai Yau Bank Limited 31-Dec-17 17 244 13 248 - - 248 247 2,854 1 - 2,067 783 157.3% 71.3%#
22 Wing Lung Bank Limited 31-Dec-17 3,638 2,222 1,953 3,907 191 783 4,499 3,861 298,766 156,248 627 210,964 37,760 18.2% 150.2%*
TOTALN1 2017 222,809 133,901 152,391 204,319 11,556 24,575 214,598 179,183 16,535,522 7,659,407 36,532 11,321,125 1,639,889 - -
Total excluding HSBCN2 2017 137,149 68,582 82,092 123,639 8,268 10,022 122,653 103,168 10,070,594 5,125,552 25,084 7,257,690 1,038,982 - -
Total excluding BOCHK & HSBCN2 2017 104,904 53,802 68,747 89,959 7,194 6,225 86,268 72,639 7,556,130 3,939,740 21,000 5,483,079 809,295 - -
* This is Liquidity Coverage Ratio.# This is Liquidity Maintenance Ratio.N1 This does not include Hang Seng Bank, as it is already included in the results of The Hongkong and Shanghai Banking Corporation.N2 This includes Hang Seng Bank.N3 For the purpose of analysis, operating results of the discontinued operation were reclassified to the operating results of continued operation.
Source: Extracted from individual banks’ financial and public statements
Licensed banks – Financial highlights
© 2018 KPMG, a Hong Kong partnership and a member firm of the KPMG network of independent member firms affiliated with KPMG International Cooperative (“KPMG International”), a Swiss entity. All rights reserved. © 2018 KPMG, a Hong Kong partnership and a member firm of the KPMG network of independent member firms affiliated with KPMG International Cooperative (“KPMG International”), a Swiss entity. All rights reserved.

Financial highlights
Income statement Size and strength measuresHK$ millions Year ended Net interest
incomeNon-
interest income
Operating expenses
Operating profit before
impairment charges
Loan impairment
charges/(recovery)
Other items Profit before tax
Net profit after tax Total assets Gross advances to customers
Impairment allowances
against customer advances
Total deposits from customers
Total equity Capital adequacy ratio
Liquidity ratio
1 Bank of China (Hong Kong) Limited N3 31-Dec-17 32,245 14,780 13,345 33,680 1,074 3,797 36,385 30,529 2,514,464 1,185,812 4,084 1,774,611 229,687 20.4% 135.6%*
2 Bank of Communications (Hong Kong) Limited 31-Dec-17 - - 6 (6) - - (6) (6) 303 - - - 292 N/A N/A
3 Bank of East Asia, Limited (The) 31-Dec-17 11,832 5,184 8,067 8,949 1,742 1,788 7,565 6,370 808,942 487,685 3,437 571,684 101,214 17.8% 151.7%*
4 China CITIC Bank International Limited 31-Dec-17 5,395 2,478 3,174 4,699 1,391 41 3,287 2,808 344,308 196,287 1,523 271,472 43,557 20.3% 177.6%*
5 China Construction Bank (Asia) Corporation Limited 31-Dec-17 4,945 2,463 3,076 4,332 368 (29) 3,937 3,268 521,025 289,498 1,315 353,269 59,317 17.8% 187.5%*
6 Chiyu Banking Corporation Limited 31-Dec-17 950 476 477 949 62 12 899 752 84,089 43,301 246 63,279 9,563 19.8% 143.0%*
7 Chong Hing Bank Limited 31-Dec-17 2,318 392 1,354 1,356 372 727 1,709 1,565 163,747 86,698 724 118,759 17,434 17.6% 40.7%#
8 Citibank (Hong Kong) Limited 31-Dec-17 3,239 3,764 4,135 2,868 128 - 2,740 2,324 180,867 74,049 228 154,202 21,421 30.3% 42.4%#
9 Dah Sing Bank Limited 31-Dec-17 3,893 1,431 2,528 2,796 271 (28) 2,497 2,084 219,778 123,330 685 162,726 26,117 18.7% 44.0%#
10 DBS Bank (Hong Kong) Limited 31-Dec-17 5,931 3,400 4,667 4,664 (9) (25) 4,698 3,897 396,819 154,829 1,666 327,483 38,670 18.8% 126.8%*
11 Fubon Bank (Hong Kong) Limited 31-Dec-17 1,216 323 950 589 68 180 693 583 98,484 48,753 289 62,068 14,368 19.4% 50.5%#
12 Hang Seng Bank, Limited 31-Dec-17 24,577 10,780 10,768 24,589 1,042 127 23,674 20,003 1,478,418 808,170 1,597 1,074,837 152,079 20.1% 209.5%*
13 Hongkong And Shanghai Banking Corporation Limited (The) 31-Dec-17 110,237 76,099 81,067 105,269 4,330 14,680 115,619 96,018 7,943,346 3,342,025 13,045 5,138,272 752,986 18.9% 153.6%*
14 Industrial And Commercial Bank of China (Asia) Limited 31-Dec-17 10,052 3,053 3,064 10,041 559 41 9,481 7,768 898,109 461,127 4,397 496,312 91,686 16.6% 144.6%*
15 Nanyang Commercial Bank, Limited 31-Dec-17 5,994 1,654 2,903 4,745 914 30 3,847 3,256 435,062 236,734 2,037 325,416 52,089 18.5% 159.3%*
16 OCBC Wing Hang Bank Limited 31-Dec-17 4,409 1,292 2,963 2,738 (28) 65 2,831 2,408 320,925 182,900 649 222,459 36,553 16.1% 44.1%#
17 Public Bank (Hong Kong) Limited 31-Dec-17 1,380 224 852 752 149 - 603 495 42,193 29,304 80 34,095 5,717 19.2% 49.0%#
18 Shanghai Commercial Bank Limited 31-Dec-17 3,100 1,508 1,520 3,088 59 50 3,079 2,431 184,531 78,647 350 146,953 25,545 18.9% 45.6%#
19 Standard Chartered Bank (Hong Kong) Limited 31-Dec-17 12,007 12,890 16,257 8,640 (85) 2,436 9,945 8,483 1,075,049 482,017 1,150 883,899 74,428 18.2% 158.0%*
20 Tai Sang Bank Limited 31-Dec-17 11 24 20 15 - 27 42 42 1,861 162 - 1,135 702 86.0% 80.8%#
21 Tai Yau Bank Limited 31-Dec-17 17 244 13 248 - - 248 247 2,854 1 - 2,067 783 157.3% 71.3%#
22 Wing Lung Bank Limited 31-Dec-17 3,638 2,222 1,953 3,907 191 783 4,499 3,861 298,766 156,248 627 210,964 37,760 18.2% 150.2%*
TOTALN1 2017 222,809 133,901 152,391 204,319 11,556 24,575 214,598 179,183 16,535,522 7,659,407 36,532 11,321,125 1,639,889 - -
Total excluding HSBCN2 2017 137,149 68,582 82,092 123,639 8,268 10,022 122,653 103,168 10,070,594 5,125,552 25,084 7,257,690 1,038,982 - -
Total excluding BOCHK & HSBCN2 2017 104,904 53,802 68,747 89,959 7,194 6,225 86,268 72,639 7,556,130 3,939,740 21,000 5,483,079 809,295 - -
Hong Kong Banking Report 2018 | 55
© 2018 KPMG, a Hong Kong partnership and a member firm of the KPMG network of independent member firms affiliated with KPMG International Cooperative (“KPMG International”), a Swiss entity. All rights reserved. © 2018 KPMG, a Hong Kong partnership and a member firm of the KPMG network of independent member firms affiliated with KPMG International Cooperative (“KPMG International”), a Swiss entity. All rights reserved. © 2018 KPMG, a Hong Kong partnership and a member firm of the KPMG network of independent member firms affiliated with KPMG International Cooperative (“KPMG International”), a Swiss entity. All rights reserved.
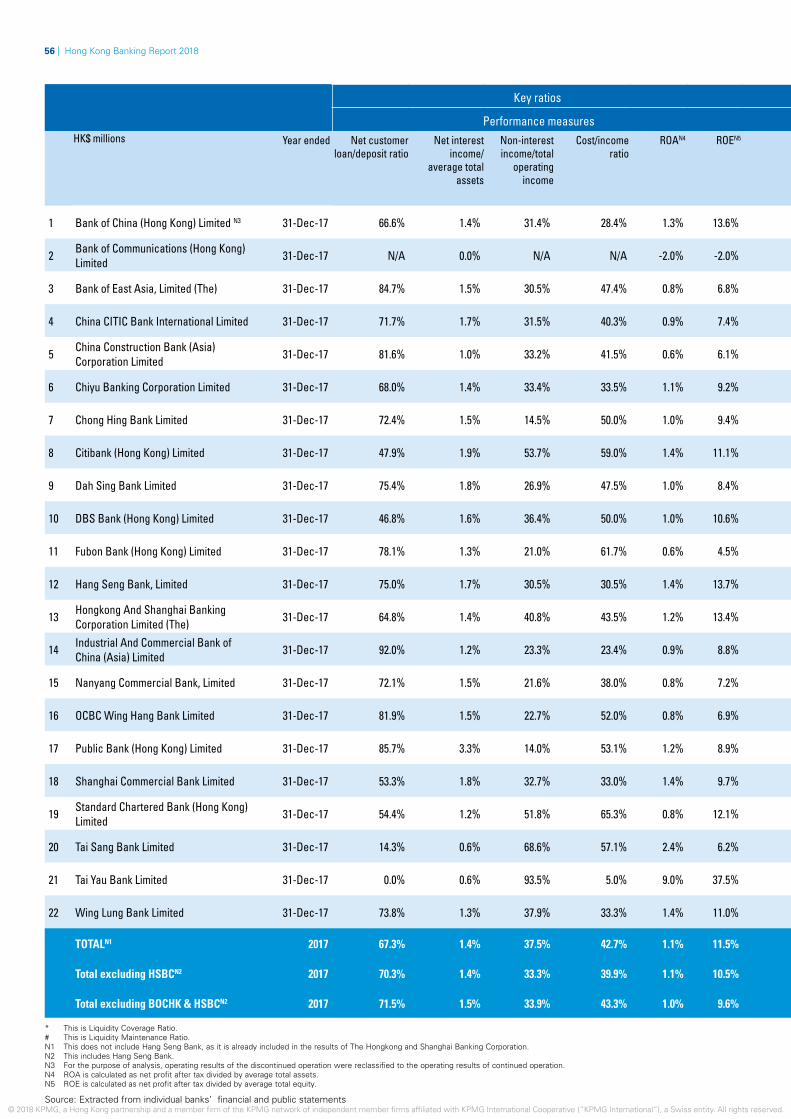
Key ratios Loan asset quality
Performance measures Past due but not impaired advances Impaired advancesHK$ millions Year ended Net customer
loan/deposit ratio Net interest
income/ average total
assets
Non-interest income/total
operating income
Cost/income ratio
ROAN4 ROEN5 Loans overdue ≤ 3
months
Loans overdue > 3
months
Gross advances which are past due
but not impaired
Gross impaired advances
Gross impaired advances/gross
advances to customers
Individually assessed impairment allowances made against impaired
advances
Individually assessed
allowances as a percentage of gross
impaired advances
Collaterals for individually assessed
impaired advances
1 Bank of China (Hong Kong) Limited N3 31-Dec-17 66.6% 1.4% 31.4% 28.4% 1.3% 13.6% 3,139 31 3,170 1,371 0.1% 538 39.2% 1,523
2 Bank of Communications (Hong Kong) Limited 31-Dec-17 N/A 0.0% N/A N/A -2.0% -2.0% - - - - N/A - N/A -
3 Bank of East Asia, Limited (The) 31-Dec-17 84.7% 1.5% 30.5% 47.4% 0.8% 6.8% 416 - 416 5,177 1.1% 1,059 20.5% 4,329
4 China CITIC Bank International Limited 31-Dec-17 71.7% 1.7% 31.5% 40.3% 0.9% 7.4% 1,747 - 1,747 2,464 1.26% 1,127 45.7% 813
5 China Construction Bank (Asia) Corporation Limited 31-Dec-17 81.6% 1.0% 33.2% 41.5% 0.6% 6.1% 5,079 - 5,079 636 0.2% 226 35.5% 35
6 Chiyu Banking Corporation Limited 31-Dec-17 68.0% 1.4% 33.4% 33.5% 1.1% 9.2% 108 1 109 199 0.5% 70 35.2% 363
7 Chong Hing Bank Limited 31-Dec-17 72.4% 1.5% 14.5% 50.0% 1.0% 9.4% 97 107 204 398 0.5% 394 99.0% 4
8 Citibank (Hong Kong) Limited 31-Dec-17 47.9% 1.9% 53.7% 59.0% 1.4% 11.1% 1,003 - 1,003 59 0.1% - 0.0% 4
9 Dah Sing Bank Limited 31-Dec-17 75.4% 1.8% 26.9% 47.5% 1.0% 8.4% 2,057 173 2,230 774 0.6% 281 36.3% 563
10 DBS Bank (Hong Kong) Limited 31-Dec-17 46.8% 1.6% 36.4% 50.0% 1.0% 10.6% 2,849 376 3,225 2,446 1.6% 829 33.9% 1,520
11 Fubon Bank (Hong Kong) Limited 31-Dec-17 78.1% 1.3% 21.0% 61.7% 0.6% 4.5% 365 2 367 187 0.4% 156 83.4% 32
12 Hang Seng Bank, Limited 31-Dec-17 75.0% 1.7% 30.5% 30.5% 1.4% 13.7% 4,452 - 4,452 1,970 0.2% 602 30.6% 958
13 Hongkong And Shanghai Banking Corporation Limited (The) 31-Dec-17 64.8% 1.4% 40.8% 43.5% 1.2% 13.4% 30,061 303 29,878 17,579 0.5% 8,229 46.8% 7,472
14 Industrial And Commercial Bank of China (Asia) Limited 31-Dec-17 92.0% 1.2% 23.3% 23.4% 0.9% 8.8% 802 16 819 3,064 0.7% 2,108 68.8% 640
15 Nanyang Commercial Bank, Limited 31-Dec-17 72.1% 1.5% 21.6% 38.0% 0.8% 7.2% 464 53 517 1,023 0.4% 820 80.2% 132
16 OCBC Wing Hang Bank Limited 31-Dec-17 81.9% 1.5% 22.7% 52.0% 0.8% 6.9% 4,587 27 4,614 871 0.5% 173 19.9% 744
17 Public Bank (Hong Kong) Limited 31-Dec-17 85.7% 3.3% 14.0% 53.1% 1.2% 8.9% 553 - 553 135 0.5% 71 52.6% 61
18 Shanghai Commercial Bank Limited 31-Dec-17 53.3% 1.8% 32.7% 33.0% 1.4% 9.7% 2,379 - 2,379 609 0.8% 37 6.1% 1,383
19 Standard Chartered Bank (Hong Kong) Limited 31-Dec-17 54.4% 1.2% 51.8% 65.3% 0.8% 12.1% 2,182 84 2,266 3,278 0.7% 907 27.7% 1,344
20 Tai Sang Bank Limited 31-Dec-17 14.3% 0.6% 68.6% 57.1% 2.4% 6.2% - - - - 0.0% - N/A -
21 Tai Yau Bank Limited 31-Dec-17 0.0% 0.6% 93.5% 5.0% 9.0% 37.5% - - - - 0.0% - N/A -
22 Wing Lung Bank Limited 31-Dec-17 73.8% 1.3% 37.9% 33.3% 1.4% 11.0% 2,889 23 2,911 835 0.5% 332 39.8% 444
TOTALN1 2017 67.3% 1.4% 37.5% 42.7% 1.1% 11.5% 60,777 1,196 61,487 41,105 0.5% 17,357 42.2% 21,406
Total excluding HSBCN2 2017 70.3% 1.4% 33.3% 39.9% 1.1% 10.5% 35,168 893 36,061 25,496 0.5% 9,730 38.2% 14,892
Total excluding BOCHK & HSBCN2 2017 71.5% 1.5% 33.9% 43.3% 1.0% 9.6% 32,029 862 32,891 24,125 0.6% 9,192 38.1% 13,369
* This is Liquidity Coverage Ratio.# This is Liquidity Maintenance Ratio.N1 This does not include Hang Seng Bank, as it is already included in the results of The Hongkong and Shanghai Banking Corporation.N2 This includes Hang Seng Bank.N3 For the purpose of analysis, operating results of the discontinued operation were reclassified to the operating results of continued operation.N4 ROA is calculated as net profit after tax divided by average total assets.N5 ROE is calculated as net profit after tax divided by average total equity.
Source: Extracted from individual banks’ financial and public statements
56 | Hong Kong Banking Report 2018
© 2018 KPMG, a Hong Kong partnership and a member firm of the KPMG network of independent member firms affiliated with KPMG International Cooperative (“KPMG International”), a Swiss entity. All rights reserved.
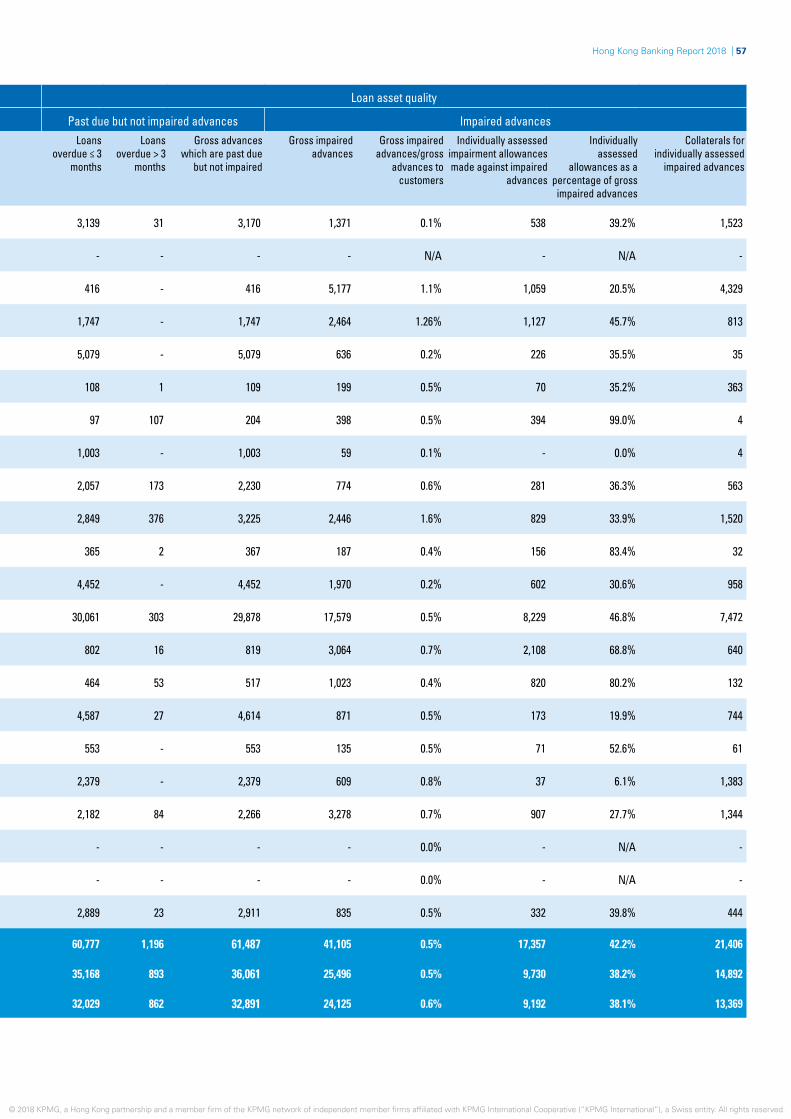
Key ratios Loan asset quality
Performance measures Past due but not impaired advances Impaired advancesHK$ millions Year ended Net customer
loan/deposit ratio Net interest
income/ average total
assets
Non-interest income/total
operating income
Cost/income ratio
ROAN4 ROEN5 Loans overdue ≤ 3
months
Loans overdue > 3
months
Gross advances which are past due
but not impaired
Gross impaired advances
Gross impaired advances/gross
advances to customers
Individually assessed impairment allowances made against impaired
advances
Individually assessed
allowances as a percentage of gross
impaired advances
Collaterals for individually assessed
impaired advances
1 Bank of China (Hong Kong) Limited N3 31-Dec-17 66.6% 1.4% 31.4% 28.4% 1.3% 13.6% 3,139 31 3,170 1,371 0.1% 538 39.2% 1,523
2 Bank of Communications (Hong Kong) Limited 31-Dec-17 N/A 0.0% N/A N/A -2.0% -2.0% - - - - N/A - N/A -
3 Bank of East Asia, Limited (The) 31-Dec-17 84.7% 1.5% 30.5% 47.4% 0.8% 6.8% 416 - 416 5,177 1.1% 1,059 20.5% 4,329
4 China CITIC Bank International Limited 31-Dec-17 71.7% 1.7% 31.5% 40.3% 0.9% 7.4% 1,747 - 1,747 2,464 1.26% 1,127 45.7% 813
5 China Construction Bank (Asia) Corporation Limited 31-Dec-17 81.6% 1.0% 33.2% 41.5% 0.6% 6.1% 5,079 - 5,079 636 0.2% 226 35.5% 35
6 Chiyu Banking Corporation Limited 31-Dec-17 68.0% 1.4% 33.4% 33.5% 1.1% 9.2% 108 1 109 199 0.5% 70 35.2% 363
7 Chong Hing Bank Limited 31-Dec-17 72.4% 1.5% 14.5% 50.0% 1.0% 9.4% 97 107 204 398 0.5% 394 99.0% 4
8 Citibank (Hong Kong) Limited 31-Dec-17 47.9% 1.9% 53.7% 59.0% 1.4% 11.1% 1,003 - 1,003 59 0.1% - 0.0% 4
9 Dah Sing Bank Limited 31-Dec-17 75.4% 1.8% 26.9% 47.5% 1.0% 8.4% 2,057 173 2,230 774 0.6% 281 36.3% 563
10 DBS Bank (Hong Kong) Limited 31-Dec-17 46.8% 1.6% 36.4% 50.0% 1.0% 10.6% 2,849 376 3,225 2,446 1.6% 829 33.9% 1,520
11 Fubon Bank (Hong Kong) Limited 31-Dec-17 78.1% 1.3% 21.0% 61.7% 0.6% 4.5% 365 2 367 187 0.4% 156 83.4% 32
12 Hang Seng Bank, Limited 31-Dec-17 75.0% 1.7% 30.5% 30.5% 1.4% 13.7% 4,452 - 4,452 1,970 0.2% 602 30.6% 958
13 Hongkong And Shanghai Banking Corporation Limited (The) 31-Dec-17 64.8% 1.4% 40.8% 43.5% 1.2% 13.4% 30,061 303 29,878 17,579 0.5% 8,229 46.8% 7,472
14 Industrial And Commercial Bank of China (Asia) Limited 31-Dec-17 92.0% 1.2% 23.3% 23.4% 0.9% 8.8% 802 16 819 3,064 0.7% 2,108 68.8% 640
15 Nanyang Commercial Bank, Limited 31-Dec-17 72.1% 1.5% 21.6% 38.0% 0.8% 7.2% 464 53 517 1,023 0.4% 820 80.2% 132
16 OCBC Wing Hang Bank Limited 31-Dec-17 81.9% 1.5% 22.7% 52.0% 0.8% 6.9% 4,587 27 4,614 871 0.5% 173 19.9% 744
17 Public Bank (Hong Kong) Limited 31-Dec-17 85.7% 3.3% 14.0% 53.1% 1.2% 8.9% 553 - 553 135 0.5% 71 52.6% 61
18 Shanghai Commercial Bank Limited 31-Dec-17 53.3% 1.8% 32.7% 33.0% 1.4% 9.7% 2,379 - 2,379 609 0.8% 37 6.1% 1,383
19 Standard Chartered Bank (Hong Kong) Limited 31-Dec-17 54.4% 1.2% 51.8% 65.3% 0.8% 12.1% 2,182 84 2,266 3,278 0.7% 907 27.7% 1,344
20 Tai Sang Bank Limited 31-Dec-17 14.3% 0.6% 68.6% 57.1% 2.4% 6.2% - - - - 0.0% - N/A -
21 Tai Yau Bank Limited 31-Dec-17 0.0% 0.6% 93.5% 5.0% 9.0% 37.5% - - - - 0.0% - N/A -
22 Wing Lung Bank Limited 31-Dec-17 73.8% 1.3% 37.9% 33.3% 1.4% 11.0% 2,889 23 2,911 835 0.5% 332 39.8% 444
TOTALN1 2017 67.3% 1.4% 37.5% 42.7% 1.1% 11.5% 60,777 1,196 61,487 41,105 0.5% 17,357 42.2% 21,406
Total excluding HSBCN2 2017 70.3% 1.4% 33.3% 39.9% 1.1% 10.5% 35,168 893 36,061 25,496 0.5% 9,730 38.2% 14,892
Total excluding BOCHK & HSBCN2 2017 71.5% 1.5% 33.9% 43.3% 1.0% 9.6% 32,029 862 32,891 24,125 0.6% 9,192 38.1% 13,369
Hong Kong Banking Report 2018 | 57
© 2018 KPMG, a Hong Kong partnership and a member firm of the KPMG network of independent member firms affiliated with KPMG International Cooperative (“KPMG International”), a Swiss entity. All rights reserved. © 2018 KPMG, a Hong Kong partnership and a member firm of the KPMG network of independent member firms affiliated with KPMG International Cooperative (“KPMG International”), a Swiss entity. All rights reserved.
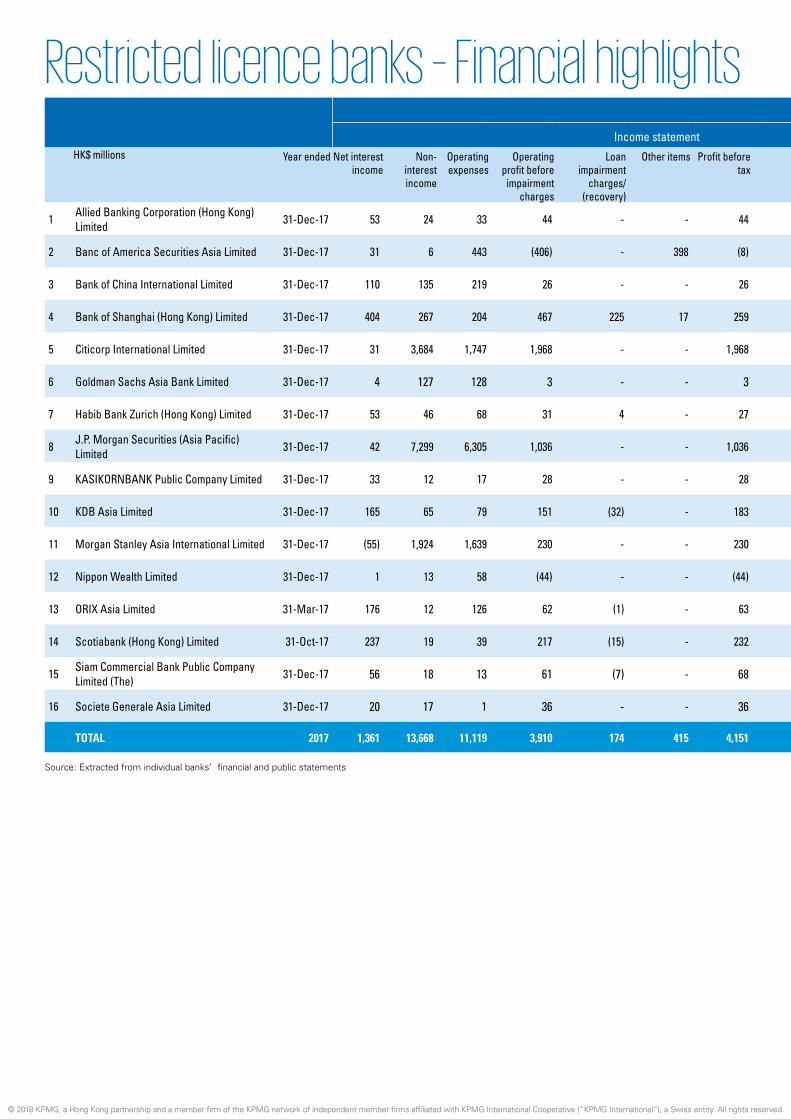
Financial highlights
Income statement Size and strength measuresHK$ millions Year ended Net interest
incomeNon-
interest income
Operating expenses
Operating profit before
impairment charges
Loan impairment
charges/(recovery)
Other items Profit before tax
Net profit after tax Total assets Gross advances to customers
Impairment allowances
against customer advances
Total deposits from customers
Total equity Capital adequacy ratio
Liquidity ratio
1 Allied Banking Corporation (Hong Kong) Limited 31-Dec-17 53 24 33 44 - - 44 38 1,677 1,119 2 1,157 472 31.2% 45.9%
2 Banc of America Securities Asia Limited 31-Dec-17 31 6 443 (406) - 398 (8) (7) 4,989 - - - 4,181 163% 37380%
3 Bank of China International Limited 31-Dec-17 110 135 219 26 - - 26 22 11,399 4,182 2 9,711 1,557 34.3% 51.6%
4 Bank of Shanghai (Hong Kong) Limited 31-Dec-17 404 267 204 467 225 17 259 221 25,777 15,329 266 13,628 4,454 22.3% 51.0%
5 Citicorp International Limited 31-Dec-17 31 3,684 1,747 1,968 - - 1,968 1,643 10,727 - - - 8,763 109.5% 160.0%
6 Goldman Sachs Asia Bank Limited 31-Dec-17 4 127 128 3 - - 3 3 1,036 - - 8 888 200.4% 160.0%
7 Habib Bank Zurich (Hong Kong) Limited 31-Dec-17 53 46 68 31 4 - 27 22 2,236 1,287 31 1,237 555 33.7% 90.3%
8 J.P. Morgan Securities (Asia Pacific) Limited 31-Dec-17 42 7,299 6,305 1,036 - - 1,036 847 11,778 - - - 7,187 40.3% 263.7%
9 KASIKORNBANK Public Company Limited 31-Dec-17 33 12 17 28 - - 28 24 12,094 688 5 220 446 18.0% 2243.0%
10 KDB Asia Limited 31-Dec-17 165 65 79 151 (32) - 183 157 10,806 6,059 65 16 2,261 28.9% 154.1%
11 Morgan Stanley Asia International Limited 31-Dec-17 (55) 1,924 1,639 230 - - 230 196 31,711 11,180 - 22,660 1,821 24.0% 58.0%
12 Nippon Wealth Limited 31-Dec-17 1 13 58 (44) - - (44) (44) 308 - - 126 175 190.5% 144.8%
13 ORIX Asia Limited 31-Mar-17 176 12 126 62 (1) - 63 53 7,031 6,571 39 276 2,058 29.2% 52.0%
14 Scotiabank (Hong Kong) Limited 31-Oct-17 237 19 39 217 (15) - 232 194 14,716 11,495 21 - 5,410 41.8% 49.7%
15 Siam Commercial Bank Public Company Limited (The) 31-Dec-17 56 18 13 61 (7) - 68 62 14,498 2,037 20 1,274 - 17.7% 143.5%
16 Societe Generale Asia Limited 31-Dec-17 20 17 1 36 - - 36 30 243 - - - 180 60.2% 61.8%
TOTAL 2017 1,361 13,668 11,119 3,910 174 415 4,151 3,461 161,026 59,947 451 50,313 40,408 - -
Source: Extracted from individual banks’ financial and public statements
Restricted licence banks – Financial highlights
© 2018 KPMG, a Hong Kong partnership and a member firm of the KPMG network of independent member firms affiliated with KPMG International Cooperative (“KPMG International”), a Swiss entity. All rights reserved. © 2018 KPMG, a Hong Kong partnership and a member firm of the KPMG network of independent member firms affiliated with KPMG International Cooperative (“KPMG International”), a Swiss entity. All rights reserved.

Financial highlights
Income statement Size and strength measuresHK$ millions Year ended Net interest
incomeNon-
interest income
Operating expenses
Operating profit before
impairment charges
Loan impairment
charges/(recovery)
Other items Profit before tax
Net profit after tax Total assets Gross advances to customers
Impairment allowances
against customer advances
Total deposits from customers
Total equity Capital adequacy ratio
Liquidity ratio
1 Allied Banking Corporation (Hong Kong) Limited 31-Dec-17 53 24 33 44 - - 44 38 1,677 1,119 2 1,157 472 31.2% 45.9%
2 Banc of America Securities Asia Limited 31-Dec-17 31 6 443 (406) - 398 (8) (7) 4,989 - - - 4,181 163% 37380%
3 Bank of China International Limited 31-Dec-17 110 135 219 26 - - 26 22 11,399 4,182 2 9,711 1,557 34.3% 51.6%
4 Bank of Shanghai (Hong Kong) Limited 31-Dec-17 404 267 204 467 225 17 259 221 25,777 15,329 266 13,628 4,454 22.3% 51.0%
5 Citicorp International Limited 31-Dec-17 31 3,684 1,747 1,968 - - 1,968 1,643 10,727 - - - 8,763 109.5% 160.0%
6 Goldman Sachs Asia Bank Limited 31-Dec-17 4 127 128 3 - - 3 3 1,036 - - 8 888 200.4% 160.0%
7 Habib Bank Zurich (Hong Kong) Limited 31-Dec-17 53 46 68 31 4 - 27 22 2,236 1,287 31 1,237 555 33.7% 90.3%
8 J.P. Morgan Securities (Asia Pacific) Limited 31-Dec-17 42 7,299 6,305 1,036 - - 1,036 847 11,778 - - - 7,187 40.3% 263.7%
9 KASIKORNBANK Public Company Limited 31-Dec-17 33 12 17 28 - - 28 24 12,094 688 5 220 446 18.0% 2243.0%
10 KDB Asia Limited 31-Dec-17 165 65 79 151 (32) - 183 157 10,806 6,059 65 16 2,261 28.9% 154.1%
11 Morgan Stanley Asia International Limited 31-Dec-17 (55) 1,924 1,639 230 - - 230 196 31,711 11,180 - 22,660 1,821 24.0% 58.0%
12 Nippon Wealth Limited 31-Dec-17 1 13 58 (44) - - (44) (44) 308 - - 126 175 190.5% 144.8%
13 ORIX Asia Limited 31-Mar-17 176 12 126 62 (1) - 63 53 7,031 6,571 39 276 2,058 29.2% 52.0%
14 Scotiabank (Hong Kong) Limited 31-Oct-17 237 19 39 217 (15) - 232 194 14,716 11,495 21 - 5,410 41.8% 49.7%
15 Siam Commercial Bank Public Company Limited (The) 31-Dec-17 56 18 13 61 (7) - 68 62 14,498 2,037 20 1,274 - 17.7% 143.5%
16 Societe Generale Asia Limited 31-Dec-17 20 17 1 36 - - 36 30 243 - - - 180 60.2% 61.8%
TOTAL 2017 1,361 13,668 11,119 3,910 174 415 4,151 3,461 161,026 59,947 451 50,313 40,408 - -
Hong Kong Banking Report 2018 | 59
© 2018 KPMG, a Hong Kong partnership and a member firm of the KPMG network of independent member firms affiliated with KPMG International Cooperative (“KPMG International”), a Swiss entity. All rights reserved. © 2018 KPMG, a Hong Kong partnership and a member firm of the KPMG network of independent member firms affiliated with KPMG International Cooperative (“KPMG International”), a Swiss entity. All rights reserved. © 2018 KPMG, a Hong Kong partnership and a member firm of the KPMG network of independent member firms affiliated with KPMG International Cooperative (“KPMG International”), a Swiss entity. All rights reserved.

Key ratios Loan asset quality
Performance measures Past due but not impaired advances Impaired advancesHK$ millions Year ended Net customer
loan/deposit ratio
Net interest income/
average total assets
Non-interest income/total
operating income
Cost/income ratio
ROA ROE Loans overdue ≤ 3 months
Loans overdue > 3 months
Gross advances which are past due
but not impaired
Gross impaired advances
Gross impaired advances/gross
advances to customers
Individually assessed
impairment allowances made against impaired
advances
Individually assessed
allowances as a percentage of gross impaired
advances
Collaterals for individually
assessed impaired advances
1 Allied Banking Corporation (Hong Kong) Limited 31-Dec-17 96.5% 3.1% 31.2% 42.9% 2.2% 8.4% 15 - 15 - 0.0% - N/A N/A
2 Banc of America Securities Asia Limited 31-Dec-17 N/A 0.9% 16.2% 1197.3% -0.2% -0.2% - - - - N/A - N/A -
3 Bank of China International Limited 31-Dec-17 43.0% 1.0% 55.1% 89.4% 0.2% 1.4% - - - 2 0.0% 2 100.0% -
4 Bank of Shanghai (Hong Kong) Limited 31-Dec-17 110.5% 1.7% 39.8% 30.4% 0.9% 5.1% - - - 274 1.8% 7 2.6% -
5 Citicorp International Limited 31-Dec-17 N/A 0.3% 99.2% 47.0% 17.7% 20.7% - - - - N/A - N/A -
6 Goldman Sachs Asia Bank Limited 31-Dec-17 0.0% 0.4% 96.9% 97.7% 0.3% 0.3% - - - - N/A - N/A -
7 Habib Bank Zurich (Hong Kong) Limited 31-Dec-17 101.5% 2.4% 46.5% 68.7% 1.0% 4.0% 113 - 113 29 2.3% 12 41.4% 15
8 J.P. Morgan Securities (Asia Pacific) Limited 31-Dec-17 N/A 0.4% 99.4% 85.9% 7.6% 13.6% - - - - N/A - N/A -
9 KASIKORNBANK Public Company Limited 31-Dec-17 310.5% 0.3% 26.7% 37.8% 0.2% 5.5% - - - - 0.0% - N/A -
10 KDB Asia Limited 31-Dec-17 37462.5% 1.6% 28.3% 34.3% 1.5% 7.2% - - - 252 4.2% 59 23.4% -
11 Morgan Stanley Asia International Limited 31-Dec-17 N/A -0.2% 102.9% 87.7% 0.6% 11.4% - - - - 0.0% - N/A -
12 Nippon Wealth Limited 31-Dec-17 0.0% N/A 92.9% 414.3% -14.8% -27.8% - - - - N/A - N/A -
13 ORIX Asia Limited 31-Mar-17 2366.7% 2.8% 6.4% 67.0% 0.8% 2.6% 136 - 136 37 0.6% 31 83.8% 6
14 Scotiabank (Hong Kong) Limited 31-Oct-17 N/A 1.3% 7.4% 15.2% 1.1% 3.7% - - - - 0.0% - N/A -
15 Siam Commercial Bank Public Company Limited (The) 31-Dec-17 158.3% 0.4% 24.3% 17.6% 0.4% N/A - - - - 0.0% - N/A -
16 Societe Generale Asia Limited 31-Dec-17 N/A 4.2% 45.9% 2.7% 6.3% 9.8% - - - - N/A - N/A -
TOTAL 2017 118.3% 0.8% 90.9% 74.0% 2.1% 9.2% 264 - 264 594 1.0% 111 18.7% 21
Source: Extracted from individual banks’ financial and public statements
60 | Hong Kong Banking Report 2018
© 2018 KPMG, a Hong Kong partnership and a member firm of the KPMG network of independent member firms affiliated with KPMG International Cooperative (“KPMG International”), a Swiss entity. All rights reserved.
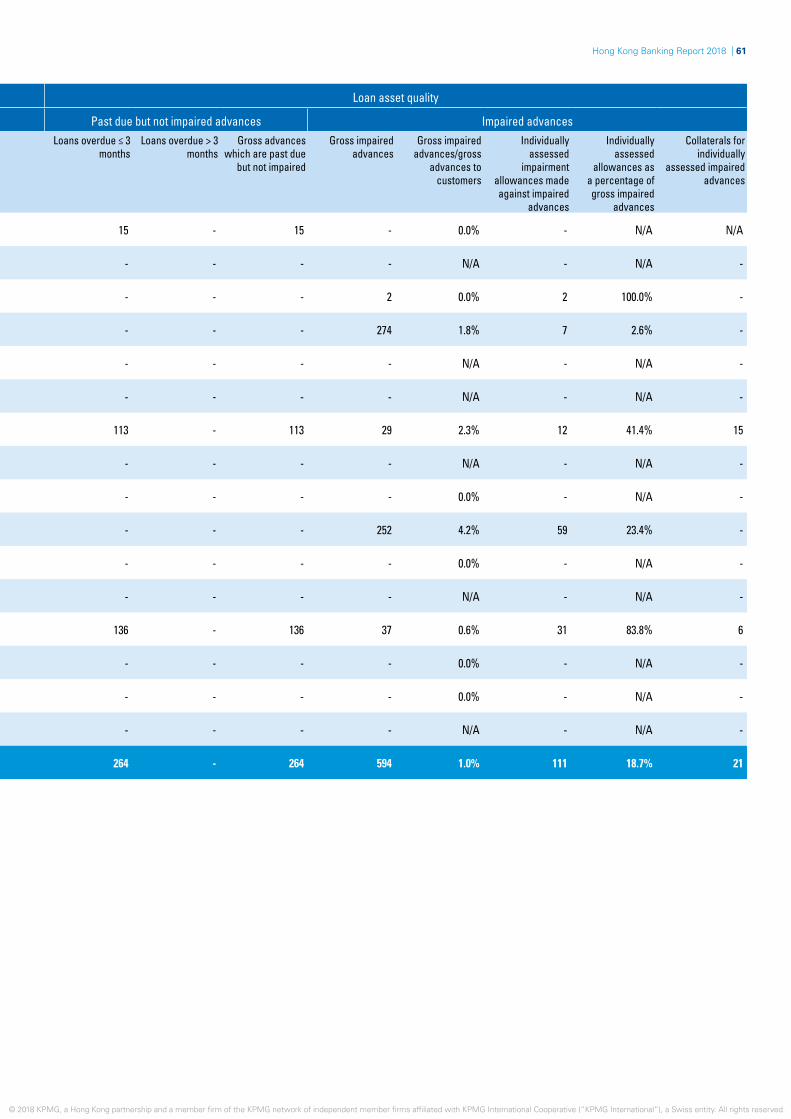
Key ratios Loan asset quality
Performance measures Past due but not impaired advances Impaired advancesHK$ millions Year ended Net customer
loan/deposit ratio
Net interest income/
average total assets
Non-interest income/total
operating income
Cost/income ratio
ROA ROE Loans overdue ≤ 3 months
Loans overdue > 3 months
Gross advances which are past due
but not impaired
Gross impaired advances
Gross impaired advances/gross
advances to customers
Individually assessed
impairment allowances made against impaired
advances
Individually assessed
allowances as a percentage of gross impaired
advances
Collaterals for individually
assessed impaired advances
1 Allied Banking Corporation (Hong Kong) Limited 31-Dec-17 96.5% 3.1% 31.2% 42.9% 2.2% 8.4% 15 - 15 - 0.0% - N/A N/A
2 Banc of America Securities Asia Limited 31-Dec-17 N/A 0.9% 16.2% 1197.3% -0.2% -0.2% - - - - N/A - N/A -
3 Bank of China International Limited 31-Dec-17 43.0% 1.0% 55.1% 89.4% 0.2% 1.4% - - - 2 0.0% 2 100.0% -
4 Bank of Shanghai (Hong Kong) Limited 31-Dec-17 110.5% 1.7% 39.8% 30.4% 0.9% 5.1% - - - 274 1.8% 7 2.6% -
5 Citicorp International Limited 31-Dec-17 N/A 0.3% 99.2% 47.0% 17.7% 20.7% - - - - N/A - N/A -
6 Goldman Sachs Asia Bank Limited 31-Dec-17 0.0% 0.4% 96.9% 97.7% 0.3% 0.3% - - - - N/A - N/A -
7 Habib Bank Zurich (Hong Kong) Limited 31-Dec-17 101.5% 2.4% 46.5% 68.7% 1.0% 4.0% 113 - 113 29 2.3% 12 41.4% 15
8 J.P. Morgan Securities (Asia Pacific) Limited 31-Dec-17 N/A 0.4% 99.4% 85.9% 7.6% 13.6% - - - - N/A - N/A -
9 KASIKORNBANK Public Company Limited 31-Dec-17 310.5% 0.3% 26.7% 37.8% 0.2% 5.5% - - - - 0.0% - N/A -
10 KDB Asia Limited 31-Dec-17 37462.5% 1.6% 28.3% 34.3% 1.5% 7.2% - - - 252 4.2% 59 23.4% -
11 Morgan Stanley Asia International Limited 31-Dec-17 N/A -0.2% 102.9% 87.7% 0.6% 11.4% - - - - 0.0% - N/A -
12 Nippon Wealth Limited 31-Dec-17 0.0% N/A 92.9% 414.3% -14.8% -27.8% - - - - N/A - N/A -
13 ORIX Asia Limited 31-Mar-17 2366.7% 2.8% 6.4% 67.0% 0.8% 2.6% 136 - 136 37 0.6% 31 83.8% 6
14 Scotiabank (Hong Kong) Limited 31-Oct-17 N/A 1.3% 7.4% 15.2% 1.1% 3.7% - - - - 0.0% - N/A -
15 Siam Commercial Bank Public Company Limited (The) 31-Dec-17 158.3% 0.4% 24.3% 17.6% 0.4% N/A - - - - 0.0% - N/A -
16 Societe Generale Asia Limited 31-Dec-17 N/A 4.2% 45.9% 2.7% 6.3% 9.8% - - - - N/A - N/A -
TOTAL 2017 118.3% 0.8% 90.9% 74.0% 2.1% 9.2% 264 - 264 594 1.0% 111 18.7% 21
Hong Kong Banking Report 2018 | 61
© 2018 KPMG, a Hong Kong partnership and a member firm of the KPMG network of independent member firms affiliated with KPMG International Cooperative (“KPMG International”), a Swiss entity. All rights reserved. © 2018 KPMG, a Hong Kong partnership and a member firm of the KPMG network of independent member firms affiliated with KPMG International Cooperative (“KPMG International”), a Swiss entity. All rights reserved.

Financial highlights
Income statement Size and strength measuresHK$ millions Year ended Net interest
incomeNon-
interest income
Operating expenses
Operating profit before
impairment charges
Loan impairment
charges/(recovery)
Other items Profit before tax
Net profit after tax Total assets Gross advances to customers
Impairment allowances
against customer advances
Total deposits from customers
Total equity Capital adequacy ratio
Liquidity ratio
1 BCOM Finance (Hong Kong) Limited 31-Dec-17 - 7 1 6 - - 6 5 248 - - 1 246 N/A N/A
2 BPI International Finance Limited 31-Dec-17 4 38 35 7 - - 7 6 459 18 - 260 189 96.2% 503.0%
3 Chau's Brothers Finance Company Limited 31-Dec-17 5 1 5 1 - - 1 1 73 59 - 3 69 95.9% 149.1%
4 Chong Hing Finance Limited 31-Dec-17 - - - - - - - - 45 - - - 45 N/A N/A
5 Commonwealth Finance Corporation Limited 31-Dec-17 13 4 11 6 1 5 10 9 324 251 5 141 113 54.7% 250.6%
6 Corporate Finance (D.T.C.) Limited 31-Dec-17 5 - 3 2 - - 2 2 337 134 - 238 97 N/A N/A
7 Fubon Credit (Hong Kong) Limited 31-Dec-17 - - 1 (1) (2) - 1 1 96 8 - - 90 N/A N/A
8 Gunma Finance (Hong Kong) Limited 31-Dec-17 10 - 8 2 - - 2 2 586 282 - 17 312 N/A N/A
9 Habib Finance International Limited 31-Dec-17 8 3 9 2 - - 2 2 165 107 - 4 155 175.4% 573.1%
10 Henderson International Finance Limited 31-Dec-17 1 - 1 - - - - - 57 - - 3 54 N/A N/A
11 HKCB Finance Limited 31-Dec-17 81 5 7 79 - - 79 66 6,145 6,073 - - 506 17.6% 160.0%
12 KEB Hana Global Finance Limited 31-Dec-17 27 13 25 15 8 - 7 6 1,391 1,167 9 - 441 60.1% 787.18%
13 Kexim Asia Limited 31-Dec-17 34 2 15 21 (3) 2 26 22 3,080 1,526 10 - 439 21.8% 720.6%
14 Public Finance Limited 31-Dec-17 788 118 435 471 166 2 307 256 6,856 5,725 75 5,077 1,600 22.8% 72.9%
15 Shinhan Asia Limited 31-Dec-17 70 78 38 110 - - 110 96 4,000 1,596 2 - 1,516 36.5% 161.4%
16 Vietnam Finance Company Limited 31-Dec-17 8 3 7 4 - - 4 3 997 2 - - 102 N/A N/A
17 Woori Global Markets Asia Limited 31-Dec-17 30 13 26 17 - - 17 14 2,123 1,044 2 - 817 52.3% 193.7%
TOTAL 2017 1,084 285 627 742 170 9 581 491 26,982 17,992 103 5,744 6,791 - -
Source: Extracted from individual banks’ financial and public statements
Deposit-taking companies – Financial highlights
© 2018 KPMG, a Hong Kong partnership and a member firm of the KPMG network of independent member firms affiliated with KPMG International Cooperative (“KPMG International”), a Swiss entity. All rights reserved. © 2018 KPMG, a Hong Kong partnership and a member firm of the KPMG network of independent member firms affiliated with KPMG International Cooperative (“KPMG International”), a Swiss entity. All rights reserved.
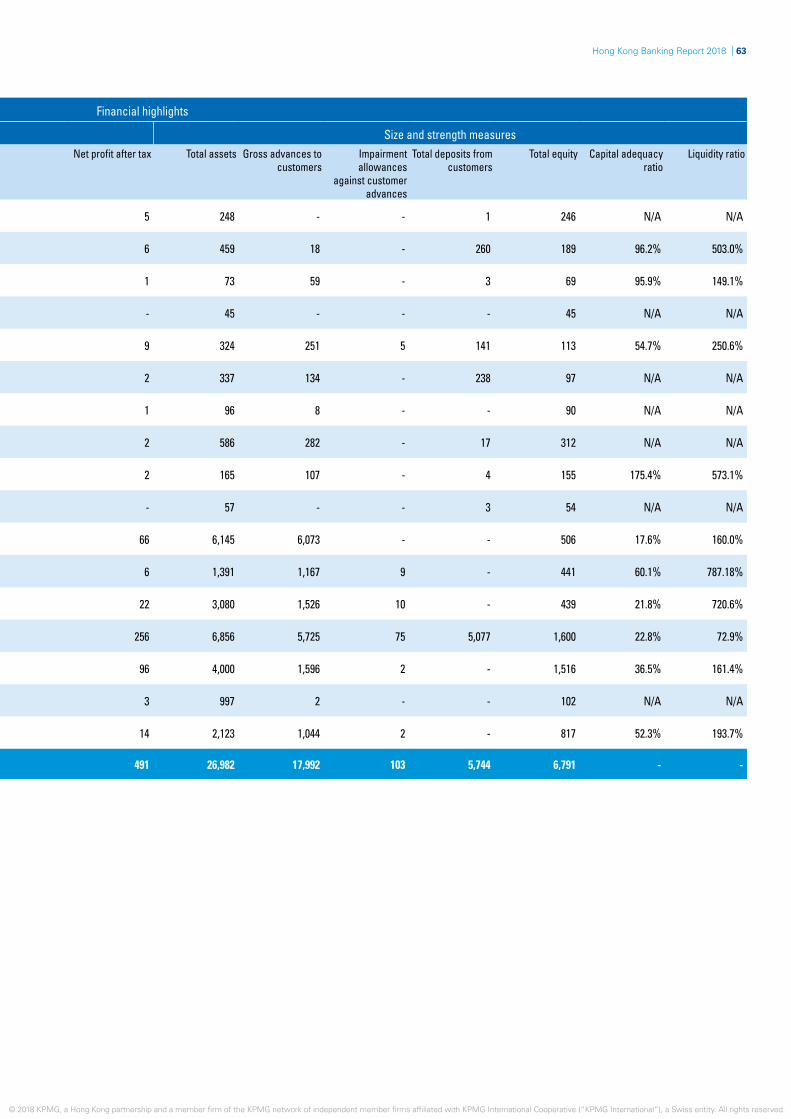
Financial highlights
Income statement Size and strength measuresHK$ millions Year ended Net interest
incomeNon-
interest income
Operating expenses
Operating profit before
impairment charges
Loan impairment
charges/(recovery)
Other items Profit before tax
Net profit after tax Total assets Gross advances to customers
Impairment allowances
against customer advances
Total deposits from customers
Total equity Capital adequacy ratio
Liquidity ratio
1 BCOM Finance (Hong Kong) Limited 31-Dec-17 - 7 1 6 - - 6 5 248 - - 1 246 N/A N/A
2 BPI International Finance Limited 31-Dec-17 4 38 35 7 - - 7 6 459 18 - 260 189 96.2% 503.0%
3 Chau's Brothers Finance Company Limited 31-Dec-17 5 1 5 1 - - 1 1 73 59 - 3 69 95.9% 149.1%
4 Chong Hing Finance Limited 31-Dec-17 - - - - - - - - 45 - - - 45 N/A N/A
5 Commonwealth Finance Corporation Limited 31-Dec-17 13 4 11 6 1 5 10 9 324 251 5 141 113 54.7% 250.6%
6 Corporate Finance (D.T.C.) Limited 31-Dec-17 5 - 3 2 - - 2 2 337 134 - 238 97 N/A N/A
7 Fubon Credit (Hong Kong) Limited 31-Dec-17 - - 1 (1) (2) - 1 1 96 8 - - 90 N/A N/A
8 Gunma Finance (Hong Kong) Limited 31-Dec-17 10 - 8 2 - - 2 2 586 282 - 17 312 N/A N/A
9 Habib Finance International Limited 31-Dec-17 8 3 9 2 - - 2 2 165 107 - 4 155 175.4% 573.1%
10 Henderson International Finance Limited 31-Dec-17 1 - 1 - - - - - 57 - - 3 54 N/A N/A
11 HKCB Finance Limited 31-Dec-17 81 5 7 79 - - 79 66 6,145 6,073 - - 506 17.6% 160.0%
12 KEB Hana Global Finance Limited 31-Dec-17 27 13 25 15 8 - 7 6 1,391 1,167 9 - 441 60.1% 787.18%
13 Kexim Asia Limited 31-Dec-17 34 2 15 21 (3) 2 26 22 3,080 1,526 10 - 439 21.8% 720.6%
14 Public Finance Limited 31-Dec-17 788 118 435 471 166 2 307 256 6,856 5,725 75 5,077 1,600 22.8% 72.9%
15 Shinhan Asia Limited 31-Dec-17 70 78 38 110 - - 110 96 4,000 1,596 2 - 1,516 36.5% 161.4%
16 Vietnam Finance Company Limited 31-Dec-17 8 3 7 4 - - 4 3 997 2 - - 102 N/A N/A
17 Woori Global Markets Asia Limited 31-Dec-17 30 13 26 17 - - 17 14 2,123 1,044 2 - 817 52.3% 193.7%
TOTAL 2017 1,084 285 627 742 170 9 581 491 26,982 17,992 103 5,744 6,791 - -
Hong Kong Banking Report 2018 | 63
© 2018 KPMG, a Hong Kong partnership and a member firm of the KPMG network of independent member firms affiliated with KPMG International Cooperative (“KPMG International”), a Swiss entity. All rights reserved. © 2018 KPMG, a Hong Kong partnership and a member firm of the KPMG network of independent member firms affiliated with KPMG International Cooperative (“KPMG International”), a Swiss entity. All rights reserved. © 2018 KPMG, a Hong Kong partnership and a member firm of the KPMG network of independent member firms affiliated with KPMG International Cooperative (“KPMG International”), a Swiss entity. All rights reserved.

Key ratios Loan asset quality
Performance measures Past due but not impaired advances Impaired advancesHK$ millions Year ended Net customer
loan/deposit ratio
Net interest income/
average total assets
Non-interest income/
total operating income
Cost/income ratio
ROA ROE Loans overdue ≤ 3 months
Loans overdue > 3 months
Gross advances which are past due
but not impaired
Gross impaired advances
Gross impaired advances/gross
advances to customers
Individually assessed
impairment allowances made against impaired
advances
Individually assessed
allowances as a percentage of gross impaired
advances
Collaterals for individually
assessed impaired advances
1 BCOM Finance (Hong Kong) Limited 31-Dec-17 0.0% 0.0% 100.0% 14.3% 2.0% 2.1% - - - - N/A - N/A -
2 BPI International Finance Limited 31-Dec-17 6.9% 0.9% 90.5% 83.3% 1.4% 3.2% - - - - 0.0% - N/A -
3 Chau's Brothers Finance Company Limited 31-Dec-17 1966.7% 6.8% 16.7% 83.3% 1.4% 1.4% - - - N/A N/A - N/A N/A
4 Chong Hing Finance Limited 31-Dec-17 N/A 0.0% N/A N/A 0.0% 0.0% - - - - N/A - N/A -
5 Commonwealth Finance Corporation Limited 31-Dec-17 174.5% 4.3% 23.5% 64.7% 3.0% 8.2% - - - N/A N/A 3 N/A N/A
6 Corporate Finance (D.T.C.) Limited 31-Dec-17 56.3% 1.5% 0.0% 60.0% 0.6% 2.1% 35 - 35 - 0.0% - N/A 145
7 Fubon Credit (Hong Kong) Limited 31-Dec-17 N/A 0.0% N/A N/A 1.0% 1.1% - - - N/A N/A N/A N/A N/A
8 Gunma Finance (Hong Kong) Limited 31-Dec-17 1658.8% 1.7% 0.0% 80.0% 0.3% 0.6% - - - - 0.0% - N/A -
9 Habib Finance International Limited 31-Dec-17 2675.0% 3.0% 27.3% 81.8% 0.8% 1.3% 3 - 3 - 0.0% - N/A 4
10 Henderson International Finance Limited 31-Dec-17 0.0% 1.1% 0.0% 100.0% 0.0% 0.0% - - - - N/A - N/A -
11 HKCB Finance Limited 31-Dec-17 N/A 1.3% 5.8% 8.1% 1.1% 12.9% 83 - 83 - 0.0% - N/A N/A
12 KEB Hana Global Finance Limited 31-Dec-17 N/A 2.0% 32.5% 62.5% 0.4% 1.4% - - - 10 0.9% 7 70.0% -
13 Kexim Asia Limited 31-Dec-17 N/A 1.2% 5.6% 41.7% 0.8% 5.1% - - - - 0.0% - N/A -
14 Public Finance Limited 31-Dec-17 111.3% 11.6% 13.0% 48.0% 3.8% 16.2% 282 - 282 101 1.8% 69 68.3% -
15 Shinhan Asia Limited 31-Dec-17 N/A 2.0% 52.7% 25.7% 2.7% 6.6% - - - - 0.0% - N/A -
16 Vietnam Finance Company Limited 31-Dec-17 N/A 0.8% 27.3% 63.6% 0.3% 3.0% - - - N/A N/A - N/A N/A
17 Woori Global Markets Asia Limited 31-Dec-17 N/A 1.5% 30.2% 60.5% 0.7% 1.7% - - - - 0.0% - N/A N/A
TOTAL 2017 311.4% 4.1% 20.8% 45.8% 1.9% 7.3% 403 - 403 111 0.6% 79 71.2% 149
Source: Extracted from individual companies’ financial and public statements
64 | Hong Kong Banking Report 2018
© 2018 KPMG, a Hong Kong partnership and a member firm of the KPMG network of independent member firms affiliated with KPMG International Cooperative (“KPMG International”), a Swiss entity. All rights reserved.

Key ratios Loan asset quality
Performance measures Past due but not impaired advances Impaired advancesHK$ millions Year ended Net customer
loan/deposit ratio
Net interest income/
average total assets
Non-interest income/
total operating income
Cost/income ratio
ROA ROE Loans overdue ≤ 3 months
Loans overdue > 3 months
Gross advances which are past due
but not impaired
Gross impaired advances
Gross impaired advances/gross
advances to customers
Individually assessed
impairment allowances made against impaired
advances
Individually assessed
allowances as a percentage of gross impaired
advances
Collaterals for individually
assessed impaired advances
1 BCOM Finance (Hong Kong) Limited 31-Dec-17 0.0% 0.0% 100.0% 14.3% 2.0% 2.1% - - - - N/A - N/A -
2 BPI International Finance Limited 31-Dec-17 6.9% 0.9% 90.5% 83.3% 1.4% 3.2% - - - - 0.0% - N/A -
3 Chau's Brothers Finance Company Limited 31-Dec-17 1966.7% 6.8% 16.7% 83.3% 1.4% 1.4% - - - N/A N/A - N/A N/A
4 Chong Hing Finance Limited 31-Dec-17 N/A 0.0% N/A N/A 0.0% 0.0% - - - - N/A - N/A -
5 Commonwealth Finance Corporation Limited 31-Dec-17 174.5% 4.3% 23.5% 64.7% 3.0% 8.2% - - - N/A N/A 3 N/A N/A
6 Corporate Finance (D.T.C.) Limited 31-Dec-17 56.3% 1.5% 0.0% 60.0% 0.6% 2.1% 35 - 35 - 0.0% - N/A 145
7 Fubon Credit (Hong Kong) Limited 31-Dec-17 N/A 0.0% N/A N/A 1.0% 1.1% - - - N/A N/A N/A N/A N/A
8 Gunma Finance (Hong Kong) Limited 31-Dec-17 1658.8% 1.7% 0.0% 80.0% 0.3% 0.6% - - - - 0.0% - N/A -
9 Habib Finance International Limited 31-Dec-17 2675.0% 3.0% 27.3% 81.8% 0.8% 1.3% 3 - 3 - 0.0% - N/A 4
10 Henderson International Finance Limited 31-Dec-17 0.0% 1.1% 0.0% 100.0% 0.0% 0.0% - - - - N/A - N/A -
11 HKCB Finance Limited 31-Dec-17 N/A 1.3% 5.8% 8.1% 1.1% 12.9% 83 - 83 - 0.0% - N/A N/A
12 KEB Hana Global Finance Limited 31-Dec-17 N/A 2.0% 32.5% 62.5% 0.4% 1.4% - - - 10 0.9% 7 70.0% -
13 Kexim Asia Limited 31-Dec-17 N/A 1.2% 5.6% 41.7% 0.8% 5.1% - - - - 0.0% - N/A -
14 Public Finance Limited 31-Dec-17 111.3% 11.6% 13.0% 48.0% 3.8% 16.2% 282 - 282 101 1.8% 69 68.3% -
15 Shinhan Asia Limited 31-Dec-17 N/A 2.0% 52.7% 25.7% 2.7% 6.6% - - - - 0.0% - N/A -
16 Vietnam Finance Company Limited 31-Dec-17 N/A 0.8% 27.3% 63.6% 0.3% 3.0% - - - N/A N/A - N/A N/A
17 Woori Global Markets Asia Limited 31-Dec-17 N/A 1.5% 30.2% 60.5% 0.7% 1.7% - - - - 0.0% - N/A N/A
TOTAL 2017 311.4% 4.1% 20.8% 45.8% 1.9% 7.3% 403 - 403 111 0.6% 79 71.2% 149
Hong Kong Banking Report 2018 | 65
© 2018 KPMG, a Hong Kong partnership and a member firm of the KPMG network of independent member firms affiliated with KPMG International Cooperative (“KPMG International”), a Swiss entity. All rights reserved. © 2018 KPMG, a Hong Kong partnership and a member firm of the KPMG network of independent member firms affiliated with KPMG International Cooperative (“KPMG International”), a Swiss entity. All rights reserved.

Financial highlights
Income statement Size and strength measuresHK$ millions Year ended Net interest
incomeNon-interest
incomeOperating expenses
Operating profit before
impairment charges
Loan impairment
charges/(recovery)
Other items Profit before tax Net profit after tax Total assets Gross advances to customers
Impairment allowances against customer
advances
Total deposits from customers
Liquidity ratio
1 ABN AMRO Bank N.V. 31-Dec-17 354 229 324 259 159 1,080 1,180 1,161 56,161 16,178 239 2,311 53.4%
2 Agricultural Bank of China Limited 31-Dec-17 3,453 1,125 399 4,179 243 56 3,880 3,239 528,781 240,428 618 110,547 50.4%
3 Allahabad Bank 31-Mar-17 123 24 17 130 126 - 4 20 15,344 9,560 175 1,406 143.5%
4 Australia And New Zealand Banking Group Limited 30-Sep-17 891 839 1,799 (69) 52 - (121) (112) 150,257 52,634 280 51,075 37.1%
5 Axis Bank Limited 31-Mar-17 154 202 32 324 670 - (346) (346) 14,584 12,257 814 1,292 93.9%
6 Banco Bilbao Vizcaya Argentaria S.A. 31-Dec-17 178 254 182 250 102 - 148 148 25,171 17,712 3 2,554 46.4%
7 Banco Santander, S.A. 31-Dec-17 98 310 503 (95) - - (95) (117) 56,978 17,266 10 442 42.0%
8 Bangkok Bank Public Company Limited 31-Dec-17 319 48 141 226 185 - 41 38 75,542 16,591 1,542 12,096 40.7%
9 Bank J. Safra Sarasin AG 31-Dec-17 114 259 302 71 - - 71 61 18,463 11,595 - 9,568 44.8%
10 Bank Julius Baer & Co. Ltd. 31-Dec-17 470 1,299 1,608 161 - - 161 201 86,021 38,229 - 44,757 40.7%
11 Bank of America, National Association 31-Dec-17 1,129 1,202 1,802 529 247 - 282 238 140,113 55,889 1,265 45,700 56.4%
12 Bank of Baroda 31-Mar-17 84 51 28 107 266 - (159) (167) 14,544 7,021 467 1,338 40.5%
13 Bank of China Limited 31-Dec-17 2,852 (1,223) 123 1,506 - - 1,506 1,258 349,053 - - - 14569.8%
14 Bank of Communications Co., Ltd. 31-Dec-17 4,965 2,695 2,371 5,289 132 18 5,237 4,399 595,108 257,755 1,393 440,088 148.0%
15 Bank of India 31-Mar-17 293 32 47 278 326 5 (53) (80) 22,115 9,547 762 4,052 194.9%
16 Bank of Montreal 31-Oct-17 63 190 392 (139) 12 - (151) (152) 21,846 7,607 22 5,156 70.5%
17 Bank of New York Mellon (The) 31-Dec-17 118 785 565 338 - - 338 270 50,248 1,867 - 3,688 164.6%
18 Bank of Nova Scotia (The) 31-Oct-17 162 372 273 261 - - 261 212 39,183 12,134 - 11,175 57.8%
19 Bank of Singapore Limited 31-Dec-17 81 510 558 33 - - 33 23 23,023 8,464 - 12,687 43.8%
20 Bank of Taiwan 31-Dec-17 200 17 43 174 (7) 3 184 184 15,990 4,627 90 7,170 63.6%
21 Bank of Tokyo-Mitsubishi UFJ, Ltd. (The) 31-Mar-17 725 1,119 1,107 737 40 (1) 696 574 410,089 215,225 2,181 156,134 39.2%
22 Bank Sinopac 31-Dec-17 297 121 158 260 33 12 215 215 24,137 7,718 111 18,077 42.0%
23 Barclays Bank Plc 31-Dec-17 128 1,593 1,674 47 - - 47 38 5,930 241 - 1,221 217.5%
24 BNP Paribas 31-Dec-17 1,747 4,167 4,583 1,331 46 - 1,285 1,397 370,380 150,076 394 173,472 41.2%
25 CA Indosuez (Switzerland) SA 31-Dec-17 17 246 256 7 - - 7 (2) 6,382 1,449 - 4,096 69.3%
26 Canadian Imperial Bank of Commerce 31-Oct-17 57 349 223 183 - - 183 149 25,732 4,104 - 8,127 109.2%
27 Canara Bank 31-Mar-17 113 22 16 119 79 - 40 30 16,469 12,362 316 6,862 242.0%
28 Cathay Bank 31-Dec-17 53 11 43 21 2 - 19 18 3,269 1,843 18 2,367 48.2%
29 Cathay United Bank Company, Limited 31-Dec-17 245 102 183 164 30 - 134 134 19,143 8,654 100 9,433 54.7%
30 Chang Hwa Commercial Bank, Ltd. 31-Dec-17 203 58 33 228 13 - 215 180 14,975 5,997 81 8,675 41.1%
31 China Construction Bank Corporation 31-Dec-17 2,169 668 551 2,286 389 - 1,897 1,579 546,990 170,956 1,616 186,620 243.0%
32 China Development Bank 31-Dec-17 3,689 1,313 237 4,765 3,130 - 1,635 1,549 364,758 267,349 15,611 24,519 97.7%
33 China Everbright Bank Co., Ltd. 31-Dec-17 376 672 232 816 50 - 766 641 123,757 58,038 220 49,811 57.0%
34 China Merchants Bank Co., Ltd. 31-Dec-17 1,949 964 350 2,563 409 - 2,154 1,696 174,930 59,866 1,286 110,882 42.9%
35 China Minsheng Banking Corp., Ltd. 31-Dec-17 1,385 875 409 1,851 576 - 1,275 1,056 189,340 81,859 1,001 85,665 67.6%
36 CIMB Bank Berhad 31-Dec-17 46 51 75 22 - - 22 22 6,552 2,825 - 2,211 60.3%
37 Citibank, N.A. 31-Dec-17 3,892 2,282 3,040 3,134 (63) - 3,197 2,697 391,584 138,937 211 269,348 31.9%
38 Commerzbank AG 31-Dec-17 80 492 398 174 2 - 172 172 16,138 3,569 36 3,907 54.1%
Source: Extracted from individual banks’ financial and public statements.
Foreign bank branches – Financial highlights
© 2018 KPMG, a Hong Kong partnership and a member firm of the KPMG network of independent member firms affiliated with KPMG International Cooperative (“KPMG International”), a Swiss entity. All rights reserved. © 2018 KPMG, a Hong Kong partnership and a member firm of the KPMG network of independent member firms affiliated with KPMG International Cooperative (“KPMG International”), a Swiss entity. All rights reserved.

Financial highlights
Income statement Size and strength measuresHK$ millions Year ended Net interest
incomeNon-interest
incomeOperating expenses
Operating profit before
impairment charges
Loan impairment
charges/(recovery)
Other items Profit before tax Net profit after tax Total assets Gross advances to customers
Impairment allowances against customer
advances
Total deposits from customers
Liquidity ratio
1 ABN AMRO Bank N.V. 31-Dec-17 354 229 324 259 159 1,080 1,180 1,161 56,161 16,178 239 2,311 53.4%
2 Agricultural Bank of China Limited 31-Dec-17 3,453 1,125 399 4,179 243 56 3,880 3,239 528,781 240,428 618 110,547 50.4%
3 Allahabad Bank 31-Mar-17 123 24 17 130 126 - 4 20 15,344 9,560 175 1,406 143.5%
4 Australia And New Zealand Banking Group Limited 30-Sep-17 891 839 1,799 (69) 52 - (121) (112) 150,257 52,634 280 51,075 37.1%
5 Axis Bank Limited 31-Mar-17 154 202 32 324 670 - (346) (346) 14,584 12,257 814 1,292 93.9%
6 Banco Bilbao Vizcaya Argentaria S.A. 31-Dec-17 178 254 182 250 102 - 148 148 25,171 17,712 3 2,554 46.4%
7 Banco Santander, S.A. 31-Dec-17 98 310 503 (95) - - (95) (117) 56,978 17,266 10 442 42.0%
8 Bangkok Bank Public Company Limited 31-Dec-17 319 48 141 226 185 - 41 38 75,542 16,591 1,542 12,096 40.7%
9 Bank J. Safra Sarasin AG 31-Dec-17 114 259 302 71 - - 71 61 18,463 11,595 - 9,568 44.8%
10 Bank Julius Baer & Co. Ltd. 31-Dec-17 470 1,299 1,608 161 - - 161 201 86,021 38,229 - 44,757 40.7%
11 Bank of America, National Association 31-Dec-17 1,129 1,202 1,802 529 247 - 282 238 140,113 55,889 1,265 45,700 56.4%
12 Bank of Baroda 31-Mar-17 84 51 28 107 266 - (159) (167) 14,544 7,021 467 1,338 40.5%
13 Bank of China Limited 31-Dec-17 2,852 (1,223) 123 1,506 - - 1,506 1,258 349,053 - - - 14569.8%
14 Bank of Communications Co., Ltd. 31-Dec-17 4,965 2,695 2,371 5,289 132 18 5,237 4,399 595,108 257,755 1,393 440,088 148.0%
15 Bank of India 31-Mar-17 293 32 47 278 326 5 (53) (80) 22,115 9,547 762 4,052 194.9%
16 Bank of Montreal 31-Oct-17 63 190 392 (139) 12 - (151) (152) 21,846 7,607 22 5,156 70.5%
17 Bank of New York Mellon (The) 31-Dec-17 118 785 565 338 - - 338 270 50,248 1,867 - 3,688 164.6%
18 Bank of Nova Scotia (The) 31-Oct-17 162 372 273 261 - - 261 212 39,183 12,134 - 11,175 57.8%
19 Bank of Singapore Limited 31-Dec-17 81 510 558 33 - - 33 23 23,023 8,464 - 12,687 43.8%
20 Bank of Taiwan 31-Dec-17 200 17 43 174 (7) 3 184 184 15,990 4,627 90 7,170 63.6%
21 Bank of Tokyo-Mitsubishi UFJ, Ltd. (The) 31-Mar-17 725 1,119 1,107 737 40 (1) 696 574 410,089 215,225 2,181 156,134 39.2%
22 Bank Sinopac 31-Dec-17 297 121 158 260 33 12 215 215 24,137 7,718 111 18,077 42.0%
23 Barclays Bank Plc 31-Dec-17 128 1,593 1,674 47 - - 47 38 5,930 241 - 1,221 217.5%
24 BNP Paribas 31-Dec-17 1,747 4,167 4,583 1,331 46 - 1,285 1,397 370,380 150,076 394 173,472 41.2%
25 CA Indosuez (Switzerland) SA 31-Dec-17 17 246 256 7 - - 7 (2) 6,382 1,449 - 4,096 69.3%
26 Canadian Imperial Bank of Commerce 31-Oct-17 57 349 223 183 - - 183 149 25,732 4,104 - 8,127 109.2%
27 Canara Bank 31-Mar-17 113 22 16 119 79 - 40 30 16,469 12,362 316 6,862 242.0%
28 Cathay Bank 31-Dec-17 53 11 43 21 2 - 19 18 3,269 1,843 18 2,367 48.2%
29 Cathay United Bank Company, Limited 31-Dec-17 245 102 183 164 30 - 134 134 19,143 8,654 100 9,433 54.7%
30 Chang Hwa Commercial Bank, Ltd. 31-Dec-17 203 58 33 228 13 - 215 180 14,975 5,997 81 8,675 41.1%
31 China Construction Bank Corporation 31-Dec-17 2,169 668 551 2,286 389 - 1,897 1,579 546,990 170,956 1,616 186,620 243.0%
32 China Development Bank 31-Dec-17 3,689 1,313 237 4,765 3,130 - 1,635 1,549 364,758 267,349 15,611 24,519 97.7%
33 China Everbright Bank Co., Ltd. 31-Dec-17 376 672 232 816 50 - 766 641 123,757 58,038 220 49,811 57.0%
34 China Merchants Bank Co., Ltd. 31-Dec-17 1,949 964 350 2,563 409 - 2,154 1,696 174,930 59,866 1,286 110,882 42.9%
35 China Minsheng Banking Corp., Ltd. 31-Dec-17 1,385 875 409 1,851 576 - 1,275 1,056 189,340 81,859 1,001 85,665 67.6%
36 CIMB Bank Berhad 31-Dec-17 46 51 75 22 - - 22 22 6,552 2,825 - 2,211 60.3%
37 Citibank, N.A. 31-Dec-17 3,892 2,282 3,040 3,134 (63) - 3,197 2,697 391,584 138,937 211 269,348 31.9%
38 Commerzbank AG 31-Dec-17 80 492 398 174 2 - 172 172 16,138 3,569 36 3,907 54.1%
Hong Kong Banking Report 2018 | 67
© 2018 KPMG, a Hong Kong partnership and a member firm of the KPMG network of independent member firms affiliated with KPMG International Cooperative (“KPMG International”), a Swiss entity. All rights reserved. © 2018 KPMG, a Hong Kong partnership and a member firm of the KPMG network of independent member firms affiliated with KPMG International Cooperative (“KPMG International”), a Swiss entity. All rights reserved. © 2018 KPMG, a Hong Kong partnership and a member firm of the KPMG network of independent member firms affiliated with KPMG International Cooperative (“KPMG International”), a Swiss entity. All rights reserved.

Financial highlights
Income statement Size and strength measuresHK$ millions Year ended Net interest
incomeNon-interest
incomeOperating expenses
Operating profit before
impairment charges
Loan impairment
charges/(recovery)
Other items Profit before tax Net profit after tax Total assets Gross advances to customers
Impairment allowances against customer
advances
Total deposits from customers
Liquidity ratio
39 Commonwealth Bank of Australia 30-Jun-17 271 65 204 132 139 - (7) (6) 41,151 27,042 - 5,019 119.2%
40 Coöperatieve Rabobank U.A. 31-Dec-17 756 431 617 570 257 - 313 280 92,911 44,183 1,179 5,014 46.9%
41 Coutts & Co AG 31-Dec-17 1 1 52 (50) - - (50) (50) 85 - - 51 79.8%
42 Credit Agricole Corporate And Investment Bank 31-Dec-17 573 1,066 1,129 510 1 - 509 428 144,217 32,116 279 32,228 66.1%
43 Credit Industriel et Commercial 31-Dec-17 33 17 38 12 - - 12 9 10,619 7,643 - 446 45.4%
44 Credit Suisse AG 31-Dec-17 1,221 1,659 2,009 871 33 - 838 710 171,782 88,586 352 128,322 41.5%
45 CTBC Bank Co., Ltd. 31-Dec-17 931 434 566 799 100 9 690 565 70,804 25,169 397 63,592 46.8%
46 DBS Bank Ltd. 31-Dec-17 2,282 919 630 2,571 444 - 2,127 1,780 302,800 187,694 1,650 53,366 38.0%
47 Deutsche Bank Aktiengesellschaft 31-Dec-17 1,284 6,075 6,601 758 4 - 754 747 96,885 36,507 55 30,054 90.3%
48 DZ Bank AG Deutsche Zentral-Genossenschaftsbank, Frankfurt Am Main 31-Dec-17 131 89 90 130 (20) - 150 150 19,112 5,973 68 390 91.4%
49 E.Sun Commercial Bank, Ltd. 31-Dec-17 406 182 172 416 36 - 380 300 26,119 12,511 222 24,386 41.3%
50 East West Bank 31-Dec-17 162 51 113 100 20 - 80 66 8,643 5,589 70 6,749 39.1%
51 EFG Bank AG 31-Dec-17 179 634 665 148 - - 148 123 37,966 19,815 - 34,917 63.9%
52 Erste Group Bank AG 31-Dec-17 135 75 62 148 (19) - 167 143 14,604 173 3 - 63.8%
53 Far Eastern International Bank 31-Dec-17 62 15 34 43 (5) - 48 48 5,080 2,270 29 3,864 49.7%
54 First Abu Dhabi Bank PJSC 31-Dec-17 28 142 119 51 - - 51 46 36,177 7,988 - 6,325 57.3%
55 First Commercial Bank, Ltd. 31-Dec-17 273 55 46 282 30 - 252 208 17,560 7,426 83 13,647 44.3%
56 HDFC Bank Limited 31-Mar-17 46 (6) 11 29 (19) - 48 35 5,988 2,573 45 779 94%
57 HSBC Private Bank (Suisse) SA 31-Dec-17 - - 1 (1) - - (1) (1) 16 - - - 25004334%
58 Hua Nan Commercial Bank, Ltd. 31-Dec-17 283 29 46 266 3 - 263 223 23,376 5,180 54 21,099 45.8%
59 ICBC Standard Bank Plc 31-Dec-17 1 75 73 3 - - 3 3 93 - 6 43 127.0%
60 ICICI Bank Limited 31-Mar-17 407 223 99 531 141 - 390 327 36,768 11,232 325 3,544 44.2%
61 Indian Overseas Bank 31-Mar-17 146 84 38 192 111 - 81 64 13,563 9,400 801 3,690 160.3%
62 Industrial And Commercial Bank of China Limited 31-Dec-17 925 492 85 1,332 542 - 790 661 234,947 80,290 710 - 44.1%
63 Industrial Bank Co., Ltd. 31-Dec-17 1,758 1,668 332 3,094 547 - 2,547 2,108 195,414 71,324 736 110,659 56.7%
64 Industrial Bank of Korea 31-Dec-17 79 99 30 148 (2) - 150 139 10,764 1,197 16 2,043 116.8%
65 ING Bank N.V. 31-Dec-17 517 316 339 494 5 - 489 428 89,238 38,180 17 6,038 42.6%
66 Intesa Sanpaolo Spa 31-Dec-17 302 282 135 449 235 5 219 191 45,780 13,730 637 1,710 40.7%
67 JPMorgan Chase Bank, National Association 31-Dec-17 465 7,291 7,087 669 256 13 426 344 124,558 12,691 - 35,602 65.7%
68 KBC Bank N.V. 31-Dec-17 82 32 70 44 10 - 34 31 8,406 2,634 33 1,558 57.7%
69 KEB Hana Bank 31-Dec-17 262 162 48 376 69 (1) 308 274 31,681 22,591 174 4,333 38.6%
70 Kookmin Bank 31-Dec-17 62 36 36 62 17 - 45 38 9,568 6,428 45 1,708 84.8%
71 LGT Bank AG 31-Dec-17 196 1,108 1,391 (87) 13 - (100) (86) 53,555 21,862 19 34,222 57%
72 Macquarie Bank Limited 31-Mar-17 (20) 794 999 (225) - - (225) (225) 29,018 - - - 306.7%
Source: Extracted from individual banks’ financial and public statements.
68 | Hong Kong Banking Report 2018
© 2018 KPMG, a Hong Kong partnership and a member firm of the KPMG network of independent member firms affiliated with KPMG International Cooperative (“KPMG International”), a Swiss entity. All rights reserved.

Financial highlights
Income statement Size and strength measuresHK$ millions Year ended Net interest
incomeNon-interest
incomeOperating expenses
Operating profit before
impairment charges
Loan impairment
charges/(recovery)
Other items Profit before tax Net profit after tax Total assets Gross advances to customers
Impairment allowances against customer
advances
Total deposits from customers
Liquidity ratio
39 Commonwealth Bank of Australia 30-Jun-17 271 65 204 132 139 - (7) (6) 41,151 27,042 - 5,019 119.2%
40 Coöperatieve Rabobank U.A. 31-Dec-17 756 431 617 570 257 - 313 280 92,911 44,183 1,179 5,014 46.9%
41 Coutts & Co AG 31-Dec-17 1 1 52 (50) - - (50) (50) 85 - - 51 79.8%
42 Credit Agricole Corporate And Investment Bank 31-Dec-17 573 1,066 1,129 510 1 - 509 428 144,217 32,116 279 32,228 66.1%
43 Credit Industriel et Commercial 31-Dec-17 33 17 38 12 - - 12 9 10,619 7,643 - 446 45.4%
44 Credit Suisse AG 31-Dec-17 1,221 1,659 2,009 871 33 - 838 710 171,782 88,586 352 128,322 41.5%
45 CTBC Bank Co., Ltd. 31-Dec-17 931 434 566 799 100 9 690 565 70,804 25,169 397 63,592 46.8%
46 DBS Bank Ltd. 31-Dec-17 2,282 919 630 2,571 444 - 2,127 1,780 302,800 187,694 1,650 53,366 38.0%
47 Deutsche Bank Aktiengesellschaft 31-Dec-17 1,284 6,075 6,601 758 4 - 754 747 96,885 36,507 55 30,054 90.3%
48 DZ Bank AG Deutsche Zentral-Genossenschaftsbank, Frankfurt Am Main 31-Dec-17 131 89 90 130 (20) - 150 150 19,112 5,973 68 390 91.4%
49 E.Sun Commercial Bank, Ltd. 31-Dec-17 406 182 172 416 36 - 380 300 26,119 12,511 222 24,386 41.3%
50 East West Bank 31-Dec-17 162 51 113 100 20 - 80 66 8,643 5,589 70 6,749 39.1%
51 EFG Bank AG 31-Dec-17 179 634 665 148 - - 148 123 37,966 19,815 - 34,917 63.9%
52 Erste Group Bank AG 31-Dec-17 135 75 62 148 (19) - 167 143 14,604 173 3 - 63.8%
53 Far Eastern International Bank 31-Dec-17 62 15 34 43 (5) - 48 48 5,080 2,270 29 3,864 49.7%
54 First Abu Dhabi Bank PJSC 31-Dec-17 28 142 119 51 - - 51 46 36,177 7,988 - 6,325 57.3%
55 First Commercial Bank, Ltd. 31-Dec-17 273 55 46 282 30 - 252 208 17,560 7,426 83 13,647 44.3%
56 HDFC Bank Limited 31-Mar-17 46 (6) 11 29 (19) - 48 35 5,988 2,573 45 779 94%
57 HSBC Private Bank (Suisse) SA 31-Dec-17 - - 1 (1) - - (1) (1) 16 - - - 25004334%
58 Hua Nan Commercial Bank, Ltd. 31-Dec-17 283 29 46 266 3 - 263 223 23,376 5,180 54 21,099 45.8%
59 ICBC Standard Bank Plc 31-Dec-17 1 75 73 3 - - 3 3 93 - 6 43 127.0%
60 ICICI Bank Limited 31-Mar-17 407 223 99 531 141 - 390 327 36,768 11,232 325 3,544 44.2%
61 Indian Overseas Bank 31-Mar-17 146 84 38 192 111 - 81 64 13,563 9,400 801 3,690 160.3%
62 Industrial And Commercial Bank of China Limited 31-Dec-17 925 492 85 1,332 542 - 790 661 234,947 80,290 710 - 44.1%
63 Industrial Bank Co., Ltd. 31-Dec-17 1,758 1,668 332 3,094 547 - 2,547 2,108 195,414 71,324 736 110,659 56.7%
64 Industrial Bank of Korea 31-Dec-17 79 99 30 148 (2) - 150 139 10,764 1,197 16 2,043 116.8%
65 ING Bank N.V. 31-Dec-17 517 316 339 494 5 - 489 428 89,238 38,180 17 6,038 42.6%
66 Intesa Sanpaolo Spa 31-Dec-17 302 282 135 449 235 5 219 191 45,780 13,730 637 1,710 40.7%
67 JPMorgan Chase Bank, National Association 31-Dec-17 465 7,291 7,087 669 256 13 426 344 124,558 12,691 - 35,602 65.7%
68 KBC Bank N.V. 31-Dec-17 82 32 70 44 10 - 34 31 8,406 2,634 33 1,558 57.7%
69 KEB Hana Bank 31-Dec-17 262 162 48 376 69 (1) 308 274 31,681 22,591 174 4,333 38.6%
70 Kookmin Bank 31-Dec-17 62 36 36 62 17 - 45 38 9,568 6,428 45 1,708 84.8%
71 LGT Bank AG 31-Dec-17 196 1,108 1,391 (87) 13 - (100) (86) 53,555 21,862 19 34,222 57%
72 Macquarie Bank Limited 31-Mar-17 (20) 794 999 (225) - - (225) (225) 29,018 - - - 306.7%
Hong Kong Banking Report 2018 | 69
© 2018 KPMG, a Hong Kong partnership and a member firm of the KPMG network of independent member firms affiliated with KPMG International Cooperative (“KPMG International”), a Swiss entity. All rights reserved. © 2018 KPMG, a Hong Kong partnership and a member firm of the KPMG network of independent member firms affiliated with KPMG International Cooperative (“KPMG International”), a Swiss entity. All rights reserved.

Financial highlights
Income statement Size and strength measuresHK$ millions Year ended Net interest
incomeNon-interest
incomeOperating expenses
Operating profit before
impairment charges
Loan impairment
charges/(recovery)
Other items Profit before tax Net profit after tax Total assets Gross advances to customers
Impairment allowances against customer
advances
Total deposits from customers
Liquidity ratio
73 Malayan Banking Berhad 31-Dec-17 387 134 181 340 1,359 - (1,019) (1,017) 49,605 15,939 1,839 18,384 57.7%
74 Mega International Commercial Bank Co., Ltd. 31-Dec-17 381 69 88 362 12 - 350 296 37,772 5,531 64 36,531 58.5%
75 Mitsubishi UFJ Trust And Banking Corporation 31-Mar-17 176 (8) 54 114 - - 114 114 28,531 4,218 - 304 67.6%
76 Mizuho Bank, Ltd. 31-Mar-17 839 1,007 755 1,091 3 - 1,088 970 437,781 161,218 153 185,464 65.2%
77 National Australia Bank Limited 30-Sep-17 439 497 424 512 (85) - 597 494 63,521 14,903 40 33,509 98.2%
78 NATIXIS 31-Dec-17 371 1,821 1,178 1,014 (2) - 1,016 867 73,713 28,166 - 5,347 35.2%
79 O-Bank Co., Ltd 31-Dec-17 173 60 102 131 - - 131 105 12,314 7,372 100 7,238 49.1%
80 Oversea-Chinese Banking Corporation Limited 31-Dec-17 926 278 236 968 240 11 739 631 118,024 59,109 686 32,951 61.5%
81 Pictet & Cie (Europe) S.A. 31-Dec-17 54 254 327 (19) - - (19) (19) 8,339 3,328 - 3,737 44.3%
82 Punjab National Bank 31-Mar-17 275 8 24 259 592 - (333) (383) 49,459 26,670 1,040 1,850 51.1%
83 Royal Bank of Canada 31-Oct-17 (46) 603 585 (28) - - (28) (28) 21,868 729 - 4,659 2113.0%
84 Royal Bank of Scotland Public Limited Company (The) 31-Dec-17 (6) 588 139 443 - - 443 443 166 - - - 286.7%
85 Shanghai Commercial & Savings Bank, Ltd. (The) 31-Dec-17 99 28 36 91 34 - 57 43 6,700 2,944 57 5,439 41.4%
86 Shanghai Pudong Development Bank Co., Ltd. 31-Dec-17 954 567 283 1,238 130 - 1,108 931 164,104 80,297 421 74,642 63.6%
87 Shinhan Bank 31-Dec-17 112 59 20 151 (7) - 158 140 17,845 12,664 23 1,522 239.8%
88 Societe Generale 31-Dec-17 94 2,328 1,881 541 78 1 464 393 186,477 50,356 175 17,341 59.7%
89 State Bank of India 31-Mar-17 412 186 153 445 28 - 417 324 108,601 29,190 321 10,471 120.1%
90 State Street Bank And Trust Company 31-Dec-17 161 1,032 1,068 125 - - 125 105 134,756 6 - 16,340 65.8%
91 Sumitomo Mitsui Banking Corporation 31-Mar-17 1,305 785 585 1,505 - - 1,505 1,315 315,612 125,669 85 94,900 34.0%
92 Sumitomo Mitsui Trust Bank, Limited 31-Mar-17 13 260 66 207 - - 207 183 83,539 20,302 - 21,199 78.5%
93 Taipei Fubon Commercial Bank Co., Ltd. 31-Dec-17 474 230 163 541 181 4 356 279 51,191 22,795 307 34,394 42.8%
94 Taishin International Bank Co., Ltd 31-Dec-17 136 69 93 112 24 (4) 92 106 12,393 6,235 64 10,453 46.8%
95 Taiwan Business Bank 31-Dec-17 96 13 32 77 4 - 73 62 5,771 2,614 36 4,031 43.93%
96 Taiwan Cooperative Bank, Ltd. 31-Dec-17 155 21 29 147 18 - 129 105 9,970 5,757 60 6,088 35.0%
97 Taiwan Shin Kong Commercial Bank Co., Ltd. 31-Dec-17 66 12 33 45 9 2 34 26 4,656 2,205 27 3,685 48.6%
98 UBS AG 31-Dec-17 2,067 13,110 11,305 3,872 13 - 3,859 3,199 245,093 154,346 35 140,564 53.0%
99 UCO Bank 31-Mar-17 216 74 70 220 110 - 110 98 22,835 18,720 362 7,271 43.7%
100 Unicredit Bank AG 31-Dec-17 166 95 315 (54) - (23) (31) (31) 50,773 4,228 - 1,189 383.0%
101 Union Bancaire Privée, UBP SA 31-Dec-17 165 261 393 33 - - 33 33 15,194 7,955 - 10,356 48.1%
102 Union Bank of India 31-Mar-17 154 66 33 187 602 - (415) (445) 31,218 24,959 1,122 2,393 43.5%
103 United Overseas Bank Ltd. 31-Dec-17 1,130 1,200 655 1,675 (13) 49 1,737 1,460 159,894 104,553 203 56,268 39.8%
104 Wells Fargo Bank, National Association 31-Dec-17 91 1,164 1,110 145 - - 145 134 34,895 10,025 - 960 285.6%
105 Westpac Banking Corporation 30-Sep-17 (18) 159 149 (8) 13 (1) (20) (16) 27,669 14,336 54 14,484 78.8%
106 Woori Bank 31-Dec-17 83 39 28 94 60 - 34 28 16,710 10,822 102 2,362 54.7%
TOTAL 2017 59,611 75,989 71,637 63,963 13,600 1,238 51,545 43,669 9,625,317 3,836,587 44,771 3,390,253 -
Source: Extracted from individual companies’ financial and public statements
70 | Hong Kong Banking Report 2018
© 2018 KPMG, a Hong Kong partnership and a member firm of the KPMG network of independent member firms affiliated with KPMG International Cooperative (“KPMG International”), a Swiss entity. All rights reserved.

Financial highlights
Income statement Size and strength measuresHK$ millions Year ended Net interest
incomeNon-interest
incomeOperating expenses
Operating profit before
impairment charges
Loan impairment
charges/(recovery)
Other items Profit before tax Net profit after tax Total assets Gross advances to customers
Impairment allowances against customer
advances
Total deposits from customers
Liquidity ratio
73 Malayan Banking Berhad 31-Dec-17 387 134 181 340 1,359 - (1,019) (1,017) 49,605 15,939 1,839 18,384 57.7%
74 Mega International Commercial Bank Co., Ltd. 31-Dec-17 381 69 88 362 12 - 350 296 37,772 5,531 64 36,531 58.5%
75 Mitsubishi UFJ Trust And Banking Corporation 31-Mar-17 176 (8) 54 114 - - 114 114 28,531 4,218 - 304 67.6%
76 Mizuho Bank, Ltd. 31-Mar-17 839 1,007 755 1,091 3 - 1,088 970 437,781 161,218 153 185,464 65.2%
77 National Australia Bank Limited 30-Sep-17 439 497 424 512 (85) - 597 494 63,521 14,903 40 33,509 98.2%
78 NATIXIS 31-Dec-17 371 1,821 1,178 1,014 (2) - 1,016 867 73,713 28,166 - 5,347 35.2%
79 O-Bank Co., Ltd 31-Dec-17 173 60 102 131 - - 131 105 12,314 7,372 100 7,238 49.1%
80 Oversea-Chinese Banking Corporation Limited 31-Dec-17 926 278 236 968 240 11 739 631 118,024 59,109 686 32,951 61.5%
81 Pictet & Cie (Europe) S.A. 31-Dec-17 54 254 327 (19) - - (19) (19) 8,339 3,328 - 3,737 44.3%
82 Punjab National Bank 31-Mar-17 275 8 24 259 592 - (333) (383) 49,459 26,670 1,040 1,850 51.1%
83 Royal Bank of Canada 31-Oct-17 (46) 603 585 (28) - - (28) (28) 21,868 729 - 4,659 2113.0%
84 Royal Bank of Scotland Public Limited Company (The) 31-Dec-17 (6) 588 139 443 - - 443 443 166 - - - 286.7%
85 Shanghai Commercial & Savings Bank, Ltd. (The) 31-Dec-17 99 28 36 91 34 - 57 43 6,700 2,944 57 5,439 41.4%
86 Shanghai Pudong Development Bank Co., Ltd. 31-Dec-17 954 567 283 1,238 130 - 1,108 931 164,104 80,297 421 74,642 63.6%
87 Shinhan Bank 31-Dec-17 112 59 20 151 (7) - 158 140 17,845 12,664 23 1,522 239.8%
88 Societe Generale 31-Dec-17 94 2,328 1,881 541 78 1 464 393 186,477 50,356 175 17,341 59.7%
89 State Bank of India 31-Mar-17 412 186 153 445 28 - 417 324 108,601 29,190 321 10,471 120.1%
90 State Street Bank And Trust Company 31-Dec-17 161 1,032 1,068 125 - - 125 105 134,756 6 - 16,340 65.8%
91 Sumitomo Mitsui Banking Corporation 31-Mar-17 1,305 785 585 1,505 - - 1,505 1,315 315,612 125,669 85 94,900 34.0%
92 Sumitomo Mitsui Trust Bank, Limited 31-Mar-17 13 260 66 207 - - 207 183 83,539 20,302 - 21,199 78.5%
93 Taipei Fubon Commercial Bank Co., Ltd. 31-Dec-17 474 230 163 541 181 4 356 279 51,191 22,795 307 34,394 42.8%
94 Taishin International Bank Co., Ltd 31-Dec-17 136 69 93 112 24 (4) 92 106 12,393 6,235 64 10,453 46.8%
95 Taiwan Business Bank 31-Dec-17 96 13 32 77 4 - 73 62 5,771 2,614 36 4,031 43.93%
96 Taiwan Cooperative Bank, Ltd. 31-Dec-17 155 21 29 147 18 - 129 105 9,970 5,757 60 6,088 35.0%
97 Taiwan Shin Kong Commercial Bank Co., Ltd. 31-Dec-17 66 12 33 45 9 2 34 26 4,656 2,205 27 3,685 48.6%
98 UBS AG 31-Dec-17 2,067 13,110 11,305 3,872 13 - 3,859 3,199 245,093 154,346 35 140,564 53.0%
99 UCO Bank 31-Mar-17 216 74 70 220 110 - 110 98 22,835 18,720 362 7,271 43.7%
100 Unicredit Bank AG 31-Dec-17 166 95 315 (54) - (23) (31) (31) 50,773 4,228 - 1,189 383.0%
101 Union Bancaire Privée, UBP SA 31-Dec-17 165 261 393 33 - - 33 33 15,194 7,955 - 10,356 48.1%
102 Union Bank of India 31-Mar-17 154 66 33 187 602 - (415) (445) 31,218 24,959 1,122 2,393 43.5%
103 United Overseas Bank Ltd. 31-Dec-17 1,130 1,200 655 1,675 (13) 49 1,737 1,460 159,894 104,553 203 56,268 39.8%
104 Wells Fargo Bank, National Association 31-Dec-17 91 1,164 1,110 145 - - 145 134 34,895 10,025 - 960 285.6%
105 Westpac Banking Corporation 30-Sep-17 (18) 159 149 (8) 13 (1) (20) (16) 27,669 14,336 54 14,484 78.8%
106 Woori Bank 31-Dec-17 83 39 28 94 60 - 34 28 16,710 10,822 102 2,362 54.7%
TOTAL 2017 59,611 75,989 71,637 63,963 13,600 1,238 51,545 43,669 9,625,317 3,836,587 44,771 3,390,253 -
Hong Kong Banking Report 2018 | 71
© 2018 KPMG, a Hong Kong partnership and a member firm of the KPMG network of independent member firms affiliated with KPMG International Cooperative (“KPMG International”), a Swiss entity. All rights reserved. © 2018 KPMG, a Hong Kong partnership and a member firm of the KPMG network of independent member firms affiliated with KPMG International Cooperative (“KPMG International”), a Swiss entity. All rights reserved.

Key ratios Loan asset quality
Performance measures Past due advances Impaired advancesHK$ millions Year ended Net customer
loan/deposit ratio
Net interest income/
average total assets
Non-interest income/total
operating income
Cost/ income ratio
ROA Loans overdue ≤ 3 months
Loans overdue > 3 months
Gross advances which are past due
Gross impaired advances
Gross impaired advances/ gross
advances to customers
Individually assessed impairment
allowances made against impaired
advances
Individually assessed allowances as a
percentage of gross impaired advances
Collaterals for individually
assessed impaired
advances
1 ABN AMRO Bank N.V. 31-Dec-17 689.7% 0.6% 39.3% 55.6% 1.9% 149 86 235 240 1.5% 202 84.2% -
2 Agricultural Bank of China Limited 31-Dec-17 216.9% 0.7% 24.6% 8.7% 0.6% N/A 117 117 117 0.0% 113 96.6% 2
3 Allahabad Bank 31-Mar-17 667.5% 0.8% 16.3% 11.6% 0.1% N/A 201 201 201 2.1% 113 56.2% 153
4 Australia And New Zealand Banking Group Limited 30-Sep-17 102.5% 0.6% 48.5% 104.0% -0.1% N/A 105 105 109 0.2% 98 89.9% -
5 Axis Bank Limited 31-Mar-17 885.7% 1.0% 56.7% 9.0% -2.2% N/A 1,292 1,292 1,292 10.5% - 0.0% -
6 Banco Bilbao Vizcaya Argentaria S.A. 31-Dec-17 693.4% 0.7% 58.8% 42.1% 0.6% N/A 24 24 292 1.6% 3 1.0% 224
7 Banco Santander, S.A. 31-Dec-17 3904.1% 0.2% 76.0% 123.3% -0.2% - - - - 0.0% - N/A -
8 Bangkok Bank Public Company Limited 31-Dec-17 124.4% 0.5% 13.1% 38.4% 0.1% 1 41 42 42 0.3% 42 100.0% -
9 Bank J. Safra Sarasin AG 31-Dec-17 121.2% 0.7% 69.4% 81.0% 0.4% - - - - 0.0% - N/A -
10 Bank Julius Baer & Co. Ltd. 31-Dec-17 85.4% 0.7% 73.4% 90.9% 0.3% - - - - 0.0% - N/A -
11 Bank of America, National Association 31-Dec-17 119.5% 1.0% 51.6% 77.3% 0.2% N/A 695 695 1,010 1.8% 635 62.9% -
12 Bank of Baroda 31-Mar-17 489.8% 0.6% 37.8% 20.7% -1.2% N/A 443 443 443 6.3% 358 80.8% 35
13 Bank of China Limited 31-Dec-17 N/A 0.9% -75.1% 7.6% 0.4% - - - N/A N/A - N/A -
14 Bank of Communications Co., Ltd. 31-Dec-17 58.3% 0.9% 35.2% 31.0% 0.8% N/A 545 545 492 0.2% 218 44.3% 404
15 Bank of India 31-Mar-17 216.8% 0.9% 9.8% 14.5% -0.2% N/A 1,339 1,339 1,618 16.9% 667 41.2% 1,109
16 Bank of Montreal 31-Oct-17 147.1% 0.3% 75.1% 154.9% -0.8% - - - - 0.0% - N/A -
17 Bank of New York Mellon (The) 31-Dec-17 50.6% 0.2% 86.9% 62.6% 0.5% - - - - 0.0% - N/A -
18 Bank of Nova Scotia (The) 31-Oct-17 108.6% 0.4% 69.7% 51.1% 0.5% - - - - 0.0% - N/A -
19 Bank of Singapore Limited 31-Dec-17 66.7% 0.4% 86.3% 94.4% 0.1% - - - - 0.0% - N/A -
20 Bank of Taiwan 31-Dec-17 63.3% 1.1% 7.8% 19.8% 1.0% - - - 25 0.5% 25 100.0% -
21 Bank of Tokyo-Mitsubishi UFJ, Ltd. (The) 31-Mar-17 136.4% 0.2% 60.7% 60.0% 0.1% - - - 15 0.0% 8 53.3% -
22 Bank Sinopac 31-Dec-17 42.1% 1.2% 28.9% 37.8% 0.9% N/A 1 1 1 0.0% 1 100.0% -
23 Barclays Bank Plc 31-Dec-17 19.7% 1.5% 92.6% 97.3% 0.4% - - - - 0.0% - N/A -
24 BNP Paribas 31-Dec-17 86.3% 0.5% 70.5% 77.5% 0.4% N/A 266 266 444 0.3% 255 57.4% 750
25 CA Indosuez (Switzerland) SA 31-Dec-17 35.4% 0.3% 93.5% 97.3% 0.0% - - - - 0.0% - N/A -
26 Canadian Imperial Bank of Commerce 31-Oct-17 50.5% 0.2% 86.0% 54.9% 0.5% - - - - 0.0% - N/A -
27 Canara Bank 31-Mar-17 175.5% 0.8% 16.3% 11.9% 0.2% N/A 404 404 - 0.0% - N/A -
28 Cathay Bank 31-Dec-17 78.6% 1.7% 17.2% 67.2% 0.6% N/A 9 9 10 0.5% - 0.0% 10
29 Cathay United Bank Company, Limited 31-Dec-17 90.7% 1.4% 29.4% 52.7% 0.8% - - - - 0.0% - N/A -
30 Chang Hwa Commercial Bank, Ltd. 31-Dec-17 68.2% 1.4% 22.2% 12.6% 1.3% N/A 1 1 1 0.0% 1 100.0% -
31 China Construction Bank Corporation 31-Dec-17 90.7% 0.4% 23.5% 19.4% 0.3% N/A 95 95 - 0.0% - N/A -
32 China Development Bank 31-Dec-17 1026.7% 1.0% 26.2% 4.7% 0.4% 1,395 6,238 7,633 6,472 2.4% 5,130 79.3% 111
33 China Everbright Bank Co., Ltd. 31-Dec-17 116.1% 0.4% 64.1% 22.1% 0.6% N/A 10 10 10 0.0% 10 100.0% -
34 China Merchants Bank Co., Ltd. 31-Dec-17 52.8% 1.2% 33.1% 12.0% 1.1% N/A 243 243 243 0.4% 243 100.0% -
35 China Minsheng Banking Corp., Ltd. 31-Dec-17 94.4% 0.8% 38.7% 18.1% 0.6% N/A 774 774 775 0.9% 492 63.5% 365
36 CIMB Bank Berhad 31-Dec-17 127.8% 0.7% 52.6% 77.3% 0.3% - - - - 0.0% - N/A -
37 Citibank, N.A. 31-Dec-17 51.5% 1.0% 37.0% 49.2% 0.7% - - - - 0.0% - N/A -
38 Commerzbank AG 31-Dec-17 90.4% 0.6% 86.0% 69.6% 1.4% - - - 78 2.2% 29 37.2% -
Source: Extracted from individual banks’ financial and public statements.
Foreign bank branches – Financial highlights(Continued)
© 2018 KPMG, a Hong Kong partnership and a member firm of the KPMG network of independent member firms affiliated with KPMG International Cooperative (“KPMG International”), a Swiss entity. All rights reserved. © 2018 KPMG, a Hong Kong partnership and a member firm of the KPMG network of independent member firms affiliated with KPMG International Cooperative (“KPMG International”), a Swiss entity. All rights reserved.

Key ratios Loan asset quality
Performance measures Past due advances Impaired advancesHK$ millions Year ended Net customer
loan/deposit ratio
Net interest income/
average total assets
Non-interest income/total
operating income
Cost/ income ratio
ROA Loans overdue ≤ 3 months
Loans overdue > 3 months
Gross advances which are past due
Gross impaired advances
Gross impaired advances/ gross
advances to customers
Individually assessed impairment
allowances made against impaired
advances
Individually assessed allowances as a
percentage of gross impaired advances
Collaterals for individually
assessed impaired
advances
1 ABN AMRO Bank N.V. 31-Dec-17 689.7% 0.6% 39.3% 55.6% 1.9% 149 86 235 240 1.5% 202 84.2% -
2 Agricultural Bank of China Limited 31-Dec-17 216.9% 0.7% 24.6% 8.7% 0.6% N/A 117 117 117 0.0% 113 96.6% 2
3 Allahabad Bank 31-Mar-17 667.5% 0.8% 16.3% 11.6% 0.1% N/A 201 201 201 2.1% 113 56.2% 153
4 Australia And New Zealand Banking Group Limited 30-Sep-17 102.5% 0.6% 48.5% 104.0% -0.1% N/A 105 105 109 0.2% 98 89.9% -
5 Axis Bank Limited 31-Mar-17 885.7% 1.0% 56.7% 9.0% -2.2% N/A 1,292 1,292 1,292 10.5% - 0.0% -
6 Banco Bilbao Vizcaya Argentaria S.A. 31-Dec-17 693.4% 0.7% 58.8% 42.1% 0.6% N/A 24 24 292 1.6% 3 1.0% 224
7 Banco Santander, S.A. 31-Dec-17 3904.1% 0.2% 76.0% 123.3% -0.2% - - - - 0.0% - N/A -
8 Bangkok Bank Public Company Limited 31-Dec-17 124.4% 0.5% 13.1% 38.4% 0.1% 1 41 42 42 0.3% 42 100.0% -
9 Bank J. Safra Sarasin AG 31-Dec-17 121.2% 0.7% 69.4% 81.0% 0.4% - - - - 0.0% - N/A -
10 Bank Julius Baer & Co. Ltd. 31-Dec-17 85.4% 0.7% 73.4% 90.9% 0.3% - - - - 0.0% - N/A -
11 Bank of America, National Association 31-Dec-17 119.5% 1.0% 51.6% 77.3% 0.2% N/A 695 695 1,010 1.8% 635 62.9% -
12 Bank of Baroda 31-Mar-17 489.8% 0.6% 37.8% 20.7% -1.2% N/A 443 443 443 6.3% 358 80.8% 35
13 Bank of China Limited 31-Dec-17 N/A 0.9% -75.1% 7.6% 0.4% - - - N/A N/A - N/A -
14 Bank of Communications Co., Ltd. 31-Dec-17 58.3% 0.9% 35.2% 31.0% 0.8% N/A 545 545 492 0.2% 218 44.3% 404
15 Bank of India 31-Mar-17 216.8% 0.9% 9.8% 14.5% -0.2% N/A 1,339 1,339 1,618 16.9% 667 41.2% 1,109
16 Bank of Montreal 31-Oct-17 147.1% 0.3% 75.1% 154.9% -0.8% - - - - 0.0% - N/A -
17 Bank of New York Mellon (The) 31-Dec-17 50.6% 0.2% 86.9% 62.6% 0.5% - - - - 0.0% - N/A -
18 Bank of Nova Scotia (The) 31-Oct-17 108.6% 0.4% 69.7% 51.1% 0.5% - - - - 0.0% - N/A -
19 Bank of Singapore Limited 31-Dec-17 66.7% 0.4% 86.3% 94.4% 0.1% - - - - 0.0% - N/A -
20 Bank of Taiwan 31-Dec-17 63.3% 1.1% 7.8% 19.8% 1.0% - - - 25 0.5% 25 100.0% -
21 Bank of Tokyo-Mitsubishi UFJ, Ltd. (The) 31-Mar-17 136.4% 0.2% 60.7% 60.0% 0.1% - - - 15 0.0% 8 53.3% -
22 Bank Sinopac 31-Dec-17 42.1% 1.2% 28.9% 37.8% 0.9% N/A 1 1 1 0.0% 1 100.0% -
23 Barclays Bank Plc 31-Dec-17 19.7% 1.5% 92.6% 97.3% 0.4% - - - - 0.0% - N/A -
24 BNP Paribas 31-Dec-17 86.3% 0.5% 70.5% 77.5% 0.4% N/A 266 266 444 0.3% 255 57.4% 750
25 CA Indosuez (Switzerland) SA 31-Dec-17 35.4% 0.3% 93.5% 97.3% 0.0% - - - - 0.0% - N/A -
26 Canadian Imperial Bank of Commerce 31-Oct-17 50.5% 0.2% 86.0% 54.9% 0.5% - - - - 0.0% - N/A -
27 Canara Bank 31-Mar-17 175.5% 0.8% 16.3% 11.9% 0.2% N/A 404 404 - 0.0% - N/A -
28 Cathay Bank 31-Dec-17 78.6% 1.7% 17.2% 67.2% 0.6% N/A 9 9 10 0.5% - 0.0% 10
29 Cathay United Bank Company, Limited 31-Dec-17 90.7% 1.4% 29.4% 52.7% 0.8% - - - - 0.0% - N/A -
30 Chang Hwa Commercial Bank, Ltd. 31-Dec-17 68.2% 1.4% 22.2% 12.6% 1.3% N/A 1 1 1 0.0% 1 100.0% -
31 China Construction Bank Corporation 31-Dec-17 90.7% 0.4% 23.5% 19.4% 0.3% N/A 95 95 - 0.0% - N/A -
32 China Development Bank 31-Dec-17 1026.7% 1.0% 26.2% 4.7% 0.4% 1,395 6,238 7,633 6,472 2.4% 5,130 79.3% 111
33 China Everbright Bank Co., Ltd. 31-Dec-17 116.1% 0.4% 64.1% 22.1% 0.6% N/A 10 10 10 0.0% 10 100.0% -
34 China Merchants Bank Co., Ltd. 31-Dec-17 52.8% 1.2% 33.1% 12.0% 1.1% N/A 243 243 243 0.4% 243 100.0% -
35 China Minsheng Banking Corp., Ltd. 31-Dec-17 94.4% 0.8% 38.7% 18.1% 0.6% N/A 774 774 775 0.9% 492 63.5% 365
36 CIMB Bank Berhad 31-Dec-17 127.8% 0.7% 52.6% 77.3% 0.3% - - - - 0.0% - N/A -
37 Citibank, N.A. 31-Dec-17 51.5% 1.0% 37.0% 49.2% 0.7% - - - - 0.0% - N/A -
38 Commerzbank AG 31-Dec-17 90.4% 0.6% 86.0% 69.6% 1.4% - - - 78 2.2% 29 37.2% -
Hong Kong Banking Report 2018 | 73
© 2018 KPMG, a Hong Kong partnership and a member firm of the KPMG network of independent member firms affiliated with KPMG International Cooperative (“KPMG International”), a Swiss entity. All rights reserved. © 2018 KPMG, a Hong Kong partnership and a member firm of the KPMG network of independent member firms affiliated with KPMG International Cooperative (“KPMG International”), a Swiss entity. All rights reserved. © 2018 KPMG, a Hong Kong partnership and a member firm of the KPMG network of independent member firms affiliated with KPMG International Cooperative (“KPMG International”), a Swiss entity. All rights reserved.

Key ratios Loan asset quality
Performance measures Past due advances Impaired advancesHK$ millions Year ended Net customer
loan/deposit ratio
Net interest income/
average total assets
Non-interest income/total
operating income
Cost/income ratio
ROA Loans overdue ≤ 3 months
Loans overdue > 3 months
Gross advances which are past due
Gross impaired advances
Gross impaired advances/ gross
advances to customers
Individually assessed impairment
allowances made against impaired
advances
Individually assessed allowances as a
percentage of gross impaired advances
Collaterals for individually
assessed impaired
advances
39 Commonwealth Bank of Australia 30-Jun-17 538.8% 0.7% 19.3% 60.7% 0.0% - - - - 0.0% - N/A -
40 Coöperatieve Rabobank U.A. 31-Dec-17 857.7% 0.8% 36.3% 52.0% 0.3% N/A 2,054 2,054 2,649 6.0% 1,139 43.0% 436
41 Coutts & Co AG 31-Dec-17 0.0% 0.2% 50.0% 2600.0% -11.9% - - - N/A N/A - N/A -
42 Credit Agricole Corporate And Investment Bank 31-Dec-17 98.8% 0.4% 65.0% 68.9% 0.3% N/A 435 435 435 1.4% 279 64.1% N/A
43 Credit Industriel et Commercial 31-Dec-17 1713.7% 0.3% 34.0% 76.0% 0.1% - - - - 0.0% N/A N/A -
44 Credit Suisse AG 31-Dec-17 68.8% 0.8% 57.6% 69.8% 0.5% N/A 437 437 437 0.5% 352 80.5% 85
45 CTBC Bank Co., Ltd. 31-Dec-17 39.0% 1.4% 31.8% 41.5% 0.9% 3 117 120 205 0.8% 147 71.7% 20
46 DBS Bank Ltd. 31-Dec-17 348.6% 0.8% 28.7% 19.7% 0.7% - - - - 0.0% - N/A N/A
47 Deutsche Bank Aktiengesellschaft 31-Dec-17 121.3% 1.2% 82.6% 89.7% 0.7% N/A 12 12 12 0.0% 8 66.7% -
48 DZ Bank AG Deutsche Zentral-Genossenschaftsbank, Frankfurt Am Main 31-Dec-17 1514.1% 0.8% 40.5% 40.9% 0.9% N/A 94 94 94 1.6% 68 72.3% -
49 E.Sun Commercial Bank, Ltd. 31-Dec-17 50.4% 1.7% 31.0% 29.3% 1.3% - - - - 0.0% - N/A -
50 East West Bank 31-Dec-17 81.8% 1.9% 23.9% 53.1% 0.8% N/A 56 56 118 2.1% 13 11.0% 62
51 EFG Bank AG 31-Dec-17 56.7% 0.5% 78.0% 81.8% 0.4% - - - - 0.0% - N/A -
52 Erste Group Bank AG 31-Dec-17 N/A 1.0% 35.7% 29.5% 1.1% - - - N/A N/A N/A N/A N/A
53 Far Eastern International Bank 31-Dec-17 58.0% 1.1% 19.5% 44.2% 0.9% - - - - 0.0% - N/A -
54 First Abu Dhabi Bank PJSC 31-Dec-17 126.3% 0.1% 83.5% 70.0% 0.1% - - - - 0.0% - N/A -
55 First Commercial Bank, Ltd. 31-Dec-17 53.8% 1.6% 16.8% 14.0% 1.2% - - - 5 0.1% 5 100.0% -
56 HDFC Bank Limited 31-Mar-17 324.5% 0.7% -15.0% 27.5% 0.5% - - - - 0.0% - N/A N/A
57 HSBC Private Bank (Suisse) SA 31-Dec-17 N/A 0.0% N/A N/A -6.3% - - - N/A N/A - N/A -
58 Hua Nan Commercial Bank, Ltd. 31-Dec-17 24.3% 1.2% 9.3% 14.7% 1.0% - - - N/A N/A - N/A -
59 ICBC Standard Bank Plc 31-Dec-17 -14.0% 0.2% 98.7% 96.1% 0.5% - - - N/A N/A - N/A -
60 ICICI Bank Limited 31-Mar-17 307.8% 1.0% 35.4% 15.7% 0.8% 831 305 1,136 305 2.7% 175 57.4% 185
61 Indian Overseas Bank 31-Mar-17 233.0% 1.0% 36.5% 16.5% 0.4% N/A 1,318 1,318 1,317 14.0% 732 55.6% -
62 Industrial And Commercial Bank of China Limited 31-Dec-17 N/A 0.4% 34.7% 6.0% 0.3% N/A 72 72 72 0.1% 72 100.0% -
63 Industrial Bank Co., Ltd. 31-Dec-17 65.1% 1.0% 48.7% 9.7% 1.3% - - - 736 1.0% - 0.0% -
64 Industrial Bank of Korea 31-Dec-17 57.8% 0.8% 55.6% 16.9% 1.3% - - - - 0.0% N/A N/A N/A
65 ING Bank N.V. 31-Dec-17 632.0% 0.7% 37.9% 40.7% 0.6% - - - - 0.0% - N/A -
66 Intesa Sanpaolo Spa 31-Dec-17 765.7% 0.6% 48.3% 23.1% 0.4% N/A 623 623 1,091 7.9% 475 43.5% -
67 JPMorgan Chase Bank, National Association 31-Dec-17 35.6% 0.3% 94.0% 91.4% 0.2% - - - - 0.0% - N/A -
68 KBC Bank N.V. 31-Dec-17 166.9% 1.0% 28.1% 61.4% 0.4% N/A 27 27 27 1.0% 25 92.6% -
69 KEB Hana Bank 31-Dec-17 517.4% 0.8% 38.2% 11.3% 0.9% - - - 195 0.9% 148 75.9% -
70 Kookmin Bank 31-Dec-17 373.7% 0.6% 36.7% 36.7% 0.4% - - - - 0.0% - N/A -
71 LGT Bank AG 31-Dec-17 63.8% 0.5% 85.0% 106.7% -0.2% - - - - 0.0% - N/A -
72 Macquarie Bank Limited 31-Mar-17 N/A -0.1% 102.6% 129.1% -0.9% - - - N/A N/A - N/A -
Source: Extracted from individual banks’ financial and public statements.
74 | Hong Kong Banking Report 2018
© 2018 KPMG, a Hong Kong partnership and a member firm of the KPMG network of independent member firms affiliated with KPMG International Cooperative (“KPMG International”), a Swiss entity. All rights reserved.
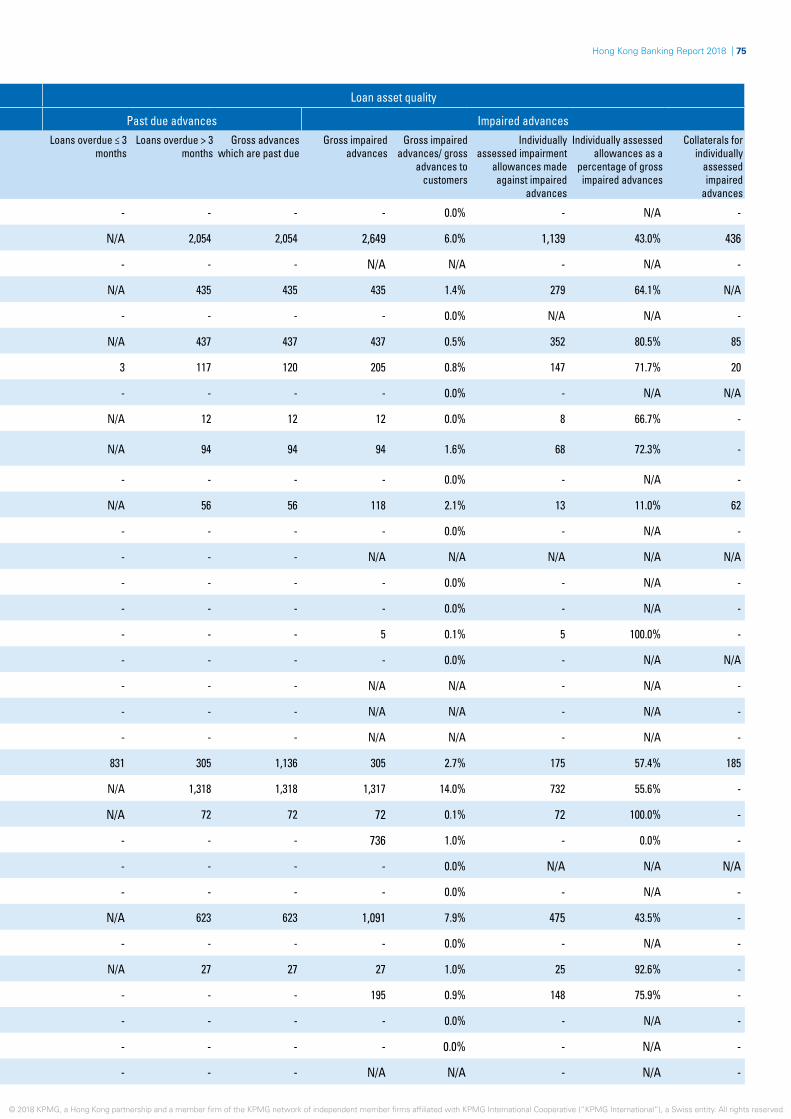
Key ratios Loan asset quality
Performance measures Past due advances Impaired advancesHK$ millions Year ended Net customer
loan/deposit ratio
Net interest income/
average total assets
Non-interest income/total
operating income
Cost/income ratio
ROA Loans overdue ≤ 3 months
Loans overdue > 3 months
Gross advances which are past due
Gross impaired advances
Gross impaired advances/ gross
advances to customers
Individually assessed impairment
allowances made against impaired
advances
Individually assessed allowances as a
percentage of gross impaired advances
Collaterals for individually
assessed impaired
advances
39 Commonwealth Bank of Australia 30-Jun-17 538.8% 0.7% 19.3% 60.7% 0.0% - - - - 0.0% - N/A -
40 Coöperatieve Rabobank U.A. 31-Dec-17 857.7% 0.8% 36.3% 52.0% 0.3% N/A 2,054 2,054 2,649 6.0% 1,139 43.0% 436
41 Coutts & Co AG 31-Dec-17 0.0% 0.2% 50.0% 2600.0% -11.9% - - - N/A N/A - N/A -
42 Credit Agricole Corporate And Investment Bank 31-Dec-17 98.8% 0.4% 65.0% 68.9% 0.3% N/A 435 435 435 1.4% 279 64.1% N/A
43 Credit Industriel et Commercial 31-Dec-17 1713.7% 0.3% 34.0% 76.0% 0.1% - - - - 0.0% N/A N/A -
44 Credit Suisse AG 31-Dec-17 68.8% 0.8% 57.6% 69.8% 0.5% N/A 437 437 437 0.5% 352 80.5% 85
45 CTBC Bank Co., Ltd. 31-Dec-17 39.0% 1.4% 31.8% 41.5% 0.9% 3 117 120 205 0.8% 147 71.7% 20
46 DBS Bank Ltd. 31-Dec-17 348.6% 0.8% 28.7% 19.7% 0.7% - - - - 0.0% - N/A N/A
47 Deutsche Bank Aktiengesellschaft 31-Dec-17 121.3% 1.2% 82.6% 89.7% 0.7% N/A 12 12 12 0.0% 8 66.7% -
48 DZ Bank AG Deutsche Zentral-Genossenschaftsbank, Frankfurt Am Main 31-Dec-17 1514.1% 0.8% 40.5% 40.9% 0.9% N/A 94 94 94 1.6% 68 72.3% -
49 E.Sun Commercial Bank, Ltd. 31-Dec-17 50.4% 1.7% 31.0% 29.3% 1.3% - - - - 0.0% - N/A -
50 East West Bank 31-Dec-17 81.8% 1.9% 23.9% 53.1% 0.8% N/A 56 56 118 2.1% 13 11.0% 62
51 EFG Bank AG 31-Dec-17 56.7% 0.5% 78.0% 81.8% 0.4% - - - - 0.0% - N/A -
52 Erste Group Bank AG 31-Dec-17 N/A 1.0% 35.7% 29.5% 1.1% - - - N/A N/A N/A N/A N/A
53 Far Eastern International Bank 31-Dec-17 58.0% 1.1% 19.5% 44.2% 0.9% - - - - 0.0% - N/A -
54 First Abu Dhabi Bank PJSC 31-Dec-17 126.3% 0.1% 83.5% 70.0% 0.1% - - - - 0.0% - N/A -
55 First Commercial Bank, Ltd. 31-Dec-17 53.8% 1.6% 16.8% 14.0% 1.2% - - - 5 0.1% 5 100.0% -
56 HDFC Bank Limited 31-Mar-17 324.5% 0.7% -15.0% 27.5% 0.5% - - - - 0.0% - N/A N/A
57 HSBC Private Bank (Suisse) SA 31-Dec-17 N/A 0.0% N/A N/A -6.3% - - - N/A N/A - N/A -
58 Hua Nan Commercial Bank, Ltd. 31-Dec-17 24.3% 1.2% 9.3% 14.7% 1.0% - - - N/A N/A - N/A -
59 ICBC Standard Bank Plc 31-Dec-17 -14.0% 0.2% 98.7% 96.1% 0.5% - - - N/A N/A - N/A -
60 ICICI Bank Limited 31-Mar-17 307.8% 1.0% 35.4% 15.7% 0.8% 831 305 1,136 305 2.7% 175 57.4% 185
61 Indian Overseas Bank 31-Mar-17 233.0% 1.0% 36.5% 16.5% 0.4% N/A 1,318 1,318 1,317 14.0% 732 55.6% -
62 Industrial And Commercial Bank of China Limited 31-Dec-17 N/A 0.4% 34.7% 6.0% 0.3% N/A 72 72 72 0.1% 72 100.0% -
63 Industrial Bank Co., Ltd. 31-Dec-17 65.1% 1.0% 48.7% 9.7% 1.3% - - - 736 1.0% - 0.0% -
64 Industrial Bank of Korea 31-Dec-17 57.8% 0.8% 55.6% 16.9% 1.3% - - - - 0.0% N/A N/A N/A
65 ING Bank N.V. 31-Dec-17 632.0% 0.7% 37.9% 40.7% 0.6% - - - - 0.0% - N/A -
66 Intesa Sanpaolo Spa 31-Dec-17 765.7% 0.6% 48.3% 23.1% 0.4% N/A 623 623 1,091 7.9% 475 43.5% -
67 JPMorgan Chase Bank, National Association 31-Dec-17 35.6% 0.3% 94.0% 91.4% 0.2% - - - - 0.0% - N/A -
68 KBC Bank N.V. 31-Dec-17 166.9% 1.0% 28.1% 61.4% 0.4% N/A 27 27 27 1.0% 25 92.6% -
69 KEB Hana Bank 31-Dec-17 517.4% 0.8% 38.2% 11.3% 0.9% - - - 195 0.9% 148 75.9% -
70 Kookmin Bank 31-Dec-17 373.7% 0.6% 36.7% 36.7% 0.4% - - - - 0.0% - N/A -
71 LGT Bank AG 31-Dec-17 63.8% 0.5% 85.0% 106.7% -0.2% - - - - 0.0% - N/A -
72 Macquarie Bank Limited 31-Mar-17 N/A -0.1% 102.6% 129.1% -0.9% - - - N/A N/A - N/A -
Hong Kong Banking Report 2018 | 75
© 2018 KPMG, a Hong Kong partnership and a member firm of the KPMG network of independent member firms affiliated with KPMG International Cooperative (“KPMG International”), a Swiss entity. All rights reserved. © 2018 KPMG, a Hong Kong partnership and a member firm of the KPMG network of independent member firms affiliated with KPMG International Cooperative (“KPMG International”), a Swiss entity. All rights reserved.
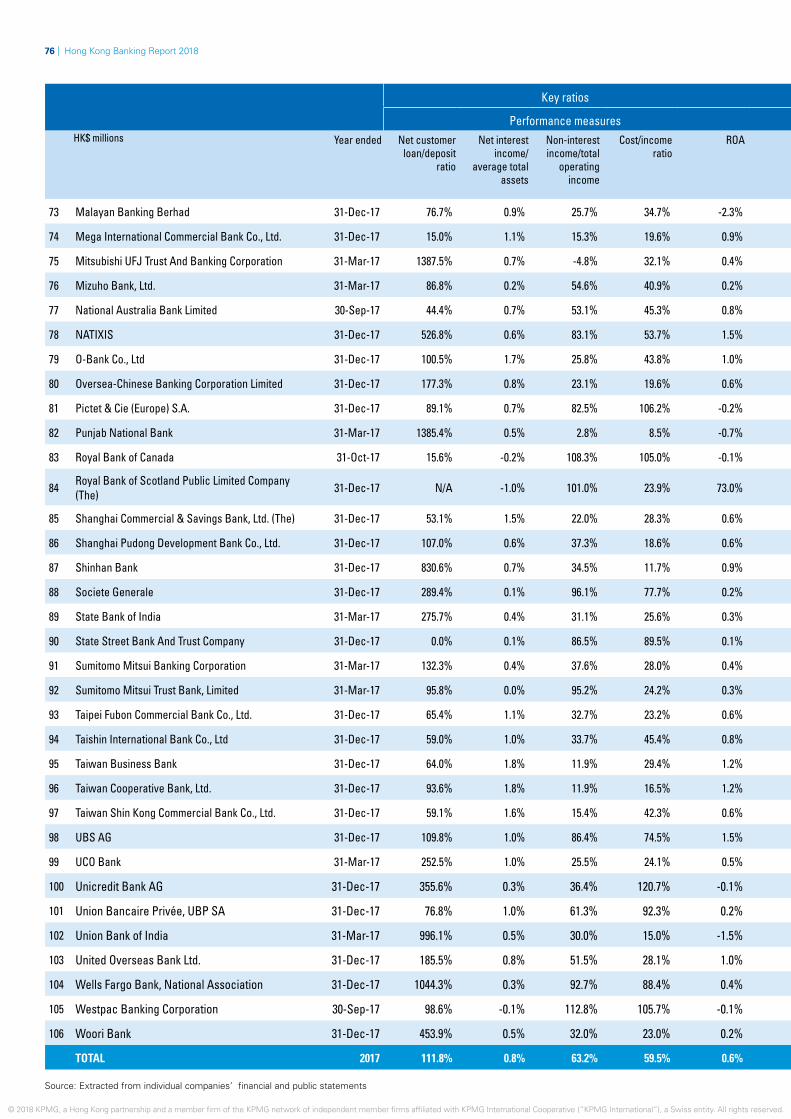
Key ratios Loan asset quality
Performance measures Past due advances Impaired advancesHK$ millions Year ended Net customer
loan/deposit ratio
Net interest income/
average total assets
Non-interest income/total
operating income
Cost/income ratio
ROA Loans overdue ≤ 3 months
Loans overdue > 3 months
Gross advances which are past due
Gross impaired advances
Gross impaired advances/ gross
advances to customers
Individually assessed impairment
allowances made against impaired
advances
Individually assessed allowances as a
percentage of gross impaired advances
Collaterals for individually
assessed impaired
advances
73 Malayan Banking Berhad 31-Dec-17 76.7% 0.9% 25.7% 34.7% -2.3% N/A 1,790 1,790 1,790 11.2% 1,696 94.7% N/A
74 Mega International Commercial Bank Co., Ltd. 31-Dec-17 15.0% 1.1% 15.3% 19.6% 0.9% N/A 10 10 - 0.0% - N/A -
75 Mitsubishi UFJ Trust And Banking Corporation 31-Mar-17 1387.5% 0.7% -4.8% 32.1% 0.4% - - - - 0.0% - N/A -
76 Mizuho Bank, Ltd. 31-Mar-17 86.8% 0.2% 54.6% 40.9% 0.2% N/A 40 40 522 0.3% 153 29.3% 24
77 National Australia Bank Limited 30-Sep-17 44.4% 0.7% 53.1% 45.3% 0.8% - - - - 0.0% - N/A N/A
78 NATIXIS 31-Dec-17 526.8% 0.6% 83.1% 53.7% 1.5% - - - - 0.0% - N/A -
79 O-Bank Co., Ltd 31-Dec-17 100.5% 1.7% 25.8% 43.8% 1.0% - - - 57 0.8% N/A N/A N/A
80 Oversea-Chinese Banking Corporation Limited 31-Dec-17 177.3% 0.8% 23.1% 19.6% 0.6% N/A 246 246 246 0.4% 163 66.3% -
81 Pictet & Cie (Europe) S.A. 31-Dec-17 89.1% 0.7% 82.5% 106.2% -0.2% - - - - 0.0% - N/A -
82 Punjab National Bank 31-Mar-17 1385.4% 0.5% 2.8% 8.5% -0.7% N/A 1,381 1,381 1,199 4.5% 930 77.6% 885
83 Royal Bank of Canada 31-Oct-17 15.6% -0.2% 108.3% 105.0% -0.1% - - - - 0.0% - N/A -
84 Royal Bank of Scotland Public Limited Company (The) 31-Dec-17 N/A -1.0% 101.0% 23.9% 73.0% - - - N/A N/A - N/A -
85 Shanghai Commercial & Savings Bank, Ltd. (The) 31-Dec-17 53.1% 1.5% 22.0% 28.3% 0.6% - - - 26 0.9% (13) -50.0% -
86 Shanghai Pudong Development Bank Co., Ltd. 31-Dec-17 107.0% 0.6% 37.3% 18.6% 0.6% - - - 421 0.5% - 0.0% -
87 Shinhan Bank 31-Dec-17 830.6% 0.7% 34.5% 11.7% 0.9% - - - - 0.0% - N/A -
88 Societe Generale 31-Dec-17 289.4% 0.1% 96.1% 77.7% 0.2% N/A 117 117 548 1.1% 175 31.9% 627
89 State Bank of India 31-Mar-17 275.7% 0.4% 31.1% 25.6% 0.3% N/A 531 531 531 1.8% 166 31.3% 531
90 State Street Bank And Trust Company 31-Dec-17 0.0% 0.1% 86.5% 89.5% 0.1% - - - - 0.0% - N/A -
91 Sumitomo Mitsui Banking Corporation 31-Mar-17 132.3% 0.4% 37.6% 28.0% 0.4% N/A 84 84 84 0.1% 84 100.0% -
92 Sumitomo Mitsui Trust Bank, Limited 31-Mar-17 95.8% 0.0% 95.2% 24.2% 0.3% - - - - 0.0% - N/A -
93 Taipei Fubon Commercial Bank Co., Ltd. 31-Dec-17 65.4% 1.1% 32.7% 23.2% 0.6% N/A 64 64 516 2.3% 85 16.5% 67
94 Taishin International Bank Co., Ltd 31-Dec-17 59.0% 1.0% 33.7% 45.4% 0.8% N/A 2 2 2 0.0% 2 100.0% -
95 Taiwan Business Bank 31-Dec-17 64.0% 1.8% 11.9% 29.4% 1.2% - - - 39 1.5% 10 25.6% N/A
96 Taiwan Cooperative Bank, Ltd. 31-Dec-17 93.6% 1.8% 11.9% 16.5% 1.2% - - - - 0.0% - N/A -
97 Taiwan Shin Kong Commercial Bank Co., Ltd. 31-Dec-17 59.1% 1.6% 15.4% 42.3% 0.6% N/A 5 5 9 0.4% - 0.0% 9
98 UBS AG 31-Dec-17 109.8% 1.0% 86.4% 74.5% 1.5% N/A 14 14 14 0.0% 14 100.0% -
99 UCO Bank 31-Mar-17 252.5% 1.0% 25.5% 24.1% 0.5% N/A 401 401 401 2.1% 333 83.0% N/A
100 Unicredit Bank AG 31-Dec-17 355.6% 0.3% 36.4% 120.7% -0.1% - - - - 0.0% - N/A -
101 Union Bancaire Privée, UBP SA 31-Dec-17 76.8% 1.0% 61.3% 92.3% 0.2% - - - - 0.0% - N/A -
102 Union Bank of India 31-Mar-17 996.1% 0.5% 30.0% 15.0% -1.5% N/A 2,988 2,988 2,748 11.0% 967 35.2% 1,823
103 United Overseas Bank Ltd. 31-Dec-17 185.5% 0.8% 51.5% 28.1% 1.0% N/A 281 281 203 0.2% 203 100.0% -
104 Wells Fargo Bank, National Association 31-Dec-17 1044.3% 0.3% 92.7% 88.4% 0.4% - - - - 0.0% - N/A -
105 Westpac Banking Corporation 30-Sep-17 98.6% -0.1% 112.8% 105.7% -0.1% - - - - 0.0% - N/A -
106 Woori Bank 31-Dec-17 453.9% 0.5% 32.0% 23.0% 0.2% - - - 51 0.5% 47 92.2% -
TOTAL 2017 111.8% 0.8% 63.2% 59.5% 0.6% 2,379 26,433 28,812 31,035 0.8% 17,296 55.7% 7,917
Source: Extracted from individual companies’ financial and public statements
76 | Hong Kong Banking Report 2018
© 2018 KPMG, a Hong Kong partnership and a member firm of the KPMG network of independent member firms affiliated with KPMG International Cooperative (“KPMG International”), a Swiss entity. All rights reserved.

Key ratios Loan asset quality
Performance measures Past due advances Impaired advancesHK$ millions Year ended Net customer
loan/deposit ratio
Net interest income/
average total assets
Non-interest income/total
operating income
Cost/income ratio
ROA Loans overdue ≤ 3 months
Loans overdue > 3 months
Gross advances which are past due
Gross impaired advances
Gross impaired advances/ gross
advances to customers
Individually assessed impairment
allowances made against impaired
advances
Individually assessed allowances as a
percentage of gross impaired advances
Collaterals for individually
assessed impaired
advances
73 Malayan Banking Berhad 31-Dec-17 76.7% 0.9% 25.7% 34.7% -2.3% N/A 1,790 1,790 1,790 11.2% 1,696 94.7% N/A
74 Mega International Commercial Bank Co., Ltd. 31-Dec-17 15.0% 1.1% 15.3% 19.6% 0.9% N/A 10 10 - 0.0% - N/A -
75 Mitsubishi UFJ Trust And Banking Corporation 31-Mar-17 1387.5% 0.7% -4.8% 32.1% 0.4% - - - - 0.0% - N/A -
76 Mizuho Bank, Ltd. 31-Mar-17 86.8% 0.2% 54.6% 40.9% 0.2% N/A 40 40 522 0.3% 153 29.3% 24
77 National Australia Bank Limited 30-Sep-17 44.4% 0.7% 53.1% 45.3% 0.8% - - - - 0.0% - N/A N/A
78 NATIXIS 31-Dec-17 526.8% 0.6% 83.1% 53.7% 1.5% - - - - 0.0% - N/A -
79 O-Bank Co., Ltd 31-Dec-17 100.5% 1.7% 25.8% 43.8% 1.0% - - - 57 0.8% N/A N/A N/A
80 Oversea-Chinese Banking Corporation Limited 31-Dec-17 177.3% 0.8% 23.1% 19.6% 0.6% N/A 246 246 246 0.4% 163 66.3% -
81 Pictet & Cie (Europe) S.A. 31-Dec-17 89.1% 0.7% 82.5% 106.2% -0.2% - - - - 0.0% - N/A -
82 Punjab National Bank 31-Mar-17 1385.4% 0.5% 2.8% 8.5% -0.7% N/A 1,381 1,381 1,199 4.5% 930 77.6% 885
83 Royal Bank of Canada 31-Oct-17 15.6% -0.2% 108.3% 105.0% -0.1% - - - - 0.0% - N/A -
84 Royal Bank of Scotland Public Limited Company (The) 31-Dec-17 N/A -1.0% 101.0% 23.9% 73.0% - - - N/A N/A - N/A -
85 Shanghai Commercial & Savings Bank, Ltd. (The) 31-Dec-17 53.1% 1.5% 22.0% 28.3% 0.6% - - - 26 0.9% (13) -50.0% -
86 Shanghai Pudong Development Bank Co., Ltd. 31-Dec-17 107.0% 0.6% 37.3% 18.6% 0.6% - - - 421 0.5% - 0.0% -
87 Shinhan Bank 31-Dec-17 830.6% 0.7% 34.5% 11.7% 0.9% - - - - 0.0% - N/A -
88 Societe Generale 31-Dec-17 289.4% 0.1% 96.1% 77.7% 0.2% N/A 117 117 548 1.1% 175 31.9% 627
89 State Bank of India 31-Mar-17 275.7% 0.4% 31.1% 25.6% 0.3% N/A 531 531 531 1.8% 166 31.3% 531
90 State Street Bank And Trust Company 31-Dec-17 0.0% 0.1% 86.5% 89.5% 0.1% - - - - 0.0% - N/A -
91 Sumitomo Mitsui Banking Corporation 31-Mar-17 132.3% 0.4% 37.6% 28.0% 0.4% N/A 84 84 84 0.1% 84 100.0% -
92 Sumitomo Mitsui Trust Bank, Limited 31-Mar-17 95.8% 0.0% 95.2% 24.2% 0.3% - - - - 0.0% - N/A -
93 Taipei Fubon Commercial Bank Co., Ltd. 31-Dec-17 65.4% 1.1% 32.7% 23.2% 0.6% N/A 64 64 516 2.3% 85 16.5% 67
94 Taishin International Bank Co., Ltd 31-Dec-17 59.0% 1.0% 33.7% 45.4% 0.8% N/A 2 2 2 0.0% 2 100.0% -
95 Taiwan Business Bank 31-Dec-17 64.0% 1.8% 11.9% 29.4% 1.2% - - - 39 1.5% 10 25.6% N/A
96 Taiwan Cooperative Bank, Ltd. 31-Dec-17 93.6% 1.8% 11.9% 16.5% 1.2% - - - - 0.0% - N/A -
97 Taiwan Shin Kong Commercial Bank Co., Ltd. 31-Dec-17 59.1% 1.6% 15.4% 42.3% 0.6% N/A 5 5 9 0.4% - 0.0% 9
98 UBS AG 31-Dec-17 109.8% 1.0% 86.4% 74.5% 1.5% N/A 14 14 14 0.0% 14 100.0% -
99 UCO Bank 31-Mar-17 252.5% 1.0% 25.5% 24.1% 0.5% N/A 401 401 401 2.1% 333 83.0% N/A
100 Unicredit Bank AG 31-Dec-17 355.6% 0.3% 36.4% 120.7% -0.1% - - - - 0.0% - N/A -
101 Union Bancaire Privée, UBP SA 31-Dec-17 76.8% 1.0% 61.3% 92.3% 0.2% - - - - 0.0% - N/A -
102 Union Bank of India 31-Mar-17 996.1% 0.5% 30.0% 15.0% -1.5% N/A 2,988 2,988 2,748 11.0% 967 35.2% 1,823
103 United Overseas Bank Ltd. 31-Dec-17 185.5% 0.8% 51.5% 28.1% 1.0% N/A 281 281 203 0.2% 203 100.0% -
104 Wells Fargo Bank, National Association 31-Dec-17 1044.3% 0.3% 92.7% 88.4% 0.4% - - - - 0.0% - N/A -
105 Westpac Banking Corporation 30-Sep-17 98.6% -0.1% 112.8% 105.7% -0.1% - - - - 0.0% - N/A -
106 Woori Bank 31-Dec-17 453.9% 0.5% 32.0% 23.0% 0.2% - - - 51 0.5% 47 92.2% -
TOTAL 2017 111.8% 0.8% 63.2% 59.5% 0.6% 2,379 26,433 28,812 31,035 0.8% 17,296 55.7% 7,917
Hong Kong Banking Report 2018 | 77
© 2018 KPMG, a Hong Kong partnership and a member firm of the KPMG network of independent member firms affiliated with KPMG International Cooperative (“KPMG International”), a Swiss entity. All rights reserved. © 2018 KPMG, a Hong Kong partnership and a member firm of the KPMG network of independent member firms affiliated with KPMG International Cooperative (“KPMG International”), a Swiss entity. All rights reserved.

About KPMGKPMG China operates in 18 cities across China, with around 12,000 partners and staff in Beijing, Beijing Zhongguancun, Changsha, Chengdu, Chongqing, Foshan, Fuzhou, Guangzhou, Hangzhou, Nanjing, Qingdao, Shanghai, Shenyang, Shenzhen, Tianjin, Wuhan, Xiamen, Hong Kong SAR and Macau SAR. With a single management structure across all these offices, KPMG China can deploy experienced professionals efficiently, wherever our client is located.
KPMG International is a global network of professional services firms providing Audit, Tax and Advisory services. We operate in 154 countries and territories and have 200,000 people working in member firms around the world. The independent member firms of the KPMG network are affiliated with KPMG International Cooperative (“KPMG International”), a Swiss entity. Each KPMG firm is a legally distinct and separate entity and describes itself as such.
In 1992, KPMG International became the first international accounting network to be granted a joint venture licence in mainland China. KPMG China was also the first among the Big Four in mainland China to convert from a joint venture to a special general partnership, as of 1 August 2012. Additionally, the Hong Kong office can trace its origins to 1945. This early commitment to the China market, together with an unwavering focus on quality, has been the foundation for accumulated industry experience, and is reflected in the Chinese member firm’s appointment by some of China’s most prestigious companies.
78 | Hong Kong Banking Report 2018
© 2018 KPMG, a Hong Kong partnership and a member firm of the KPMG network of independent member firms affiliated with KPMG International Cooperative (“KPMG International”), a Swiss entity. All rights reserved.
Contact usAndrew WeirRegional Senior Partner, Hong KongKPMG China+852 2826 [email protected]
Ayesha LauManaging Partner, Hong KongKPMG China+852 2826 [email protected]
Simon GleavePartner, Regional Head of Financial Services, Asia PacificKPMG China+86 (10) 8508 [email protected]
Egidio ZarrellaPartner, Head of Clients & InnovationKPMG China+852 2847 [email protected]
Paul McSheaffreyPartner, Head of Banking & Capital Markets, Hong Kong KPMG China+852 2978 [email protected]
Bonn LiuPartner, Head of Financial Services, Hong KongKPMG China+852 2826 [email protected]
Darren BowdernPartner, Head of Financial Services TaxKPMG China+852 2826 [email protected]
Kyran McCarthyPartner, Asia-Pacific Head of AML & Sanctions Services KPMG China+852 2140 [email protected]
Simon ToppingPartner, Regulatory Advisory KPMG China+852 2826 [email protected]
Isabel ZisselsbergerPartner, Head of Customer and Operations and Financial Management KPMG China+852 2826 [email protected]
Henry ShekPartner, Head of IT Advisory Risk ConsultingKPMG China+852 2143 [email protected]
Peter OutridgePartner, Head of People & Change Advisory KPMG China+852 2847 [email protected]
Tom JenkinsPartner, Financial Services KPMG China+852 2143 [email protected]
Rupert ChamberlainCEO, Managed ServicesKPMG China+852 2140 [email protected]
Terence FongPartner, Financial ServicesKPMG China+852 2978 [email protected]
Rita WongPartner, Financial ServicesKPMG China+852 2978 [email protected]
Arend OldenzielPartner, Financial ServicesKPMG China+852 2978 [email protected]
John TimpanyPartner, Tax KPMG China+852 2143 [email protected]
Lachlan WolfersPartner, Head of Tax TechnologyKPMG China+852 2685 [email protected]
Jianing SongPartner, Financial Services Advisory KPMG China+852 2978 [email protected] Rani KamaruddinPartner, AML & Sanctions Services, Hong KongKPMG China+852 2140 [email protected]
Michael MontefortePartner, Financial Risk ManagementKPMG China+852 2847 [email protected]
Catherine YoungDirector, Risk Consulting KPMG China+852 2847 [email protected]
Susanne SteynDirector, Risk ConsultingKPMG China+852 2140 [email protected]
David LonerganDirector, Risk ConsultingKPMG China+852 2826 [email protected]
Bhagya PereraDirector, IT AdvisoryKPMG China+852 2140 [email protected]
Patrick WongDirector, IT AdvisoryKPMG China+852 2140 [email protected]
James HarteDirector, Global Strategy Group KPMG China+852 2140 [email protected]
Michael CamerlengoDirector, Infrastructure AdvisoryKPMG China+852 2140 [email protected]
Hong Kong Banking Report 2018 | 79
© 2018 KPMG, a Hong Kong partnership and a member firm of the KPMG network of independent member firms affiliated with KPMG International Cooperative (“KPMG International”), a Swiss entity. All rights reserved. © 2018 KPMG, a Hong Kong partnership and a member firm of the KPMG network of independent member firms affiliated with KPMG International Cooperative (“KPMG International”), a Swiss entity. All rights reserved.
kpmg.com/cn/socialmedia
The information contained herein is of a general nature and is not intended to address the circumstances of any particular individual or entity. Although we endeavour to provide accurate and timely information, there can be no guarantee that such information is accurate as of the date it is received or that it will continue to be accurate in the future. No one should act upon such information without appropriate professional advice after a thorough examination of the particular situation.
© 2018 KPMG, a Hong Kong partnership and a member firm of the KPMG network of independent member firms affiliated with KPMG International Cooperative (“KPMG International”), a Swiss entity. All rights reserved. Printed in Hong Kong.
The KPMG name and logo are registered trademarks or trademarks of KPMG International.
Publication number: HK-FS18-0001
Publication date: June 2018
For a list of KPMG China offices, please scan the QR code or visit our website: https://home.kpmg.com/cn/en/home/about/offices.html
kpmg.com/cn/banking