homogeneity of doping with paramagnetic ions by nmr
TRANSCRIPT
9752 | Phys. Chem. Chem. Phys., 2016, 18, 9752--9757 This journal is© the Owner Societies 2016
Cite this:Phys.Chem.Chem.Phys.,
2016, 18, 9752
Homogeneity of doping with paramagnetic ionsby NMR†
Wenyu Li,a Vinicius R. Celinski,a Johannes Weber,a Nathalie Kunkel,b
Holger Kohlmannc and Jorn Schmedt auf der Gunne*a
In NMR, paramagnetic dopants change the relaxation behavior and the chemical shift of the nuclei in
their immediate environment. Based on the concept that the ‘‘immediate environment’’ in a diamagnetic
host material can be described as a sphere with radius r0, we developed a function for the fraction of
unperturbed nuclei (the fraction of nuclei outside the sphere) which gives a link between the effective
radius and the doping concentration. In the case of a homogeneous doping scenario a characteristic
dependence is observed in both theory and experiment. We validated the model on a sample series
where paramagnetic Eu(II) ions are doped into crystalline SrH2. The fraction of unperturbed nuclei was
determined from the 1H NMR signal and follows the predicted curve for a homogeneous doping
scenario where the radius r0 is 17 Å.
Introduction
Doping by paramagnetic ions enables the functionalization ofinorganic materials such as phosphors1–5 and semiconductors.6–8
For example, one type of phosphor-converted white-light LED isrealized with a diamagnetic SrSi2O2N2 host doped with only 2%of Eu which yields quantum efficiencies as high as 91%.9 In thecase of long lasting phosphors (LLPs), it has been observed thatonly a small fraction of the dopants participate in the process ofphosphorescence.10,11 Many long lasting phosphors are based onparamagnetic doping with rare-earth elements. Clearly, the distri-bution of paramagnetic dopant ions in the host lattice could affectthe brightness,12,13 the emission wavelength,14 the efficiency13
and the afterglow duration15–17 of phosphors. One reason is theconcentration quenching effect10,18 which refers to the phenom-enon that the luminescence yield decreases with increasingactivator concentration at high concentrations. According to thestatistical trap mechanism,18–21 for the inorganic phosphors, theenergy transfer probability increases dramatically if the activatorions are close to each other, due to the D�6 dependence (D is thedistance between two activator centers) which relates to theelectric dipole–dipole interaction nature of this energy transfer.
Therefore, homogeneous doping is often demanded in order toachieve optimal optical properties, and in fact methods such as thesol–gel method22 and the homogeneous precipitation23 are oftenapplied in phosphor synthesis to improve doping homogeneity.
What does ‘‘homogeneous doping’’ mean? According to theIUPAC gold book,24 ‘‘homogeneous’’ refers to ‘‘the degree to which aproperty or a constituent is uniformly distributed throughout aquantity of material’’. By this definition, a specific scale for thematerial’s quantity is required over which a property is homo-geneous. While glass appears homogeneous to the human eye atthe wavelength of several hundred nanometers, its refractive indexgives evidence of the inner disorder when going to shorter wave-lengths, for example, under a scanning electron microscope (SEM)by the electron beam with wavelengths of few nm or Å.25
The investigation of doping homogeneity can be achieved bydifferent analytical techniques depending on the required lengthscale of homogeneity. Homogeneous doping is often assumedif the lattice parameters determined by X-ray diffraction followVegard’s empirical law.26,27 While neutron diffraction and someX-ray diffraction devices can be used to determine pair-distributionfunctions to study doping inhomogeneity,28–30 this is hardly possi-ble on standard laboratory X-ray diffractometers;31 optical spectro-scopy techniques such as X-ray photoelectron spectroscopy (XPS)32
can provide the distribution of paramagnetic dopant ions on thesurface but not in the bulk; another surface technique to studyhomogeneity is electron microscopy33,34 which offers a direct imageon spots of the surface of the sample down to the atomic scale.In addition, atomic probe tomography35 can provide 3D pictures onthe distribution of dopants down to nm and atomic scale.
Here we want to focus on magnetic resonance spectroscopy tostudy doping homogeneity. By electron spin resonance spectroscopy
a Inorganic Materials Chemistry, University of Siegen, Adolf-Reichwein-Str. 2,
57076 Siegen, Germany. E-mail: [email protected] ParisTech-CNRS, Institut de Recherche de Chimie Paris, 11,
Rue Pierre et Marie Curie, 75005 Paris, Francec Inorganic Chemistry, University of Leipzig, Johannisallee 29, 04103 Leipzig,
Germany
† Electronic supplementary information (ESI) available: Error propagation; acomparison of different wipe-out radii with the experimental data; and detailsof the Fortran program. See DOI: 10.1039/c5cp07606d
Received 9th December 2015,Accepted 1st March 2016
DOI: 10.1039/c5cp07606d
www.rsc.org/pccp
PCCP
PAPER
This journal is© the Owner Societies 2016 Phys. Chem. Chem. Phys., 2016, 18, 9752--9757 | 9753
(ESR) information about the homogeneity of doping with para-magnetic atoms can be extracted via lineshape analysis36,37 or bymultipulse spectroscopy.38 In this contribution we use nuclearmagnetic resonance spectroscopy (NMR) to analyze the environ-ment of the doped paramagnetic atoms to obtain informationabout their distribution in the diamagnetic host material. Theadvantage of this inverse approach as compared to ESR is thatnon-doped areas which are not visible in the ESR experiment arenot overlooked. So far NMR studies of sample homogeneity37,39–53
have focused on the variation of magnetization with the spinlattice relaxation time T1. Often combined models are suggestedwhich try to derive the observed relaxation time distribution frommodels taking into account spin-diffusion between nuclear spinsand paramagnetic relaxation pathways of nuclear spin-systems.Models suggest that spin-diffusion only becomes efficient fornuclei outside a certain radius (the so called wipe-out radius54–56)around the paramagnetic ion. Owing to the extremely fast relaxa-tion mechanism near typical paramagnetic ions, the detection ofthe nuclei in their direct environment is technically quite difficultdue to significant distortions in the measured relaxation distri-bution function. In addition, the paramagnetic shift due toFermi-contact and pseudo-contact interactions might shift theresonance line out of the spectral window thereby rendering itnon-observable.
Interestingly, although the effects induced by paramagneticions53,57–59 regarding the paramagnetic shift, relaxation andlineshape (Fig. 1) are well understood, for example, 6Li MASNMR spinning side band manifolds60 and shifts61 are shown tobe very sensitive to the nearest coordination sphere of Mn ions,to the best of our knowledge, the approach to simply quantifythe signal intensity of the nuclei outside the wipe-out radius tostudy the doping homogeneity has not been used so far.
Based on the above considerations, the working hypothesishere is that the doping homogeneity on the atomic scale canbe accessed by quantitative solid state NMR via the peak areameasurements.
ExperimentalSynthesis of Sr1�xEuxH2 doping series
Eu is incorporated in the Sr metal before contacting with H2
to make sure that the doping is as homogeneous as possible
within the limit of the lab work. The starting materials and themetal hydride products are very sensitive to air and were thereforehandled in an argon filled glove box. Strontium and europiumwere melted together in order to achieve optimal homogeneity asdescribed in the earlier work.62 The resulting alloys were hydro-genated in an autoclave made from hydrogen resistant Nicrofers
5219 alloy (Inconel 718) at 650 K and 100 bar hydrogen pressure.The europium content was determined by ICP-MS analysis.Further details of preparation, X-ray diffraction and chemicalanalysis can be found in earlier work.62
Solid state NMR
The solid state NMR experiments were performed at 11.75 T on aBruker Avance III NMR spectrometer equipped with a commer-cial 1.3 mm MAS probe at a 1H frequency of 500 MHz underambient conditions. The sample spinning frequency was 40 kHz.
The chemical shifts of 1H are reported using the d scale,relative to 1% tetramethylsilane (TMS) in CDCl3.63 The peak areaquantification is based on the analysis of back-extrapolated spin-echo experiments.64
The side bands were taken into consideration when calculatingthe peak area. An estimated error of 10% for the quantificationagainst the external reference adamantane was taken into accountsubsequently. Peak areas were obtained by deconvolution withseveral Gaussian and Lorentzian functions using a home-writtenprogram.
Results and discussion
In order to test the hypothesis, we present a case study wherewe use crystalline SrH2 as the host material doped with theparamagnetic ions of Eu(II). Strontium hydride and europiumhydride form a solid solution Sr1�xEuxH2 and show a Vegard27
like behaviour,65 which can be expected considering the crystalchemical similarities of strontium and europium hydrides.66
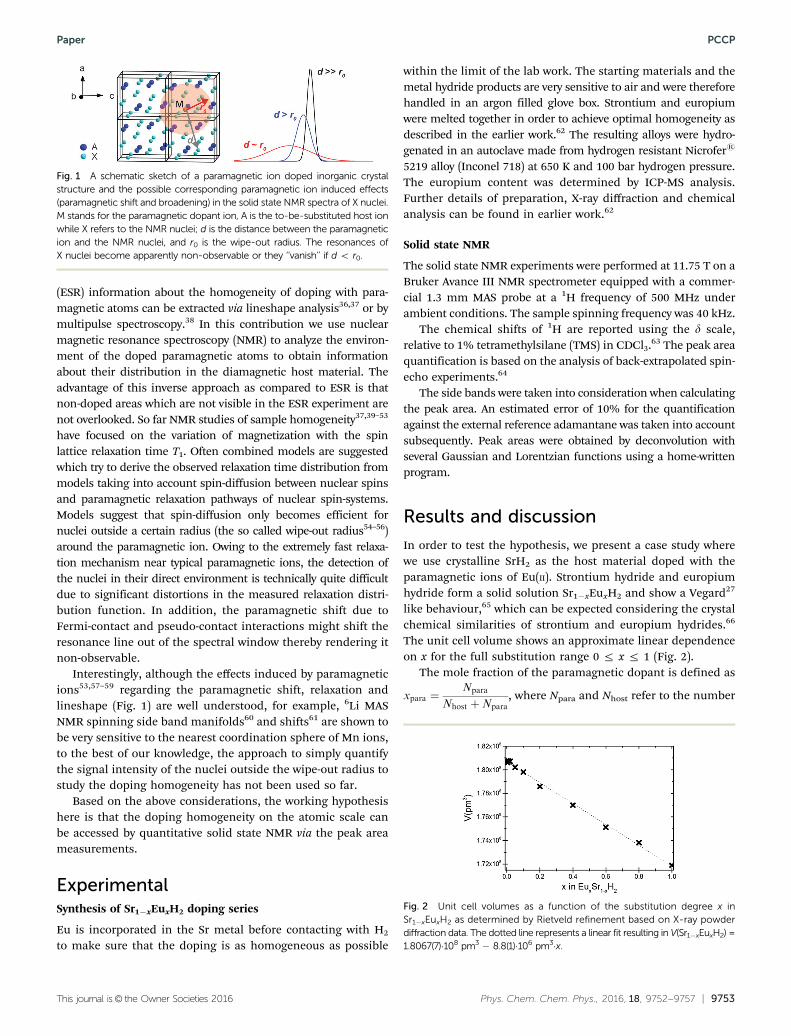
The unit cell volume shows an approximate linear dependenceon x for the full substitution range 0 r x r 1 (Fig. 2).
The mole fraction of the paramagnetic dopant is defined as
xpara ¼Npara
Nhost þNpara, where Npara and Nhost refer to the number
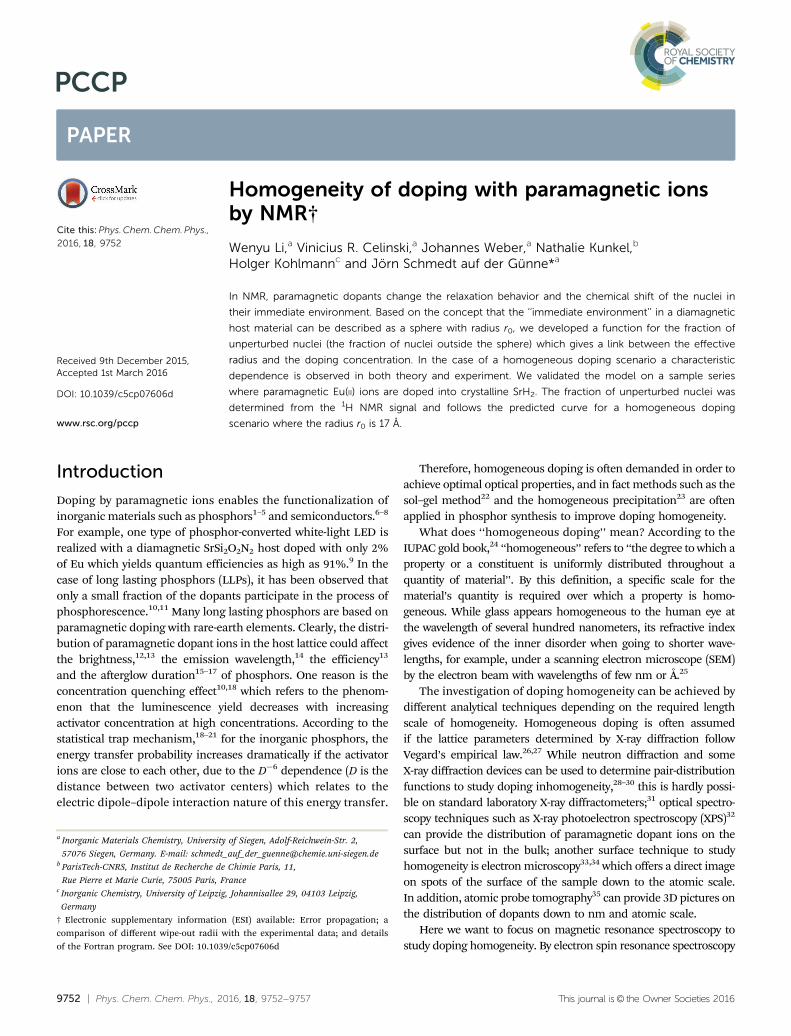
Fig. 1 A schematic sketch of a paramagnetic ion doped inorganic crystalstructure and the possible corresponding paramagnetic ion induced effects(paramagnetic shift and broadening) in the solid state NMR spectra of X nuclei.M stands for the paramagnetic dopant ion, A is the to-be-substituted host ionwhile X refers to the NMR nuclei; d is the distance between the paramagneticion and the NMR nuclei, and r0 is the wipe-out radius. The resonances ofX nuclei become apparently non-observable or they ‘‘vanish’’ if d o r0.
Fig. 2 Unit cell volumes as a function of the substitution degree x inSr1�xEuxH2 as determined by Rietveld refinement based on X-ray powderdiffraction data. The dotted line represents a linear fit resulting in V(Sr1�xEuxH2) =1.8067(7)�108 pm3 � 8.8(1)�106 pm3�x.
Paper PCCP

9754 | Phys. Chem. Chem. Phys., 2016, 18, 9752--9757 This journal is© the Owner Societies 2016
of dopant ions and the corresponding host sites that can beoccupied by the dopant ions (for simplicity, they are written asthe host ions in the rest of the paper). In this case, the dopantion is Eu2+ and the host ion is Sr2+, therefore we specify thedoping mole fraction of Eu as xEu in the figures.
In order to test our hypothesis, the correlation between xpara
and the visible peak areas is first set up, and the experimentallyvisible H fraction fvisible was introduced. In the ideal case, with asuitable internal reference, the observed peak area fraction is aquantitative reflection of the visible H percentage. On the otherhand, in the following sub-chapters, in all theoretical models,the visible H percentage is calculated as the ratio of the numberof NMR ‘‘visible’’ 1H nuclei, which are located outside of the Euinfluencing spheres, to the total number of H atoms.
The presented analysis is organized in the following way.In the first part we present the experimental data obtained byquantitative 1H NMR measurements and an empirical functionfor describing the observed findings. In the second part wediscuss the assumptions made for deriving analytical functionsfor the fraction of visible 1H atoms as a function of the dopingconcentration. In part three analytical functions are derived fordescribing the obtained NMR data for the statistical dopingscenario.
We obtained quantitative 1H NMR spectra of a doping seriesof Sr1�xEuxH2. The NMR spectra (see ESI†) qualitatively show adecay of signal intensity for the 1H peak found in the samplewith the lowest doping mole fraction x = 10�8, and a broadeningof the resonance with higher doping concentration x.
From the observed peak area per mole of sample (A/n) of
Sr1�xEuxH2 we define the ratio fvisible as fvisible ¼Adoped
�ndoped
Anon-doped�nnon-doped
.
Here visible refers to nuclei whose 1H NMR peaks remainapproximately at the same position in the spectrum as a non-doped sample. For the following treatment we assume that theparamagnetic shift of atoms is the dominant reason why anucleus becomes ‘‘invisible’’ in the above sense and we neglectthe relaxation effects which can make the signal of a nucleusvanish in the dead-time delay of the probehead.
The ratio fvisible is experimentally accessible and plottedagainst xEu on a logarithmic scale, which, as expected, showsa simple behavior following a monotonous decay (see ESI†).Empirically the following function was found which can describethe experimental data (see ESI†):
fvisible xpara� �
¼ exp �k1 xpara� �k2h i
The coefficients k1 and k2 were used as fitting parameterswhich took the values k1 = 425 � 113 and k2 = 1.00 � 0.04,respectively.
In order to derive analytical functions for fvisible = fvisible (xpara)we make a number of assumptions. We assume that all atomsinside a radial sphere of influence (called wipe-out radius r0)around a paramagnetic atom (Fig. 3) will be shifted to an extremespectral range which makes them virtually invisible to NMRexperiments. The concept of a radial sphere of influence is wellestablished (shell-of-influence model43,67) and still questionable
if one takes into account (1) the angular dependence of thehyperfine interaction, (2) the unrealistic, discontinuous considera-tion at the border between visible and invisible H atoms and (3) thepossibility of multiple interactions with different Eu atoms, whichcould mutually cancel each other. On the other hand, the pseudo-contact shift carries a term with an inverse cubic distance depen-dence which corresponds to a strong radial dependence.
In order to calculate the visible fraction fvisible as the visiblevolume divided by the total volume, the assumption about thenumber density of H ions has to be made first. Only in thecondition that the number density is already approximately aconstant at a distance smaller than the wipe-out radius, theoscillating error induced by the number density variation of thelattice at small distance can be neglected. The following is toshow that the calculation system of 5 Å is enough for obtaininga fairly good (o20% error) number density approximation.
To evaluate the number density of H atoms, a discrete point-model based on the crystal structure may serve as a reference.Such models were implemented in Fortran90 (ESI†) to analyzedifferent doping scenarios, however their analysis always requiresfull information about the unit cell which is hardly feasible in ageneral case. A more practical approach is to follow a continuousmodel, namely to calculate the expected number of observednuclei around a dopant with the help of the average numberdensity and the volume of a sphere. The difference between thesetwo approaches becomes apparent from the normalized integral
of the radial pair distribution function G rð Þ ¼ 3
r3Ð r0g r0ð Þ � r0ð Þ2dr0
of Sr1�xEuxH2 (Fig. 4). The better the continuous approximationthe smaller the difference from 1.0. From the GSrH(r) it becomesobvious that for spheres with a size bigger than 4.7 Å the errors inthe number of atoms in the sphere deviates by less than 20%from the value expected from the number density. We concludethat the continuous approximation is acceptable given that theradius r0 below which the 1H nuclei become invisible is of theorder of 10 to 20 Å.
The visible H fraction is easily counted for a statistical dopingscenario for a given wipe-out radius r0 with the help of a smallcomputer program. By comparing the experimental plot with thecalculated data for different assumed radii, the wipe-out radiuscan be estimated at around 17 Å with a convergence criterion of3% for the lowest doping level (see ESI†).
Fig. 3 A schematic drawing of the influence sphere model. M is theparamagnetic center while X represents the NMR nuclei. According tothe influence sphere model, if the distance dM�X between an X nucleusand the paramagnetic ion M is smaller than the wipe-out radius r0, the Xnucleus is not visible by NMR. On the other hand, the X nuclei withdM�X > r0 are visible by NMR.
PCCP Paper

This journal is© the Owner Societies 2016 Phys. Chem. Chem. Phys., 2016, 18, 9752--9757 | 9755
An interesting question is how the empirical fitting functioncan be given a physical meaning in the sense that becomes afunction of the wipe-out radius fvisible = fvisible(r0,xpara) and theaverage number densities according to the crystal structure.
The approach we took is to calculate the regime of extremelow doping concentrations. For those the function fvisible =fvisible(r0,xpara) should approach values calculated from the totalvolume Vinvisible of all wipe-out spheres from the volume of anindividual sphere multiplied by the number of dopants. Thesespheres are not likely to be superimposed at low concentration,which justifies the approach.
Vinvisible ¼4
3pr03Npara
Here Npara is the number of dopant ions in the total volume of thecrystal Vtotal. The doping mole fraction xpara helps relate Npara andthe unit cell volume VUC to the total volume of the crystal Vtotal.The term Nhost UC refers to the number of ‘‘dopable’’ sites in theunit cell, in this example, the number of Sr atoms per unit cell.
Vtotal ¼Nhost þNpara
NhostUCVUC
Assuming equal 1H number densities in each volume unit, theinvisible fraction is proportional to the invisible volume ratio,which can be described as a function of the wipe-out radius r0.
finvisible r0;xpara� �
¼ Vinvisible
Vtotal¼ 4pNhostUC
3VUCr03xpara
fvisible r0;xpara� �
¼ 1� 4pNhostUC
3VUCr03xpara
The pre-factor a in the empirical exponential fitting functionfvisible(r0,xpara) = exp(�ar0
3 xpara) is fitted to be a = 0.0863 �0.0016, which shows a resemblance with the theoretical value4pNhostUC
3VUC¼ 0:0939, which can be explained mathematically by
the Taylor expansion in the small xpara range:
fvisible r0;xpara� �
¼ exp �ar03xpara� �
�1� ar03xpara þ
1
2a2r0
6xpara2 � � � � as xpara ! 0
By asymptotic analysis, as xpara approaches zero, the higherorder terms can be neglected, and the following equation holds
fvisible(r0,xpara) B 1 �ar03xpara as xpara - 0
or written as limxpara!0
fvisible r0;xpara� �
¼ 1� ar03xpara, which shows
a resemblance to the formula
fvisible r0;xpara� �
¼ 1� 4pNhostUC
3VUCr03xpara
with a ¼ 4pNhostUC
3VUCas xpara ! 0.
Due to the fact that the experimental data fit the calculatedcurve based on the statistical distribution model (see Fig. 5), weconclude that the SrH2:Eu samples are homogeneously doped onthe Å scale and this homogeneity refers to a statistical distribu-tion of Eu2+ ions.
A remaining question is if the wipe-out radius r0 for aparamagnetic dopant ion is a constant or within a certain limit.If so, testing the homogeneity by a single NMR experimentcould be feasible and promising. Here we provide an embryoidea for further NMR investigation by introducing a parameter,namely the cut-off mole fraction x0. Based on the statisticaldistribution model, x0 is defined that if a sample is statisticallydoped at the doping level xpara > x0, then the macroscopic signalin the MAS NMR measurement is very weak or non-observable( fvisible o 0.1%), see Fig. 5.
To the best of our knowledge, the numeric value for thewipe-out radius r0 has not been published before, and for the firsttime, we calculated the r0 for Eu2+ to be around 17 Å. If the wipe-out radius r0 would be approximately a calculable constant forEu2+ in different host lattices, and if the empirical fitting functioncould be applied, then the doping homogeneity could be acces-sible by only one NMR experiment at the cut-off mole fractionx0 together with a measurement of the non-doped sample.
Fig. 4 The integrated pair distribution function GSrH(r) of SrH2 calculatedfrom the crystal structure by counting atoms on a grid of 0.1 Å.
Fig. 5 The comparison of the visible H fraction fvisible calculated from the1H MAS NMR back extrapolated full echo series experiments63 with errorbars, calculated according to the statistical distribution model and thefitted function fvisible = exp(�ar0
3xEu) with a = 0.0863 � 0.0016, plottedagainst the Eu doping mole fraction xEu in the log scale. The wipe-outradius r0 is taken as 17 Å. The hollow circle, the hollow triangle and thedashed line represent the experimental data, the calculated data and thefunction plot, respectively. The dotted line at xEu E 0.0163 is the cut-offconcentration x0 line, at which the fvisible approaches zero (fvisible o 0.1%).
Paper PCCP

9756 | Phys. Chem. Chem. Phys., 2016, 18, 9752--9757 This journal is© the Owner Societies 2016
Conclusions
The main question of this work is whether the paramagneticdoping homogeneity can be quantitatively investigated by solidstate NMR. Based on the comparison of the experimental andthe calculated data, we conclude that by applying a simple
function fvisible(r0,xpara) = exp(�ar03xpara) with a ¼ 4pNhostUC
3VUC
which connects the wipe-out radius r0 and the doping molefraction xpara with the NMR visible signal fraction fvisible, thestatistical doping scenario can be described adequately.
The above-mentioned method may serve as an efficient tool forquantitative analysis of the doping homogeneity of an arbitraryparamagnetic dopant in different host lattices, especially for therare earth and transition metal elements. This may be helpful forapplications such as the design of quantum dots and phosphors.The approach is hardly limited by the choice of the isotope as longas a signal can be obtained in 1D NMR spectroscopy. Thus studieseven with less common NMR nuclei such as 71Ga, 75As or 37Cl arepossible. This method is also applicable to homogeneity analysisof nano-scale materials on an Å scale.
Acknowledgements
The author would like to acknowledge Prof. Dr. Wolfgang Schnickand Dr. Thomas Brauniger for providing access to the lab instru-ment and Christian Minke for technical support and maintenanceof the NMR spectrometer.
References
1 R.-J. Xie, N. Hirosaki, Y. Li and T. Takeda, Materials, 2010, 3,3777–3793.
2 K. Van den Eeckhout, P. F. Smet and D. Poelman, Materials,2010, 3, 2536–2566.
3 W. Schnick, Phys. Status Solidi RRL, 2009, 3, A113–A114.4 R. Mueller-Mach, G. Mueller, M. R. Krames, H. A. Hoppe,
F. Stadler, W. Schnick, T. Juestel and P. Schmidt, Phys.Status Solidi A, 2005, 202, 1727.
5 C. C. Lin and R.-S. Liu, J. Phys. Chem. Lett., 2011, 2,1268–1277.
6 A. Bonanni, Semicond. Sci. Technol., 2007, 22, R41.7 R. I. Epstein and M. Sheik-Bahae, Optical Refrigeration, Science
and Applications of Laser Cooling of Solids, Wiley-VCH, 2009,pp. 1–32.
8 R. Jones, Opt. Mater., 2006, 28, 718–722.9 V. Bachmann, C. Ronda, O. Oeckler, W. Schnick and
A. Meijerink, Chem. Mater., 2008, 21, 316–325.10 G. Blasse and B. C. Grabmaier, Luminescent Materials, Springer
Berlin Heidelberg, Berlin, Heidelberg, 1994.11 F. Clabau, X. Rocquefelte, T. Le Mercier, P. Deniard, S. Jobic
and M.-H. Whangbo, Chem. Mater., 2006, 18, 3212–3220.12 I. Yu and M. Senna, Appl. Phys. Lett., 1995, 66, 424–426.13 W. Park, T. C. Jones, W. Tong, S. Schon, M. Chaichimansour,
B. K. Wagner and C. J. Summers, J. Appl. Phys., 1998, 84,6852–6858.
14 N. C. George, K. A. Denault and R. Seshadri, Annu. Rev.Mater. Res., 2013, 43, 481–501.
15 D. Poelman, N. Avci and P. F. Smet, Opt. Express, 2009, 17,358–364.
16 F. Clabau, X. Rocquefelte, S. Jobic, P. Deniard, M.-H.Whangbo, A. Garcia and T. Le Mercier, Chem. Mater.,2005, 17, 3904–3912.
17 K. Van den Eeckhout, P. F. Smet and D. Poelman, Materials,2011, 4, 980–990.
18 D. L. Dexter and J. H. Schulman, J. Chem. Phys., 1954, 22,1063–1070.
19 T. Forster, Ann. Phys., 1948, 437, 55–75.20 D. L. Dexter, J. Chem. Phys., 1953, 21, 836–850.21 J. Knoester and J. E. V. Himbergen, J. Chem. Phys., 1987, 86,
3571–3576.22 M. L. Pang, J. Lin, J. Fu, R. B. Xing, C. X. Luo and Y. C. Han,
Opt. Mater., 2003, 23, 547–558.23 Y. Kawahara, V. Petrykin, T. Ichihara, N. Kijima and
M. Kakihana, Chem. Mater., 2006, 18, 6303–6307.24 W. Horwitz, Pure Appl. Chem., 2009, 62, 1193–1208.25 A. Ben-Yakar, R. L. Byer, A. Harkin, J. Ashmore, H. A. Stone,
M. Shen and E. Mazur, Appl. Phys. Lett., 2003, 83, 3030.26 L. Vegard, Z. Phys., 1921, 5, 17–26.27 L. Vegard and H. Dale, Z. Kristallogr., Kristallgeom., Kristallphys.,
Kristallchem, 1928, 67, 148–162.28 E. S. Bozin, G. H. Kwei, H. Takagi and S. J. L. Billinge, Phys.
Rev. Lett., 2000, 84, 5856–5859.29 S. J. L. Billinge, T. Proffen, V. Petkov, J. L. Sarrao and
S. Kycia, Phys. Rev. B: Condens. Matter Mater. Phys., 2000,62, 1203–1211.
30 J. Huang, J. Xu, H. Luo, X. Yu and Y. Li, Inorg. Chem., 2011,50, 11487–11492.
31 C. Michaelsen, Philos. Mag. A, 1995, 72, 813–828.32 C. Dong, J. Pichaandi, T. Regier and F. C. J. M. van Veggel,
J. Phys. Chem. C, 2011, 115, 15950–15958.33 J. Liu, J. Electron Microsc., 2005, 54, 251–278.34 R. Pantel and G. Servanton, in Transmission Electron Micro-
scopy in Micro-Nanoelectronics, ed. A. Claverie and M. Mouis,John Wiley & Sons, Inc., 2012, pp. 37–64.
35 G. Scappucci, W. M. Klesse, L. A. Yeoh, D. J. Carter,O. Warschkow, N. A. Marks, D. L. Jaeger, G. Capellini,M. Y. Simmons and A. R. Hamilton, Sci. Rep., 2015, 5, 12948.
36 C. P. Poole and H. A. Farach, Bull. Magn. Reson., 1979, 1,162–194.
37 S. Sen and J. F. Stebbins, J. Non-Cryst. Solids, 1995, 188,54–62.
38 R.-A. Eichel, J. Am. Ceram. Soc., 2008, 91, 691–701.39 N. Bloembergen, Physica, 1949, 15, 386–426.40 P.-G. de Gennes, J. Phys. Chem. Solids, 1958, 7, 345–350.41 W. W. Simmons, W. J. O’Sullivan and W. A. Robinson, Phys.
Rev., 1962, 127, 1168–1178.42 H. E. Rorschach Jr., Physica, 1964, 30, 38–48.43 C. D. Jeffries, Proc. Phys. Soc., 1966, 88, 257–258.44 G. R. Khutsishvili, Phys.-Usp., 1966, 8, 743–769.45 I. J. Lowe and S. Gade, Phys. Rev., 1967, 156, 817–825.46 I. J. Lowe and D. Tse, Phys. Rev., 1968, 166, 279–291.
PCCP Paper
This journal is© the Owner Societies 2016 Phys. Chem. Chem. Phys., 2016, 18, 9752--9757 | 9757
47 G. R. Khutsishvili, Phys.-Usp., 1969, 11, 802–815.48 M. Punkkinen, Phys. Kondens. Mater., 1971, 13, 79–88.49 E. F. W. Seymour and C. A. Sholl, J. Phys. C: Solid State Phys.,
1985, 18, 4521–4537.50 G. B. Furman, E. M. Kunoff, S. D. Goren, V. Pasquier and
D. Tinet, Solid State Nucl. Magn. Reson., 1995, 4, 255–258.51 G. B. Furman, E. M. Kunoff, S. D. Goren, V. Pasquier and
D. Tinet, Phys. Rev. B: Condens. Matter Mater. Phys., 1995, 52,10182–10187.
52 G. B. Furman, A. M. Panich, A. Yochelis, E. M. Kunoff andS. D. Goren, Phys. Rev. B: Condens. Matter Mater. Phys., 1997,55, 439–444.
53 S. Maron, G. Dantelle, T. Gacoin and F. Devreux, Phys.Chem. Chem. Phys., 2014, 16, 18788–18798.
54 M. Punkkinen, Phys. Kondens. Mater., 1971, 13, 79–88.55 P. Bernier, H. Launois and H. Alloul, J. Phys., Colloq., 1971,
32, C1-513–C1-515.56 B. Giovannini, P. Pincus, G. Gladstone and A. J. Heeger,
J. Phys., Colloq., 1971, 32, C1-163–C1-171.57 H. Eckert, J. P. Yesinowski, L. A. Silver and E. M. Stolper,
J. Phys. Chem., 1988, 92, 2055–2064.
58 G. Aromı, M. J. Knapp, J.-P. Claude, J. C. Huffman,D. N. Hendrickson and G. Christou, J. Am. Chem. Soc.,1999, 121, 5489–5499.
59 S. E. Butcher, F. H.-T. Allain and J. Feigon, Biochemistry,2000, 39, 2174–2182.
60 Y. J. Lee and C. P. Grey, J. Phys. Chem. B, 2002, 106,3576–3582.
61 Y. J. Lee, S.-H. Park, C. Eng, J. B. Parise and C. P. Grey,Chem. Mater., 2002, 14, 194–205.
62 R. Hahn, N. Kunkel, C. Hein, R. Kautenburger andH. Kohlmann, RSC Adv., 2015, 5, 9722–9726.
63 R. K. Harris and E. D. Becker, J. Magn. Reson., 2002, 156,323–326.
64 Y. S. Avadhut, D. Schneider and J. Schmedt auf der Gunne,J. Magn. Reson., 2009, 201, 1–6.
65 N. Kunkel, H. Kohlmann, A. Sayede and M. Springborg,Inorg. Chem., 2011, 50, 5873–5875.
66 K. Yvon, H. Kohlmann and B. Bertheville, Chim. Int. J. Chem.,2001, 55, 505–509.
67 T. J. Schmugge and C. D. Jeffries, Phys. Rev., 1965, 138,A1785–A1801.
Paper PCCP