homeownership and rental: what road is ireland...
TRANSCRIPT

Homeownership and Rental: What Road is Ireland On?
No. 140 December 2014

National Economic and Social Council
Constitution and Terms of Reference
1. The main tasks of the National Economic and Social Council shall be to analyse
and report on strategic issues relating to the efficient development of the
economy and the achievement of social justice.
2. The Council may consider such matters either on its own initiative or at the
request of the Government.
3. Any reports which the Council may produce shall be submitted to the
Government, and shall be laid before each House of the Oireachtas and
published.
4. The membership of the Council shall comprise a Chairperson appointed by the
Government in consultation with the interests represented on the Council, and
Four persons nominated by agricultural and farming organisations;
Four persons nominated by business and employers’ organisations;
Four persons nominated by the Irish Congress of Trade Unions;
Four persons nominated by community and voluntary organisations;
Four persons nominated by environment organisations;
Twelve other persons nominated by the Government, including the
Secretaries General of the Department of Finance, the Department of Jobs,
Enterprise and Innovation, the Department of Environment, Community
and Local Government, the Department of Education and Skills.
5. Any other Government Department shall have the right of audience at Council
meetings if warranted by the Council’s agenda, subject to the right of the
Chairperson to regulate the numbers attending.
6. The term of office of members shall be for three years. Casual vacancies shall
be filled by the Government or by the nominating body as appropriate.
Members filling casual vacancies may hold office until the expiry of the other
members’ current term of office.
7. The numbers, remuneration and conditions of service of staff are subject to the
approval of the Taoiseach.
8. The Council shall regulate its own procedure.

Homeownership and Rental: What Road is Ireland On?
No. 140 December 2014

ii
Membership of the National Economic and Social Council
Chairperson Mr Martin Fraser, Secretary General, Department of the Taoiseach and Secretary General to the Government
Deputy Chairperson Mr John Shaw Assistant Secretary, Department of the Taoiseach
Government Nominees Prof Mary Daly, University of Oxford
Prof Anna Davies, Trinity College Dublin
Prof John McHale, NUI, Galway
Prof Edgar Morgenroth, ESRI
Dr Michelle Norris, UCD Geary Institute
Prof Seán Ó Riain, NUI, Maynooth
Dr Michael O’Sullivan, Credit Suisse
Ms Mary Walsh, Chartered Accountant
Mr Derek Moran, Department of Finance
Mr John Murphy, Department of Jobs, Enterprise and Innovation
Mr John McCarthy, Department of Environment, Community and Local Government
Mr Seán Ó Foghlú, Department of Education and Skills
Business and Employers Mr Danny McCoy, IBEC
Mr Tom Parlon, Construction Industry Federation
Mr Ian Talbot, Chambers Ireland
Mr Tony Donohoe, IBEC
Trade Unions Mr David Begg, ICTU
Ms Sally Anne Kinahan, ICTU
Mr Manus O'Riordan, SIPTU
Mr Shay Cody, IMPACT
Farming and Agricultural Mr Edmond Connolly, Macra na Féirme
Mr Pat Smith, IFA
Mr Seamus O'Donohoe, ICOS
Mr Frank Allen, ICMSA
Community and Voluntary Fr Seán Healy, Social Justice Ireland
Ms Brid O'Brien, Irish National Organisation of the Unemployed
Mr James Doorley, National Youth Council of Ireland
Ms Karen Murphy, Irish Council for Social Housing
Environmental Mr Oisín Coghlan, Friends of the Earth Ireland
Mr Michael Ewing, Environmental Pillar
Ms Karin Dubsky, Environmental Pillar
Ms Siobhán Egan, Environmental Pillar
Secretariat to Project Dr Rory O’Donnell Director
Mr Noel Cahill, Economist
Dr Anne Marie McGauran, Policy Analyst
A full list of the NESC Secretariat can be found at www.nesc.ie

iii
Table of Contents
Executive Summary viii
Chapter 1 Introduction 1
Chapter 2 Household Tenure in Ireland 5
2.1 Introduction 6
2.2 Household Tenure 1946–2011 6
2.3 Factors Driving Recent Changes in Tenure Mix 9
2.4 Tenure and Age 10
2.5 Tenure and Social Class 13
2.6 Tenure and Household Type 17
2.7 Geographical Patterns 19
2.8 Tenure and Nationality 20
2.9 Ownership of More than One Property 21
2.10 Tenure in a Comparative Context 23
2.11 Affordability 23
2.12 Likely Future Trends 32
Chapter 3 Understanding Ireland’s Evolving Tenure Mix 33
3.1 Introduction 34
3.2 The Role of Government Policy and Credit Conditions 34
3.3 Where Are We Now: Stability or Change in the Role
of Owner-Occupation? 39
Chapter 4 Explore Aspirations, Advantages and Possibilities for Homeownership and Rental 43
4.1 The Relative Advantages of Homeownership and Renting 45
4.2 Towards an Understanding of Policy Possibilities for
Homeownership and Rental 55
4.3 Summary of Discussion on Policy Options for the Future 61
Bibliography 63

iv
List of Tables
Table 2.1: Breakdown of Permanent Private Households by Tenure, 1946–2011 7
Table 2.2: Estimated Percentage of all Private Households in State-supported
or Privately Paid Accommodation, 2002–2011 8
Table 2.3: Headship Rates by Age Cohort, 1966–2011 (%) 11
Table 2.4: Occupancy of Heads of Household (all Private Households) by Age
Group (%), 2011 11
Table 2.5: Occupancy of Heads of Household (all Private Households) by Age
Group (%), 1991 12
Table 2.6: Percentage of Heads of Households (all Private Households) Aged
35–44, and Over-65, who are Owner Occupiers, by Social Class and
Census year, 1991–2011 14
Table 2.7: Percentage of Owner-Occupied Households in Urban and
Rural Areas, 1991–2011 19
Table 2.8: Percentage of Population in Owner-occupation in European
Countries, 1996–2012 24
List of Figures
Figure 2.1: Proportion of Household Heads (all Private Households) in Each Age
Group that Own, and Rent Privately, 1991, 2002, 2006 and 2011 13
Figure 2.2: Gap between Percentage of Heads of Household (all Private
Households) Aged Over 65 Who Own, and Heads of Households
Aged 35–44 Who Own, 1991–2011 15
Figure 2.3: Percentage of Heads of Household (all Private Households)
with a Mortgage, by Household Type, 2002–2011 18
Figure 2.4: Percentage of Heads of All Private Households Renting from a
Private or AHB Landlord, by Household Type, 2002–2011 18
Figure 2.5: Changes in Occupancy of Permanent Private Households,
Irish and 'Other' Nationality, 2006–2011 22
Figure 2.6: Ratio of New House Prices to Average Gross Industrial
Earnings, Ireland, 1994–2013 25
Figure 2.7: Mortgage Repayments as a Percentage of Net Income (two earners) 26

v
Figure 2.8: Average Weekly Household Disposable Income of Each
Household Tenure Type, as a Percentage of Average Income 28
Figure 2.9: Weekly Rent or Mortgage Expenditure as a Percentage of Total
Household Expenditure (by Household Tenure) 29
Figure 4.1: National House Prices in Nominal and Real Terms, 1974–2013, 48
Figure 4.2: Spectrum of Possible ‘Ownership’ Models 59
List of Boxes
Box 3.1: Government Support for Homeownership—Selected Countries 38

vi
Abbreviations
AHB
Approved Housing
Bodies
CALF
Capital Advance
Leasing Facility
CAS
Capital Assistance
Scheme
CLSS
Capital Loan and
Subsidy Scheme
CPI
Consumer Price Index
CSO
Central Statistics
Office
DECLG
Department of the
Environment,
Community and Local
Government
DEHLG
Department of
Environment, Heritage
and Local Government
(pre 2010)
ECHP
European Community
Household Panel
EU
European Union
LA
Local Authority
LTV
Loan-to-value
LTI
Loan-to-income
PDH
Principal Dwelling
Home
PTRB
Private Residential
Tenancies Board
RAS
Rental
Accommodation
Scheme
SILC
Survey on Income and
Living Conditions
NAMA
National Asset
Management Agency
NESC
National Economic
and Social Council

vii
Acknowledgements
The Council wishes to acknowledge the assistance of several people and
organisations in the preparation of this report. We would like to thank the CSO for
providing special runs of earnings data, and of Census data on tenure from 1991,
2002, 2006 and 2011. We would also like to thank the following for their time and
expertise: staff of NAMA; the Department of the Environment, Community and
Local Government; South Dublin County Council; Mr Karl Deeter of Irish Mortgage
Brokers; and Dr Ronan Lyons of Trinity College Dublin.

EXECUTIVE SUMMARY viii
Executive Summary

EXECUTIVE SUMMARY ix
This is the second report to emerge from NESC’s current programme of work on
housing policy. It looks at the evolving balance between homeownership and rental
accommodation, discusses likely trends and raises policy issues that need to be
discussed.
Tenure of Irish Households
Ireland’s rate of homeownership peaked, at 80 per cent of households, in 1991,
with private rental accounting for 8 per cent and social renting for 10 per cent. By
2011, owner-occupation had fallen to 71 per cent, while 19 per cent of households
rented from a private landlord, and 9 per cent rented from a local authority or
voluntary association (known as Approved Housing Bodies—AHBs). In urban areas
almost one third of households now rent their dwelling (including social rental).
These changes can be related to changes in household formation, immigration,
incomes, house prices and access to credit, as well as the decline in local-authority
provision. Irish homeownership rates are now close to the EU averages (67 per cent
for the EU-15 and 71 per cent for the EU-28). However, in many EU countries
ownership rates are rising, while in Ireland they are falling.
Tenure varies significantly across social groups. Mortgage-holding is declining most
among young people in the unskilled, semi-skilled and skilled manual classes,
particularly the former. The proportion of single-person and lone-parent
households that rent has increased significantly over the past 20 years. Owner-
occupation is much higher among households headed by Irish nationals (77 per
cent) compared to non-Irish nationals (34 per cent). Having fallen during the
economic boom, the age at which people get a first mortgage is increasing.
Affordability pressures have always been greater in Dublin than the national
average, with Cork and Galway also relatively expensive. Housing costs weigh
differently on different households. Those renting from a private landlord pay the
highest proportion of their income on rent—an average of 25 per cent in 2009–10.
International comparisons show that Irish house prices (per square metre) are
about ‘average’ in the EU, similar to those in the Netherlands, Denmark, and
Belgium. Dublin prices are comparable to those in Amsterdam, Brussels and Lyon,
but well below those in Paris and London. The current increase in prices may
change this.
EXECUTIVE SUMMARY x
Understanding Ireland’s Evolving Tenure Mix
Government policy played a significant role in promoting a high level of
homeownership in earlier decades through subsidies such as local-authority loans
and mortgage interest relief. Tenant purchase was a particularly significant way in
which owner-occupation was encouraged. The falling share of ownership reflects
gradual removal of subsidies since the 1980s, and changing economic and social
conditions.
While the continuing high level of homeownership suggest, an element of stability,
for a range of economic and social groups—younger adults, newly setting up home,
seeking to live in or near the centres of employment and, most of all, those on low
incomes or in single-parent and single-earner households—housing conditions and
housing tenure choice are changing quite considerably. While homeownership was
traditionally high across the class spectrum, it seems likely that in the coming
decades housing options will differ more. Existing trends in availability,
affordability, incomes and household size suggest that those with lower incomes
and in single-adult households are less likely to have mortgages, and therefore be
on track to homeownership, than those from higher social classes.
The Relative Advantages of Homeownership and Renting
In setting the direction of future housing policy, it is important to consider the
advantages and disadvantages of different tenures. Private renting has the
advantage of low-entry costs, no investment risk, flexibility and no liability for major
repair bills. However, in Ireland private renting provides less security of tenure than
owing or renting from a local authority, and tenants are uncertain about future
rents that are market-determined. An important disadvantage is that the payment
of rental income does not help the renter accumulate an asset. This is a key
advantage of mortgage-holding—in a stable housing market. The main
disadvantage of homeownership is the investment risk that can occur when buying
in an unstable market, and exposure to rising interest rates. On balance, in the Irish
context there are real financial advantages to homeownership compared to renting.
But the advantages of homeownership depend on the alternatives available. In
many EU countries it is not necessary to buy a home to achieve security, and rental
from voluntary bodies or private landlords provides security of tenure and more
predictable rents.
Renting from a local authority or AHB has advantages in terms of both cost and
security of tenure. But provision has been limited for several decades and there are
long waiting lists. While most local-authority housing is successful, some estates
have failed and this has led some to have a negative image of social housing. With
the decline in local-authority construction, social renting has increasingly moved
from local authority-owned to private-sector accommodation, paid for by rent
supplement or the Rental Accommodation Scheme (RAS).

EXECUTIVE SUMMARY xi
Exploring Aspirations and Policy Possibilities for Homeownership and Renting
The overarching goals of housing policy are (i) affordability (ii) sustainability
(economic, social and environmental) and (iii) equality and social inclusion. It is
important to ask how different forms of housing tenure can serve these goals. The
trends in Ireland’s tenure mix and the relative advantages of homeownership and
rental, discussed in this report, pose some challenging questions that Irish housing
policy must now address.
Given the existing advantages of homeownership, does policy wish to promote it
or improve the availability and relative attractiveness of long-term rental?
Are these goals complementary or conflicting?
What is the feasibility of homeownership for different kinds of households in the
coming decades?
What supply-side, demand-side and other policy approaches are available to
promote either homeownership or secure rental occupancy?
What is the relationship between possible ways of promoting homeownership
and the policy approaches to social housing and cost rental advocated by the
Council in its June 2014 report and enunciated in the Government’s recent
budget statement and Social Housing Strategy?
However these questions are answered, policy needs to achieve four overarching
outcomes:
Stable and sustainable housing supply management;
Greater balance between the shares of homeownership and rental, to address
affordability problems and dampen housing-market and macroeconomic
instability;
Social support to address housing needs, which are conducive to good economic
performance, social cohesion and equality of opportunity; and
Affordable and sustainable housing options for intermediate households.
In exploring how to achieve these broad outcomes it is important to consider
possibilities for greater security of tenure in rental accommodation, cost rental and
shared ownership.

INTRODUCTION 1
Chapter 1 Introduction

INTRODUCTION 2
This is the second report to emerge from NESC’s current work on housing policy.
The first report, Social Housing at the Crossroads, focused on the most pressing
aspect of Ireland’s housing system. It identified severe problems in each of the
three channels of social housing provision: local-authority housing, provision by
voluntary associations (hereafter referred to as approved housing bodies or AHBs),
and social housing supports for eligible low-income tenants in the private rented
sector.
It recommended that policy must now create effective approaches on three fronts:
Financial mechanisms capable of funding the quantity and quality of housing we
require;
Policies to grow cost-rental1 provision that will gradually shape the overall rental
sector; and
Direct public-policy influence on housing supply and urban development.
These recommendations are reflected in important recent and ongoing policy
developments—Budget 2015 allocated €2.2bn for increased provision of social
housing by local authorities and AHBs.
As noted in the Council’s 2014 June report, a range of public bodies—such as key
Government departments, local authorities, NAMA, the Housing Finance Agency
and the European Investment Bank—are undertaking significant initiatives to
deliver off-balance-sheet funding for both new provision and refurbishment by both
local authorities and AHBs.
Further important policy developments are contained in the recently published
Social Housing Strategy.
1 Cost rental is defined as rental housing, irrespective of ownership, where the rents charged cover only the
actual incurred costs of the dwelling. This differs from profit rental, where the rent charged is what the market
will bear.

INTRODUCTION 3
This report takes a wider view of Ireland’s housing system. It argues that the goals
of housing policy should be:
Affordability;
Sustainability (economic, social and environmental); and
Equality and social inclusion.
In this context, the report is primarily an empirical study of Ireland’s changing
tenure mix rather than a set of policy recommendations from the Council. We
believe that an objective analysis of existing trends and the relative attractions of
homeownership and rental in the current housing system is an important prelude to
the formulation of strategic housing policy.
In Chapter 2 the evolving balance between homeownership and rental
accommodation in Ireland is documented and analysed, particularly over the last 20
years. It considers the affordability of housing, particularly owner-occupation. It also
looks at the prevalence of homeownership in Ireland relative to other European
countries. This empirical analysis provides a foundation for later discussion, of a
number of critical issues. The first is whether we are witnessing a permanent
reduction in the share of owner-occupation or merely the effects of the crisis and
associated blockages in the functioning of the housing market. A related issue is the
scope and degree of segmentation; regardless of the continuing significant share of
owner-occupation, will it be the case that in the coming decades many households
will have little chance of buying their own home and will effectively reside in either
the private rental sector or social housing of some kind? A third issue concerns
Ireland’s housing and housing tenure mix in an international context.
Chapter 3 draws on this analysis to reflect on the evolving tenure mix. It highlights
the strong role of public policy—particularly mortgage-interest tax relief and tenant
purchase—in giving Ireland one of the highest rates of homeownership in earlier
decades. It notes that national data can suggest a significant degree of stability in
tenure mix—with continuing high levels of both outright ownership and mortgages.
But it suggests that this conceals significant change at a more fine-grained level.
While it is difficult to extrapolate future trends from the period 2006–2011, which
was unusual in many respects, there is reason to believe that a range of social
groups—particularly those of low-income, single-earner and single-person
households and lone parents—will find it difficult if not impossible to achieve
homeownership in the decades ahead.
The final chapter considers the relative advantages and disadvantages of
homeownership and other tenures, before suggesting that current trends pose
some stark questions for Irish society and public policy. Among these are:
Given the existing advantages of homeownership, does policy wish to promote it
or improve the availability and relative attractiveness of long-term rental?
Are these goals complementary or conflicting?
INTRODUCTION 4
What is the feasibility of homeownership for different kinds of households in the
coming decades?
What supply-side, demand-side and other policy approaches are available to
promote either homeownership or secure rental occupancy?
What is the relation between possible ways of promoting homeownership and
the policy approaches to social housing and cost rental advocated by the Council
in its June 2014 report and enunciated in the Government’s Social Housing
Strategy?
The Council argues that Ireland must now explore aspirations, possibilities and goals
for homeownership and rental as a long-term housing option. It notes that the
starting point of any discussion of future tenure mix and housing goals must be the
recognition of three basic facts:
(i) The general superiority of homeownership over rental for individual
households in Ireland, given limited security of tenure and the risk of
rent increases;
(ii) The instability of the kind of housing market that Ireland has developed,
which creates large societal costs and can qualify the advantages of
home purchase for individual households; and
(iii) The challenge of housing affordability that faces a significant share of
households—evident in both the hurdles to homeownership and the
difficulty of achieving secure occupancy in the rental sector—which can
exacerbate inequality and exclusion, and weaken social cohesion.
In exploring ways to deliver these broad policy requirements and goals, it is
necessary to consider not only all feasible supply-side and demand-side instruments
but also a range of ownership options and ownership rights.

HOUSEHOLD TENURE IN IRELAND 5
Chapter 2 Household Tenure in Ireland
HOUSEHOLD TENURE IN IRELAND 6
2.1 Introduction
This chapter examines the proportion of households living in different tenures in
Ireland since the mid-twentieth century, with a particular focus on the situation
since the early 2000s. Since 1991, when the rate of owner-occupation in Ireland
reached its height, there has been much change in tenure types, and this section
will outline the varied patterns that underlie the current national average. After
that, the affordability of Irish house purchase and renting will be outlined. Finally,
an assessment of what this data tells us will be provided.
2.2 Household Tenure 1946–2011
Household tenure in Ireland has changed since the mid-twentieth century, although
owner-occupation has been the predominant tenure throughout that period. As
outlined in Table 2.1, in 1946 over half (53 per cent) of households owned their
home, and owner-occupation continued to rise, to a peak of 80 per cent in 1991—
one of the highest rates of homeownership in Western Europe (Drudy, 2007).
Homeownership levels remained broadly stable for the subsequent decade, but fell
nearly three percentage points between 2002 and 2006, and by a further 6.5
percentage points between 2006 and 2011. This brings Ireland’s rate of owner-
occupation, at 71 per cent, closer to the EU-15 average of 67 per cent (in 2012).
In line with this, the tenure share of the rental sector had been falling for decades,
particularly private renting. However, the latter began to increase from the 1990s,
with the sharpest growth evident between 2006 and 2011.
HOUSEHOLD TENURE IN IRELAND 7
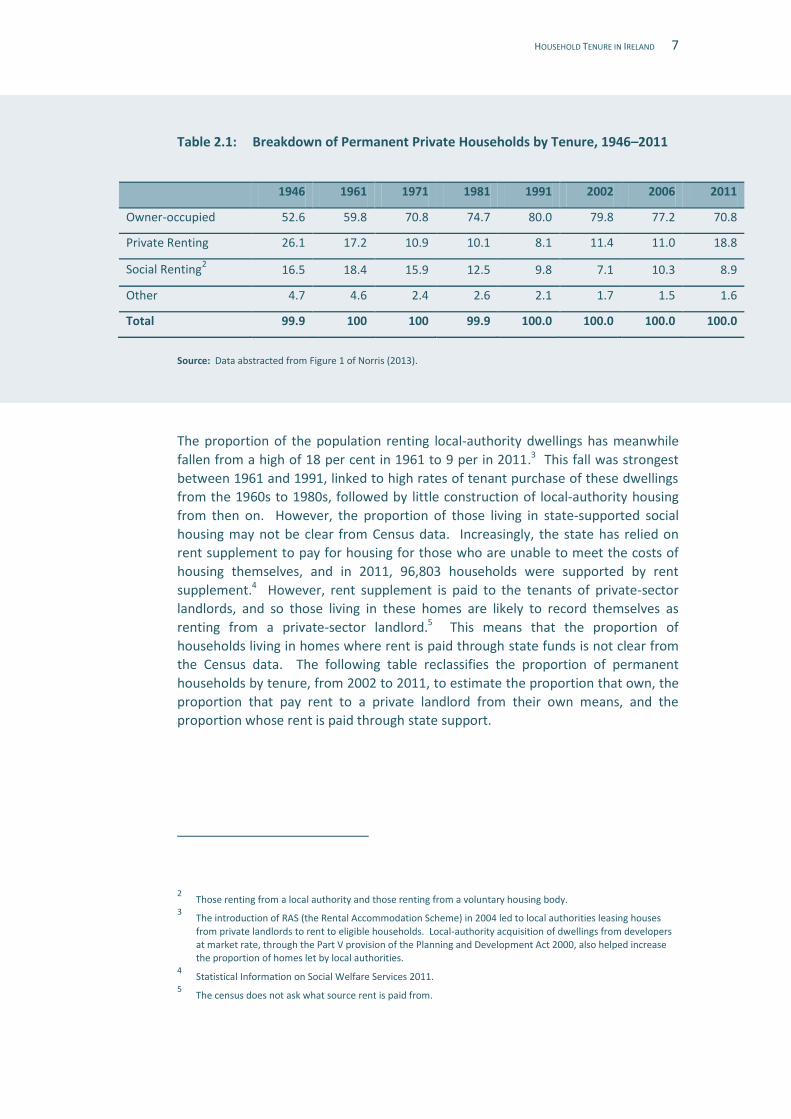
Table 2.1: Breakdown of Permanent Private Households by Tenure, 1946–2011
1946 1961 1971 1981 1991 2002 2006 2011
Owner-occupied 52.6 59.8 70.8 74.7 80.0 79.8 77.2 70.8
Private Renting 26.1 17.2 10.9 10.1 8.1 11.4 11.0 18.8
Social Renting2 16.5 18.4 15.9 12.5 9.8 7.1 10.3 8.9
Other 4.7 4.6 2.4 2.6 2.1 1.7 1.5 1.6
Total 99.9 100 100 99.9 100.0 100.0 100.0 100.0
Source: Data abstracted from Figure 1 of Norris (2013).
The proportion of the population renting local-authority dwellings has meanwhile
fallen from a high of 18 per cent in 1961 to 9 per in 2011.3 This fall was strongest
between 1961 and 1991, linked to high rates of tenant purchase of these dwellings
from the 1960s to 1980s, followed by little construction of local-authority housing
from then on. However, the proportion of those living in state-supported social
housing may not be clear from Census data. Increasingly, the state has relied on
rent supplement to pay for housing for those who are unable to meet the costs of
housing themselves, and in 2011, 96,803 households were supported by rent
supplement.4 However, rent supplement is paid to the tenants of private-sector
landlords, and so those living in these homes are likely to record themselves as
renting from a private-sector landlord.5 This means that the proportion of
households living in homes where rent is paid through state funds is not clear from
the Census data. The following table reclassifies the proportion of permanent
households by tenure, from 2002 to 2011, to estimate the proportion that own, the
proportion that pay rent to a private landlord from their own means, and the
proportion whose rent is paid through state support.
2 Those renting from a local authority and those renting from a voluntary housing body.
3 The introduction of RAS (the Rental Accommodation Scheme) in 2004 led to local authorities leasing houses
from private landlords to rent to eligible households. Local-authority acquisition of dwellings from developers at market rate, through the Part V provision of the Planning and Development Act 2000, also helped increase the proportion of homes let by local authorities.
4 Statistical Information on Social Welfare Services 2011.
5 The census does not ask what source rent is paid from.

HOUSEHOLD TENURE IN IRELAND 8
Table 2.2: Estimated Percentage of all Private Households in State-supported or Privately Paid Accommodation, 2002–2011
2002 2006 2011
Living in owner-occupied accommodation 77.3 74.6 69.7
Living in privately paid rental accommodation6 8.7 9.4 15.7
Living in state-supported rental accommodation7 9.2 11.2 11.5
Other 4.8 4.8 3.1
Total 100 100 100
Source: See footnotes 6 and 7.
Table 2.2 shows that the proportion of households in owner-occupied housing is
falling, while those in private rental accommodation is rising, but it also shows the
proportion living in state-supported rental accommodation is higher than the un-
differentiated Census data shows. The proportion in state-supported
accommodation in 2011 seems in reality to be more similar to that pertaining in the
1980s and early 1990s, when the number of households in receipt of rent
supplement was much lower (28,800 in 1994 for example8).
Some households living in mortgaged homes in arrears may also be indirectly
supported by the state, at least to some degree. At the end of June 2011, over
55,000 residential mortgages were in arrears for more than 90 days (Central Bank of
Ireland, 2011). Few have been repossessed by banks. At the end of 2011, 18,988
households were receiving mortgage-interest supplement payments, which are paid
6 This is the proportion of all households renting from a private landlord, minus those on rent supplement for
over 12 months. The latter figure is available for Census years 2002, 2006 and 2011 (from Statistical Information on Social Welfare Services for these years), and gives an indication of the number who are
becoming long-term dependent on state-supported housing. 7 The proportion of all households renting from a local authority, plus those on rent supplement for 12+ months,
plus those renting accommodation from a housing association. The housing association data for 2002 (when renting from a voluntary landlord was not included in the Census questions) has been sourced from Department of Environment, Community and Local Government online social and affordable housing statistics
(found in a number of Excel files which can be accessed from this at http://www.environ.ie/en/Publications/StatisticsandRegularPublications/HousingStatistics/. This information is regularly updated and so it is not possible to provide a web link to a particular tab of Excel files. Instead
readers can search through the tabs in these files to find the particular figures they are interested in) on dwellings built with the Capital Assistance Scheme (CAS) and Capital Loan and Subsidy Scheme (CLSS), with an addition of 2,000 dwellings, as this number was owned by housing associations before CAS and CLSS were
established. 8 See Norris et al., 2008. They note that comprehensive data on rent supplement is not available for the period
before 1994.

HOUSEHOLD TENURE IN IRELAND 9
to certain households who no longer have the means to pay their mortgage
repayments.9
2.3 Factors Driving Recent Changes in Tenure Mix
Clearly there has been significant change in the proportion of Irish households
renting privately and living in owner-occupied housing from 1991 on. This can be
related to important changes in the Irish economy and society. From the late 1990s
to 2002, the economy grew significantly, as did employment, population and
incomes, particularly in large urban areas. There was high immigration, and the
proportion of women in the workforce almost doubled.10 With many young people
in the population, new household formation also grew. These changes had an
impact on the housing market and tenure mix. There was a shortage of housing
supply, particularly in urban areas, and this, linked with income growth, more dual-
income couples and freer access to credit, led to increased house prices. While
many young people bought houses, a growing proportion of young people, and
most immigrants to Ireland, also chose to rent. This was facilitated by Government
schemes to increase the supply of property built to rent. It is not surprising,
therefore, that Census 2006 shows an increase in the proportion renting privately,
and a decline in the proportion living in owner-occupied dwellings.
Significant changes are also evident between 2006 and 2011. However, this period
is unusual given the scale of the economic crisis. After reaching a peak of growth
and employment in 2007, the economy contracted and unemployment increased
sharply. The housing market followed a similar pattern. Purchase prices reached a
peak in the third quarter of 2007, but then fell precipitously. By the end of the
second quarter of 2011, house prices nationally had fallen by 47 per cent, and in
Dublin by over 50 per cent, since mid-2007 (Daft.ie, 2011a). Rents had also fallen
continuously from early 2008 to April 2011 (Daft.ie, 2011b). In this context it is
hardly surprising that the proportion of the population renting privately had grown
significantly, and that the rate of owner-occupation had fallen. Younger people
who had not already bought houses would have seen little reason to buy, and many
reasons not to, with not only low rents and falling house prices, but also the
knowledge that many of those slightly older than them were in serious negative
equity. Access to credit was also reduced, as were secure incomes, due to the rise
in unemployment. And renting had become a more attractive proposition since
2004 legislation improved security of tenure for tenants. Older people who had
sold would have been likely to postpone purchasing for the same reasons.
To assess change in tenures, and to try to ascertain if the recent changes are likely
to be permanent, NESC has analysed data on the tenure of heads of households in
9 Statistical Information on Social Welfare Service 2011.
10 It increased by 83 per cent between 1995 and 2006, according to Kavanagh, (2007).
HOUSEHOLD TENURE IN IRELAND 10
Censii 1991, 2002, 2006 and 2011, which has been made available by the CSO. Key
findings from this analysis are outlined in the following sections, looking at
variations by age, social class, household type, geography and nationality.
2.4 Tenure and Age
Norris and Winston (2013) show that headship rates (that is, the percentage of all
people in an age group who are household heads—whether renting or owning)
among younger people in Ireland have increased almost constantly since the 1960s,
in line with access to housing, the labour market and education.11 Greater access to
these has contributed to more young people being able to establish their own
households, rather than live with parents, other relatives or friends.
In the 1960s and 1970s, this growth was assisted by high public expenditure on
social housing, high wage growth and inflation, which led to falling mortgage debt,
and Government supports for private homeownership. In the 1980s and early
1990s, there was a slight fall in the headship rate for those aged under 25, in
particular, in line with the fall in employment among young people and the decline
in social housing output. From the late 1990s to the mid-2000s, headship rates
grew once more among those under 30, linked to the economic growth and other
factors outlined earlier.
Census 2011 shows a slight decline in headship rates among those aged under 25.
The proportion of all young people12 living in non-family households (flat-shares
etc.) had fallen from 22 to 18 per cent (CSO, 2012a), and the percentage living at
home with their parents had increased from 59 per cent in 2006 to 66 per cent in
2011. These changes can be related to falling employment and rising
unemployment among those under 25, who have been particularly badly affected
by the unemployment crisis. For those who had not purchased homes, credit is less
available, and in a falling market there was little incentive to purchase. Meanwhile,
headship rates for older households have increased (see Table 2.3), including for the
25–34 age group, as outlined below.
It is also interesting to look at the type of tenure in which younger and older people
are living. Table 2.4 shows that in 2011, heads of household aged under 24 were
most likely to rent, while those aged 35–44 were most likely to have a mortgage,
and those over 55 most likely to own.
11 Headship rates for younger adults are lower in Ireland than in other EU countries. This may reflect higher costs
for establishing an independent household in Ireland, the tradition for third-level students to live with their parents in Ireland, etc. See Duffy et al., 2014.
12 Not just young people who are head of a household.

HOUSEHOLD TENURE IN IRELAND 11
Table 2.3: Headship Rates by Age Cohort, 1966–2011 (%)
Age Cohort 1966 1971 1979 1981 1991 2002 2006 2011
20-24 6.8 9.4 15 15.8 14 18.9 19.3 18.5
25-29 31 33.8 31.3 32.5 29.8 31.2 33.8 35.3
30-34
40.1 41.7 42.8 42.9 45 46.8
35-39
43.3 45.2 47.6 47.8 49.2 50.9
40-44
45.7 47 49.6 50.8 51.3 53.0
45-64 51.1 51.3 52.2 53 54.8 54.2 55.3 56.1
65+ 45.7 55.2 59 57.4 61.1 61.9 62.6 62.9
Source: Norris & Winston, 2013; Census 2011 (NESC calculations), based on figures from CSO (2012a & 2012b).
Table 2.4: Occupancy of Heads of Household (all Private Households) by Age Group (%), 201113
Own outright Own with a mortgage
Renting from private landlord
Renting from local authority
0–24 3.3 5.8 74.2 9.4
25–34 3 39.3 44.3 8.7
35–44 9.1 59.8 19.4 8.4
45–54 29.6 49 10.3 8.2
55–64 58.4 24.8 5.3 8.0
Over 65 81.3 5.3 2.5 5.8
Source: NESC analysis of CSO special run on Census 2011.
13 The figures in each row do not sum to 100 as data on those renting from a voluntary agency, or living rent-free,
were not included. For those aged under 24, these represent 7 per cent of tenures, and for all other groups, 5
per cent or less.

HOUSEHOLD TENURE IN IRELAND 12
There has been some change in these patterns since 1991, as comparison with
Table 2.5 shows. For example, although renting from a private landlord is the
preferred tenure of heads of households under 24 years of age in both years, the
proportion that rent has increased significantly since 1991. The proportion of heads
of households over 65 years of age who own outright has also increased
significantly in those 20 years. And the age when the majority of heads of
household first have a mortgage has moved from 25–34, to 35–44.
Table 2.5: Occupancy of Heads of Household (all Private Households) by Age Group (%), 1991
1991 Own outright
Own with a mortgage
*
Renting from private
landlord
Renting from local authority
0–24 6.2 15.8 56.8 12.8
25–34 9.1 59.3 15.3 12.4
35–44 19 63.2 5.2 10.2
45–54 35.9 45.9 3.3 8.4
55–64 56.8 27.9 3 8.4
Over 65 69.1 13.1 4.1 8.3
Source: NESC analysis of CSO special run on Census 1991.
Note: *This includes those purchasing from a local authority.
There has been a widening gap between 1991 and 2011 in the proportion of heads
of household in each age group who rent and who own, although it is smaller in
older age groups, as outlined in Figure 2.1. It is most evident in the 25–34 and 35–
44 age groups, with the proportion who own declining in each census, while the
proportion renting from a private landlord increases.
This data all suggests that younger age groups are buying at an older age. Although
this pattern is most evident when comparing 2006 to 2011, the data shows that the
trend has been evident since 1991.

HOUSEHOLD TENURE IN IRELAND 13
Figure 2.1: Proportion of Household Heads (all Private Households) in Each Age Group that Own*, and Rent Privately^, 1991, 2002, 2006 and 2011
Source: NESC analysis of CSO special run on Censii 1991, 2002, 2006 and 2011.
Note: *All owing outright, and those buying from the local authority, and those buying with a mortgage.
^2006 and 2011 includes those renting from an AHB
2.5 Tenure and Social Class
Historically, Ireland is unusual in having a high level of homeownership among all
classes, facilitated by tenant purchase of local-authority housing, which was heavily
subsidised by the state, part of what Tony Fahey terms ‘asset-based welfare’.14
Take-up of tenant purchase was highest from the mid-1970s, and by 2000, 70 per
cent of households with incomes in the lowest quintile were homeowners, not that
much different to the 90 per cent of households in the top income quintile (Norris &
Fahey, 2011: 459–69). However, with the sharp decline in local-authority housing
construction and other supports for low-income buyers from the mid-1980s, this
option is no longer available for many younger people in socio-economic groups
with lower incomes. This can be seen in the Census data for different social classes,
from 1991 on. Table 2.6 compares the proportion of heads of household over 65
14 See Fahey, 2002 and Norris & Fahey, 2011.
0
10
20
30
40
50
60
70
80
0-24 25-34 35-44 45-54 55-64 Over 65
Renters
1991 2002 2006 2011
0
10
20
30
40
50
60
70
80
90
0-24 25-34 35-44 45-54 55-64 Over 65
Owners
1991 2002 2006 2011

HOUSEHOLD TENURE IN IRELAND 14
years of age that own to the proportion of heads of households aged 35–44 that
own,15 by social class and age group, for the 1991–2011 period.
In all years, heads of households aged 35–44 were the age group most likely to have
a mortgage, and so looking at this group provides a good indicator of the rate of
ownership in future years.
Table 2.6 shows that, overall, the proportion of heads of household over-65 years of
age that own has been increasing gradually up to 2011, but the proportion of heads
of households aged 35–44 that own has been decreasing.
Table 2.6: Percentage of Heads of Households (all Private Households) Aged 35–44, and Over-65, who are Owner Occupiers,16 by Social Class and Census year, 1991–2011
Source: Special run of Censii 1991, 2002, 2006 and 2011, made available to NESC by the CSO. Note: *1991 figures here include unknown.
15 Ownership is calculated by adding the proportion of heads of household who own outright, with the proportion
with a mortgage, and with a local-authority loan. 16
Owner occupiers are outright owners, purchasing with a private loan or mortgage, and/or purchasing from a
local authority.
Year Age Group (year-olds)
Profess-ional
workers
Manager-ial &
technical
Non-manual
Skilled manual
Semi-skilled
Unskilled All others gainfully
occupied*
Total
1991 35–44 91.0 90.5 88.0 84.8 77.1 64.9 51.7 82.1
1991 Over–65 88.7 89.2 87.2 85.0 80.2 72.7 80.0 82.2
2002 35–44 83.6 87.6 85.2 83.9 77.1 65.5 53.8 79.9
2002 Over–65 88.9 93.0 90.3 87.8 85.5 80.5 81.9 85.9
2006 35–44 84.0 86.3 81.9 79.2 71.9 57.7 43.5 75.9
2006 Over–65 87.7 92.7 91.0 88.1 85.1 79.6 81.1 86.5
2011 35–44 80.0 80.9 75.2 71.3 63.8 49.0 31.7 68.8
2011 Over–65 89.4 92.5 90.7 87.7 85.1 78.5 81.8 86.6

HOUSEHOLD TENURE IN IRELAND 15
Figure 2.2 shows the gap between the proportion of over-65-year-olds that own,
and the proportion of heads of households aged 35–44 that own, by social class,
between 1991 and 2011. A positive figure in the diagram indicates a greater
proportion of 35–44-year-olds than over-65-year-olds are owner occupiers, as in
1991, when 35–44-year-olds in the top four social classes were more likely to be
owner-occupiers than the over-65-year-olds in these classes. However, with owner-
occupation declining, it is not surprising the graph shows mostly negative figures,
with the proportion of heads of households aged 35–44 that own declining relative
to the proportion of over 65 year olds who own.
The graph also shows that the gap between the proportion of heads of households
aged 35–44 that own, relative to heads of households over 65 years of age that
own, is largest for the semi-skilled, unskilled and other social classes, reflecting the
fact that much less 35–44-year-olds are buying in these groups compared to their
older peers. The gap between heads of households aged 35–44 who own in the
semi-skilled, unskilled and other social classes has also increased over time in
comparison to the ownership levels of their 35–44-year-olds peers in other social
classes. The raw data shows that, for example, in 1991, 65 per cent of 35–44-year-
old unskilled heads of household were owner-occupiers, but in 2011 this figure was
49 per cent, a fall of 16 percentage points. For professional heads of households
aged 35–44, the fall was 11 percentage points, from 91 per cent to 80 per cent.
Figure 2.2: Gap between Percentage of Heads of Household (all Private Households) Aged Over 65 Who Own*, and Heads of Households Aged 35–44 Who Own, 1991–2011
Source: Special run of Censii 1991, 2002, 2006 and 2011, made available to NESC by the CSO. Note: *All who own outright, plus those purchasing from a local authority (LA) and with a mortgage.
-60.0
-50.0
-40.0
-30.0
-20.0
-10.0
0.0
10.0
1991
2002
2006
2011

HOUSEHOLD TENURE IN IRELAND 16
As we discuss later, this suggests that in future the rate of outright ownership
among the semi-skilled, unskilled and other social groups is likely to be much lower
than the rate for those in the professional, technical/managerial and non-manual
classes, unlike the current situation.
Analysis of census data shows that the proportion of those who purchased through
local-authority tenant-purchase schemes was highest in the unskilled, semi-skilled
and skilled manual classes. In 1991, between 9 and 13 per cent of heads of
households in these groups were purchasing from a local authority. By 2006, these
figures had dropped to between 3 and 4 per cent;17 and in 2011 the figures were
not collected, but would have dropped further. It is these social classes that show
most change in tenure type over the past 20 years, as both local-authority rental
accommodation and local-authority tenant purchase declined. The response of
households in each social class varied. In the unskilled households, a decline of 20
percentage points in the proportion of those living in local-authority
accommodation between 1991 and 2011 was matched by an increase of 17
percentage points in the proportion living in privately rented accommodation.
Among the semi-skilled, there was a decrease of 13 percentage points in the
proportion living in local-authority accommodation, but an increase of 14 per cent
in those in private rental accommodation, as well as an increase of 5 per cent in
those with mortgages. In the semi-skilled class, a similar pattern of declining local-
authority accommodation, matched with an increase in both mortgages and private
rental, was also evident.
Further data suggests that the number owning outright is likely to be lower in 20–30
years time than it is currently. In 2011, 3.4 per cent of all private households
headed by a person aged over 65 were in rented properties (properties rented
either from a private landlord or an AHB). But 20 per cent of households headed by
a 35–44-year-old were renting, and 11 per cent of households headed by 45–54-
year-olds. The proportion of households renting privately was also highest for the
semi-skilled, unskilled, others, and not-stated social class groups.18 Although these
figures may fall somewhat as rents increase, ownership will still remain difficult for
those with lower incomes and precarious employment. This suggests that in future
a larger proportion of older people will need to pay housing costs in retirement, as
fewer will have outright ownership of the properties in which they live. As most of
these older people are likely to be in the less well-off social classes, this could mean
larger costs for the state if it needs to support pensioners on low incomes to pay
their housing costs.
17 All data cited in these paragraphs is from the special run of occupancy data from Census 1991–2011, which was
supplied to NESC by the CSO. 18
The proportion of all heads of household renting in these classes was 22, 21, 25 and 36 per cent respectively.
The national average was 19 per cent.

HOUSEHOLD TENURE IN IRELAND 17
It is possible that inheritance from their parents’ homes may help some in the less
well-off social classes to purchase a home later in life. However, such a home is
likely to be of less value than the homes of the parents of those in higher social
classes, and so may not have a strong influence on the overall pattern of owner-
occupation.
2.6 Tenure and Household Type
Another key dimension is the way in which tenure mix varies for different
household types. As Figure 2.3 and 2.4 overleaf show, between 2002 and 2006,
couples without children and one-person households increased their mortgage-
holding to some extent, but between 2006–2011 mortgage-holding among all
household types fell.19 At all times, the proportion of lone parents and one-person
households with a mortgage was low, between 20 and 30 per cent.
There was an increase in the proportion of all household types renting privately
throughout this period, but particularly from 2006 to 2011.
Households made up of couples with children showed the least change in tenure
type from 2002 to 2011. Almost 60 per cent of these households were living in a
home with a mortgage in all Census years, and proportionally there was a small
relatively small move from accommodation with a mortgage to the private rented
sector. This may reflect the fact that most of these households are older and so
may have bought homes before the extreme volatility in the housing market from
2005 on. It may reflect a desire by families with children to live in owner-occupied
housing at this stage of their lives. As will be outlined later, this tenure offers the
strongest security.
Lone-parent households have meanwhile shown a steady decline, since 2002, in the
proportion with a mortgage. Instead there has been a strong increase in the
proportion who rent privately, and some increase in the proportion who rent from a
local authority. Over 20 per cent of one-parent households now rent from a local
authority.
Outright ownership is not shown in the graphs here, but the remainder of the
households are outright owners of their homes. Outright ownership is
concentrated among older age groups, with approximately 75 per cent of outright
owners aged over 55 in 2011.
19 These tables do not include tenure of households made up of a related family and other unrelated persons.
Such households accounted for 12 per cent of all households in 2011.

HOUSEHOLD TENURE IN IRELAND 18
Figure 2.3: Percentage of Heads of Household (all Private Households) with a Mortgage, by Household Type, 2002–2011
Source: CSO special run.
Figure 2.4: Percentage of Heads of All Private Households Renting from a Private or AHB Landlord, by Household Type, 2002–2011
Source: CSO special run. Note: This includes those renting from an AHB.
0.0
10.0
20.0
30.0
40.0
50.0
60.0
70.0
2002 2006 2011
Couples with children
Couples without children
Lone parents
One person households
0.0
5.0
10.0
15.0
20.0
25.0
2002 2006 2011
One person households
Lone parents
Couples without children
Couples with children

HOUSEHOLD TENURE IN IRELAND 19
2.7 Geographical Patterns
Census data shows that in rural areas there has been little change in tenure from
the early 1970s onwards. Urban areas have, however, experienced variation in this,
with homeownership rates growing from 38 per cent in 1961 to a peak of 74 in
1991, with this persisting until 2002. Ownership in urban areas then declined to 70
per cent by 2006, which may reflect the strong growth in urban house prices in the
mid-2000s. Urban ownership then declined further to 62 per cent in 2011 (Table
2.7). Ownership among rural households also fell for the first time in fifteen years,
by three percentage points, between 2006 and 2011. It is likely that some of the
decline between 2006 and 2011 reflects consumers reacting to falling house
purchase and rental prices.
Table 2.7: Percentage of Owner-Occupied Households in Urban and Rural Areas, 1991–2011
1991 2002 2006 2011
Owner-occupied 80.0 79.8 77.2 70.8
Rural 88.8 88.7 88.2 85.1
Urban 73.1 74.0 70.4 61.6
Source: CSO (2012b).
There has been a corresponding increase in renting in urban areas, with the
proportion of households renting privately in Dublin increasing from 20 per cent in
2006 to 32 per cent in 2011 (National Transport Authority, 2013) and in Galway
from 19 per cent to 38 per cent (ibid.). Cork also has a high level of rented
accommodation.
Just under half of those living in a form of State-supported rental housing20 in 2011
were in Dublin (34 per cent of the total) and Cork (12 per cent of the total). Of the
eight counties with a higher than average proportion of the population in state-
supported rental housing, all but two (Waterford and Cork) were in Leinster.21
20 This is local-authority owned accommodation, and accommodation paid for by RAS and rent supplement. The
data is drawn from the Department of the Environment’s online social and affordable housing statistics (see
footnote 7 for further information on this resource), and from the Department of Social Protections’ Statistical Information on Social Welfare Services 2011.
21 The remaining six are Carlow, Dublin, Wexford, Longford, Wicklow and Louth.

HOUSEHOLD TENURE IN IRELAND 20
Returning to ownership, households that are owned outright are most likely to be in
western counties (Mayo, Roscommon, Kerry and Leitrim), while those with a
mortgage are most likely to be located in the east around the larger towns and
cities, in the ‘commuter belts’ of Meath, Kildare and Fingal (Gleeson, 2014). This is
likely to be linked to the availability of employment opportunities nearby, and lower
house prices than in the more central areas, as the commuter belts are popular with
young couples working in nearby cities, while the population of more peripheral
areas is older. Prices are also usually lower in more peripheral areas (where they
are not holiday locations), which assists outright ownership. Lower prices can be
related to lower incomes, as well as cheaper land and construction costs.
A further issue in the geography of Irish housing developments is the extent to
which one-off rural houses are favoured.22 In the early 2000s, approximately one-
third of Irish houses were one-off, but this had reduced to one-quarter in 2011.23
Altogether, one-sixth of all private dwellings built since 2001 were one-off houses.
One-off houses are predominantly located in rural counties, particularly in the west.
Sixty per cent of households in County Galway are in one-off houses, 54 per cent in
Roscommon and 50 per cent in Mayo (CSO, 2012b). These houses are often
cheaper than those built by a developer, as they are commonly built on land already
owned by the household or relatives. There is a strong overlap between the areas
where outright ownership is high and where one-off houses predominate.
2.8 Tenure and Nationality
Immigration has had an effect on the composition of tenures in Ireland, as the
proportion of non-Irish nationals in the population increased from 6 per cent in
2002, to 12 per cent in 2011. Owner-occupation remains high among Irish
nationals, at 77 per cent in 2011 (down from 82 per cent in 2006), but only 26 per
cent of other nationalities are owner-occupiers. Instead, private renting is the
latter’s predominant form of tenure, at 68 per cent. This can be partly related to
where non-Irish nationals live—they are much more likely to live in urban areas,
which have lower owner-occupation, than in rural areas.24 Clearly, their transitory
status also leads to renting being attractive. While an increasing number are
remaining long-term in Ireland, for those who do not plan to stay long-term, or who
are unsure if they will, renting is the most suitable tenure. Ownership among non-
22 Census 2011 defines these as houses with their own sewerage system. Two-thirds were located 1–5km from
the nearest town. 23
However, during the downturn, with so few developers building, the proportion of one-off houses built has increased. In the second quarter of 2011, 34 per cent of planning permissions granted for individual units were for one-off housing.
See http://www.cso.ie/px/pxeirestat/Statire/SelectVarVal/saveselections.asp, accessed 9 October 2014. 24
Six per cent of those living rural areas in 2011 were non-Irish nationals, compared to 15 per cent of those in
urban areas (CSO, 2012d).

HOUSEHOLD TENURE IN IRELAND 21
Irish nationals has increased between 2006 and 2011, but from a low base, and is
still low.
There are also variations in tenure among ‘other nationals’. Over 60 per cent of
heads of household who are UK nationals are owner-occupiers, compared to 5 per
cent of Polish nationals. In general, those from the EU accession states are least
likely to own of all groups, with less than 10 per cent of these nationals owning their
accommodation. This has contributed to the decreasing proportion of owner-
occupation in Ireland between 2002 and 2011. In 2002, Eastern Europeans made
up 0.3 per cent of Ireland’s population, but by 2011 they made up 4.5 per cent of
it.25
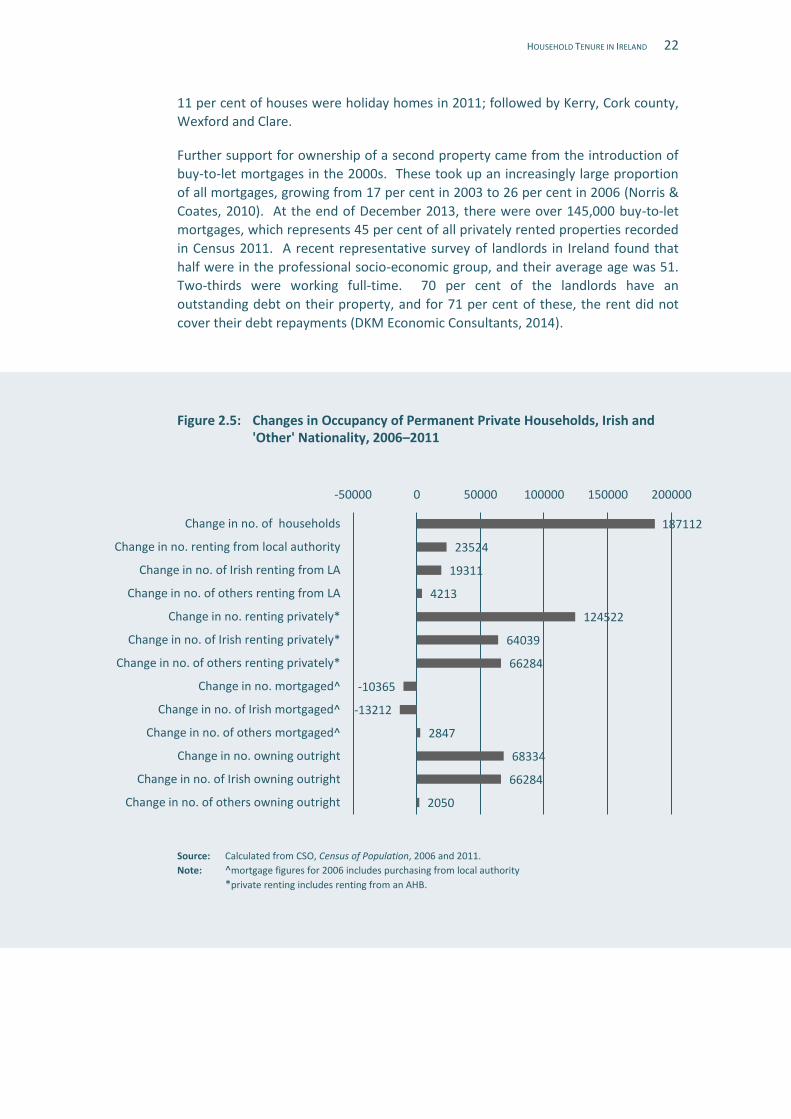
However, the increase in private renting is not only among non-Irish nationals.
Private renting among Irish national heads of household doubled between 2006 and
2011, with over 12 per cent renting in 2011. As Figure 2.5 overleaf shows, the
increase in renting has been split evenly between the households headed by Irish
nationals and by other nationals. The increase in outright ownership, and in renting
from local authorities,26 has, however, been almost totally among Irish nationals.
Similarly, the decrease in households living in mortgaged properties has been
concentrated among Irish nationals.
Duffy et al. (2014) also note that migrants to Ireland tend to have higher headship
rates than the Irish-born population, leading to greater demand for (rental) housing.
2.9 Ownership of More than One Property
Norris et al. (2010) show that ownership of holiday homes increased strongly in
Ireland between 1991, when it was at 1 per cent of all dwellings, and 2006, when it
was at 3 per cent (it remained at 3 per cent in 2011).27 They also note that holiday-
homeownership rates could be higher than that suggested in the Census,28 as
Survey on Income and Living Conditions (SILC) data shows that in 2006, over 6 per
cent of Irish people owned at least one holiday home (although some of these
homes may be abroad). Some of the growth in ownership of second properties was
supported by Government policies to promote construction in rural areas (e.g. the
Seaside Resorts Scheme). It can also be related to rising affluence, with higher
professionals and managers more likely to own second homes. Holiday-
homeownership is concentrated in rural and coastal regions, e.g. Donegal, where
25 See Census 2006 Volume 4 Usual Residence, Migration, Birthplaces and Nationalities and Census 2011 Profile 6
Migration and Diversity—A profile of diversity in Ireland. 26
This increase is accounted for by the number of properties leased by local authorities through RAS, as very few new properties were built by/for local authorities between 2006 and 2011.
27 These figures refer to holiday homes in Ireland.
28 As some properties classified as vacant in the Census are actually holiday homes.
HOUSEHOLD TENURE IN IRELAND 22
11 per cent of houses were holiday homes in 2011; followed by Kerry, Cork county,
Wexford and Clare.
Further support for ownership of a second property came from the introduction of
buy-to-let mortgages in the 2000s. These took up an increasingly large proportion
of all mortgages, growing from 17 per cent in 2003 to 26 per cent in 2006 (Norris &
Coates, 2010). At the end of December 2013, there were over 145,000 buy-to-let
mortgages, which represents 45 per cent of all privately rented properties recorded
in Census 2011. A recent representative survey of landlords in Ireland found that
half were in the professional socio-economic group, and their average age was 51.
Two-thirds were working full-time. 70 per cent of the landlords have an
outstanding debt on their property, and for 71 per cent of these, the rent did not
cover their debt repayments (DKM Economic Consultants, 2014).
Figure 2.5: Changes in Occupancy of Permanent Private Households, Irish and 'Other' Nationality, 2006–2011
Source: Calculated from CSO, Census of Population, 2006 and 2011.
Note: ^mortgage figures for 2006 includes purchasing from local authority
*private renting includes renting from an AHB.
187112
23524
19311
4213
124522
64039
66284
-10365
-13212
2847
68334
66284
2050
Change in no. of households
Change in no. renting from local authority
Change in no. of Irish renting from LA
Change in no. of others renting from LA
Change in no. renting privately*
Change in no. of Irish renting privately*
Change in no. of others renting privately*
Change in no. mortgaged^
Change in no. of Irish mortgaged^
Change in no. of others mortgaged^
Change in no. owning outright
Change in no. of Irish owning outright
Change in no. of others owning outright
-50000 0 50000 100000 150000 200000

HOUSEHOLD TENURE IN IRELAND 23
2.10 Tenure in a Comparative Context
Before considering the affordability of Irish housing, it is interesting to look at Irish
tenure in comparison to that in other EU countries.
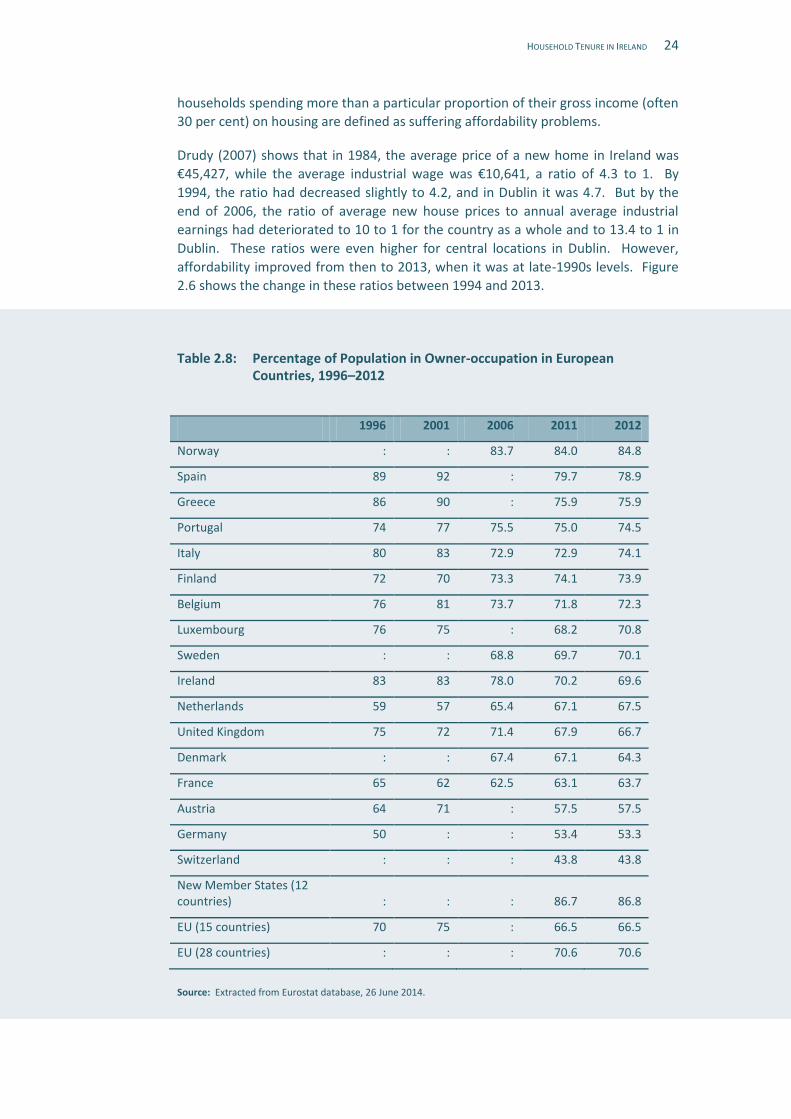
The gap between Ireland and other European countries in the level of
homeownership is less prevalent than it was in the past. Owner-occupation is now
the tenure of the majority of the population in every EU country. The share of the
population in owner-occupation in Ireland in 2012 was 70 per cent, the same as the
EU-28 average and not that much higher than the EU-15 average (66 per cent).29
Ireland’s level of owner-occupation (as a share of the population) is now the same
as Sweden’s. As outlined in Table 2.8 overleaf, some European countries have a
substantially lower level of owner-occupation: Germany (53 per cent), Austria (57
per cent) and Denmark (64 per cent). The lowest level of owner-occupation is in
Switzerland (44 per cent).
The data presented here are national averages. There are significant variations in
the pattern of owner-occupation by age and area of residence in EU countries, as
discussed above in relation to Ireland.
2.11 Affordability
Affordability covers a wide variety of issues including housing prices, incomes,
creditworthiness, housing quality, housing policies, supply, and individuals’
decisions regarding how much expenditure they wish to devote to housing (Norris,
2014). Lack of affordability can result in people being homeless, at risk of being
unable to sustain their rent or mortgage payments, unable to purchase a dwelling
on the open market or devoting a disproportionate share of income to cover
housing costs.
This section looks at three measures of the affordability of purchasing a home in
Ireland over time, and provides some data on the affordability of ownership in
comparison to renting publicly or privately. It also considers data on mortgage and
rent arrears, which provide another indicator of affordability. Finally, the
affordability of homes in Ireland is compared to the situation in other countries.
2.11.1 Ratio Measures of Affordability
The ratio between average house prices and average household incomes indicates
the proportion of household income being spent on housing. Lower-income
29 The figures on owner-occupation quoted here refer to the share of the population in this tenure. The situation
may be somewhat different if owner-occupation is measured in terms of households. The population figures
are used here as recent figures are available on this basis from Eurostat.
HOUSEHOLD TENURE IN IRELAND 24
households spending more than a particular proportion of their gross income (often
30 per cent) on housing are defined as suffering affordability problems.
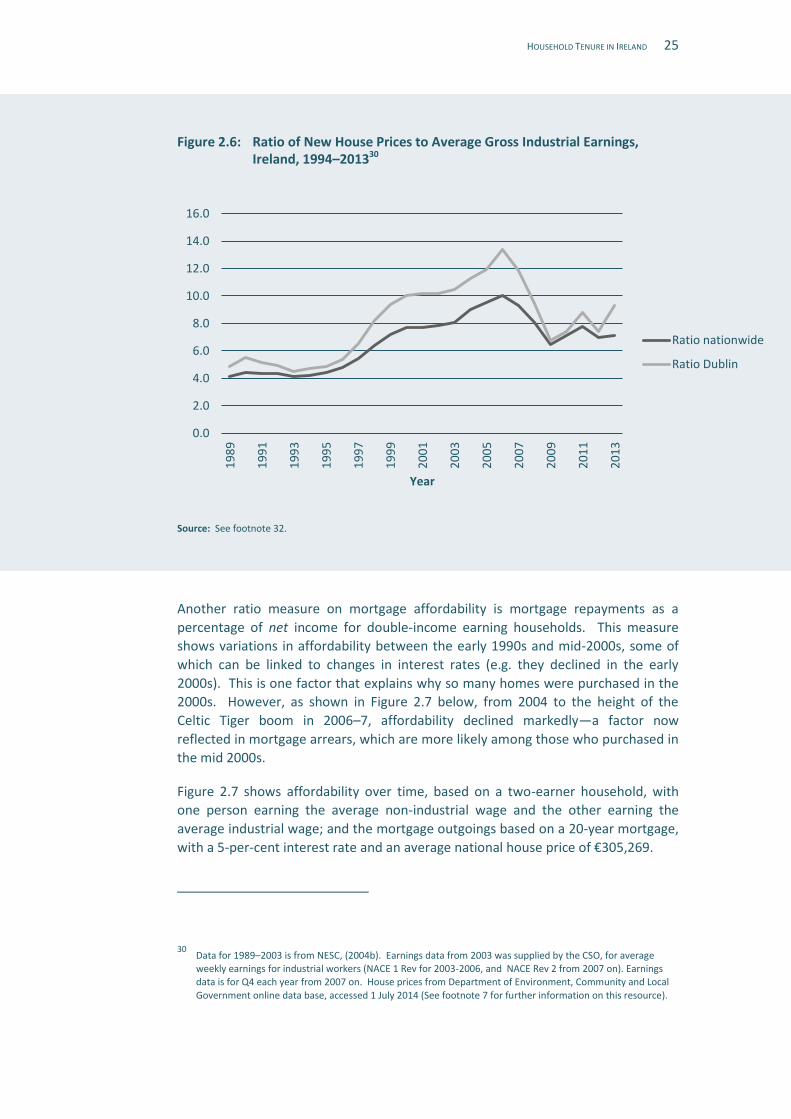
Drudy (2007) shows that in 1984, the average price of a new home in Ireland was
€45,427, while the average industrial wage was €10,641, a ratio of 4.3 to 1. By
1994, the ratio had decreased slightly to 4.2, and in Dublin it was 4.7. But by the
end of 2006, the ratio of average new house prices to annual average industrial
earnings had deteriorated to 10 to 1 for the country as a whole and to 13.4 to 1 in
Dublin. These ratios were even higher for central locations in Dublin. However,
affordability improved from then to 2013, when it was at late-1990s levels. Figure
2.6 shows the change in these ratios between 1994 and 2013.
Table 2.8: Percentage of Population in Owner-occupation in European Countries, 1996–2012
1996 2001 2006 2011 2012
Norway : : 83.7 84.0 84.8
Spain 89 92 : 79.7 78.9
Greece 86 90 : 75.9 75.9
Portugal 74 77 75.5 75.0 74.5
Italy 80 83 72.9 72.9 74.1
Finland 72 70 73.3 74.1 73.9
Belgium 76 81 73.7 71.8 72.3
Luxembourg 76 75 : 68.2 70.8
Sweden : : 68.8 69.7 70.1
Ireland 83 83 78.0 70.2 69.6
Netherlands 59 57 65.4 67.1 67.5
United Kingdom 75 72 71.4 67.9 66.7
Denmark : : 67.4 67.1 64.3
France 65 62 62.5 63.1 63.7
Austria 64 71 : 57.5 57.5
Germany 50 : : 53.4 53.3
Switzerland : : : 43.8 43.8
New Member States (12 countries) : : : 86.7 86.8
EU (15 countries) 70 75 : 66.5 66.5
EU (28 countries) : : : 70.6 70.6
Source: Extracted from Eurostat database, 26 June 2014.
HOUSEHOLD TENURE IN IRELAND 25
Figure 2.6: Ratio of New House Prices to Average Gross Industrial Earnings, Ireland, 1994–201330
Source: See footnote 32.
Another ratio measure on mortgage affordability is mortgage repayments as a
percentage of net income for double-income earning households. This measure
shows variations in affordability between the early 1990s and mid-2000s, some of
which can be linked to changes in interest rates (e.g. they declined in the early
2000s). This is one factor that explains why so many homes were purchased in the
2000s. However, as shown in Figure 2.7 below, from 2004 to the height of the
Celtic Tiger boom in 2006–7, affordability declined markedly—a factor now
reflected in mortgage arrears, which are more likely among those who purchased in
the mid 2000s.
Figure 2.7 shows affordability over time, based on a two-earner household, with
one person earning the average non-industrial wage and the other earning the
average industrial wage; and the mortgage outgoings based on a 20-year mortgage,
with a 5-per-cent interest rate and an average national house price of €305,269.
30 Data for 1989–2003 is from NESC, (2004b). Earnings data from 2003 was supplied by the CSO, for average
weekly earnings for industrial workers (NACE 1 Rev for 2003-2006, and NACE Rev 2 from 2007 on). Earnings data is for Q4 each year from 2007 on. House prices from Department of Environment, Community and Local
Government online data base, accessed 1 July 2014 (See footnote 7 for further information on this resource).
0.0
2.0
4.0
6.0
8.0
10.0
12.0
14.0
16.0 1
98
9
19
91
19
93
19
95
19
97
19
99
20
01
20
03
20
05
20
07
20
09
20
11
20
13
Year
Ratio nationwide
Ratio Dublin

HOUSEHOLD TENURE IN IRELAND 26
Figure 2.7: Mortgage Repayments as a Percentage of Net Income (two earners)
Source: DEHLG, (2009).
This index is no longer produced, but a similar one collected by EBS/DKM shows
that after 2008, the cost of a two-earner, first-time buyer couple on average
incomes servicing a 25-year (rather than 20-year) mortgage fell to 14 per cent of net
income by summer 2012. However, this cost had increased again to 19 per cent by
February 2014. Nineteen per cent represents the average national cost, and there
are counties where prices are much lower—and also much higher. Looked at
regionally, the data points to the development of a ‘three tier market’ across the
country. Prices are currently most expensive in Dublin, followed closely by Wicklow
and Kildare. These are the least affordable counties in which to live, requiring
between 19 and 23 per cent of net income to repay this mortgage in early 2014.
They are followed by Meath, Cork and Galway, with affordability at 15 per cent of
net income. These counties together reflect the main city and commuter-belt
areas. At the other end of the scale, Roscommon, Cavan, Leitrim and Longford are
least expensive, requiring 8 per cent of net income to fund this mortgage. In most
other counties, mortgage repayments cost approximately 10–12 per cent of net
income.31 It is also important to note that at a more fine-grained level—for
example, even within electoral districts—there is often considerable variation in
property prices. Repayments are also increasing for new mortgagees, as these are
on variable interest rates, which many banks are increasing in order to compensate
for the losses being made on tracker-mortgage interest rates.
31 EBS/DKM Irish housing affordability index April 2014, http://dkm.ie/en/publications/affordability_index,
accessed 30 June 2014.

HOUSEHOLD TENURE IN IRELAND 27
The EBS/DKM data also shows that in February 2014, a single first-time buyer on
average earnings would pay 38 per cent of their net income on mortgage
repayments, at the limit of what is considered to be a cost burden in the
international literature (30 per cent of gross income) (ibid.). Census data outlined
earlier shows that the groups least likely to have a mortgage, and most likely to
rent, are indeed single-person households, or those headed by lone parents, and
that it is couples with children who are most likely to have a mortgage.32
The Central Bank has recently published a consultation paper on limits in mortgage
borrowing, proposing the introduction of limits on the loan-to-value (LTV) and loan-
to-income (LTI) ratio of mortgages from January 2015 . The proposals will:
Restrict new lending for principal dwelling houses (PDH) above 80-per-cent LTV
to no more than 15 per cent of the value of all new PDH loans;
Restrict new lending for PDHs above 3.5 times LTI to no more than 20 per cent of
the value of all new PDH loans; and
Restrict new lending to buy-to-let above 70-per-cent LTV to no more than 10 per
cent of the value of all housing loans for investment purposes.33
First-time buyers now comprise approximately half of those drawing down
mortgages (IBF & PwC, 2014). The proposal on LTV values is likely to cause some
difficulty for them, particularly if they have to rent accommodation in a large urban
area while saving a deposit. To buy a €200,000-dwelling, a first-time buyer would
need to save €40,000. However, the limits on LTI ratios should help to sustain
affordability in housing prices.
2.11.2 Residual Measures of Affordability
Residual measures look at absolute levels of expenditure and examine whether the
income that remains after housing costs is sufficient to cover other essential
household expenditure.
Household Budget Survey data from 1973 to 2009–10 shows change in the average
weekly household disposable income of each tenure type over this time period: see
Figure 2.8 overleaf. This data shows that there is now greater disparity between the
incomes of those in different tenure types than in the past. In 1973, there was a
gap of 40 percentage points between the average disposable income of those who
rented from a local authority and those with a mortgage. By 2005–6, when the gap
32 Couples with no children and single-person households are most likely to own outright. This may be related to
age, as 48 per cent of heads of household who are outright owners are aged over 65. Couples living without children may be older, and the Census also shows 46 per cent of those aged over 65 are either single, widowed
or separated/divorced. 33
See http://www.centralbank.ie/press-area/press-releases/Pages/CentralBankpublishesnewmacro-
prudentialmeasuresformortgagelending.aspx, accessed 9 October 2014.

HOUSEHOLD TENURE IN IRELAND 28
was highest, it was almost 90 percentage points. It has declined slightly since. It
also shows that since 1999–2000 there has been widening disparity between the
incomes of those with a mortgage and those renting. The disposable incomes of
those with a mortgage are now further above average and the disposable incomes
of those renting are now further below average than they were before 1999–2000.
This fits with the decreasing proportion of mortgage-holding among those in lower
social classes. It may also be influenced by the increasing proportion of those in the
private rented sector on rent supplement, which has increased significantly since
the early 1990s.
Figure 2.8: Average Weekly Household Disposable Income of Each Household Tenure Type, as a Percentage of Average Income
Source: Household Budget Surveys, 1973 to 2009–10.
The proportion of household expenditure spent on housing by each tenure type
follows a similar pattern—see Figure 2.9. While the proportion spent on housing
has increased for all tenure types, this increase has been sharpest among those
renting privately, since 1987. It has also risen sharply for those with mortgages, but
only since 2004–5, possibly reflecting higher repayments on the larger mortgages
taken out in 2006–7.
0.0
20.0
40.0
60.0
80.0
100.0
120.0
140.0
160.0
Ave
rage
we
ekl
y h
ou
seh
old
dis
po
sab
le in
com
e
as a
pe
rce
nta
ge o
f av
era
ge in
com
e
Owned with mortgage
Average, all tenures
Private renters
Local authority renters

HOUSEHOLD TENURE IN IRELAND 29
Figure 2.9: Weekly Rent or Mortgage Expenditure as a Percentage of Total Household Expenditure (by Household Tenure)
Source: Fahey & Duffy, (2007); CSO, (2007, 2012c).
These figures represent averages, and they may be higher in some areas, such as
Dublin, where rents and mortgages are particularly high. It is also very likely that
the proportion of household expenditure spent on private rents has increased since
2009–10, as rents have increased, while incomes have fallen.34
2.11.3 Rent and Mortgage Arrears
Rent and mortgage arrears are another indicator of affordability, and both have
increased since the height of the Celtic Tiger. The proportion of mortgages in
arrears has increased from practically zero in 2004, to 12 per cent (90,343) of
mortgage accounts for PDHs being in arrears for more than 90 days by June 2014.35
The situation of mortgages on buy-to-let properties is worse, with 31,749 buy-to-let
34 The CSO’s earnings and labour costs data shows that the average weekly income of all employees in the fourth
quarter of 2009 was €717, and had fallen to €689 by the first quarter of 2014. See http://www.cso.ie/quicktables/GetQuickTables.aspx?FileName=EHQ03.asp&TableName=Earnings+and+Labour
+Costs&StatisticalProduct=DB_EH, accessed 7 July 2014. As incomes have fallen, mortgage repayments would also take up a higher proportion of income, but mortgage repayment costs have not risen as fast as rents. Mortgage repayment costs also present a mixed picture, as those on tracker mortgages have benefited from a
decline in interest rates, while those on variable rates have experienced an increase. 35
See http://www.centralbank.ie/polstats/stats/mortgagearrears/pages/releases.aspx, accessed 24 September
2014.
0
5
10
15
20
25
30
Pe
rce
nta
ge o
f h
ou
seh
old
exp
en
idtu
re
Private renters
Owners with mortgage
Local authority renters

HOUSEHOLD TENURE IN IRELAND 30
accounts in arrears of more than 90 days at the end of June 2014, representing 22
per cent of all buy-to-let mortgages. Some recovery is beginning to show in these
figures, with the proportion of all mortgages in arrears declining slightly now.
Meanwhile 6,275 local-authority mortgages were also in arrears of more than 90
days by October 2013. This represents 31 per cent of the total number of these
loans, up from 24 per cent at the end of March 2010.36 While the share of arrears
on local-authority mortgages made available to people on lower incomes to buy
houses is considerably higher than those on standard mortgages, in absolute terms
the volume of local-authority mortgage debt is small: there was €1.1bn outstanding
in local-authority loans in the final quarter of 2013, which represents just over 1 per
cent of total outstanding loans for house purchase as reported by the Central Bank
(€83.7bn).
Those most likely to be in arrears of over 90 days with bank mortgages are: those
who took out mortgages in 2006 and 2007 (Lydon & McCarthy, 2011); those living in
the Midlands, Border and Mid-East regions (which have higher vacancy rates,
unemployment rates and distressed properties in negative equity: Kennedy &
McIndoe Calder, (2011); and those with a high repayment relative to their income
(McCarthy & McQuinn, 2011). Households with a high repayment relative to their
income are more likely to be made up of one adult (either with or without children);
and this adult is more likely to be single, female, younger (aged 38, compared to 43
on average), highly educated, and living in an urban area (Kelly et al., 2011). Those
whose mortgages are in arrears are more likely to be unemployed, in precarious
employment, and/or have had reductions in income from employment (Burke-
Kennedy, 2014).
As outlined in NESC (2013), SILC data shows that those in consistent poverty are
three times more likely to be in mortgage/rent arrears; and where a household is in
mortgage arrears, it is proportionately more likely to have a head of household
whose highest level of education is primary or none; who is ill/disabled,
unemployed, or on home duties; and who is a lone parent.
In terms of rents in arrears, the most recent data shows that total local-authority
rent arrears increased from €32.9m on 1 January 2008, to €58.5m on 31 December
2011. In Dublin City Council, 2011 figures show that 21 per cent of rent was in
arrears. This is estimated to represent 13,400 tenants in arrears (O'Sullivan, 2012).
These figures are considerably higher than in 2006, when 14 per cent of rent was in
arrears (Dublin City Council, 2007).
Such data does not exist for private tenancies, but information from the Private
Residential Tenancies Board (PTRB) shows that in 2011, 32 per cent of dispute
applications received were related to rent arrears, compared to 19 per cent in 2007.
36 From written reply to PQ 9062/12, accessed at http://debates.oireachtas.ie/dail/2012/02/16/00132.asp, 13
September 2012; and answered by Minister for State Jan O’Sullivan; by Deputy Bernard J Durkan on 23 Tuesday October 2012, accessed at http://oireachtasdebates.oireachtas.ie/debates%20authoring/debateswebpack.nsf/takes/dail2012102300011?
opendocument#Local%20Authority%20Housing, on 13 December 2012; and from MacCarthaigh (2013).

HOUSEHOLD TENURE IN IRELAND 31
The PRTB considers that this increase is a reflection of the overall economic
situation (PRTB, 2008, 2012). SILC data for 2012 also shows that among households
who rented, 19 per cent had missed making rent payments on time at some stage in
the previous 12 months (CSO, 2013).
As outlined in NESC (2013), SILC data shows that in both 2006 and 2010, heads of
household with secondary education only were most likely to have been in rent
arrears in the previous year, as well as heads of household in income deciles 1 and
2, lone parents or ‘other households with children’, and heads of household who
are unemployed, on home duties, or ill/disabled. These figures show again the
polarisation in housing conditions, with those on lower incomes, of lower social
classes, and lone parents, least able to afford their accommodation costs.
2.11.4 Affordability in an International Context
Figures from a Deloitte survey of 15 European countries (plus Israel) indicate that in
2013, Irish new housing was the sixth-most affordable of the 16 countries surveyed.
Affordability in this context was measured as the ratio of average purchase price for
a standard-sized new dwelling (70 square metres) to average gross salary.37 The
least affordable housing was in the UK, Russia and Israel. They all had average
prices in the region of €4,000 per square metre. Ireland was in the group of
countries with average prices at around €2,000 per square metre. Countries with a
similar level of prices to Ireland for new dwellings in 2013 were the Netherlands,
Denmark and Belgium (Rádl Rogerová et al., 2014).
This survey also looked at prices in key cities, and found four where prices exceeded
the national average by more than 200 per cent (Prague, Hamburg, London and
Paris); and a further seven capital cities for which prices exceeded the national
average by more than 50 per cent (Lisbon, Warsaw, Berlin, Vienna, Madrid,
Copenhagen and Amsterdam). Dublin’s premium relative to the national average
was below this level. The survey showed that prices per square metre in Dublin
were similar to prices in Amsterdam, Brussels and Lyon and well below Paris and
London.
The affordability of Irish housing in 2013 is confirmed by the annual Demographia
survey of housing affordability in 360 metropolitan housing markets in the English-
speaking countries, along with Hong Kong, Singapore and Japan (Cox & Pavletich,
2013). This survey measures housing affordability as the ratio of median house
prices to gross median household income. The rationale for focusing on median
house prices and incomes is that the survey seeks to reflect the situation as
experienced by a representative household. House prices and income ratio
measures in Ireland normally refer to the mean rather than the median.
37 The Deloitte calculation uses the same standard size of house (70 square metres) for each country although the
actual average size difference varies across countries. Hence this is calculation is a measure of affordability of
housing per square metre.

HOUSEHOLD TENURE IN IRELAND 32
In 2013, the average ratio of median house prices to median incomes for Ireland
was just under three and Ireland was the most affordable housing market among
the nine countries in the Demographia survey. The ratio for Ireland in 2013 was just
below the US (the next most affordable). The survey also examined the
affordability ratio in what they refer to as 85 ‘major markets’; these are housing
markets with over 1 million population, including Dublin. The ratio for Dublin was
estimated at 3.7. Demographia considers that a ratio of 3.0 or less is ‘affordable’.
Only 14 major markets, all of which were in the US, made it into the ‘affordable’
category. Dublin came into the next category (3.1–4.0), referred to by Demographia
as ‘moderately unaffordable’. This would place Dublin as one of the more
affordable major housing markets among the seven non-US countries in the
Demographia survey.
However, house prices are now rising strongly in Ireland, and this is likely to reduce
affordability, particularly in urban markets. House prices now (October 2014) are
higher than those used in the international comparisons presented above. The
Central Bank proposals (outlined above) to limit the proportion of mortgages where
the loan is over 3.5 times gross annual income may help contain the growth of
house prices.
2.12 Likely Future Trends
The overall integration of this data is discussed in Chapter 3, which considers how
best to understand Ireland’s changing tenure mix.

UNDERSTANDING IRELAND’S EVOLVING TENURE MIX 33
Chapter 3 Understanding Ireland’s Evolving Tenure Mix

UNDERSTANDING IRELAND’S EVOLVING TENURE MIX 34
3.1 Introduction
This chapter considers how we should understand Ireland’s evolving tenure mix.
Section 3.1 explores the role of government policy and changing credit conditions in
driving the increased share of homeownership from the 1960s to the early 1990s.
In those decades government strongly supported homeownership with a range of
subsidies. These were gradually reduced, although a number of policy aspects such
as remaining mortgage interest relief, absence of capital gains tax and non-taxation
of imputed rents, still favour homeownership.
Section 3.2 asks where we are now. Should we expect stability or change in these
respective roles of homeownership, private rental and social-rental housing?
Although aggregate national data suggest a high degree of stability—with owner-
occupation levels remaining high—a more fine-grained examination of the data, as
provided in Chapter 2, suggests we are witnessing significant long-term change. In
particular, a range of household types and income groups are likely to have limited
prospects of buying their own home and will, therefore, be reliant on either the
private rental sector or greater provision by local authorities (or other public
bodies) and approved housing bodies (AHBs).
3.2 The Role of Government Policy and Credit Conditions
In seeking to understand the long-term and more recent evolution of Ireland’s
tenure mix, it is vital to recognise the central role of government policy. One of the
main factors influencing the high rate of owner-occupation in Ireland—and, through
much of the 20th century, the falling share of rental accommodation—has been a
range of government incentives aimed almost exclusively at homeowners.
Norris (2013) outlines the range of public subsidies and methods of regulation
which supported high rates of homeownership. First, there was a range of tenant-
purchase schemes, which were first introduced in rural areas in 1936. The
background to this was rural land reform from the 1890s, arising from the Land
War, which agitated to improve the lot of tenant farmers, and ultimately to

UNDERSTANDING IRELAND’S EVOLVING TENURE MIX 35
redistribute land to tenants. Various Acts allowed farm tenants to purchase farms
from their landlords, and led to demands for a similar tenant-purchase scheme on
the part of agricultural labourers, who were excluded from the land-reform
transfers. As a result, schemes that allowed rural tenants to purchase dwellings
built by local authorities were introduced. In the 1950s, these schemes became
particularly generous, with purchase annuities for rural cottages reduced to 50 per
cent of current rents. By 1964, 80 per cent of the 87,000 rural cottages that had
been built to that date had been transferred to private ownership. This led to
pressure to introduce such a scheme in urban areas, which happened in 1966. The
result was that by the 1990s, of the 330,000 local-authority dwellings built over the
previous century, 220,000 had been sold to tenants. These accounted for a quarter
of all homes in private ownership at the time, and were a significant support to
those on lower incomes (Fahey, 2002). From 1925, the Government also enabled
housing development by co-operatives, which built 27 per cent of all private
housing in Dublin between 1933 and 1938.
In terms of finance, the government provided grants to help people to buy, and also
set up a Local Loans Fund that borrowed money from commercial sources and lent
it on to local government in rural areas, to fund mortgages and construction. Local
authorities became the main source of mortgage finance during the 1940s and
1950s, due in part to the lower-down payments required compared to those in
commercial building societies. Grants for home purchase were also available.
Overall, O’Connell (2004:26, cited in Norris) has estimated that by the early 1960s,
almost 30 per cent of the cost of a standard suburban house could be recouped
from the government by the purchaser.
Due to the expense of these schemes, Government in the 1970s began to limit
access to some subsidies and loans to first-time buyers, and a limit was placed on
the amount of mortgage interest that was tax deductable. However, the ceiling was
high at first and the mortgage interest relief still covered 22 per cent of the total
costs of servicing an average building society mortgage in 1975.
Ireland experienced a long economic and fiscal crisis from 1979 to 1987. The
actions taken in 1987 and subsequent years to address the crisis included
significantly reduced income limits for access to local-authority mortgages. As a
result, these mortgages fell from a quarter of mortgages in the early 1980s to 2 per
cent by the early 1990s, and have remained below this level. In fact, since 1999, the
number of new local-authority loans approved has not exceeded 218 per annum.38
Indeed, from the late 1980s, fewer local-authority houses were built, and this,
coupled with the smaller number and lower income of the more residualised
tenants remaining, meant that tenant purchase declined considerably. Between
1994 and 2006, only 21,402 local-authority homes were sold. The peak years in this
period were the late 1990s, with over 2,000 homes sold each year between 1996
38 See Department of Environment, Community and Local Government social housing statistics on loan approvals.
See footnote 7 for further information on this resource.
UNDERSTANDING IRELAND’S EVOLVING TENURE MIX 36
and 1999 (Drudy, 2007). Government also abolished three of the four home-owner
grants, although it did retain some supports for low-income buyers. Such supports
were somewhat increased again in the 1990s, with the introduction of a number of
schemes. These included the Shared Ownership Scheme (a rent/buy scheme for
low-income earners), the Mortgage Allowance Scheme (a grant to local-authority
tenants who surrendered their tenancy and bought a home) and the Affordable
Housing Schemes39 and Initiative (enabling local government to build and sell at cost
to low-income owners). The number benefitting from these schemes was,
however, quite low. For example, over half a million houses were built between
2002 and 2012, and in that period, only 5,225 persons availed of the shared-
ownership scheme. Likewise, 16,764 houses were provided under the Affordable
Housing Scheme between 2002 and 2012, and the Affordable Housing Initiative
delivered a total of 1152 affordable homes(DECLG, 2014).40
In tandem with its reduction of supports for universal homeownership, government
facilitated financial markets to support homeownership. The 1980s saw the
deregulation of Irish commercial banking, and banks slowly took over as the primary
source of mortgages. This continued throughout the 1990s and 2000s. The
economy and population also grew. Housing supply lagged behind, and to address
this, the Government reformed land-use planning and land servicing in the late
1990s to promote building by private developers. As a result, output did increase,
but a significant part of the output was outside the main population centres.
Together these factors contributed to high housing inflation, particularly in Dublin.
In addition, UK banks entered the Irish market, EU bank funding became available
to Irish banks, the number and value of mortgages taken out grew, and the terms of
mortgage repayment lengthened. Government did not limit this credit availability
in any significant way, and the availability of this credit played an important role in
high house-price inflation (Norris & Coates, 2010). The influence on
homeownership was mixed. Purchasing became more difficult for low-income
households, despite the continued existence of some Government supports for this
group. However, many households still purchased, often through taking out large
mortgages. At the same time, the proportion of buy-to-let mortgages increased
significantly. In fact, between December 2003 and December 2006, the proportion
of outstanding mortgages taken up by buy-to-let investors increased from 17 to 26
per cent. In the same period, the share of mortgages held by homeowners declined
from 82 to 73 per cent (Norris, 2013).
After the 2007 global financial crisis, Ireland’s banks lost deposits and were unable
to access international market funding, one of the factors that led to a collapse in
mortgage lending. New mortgages declined from 111,253 in 2006 to 11,227 in
2011. At the same time, Government reduced mortgage-interest tax relief, and in
39 There were two such schemes—the 1999 Affordable Housing Scheme, and the 2000 Part V Affordable Housing.
The latter sold affordable housing bought by local authorities under Part V, which required developers to provide a proportion of housing for sale at lower prices to local authorities for social and affordable housing. See NESC, 2014.
40 The Affordable Homes Partnership a related scheme, also delivered 718 homes.

UNDERSTANDING IRELAND’S EVOLVING TENURE MIX 37
2011 closed all of its affordable housing schemes to new applicants41 (although the
legislation underpinning them has not been repealed). The main tenant-purchase
scheme was also suspended, pending introduction of a new incremental tenant-
purchase scheme.42 This scheme has now been included in the Housing
(Miscellaneous Provisions) Bill 2014.
The creditworthiness of many borrowers deteriorated with increased
unemployment. These factors led to a further decline in owner-occupation. The
collapse in house prices associated with the financial crisis also influenced this, as
prospective buyers were reluctant to purchase while prices were falling.43 Some
recovery in house prices is now occurring, leading to a higher number of house
purchases in 2013 and 2014.
A residential property tax has been introduced recently,44 and can be seen as a
further roll-back of support for owner-occupation, although the rates of property
tax are low (0.18 per cent of the value of the property per year).45 However, other
support for homeownership continues. There is no capital gains tax on principal
private residences, and no tax on imputed rental income. In addition, the
Government is sustaining owner-occupation in some of the measures it has taken in
response to the acute problems arising from the economic and banking crisis. In
particular, the Central Bank has introduced requirements to delay repossession of
dwellings for a certain time period where the mortgage is in arrears and the
mortgagee is co-operating with the lender.46 In December 2013, almost 100,000
mortgages on principle private residences were in arrears of over 90 days, but only
1,014 repossessed homes were in the possession of the banks.47 The Department of
the Environment also states that it is committed to supporting access to
homeownership for lower-income households, but the schemes that remain in
place to support this are few, and the number benefitting from these is extremely
low.48
41 See http://www.citizensinformation.ie.
42 There is an existing incremental purchase scheme but this is a limited scheme that only applies to designated
new local authority and AHB houses. 43
The Department of Environment, Community and Local Government’s online housing statistics (see footnote 7 for further information on this resource), show that the average national price of a second-hand house fell continuously from €377,850 in 2007 to €249,132 in 2012.
44 The property tax introduced in the 1980s was targeted at the most wealthy and was later abolished. Property
tax for all homeowners was introduced in Budget 2013. 45
A property tax rate of 1.2 per cent in Taiwan is judged to be low by Tang (2007). 46
Currently a dwelling may not be repossessed for at least eight months under the Central Bank’s Code of Conduct on Mortgage Arrears. This Code has been revised a number of times, and the time period during which repossession cannot proceed has varied. For more detail, see
http://www.citizensinformation.ie/en/housing/owning_a_home/mortgage_arrears/mortgage_arrears_resolution_process.html, accessed 11 July 2014.
47 See
http://www.centralbank.ie/polstats/stats/mortgagearrears/Documents/2013q4_ie_mortgage_arrears_statistics.pdf, :6, accessed 8 July 2014.
48 See http://www.environ.ie/en/DevelopmentHousing/Housing/HomeOwnership/, accessed 10 July 2014.

UNDERSTANDING IRELAND’S EVOLVING TENURE MIX 38
There are very few countries that do not provide policy support for
homeownership. The supports take different forms: subsidies, grants, savings
incentives, mortgage guarantees, interest subsidies and reliefs and housing
allowances. Box 3.1 notes some of the approaches used, particularly policy that has
stimulated a new supply of homes that are subject to sales-qualification periods and
conditions.
In contrast to the Irish Government’s supports for owner-occupation, there had
been little Government support in Ireland for rental accommodation and, over
several decades, greatly reduced investment in the construction of social housing.
However, the latter has been balanced to some extent by the large increase in rent
supplement and RAS49 recipients, who are housed in private rental accommodation.
Under rent supplement, landlords are paid market rent (subject to prescribed
maximum limits) with some contribution from tenants. There has also been state
support for the construction of social housing by AHBs (see NESC, 2004a; 2014).
Box 3.1: Government Support for Homeownership—Selected Countries50
Germany, Finland and Hungary: Government-supported savings schemes.
Finland, Portugal and Hungary: Grants and subsidies for low-income households.
Norway: Subsidies and cheap loans and land at below-market prices for the co-
operative sector.
Austria: Balanced support of all tenures types but expenditure is not particularly high
compared to other countries.
Spain: Supports for social housing are almost exclusively focused on subsidising
owner-occupation, primarily through soft financing for houses sold at regulated
below-market prices with resale prices set by government for defined qualification
periods.
Asia: Large scale sales of public housing to tenants, at high discounts enabled by the
state’s ownership of nearly all land (e.g. Singapore and China).
49 The Rental Accommodation Scheme (RAS). This was introduced in 2004, and those on long-term rent
supplement can be transferred to it. The accommodation is leased from the private and voluntary sector by local authorities. The social housing leasing scheme, and other leasing schemes, provide a similar service.
50 This box draws on two sources (Elsinga et al., 2007: 318; Hoekstra et al., 2010: 130).

UNDERSTANDING IRELAND’S EVOLVING TENURE MIX 39
The private rental sector was virtually unregulated until the early 2000s, but in 2004
the Residential Tenancies Act was introduced, which greatly improved security of
tenure, and provided market-related rent control, although this is still relatively
weak when compared to other EU countries (Cuerpo et al., 2014). After the
abolition of legislation that froze rents in the early 1980s, deterring investment in
the sector, the supply of rental accommodation was incentivised by various
Government schemes, such as Section 23, which supported construction of housing
to let, from the 1980s on. These schemes provided generous tax relief to builders
and/or purchasers of apartments and small townhouses in designated urban
areas.51 However, these schemes have been closed, and the tax treatment of
landlords has changed since 2008, with much higher rates of tax due on rental
income. A recent representative survey of landlords showed that 70 per cent have
an outstanding debt on their property, and for 71 per cent of these, the rent did not
cover their debt repayments. Twenty-nine per cent planned to exit the sector as
soon as possible (DKM Economic Consultants, 2014). Meanwhile, the increase in
rent-supplement recipients may have sustained the demand for rental
accommodation, particularly since the mid-2000s when the number of recipients
increased from 50,000 to over 97,000 in 2010. For tenants, tax relief on rent was
introduced in the 1990s, although it is now being phased out, as part of the tenure-
neutral housing policy of the Department of the Environment and Local
Government. These factors all help to explain the increase in the population that
rents. Other factors also supported this increase, such as the increase in
immigration, the high costs of buying, falling rents at certain times, and, more
recently, difficulties accessing credit, as well as concerns about losing money on
home purchase.
3.3 Where Are We Now: Stability or Change in the Role of Owner-Occupation?
As noted in the introductory section, the empirical analysis in this report is designed
to answer some key questions of policy relevance concerning the degree of change
in Ireland’s tenure mix, the likely degree of segmentation in the housing system,
and Ireland’s position in an international perspective.
In assessing likely future trends in tenure mix, we have to acknowledge a degree of
uncertainty. The most significant increase in rental share has occurred in the
periods 2000–05 and 2006–present—although it should be noted that the share of
owner occupation peaked as long ago as 1991. Both periods were unusual viewed
historically. The earlier period saw unprecedented increases in income,
immigration, credit creation and construction, combined with rising house prices.
51 See McCabe (2010). Other schemes included Section 50, which provided tax relief in relation to construction of
student accommodation.

UNDERSTANDING IRELAND’S EVOLVING TENURE MIX 40
The period between 2006 and 2011 was unusual given the dramatic reduction in
employment, incomes, house prices and, to a lesser extent, rents. Consequently,
there is a limit to what we can infer, and extrapolation of recent trends could well
prove inaccurate.
As outlined above, at first sight it might seem that not very much has changed and
that, in particular, Ireland is not distinctive as regards the place of owner-
occupation in the overall housing system. As recorded in Census 2011, owner-
occupation remains the dominant tenure, at 71 per cent, down from a peak of 80
per cent in 1991. As noted in Section 2.10, Ireland’s share of owner-occupation in
2012, at 69.6 per cent, is not that far above the EU-15 average of 66.5 per cent.
Many of the 12 additional member states, especially those in Central and Eastern
Europe, have very high rates of homeownership, following privatisation of formerly
state-owned housing, and this pulls the EU-28 average up to 70.6 per cent.
Although the overall share of owner-occupation has fallen from a peak of 80 per
cent in 1991 to 71 per cent in 2011, among Irish nationals it remains at 77 per cent.
Indeed, there is reason to expect some return to house purchase and owner-
occupation in the coming years. Research by Byrne et al. (2014) suggests that there
will be some increase in owner-occupation. It contends that one reason for the high
increase in renting among younger people between 2006 and 2011 was the fall in
rental prices, and the steep decline in house prices from 2008 on, which gave little
incentive to investing in homeownership. Byrne et al. consider that the current
rising costs of rent and of house prices are likely to push owner-occupation up
again. Rental prices in Dublin have increased by 15 per cent in the year to June
2014, and in the Dublin commuter counties by 11 per cent (Daft.ie, 2014a). And
even though purchase prices in Dublin have increased by 21 per cent in the year to
April 2014, and are beginning to increase in the rest of the country for the first time
since 2007 (Daft.ie, 2014b), purchasing is now less expensive than renting, based on
a 30-year mortgage, in most parts of the country (ibid.). Byrne et al. estimate that
2.6 per cent of current renters will wish to switch to owner-occupation. They also
see an overhang of potential buyers, which is continually growing. While the
authors note that it is difficult to assess how much the crisis will lead to a
permanent change in preference away from homeownership, their analysis
suggests that owner-occupation will increase again to some degree among those
aged over 25.52
Furthermore, we need to be aware that the share of owner-occupation and rental
at any given time gives a partial picture of the underlying tendencies and
preferences. For example, the age at which people enter homeownership fell
significantly during the economic boom and may be rising again now. The latter
trend will show up in a lower overall share of ownership at any given time, but over
52 The Irish Banking Federation is finding also that the volume of mortgage drawdowns is improving somewhat,
although it is still low. They find that the value of mortgages drawn down is increasing strongly—evidence of rising prices. See IBF & PwC (2014: 5).

UNDERSTANDING IRELAND’S EVOLVING TENURE MIX 41
a lifetime the rate of ownership might be no lower. International housing analysis
distinguishes between contexts where rental accommodation is a long-term option,
yielding security, and those where it remains a transitory category or one used by
those who have no other option.
Although aggregate data suggest a high degree of stability, closer analysis suggests
that this impression of stability in a high share of owner-occupation is probably
misleading and that some significant changes are almost certainly underway. There
are several reasons why national averages, while important, are not a good guide to
underlying dynamics and associated policy challenges. One is that, by their very
nature, housing and housing-tenure averages are slow-moving variables, since most
households live in a small number of properties over a lifetime and change occurs
more across generations than within them. A second, related, reason is that
Ireland’s housing system has, historically, some features that provide a strong
element of stability in the national data. Most striking is the high share of heads of
household that own their homes outright—currently 36 per cent. Indeed, as shown
above, this share has been remarkably high across the social-class spectrum,
although this is now changing. Outright ownership also has a strong geographic and
age profile, which can reinforce the impression of stability, being particularly high in
Western counties, among those aged over 55 and for one-off rural houses.
When we factor out these strong elements of stability, we find that for a range of
other economic and social groups—younger adults, newly setting up home;
migrants; those seeking to live in or near the centres of employment opportunity;
and, most of all, those on low incomes—housing conditions and housing-tenure
choice are indeed changing quite considerably. Some among these groups are in
mortgage difficulty or have negative equity. Many others have little prospect of
buying their own homes and are mainly reliant on the private rental sector and, for
a minority, social housing. Furthermore, as indicated in Section 2.5, the class profile
of housing and tenure type is likely to continue changing over the next 20 years. In
particular, existing trends in availability, affordability, incomes and household size
suggest that those with lower incomes and in single-adult households are much less
likely to have mortgages, and therefore be on track to homeownership, than those
from higher social classes. In recent trends, owner-occupation is declining among
all social classes, but is declining most among those in lower social classes,
particularly the semi-skilled and unskilled. This trend has been evident since 1991
and is likely to be long-term, given the decline in local-authority tenant-purchase
opportunities. Furthermore, the trends of the last decade or more suggest that, in
the absence of significant policy change, those in the private rental sector are likely
to experience the greatest pressures of affordability. Social polarisation is also
evident in second-homeownership and buy-to-let properties. These properties are
much more likely to be owned by professionals. It also seems that some are let to
the growing proportion of semi-skilled and unskilled who rent. However, purchase

UNDERSTANDING IRELAND’S EVOLVING TENURE MIX 42
of investment homes has dropped sharply53 so this pattern may be less evident in
future.
Furthermore, although the share of owner-occupation in Ireland is not that
different from a range of EU-15 member states, it would not seem correct to infer
from this that Ireland is converging on a European norm. First, the direction of
change is different, with Ireland experiencing falling rates of owner-occupation
while several continental European countries see a rising share. Second, many
continental countries combine owner-occupation with a more developed and
regulated private rental sector than in Ireland, and a larger social housing sector.
Indeed, in some of the countries with the most effective housing systems, the
regime bridges the gap between private rental and social housing through cost-
rental and housing-benefit payments.
53 They made up 4–5 per cent of mortgages approved to date in 2014 (IBF & PwC, 2014); compared to 26 per cent
in 2006 (Norris, 2013).

EXPLORE ASPIRATIONS, ADVANTAGES AND POSSIBILITIES FOR HOMEOWNERSHIP AND RENTAL 43
Chapter 4 Explore Aspirations, Advantages and Possibilities for Homeownership and Rental

EXPLORE ASPIRATIONS, ADVANTAGES AND POSSIBILITIES FOR HOMEOWNERSHIP AND RENTAL 44
The data on the changing tenure mix in Irish housing outlined in this report has
important and complex implications for Irish housing policy that need to be
explored. The overarching goals of housing policy are (i) affordability (ii),
sustainability (economic, social and environmental) and (iii) equality and social
inclusion. It is important to ask how different forms of housing and home
‘ownership’ can serve these goals. In particular, it is now necessary to explore
Ireland’s aspirations, goals and possibilities for homeownership and rental
accommodation. The Council suggests a focused process to explore and clarify the
advantages and disadvantages of different tenures, aspirations for homeownership,
possible ways in which such aspirations might be met, the feasibility of policy
measures to promote a high level of ownership, and comparison of these with
measures to support the emergence of a larger rental sector that can provide
secure, affordable, long-term occupancy. Indeed, the cost-rental approach outlined
in NESCs report Social Housing at a Crossroads is designed to do that.
The Council begins that exploration in this final part of the report. In the next
section we discuss the relative advantages of homeownership and rental. This both
confirms the widely recognised advantages of homeownership in Irish conditions
and shows that these advantages are context-dependent, reflecting the limited
prospects for secure and affordable long-term rental. This poses profound
questions to Irish housing policy and the report closes by identifying these and
suggesting the kinds of deliberation and analysis necessary to answer them.
Such a systematic and honest exploration is necessary for a number of reasons.
One is that the conditions for achievement of homeownership—material, economic,
demographic and financial—seem to have changed from past decades. It is far from
clear that, without major additional policy measures, several groups (particularly
those on low income, lone parents and single-person households) will be able to
achieve homeownership at the levels that prevailed in earlier decades. A second is
that, as noted above, housing policy is especially prone to policy incoherence in
which demand-side subsidies, supply-side subsidies, regulation and direct state
action are combined in an ineffective, and sometime self-cancelling, way. A third,
related, reason is that in the area of housing, and homeownership in particular, all
sorts of ideas are suggested. We need some coherent way to assess and, if
necessary, combine them. For example, to promote homeownership it is suggested
by various observers and groups that:
Development levies be reduced;
VAT on sale of new homes be adjusted;

EXPLORE ASPIRATIONS, ADVANTAGES AND POSSIBILITIES FOR HOMEOWNERSHIP AND RENTAL 45
Standards, such as apartment sizes or energy-efficiency requirements, be
relaxed;
State lands be brought into development in new ways or on new terms;
Measures be taken to encourage older people to move out of under-occupied
housing;
Mortgage ceilings be relaxed, or not increased to the levels proposed by the
Central Bank;
Shared ownership or co-operative housing schemes be promoted more widely.
Such a plethora of suggestions and supposed silver bullets can leave policy-makers
and households confused about the feasibility of the aspiration to homeownership
and the possible measures that could help to realise it. While each of these
suggestions might contain an element of validity, is a particular point being elevated
into the point? We need a wider framework in which to place these divergent
ideas. Ideas about possible ways of promoting homeownership need to be put in
coherent relation to the policy thrusts concerning social housing, cost rental and
planning set out by Government and others, including the Council.
4.1 The Relative Advantages of Homeownership and Renting
Homeownership is typically considered to have a number of advantages over other
tenures. The two most widely cited advantages are the accumulation of an asset
and security of tenure.
4.1.1 Homeownership as the Accumulation of an Asset
A major attraction of owner-occupation compared to renting is the ability to acquire
an asset over time. When a house is acquired through a mortgage, initially the
repayments are almost all interest. Over time the real value of the debt normally
falls, both because of the effect of repayments of principal and on account of the
impact of inflation. Eventually, a home is acquired outright. The purchase of a
home is an important part of lifetime financial planning for many people. Where a
home is owned outright in retirement, this helps balance expenditure with the
lower income normally received at that stage of life. By contrast, with private rental
there is a continuing liability to pay the market rent that will typically rise over time.
For example, the asking rent for a three-bedroom house in Dublin 17 in the first
quarter of 2014 was €1,200 per month (Daft.ie, 2014c). If this rent rises by 2 per
cent annually, then over a 30-year period one would incur total expenditure of close
to €600,000 in rent and still have a need to meet future rental payments.
Purchasing the same home, at a price of approximately €200,000, would cost
EXPLORE ASPIRATIONS, ADVANTAGES AND POSSIBILITIES FOR HOMEOWNERSHIP AND RENTAL 46
€1,037 per month on a 30-year, 100 per cent mortgage with an interest rate of 4.7
per cent. The total amount paid would amount to €373,420—much less than the
rent incurred. In fact, at current interest rates, even if the mortgage taken out was
for €300,000, the total credit paid would be less than the expenditure in rent.54 And
after 30 years, the cost of accommodation would be dramatically reduced and the
purchaser would own an asset.
The calculations for the expenditure on mortgages is based on the current level of
mortgage interest rates. House buyers are exposed to the risk of increases in
interest rates in future years. House buyers in Ireland have an exceptionally high
reliance on variable-rate mortgages. There is scope to address this by switching to a
system of using long-term bonds to raise mortgage finances, as done in Denmark
(Lyons, 2014).
The vast majority of people aged over 65 in Ireland own their own homes. Housing
wealth rises with income, but even in the lowest-income group (weekly income of
up to €400) of older people (aged over 50) there is considerable housing wealth of
approximately €100,000 per household. This rises to over €330,000 for the highest-
income group. Tenant purchase has historically been a significant factor in the
housing wealth of the lowest-income group (O’Sullivan & Layte, 2011).
The long-term implications of declining owner-occupation in the UK for future
pensioners and for public expenditure are examined in a report by a UK think tank,
the Strategic Society Centre (Lloyd, 2012). This study projected that
homeownership would increase among retired people and reach a peak of 85 per
cent in 2026, and stabilise for a decade. However, higher renting among the
current cohort of younger people was projected to lead to a subsequent fall in
homeownership among pensioners to 60 per cent by 2060. The rise in the number
of pensioners who rent their accommodation is projected to result in an increase in
expenditure on housing benefit from £5.32bn in 2009 to £13.45bn in 2060. It is
argued by Lloyd that this implies a strong public-policy interest in seeking to achieve
the highest rate of homeownership that is consistent with other policy objectives.
The influential American housing economist, Robert Shiller, argues that the average
person has an exaggerated view of the financial returns from investing in housing
(Shiller, 2009). He shows that over the period 1890–2004, average US national
house prices increased by 66 per cent in real terms (i.e. after inflation) on a quality-
adjusted basis. This represents an average annual real return of 0.4 per cent.55
Thus he argues that the widespread belief that housing provides an exceptionally
good financial return is what economists call ‘money illusion’: ‘since homes are
54 The price is based on the asking prices listed on myhome.ie for Dublin 17 three-bed homes that command rent
of approximately €1,200 per month on Daft.ie. The repayment figures are calculated using the myhome.ie mortgage calculator—see http://www.myhome.ie/calculators/mortgage, accessed 30 October 2014. These figures do not include additional costs of ownership such as maintenance. Comparisons of renting and buying
vary by area. 55
The returns would be higher in certain major cities, such as Boston and Chicago, but this could not have been
confidently predicted.

EXPLORE ASPIRATIONS, ADVANTAGES AND POSSIBILITIES FOR HOMEOWNERSHIP AND RENTAL 47
relatively infrequent purchases, people still remember the prior purchase price from
a home long ago and are surprised at the difference between them (when prices
including consumer prices were much lower) and now’ (ibid.: 20).
The estimated real annual average return on housing for the US, estimated by
Shiller, refers to capital appreciation. In addition to this, homeowners derive the
benefit from living in their own home. If house prices rose on average somewhat
ahead of inflation, this implies that the return from occupying one’s home
represented a real (i.e. after inflation) return. When a house is purchased with a
mortgage, the average long-run return on the owner’s own investment (i.e. the
deposit) would have been considerably higher.
It is often thought that because of a combination of population growth, rising
prosperity and limited land in cities, it is inevitable that house prices will rise faster
than consumer prices. Shiller suggests three reasons why this may not be so. First,
technological progress in construction tends to help make housing cheaper over
time. Second, in many US cities there is no shortage of land for expansion, meaning
land is not a scarce factor, either. Third, even in cities such as Los Angeles, Boston
or London, which are land-constrained, there is mechanism to limit price increases:
When home prices rise to the point that mortgage payments take up a
large share of family income, there is a powerful incentive to move to a
lower-cost area. This safety valve tends, in the long term, to prevent
the price of homes rising too much in inflation-corrected terms, and to
burst bubbles that have inflated too far. The safety valve is more
effective in cities where buildable land is abundant nearby, but is also
effective in cities far from buildable land, because people and
businesses will, if prices rise high enough, move far way, even leaving
the area completely (ibid.: 24).
As a result of these dynamics, in ‘glamorous, speculative cities ... there has been a
tendency for house prices to rise and to crash but to show little long-term trend’
(ibid.: 24).
Very long-run house price-data are not available to measure long-run real house-
price growth for Ireland. National house-price data are available from 1974
although these are not adjusted for quality. Over the period 1974 to 1994, Irish
house prices increased sixfold in nominal terms. However, most of this increase
was in line with the increase in the consumer price index (CPI) so that in real terms
Irish house prices increased by 9 per cent over this period, a real annual increase of
0.4 per cent. Since the mid-1990s, Irish house prices increase dramatically in both
nominal and real terms. In 2013, national house prices were 3.7 times higher than
in 1994 in nominal terms and 2.5 times higher in real terms, see Figure 4.1 overleaf.
Over the extended period 1974 to 2013, the average annual growth in national
prices in real terms, was 2.5 per cent. When one adds the implicit return from the
benefit of occupying one’s house, this represents a considerable real rate of return.
Even if the capital appreciation on housing were modest in real terms and lower
than usually considered, this does not establish renting as a better choice than
owning. Those who buy a house with a mortgage acquire an asset over time while

EXPLORE ASPIRATIONS, ADVANTAGES AND POSSIBILITIES FOR HOMEOWNERSHIP AND RENTAL 48
those who rent incur similar or greater expenditure without acquiring an asset.
Provided there is not a decline in asset values, the ownership option will be more
attractive financially over the longer term. Later in this section we discuss the
advantages and disadvantages of rental.
Figure 4.1: National House Prices in Nominal and Real Terms, 1974–2013, 1974=100
Source: www.environ.ie and www.cso.ie.
The huge fall in property prices (followed by some recovery) in Ireland in recent
years is a qualification to the asset accumulation benefit of owner-occupation.
Indeed, there is a long-run pattern of boom and bust cycles, although these are
mostly less pronounced than the current one. Instead of accumulating assets, many
homeowners find themselves in negative equity, as shown in the data on negative
equity and mortgage arrears presented in Section 2.11.3 above. This points to the
need for reforms to reduce the volatility of house prices. The recently proposed
regulations by the Central Bank regarding loan-to-value (LTV) and loan-to-income
(LTI) ratios should contribute to stability, although they impose a cost on a
particular group of potential house buyers.
Another risk for house buyers is that of an increase in interest rates from their
current low level.
0
500
1,000
1,500
2,000
2,500
3,000
3,500
National house prices (nominal)
CPI
National house prices (real)

EXPLORE ASPIRATIONS, ADVANTAGES AND POSSIBILITIES FOR HOMEOWNERSHIP AND RENTAL 49
4.1.2 Security of Tenure
A significant benefit of owner-occupation is enhanced security of tenure relative to
renting. In some countries, renters enjoy considerably greater long-term security of
tenure compared to Ireland. However, owner-occupiers who own outright will still
enjoy greater long-run security since continued occupation is not dependent on the
ability to pay the market rent. A related benefit of ownership is greater control
over one’s dwelling in regard to matters such as decoration and improvements.
The European Qualify of Life Survey found that the most significant impact of
housing on life satisfaction was through concerns about the security of housing
(Eurofound, 2013). Across all the European countries in the survey, around 6 per
cent of respondents considered that it was quite likely or very likely that they would
have to leave their home. Almost one-third had been unable to meet a planned
mortgage or rent payment in the past 12 months. Concerns about housing security
are related to tenure. The share of those who considered it likely that they would
have to leave their accommodation was highest for people in private rental
accommodation (9 per cent) while it was lowest for those who owned their homes
outright (3 per cent) (Eurofound, 2012).
It is sometimes proposed that Ireland’s colonial history has resulted in a particularly
strong value being placed on security of tenure and this is the reason for Ireland’s
relatively high (until recent years) rate of owner-occupation. Fahey has traced the
influence of the land reforms in the nineteenth century on the evolution of Irish
housing policy. Preferences alone cannot explain the growth of owner-occupation
in Ireland but the policies that supported homeownership were probably influenced
by historical land developments. The Land Acts enabled tenants to buy their farms
from landlords using loans from the British Government. These Acts led to the
transfer of 58 per cent of farmland to tenants by 1922. Since farms contained
houses, this also directly expanded rural homeownership. In addition, this policy
established a precedent on largescale state intervention affecting the transfer of
capital assets (Norris, 2013). In subsequent decades, housing policy evolved to
support tenant purchase in rural areas and eventually in urban areas on highly
subsidised terms. It is noted by Fahey that ‘privatised local-authority dwellings now
account for about one-in-four of the owner-occupied dwellings in Ireland, and are a
major reason why the overall level of owner-occupation in this country ... is so high
by European standards’ (Fahey, 1999: 3). The historical development of Ireland’s
policy on homeownership is discussed in more depth in Chapter 3.
4.1.3 Wider Benefits of Homeownership
Beyond asset accumulation, many other advantages of homeownership have been
suggested and analysed—all the way back to de Tocqueville’s famous argument that
ownership enhances democratic participation. A recent comprehensive survey of
the literature by Rohe and Lindblad reached the following conclusion:
The updated literature review presented above does provide support
for several social benefits of homeownership. Even after taking self-
selection and several confounding variables into account there is
EXPLORE ASPIRATIONS, ADVANTAGES AND POSSIBILITIES FOR HOMEOWNERSHIP AND RENTAL 50
considerable evidence that positive homeownership experiences result
in greater participation in social and political activities, improved
psychological health, positive assessments of neighbourhood, and high-
school and post-secondary school completion. The jury is still out,
however, on several other claims including improved physical health,
and both the cognitive abilities and positive behaviours of children
(Rohe & Lindblad, 2013: 45).
4.1.4 Relationship Between Dwelling Type and Tenure
There is an association between houses/apartments on the one hand and
ownership/renting on the other. Across the EU, houses are more likely to be owned
than are apartments. This association, however, is much weaker in the Southern
European countries (Spain, Italy, Greece and Portugal). In these countries there is
relatively little difference in owner-occupation between houses and apartments.
For example, in Spain, 90 per cent of houses are in owner-occupation while 82 per
cent of apartments are in this tenure. Elsewhere in the EU, houses are
predominantly owner-occupied while apartments are mainly rented (Hoekstra,
2005).
In the US, it is single-family detached houses that have the highest rate of
homeownership (87 per cent in 2000) while just 13 per cent were rented. The
ownership rate for attached single-family houses was considerably lower (65 per
cent in 2000). Glaeser (2011) identifies this as a middle type of dwelling in which
both owning and renting seem attractive. It is in the large apartment blocks that
ownership rates are low, at 13 per cent for 50-family or larger buildings in 2000.
This pattern is also evident in Ireland. In 2011, 87 per cent of detached houses were
in owner-occupation with just 13 per cent rented. However, almost one-third of
semi-detached and terraced houses were rented.
The relationship between tenure type and dwelling type has significant
environmental implications. Because homeownership tends to be of houses rather
than apartments, it is argued by Glaeser that the subsidisation of homeownership
encourages low density development and higher energy consumption (ibid.).
4.1.5 Maintenance
Opinions differ somewhat on the relationship between homeownership and
maintenance of the housing stock. Shiller argues that homeowners are typically
more likely to maintain their own homes, because there is an inherent moral-hazard
problem with rental contracts: ‘the renter cannot be given proper incentives to
maintain a property as would a home owner’ (Shiller, 2009: 25). This advantage
applies more to houses than apartments. In the case of apartments, much of the
maintenance required is for the shared infrastructure of the building, and
homeowners do not have an advantage in this respect (Glaeser, 2011). In
considering whether to live in an apartment or house, in Ireland, at least, anxiety
about the reliability of apartment-management companies can be a real issue that
tips people towards a house. Kemeny (1995) meanwhile argues that homeowners

EXPLORE ASPIRATIONS, ADVANTAGES AND POSSIBILITIES FOR HOMEOWNERSHIP AND RENTAL 51
tend to neglect maintenance in old age so that this cost is passed on to the next
generation.
4.1.6 Advantages and Disadvantages of Private Renting
The major advantages of renting are low entry costs, flexibility, and absence of an
investment risk. It is easier and less costly to establish a new household in the
private rental sector compared to buying a property. The flexibility of renting is an
obvious benefit to those whose work requires mobility and makes it easier for those
who lose employment to relocate. In addition, the flexibility of renting makes it
easier to move as one’s needs for housing change at different stages of life. By
contrast, owners are more likely to occupy family homes both before and after they
actually have a need for such a home. Furthermore, when renting, maintenance is
the landlord’s responsibility so that one is not exposed to the risk of major repair
bills.
There are also disadvantages to renting. The major disadvantage of renting on a
lifetime basis is that while significant expenditure is incurred, no asset is acquired.
When incomes fall during one’s retirement years, the requirement to pay the
market rent is likely to represent a heavy burden. It is not surprising, therefore, that
private renting is comparatively rare for those aged over 65 (only 3.4 per cent of
households headed by a person aged over 65 rent privately).
Renters also have no or very limited possibility of modifying their accommodation
to meet their needs. In addition, in a dualist rental system of the Irish type, renters
are exposed to the risk of rising rents and have more limited security of tenure
compared to owning. The Residential Tenancies Act 2004 provides a degree of
security of tenure for tenants. However, this is time-limited (four years) and can be
ended for a number of reasons, including the landlord wishing to sell the property.
Experience in other European countries shows that there is considerable scope to
improve the security of tenure in Ireland.
Up-to-date information on Irish attitudes to renting and owning is available from a
recent report on the private rental sector published by the Housing Agency (DKM
Economic Consultants, 2014). Online interviews were conducted with a sample of
500 tenants. The survey found that a majority of tenants (61 per cent) had a
positive experience of renting. This was higher among younger people, with 74 per
cent of those aged 18–24 viewing their experience as positive while it was lowest in
the 35–44-year-old age group (47 per cent had a positive experience of renting).
Satisfaction with renting was affected by whether or not rent had increased in the
past 12 months. Of the tenants whose rent increased in the past 12 months, 45 per
cent had a positive experience of renting compared to 66 per cent of those whose
rent had not increased.
Tenants were asked for their assessments of a number of statements about renting
on a 10-point scale, from strongly disagree to strongly agree. This revealed that
only a minority of tenants considered renting a satisfactory long-term option and
many were reluctant renters. The survey also found:
EXPLORE ASPIRATIONS, ADVANTAGES AND POSSIBILITIES FOR HOMEOWNERSHIP AND RENTAL 52
45 per cent of tenants agreed that they would be more likely to rent long term if
there was a possibility of rent stability (agreed rent for 3–4 years guaranteed);
Separately, 29 per cent of tenants agreed with the statement that they would be
more likely to rent long term if there was a possibility of a long-term lease (lease
for 3–4 years guaranteed) (ibid.: 23).
This suggests that improved conditions could lead tenants to view long-term renting
more favourably.
4.1.7 Advantages and Disadvantages of Social Renting
The evolution of Ireland’s social housing was discussed in some detail in the
Council‘s 2004 report (NESC, 2004a). The major advantages of social renting,
generally, are low rents and high security of tenure. Social-housing tenants in
Ireland pay a relatively low differential rent that varies with income. One possible
disadvantage is that the quality of housing management by a local authority can
vary. While the quality of local-authority housing is generally very high, at certain
times social-housing development was badly designed and supported with
insufficient social and economic infrastructure. The increasing residualisation of
Ireland’s social housing has meant that, in the eyes of some, such localities have a
negative image. A study of social housing by Fahey found that ‘most local-authority
housing had been successful and had created vibrant neighbourhoods which had
merged seamlessly into the general fabric of Irish life’ (Fahey et al., 2011: 13). However, this research also found that ‘some estates or portions of estates had
failed, in the sense that they were in low demand among tenants, had waiting lists
of residents who wanted to get out, and showed physical signs of neighbourhood
decay’ (ibid.).
The shortage of supply of social housing has resulted in a very long waiting list for
those seeking social housing. Another disadvantage of social housing is that choice
is more limited compared to that available to those with the means to buy or rent
their own housing.
For many decades a key attraction of living in a local authority house was the right
to buy the house at a significant discount to market value. The main right-to-buy
scheme was closed to new applications in December 2012. Provision for a new
right-to-buy scheme for existing tenants of local-authority houses is included in the
Housing (Miscellaneous Provisions) Act 2014. Traditionally, tenants in local-
authority flats did not have a right to buy, but a scheme providing for this was
introduced in 2002.56 While tenant purchase at a discount is undoubtedly attractive
to tenants, it has the disadvantage of reducing the stock of social housing. This
56 There are additional conditions on the tenant’s right to buy a local-authority apartment. These include the
requirement that 65 per cent of the tenants in a complex support designation of the complex for purchase.
EXPLORE ASPIRATIONS, ADVANTAGES AND POSSIBILITIES FOR HOMEOWNERSHIP AND RENTAL 53
raises the question as to whether it can be part of a sustainable system in the years
and decades ahead (NESC, 2014).
As noted elsewhere, a large number of tenants in the private rental sector receive
housing supports through rent supplement, Rental Accommodation Scheme (RAS)
and other leasing schemes. Some of the advantages and disadvantages of this
tenure were discussed in the recent Council report Social Housing at the Crossroads
(2014). Such tenants pay a differential rent to the local authority or housing body,
while the landlord receives a payment related to market rent by the state. With
rent supplement, tenants receive assistance from the Department of Social
Protection in paying their rent to a private landlord.
Those in receipt of housing supports in the private rental sector generally have less
security of tenure than those in local-authority or housing association property.
Many share the same, limited security of tenure of other tenants in that sector.
Some are in properties that have been leased on a long-term basis. In some
situations, tenants may be able to secure more satisfactory accommodation, and
have more choice over what accommodation they live in, through rent supplement
or RAS rather than mainstream social housing. This can arise in market contexts
where there is a plentiful supply of quality accommodation available in the private
rented sector. However, this is not presently the case in Dublin or other major
urban centres. It has become increasingly difficult to find private rental
accommodation for rent supplement or RAS tenants in Dublin, while sharply
increasing rents are putting some of these tenants in extreme difficulty.
4.1.8 The Advantages of Homeownership are Relative and Context-
Dependent
The advantages and attractions of homeownership depend on the alternatives
available. Homeownership is lower in some continental European countries
compared to Ireland and other English-speaking countries. This raises the question
of whether the preference for and benefits of homeownership that have been
identified in English-speaking countries arise because of the absence of the type of
quality rental alternative available in continental European countries.
Behring and Helbrecht analysed the reasons for the lower level of owner-
occupation in some European countries. Their study (as quoted in Elsinga &
Hoekstra, 2005) focuses on Germany, Austria and Sweden, and also draws
comparisons with the Netherlands, Spain and the UK. They conclude that ‘in the
English speaking countries and the countries of Southern Europe, homeownership is
actually essential to acquire a degree of personal security and to offset individual
risk’ (Elsinga & Hoekstra, 2005: 105). By contrast they conclude that:
In Germany, Austria and Switzerland there really is no necessity to
enter into home ownership for the purpose of acquiring basic security
and social acceptance. The decision to do so is entirely a matter of
personal choice and can be made purely in the interests of satisfying
individual housing preferences. ... The low proportion of owner-
occupied properties in Switzerland, Austria and Germany is attributed
EXPLORE ASPIRATIONS, ADVANTAGES AND POSSIBILITIES FOR HOMEOWNERSHIP AND RENTAL 54
to the effectiveness of the welfare state, which renders it unnecessary
to own a property in order to experience a sense of security. Tenancy
protection laws play a significant part here, besides the fiscal support
for landlords and the size, quality and status of the rental sector (ibid.:
105).
This is an illustration of the difference between unitary and dualist rental systems
and the related distinction between cost rental and profit rental, explained by the
Council in Social Housing at the Crossroads (2014). In unitary rental markets, policy
supports for the supply of cost-rental homes and effective regulation of the private
rental sector mean that rental accommodation is a satisfactory long-term option for
much of the population. By contrast in dualist rental systems, such as Ireland, long-
term tenancy in a profit-rental house or apartment is not an attractive or secure
long-term option, so that those who do not qualify for the public rental sector feel
they have no option but to strive for owner-occupation.
Elsinga and Hoeskra (2005) analyse data from the European Community Household
Panel (ECHP) to examine the relationship between tenure and housing satisfaction
in different housing market contexts. They divide European countries into three
groups: English-speaking (Ireland and UK), Southern European (Spain, Italy and
Greece) and countries with well-developed rental sectors (Austria, Netherlands and
Denmark). However, data was not available to Elsinga and Hoekstra for Germany,
Sweden and Switzerland, all of which have well-developed rental markets. They
found that housing satisfaction was higher for homeowners compared to renters in
both the English-speaking and the Southern European countries. This result applied
after controlling for other key factors likely to affect housing satisfaction: housing
quality, household size, household income and housing costs. For the countries
with well-developed rental markets, the results were mixed. In the case of Austria,
there was no statistically significant difference in housing satisfaction between
owners and renters.57 However, in the Netherlands and Denmark, homeowners had
significantly higher satisfaction than tenants despite the presence of well-developed
rental alternatives.58
The life satisfaction of homeowners and renters in Germany is compared by Zumbro
(2014). After controlling for other factors—education, income, health, housing
quality and dwelling type—homeownership was found to have a small but positive
effect on life satisfaction: homeowners were 1.16 times more likely to report a
higher level of life satisfaction. The impact of ownership on life satisfaction was
higher for those on low incomes.59 The reason, Zumbro suggests, is that those on
57 It is argued by Mundt and Amann (2010) that Austria comes close to Kemeny’s prototype of an ‘integrated’
rental market, a unitary rental market in which the cost-rental sector has become a strong competitor to profit renting.
58 It should be noted that the model used does not explain a particularly high share of the variation in housing
satisfaction, ranging from 14 per cent in the UK to 29 per cent in Austria. 59
For homeowners in the lowest income quintile, the odds of reporting higher life satisfaction was 1.25 times greater than for renters in the same quintile, while in the highest income quintile there was little difference in
life satisfaction.

EXPLORE ASPIRATIONS, ADVANTAGES AND POSSIBILITIES FOR HOMEOWNERSHIP AND RENTAL 55
low incomes are concerned by the risk of having an inadequate income in
retirement. Consistent with this was the finding that homeownership was more
important to life satisfaction for those aged between 45 and 65, compared to those
under 30 and even more important for those aged over 65. The perceived financial
burden of maintenance costs was also found to have a negative effect on the
satisfaction of homeowners compared to renters.
There is a further interesting relationship between the advantages and
disadvantages of homeownership and rental—one that underlines the case for a
reasonably balanced system. As noted above, homeownership has some distinct
advantages in terms of both cost and security, the main potential disadvantage
being the possibility of negative equity or capital loss when buying in an unstable
market that experiences a house-price bust. It was also noted that a reasonably
large rental sector, providing good housing options for young people and those that
cannot easily afford to buy, can play an important role in promoting
macroeconomic and housing-market stability (Cuerpo et al., 2014). Putting these
two together, it becomes clear that development of a well-functioning and
appropriately large rental sector can mitigate the main downside risk of
homeownership. Perhaps such stability—provided by the rental sector and those
households that have to adhere to stability-oriented rules such as LTV limits—
should be thought of as a public good. Like other public goods, a case could be
made that homeowners, who benefit from stability, should share in the cost of its
provision.
Conclusion
While the perceived returns on housing investment may be exaggerated, we
consider that, when the alternative is lifetime renting in a profit-rental system,
there are real advantages to homeownership. Homeownership continues to offer
significant attractions. Homeowners without mortgages enjoy a high level of
security and relatively low housing costs. In normal circumstances, those who
acquire a house with a mortgage benefit over time from a decline in the real value
of the outstanding debt, and eventually acquire a valuable house. This helps with
managing finances over a person’s lifetime: lower housing expenditure when a
mortgage is repaid helps to balance the lower income people have in retirement. If
owner-occupation becomes a less common form of tenure, this raises the issue of
how a future older generation could afford private rental accommodation. There is
very little private rental accommodation among older people at present.
4.2 Towards an Understanding of Policy Possibilities for Homeownership and Rental
The trends in Ireland’s tenure mix and the relative advantages of homeownership
and rental, discussed above, pose some challenging questions that Irish housing
policy must now address.

EXPLORE ASPIRATIONS, ADVANTAGES AND POSSIBILITIES FOR HOMEOWNERSHIP AND RENTAL 56
Given the existing advantages of homeownership, does policy wish to promote it
or improve the availability and relative attractiveness of long-term rental?
Are these goals complementary or conflicting?
What is the feasibility of homeownership for different kinds of households in the
coming decades?
What supply-side, demand-side and other policy approaches are available to
promote either homeownership or secure rental occupancy?
What is the relationship between possible ways of promoting homeownership
and the policy approaches to social housing and cost rental advocated by the
Council in its June 2014 report, and enunciated in the Government’s recent
budget statement?
In discussing these questions, we begin by recognising three critical background
facts:
a) For individual households in Ireland, the general superiority of
homeownership over rental, given limited security of tenure and the risk
of rent increases;
b) The instability of the kind of housing market that Ireland has developed,
which creates large societal costs and can qualify the advantages of
home purchase for individual households; and
c) The challenge of housing affordability facing a significant share of
households—evident in both the hurdles to homeownership and the
difficulty of achieving secure occupancy in the rental sector—which can
exacerbate inequality and exclusion, and weaken social cohesion.
These three background conditions contain the complex relations between
individual motivation, action and outcomes, on the one hand, and collective goals
and outcomes, on the other. For example, analysis of the kind undertaken by Shiller
and others shows that individual optimisation (both rational and sometimes
‘exuberant’) in the housing market can lead to overall instability with fairly
disastrous collective outcomes. At the very least, the interrelations between these
three features of the housing environment, and between the individual and the
collective, suggest that policy will not succeed if it seeks to respond to each of these
facts separately. An example would be to see the superiority of homeownership
over rental for individuals as the basis for the kind of homeownership-based overall
housing policy that Ireland pursued in earlier decades. Indeed, Irish and
international experience demonstrates how separate policies on homeownership,
social housing and stability often prove disappointing.

EXPLORE ASPIRATIONS, ADVANTAGES AND POSSIBILITIES FOR HOMEOWNERSHIP AND RENTAL 57
Given the critical backgrounds (as listed in a, b and c above), we would seem to
need a policy that delivers four high-level elements:
w) Housing supply management: While housing markets sometimes over-
produce, in some places they have a chronic tendency to scarcity, excess
demand and windfall gains for those in control of particularly scarce or
strategic assets;
x) Greater balance between the shares of homeownership and rental—this
can help to address problems of affordability, but can also play an
important role in dampening housing-market and macroeconomic
instability;
y) Social supports that address housing needs and are conducive to good
economic performance, social cohesion and equality of opportunity;
z) Affordable and sustainable housing options for intermediate
households.
It should be clear that these are broad policy requirements and goals, and invite
exploration of what specific policy instruments could deliver them. These broad
goals are partly reflected in the policy recommendations made by the Council in
Social Housing at the Crossroads: specifically its argument on the desirability and
feasibility of supply-side measures (involving off-balance-sheet capital and public
land) to increase the provision of social housing and develop a cost-rental segment
that can gradually shape the overall rental sector. It is continuing work to assist
Irish policy in addressing these questions. But that report, focused as it was on
social housing, leaves several important housing-policy questions unanswered, such
as those listed at the start of this section. The argument of this report is that, in
order to formulate an effective overall housing policy, these questions must now be
discussed in an honest, inclusive and rigorous manner.
As regards achieving greater balance between the shares of homeownership and
rental, it is sometimes suggested to be all about improving the image and
perception of renting as a long-term housing option. There are indeed historical
and cultural factors that reinforce the widespread aspiration to homeownership in
Ireland. But the argument that focuses on history, culture, image and perception
glosses over the hard fact that homeownership has concrete advantages—in terms
of cost, life-time return and security—over rental.
Thus the argument that highlights the need to improve the image and perception of
the rental sector and the long-term rental option can tend to deflect attention from
examination of the reasons why it is currently a financially inferior option and less
secure. It therefore deflects from serious exploration of the kinds of measures
necessary to put it on a par with homeownership.
As noted in Social Housing at the Crossroads, housing policy should be thought of as
more like education or health policy than welfare policy—it inevitably affects the
whole population. Indeed, this relates to a third, more general, point: housing
policy, including policy with respect to a tenure such as owner-occupation, should,

EXPLORE ASPIRATIONS, ADVANTAGES AND POSSIBILITIES FOR HOMEOWNERSHIP AND RENTAL 58
first and foremost, be about getting people into quality affordable housing (and
making it possible for them to stay)—i.e. housing as a verb, not a noun. In other
words, with respect to any tenure (whether it be owner-occupation, private rental
or social rental), the main focus should be on those in need of or seeking housing
(or at risk), rather than on those who are already adequately housed, or the housing
tenure per se. In reality, policy often takes the reverse approach, creating (or
ignoring) pressures on the younger generation and those in need, and supporting
the interests of well-housed older incumbent groups, an effect that was particularly
pronounced in Ireland’s approach to housing during the economic boom and to
some degree since the crisis.
4.2.1 Identifying Supply-Side, Demand-Side and Ownership Policy
Options
The standard approach in housing analysis is to distinguish supply-side and demand-
side policy instruments. Supply-side instruments reduce the cost of providing
housing and encourage its supply. Demand-side measures enhance the ability of
individual households or groups to buy or rent housing. We suggest that as well as
exploring all feasible supply-side and demand-side instruments, it is important to
begin by considering the range of ownership options and ownership rights.
Homeownership and various other tenures (such as social renting, cost rental and
shared ownership) are not so categorically distinct as we are inclined to think.
‘Ownership’ can be a matter of degree. Different tenures can be seen as on a
spectrum: at one end lies a maximal form of ownership (with unfettered right to
use, transfer and sell) and, at the other, rental of a home with no security of
tenure,60 In fact, in most developed societies the spectrum of ownership does not
include these endpoints.61 In between lie a range of degrees of ‘ownership’, some
of which are shown in Figure 4.2. For example, through its guarantee of secure
tenure and succession rights, Ireland’s social housing conveys some dimensions of
ownership or property rights but not others. Shared-ownership and co-operative
housing62 provide a significant degree of ownership, but a certain portion of equity
remains with the local authority or other entity. Tenant purchase, and the option of
tenant purchase, has historically been a major source of homeownership in Ireland,
on conditions that are very distinct. In this spectrum, Ireland’s system of private
rental lies towards the lower end; by international standards the level of tenant
protection (on various dimensions, but especially secure occupancy) is low. At the
60 A more complete account of this spectrum would put at the lower end of the ‘ownership’ spectrum residence
in a homeless hostel, where residents do not have freedom to use, enter and leave the property as they wish. 61
The right to private property is qualified in certain ways in the service of the common good, and a minimum of access to housing or shelter is guaranteed.
62 Co-operative housing in Ireland covers multiple tenures. Home-ownership co-operatives develop co-operative
group schemes for sale to members. Social-rental co-operatives provide rental housing to members who
normally come from local-authority waiting lists. In addition, some housing co-operatives provide housing on a shared ownership basis in which ownership is shared between the householder and the co-operative. Finally, there are co-ownership-co-operatives where ownership of common areas in apartments or in townhouses is
managed by the co-operative.

EXPLORE ASPIRATIONS, ADVANTAGES AND POSSIBILITIES FOR HOMEOWNERSHIP AND RENTAL 59
higher end of the spectrum lies homeownership, as commonly understood, with
fairly unfettered rights to use, adapt, transfer and sell, and no capital gains tax. (It is
worth considering whether, among those in ‘homeownership’, a distinction should
be made between the degree of ownership held by those with and without negative
equity and between those with and without equity in the property they live in.)
Figure 4.2: Spectrum of Possible ‘Ownership’ Models
This way of thinking has a number of implications. One is that it prompts us to think
about which dimensions of ‘homeownership’ people aspire to and might wish to
make a goal of public policy. Is it secure occupancy? The right to adapt the
accommodation to one’s needs and tastes? The avoidance of housing costs during
retirement? The power to transfer assets to the next generation? The right to
divest of ownership by selling at a given price? The power to sell at a market price
and to make and keep a capital gain? Is it, as well as some of these, the fact that
homes that can be owned might be different (in location, size, design, quality or
even social mix in the neighbourhood) from homes that are available for rent? Each
of these dimensions of ownership might be achieved at different positions on the
ownership spectrum and can be supported by a range of policy approaches. An
honest discussion of these aspirations and possibilities, and reference to attitudinal
research of the kind recently published by the PRTB cited above, seems a necessary
pre-condition to development of public policy on homeownership in the new
conditions that prevail.
Of course, public policy has a stance on various aspects of the homeownership
spectrum. The most obvious and important example is undoubtedly the right to
private property itself. This is provided for in Article 43 of the Constitution. While
that article enunciates the right to private property, it stipulates that the exercise of
that right ought to be regulated by the principles of social justice and can be
‘delimited by law with a view to reconciling their exercise with the exigencies of the
common good’. A second example is provision of social housing and the principles
that underpin it. Housing supports to low-income tenants in the private rental
sector are another, but more qualified, provision of some limited element of
property right. A related public-policy stance is landlord–tenant law, which gives
tenants some degree of ‘ownership’ or property rights—however limited in the Irish
case. The legal incorporation, and increasing regulation, of the housing associations
EXPLORE ASPIRATIONS, ADVANTAGES AND POSSIBILITIES FOR HOMEOWNERSHIP AND RENTAL 60
is another significant stance since it protects non-profit entities in their holding and
provision of rental accommodation.
In the first instance, the public-policy stance on various possibilities for
ownership/shared value should be derived from principles of public policy, rights
and understandings of the common good. But it is also appropriate that policy on
ownership options should be informed by a practical assessment of the availability
and effectiveness of policy instruments that can promote particular ownership
models. If the policy instruments and resources existed to easily achieve
homeownership for all households that desired it, there would be much to
recommend it. Since these instruments and resources are not readily available, it is
necessary to have effective policies with respect to some of the other possibilities
on the ownership spectrum.
Thus the exploration of Ireland’s housing aspirations, possibilities and goals needs
to consider three interrelated sets of issues:
The desirability and feasibility of the various options on the ‘ownership’
spectrum, including cost rental, co-operative housing and shared ownership;
The feasibility of supply-side measures that can reduce the cost of housing and
enhance its supply;
The feasibility of demand-side measures that can make housing (whether for
purchase or rental) more affordable to particular households.
As noted in the Council’s June 2014 report, an important issue is policy coherence,
to ensure that supply-side measures, demand-side measures, regulation and direct
state action support rather than undermine each other.
In doing this, attention must be given to existing and potential relationships
between these three sets of issues. Some cost-reducing supply-side measures could
be used to support any kind or degree of ownership/value-sharing. For example,
largescale active land management policy, as undertaken in the Netherlands, could,
in principle, provide serviced land below market cost for construction of social
housing, cost-rental housing, private rental or homes for sale. But if the availability
of such land was limited, there would need to be a choice about what kind of
housing to use it for. Other cost-reducing supply-side measures are naturally
associated with a particular ‘ownership’ model. For example, provision of a piece of
land at below market price to a community land trust63 would create the basis for a
form of shared equity. Supporting a housing association through cheap state-
supported capital (such as Capital Advance Leasing Facility, CALF) or provision of
local-authority land would, in the view of many, suggest that the ownership model
63 With a community land trust, the land is collectively owned by the trust while individuals can own building
located on this land. This can be used as a way of providing affordable housing.

EXPLORE ASPIRATIONS, ADVANTAGES AND POSSIBILITIES FOR HOMEOWNERSHIP AND RENTAL 61
would mean the association, as a not-for-profit entity with a social-housing mission,
retaining permanent ownership and permanent social-housing provision.
Once the basic normative stance on housing-ownership rights has been made as
clear as possible, it is appropriate to think about the links between state measures
to provide relatively cheap land, capital and (possibly) buildings, and the ownership
model or models adopted in the housing that results from these. These links can
flow in both directions. National and international experience suggests that it
would be very difficult to realise some of the goals of housing policy—such as
security of tenure in an affordable home—without the state providing or
engineering the provision of capital and land at below-market price for a significant
part of the housing system. Equally, where the state does act to reduce the cost of
these critical factors of production, there is a need to consider the appropriate
conditions on the ownership models used.
The appropriate answer to the questions posed above are probably context-
dependent, in a number of ways. If there were largescale public active land
management, then a case could be made for using it as cost-reducing and supply-
enhancing support for housing provision across all ownership models, on somewhat
different terms for each. If, as is the case in Ireland, state provision of land and
capital is fairly scarce, partly because the state itself has to pay the market price,
then some will probably argue that such resources be used only to underpin social
housing, cost-rental housing, and perhaps some version of shared ownership, but
not profit-renting or profit-oriented house building and sale. Others will possibly
advance the view that if state-supported resources are to be used to underpin
private rental and private sale, this should be made conditional on specified
conditions on the terms of rental and sale.
4.3 Summary of Discussion on Policy Options for the Future
To conclude this report, we summarise the key outcomes of the analysis and
discussion in this report.
In summary, the Council believes it is now necessary to explore Ireland’s
aspirations, goals and possibilities for homeownership and rental accommodation.
This is necessary as the conditions for achievement of homeownership have
changed from past decades, particularly for those on low incomes, lone parents,
and single-person households. We also need to ask—does policy wish to promote
ownership, given its advantages, or to improve the availability and attractiveness of
long-term rental? Are these conflicting or complementary goals? And what policy
options are available to promote either of these goals? It is important for Ireland as
a society and economy that policy delivers the following:
Stable and sustainable housing supply management;
EXPLORE ASPIRATIONS, ADVANTAGES AND POSSIBILITIES FOR HOMEOWNERSHIP AND RENTAL 62
Greater balance between the shares of homeownership and rental, to address
affordability problems and dampen housing-market and macroeconomic
instability;
Social support to address housing needs, which are conducive to good economic
performance, social cohesion and equality of opportunity; and
Affordable and sustainable housing options for intermediate households.
These broad policy requirements and goals invite exploration of what specific policy
instruments could deliver them. Such exploration needs to look at the desirability
and feasibility of three main policy options. These are:
Demand-side measures to help individual households or groups to buy or rent;
Supply-side instruments, which reduce the cost of providing housing and
encourage its supply; and
The possibility of a continuum of ownership and rental options, ranging from
private rental to cost rental, shared ownership, tenant purchase, and finally
outright ownership. A continuum of such options might provide more
alternatives to the current choice between financially inferior and less secure
private rental, and outright ownership.
It is important that housing policy, whichever direction it takes in further
exploration of these policy options, moves forward in a coherent way. There is a
need to ensure that the various policy options adopted (such as demand and
supply-side subsidies, regulation, and direct state action) combine to work
effectively together, rather than pulling in different and sometimes contradictory
directions, as has occurred in the past.

BIBLIOGRAPHY 63
Bibliography

BIBLIOGRAPHY 64
Bibliography
Burke-Kennedy, E. (2014), 'Some 75 Per Cent of Mortgage Arrears Cases Involve Employed People', Irish Times, 31 January. Byrne, D., Duffy, D. & FitzGerald, J. (2014), 'Household Formation and Tenure Choice', Quarterly Economic Commentary, Summer. Central Bank of Ireland (2011), Residential Mortgage Arrears and Repossession Statistics—Trend to December 2011, Dublin: Central Bank of Ireland. Cox, W. & Pavletich, H. (2013), 10th Annual Demographia International Housing Affordability Survey 2014: Ratings for Metropolitan Markets, Performance Urban Planning. http://www.demographia.com/dhi.pdf, 23/10/14. CSO (2007), Household Budget Survey 2004–2005: Preliminary Results, Dublin: Central Statistics Office.
CSO (2012a), Profile 2: Older and Younger. Dublin: Stationery Office. CSO (2012b), Profile 4: The Roof Over Our Heads, Dublin: Stationery Office. CSO (2012c), Household Budget Survey 2009–2010: Volume 2, Dublin: Stationery Office. CSO (2012d), Profile 6: Migration and Diversity. Dublin: Stationery Office. CSO (2013), Quarterly National Household Survey: Effect on Households of the Economic Downturn, Quarter 3 2012. http://www.cso.ie/en/media/csoie/releasespublications/documents/labourmarket/2012/QNHSeconomicdownturnq32012.pdf, 23/10/14. Cuerpo, C., Kalantaryan, S. & Pontuch, P. (2014), Rental Market Regulation in the European Union, European Economy: Economic Papers 515, April, Brussels: European Commission.
Daft.ie (2011a), House Price Report an Analysis of Recent Trends in the Irish Residential Sales Market, 2011 Q2. https://c1.dmstatic.com/597/report/Daft-House-Price-Report-Q2-2011.pdf, 23/10/14. Daft.ie (2011b), Rental Report an Analysis of Recent Trends in the Irish Rental Market, 2011 Q2. https://c0.dmstatic.com/597/report/Daft-Rental-Report-Q2-2011.pdf, 23/10/14. Daft.ie (2014a), The Rental Report: An Analysis of Recent Trends in the Irish Rental Market, 2014 Q2. https://c0.dmstatic.com/593/report/Daft-Rental-Report-Q2-2014.pdf, 23/10/14. Daft.ie (2014b), House Price Report: An Analysis of Recent Trends in the Irish Residential Sales Market, 2014 Q2. https://c1.dmstatic.com/593/report/Daft-House-Price-Report-Q2-2014.pdf, 23/10/14.

BIBLIOGRAPHY 65
Daft.ie (2014c), The Rental Report: An Analysis of Recent Trends in the Irish Rental Market, 2014 Q1. http://c0.dmstatic.com/612/report/Daft-Rental-Report-Q1-2014.pdf, 23/10/14. DECLG (2014), Social and Affordable Housing Statistics. http://www.environ.ie/en/Publications/StatisticsandRegularPublications/HousingStatistics/, 26/03/14. DEHLG (2009), Annual Housing Statistics Bulletin 2008, Dublin: Department of Environment, Heritage & Local Government. DKM Economic Consultants (2014), Future of the Private Rented Sector: Final Report, Prepared for The Housing Agency on behalf of Private Residential Tenancies Board, Dublin: DKM Economic Consultants. Drudy, P.J. (2007), 'Housing in Ireland: Philosophy, Affordability and Access', Journal of the Statistical and Social Inquiry Society of Ireland, XXXVI: 84–119.
Dublin City Council (2007), Looking to the Future: Dublin City in the 21st Century, 2006 Annual Report & Accounts, Dublin: Dublin City Council. Duffy, D., Byrne, D. & Fitzgerald, J. (2014), 'Alternatives Scenarios for New Household Formation in Ireland', Quarterly Economic Commentary, Spring. Elsinga, M. & Hoekstra, J. (2005), 'Homeownership and Housing Satisfaction', Journal of Housing and the Built Environment, 20(4): 401–24. Elsinga, M., De Decker, P., Teller, N. & Toussaint, J. (Eds.) (2007), Home Ownership Beyond Asset and Security: Perceptions of Housing Related Security and Insecurity in Eight European Countries, Delft: DUP Science. Eurofound (2012), Third European Quality of Life Survey—Quality of Life in Europe: Impacts on the Crisis, Luxembourg: Publications office of the European Union.
Eurofound (2013), Third European Quality of Life Survey—Quality of Life in Europe: Subjective Well-Being, Luxembourg: Publications office of the European Union. Fahey, T. (Ed.) (1999), Social Housing in Ireland: A Study of Success, Failure and Lessons Learned, Combat Poverty Agency's Research Series No. 28, Dublin: Oak Tree Press. Fahey, T. (2002), 'The Family Economy in the Development of Welfare Regimes: A Case Study', European Sociological Review, 18(1): 51–64. Fahey, T. & Duffy, D. (2007), 'The Housing Boom' in Fahey, T., Russell, H. & Whelan, C. T. (Eds.), Best of Times? The Social Impact of the Celtic Tiger, Dublin: Institute of Public Affairs.

BIBLIOGRAPHY 66
Fahey, T., Norris, M., McCafferty, D. & Humphreys, E. (2011), Combating Social Disadvantage in Social Housing Estates: The Policy Implications of a Ten-Year Follow-up Study, Working Paper Series 11/02, February, Dublin: Combat Poverty Agency. Glaeser, E. L. (2011), 'Rethinking the Federal Bias toward Homeownership', Cityscape: A Journal of Policy Development and Research, 13(2). Gleeson, J. (2014), 'Picture of Ireland: Who Owns Our Houses?', Irish Times, 29 March. Hoekstra, J. (2005), 'Is There a Connection between Welfare Type Regimes and Dwelling Type? An Exploratory Statistical Analysis', Housing Studies, 20(3): 475–95. Hoekstra, J., Saizarbitoria, I.H. & Etxarri, A.E. (2010), 'Recent Changes in Spanish Housing Policies: Subsidized Owner-Occupancy Dwellings as a New Tenure Sector?', Journal of Housing and the Built Environment, 25: 125-138.
IBF & PwC (2014), IBF/PwC Mortgage Market Profile: Quarterly Report – New Lending, Irish Banking Federation and Price Waterhouse Coopers. http://www.bpfi.ie/wp-content/uploads/2014/08/IBF-PwC-Mortgage-Market-Profile-Q1-2014.pdf, 23/10/14. Kavanagh, M. (2007), Women, Learning and the Labour Market in Ireland. http://www.aontas.com/download/pdf/women_lifelong_learning_and_the_labour_market_in_ireland.pdf, 23/10/14. Kelly, R., McCarthy, Y. & McQuinn, K. (2011), Impairment and Negative Equity in the Irish Mortgage Market, Research Technical Paper, 09/RT/11, Dublin: Central Bank of Ireland Research. Kemeny, J. (1995), From Public Housing to the Social Market: Rental Policy Strategies in Comparative Perspective, London: Routledge.
Kennedy, G. & McIndoe Calder, T. (2011), The Irish Mortgage Market: Stylised Facts, Negative Equity and Arrears, Research Technical Paper, 12/RT/11, Dublin: Central Bank of Ireland. Lloyd, J. (2012), The Future Cost of Housing Benefit for Older People, London: The Strategic Society Centre. Lydon, R. & McCarthy, Y. (2011), What Lies Beneath? Understanding Recent Trends in Irish Mortgage Arrears, Research Technical Paper, 14/RT/11, Dublin: Central Bank of Ireland. Lyons, R. (2014), The Daft.Ie House Price Report, 2014: Q3. http://c1.dmstatic.com/606/report/Daft-House-Price-Report-Q3-2014.pdf, 31/10/14. MacCarthaigh, S. (2013), 'Local Authorities Owed €247m in Mortgages', Irish Examiner, 25 December.
BIBLIOGRAPHY 67
McCabe, C. (2010), 'Ray Mcsharry and the Section 23 Timebomb', Irish Left Review, October. McCarthy, Y. & McQuinn, K. (2011), 'How Are Irish Households Coping with Their Mortgage Repayments? Information from the Survey on Income and Living Conditions', Economic and Social Review, 42(1): 71–94. Mundt, A. & Amann, W. (2010), 'Indicators of an Integrated Rental Market in Austria', Housing Finance International, XXV(2): 35–44. National Transport Authority (2013), Planning and Development of Large Scale, Rail Focussed Residential Areas in Dublin. http://www.nationaltransport.ie/wp-content/uploads/2011/12/Planning_and_Development_of_Large-Scale_Rail_Focussed_Areas_in_Dublin.pdf, 10/07/14. NESC (2004a), Housing in Ireland: Performance and Policy, Dublin: National Economic and Social Council.
NESC (2004b), Housing in Ireland: Performance and Policy: The Interaction of Supply and Demand, Background Paper No. 5, Dublin: National Economic and Social Council. NESC (2013), The Social Dimensions of the Crisis: The Evidence and Its Implications, Dublin: National Economic and Social Council. NESC (2014), Social Housing at the Crossroads: Possibilities for Invesment, Provision and Cost Rental, Dublin: National Economic and Social Council. Norris, M. (2013), Varieties of Home Ownership: Ireland’s Transition from a Socialised to a Marketised Policy Regime, Geary WP2013/06, April, Dublin: University College Dublin. Norris, M. (2014), Unaffordable Housing: Scale, Implications and Solutions, Background Paper Housing Policy Statement, 3 July, Department of Environment, Community & Local Government, Dublin: University College Dublin.
Norris, M. & Coates, D. (2010), How Housing Killed the Celtic Tiger: Anatomy, Consequences and Lessons of Ireland’s Housing Boom and Bust, 2000–2009. Working Paper No. 15, UCD School fo Applied Social Science, Dublin: University College Dublin.. Norris, M. & Fahey, T. (2011), 'From Asset Based Welfare to Welfare Housing? The Changing Function of Social Housing in Ireland', Housing Studies, 26(3): 459–69. Norris, M. & Winston, N. (2013), 'Young People's Trajectories through Irish Housing Booms and Busts: Headship, Housing and Labour Market Access among the under 30s since the Late 1960s' in Forrest, R. & Ngai-Ming, Y. (Eds.), Young People and Housing: Transitions, Trajectories and Generational Fractures, Oxon: Routledge (Taylor & Francis). Norris, M., Healy, J. & Coates, D. (2008), 'Drivers of Rising Housing Allowance Claimant Numbers: Evidence from the Irish Private Rented Sector', Housing Studies, 23(1): 89–109.

BIBLIOGRAPHY 68
Norris, M., Paris, C. & Winston, N. (2010), 'Second Homes within Irish Housing Booms and Busts: North-South Comparisons, Contrasts and Debates', Environment and Planning C: Government and Policy, 28: 666–80. O'Sullivan, C. (2012), 'Local Authority Tenants Owe at Least €32m to Councils', Irish Examiner, 17 February. O’ Sullivan, V. & Layte, R. (2011), 'Income and Asset Levels of Older People' in Barrett, A., Savva, G., Timonen, V. & Kenny, R. A. (Eds.), In Fifty Plus in Ireland 2011: First Results from the Irish Longitudinal Study on Ageing, Dublin: Trinity College Dublin. PRTB (2008), Annual Report and Accounts 2007, Dublin: Private Residential Tenancies Board.
PRTB (2012), Annual Report and Accounts 2011, Dublin: Private Residential Tenancies Board. Rádl Rogerová, D., Hána, P. & Novák, P. (2014), Property Index Overview of European Residential Markets, Deloitte. http://www2.deloitte.com/content/dam/Deloitte/be/Documents/realestate/be_fas_real-estate_deloitte-european-residential-property-index-2013.pdf, 10/07/14. Rohe, W.M. & Lindblad, M. (2013), Reexamining the Social Benefits of Homeownership after the Housing Crisis, Joint Center for Housing Studies, Cambridge: Harvard University. Shiller, R. J. (2009), Irrational Exuberance, New York: Broadway Books.
Tang, P.Y.C. (2007), 'Taiwan’s Housing Policy in the Context of East Asian Welfare Models' in Groves, R., Murie, A. & Watson, C. (Eds.), Notes on Housing and the New Welfare State: Perspectives from East Asia and Europe, Aldershot: Ashgate Publishing. Zumbro, T. (2014), 'The Relationship between Homeownership and Life Satisfaction in Germany', Housing Studies, 29(3): 319–38.
69
National Economic and Social Council Publications
No. Title Date
1. Report on the Economy in
1973 and the Prospects
for 1974 1974
2. Comments on Capital
Taxation Proposals 1974
3. The Economy in 1974
and Outlook for 1975 1974
4. Regional Policy in Ireland:
A Review 1975
5. Population and Employment
Projections: 1971-86 1975
6. Comments on the OECD
Report on Manpower Policy
in Ireland 1975
7. Jobs and Living Standards:
Projects and Implications 1975
8. An Approach to Social
Policy 1975
9. Report on Inflation 1975
10. Causes and Effects of
Inflation in Ireland 1975
11. Income Distribution:
A Preliminary Report 1975
12. Education Expenditure
in Ireland 1976
13. Economy in 1975 and
Prospects for 1976 1975
14. Population Projects 1971-86:
The Implications for Social
Planning –Dwelling Needs 1976
15. The Taxation of Farming
Profits 1976
16. Some Aspects of Finance for
Owner-Occupied Housing 1976
17. Statistics for Social Policy 1976
18. Population Projections 1973-86:
The Implications for
Education 1976
19. Rural Areas: Social Planning
Problems 1976
20. The Future of Public
Expenditure 1976
21. Report on Public
Expenditure 1976
22. Institutional Arrangements
for Regional Economic
Development 1976
23. Report on Housing
Subsidies 1976
24. A Comparative Study of
Output, Value-Added and
Growth in Irish and
Dutch Agriculture 1976
25. Towards a Social Report 1977
26. Prelude to Planning 1976
27. New Farms Operators, 1973
to 1975 1977
28. Service-type Employment
and Regional Development 1977
29. Some Major Issues in Health
Policy 1977
70
30. Personal Incomes by County in
1973 1977
31. The Potential for Growth in
Irish Tax Revenues 1977
32. The Work of NESC:
1974-1976 1977
33. Comments on Economic and
Social Development;
1976-1980 1977
34. Alternative Growth Rates in
Irish Agriculture 1977
35. Population and Employment
Projections 1986:
A Reassessment 1977
36. Universality and Selectivity:
Strategies in Social Policy 1978
37. Integrated Approaches to
Personal Income Taxes and
Transfers 1978
38. Universality and Selectivity:
Social Services in Ireland 1978
39. The Work of NESC: 1977 1978
40. Policies to Accelerate
Agricultural Development 1978
41. Rural Areas: Change and
Development 1978
42. Report on Policies for
Agricultural and Rural
Development 1978
43. Productivity and
Management 1978
44. Comments on Development:
Full Employment 1978
45. Urbanisation and Regional
Development in Ireland 1979
46. Irish Forestry Policy 1979
47. Alternative Strategies for
Family Support Income 1980
48. Transport Policy 1980
49. Enterprises in the Public
Sector 1980
50. Major Issues in Planning
Services for Mentally and
Physically Handicapped
Persons 1980
51. Personal Incomes by
Regions: 1977 1980
52. Tourism Policy 1980
53. Economic and Social Policy
1980-83: Aims and
Recommendations 1980
54. The Future of the National
Economic and Social Council 1981
55. Urbanisation: Problems of
Growth and Decay in Dublin 1981
56. Industrial Policy and
Development: A Survey of
Literature from the Early
1960s to the Present 1981
57. Industrial Employment and
the Regions 1960-82 1981
58. The Socio-Economic Position
of Ireland within the
European Economic
Community 1981
59. The Importance of
Infrastructure to Industrial
Development in Ireland:
Roads, Telecommunications
and Water Supply 1981
60. Minerals Policy 1981
61. Irish Social Policy: Priorities
for Future Development 1981

71
62. Economic and Social Policy
1981: Aims and
Recommendations 1981
63. Population and Labour Force
Projections by County and
Region, 1979-1991 1981
64. A Review of Industrial Policy 1982
65. Farm Incomes 1982
66. Policies for Industrial
Development: Conclusions
and Recommendations 1982
67. An Analysis of Job and Losses
in Irish Manufacturing
Industry 1982
68. Social Planning in Ireland: Its
Purposes and Organisational
Requirements 1983
69. Housing Requirements and
Population Change:
1981-1991 1983
70. Economic and Social Policy
1982: Aims and
Recommendations 1983
71. Education: The Implications
of Demographic Change 1984
72. Social Welfare: The
Implications of Demographic
Change 1984
73. Health Services: The
Implications of Demographic
Change 1984
74. Irish Energy Policy 1984
75. Economic and Social Policy
1983: Aims and
Recommendations 1984
76. The Role of the Financial
System in Traded Sectors 1984
77. The Criminal Justice System:
Policy and Performance 1985
78. Information for Policy 1985
79. Economic and Social Policy
Assessment 1985
80. The Financing of Local
Authorities 1985
81. Designation of Areas for
Industrial Assessment 1985
82. Manpower Policy in
Ireland 1986
83. A Strategy for Development
1986-1990 1986
84. Community Care Service:
An Overview 1987
85. Redistribution Through State
Social Expenditure in the
Republic of Ireland:
1973-1980 1988
86. The Nature and Functioning
of Labour Markets 1988
87. A Review of Housing Policy 1989
88. Ireland in the European
Community: Performance,
Prospects and Strategy 1989
89. A Strategy for the Nineties:
Economic Stability and
Structural Change 1990
90. The Economic and Social
Implications of Emigration 1991
91. Women’s Participation in the
Irish Labour Market 1992
92. The Impact of Reform of the
Common Agricultural Policy 1992

72
93. The Irish Economy in a
Comparative Institutional
Perspective 1993
94. The Association between
Economic Growth and
Employment 1993
95. Education and Training
Policies for Economic and
Social Development 1993
96. A Strategy for
Competitiveness,
Growth and Employment 1993
97. New Approaches to Rural
Development 1995
98. Strategy into the 21st
Century:
Conclusions and
Recommendations 1996
99. Strategy into the 21st
Century 1996
100. Networking for Competitive
Advantage 1996
101. European Union: Integration
and Enlargement 1997
102. Population Distribution and
Economic Development:
Trends and Policy
Implications 1997
103. Private Sector Investment in
Ireland 1998
104. Opportunities, Challenges
and Capacities for Choice,
Overview: Conclusions and
Recommendations 1999
105. Opportunities, Challenges
and Capacities for Choice 1999
106. Review of the Poverty
Proofing Process 2001
107. Benchmarking the
Programme for Prosperity
and Fairness 2002
108. National Progress Indicators 2002
109. Achieving Quality Outcomes:
The Management of Public
Expenditure 2002
110. An Investment in Quality:
Services, Inclusion and
Enterprise: Overview,
Conclusions and
Recommendations 2002
111. An Investment in Quality:
Services, Inclusion and
Enterprise 2003
112. Housing in Ireland:
Performance and Policy 2004
113. The Developmental Welfare
State 2005
114. NESC Strategy 2006: People,
Productivity and Purpose 2005
115. Migration Policy 2006
116. Managing Migration in
Ireland: A Social and
Economic Analysis 2006
117. The Irish Economy in the
Early 21st
Century 2008
118. Ireland’s Five-Part Crisis:
An Integrated National
Response 2009
119. Well-being Matters: A Social
Report for Ireland 2009
120. Next Steps in Addressing
Ireland’s Five-Part Crisis:
Combining Retrenchment
with Reform 2009
73
121. The Euro: An Irish
Perspective 2010
122. Re-finding Success in Europe:
the Challenge for Irish
Institutions and Policy 2010
123. Supports and Services for
Unemployed Jobseekers:
Challenges and Opportunities
in a Time of Recession 2011
124. Quality and Standards in
Human Services in Ireland:
Overview of Concepts and
Practice 2011
125. Promoting Economic
Recovery and Employment
in Ireland 2012
126. Draft Framework for
Sustainable Development
for Ireland: NESC Response 2012
127. Quality and Standards in
Human Services in Ireland:
Policing and the Search for
Continuous Improvement 2012
128. Quality and Standards in
Human Services in Ireland:
Residential Care for Older
People 2012
129. Quality and Standards in
Human Services in Ireland:
The School System 2012
130. Quality and Standards in
Human Services in Ireland:
Home Care for Older People 2012
131. Quality and Standards in
Human Services in Ireland:
End-of-Life Care in Hospitals 2012
132. Quality and Standards in
Human Services in Ireland:
Disability Services 2012
133. Achieving Quality in Ireland’s
Human Services:
A Synthesis Report 2012
134. The Social Dimensions of the
Crisis: The Evidence and its
Implications 2012
135. Five Part Crisis, Five Years On:
Deepening Reform and
Institutional Innovation 2013
136. Ireland’s Environmental Data:
Inventory, Assessment and
Next Steps 2014
137. Jobless Households:
An Exploration of the Issues 2014
138. Social Housing at the
Crossroads: Possibilities for
Investment, Provision and
Cost Rental 2014
139. Wind Energy in Ireland:
Building Community
Engagement and Social
Support 2014
140. Homeownership and Rental:
What Road is Ireland On? 2014

74
NESC Research Series
1. Clusters in Ireland: The Irish
Dairy Processing Industry:
An Application of Porter’s
Cluster Analysis 1997
2. Clusters in Ireland: The Irish
Popular Music Industry; An
Application of Porter’s
Cluster Analysis 1997
3. Clusters in Ireland: The Irish
Indigenous Software Industry;
An Application of Porter’s
Cluster Analysis 1997
4. Profit Sharing, Employee
Share Ownership and
Gainsharing; What can
they Achieve? 2000
5. Sustaining Competitive
Advantage: Proceedings of
NESC Seminar 1998
6. Ireland’s Child Income
Supports: The Case for
a New Form of Targeting 2008
NESC Secretariat Papers
1. Ireland’s Economic Recovery:
An Analysis and Exploration 2011
2. Understanding PISA and
What It Tells Us About
Educational Standards in
Ireland 2012
3. Towards a New National
Climate Policy: Interim
Report of the NESC
Secretariat 2012
4. Ireland and the Climate
Change Challenge:
Connecting ‘How Much’
with ‘How To’. Final Report
of the NESC Secretariat 2012
5. Review of Developments in
Banking and Finance 2013
6. Employment and Enterprise
Policy 2013
7. Greening the Economy:
Challenges and Possibilities
for Integrating Sustainability
into Core Government Policy 2013
8. Activation Policy 2012
9. Consumer Prices 2012

75